North Hudson, WI Map & Demographics
North Hudson Map
North Hudson Overview
$53,036
PER CAPITA INCOME
$142,371
AVG FAMILY INCOME
$127,982
AVG HOUSEHOLD INCOME
15.9%
WAGE / INCOME GAP [ % ]
84.1¢/ $1
WAGE / INCOME GAP [ $ ]
0.33
INEQUALITY / GINI INDEX
3,837
TOTAL POPULATION
1,943
MALE POPULATION
1,894
FEMALE POPULATION
102.59
MALES / 100 FEMALES
97.48
FEMALES / 100 MALES
43.3
MEDIAN AGE
3.2
AVG FAMILY SIZE
2.7
AVG HOUSEHOLD SIZE
2,200
LABOR FORCE [ PEOPLE ]
69.0%
PERCENT IN LABOR FORCE
2.2%
UNEMPLOYMENT RATE
Income in North Hudson
Income Overview in North Hudson
Per Capita Income in North Hudson is $53,036, while median incomes of families and households are $142,371 and $127,982 respectively.
| Characteristic | Number | Measure |
| Per Capita Income | 3,837 | $53,036 |
| Median Family Income | 999 | $142,371 |
| Mean Family Income | 999 | $149,192 |
| Median Household Income | 1,440 | $127,982 |
| Mean Household Income | 1,440 | $129,957 |
| Income Deficit | 999 | $0 |
| Wage / Income Gap (%) | 3,837 | 15.86% |
| Wage / Income Gap ($) | 3,837 | 84.14¢ per $1 |
| Gini / Inequality Index | 3,837 | 0.33 |
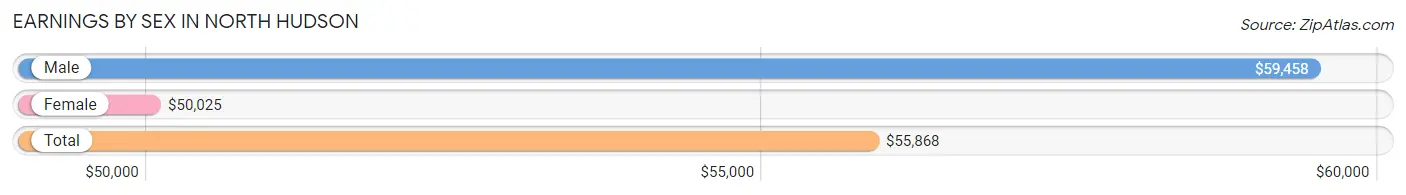
Earnings by Sex in North Hudson
Average Earnings in North Hudson are $55,868, $59,458 for men and $50,025 for women, a difference of 15.9%.
| Sex | Number | Average Earnings |
| Male | 1,295 (53.1%) | $59,458 |
| Female | 1,143 (46.9%) | $50,025 |
| Total | 2,438 (100.0%) | $55,868 |
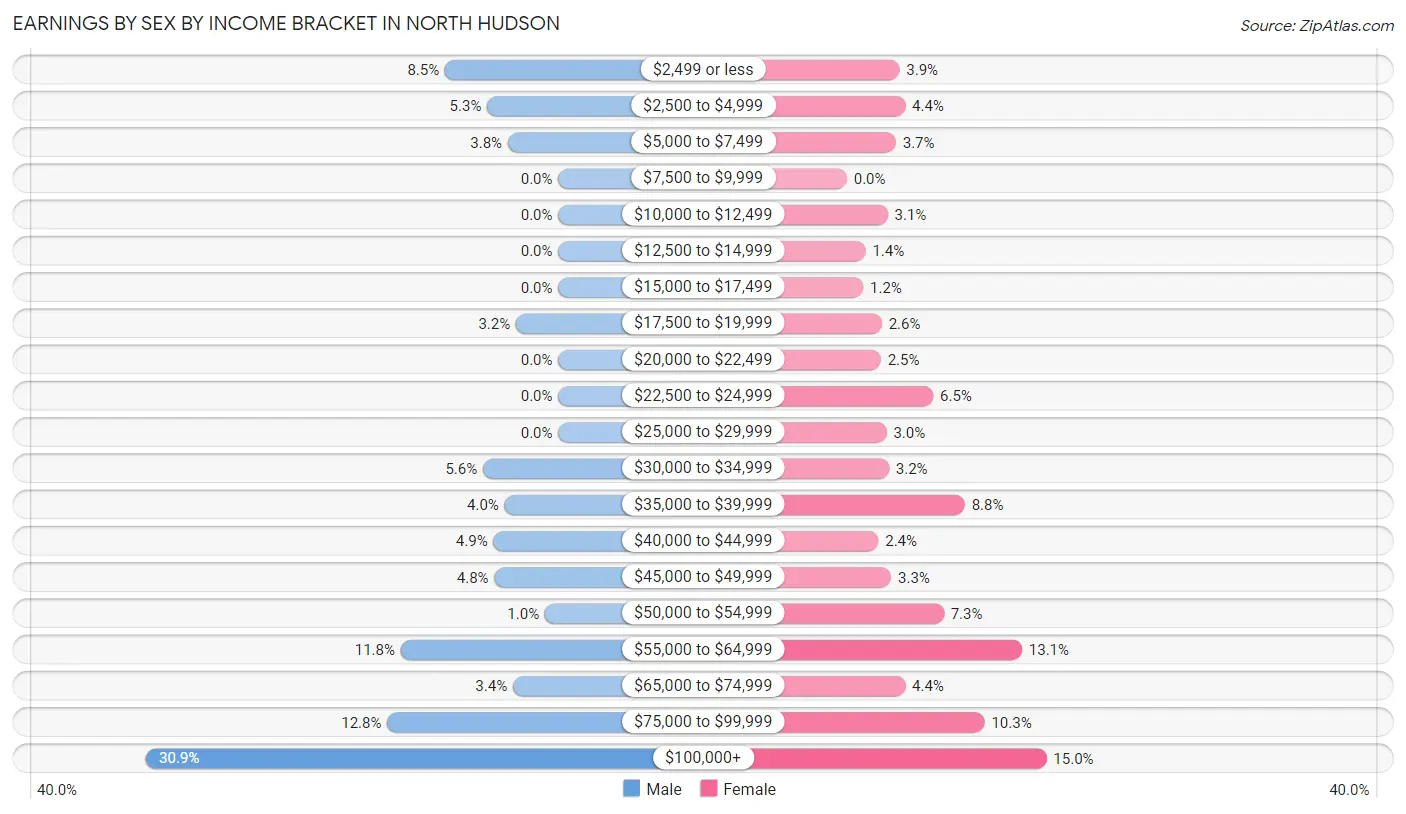
Earnings by Sex by Income Bracket in North Hudson
The most common earnings brackets in North Hudson are $100,000+ for men (400 | 30.9%) and $100,000+ for women (171 | 15.0%).
| Income | Male | Female |
| $2,499 or less | 110 (8.5%) | 45 (3.9%) |
| $2,500 to $4,999 | 69 (5.3%) | 50 (4.4%) |
| $5,000 to $7,499 | 49 (3.8%) | 42 (3.7%) |
| $7,500 to $9,999 | 0 (0.0%) | 0 (0.0%) |
| $10,000 to $12,499 | 0 (0.0%) | 35 (3.1%) |
| $12,500 to $14,999 | 0 (0.0%) | 16 (1.4%) |
| $15,000 to $17,499 | 0 (0.0%) | 14 (1.2%) |
| $17,500 to $19,999 | 41 (3.2%) | 30 (2.6%) |
| $20,000 to $22,499 | 0 (0.0%) | 29 (2.5%) |
| $22,500 to $24,999 | 0 (0.0%) | 74 (6.5%) |
| $25,000 to $29,999 | 0 (0.0%) | 34 (3.0%) |
| $30,000 to $34,999 | 73 (5.6%) | 36 (3.2%) |
| $35,000 to $39,999 | 52 (4.0%) | 101 (8.8%) |
| $40,000 to $44,999 | 63 (4.9%) | 27 (2.4%) |
| $45,000 to $49,999 | 62 (4.8%) | 38 (3.3%) |
| $50,000 to $54,999 | 13 (1.0%) | 83 (7.3%) |
| $55,000 to $64,999 | 153 (11.8%) | 150 (13.1%) |
| $65,000 to $74,999 | 44 (3.4%) | 50 (4.4%) |
| $75,000 to $99,999 | 166 (12.8%) | 118 (10.3%) |
| $100,000+ | 400 (30.9%) | 171 (15.0%) |
| Total | 1,295 (100.0%) | 1,143 (100.0%) |
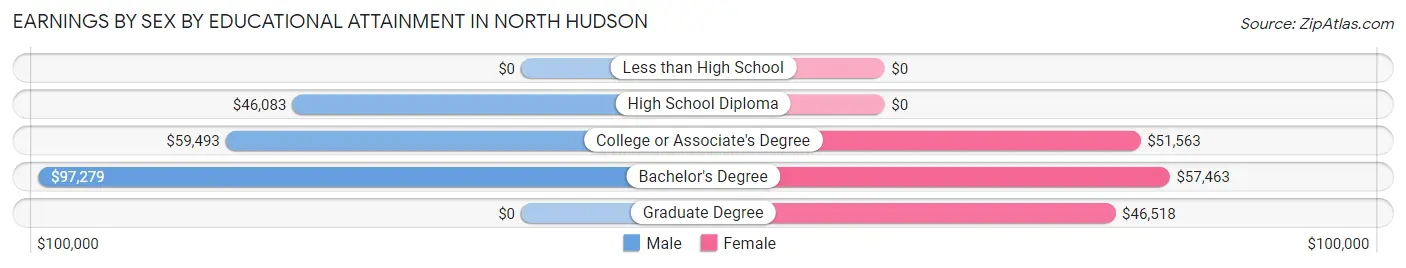
Earnings by Sex by Educational Attainment in North Hudson
Average earnings in North Hudson are $87,619 for men and $52,279 for women, a difference of 40.3%. Men with an educational attainment of bachelor's degree enjoy the highest average annual earnings of $97,279, while those with high school diploma education earn the least with $46,083. Women with an educational attainment of bachelor's degree earn the most with the average annual earnings of $57,463, while those with graduate degree education have the smallest earnings of $46,518.
| Educational Attainment | Male Income | Female Income |
| Less than High School | - | - |
| High School Diploma | $46,083 | $0 |
| College or Associate's Degree | $59,493 | $51,563 |
| Bachelor's Degree | $97,279 | $57,463 |
| Graduate Degree | - | - |
| Total | $87,619 | $52,279 |
Family Income in North Hudson
Family Income Brackets in North Hudson
According to the North Hudson family income data, there are 258 families falling into the $100,000 to $149,999 income range, which is the most common income bracket and makes up 25.8% of all families.
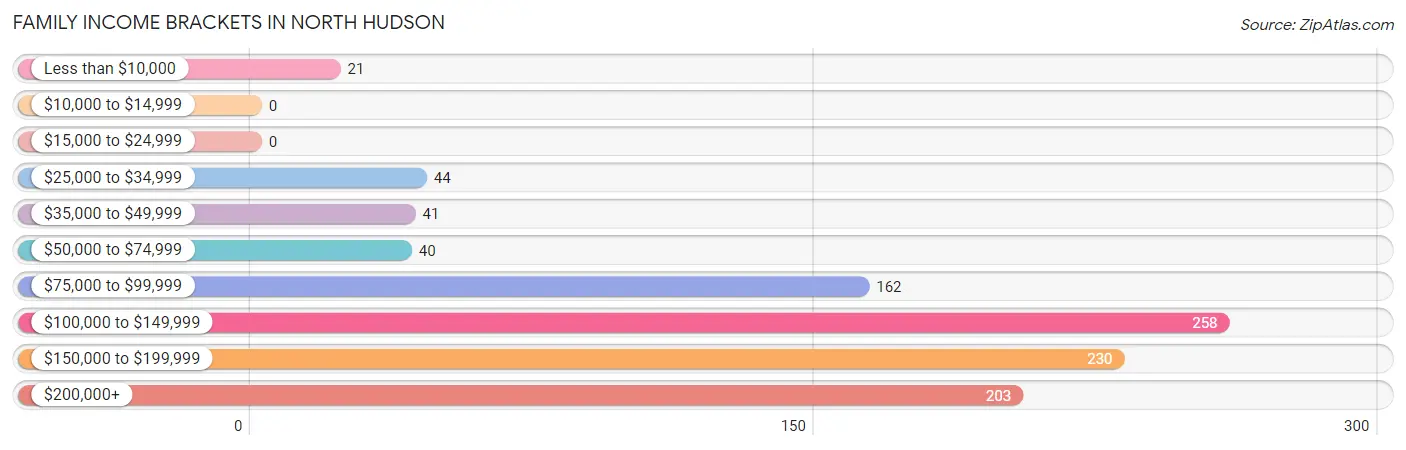
| Income Bracket | # Families | % Families |
| Less than $10,000 | 21 | 2.1% |
| $10,000 to $14,999 | 0 | 0.0% |
| $15,000 to $24,999 | 0 | 0.0% |
| $25,000 to $34,999 | 44 | 4.4% |
| $35,000 to $49,999 | 41 | 4.1% |
| $50,000 to $74,999 | 40 | 4.0% |
| $75,000 to $99,999 | 162 | 16.2% |
| $100,000 to $149,999 | 258 | 25.8% |
| $150,000 to $199,999 | 230 | 23.0% |
| $200,000+ | 203 | 20.3% |
Family Income by Famaliy Size in North Hudson
3-person families (235 | 23.5%) account for the highest median family income in North Hudson with $158,125 per family, while 3-person families (235 | 23.5%) have the highest median income of $52,708 per family member.
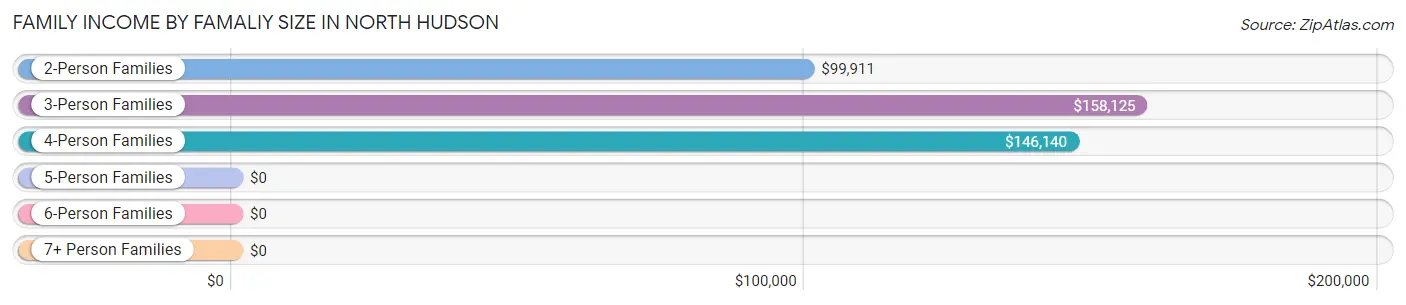
| Income Bracket | # Families | Median Income |
| 2-Person Families | 437 (43.7%) | $99,911 |
| 3-Person Families | 235 (23.5%) | $158,125 |
| 4-Person Families | 291 (29.1%) | $146,140 |
| 5-Person Families | 18 (1.8%) | $0 |
| 6-Person Families | 18 (1.8%) | $0 |
| 7+ Person Families | 0 (0.0%) | $0 |
| Total | 999 (100.0%) | $142,371 |
Family Income by Number of Earners in North Hudson
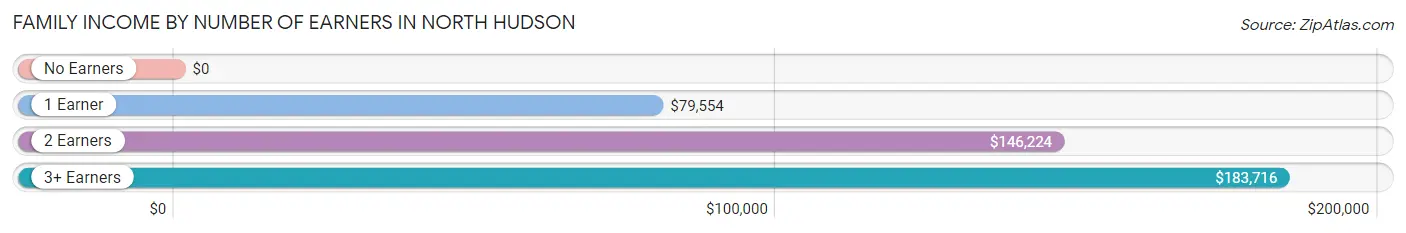
| Number of Earners | # Families | Median Income |
| No Earners | 85 (8.5%) | $0 |
| 1 Earner | 195 (19.5%) | $79,554 |
| 2 Earners | 607 (60.8%) | $146,224 |
| 3+ Earners | 112 (11.2%) | $183,716 |
| Total | 999 (100.0%) | $142,371 |
Household Income in North Hudson
Household Income Brackets in North Hudson
With 367 households falling in the category, the $100,000 to $149,999 income range is the most frequent in North Hudson, accounting for 25.5% of all households.
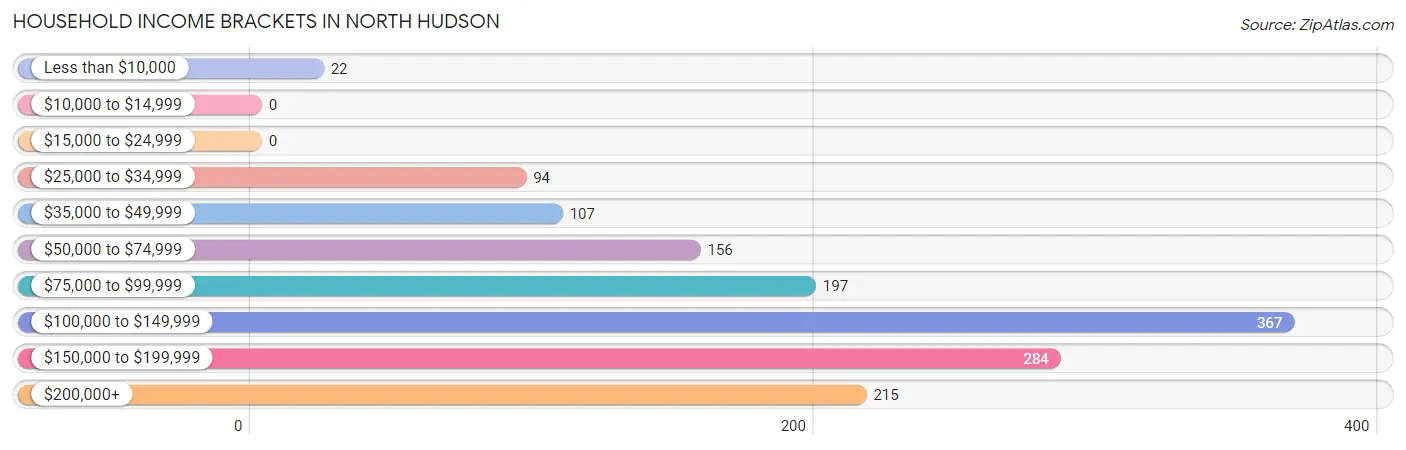
| Income Bracket | # Households | % Households |
| Less than $10,000 | 22 | 1.5% |
| $10,000 to $14,999 | 0 | 0.0% |
| $15,000 to $24,999 | 0 | 0.0% |
| $25,000 to $34,999 | 94 | 6.5% |
| $35,000 to $49,999 | 107 | 7.4% |
| $50,000 to $74,999 | 156 | 10.8% |
| $75,000 to $99,999 | 197 | 13.7% |
| $100,000 to $149,999 | 367 | 25.5% |
| $150,000 to $199,999 | 284 | 19.7% |
| $200,000+ | 215 | 14.9% |
Household Income by Householder Age in North Hudson
The median household income in North Hudson is $127,982, with the highest median household income of $146,103 found in the 25 to 44 years age bracket for the primary householder. A total of 368 households (25.6%) fall into this category. Meanwhile, the 15 to 24 years age bracket for the primary householder has the lowest median household income of $84,931, with 35 households (2.4%) in this group.
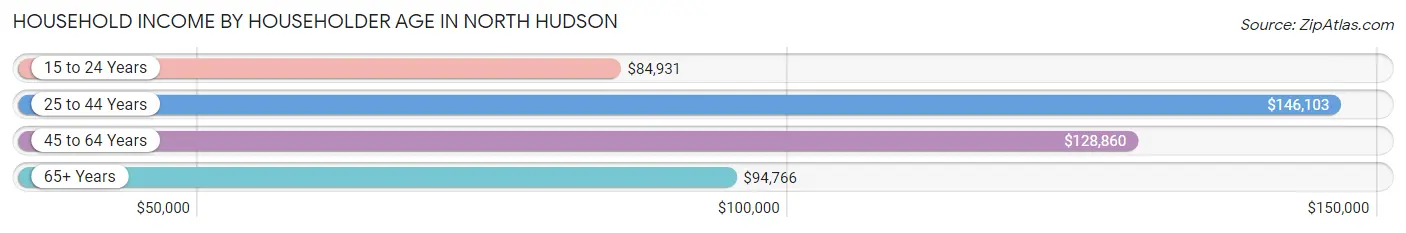
| Income Bracket | # Households | Median Income |
| 15 to 24 Years | 35 (2.4%) | $84,931 |
| 25 to 44 Years | 368 (25.6%) | $146,103 |
| 45 to 64 Years | 698 (48.5%) | $128,860 |
| 65+ Years | 339 (23.5%) | $94,766 |
| Total | 1,440 (100.0%) | $127,982 |
Poverty in North Hudson
Income Below Poverty by Sex and Age in North Hudson
With 4.1% poverty level for males and 3.8% for females among the residents of North Hudson, 5 year old males and 6 to 11 year old females are the most vulnerable to poverty, with 22 males (53.7%) and 24 females (40.7%) in their respective age groups living below the poverty level.
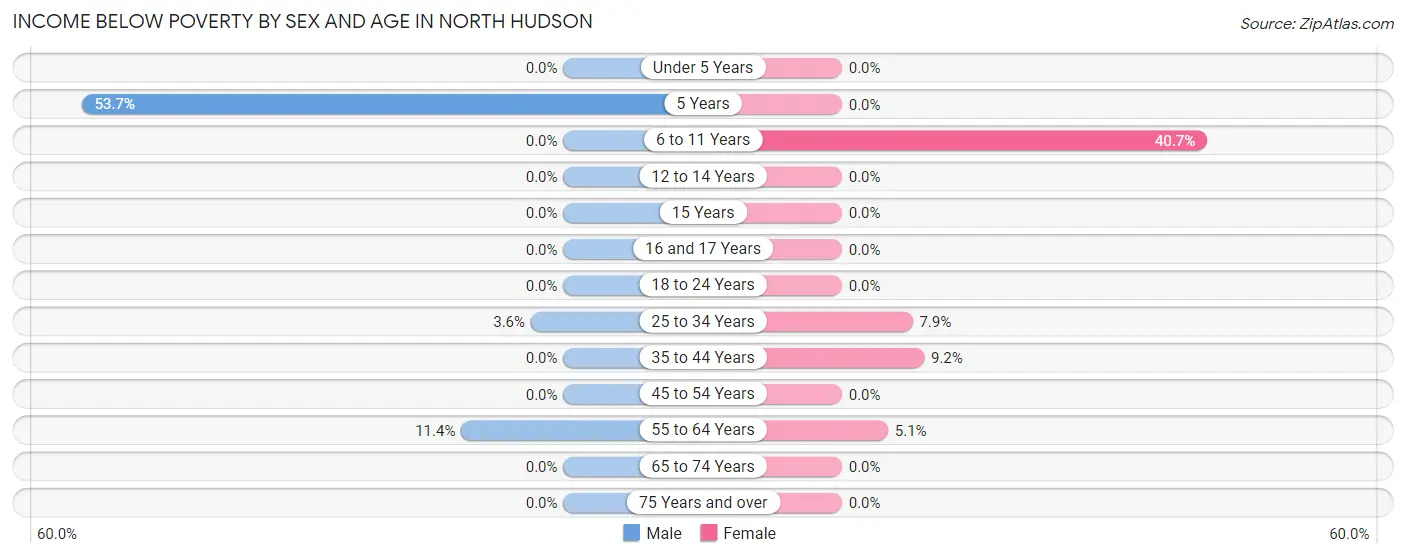
| Age Bracket | Male | Female |
| Under 5 Years | 0 (0.0%) | 0 (0.0%) |
| 5 Years | 22 (53.7%) | 0 (0.0%) |
| 6 to 11 Years | 0 (0.0%) | 24 (40.7%) |
| 12 to 14 Years | 0 (0.0%) | 0 (0.0%) |
| 15 Years | 0 (0.0%) | 0 (0.0%) |
| 16 and 17 Years | 0 (0.0%) | 0 (0.0%) |
| 18 to 24 Years | 0 (0.0%) | 0 (0.0%) |
| 25 to 34 Years | 8 (3.6%) | 21 (7.9%) |
| 35 to 44 Years | 0 (0.0%) | 12 (9.2%) |
| 45 to 54 Years | 0 (0.0%) | 0 (0.0%) |
| 55 to 64 Years | 49 (11.4%) | 16 (5.1%) |
| 65 to 74 Years | 0 (0.0%) | 0 (0.0%) |
| 75 Years and over | 0 (0.0%) | 0 (0.0%) |
| Total | 79 (4.1%) | 73 (3.8%) |
Income Above Poverty by Sex and Age in North Hudson
According to the poverty statistics in North Hudson, males aged under 5 years and females aged under 5 years are the age groups that are most secure financially, with 100.0% of males and 100.0% of females in these age groups living above the poverty line.
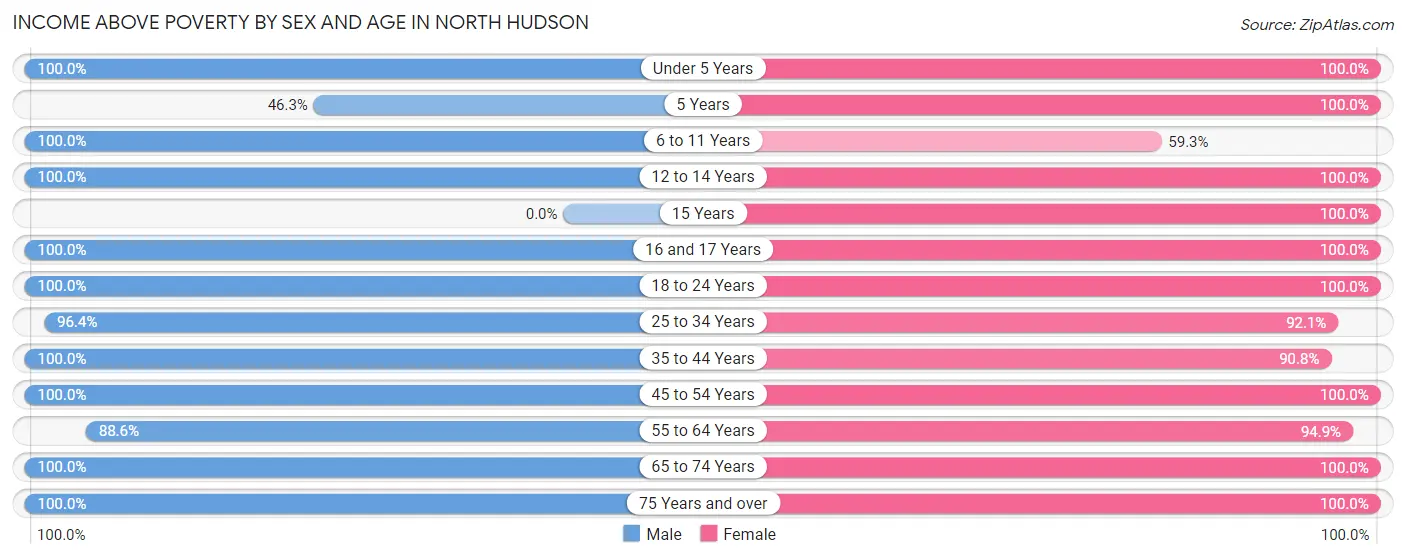
| Age Bracket | Male | Female |
| Under 5 Years | 221 (100.0%) | 81 (100.0%) |
| 5 Years | 19 (46.3%) | 16 (100.0%) |
| 6 to 11 Years | 101 (100.0%) | 35 (59.3%) |
| 12 to 14 Years | 57 (100.0%) | 40 (100.0%) |
| 15 Years | 0 (0.0%) | 33 (100.0%) |
| 16 and 17 Years | 123 (100.0%) | 81 (100.0%) |
| 18 to 24 Years | 153 (100.0%) | 117 (100.0%) |
| 25 to 34 Years | 213 (96.4%) | 246 (92.1%) |
| 35 to 44 Years | 203 (100.0%) | 119 (90.8%) |
| 45 to 54 Years | 169 (100.0%) | 359 (100.0%) |
| 55 to 64 Years | 382 (88.6%) | 296 (94.9%) |
| 65 to 74 Years | 222 (100.0%) | 195 (100.0%) |
| 75 Years and over | 1 (100.0%) | 203 (100.0%) |
| Total | 1,864 (95.9%) | 1,821 (96.2%) |
Income Below Poverty Among Married-Couple Families in North Hudson
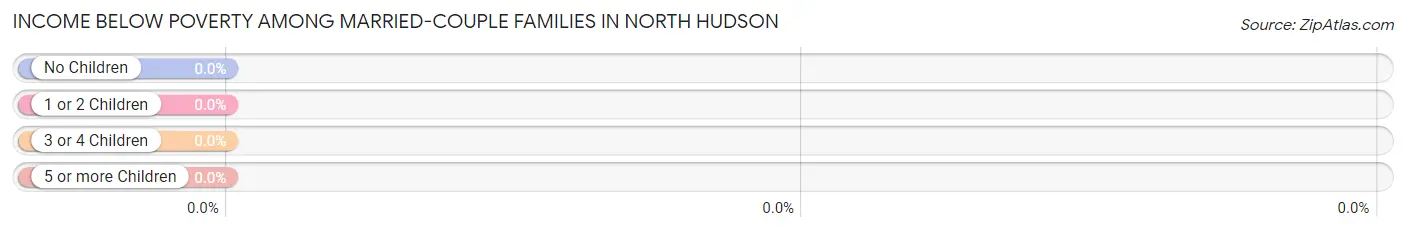
| Children | Above Poverty | Below Poverty |
| No Children | 456 (100.0%) | 0 (0.0%) |
| 1 or 2 Children | 350 (100.0%) | 0 (0.0%) |
| 3 or 4 Children | 29 (100.0%) | 0 (0.0%) |
| 5 or more Children | 0 (0.0%) | 0 (0.0%) |
| Total | 835 (100.0%) | 0 (0.0%) |
Income Below Poverty Among Single-Parent Households in North Hudson
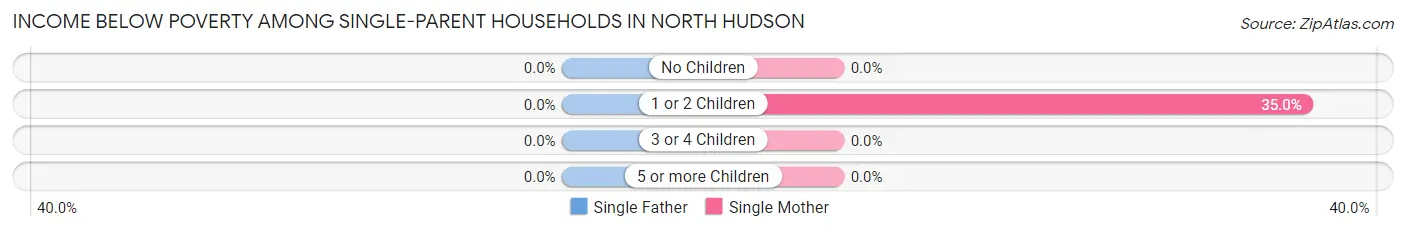
| Children | Single Father | Single Mother |
| No Children | 0 (0.0%) | 0 (0.0%) |
| 1 or 2 Children | 0 (0.0%) | 21 (35.0%) |
| 3 or 4 Children | 0 (0.0%) | 0 (0.0%) |
| 5 or more Children | 0 (0.0%) | 0 (0.0%) |
| Total | 0 (0.0%) | 21 (15.0%) |
Income Below Poverty Among Married-Couple vs Single-Parent Households in North Hudson
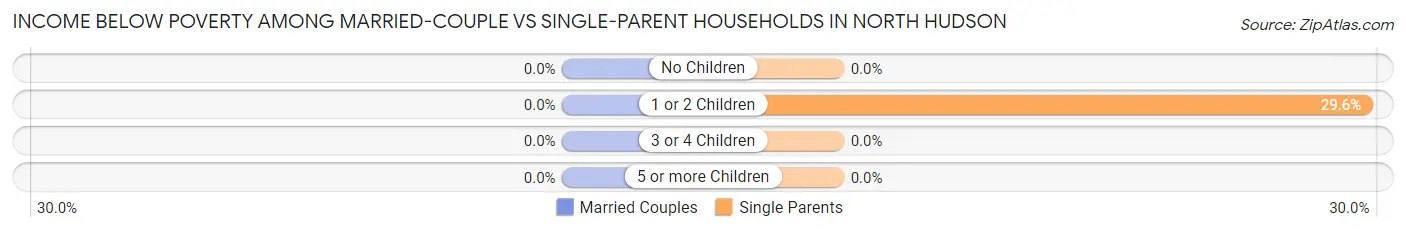
| Children | Married-Couple Families | Single-Parent Households |
| No Children | 0 (0.0%) | 0 (0.0%) |
| 1 or 2 Children | 0 (0.0%) | 21 (29.6%) |
| 3 or 4 Children | 0 (0.0%) | 0 (0.0%) |
| 5 or more Children | 0 (0.0%) | 0 (0.0%) |
| Total | 0 (0.0%) | 21 (12.8%) |
Race in North Hudson
The most populous races in North Hudson are White / Caucasian (3,595 | 93.7%), Hispanic or Latino (173 | 4.5%), and Two or more Races (157 | 4.1%).
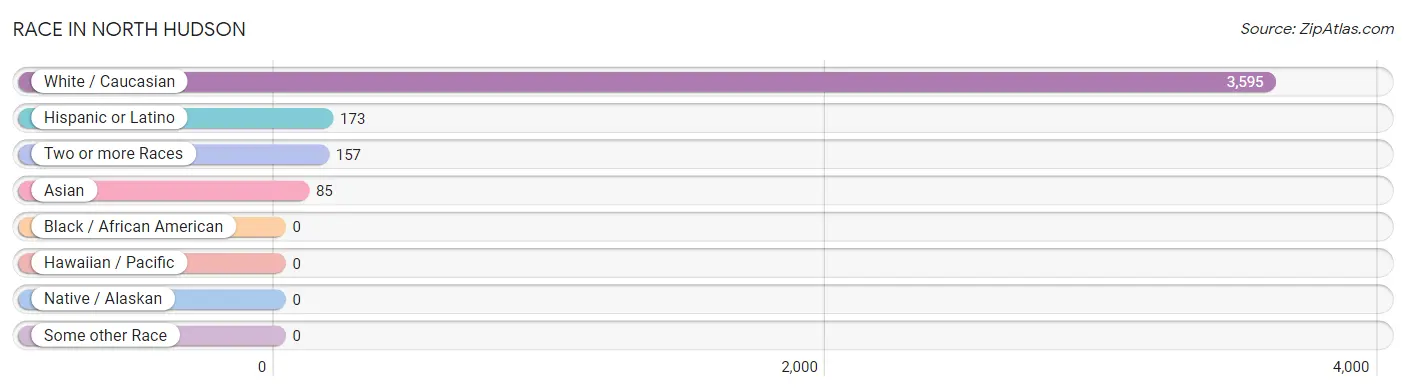
| Race | # Population | % Population |
| Asian | 85 | 2.2% |
| Black / African American | 0 | 0.0% |
| Hawaiian / Pacific | 0 | 0.0% |
| Hispanic or Latino | 173 | 4.5% |
| Native / Alaskan | 0 | 0.0% |
| White / Caucasian | 3,595 | 93.7% |
| Two or more Races | 157 | 4.1% |
| Some other Race | 0 | 0.0% |
| Total | 3,837 | 100.0% |
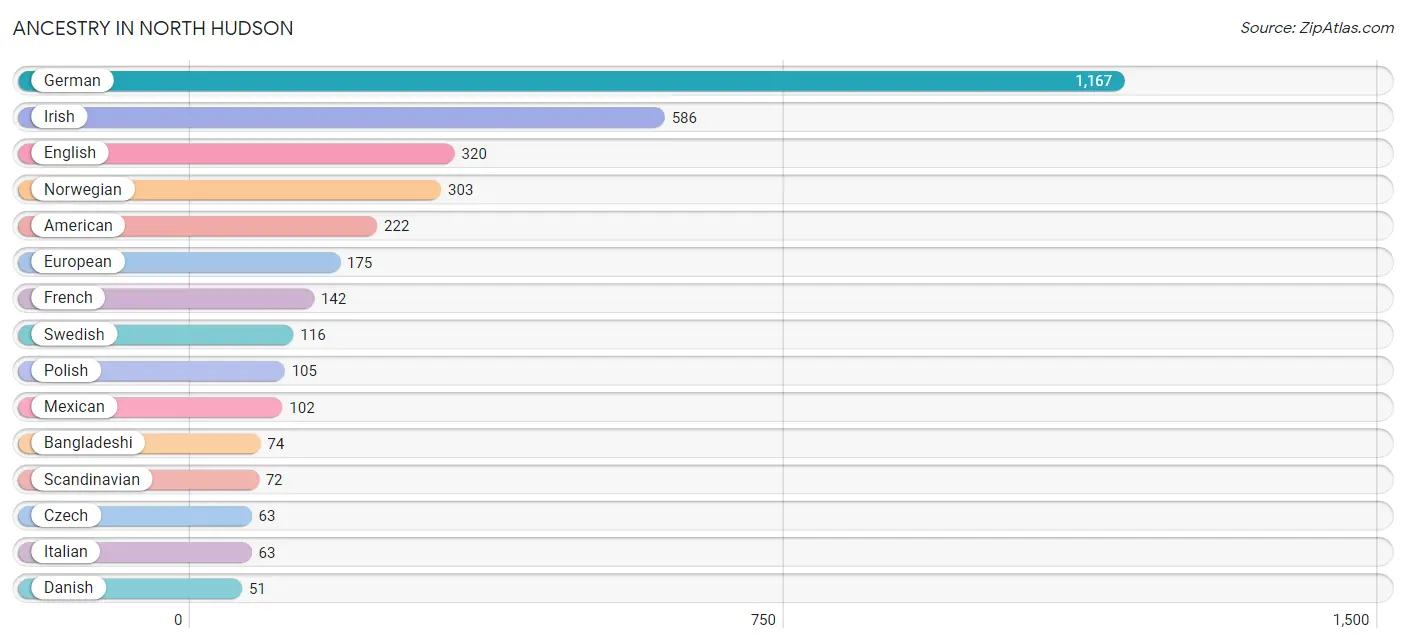
Ancestry in North Hudson
The most populous ancestries reported in North Hudson are German (1,167 | 30.4%), Irish (586 | 15.3%), English (320 | 8.3%), Norwegian (303 | 7.9%), and American (222 | 5.8%), together accounting for 67.7% of all North Hudson residents.
| Ancestry | # Population | % Population |
| American | 222 | 5.8% |
| Bangladeshi | 74 | 1.9% |
| Belgian | 11 | 0.3% |
| Burmese | 21 | 0.5% |
| Colombian | 27 | 0.7% |
| Cuban | 44 | 1.1% |
| Czech | 63 | 1.6% |
| Danish | 51 | 1.3% |
| Dutch | 28 | 0.7% |
| English | 320 | 8.3% |
| European | 175 | 4.6% |
| Finnish | 35 | 0.9% |
| French | 142 | 3.7% |
| German | 1,167 | 30.4% |
| Hungarian | 16 | 0.4% |
| Irish | 586 | 15.3% |
| Italian | 63 | 1.6% |
| Korean | 37 | 1.0% |
| Latvian | 16 | 0.4% |
| Mexican | 102 | 2.7% |
| Native Hawaiian | 41 | 1.1% |
| Northern European | 17 | 0.4% |
| Norwegian | 303 | 7.9% |
| Polish | 105 | 2.7% |
| Russian | 14 | 0.4% |
| Scandinavian | 72 | 1.9% |
| Scotch-Irish | 14 | 0.4% |
| Scottish | 17 | 0.4% |
| Slavic | 36 | 0.9% |
| South American | 27 | 0.7% |
| Swedish | 116 | 3.0% |
| Swiss | 29 | 0.8% | View All 32 Rows |
Immigrants in North Hudson
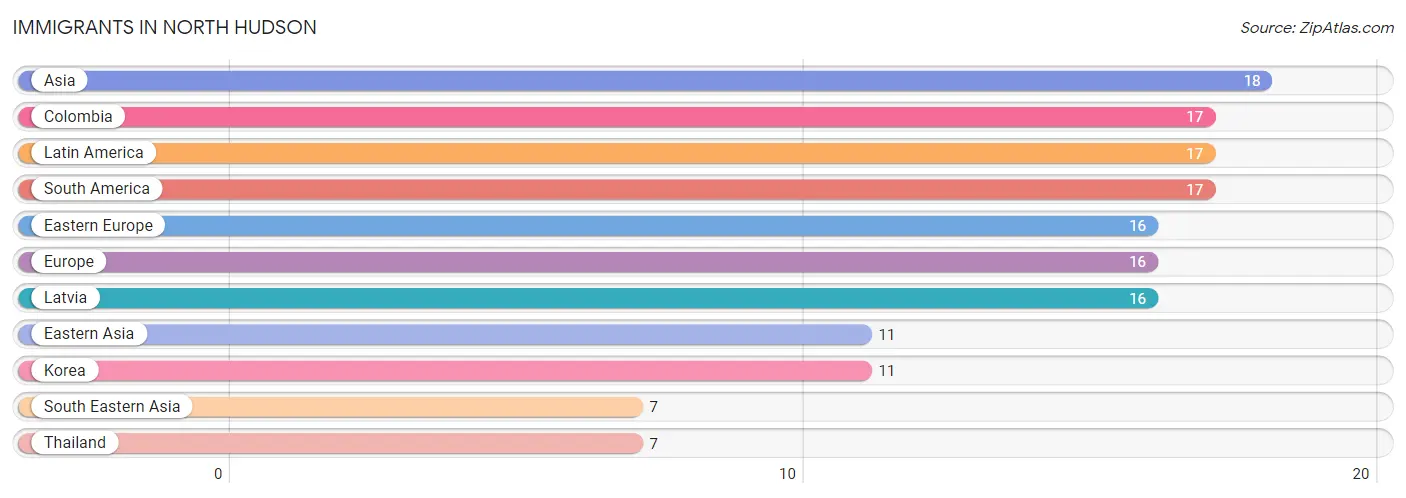
The most numerous immigrant groups reported in North Hudson came from Asia (18 | 0.5%), Colombia (17 | 0.4%), Latin America (17 | 0.4%), South America (17 | 0.4%), and Eastern Europe (16 | 0.4%), together accounting for 2.2% of all North Hudson residents.
| Immigration Origin | # Population | % Population |
| Asia | 18 | 0.5% |
| Colombia | 17 | 0.4% |
| Eastern Asia | 11 | 0.3% |
| Eastern Europe | 16 | 0.4% |
| Europe | 16 | 0.4% |
| Korea | 11 | 0.3% |
| Latin America | 17 | 0.4% |
| Latvia | 16 | 0.4% |
| South America | 17 | 0.4% |
| South Eastern Asia | 7 | 0.2% |
| Thailand | 7 | 0.2% | View All 11 Rows |
Sex and Age in North Hudson
Sex and Age in North Hudson
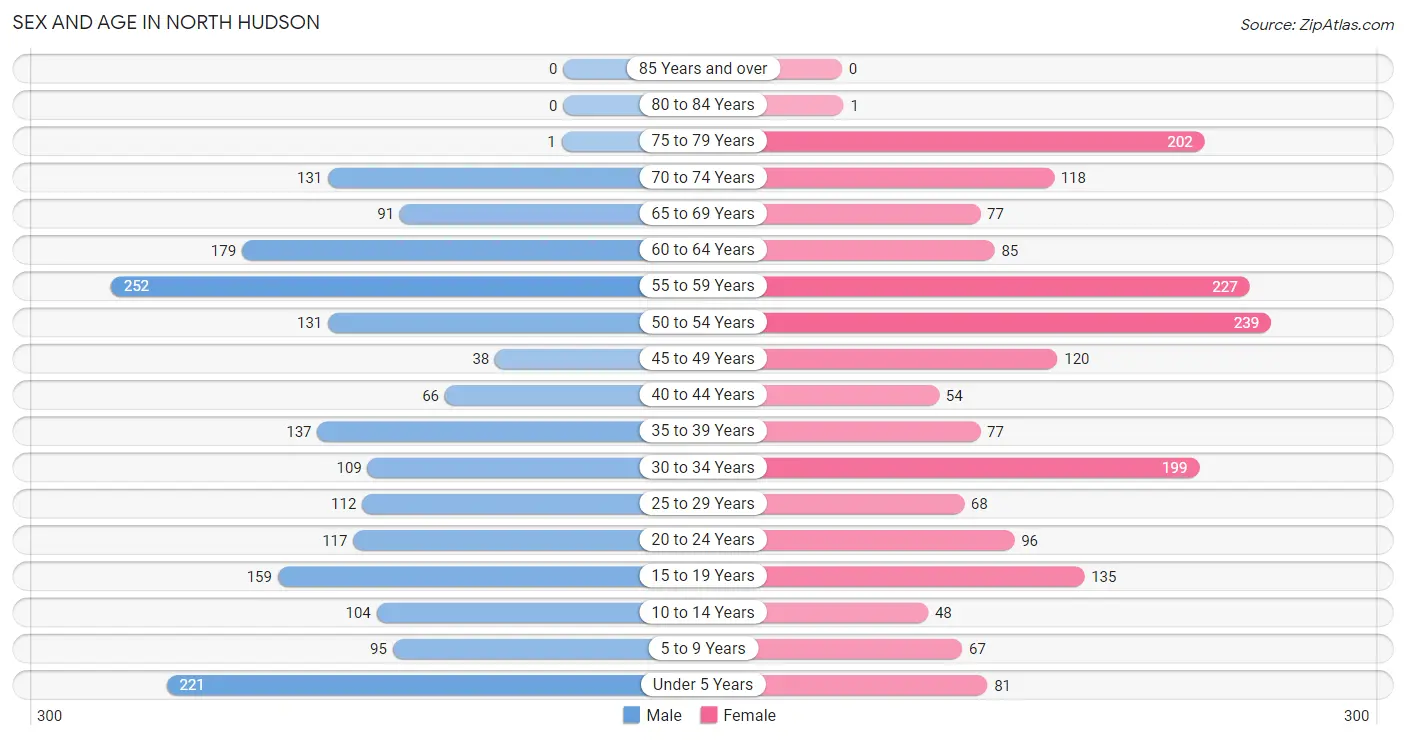
The most populous age groups in North Hudson are 55 to 59 Years (252 | 13.0%) for men and 50 to 54 Years (239 | 12.6%) for women.
| Age Bracket | Male | Female |
| Under 5 Years | 221 (11.4%) | 81 (4.3%) |
| 5 to 9 Years | 95 (4.9%) | 67 (3.5%) |
| 10 to 14 Years | 104 (5.3%) | 48 (2.5%) |
| 15 to 19 Years | 159 (8.2%) | 135 (7.1%) |
| 20 to 24 Years | 117 (6.0%) | 96 (5.1%) |
| 25 to 29 Years | 112 (5.8%) | 68 (3.6%) |
| 30 to 34 Years | 109 (5.6%) | 199 (10.5%) |
| 35 to 39 Years | 137 (7.0%) | 77 (4.1%) |
| 40 to 44 Years | 66 (3.4%) | 54 (2.9%) |
| 45 to 49 Years | 38 (2.0%) | 120 (6.3%) |
| 50 to 54 Years | 131 (6.7%) | 239 (12.6%) |
| 55 to 59 Years | 252 (13.0%) | 227 (12.0%) |
| 60 to 64 Years | 179 (9.2%) | 85 (4.5%) |
| 65 to 69 Years | 91 (4.7%) | 77 (4.1%) |
| 70 to 74 Years | 131 (6.7%) | 118 (6.2%) |
| 75 to 79 Years | 1 (0.1%) | 202 (10.7%) |
| 80 to 84 Years | 0 (0.0%) | 1 (0.1%) |
| 85 Years and over | 0 (0.0%) | 0 (0.0%) |
| Total | 1,943 (100.0%) | 1,894 (100.0%) |
Families and Households in North Hudson
Median Family Size in North Hudson
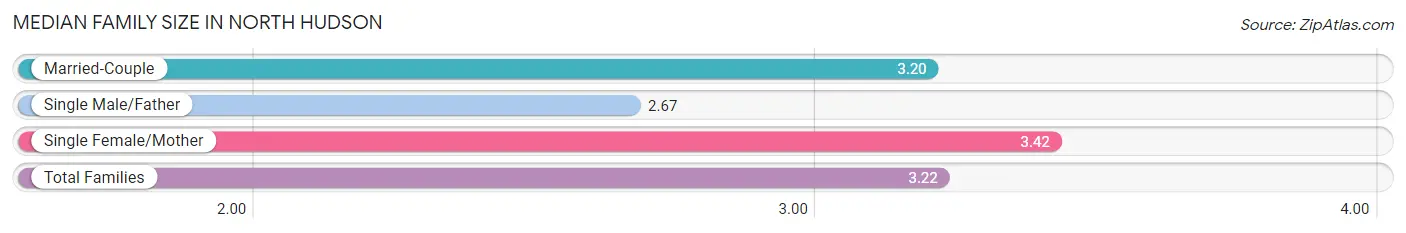
The median family size in North Hudson is 3.22 persons per family, with single female/mother families (140 | 14.0%) accounting for the largest median family size of 3.42 persons per family. On the other hand, single male/father families (24 | 2.4%) represent the smallest median family size with 2.67 persons per family.
| Family Type | # Families | Family Size |
| Married-Couple | 835 (83.6%) | 3.20 |
| Single Male/Father | 24 (2.4%) | 2.67 |
| Single Female/Mother | 140 (14.0%) | 3.42 |
| Total Families | 999 (100.0%) | 3.22 |
Median Household Size in North Hudson
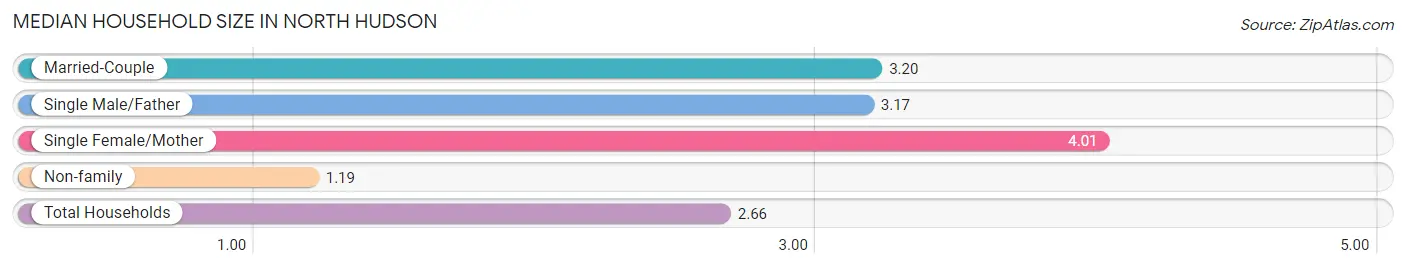
The median household size in North Hudson is 2.66 persons per household, with single female/mother households (140 | 9.7%) accounting for the largest median household size of 4.01 persons per household. non-family households (441 | 30.6%) represent the smallest median household size with 1.19 persons per household.
| Household Type | # Households | Household Size |
| Married-Couple | 835 (58.0%) | 3.20 |
| Single Male/Father | 24 (1.7%) | 3.17 |
| Single Female/Mother | 140 (9.7%) | 4.01 |
| Non-family | 441 (30.6%) | 1.19 |
| Total Households | 1,440 (100.0%) | 2.66 |
Household Size by Marriage Status in North Hudson
Out of a total of 1,440 households in North Hudson, 999 (69.4%) are family households, while 441 (30.6%) are nonfamily households. The most numerous type of family households are 2-person households, comprising 414, and the most common type of nonfamily households are 1-person households, comprising 366.
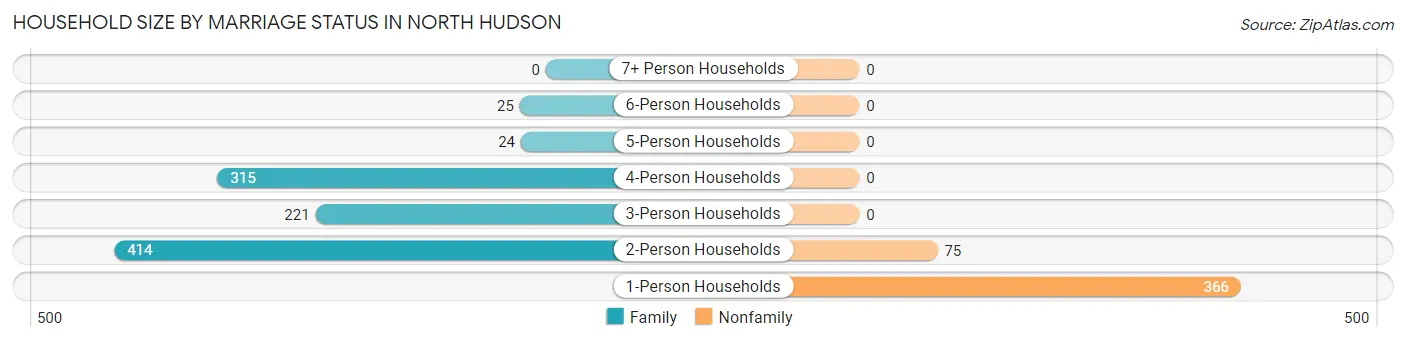
| Household Size | Family Households | Nonfamily Households |
| 1-Person Households | - | 366 (25.4%) |
| 2-Person Households | 414 (28.7%) | 75 (5.2%) |
| 3-Person Households | 221 (15.3%) | 0 (0.0%) |
| 4-Person Households | 315 (21.9%) | 0 (0.0%) |
| 5-Person Households | 24 (1.7%) | 0 (0.0%) |
| 6-Person Households | 25 (1.7%) | 0 (0.0%) |
| 7+ Person Households | 0 (0.0%) | 0 (0.0%) |
| Total | 999 (69.4%) | 441 (30.6%) |
Female Fertility in North Hudson
Fertility by Age in North Hudson
Average fertility rate in North Hudson is 60.0 births per 1,000 women. Women in the age bracket of 20 to 34 years have the highest fertility rate with 94.0 births per 1,000 women. Women in the age bracket of 20 to 34 years acount for 73.9% of all women with births.
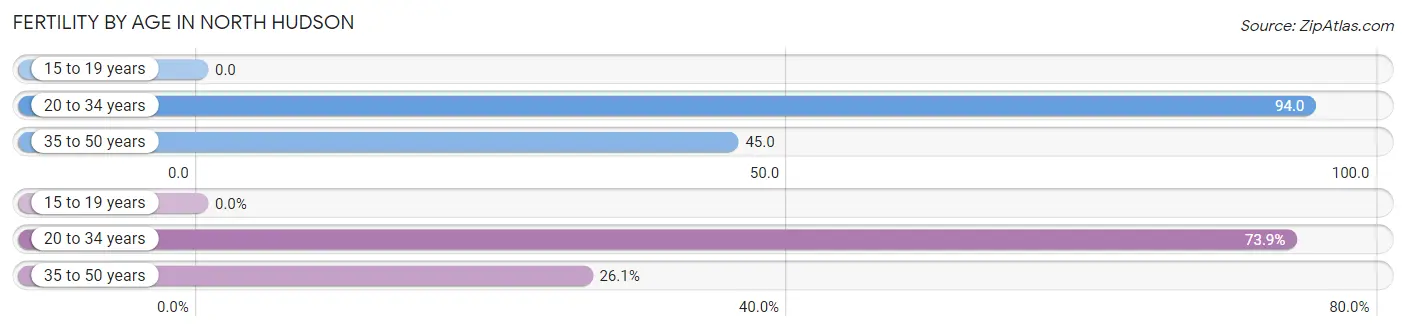
| Age Bracket | Women with Births | Births / 1,000 Women |
| 15 to 19 years | 0 (0.0%) | 0.0 |
| 20 to 34 years | 34 (73.9%) | 94.0 |
| 35 to 50 years | 12 (26.1%) | 45.0 |
| Total | 46 (100.0%) | 60.0 |
Fertility by Age by Marriage Status in North Hudson
58.7% of women with births (46) in North Hudson are married. The highest percentage of unmarried women with births falls into 35 to 50 years age bracket with 100.0% of them unmarried at the time of birth, while the lowest percentage of unmarried women with births belong to 20 to 34 years age bracket with 20.6% of them unmarried.
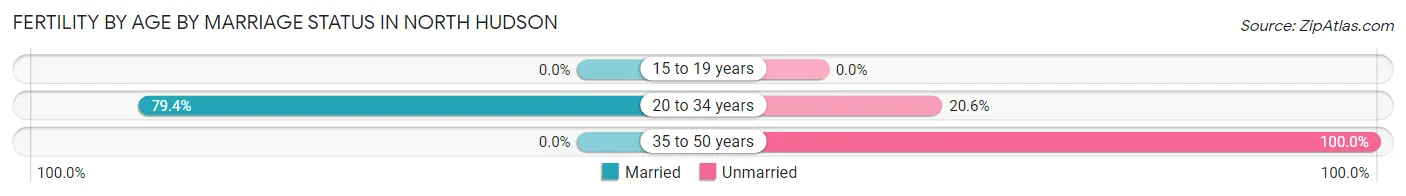
| Age Bracket | Married | Unmarried |
| 15 to 19 years | 0 (0.0%) | 0 (0.0%) |
| 20 to 34 years | 27 (79.4%) | 7 (20.6%) |
| 35 to 50 years | 0 (0.0%) | 12 (100.0%) |
| Total | 27 (58.7%) | 19 (41.3%) |
Fertility by Education in North Hudson
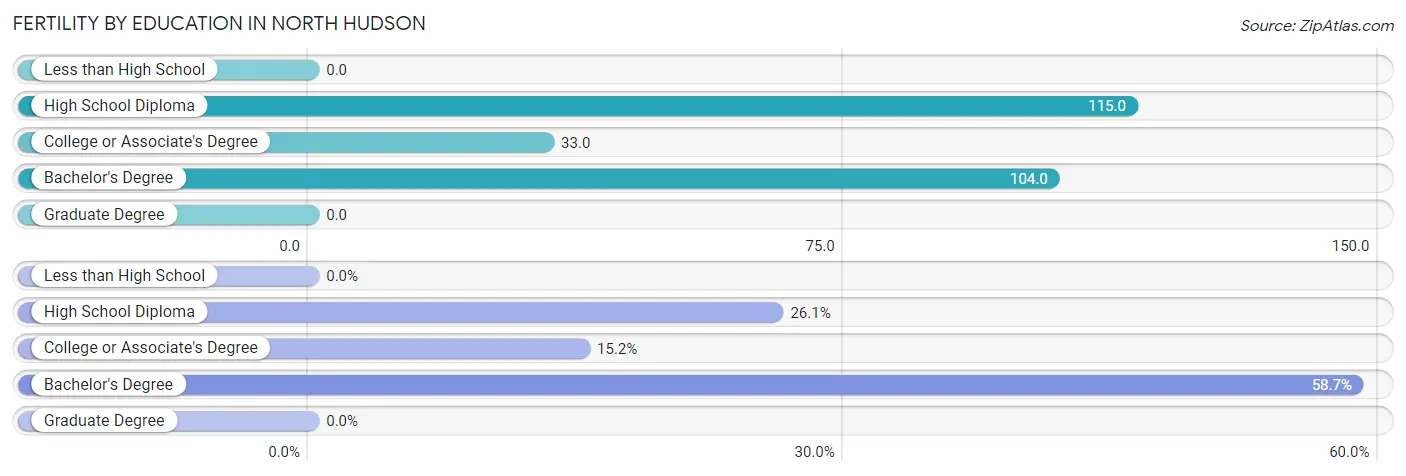
| Educational Attainment | Women with Births | Births / 1,000 Women |
| Less than High School | 0 (0.0%) | 0.0 |
| High School Diploma | 12 (26.1%) | 115.0 |
| College or Associate's Degree | 7 (15.2%) | 33.0 |
| Bachelor's Degree | 27 (58.7%) | 104.0 |
| Graduate Degree | 0 (0.0%) | 0.0 |
| Total | 46 (100.0%) | 60.0 |
Fertility by Education by Marriage Status in North Hudson
41.3% of women with births in North Hudson are unmarried. Women with the educational attainment of bachelor's degree are most likely to be married with 100.0% of them married at childbirth, while women with the educational attainment of high school diploma are least likely to be married with 100.0% of them unmarried at childbirth.
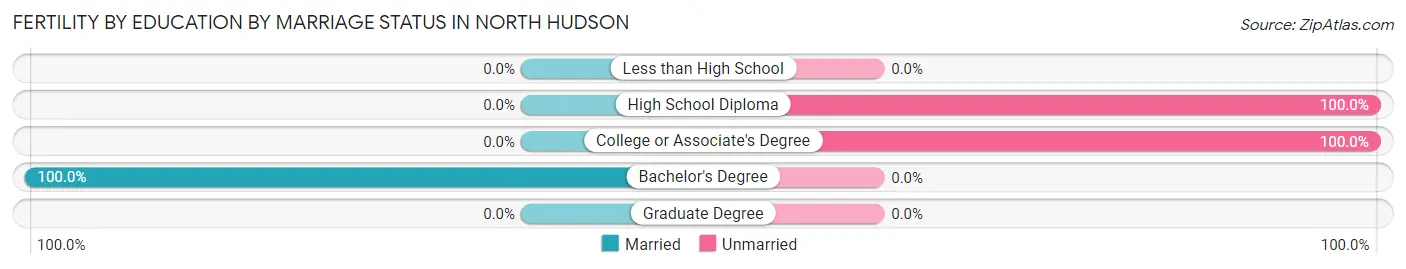
| Educational Attainment | Married | Unmarried |
| Less than High School | 0 (0.0%) | 0 (0.0%) |
| High School Diploma | 0 (0.0%) | 12 (100.0%) |
| College or Associate's Degree | 0 (0.0%) | 7 (100.0%) |
| Bachelor's Degree | 27 (100.0%) | 0 (0.0%) |
| Graduate Degree | 0 (0.0%) | 0 (0.0%) |
| Total | 27 (58.7%) | 19 (41.3%) |
Employment Characteristics in North Hudson
Employment by Class of Employer in North Hudson
Among the 2,135 employed individuals in North Hudson, private company employees (1,518 | 71.1%), not-for-profit organizations (153 | 7.2%), and self-employed (not incorporated) (151 | 7.1%) make up the most common classes of employment.
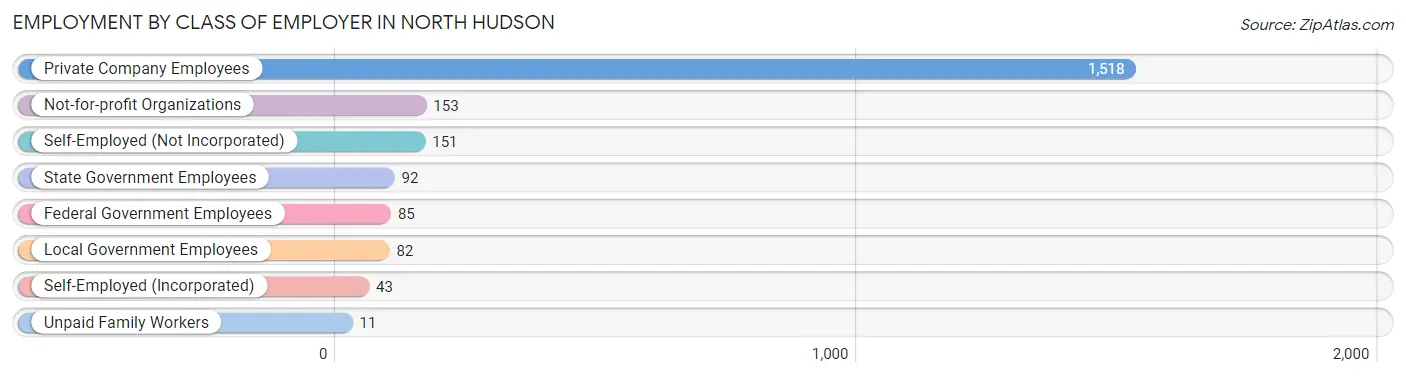
| Employer Class | # Employees | % Employees |
| Private Company Employees | 1,518 | 71.1% |
| Self-Employed (Incorporated) | 43 | 2.0% |
| Self-Employed (Not Incorporated) | 151 | 7.1% |
| Not-for-profit Organizations | 153 | 7.2% |
| Local Government Employees | 82 | 3.8% |
| State Government Employees | 92 | 4.3% |
| Federal Government Employees | 85 | 4.0% |
| Unpaid Family Workers | 11 | 0.5% |
| Total | 2,135 | 100.0% |
Employment Status by Age in North Hudson
According to the labor force statistics for North Hudson, out of the total population over 16 years of age (3,188), 69.0% or 2,200 individuals are in the labor force, with 2.2% or 48 of them unemployed. The age group with the highest labor force participation rate is 25 to 29 years, with 95.6% or 172 individuals in the labor force. Within the labor force, the 55 to 59 years age range has the highest percentage of unemployed individuals, with 9.4% or 39 of them being unemployed.
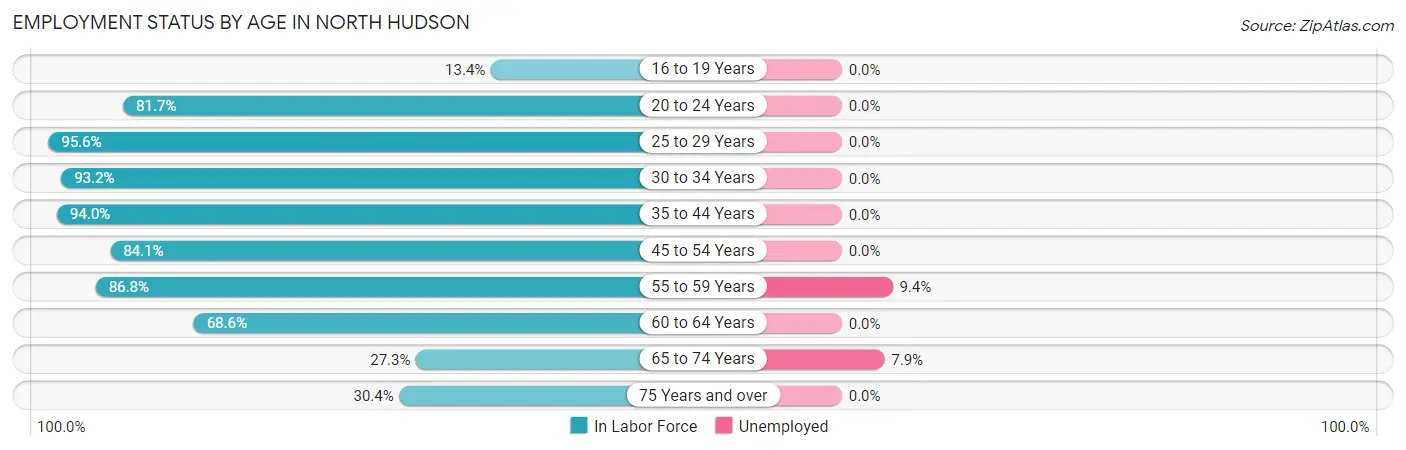
| Age Bracket | In Labor Force | Unemployed |
| 16 to 19 Years | 35 (13.4%) | 0 (0.0%) |
| 20 to 24 Years | 174 (81.7%) | 0 (0.0%) |
| 25 to 29 Years | 172 (95.6%) | 0 (0.0%) |
| 30 to 34 Years | 287 (93.2%) | 0 (0.0%) |
| 35 to 44 Years | 314 (94.0%) | 0 (0.0%) |
| 45 to 54 Years | 444 (84.1%) | 0 (0.0%) |
| 55 to 59 Years | 416 (86.8%) | 39 (9.4%) |
| 60 to 64 Years | 181 (68.6%) | 0 (0.0%) |
| 65 to 74 Years | 114 (27.3%) | 9 (7.9%) |
| 75 Years and over | 62 (30.4%) | 0 (0.0%) |
| Total | 2,200 (69.0%) | 48 (2.2%) |
Employment Status by Educational Attainment in North Hudson
According to labor force statistics for North Hudson, 86.7% of individuals (1,815) out of the total population between 25 and 64 years of age (2,093) are in the labor force, with 2.1% or 38 of them being unemployed. The group with the highest labor force participation rate are those with the educational attainment of bachelor's degree or higher, with 91.2% or 1,014 individuals in the labor force. Within the labor force, individuals with college / associate degree education have the highest percentage of unemployment, with 6.9% or 39 of them being unemployed.
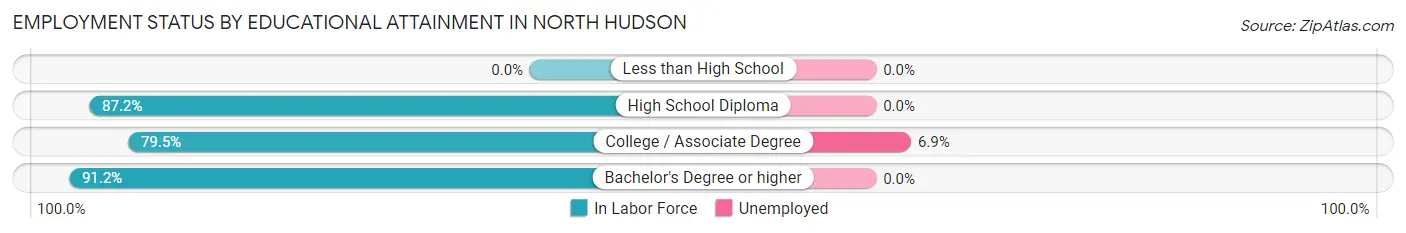
| Educational Attainment | In Labor Force | Unemployed |
| Less than High School | 0 (0.0%) | 0 (0.0%) |
| High School Diploma | 231 (87.2%) | 0 (0.0%) |
| College / Associate Degree | 569 (79.5%) | 49 (6.9%) |
| Bachelor's Degree or higher | 1,014 (91.2%) | 0 (0.0%) |
| Total | 1,815 (86.7%) | 44 (2.1%) |
Employment Occupations by Sex in North Hudson
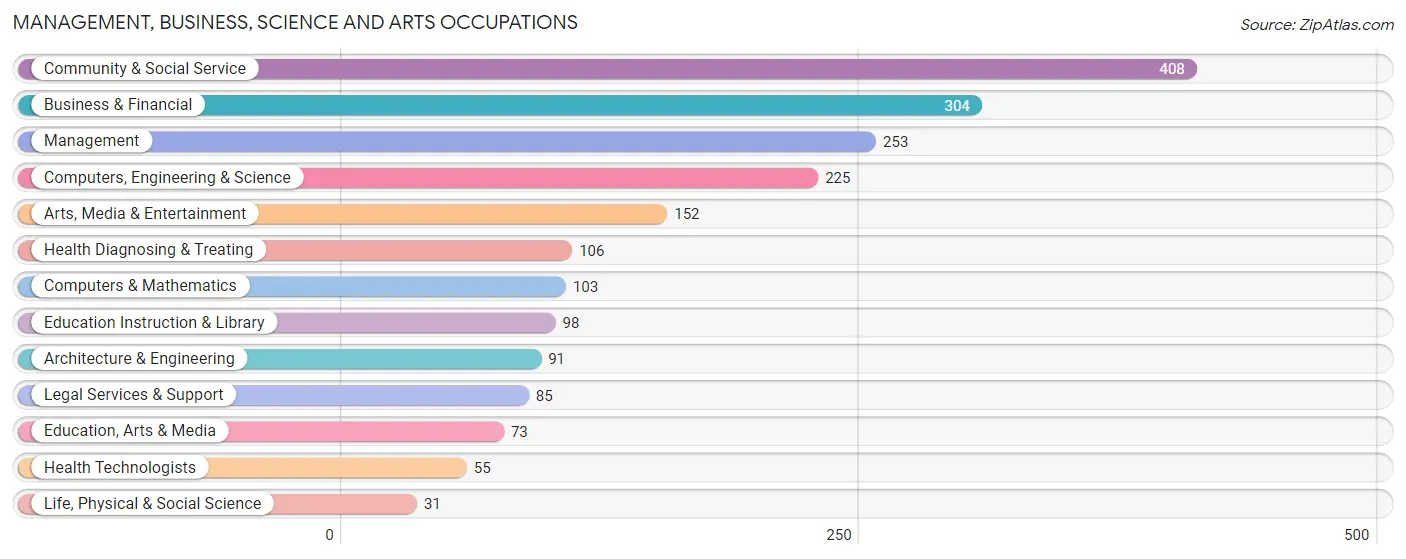
Management, Business, Science and Arts Occupations
The most common Management, Business, Science and Arts occupations in North Hudson are Community & Social Service (408 | 19.0%), Business & Financial (304 | 14.1%), Management (253 | 11.8%), Computers, Engineering & Science (225 | 10.5%), and Arts, Media & Entertainment (152 | 7.1%).
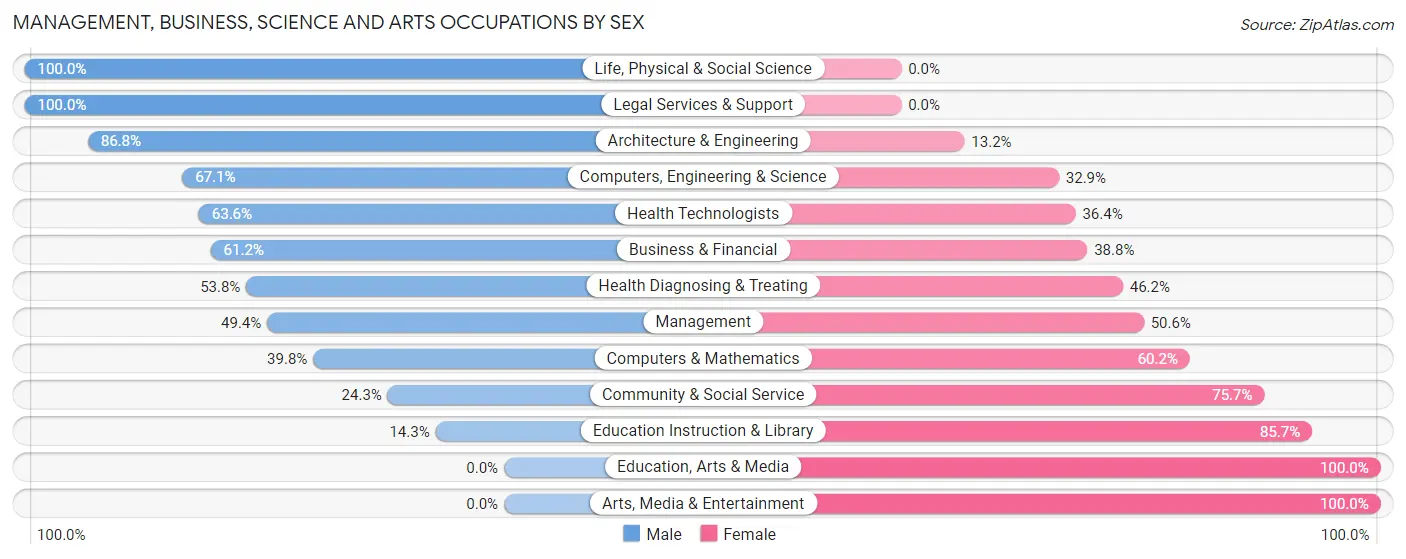
Management, Business, Science and Arts Occupations by Sex
Within the Management, Business, Science and Arts occupations in North Hudson, the most male-oriented occupations are Life, Physical & Social Science (100.0%), Legal Services & Support (100.0%), and Architecture & Engineering (86.8%), while the most female-oriented occupations are Education, Arts & Media (100.0%), Arts, Media & Entertainment (100.0%), and Education Instruction & Library (85.7%).
| Occupation | Male | Female |
| Management | 125 (49.4%) | 128 (50.6%) |
| Business & Financial | 186 (61.2%) | 118 (38.8%) |
| Computers, Engineering & Science | 151 (67.1%) | 74 (32.9%) |
| Computers & Mathematics | 41 (39.8%) | 62 (60.2%) |
| Architecture & Engineering | 79 (86.8%) | 12 (13.2%) |
| Life, Physical & Social Science | 31 (100.0%) | 0 (0.0%) |
| Community & Social Service | 99 (24.3%) | 309 (75.7%) |
| Education, Arts & Media | 0 (0.0%) | 73 (100.0%) |
| Legal Services & Support | 85 (100.0%) | 0 (0.0%) |
| Education Instruction & Library | 14 (14.3%) | 84 (85.7%) |
| Arts, Media & Entertainment | 0 (0.0%) | 152 (100.0%) |
| Health Diagnosing & Treating | 57 (53.8%) | 49 (46.2%) |
| Health Technologists | 35 (63.6%) | 20 (36.4%) |
| Total (Category) | 618 (47.7%) | 678 (52.3%) |
| Total (Overall) | 1,085 (50.4%) | 1,066 (49.6%) |
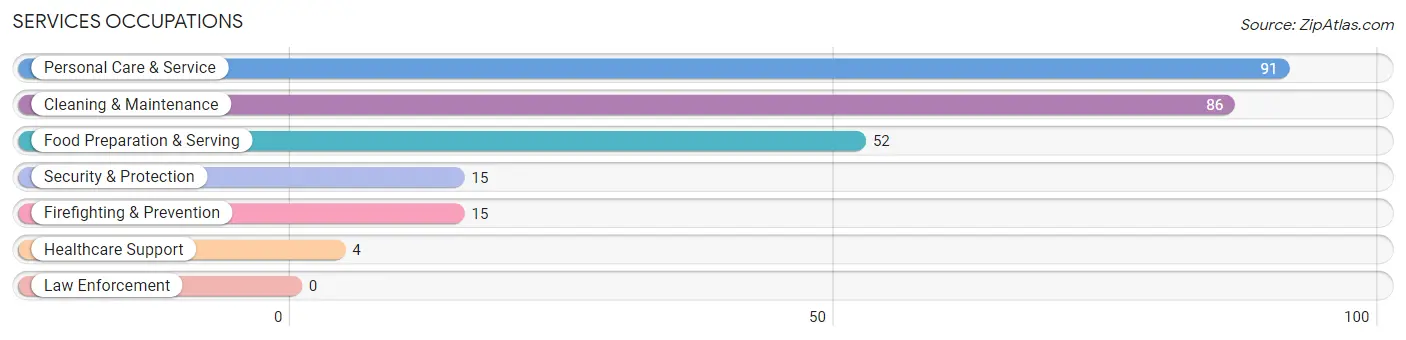
Services Occupations
The most common Services occupations in North Hudson are Personal Care & Service (91 | 4.2%), Cleaning & Maintenance (86 | 4.0%), Food Preparation & Serving (52 | 2.4%), Security & Protection (15 | 0.7%), and Firefighting & Prevention (15 | 0.7%).
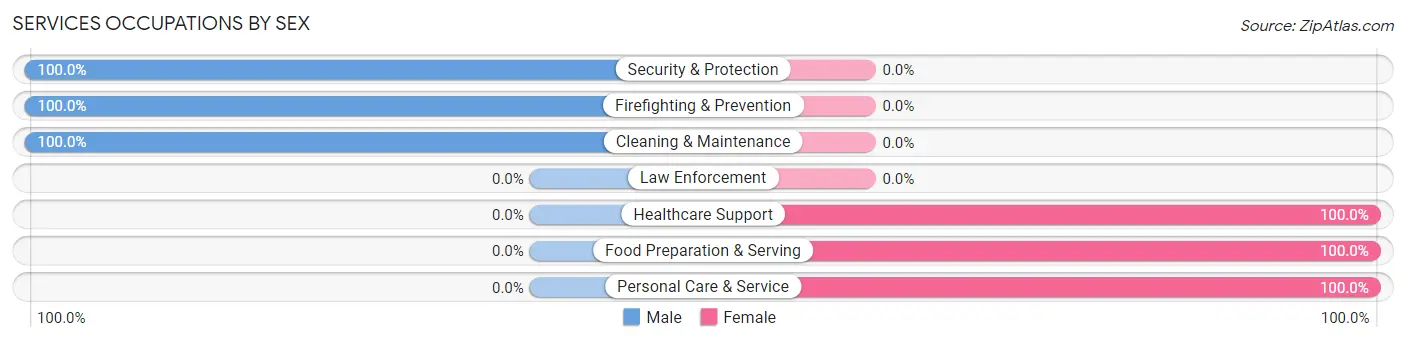
Services Occupations by Sex
Within the Services occupations in North Hudson, the most male-oriented occupations are Security & Protection (100.0%), Firefighting & Prevention (100.0%), and Cleaning & Maintenance (100.0%), while the most female-oriented occupations are Healthcare Support (100.0%), Food Preparation & Serving (100.0%), and Personal Care & Service (100.0%).
| Occupation | Male | Female |
| Healthcare Support | 0 (0.0%) | 4 (100.0%) |
| Security & Protection | 15 (100.0%) | 0 (0.0%) |
| Firefighting & Prevention | 15 (100.0%) | 0 (0.0%) |
| Law Enforcement | 0 (0.0%) | 0 (0.0%) |
| Food Preparation & Serving | 0 (0.0%) | 52 (100.0%) |
| Cleaning & Maintenance | 86 (100.0%) | 0 (0.0%) |
| Personal Care & Service | 0 (0.0%) | 91 (100.0%) |
| Total (Category) | 101 (40.7%) | 147 (59.3%) |
| Total (Overall) | 1,085 (50.4%) | 1,066 (49.6%) |
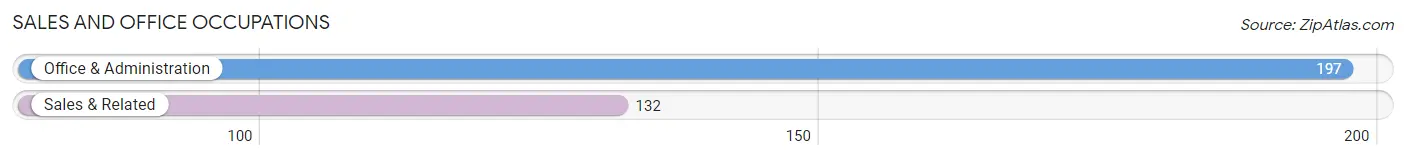
Sales and Office Occupations
The most common Sales and Office occupations in North Hudson are Office & Administration (197 | 9.2%), and Sales & Related (132 | 6.1%).
Sales and Office Occupations by Sex
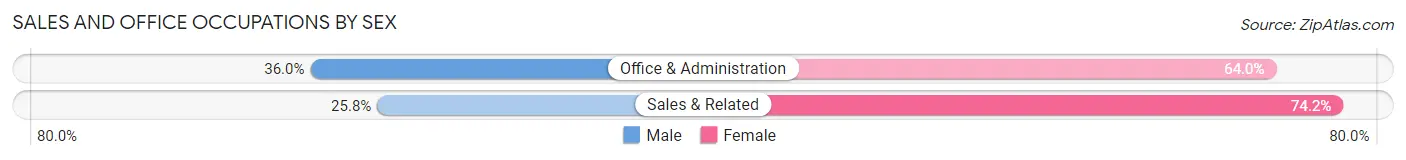
| Occupation | Male | Female |
| Sales & Related | 34 (25.8%) | 98 (74.2%) |
| Office & Administration | 71 (36.0%) | 126 (64.0%) |
| Total (Category) | 105 (31.9%) | 224 (68.1%) |
| Total (Overall) | 1,085 (50.4%) | 1,066 (49.6%) |
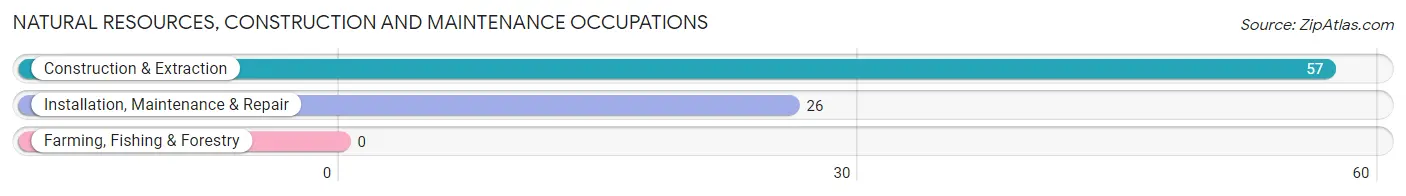
Natural Resources, Construction and Maintenance Occupations
The most common Natural Resources, Construction and Maintenance occupations in North Hudson are Construction & Extraction (57 | 2.6%), and Installation, Maintenance & Repair (26 | 1.2%).
Natural Resources, Construction and Maintenance Occupations by Sex
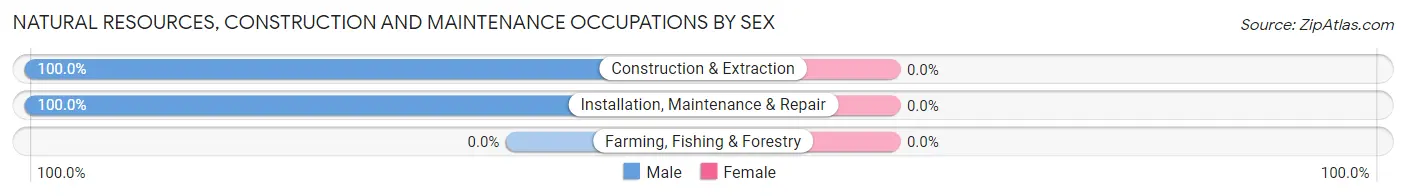
| Occupation | Male | Female |
| Farming, Fishing & Forestry | 0 (0.0%) | 0 (0.0%) |
| Construction & Extraction | 57 (100.0%) | 0 (0.0%) |
| Installation, Maintenance & Repair | 26 (100.0%) | 0 (0.0%) |
| Total (Category) | 83 (100.0%) | 0 (0.0%) |
| Total (Overall) | 1,085 (50.4%) | 1,066 (49.6%) |
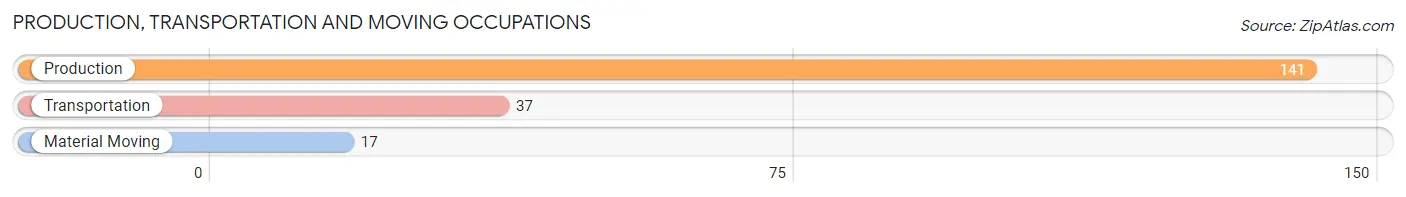
Production, Transportation and Moving Occupations
The most common Production, Transportation and Moving occupations in North Hudson are Production (141 | 6.6%), Transportation (37 | 1.7%), and Material Moving (17 | 0.8%).
Production, Transportation and Moving Occupations by Sex
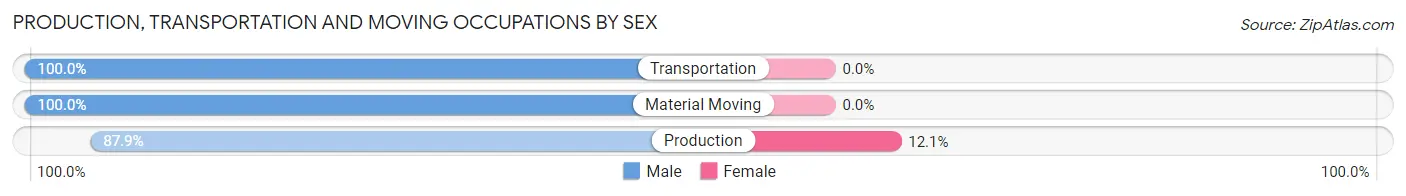
| Occupation | Male | Female |
| Production | 124 (87.9%) | 17 (12.1%) |
| Transportation | 37 (100.0%) | 0 (0.0%) |
| Material Moving | 17 (100.0%) | 0 (0.0%) |
| Total (Category) | 178 (91.3%) | 17 (8.7%) |
| Total (Overall) | 1,085 (50.4%) | 1,066 (49.6%) |
Employment Industries by Sex in North Hudson
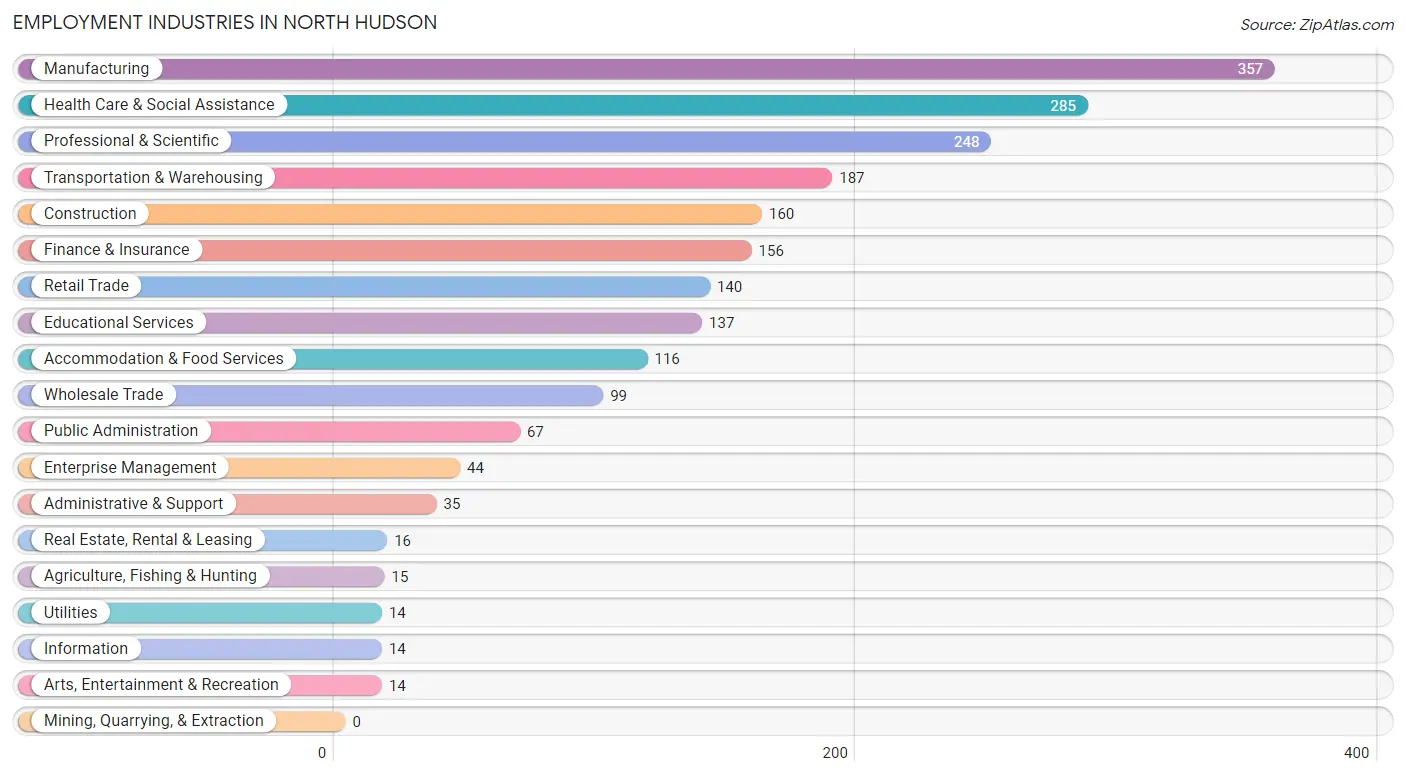
Employment Industries in North Hudson
The major employment industries in North Hudson include Manufacturing (357 | 16.6%), Health Care & Social Assistance (285 | 13.3%), Professional & Scientific (248 | 11.5%), Transportation & Warehousing (187 | 8.7%), and Construction (160 | 7.4%).
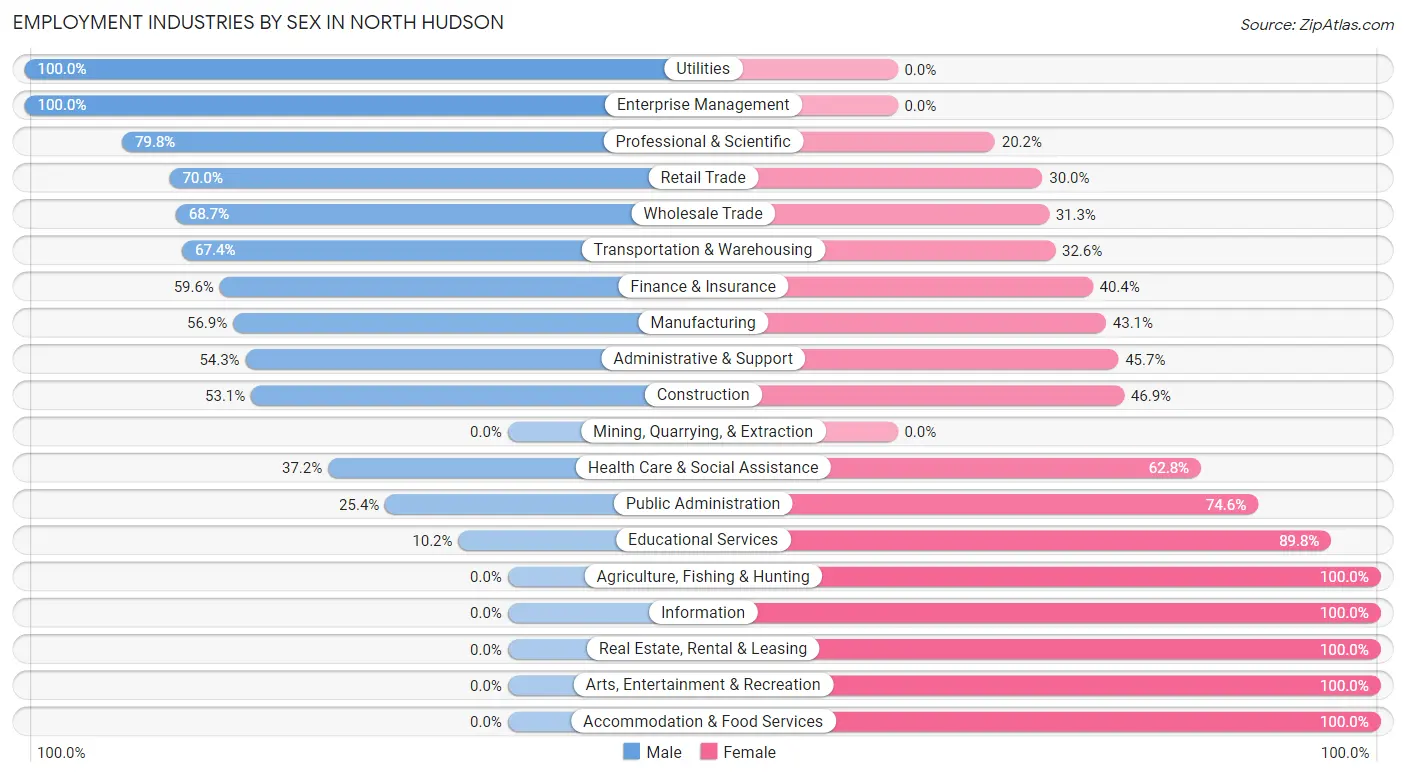
Employment Industries by Sex in North Hudson
The North Hudson industries that see more men than women are Utilities (100.0%), Enterprise Management (100.0%), and Professional & Scientific (79.8%), whereas the industries that tend to have a higher number of women are Agriculture, Fishing & Hunting (100.0%), Information (100.0%), and Real Estate, Rental & Leasing (100.0%).
| Industry | Male | Female |
| Agriculture, Fishing & Hunting | 0 (0.0%) | 15 (100.0%) |
| Mining, Quarrying, & Extraction | 0 (0.0%) | 0 (0.0%) |
| Construction | 85 (53.1%) | 75 (46.9%) |
| Manufacturing | 203 (56.9%) | 154 (43.1%) |
| Wholesale Trade | 68 (68.7%) | 31 (31.3%) |
| Retail Trade | 98 (70.0%) | 42 (30.0%) |
| Transportation & Warehousing | 126 (67.4%) | 61 (32.6%) |
| Utilities | 14 (100.0%) | 0 (0.0%) |
| Information | 0 (0.0%) | 14 (100.0%) |
| Finance & Insurance | 93 (59.6%) | 63 (40.4%) |
| Real Estate, Rental & Leasing | 0 (0.0%) | 16 (100.0%) |
| Professional & Scientific | 198 (79.8%) | 50 (20.2%) |
| Enterprise Management | 44 (100.0%) | 0 (0.0%) |
| Administrative & Support | 19 (54.3%) | 16 (45.7%) |
| Educational Services | 14 (10.2%) | 123 (89.8%) |
| Health Care & Social Assistance | 106 (37.2%) | 179 (62.8%) |
| Arts, Entertainment & Recreation | 0 (0.0%) | 14 (100.0%) |
| Accommodation & Food Services | 0 (0.0%) | 116 (100.0%) |
| Public Administration | 17 (25.4%) | 50 (74.6%) |
| Total | 1,085 (50.4%) | 1,066 (49.6%) |
Education in North Hudson
School Enrollment in North Hudson
The most common levels of schooling among the 658 students in North Hudson are high school (268 | 40.7%), elementary school (113 | 17.2%), and middle school (97 | 14.7%).
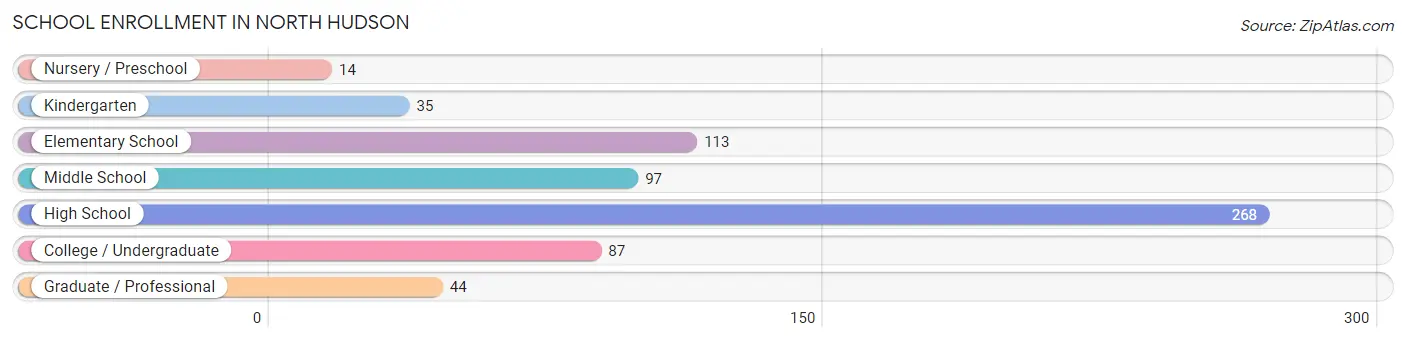
| School Level | # Students | % Students |
| Nursery / Preschool | 14 | 2.1% |
| Kindergarten | 35 | 5.3% |
| Elementary School | 113 | 17.2% |
| Middle School | 97 | 14.7% |
| High School | 268 | 40.7% |
| College / Undergraduate | 87 | 13.2% |
| Graduate / Professional | 44 | 6.7% |
| Total | 658 | 100.0% |
School Enrollment by Age by Funding Source in North Hudson
Out of a total of 658 students who are enrolled in schools in North Hudson, 104 (15.8%) attend a private institution, while the remaining 554 (84.2%) are enrolled in public schools. The age group of 3 to 4 year olds has the highest likelihood of being enrolled in private schools, with 14 (100.0% in the age bracket) enrolled. Conversely, the age group of 15 to 17 year olds has the lowest likelihood of being enrolled in a private school, with 237 (100.0% in the age bracket) attending a public institution.
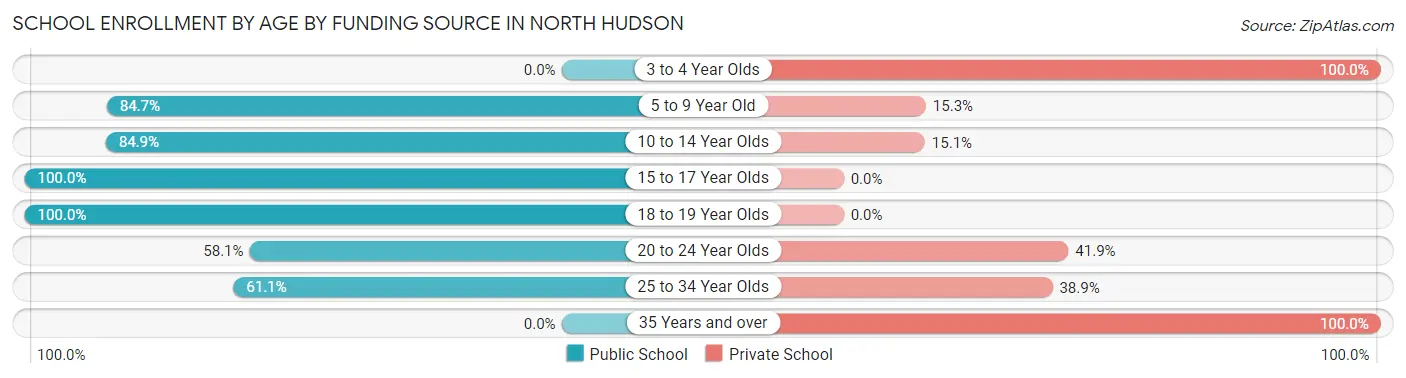
| Age Bracket | Public School | Private School |
| 3 to 4 Year Olds | 0 (0.0%) | 14 (100.0%) |
| 5 to 9 Year Old | 105 (84.7%) | 19 (15.3%) |
| 10 to 14 Year Olds | 129 (84.9%) | 23 (15.1%) |
| 15 to 17 Year Olds | 237 (100.0%) | 0 (0.0%) |
| 18 to 19 Year Olds | 36 (100.0%) | 0 (0.0%) |
| 20 to 24 Year Olds | 25 (58.1%) | 18 (41.9%) |
| 25 to 34 Year Olds | 22 (61.1%) | 14 (38.9%) |
| 35 Years and over | 0 (0.0%) | 16 (100.0%) |
| Total | 554 (84.2%) | 104 (15.8%) |
Educational Attainment by Field of Study in North Hudson
Business (291 | 19.8%), psychology (219 | 14.9%), education (197 | 13.4%), social sciences (165 | 11.2%), and bio, nature & agricultural (97 | 6.6%) are the most common fields of study among 1,471 individuals in North Hudson who have obtained a bachelor's degree or higher.
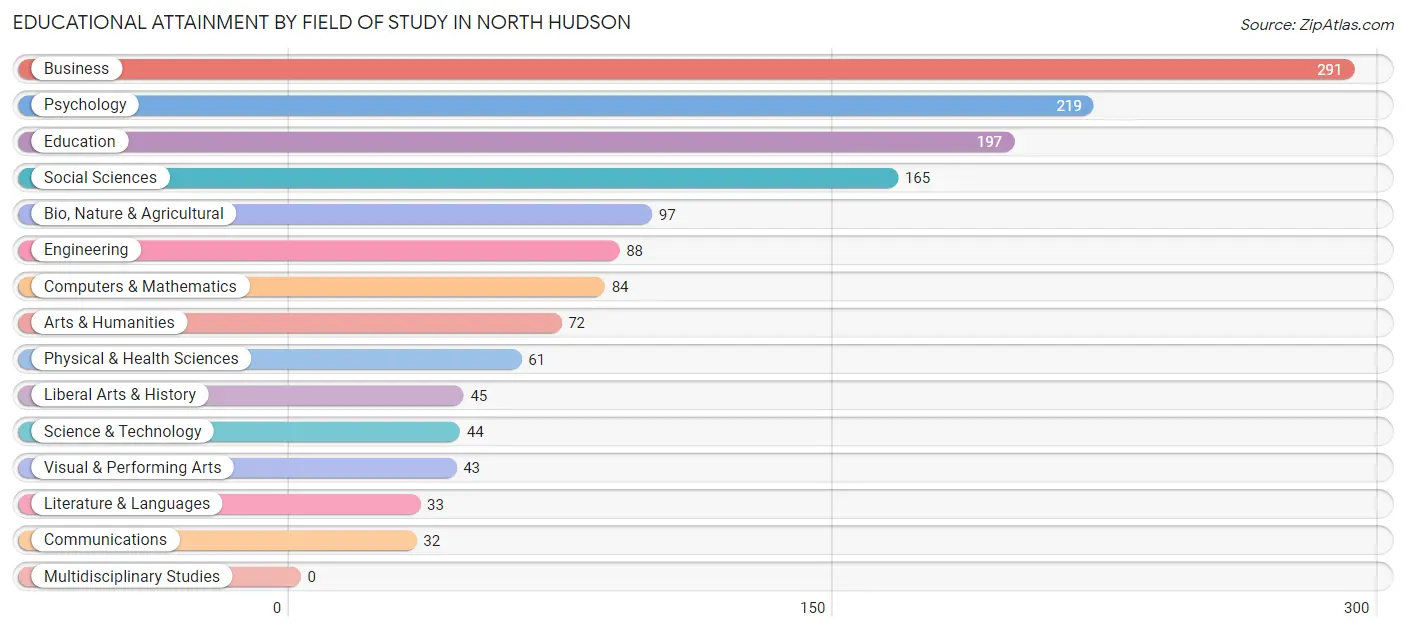
| Field of Study | # Graduates | % Graduates |
| Computers & Mathematics | 84 | 5.7% |
| Bio, Nature & Agricultural | 97 | 6.6% |
| Physical & Health Sciences | 61 | 4.2% |
| Psychology | 219 | 14.9% |
| Social Sciences | 165 | 11.2% |
| Engineering | 88 | 6.0% |
| Multidisciplinary Studies | 0 | 0.0% |
| Science & Technology | 44 | 3.0% |
| Business | 291 | 19.8% |
| Education | 197 | 13.4% |
| Literature & Languages | 33 | 2.2% |
| Liberal Arts & History | 45 | 3.1% |
| Visual & Performing Arts | 43 | 2.9% |
| Communications | 32 | 2.2% |
| Arts & Humanities | 72 | 4.9% |
| Total | 1,471 | 100.0% |
Transportation & Commute in North Hudson
Vehicle Availability by Sex in North Hudson
The most prevalent vehicle ownership categories in North Hudson are males with 2 vehicles (473, accounting for 43.6%) and females with 2 vehicles (408, making up 45.1%).
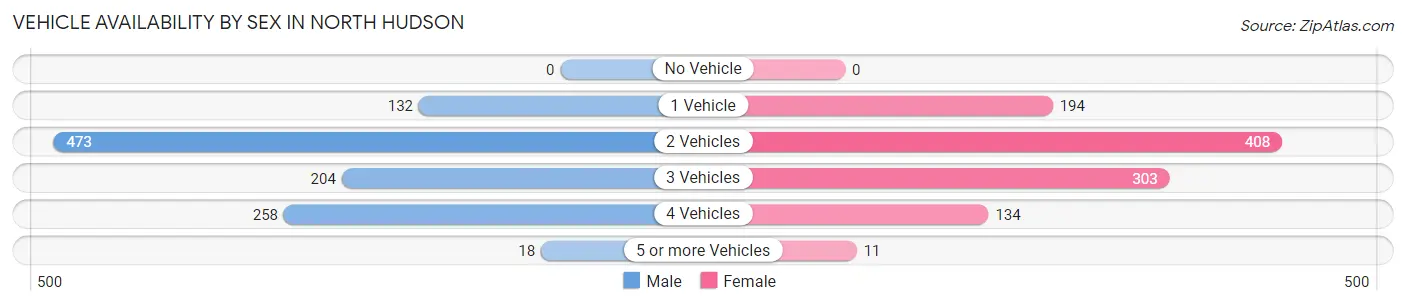
| Vehicles Available | Male | Female |
| No Vehicle | 0 (0.0%) | 0 (0.0%) |
| 1 Vehicle | 132 (12.2%) | 194 (18.5%) |
| 2 Vehicles | 473 (43.6%) | 408 (38.9%) |
| 3 Vehicles | 204 (18.8%) | 303 (28.9%) |
| 4 Vehicles | 258 (23.8%) | 134 (12.8%) |
| 5 or more Vehicles | 18 (1.7%) | 11 (1.1%) |
| Total | 1,085 (100.0%) | 1,050 (100.0%) |
Commute Time in North Hudson
The most frequently occuring commute durations in North Hudson are 10 to 14 minutes (280 commuters, 15.2%), 15 to 19 minutes (224 commuters, 12.2%), and 45 to 59 minutes (216 commuters, 11.7%).
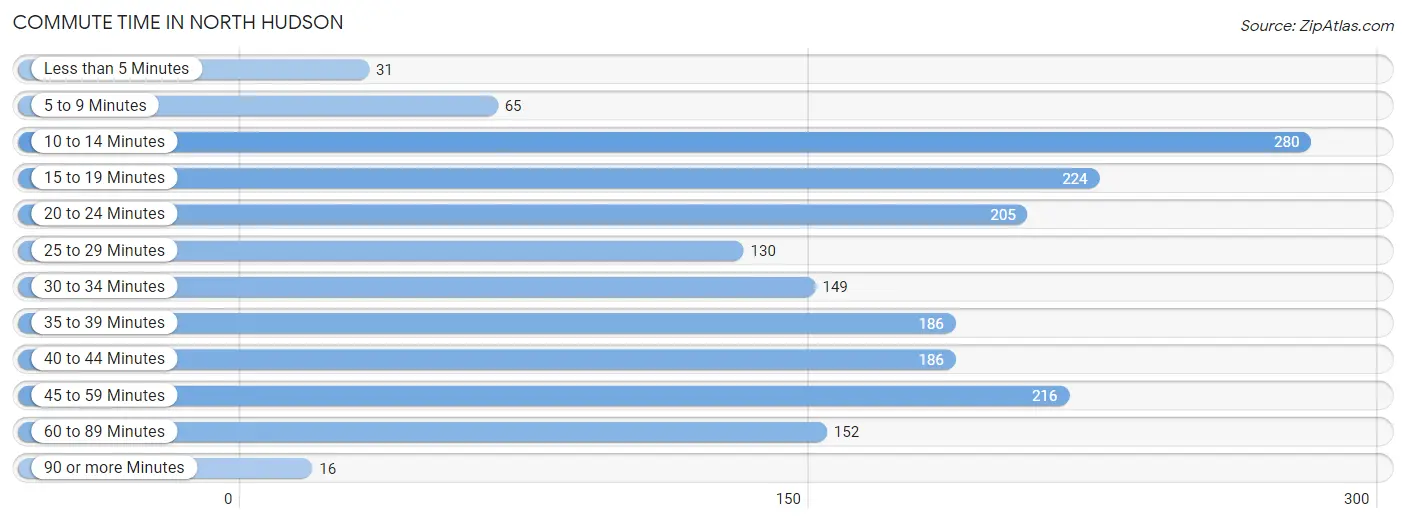
| Commute Time | # Commuters | % Commuters |
| Less than 5 Minutes | 31 | 1.7% |
| 5 to 9 Minutes | 65 | 3.5% |
| 10 to 14 Minutes | 280 | 15.2% |
| 15 to 19 Minutes | 224 | 12.2% |
| 20 to 24 Minutes | 205 | 11.1% |
| 25 to 29 Minutes | 130 | 7.1% |
| 30 to 34 Minutes | 149 | 8.1% |
| 35 to 39 Minutes | 186 | 10.1% |
| 40 to 44 Minutes | 186 | 10.1% |
| 45 to 59 Minutes | 216 | 11.7% |
| 60 to 89 Minutes | 152 | 8.3% |
| 90 or more Minutes | 16 | 0.9% |
Commute Time by Sex in North Hudson
The most common commute times in North Hudson are 15 to 19 minutes (151 commuters, 15.1%) for males and 45 to 59 minutes (177 commuters, 21.0%) for females.
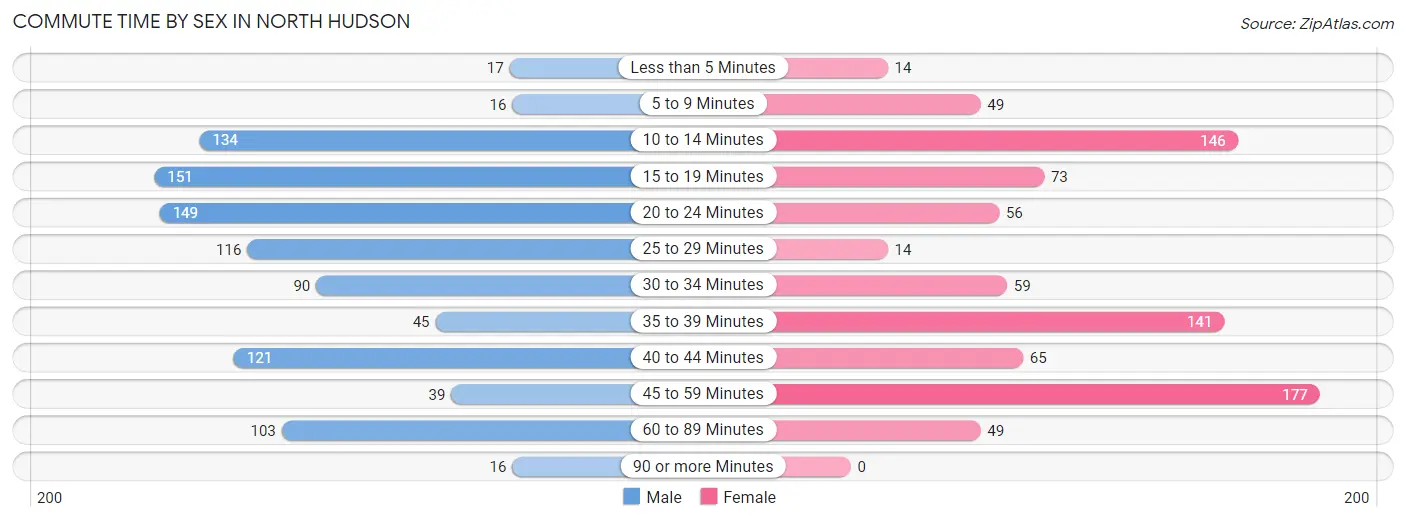
| Commute Time | Male | Female |
| Less than 5 Minutes | 17 (1.7%) | 14 (1.7%) |
| 5 to 9 Minutes | 16 (1.6%) | 49 (5.8%) |
| 10 to 14 Minutes | 134 (13.4%) | 146 (17.3%) |
| 15 to 19 Minutes | 151 (15.1%) | 73 (8.7%) |
| 20 to 24 Minutes | 149 (14.9%) | 56 (6.6%) |
| 25 to 29 Minutes | 116 (11.6%) | 14 (1.7%) |
| 30 to 34 Minutes | 90 (9.0%) | 59 (7.0%) |
| 35 to 39 Minutes | 45 (4.5%) | 141 (16.7%) |
| 40 to 44 Minutes | 121 (12.1%) | 65 (7.7%) |
| 45 to 59 Minutes | 39 (3.9%) | 177 (21.0%) |
| 60 to 89 Minutes | 103 (10.3%) | 49 (5.8%) |
| 90 or more Minutes | 16 (1.6%) | 0 (0.0%) |
Time of Departure to Work by Sex in North Hudson
The most frequent times of departure to work in North Hudson are 6:00 AM to 6:29 AM (186, 18.7%) for males and 7:00 AM to 7:29 AM (250, 29.7%) for females.
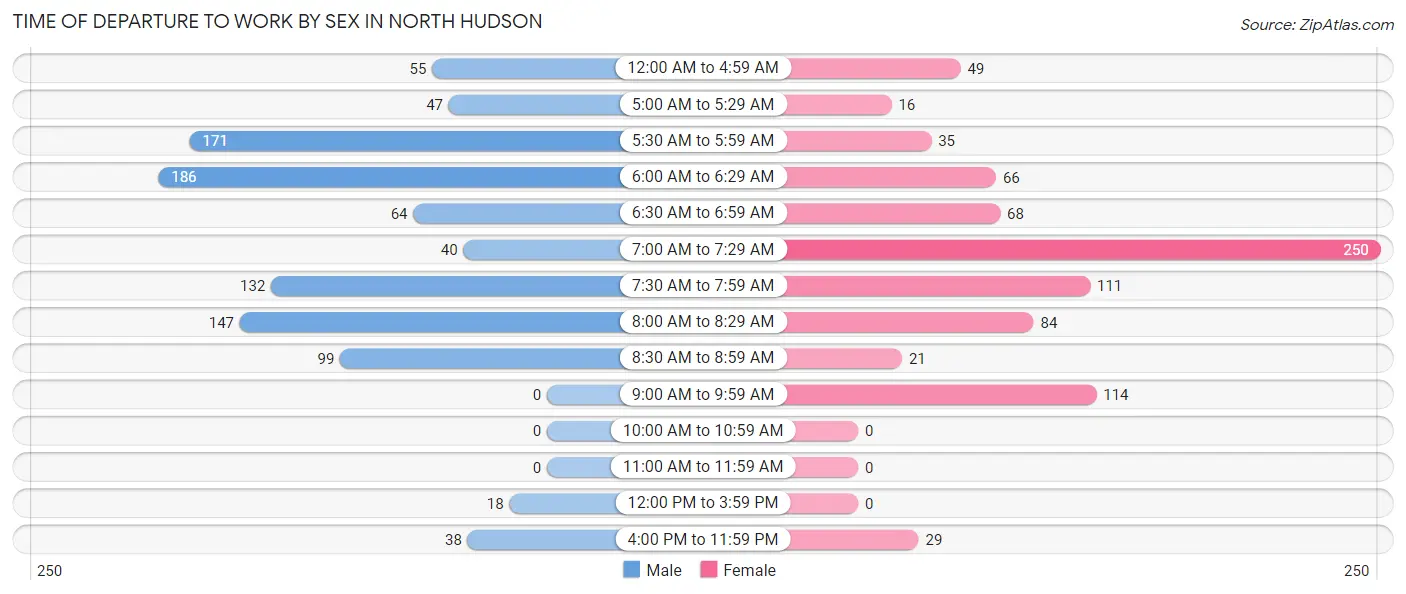
| Time of Departure | Male | Female |
| 12:00 AM to 4:59 AM | 55 (5.5%) | 49 (5.8%) |
| 5:00 AM to 5:29 AM | 47 (4.7%) | 16 (1.9%) |
| 5:30 AM to 5:59 AM | 171 (17.2%) | 35 (4.2%) |
| 6:00 AM to 6:29 AM | 186 (18.7%) | 66 (7.8%) |
| 6:30 AM to 6:59 AM | 64 (6.4%) | 68 (8.1%) |
| 7:00 AM to 7:29 AM | 40 (4.0%) | 250 (29.7%) |
| 7:30 AM to 7:59 AM | 132 (13.2%) | 111 (13.2%) |
| 8:00 AM to 8:29 AM | 147 (14.7%) | 84 (10.0%) |
| 8:30 AM to 8:59 AM | 99 (9.9%) | 21 (2.5%) |
| 9:00 AM to 9:59 AM | 0 (0.0%) | 114 (13.5%) |
| 10:00 AM to 10:59 AM | 0 (0.0%) | 0 (0.0%) |
| 11:00 AM to 11:59 AM | 0 (0.0%) | 0 (0.0%) |
| 12:00 PM to 3:59 PM | 18 (1.8%) | 0 (0.0%) |
| 4:00 PM to 11:59 PM | 38 (3.8%) | 29 (3.4%) |
| Total | 997 (100.0%) | 843 (100.0%) |
Housing Occupancy in North Hudson
Occupancy by Ownership in North Hudson
Of the total 1,440 dwellings in North Hudson, owner-occupied units account for 1,282 (89.0%), while renter-occupied units make up 158 (11.0%).
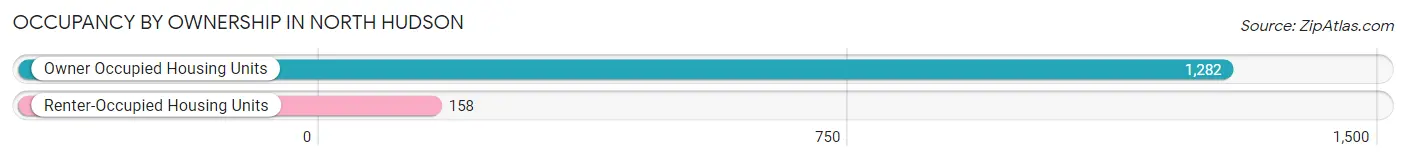
| Occupancy | # Housing Units | % Housing Units |
| Owner Occupied Housing Units | 1,282 | 89.0% |
| Renter-Occupied Housing Units | 158 | 11.0% |
| Total Occupied Housing Units | 1,440 | 100.0% |
Occupancy by Household Size in North Hudson
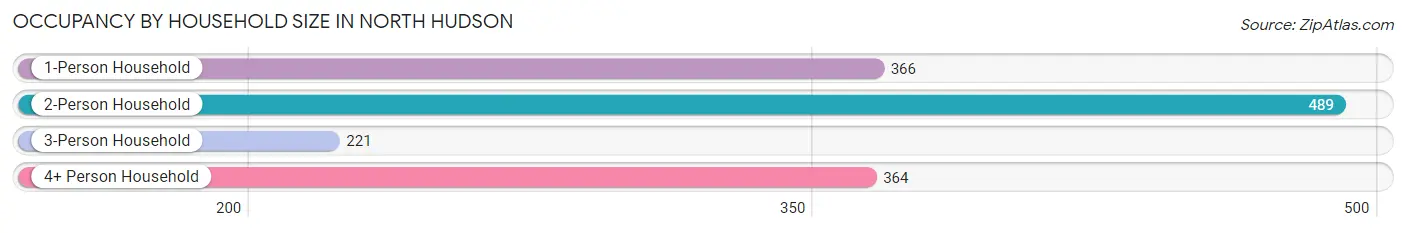
| Household Size | # Housing Units | % Housing Units |
| 1-Person Household | 366 | 25.4% |
| 2-Person Household | 489 | 34.0% |
| 3-Person Household | 221 | 15.3% |
| 4+ Person Household | 364 | 25.3% |
| Total Housing Units | 1,440 | 100.0% |
Occupancy by Ownership by Household Size in North Hudson
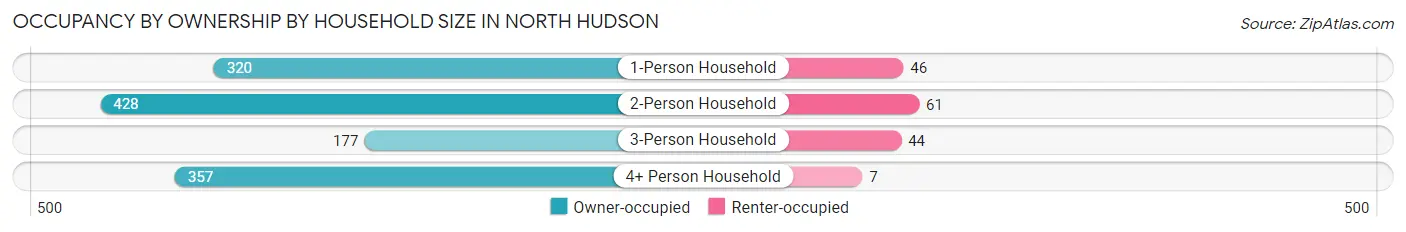
| Household Size | Owner-occupied | Renter-occupied |
| 1-Person Household | 320 (87.4%) | 46 (12.6%) |
| 2-Person Household | 428 (87.5%) | 61 (12.5%) |
| 3-Person Household | 177 (80.1%) | 44 (19.9%) |
| 4+ Person Household | 357 (98.1%) | 7 (1.9%) |
| Total Housing Units | 1,282 (89.0%) | 158 (11.0%) |
Occupancy by Educational Attainment in North Hudson
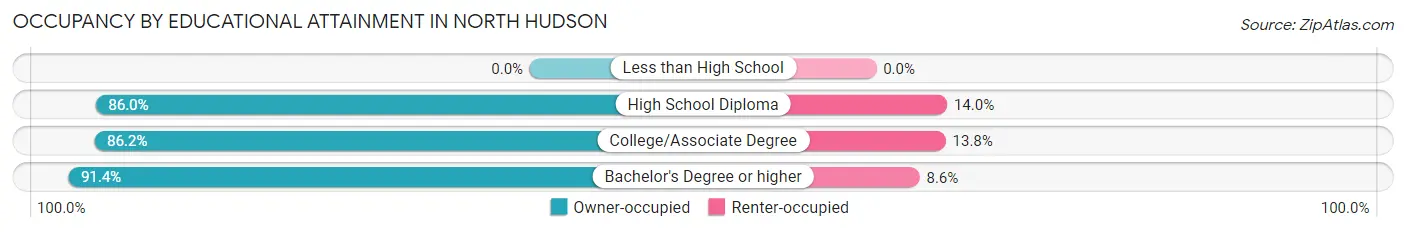
| Household Size | Owner-occupied | Renter-occupied |
| Less than High School | 0 (0.0%) | 0 (0.0%) |
| High School Diploma | 202 (86.0%) | 33 (14.0%) |
| College/Associate Degree | 357 (86.2%) | 57 (13.8%) |
| Bachelor's Degree or higher | 723 (91.4%) | 68 (8.6%) |
Occupancy by Age of Householder in North Hudson
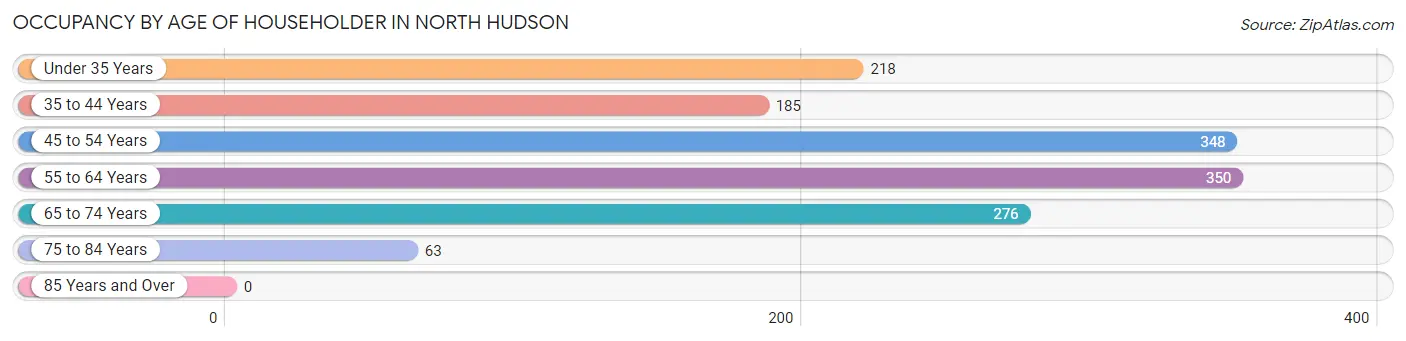
| Age Bracket | # Households | % Households |
| Under 35 Years | 218 | 15.1% |
| 35 to 44 Years | 185 | 12.9% |
| 45 to 54 Years | 348 | 24.2% |
| 55 to 64 Years | 350 | 24.3% |
| 65 to 74 Years | 276 | 19.2% |
| 75 to 84 Years | 63 | 4.4% |
| 85 Years and Over | 0 | 0.0% |
| Total | 1,440 | 100.0% |
Housing Finances in North Hudson
Median Income by Occupancy in North Hudson
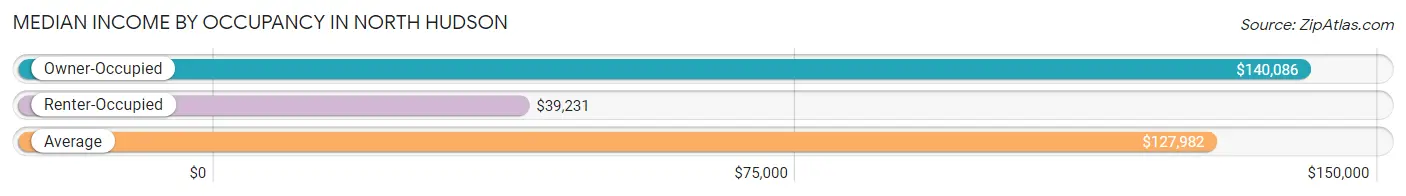
| Occupancy Type | # Households | Median Income |
| Owner-Occupied | 1,282 (89.0%) | $140,086 |
| Renter-Occupied | 158 (11.0%) | $39,231 |
| Average | 1,440 (100.0%) | $127,982 |
Occupancy by Householder Income Bracket in North Hudson
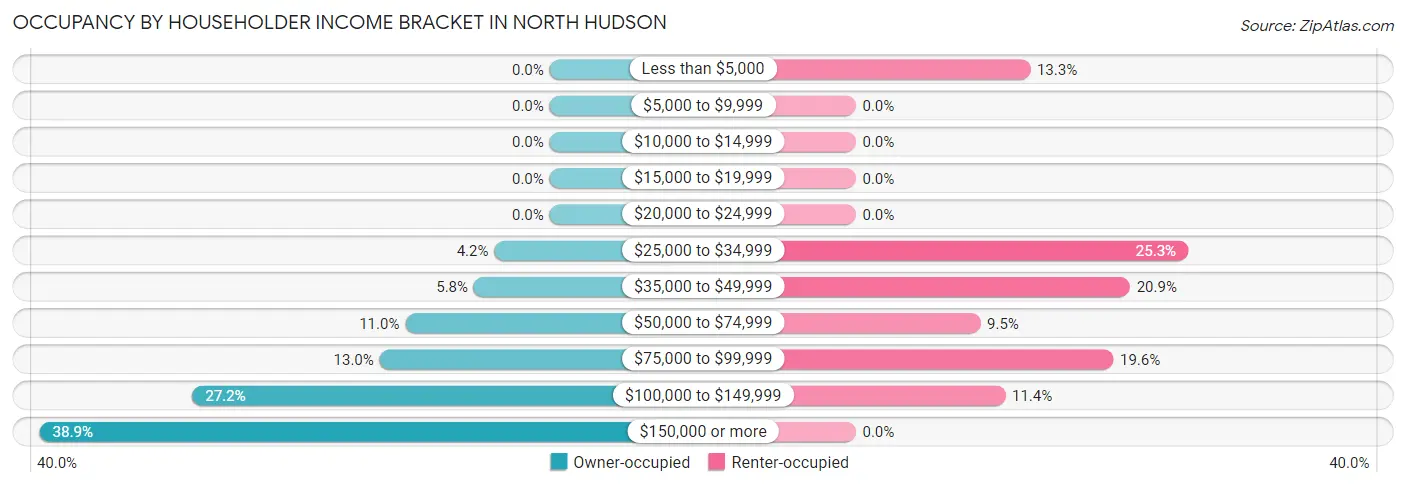
| Income Bracket | Owner-occupied | Renter-occupied |
| Less than $5,000 | 0 (0.0%) | 21 (13.3%) |
| $5,000 to $9,999 | 0 (0.0%) | 0 (0.0%) |
| $10,000 to $14,999 | 0 (0.0%) | 0 (0.0%) |
| $15,000 to $19,999 | 0 (0.0%) | 0 (0.0%) |
| $20,000 to $24,999 | 0 (0.0%) | 0 (0.0%) |
| $25,000 to $34,999 | 54 (4.2%) | 40 (25.3%) |
| $35,000 to $49,999 | 74 (5.8%) | 33 (20.9%) |
| $50,000 to $74,999 | 141 (11.0%) | 15 (9.5%) |
| $75,000 to $99,999 | 166 (13.0%) | 31 (19.6%) |
| $100,000 to $149,999 | 349 (27.2%) | 18 (11.4%) |
| $150,000 or more | 498 (38.9%) | 0 (0.0%) |
| Total | 1,282 (100.0%) | 158 (100.0%) |
Monthly Housing Cost Tiers in North Hudson
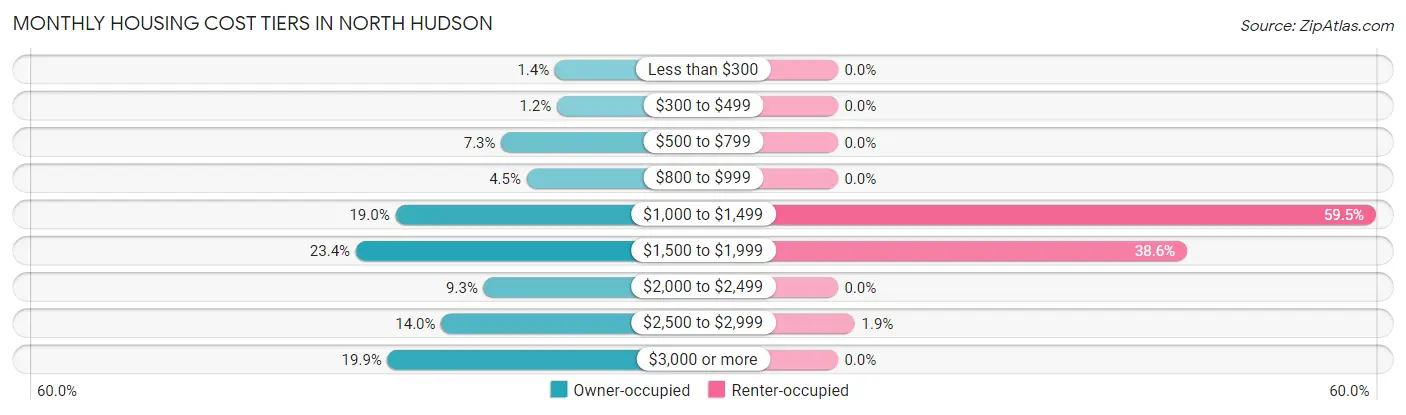
| Monthly Cost | Owner-occupied | Renter-occupied |
| Less than $300 | 18 (1.4%) | 0 (0.0%) |
| $300 to $499 | 15 (1.2%) | 0 (0.0%) |
| $500 to $799 | 94 (7.3%) | 0 (0.0%) |
| $800 to $999 | 58 (4.5%) | 0 (0.0%) |
| $1,000 to $1,499 | 244 (19.0%) | 94 (59.5%) |
| $1,500 to $1,999 | 300 (23.4%) | 61 (38.6%) |
| $2,000 to $2,499 | 119 (9.3%) | 0 (0.0%) |
| $2,500 to $2,999 | 179 (14.0%) | 3 (1.9%) |
| $3,000 or more | 255 (19.9%) | 0 (0.0%) |
| Total | 1,282 (100.0%) | 158 (100.0%) |
Physical Housing Characteristics in North Hudson
Housing Structures in North Hudson
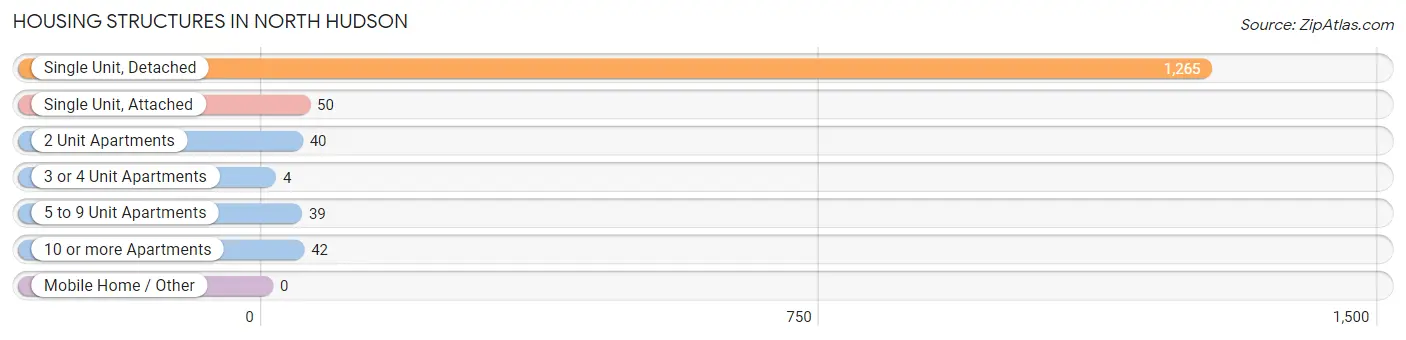
| Structure Type | # Housing Units | % Housing Units |
| Single Unit, Detached | 1,265 | 87.8% |
| Single Unit, Attached | 50 | 3.5% |
| 2 Unit Apartments | 40 | 2.8% |
| 3 or 4 Unit Apartments | 4 | 0.3% |
| 5 to 9 Unit Apartments | 39 | 2.7% |
| 10 or more Apartments | 42 | 2.9% |
| Mobile Home / Other | 0 | 0.0% |
| Total | 1,440 | 100.0% |
Housing Structures by Occupancy in North Hudson
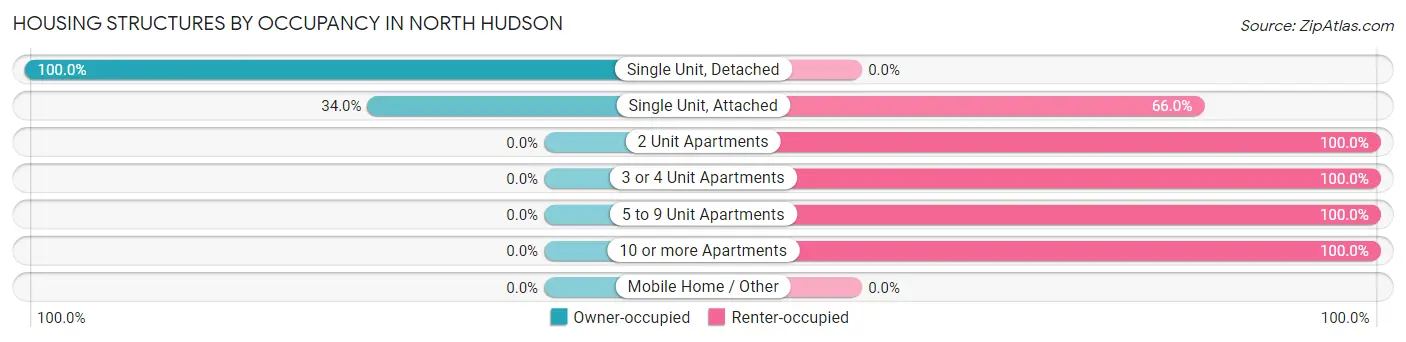
| Structure Type | Owner-occupied | Renter-occupied |
| Single Unit, Detached | 1,265 (100.0%) | 0 (0.0%) |
| Single Unit, Attached | 17 (34.0%) | 33 (66.0%) |
| 2 Unit Apartments | 0 (0.0%) | 40 (100.0%) |
| 3 or 4 Unit Apartments | 0 (0.0%) | 4 (100.0%) |
| 5 to 9 Unit Apartments | 0 (0.0%) | 39 (100.0%) |
| 10 or more Apartments | 0 (0.0%) | 42 (100.0%) |
| Mobile Home / Other | 0 (0.0%) | 0 (0.0%) |
| Total | 1,282 (89.0%) | 158 (11.0%) |
Housing Structures by Number of Rooms in North Hudson
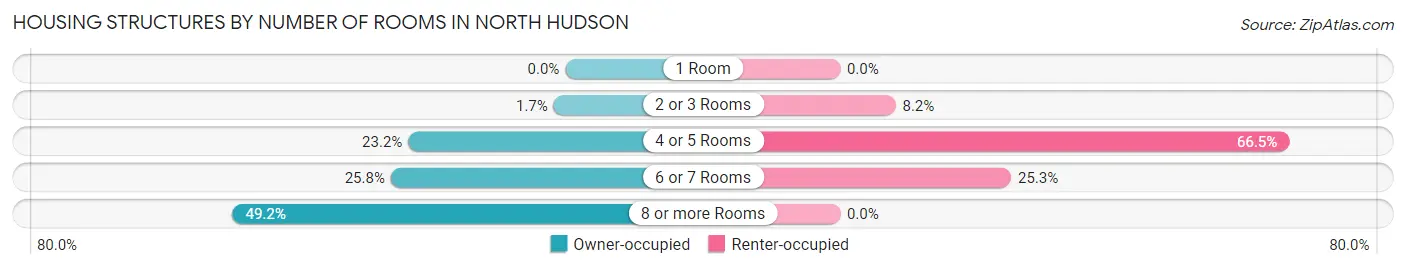
| Number of Rooms | Owner-occupied | Renter-occupied |
| 1 Room | 0 (0.0%) | 0 (0.0%) |
| 2 or 3 Rooms | 22 (1.7%) | 13 (8.2%) |
| 4 or 5 Rooms | 298 (23.2%) | 105 (66.5%) |
| 6 or 7 Rooms | 331 (25.8%) | 40 (25.3%) |
| 8 or more Rooms | 631 (49.2%) | 0 (0.0%) |
| Total | 1,282 (100.0%) | 158 (100.0%) |
Housing Structure by Heating Type in North Hudson
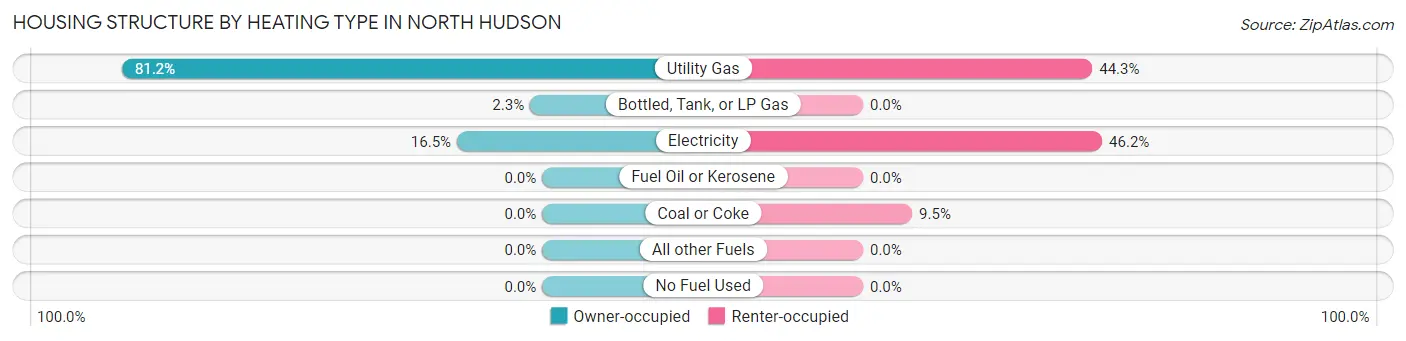
| Heating Type | Owner-occupied | Renter-occupied |
| Utility Gas | 1,041 (81.2%) | 70 (44.3%) |
| Bottled, Tank, or LP Gas | 30 (2.3%) | 0 (0.0%) |
| Electricity | 211 (16.5%) | 73 (46.2%) |
| Fuel Oil or Kerosene | 0 (0.0%) | 0 (0.0%) |
| Coal or Coke | 0 (0.0%) | 15 (9.5%) |
| All other Fuels | 0 (0.0%) | 0 (0.0%) |
| No Fuel Used | 0 (0.0%) | 0 (0.0%) |
| Total | 1,282 (100.0%) | 158 (100.0%) |
Household Vehicle Usage in North Hudson
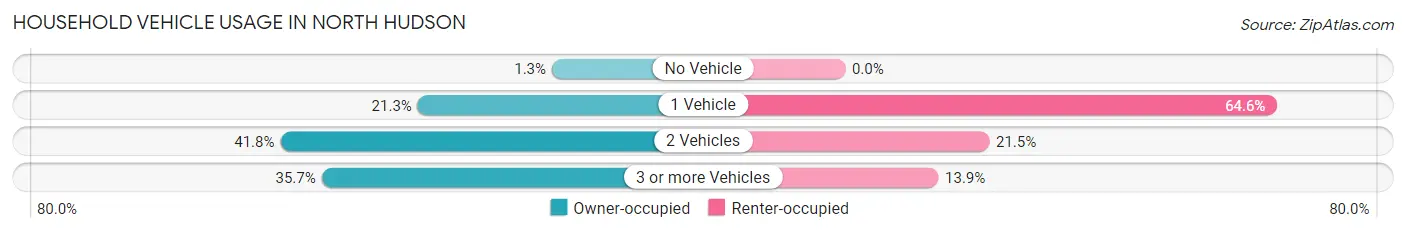
| Vehicles per Household | Owner-occupied | Renter-occupied |
| No Vehicle | 16 (1.3%) | 0 (0.0%) |
| 1 Vehicle | 273 (21.3%) | 102 (64.6%) |
| 2 Vehicles | 536 (41.8%) | 34 (21.5%) |
| 3 or more Vehicles | 457 (35.6%) | 22 (13.9%) |
| Total | 1,282 (100.0%) | 158 (100.0%) |
Real Estate & Mortgages in North Hudson
Real Estate and Mortgage Overview in North Hudson
| Characteristic | Without Mortgage | With Mortgage |
| Housing Units | 198 | 1,084 |
| Median Property Value | $356,300 | $351,700 |
| Median Household Income | - | - |
| Monthly Housing Costs | $655 | $255 |
| Real Estate Taxes | $4,490 | $0 |
Property Value by Mortgage Status in North Hudson
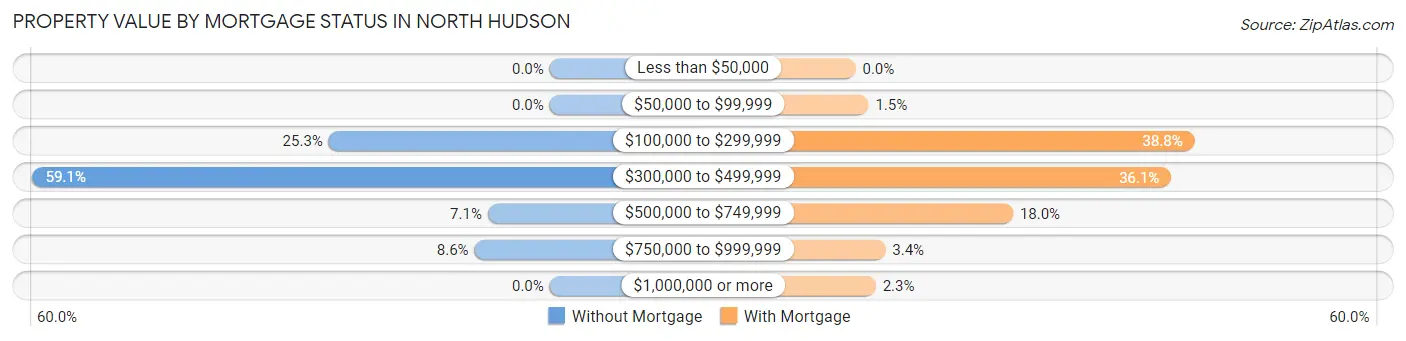
| Property Value | Without Mortgage | With Mortgage |
| Less than $50,000 | 0 (0.0%) | 0 (0.0%) |
| $50,000 to $99,999 | 0 (0.0%) | 16 (1.5%) |
| $100,000 to $299,999 | 50 (25.3%) | 420 (38.8%) |
| $300,000 to $499,999 | 117 (59.1%) | 391 (36.1%) |
| $500,000 to $749,999 | 14 (7.1%) | 195 (18.0%) |
| $750,000 to $999,999 | 17 (8.6%) | 37 (3.4%) |
| $1,000,000 or more | 0 (0.0%) | 25 (2.3%) |
| Total | 198 (100.0%) | 1,084 (100.0%) |
Household Income by Mortgage Status in North Hudson
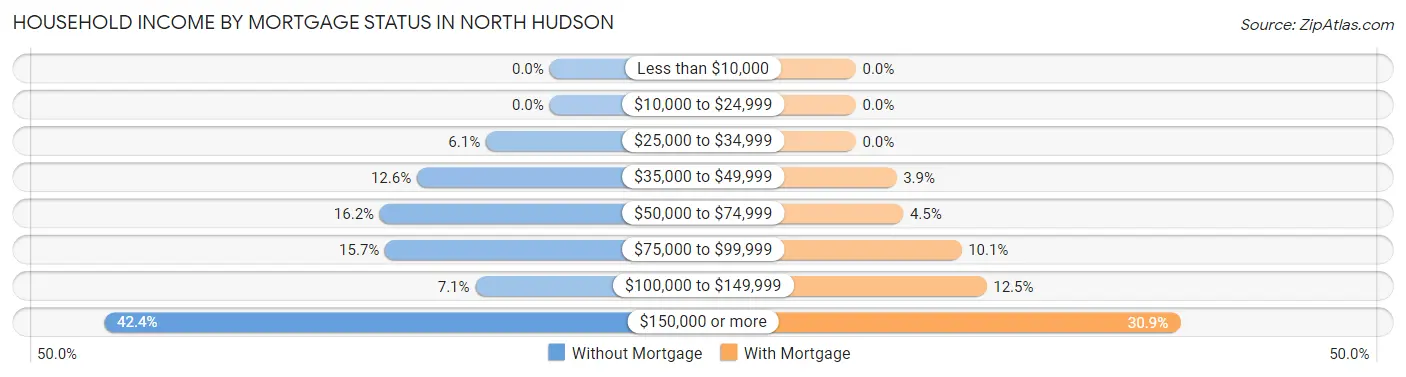
| Household Income | Without Mortgage | With Mortgage |
| Less than $10,000 | 0 (0.0%) | 0 (0.0%) |
| $10,000 to $24,999 | 0 (0.0%) | 0 (0.0%) |
| $25,000 to $34,999 | 12 (6.1%) | 0 (0.0%) |
| $35,000 to $49,999 | 25 (12.6%) | 42 (3.9%) |
| $50,000 to $74,999 | 32 (16.2%) | 49 (4.5%) |
| $75,000 to $99,999 | 31 (15.7%) | 109 (10.1%) |
| $100,000 to $149,999 | 14 (7.1%) | 135 (12.4%) |
| $150,000 or more | 84 (42.4%) | 335 (30.9%) |
| Total | 198 (100.0%) | 1,084 (100.0%) |
Property Value to Household Income Ratio in North Hudson
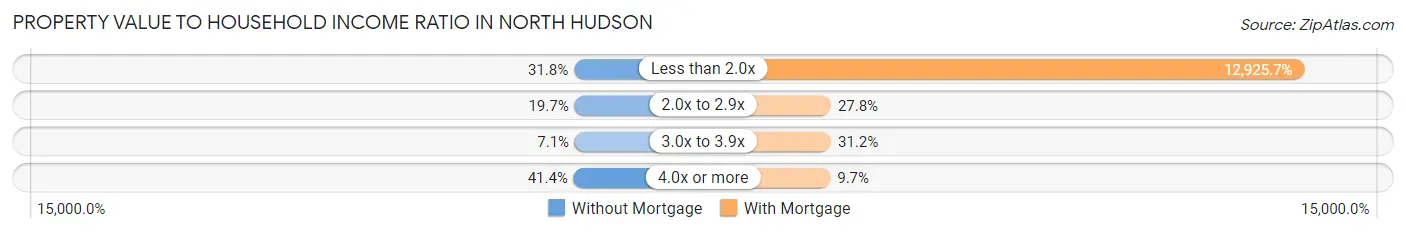
| Value-to-Income Ratio | Without Mortgage | With Mortgage |
| Less than 2.0x | 63 (31.8%) | 140,115 (12,925.7%) |
| 2.0x to 2.9x | 39 (19.7%) | 301 (27.8%) |
| 3.0x to 3.9x | 14 (7.1%) | 338 (31.2%) |
| 4.0x or more | 82 (41.4%) | 105 (9.7%) |
| Total | 198 (100.0%) | 1,084 (100.0%) |
Real Estate Taxes by Mortgage Status in North Hudson
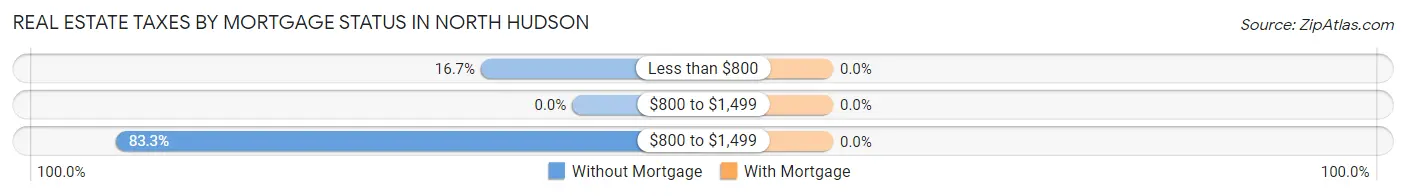
| Property Taxes | Without Mortgage | With Mortgage |
| Less than $800 | 33 (16.7%) | 0 (0.0%) |
| $800 to $1,499 | 0 (0.0%) | 0 (0.0%) |
| $800 to $1,499 | 165 (83.3%) | 0 (0.0%) |
| Total | 198 (100.0%) | 1,084 (100.0%) |
Health & Disability in North Hudson
Health Insurance Coverage by Age in North Hudson
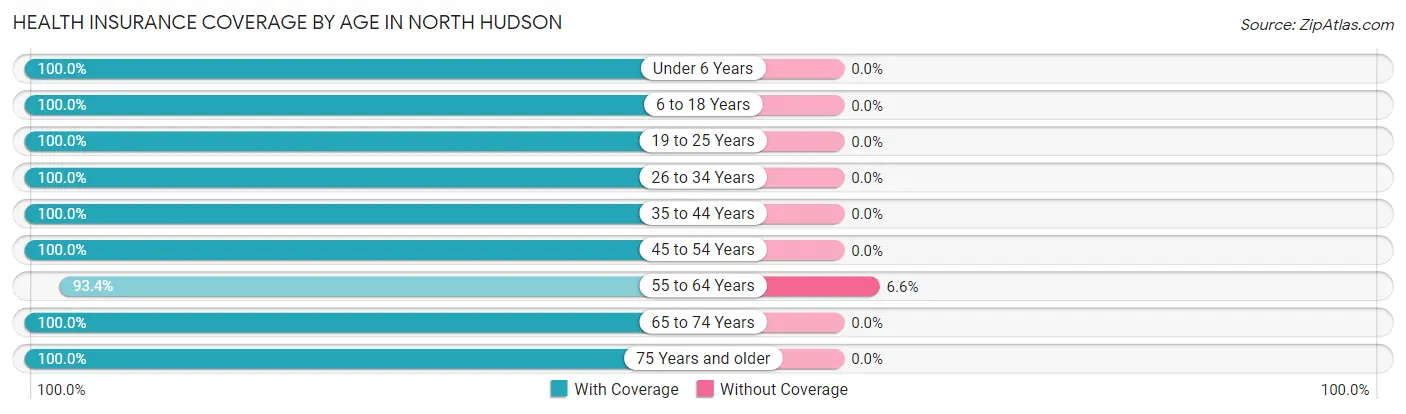
| Age Bracket | With Coverage | Without Coverage |
| Under 6 Years | 359 (100.0%) | 0 (0.0%) |
| 6 to 18 Years | 551 (100.0%) | 0 (0.0%) |
| 19 to 25 Years | 213 (100.0%) | 0 (0.0%) |
| 26 to 34 Years | 488 (100.0%) | 0 (0.0%) |
| 35 to 44 Years | 334 (100.0%) | 0 (0.0%) |
| 45 to 54 Years | 528 (100.0%) | 0 (0.0%) |
| 55 to 64 Years | 694 (93.4%) | 49 (6.6%) |
| 65 to 74 Years | 417 (100.0%) | 0 (0.0%) |
| 75 Years and older | 204 (100.0%) | 0 (0.0%) |
| Total | 3,788 (98.7%) | 49 (1.3%) |
Health Insurance Coverage by Citizenship Status in North Hudson
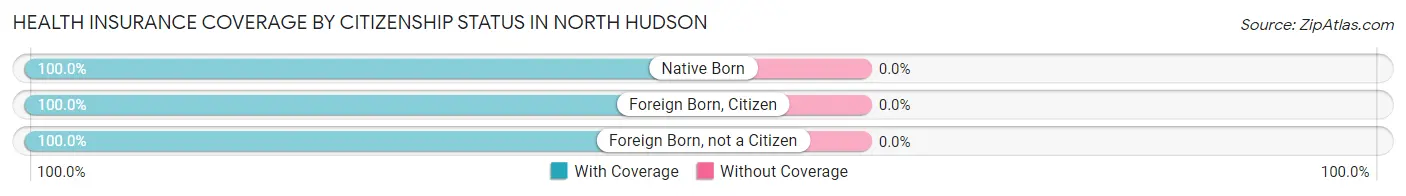
| Citizenship Status | With Coverage | Without Coverage |
| Native Born | 359 (100.0%) | 0 (0.0%) |
| Foreign Born, Citizen | 551 (100.0%) | 0 (0.0%) |
| Foreign Born, not a Citizen | 213 (100.0%) | 0 (0.0%) |
Health Insurance Coverage by Household Income in North Hudson
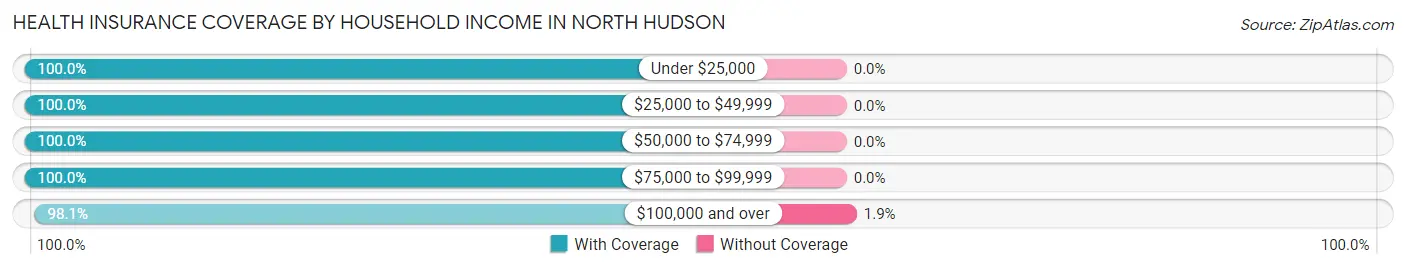
| Household Income | With Coverage | Without Coverage |
| Under $25,000 | 67 (100.0%) | 0 (0.0%) |
| $25,000 to $49,999 | 404 (100.0%) | 0 (0.0%) |
| $50,000 to $74,999 | 363 (100.0%) | 0 (0.0%) |
| $75,000 to $99,999 | 404 (100.0%) | 0 (0.0%) |
| $100,000 and over | 2,550 (98.1%) | 49 (1.9%) |
Public vs Private Health Insurance Coverage by Age in North Hudson
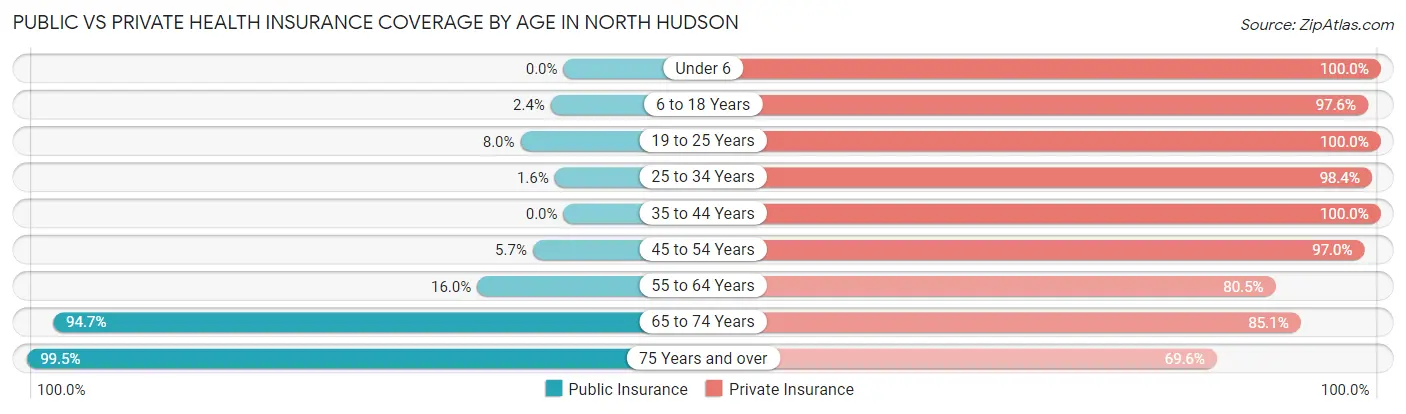
| Age Bracket | Public Insurance | Private Insurance |
| Under 6 | 0 (0.0%) | 359 (100.0%) |
| 6 to 18 Years | 13 (2.4%) | 538 (97.6%) |
| 19 to 25 Years | 17 (8.0%) | 213 (100.0%) |
| 25 to 34 Years | 8 (1.6%) | 480 (98.4%) |
| 35 to 44 Years | 0 (0.0%) | 334 (100.0%) |
| 45 to 54 Years | 30 (5.7%) | 512 (97.0%) |
| 55 to 64 Years | 119 (16.0%) | 598 (80.5%) |
| 65 to 74 Years | 395 (94.7%) | 355 (85.1%) |
| 75 Years and over | 203 (99.5%) | 142 (69.6%) |
| Total | 785 (20.5%) | 3,531 (92.0%) |
Disability Status by Sex by Age in North Hudson
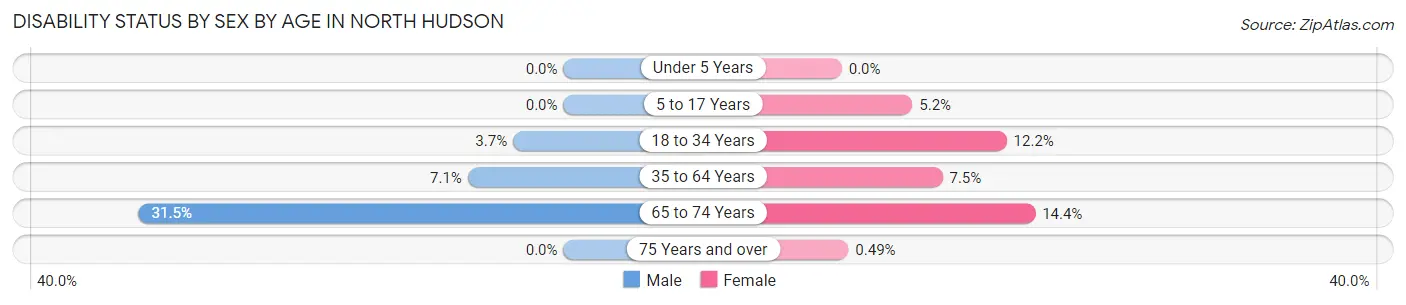
| Age Bracket | Male | Female |
| Under 5 Years | 0 (0.0%) | 0 (0.0%) |
| 5 to 17 Years | 0 (0.0%) | 12 (5.2%) |
| 18 to 34 Years | 14 (3.7%) | 47 (12.2%) |
| 35 to 64 Years | 57 (7.1%) | 60 (7.5%) |
| 65 to 74 Years | 70 (31.5%) | 28 (14.4%) |
| 75 Years and over | 0 (0.0%) | 1 (0.5%) |
Disability Class by Sex by Age in North Hudson
Disability Class: Hearing Difficulty
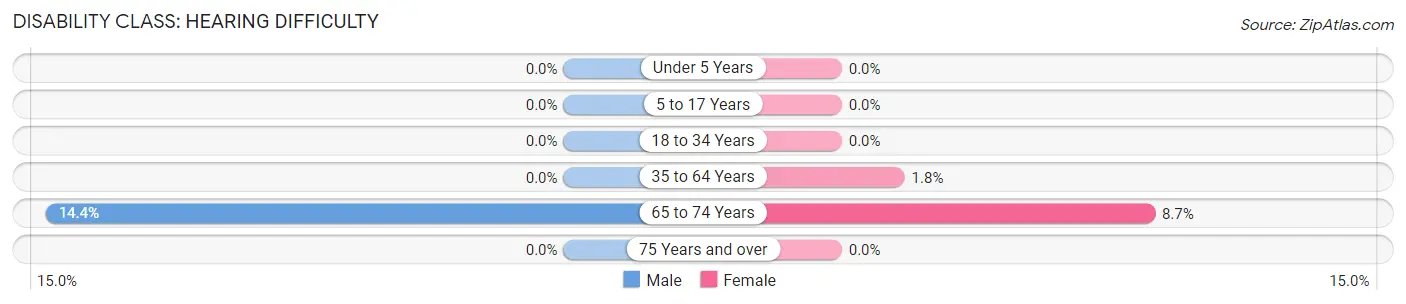
| Age Bracket | Male | Female |
| Under 5 Years | 0 (0.0%) | 0 (0.0%) |
| 5 to 17 Years | 0 (0.0%) | 0 (0.0%) |
| 18 to 34 Years | 0 (0.0%) | 0 (0.0%) |
| 35 to 64 Years | 0 (0.0%) | 14 (1.8%) |
| 65 to 74 Years | 32 (14.4%) | 17 (8.7%) |
| 75 Years and over | 0 (0.0%) | 0 (0.0%) |
Disability Class: Vision Difficulty
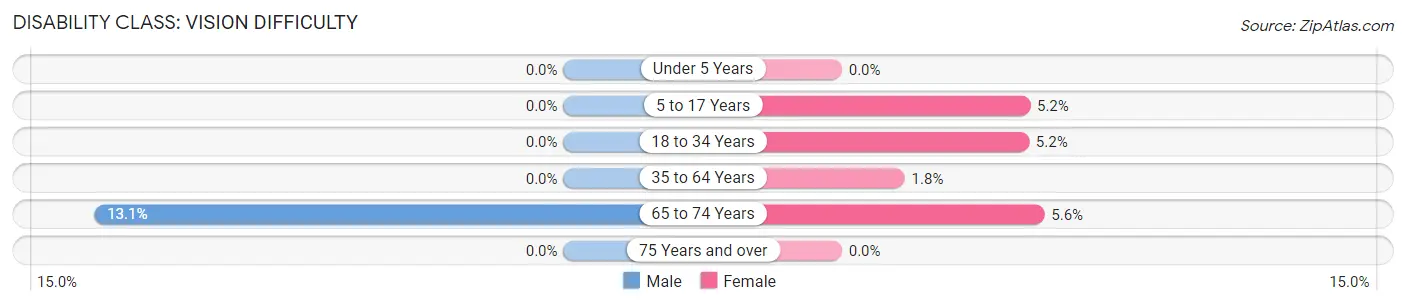
| Age Bracket | Male | Female |
| Under 5 Years | 0 (0.0%) | 0 (0.0%) |
| 5 to 17 Years | 0 (0.0%) | 12 (5.2%) |
| 18 to 34 Years | 0 (0.0%) | 20 (5.2%) |
| 35 to 64 Years | 0 (0.0%) | 14 (1.8%) |
| 65 to 74 Years | 29 (13.1%) | 11 (5.6%) |
| 75 Years and over | 0 (0.0%) | 0 (0.0%) |
Disability Class: Cognitive Difficulty
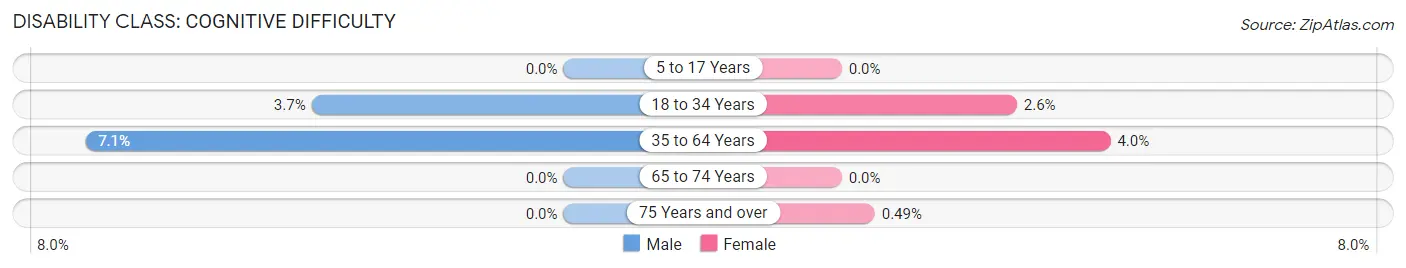
| Age Bracket | Male | Female |
| 5 to 17 Years | 0 (0.0%) | 0 (0.0%) |
| 18 to 34 Years | 14 (3.7%) | 10 (2.6%) |
| 35 to 64 Years | 57 (7.1%) | 32 (4.0%) |
| 65 to 74 Years | 0 (0.0%) | 0 (0.0%) |
| 75 Years and over | 0 (0.0%) | 1 (0.5%) |
Disability Class: Ambulatory Difficulty
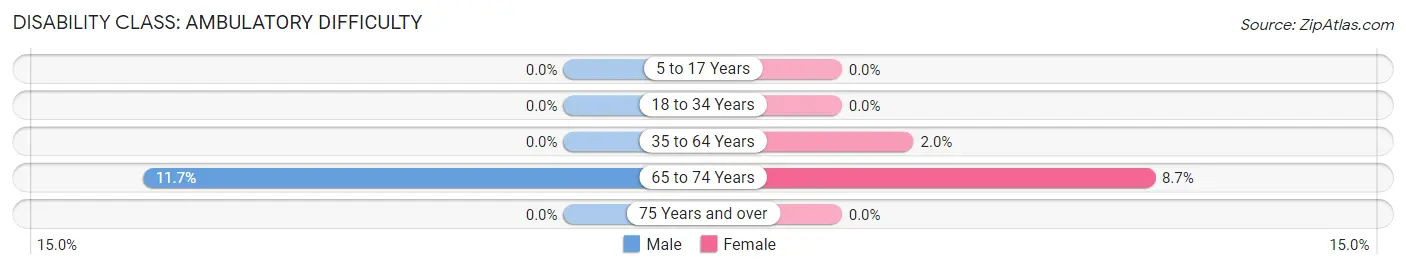
| Age Bracket | Male | Female |
| 5 to 17 Years | 0 (0.0%) | 0 (0.0%) |
| 18 to 34 Years | 0 (0.0%) | 0 (0.0%) |
| 35 to 64 Years | 0 (0.0%) | 16 (2.0%) |
| 65 to 74 Years | 26 (11.7%) | 17 (8.7%) |
| 75 Years and over | 0 (0.0%) | 0 (0.0%) |
Disability Class: Self-Care Difficulty
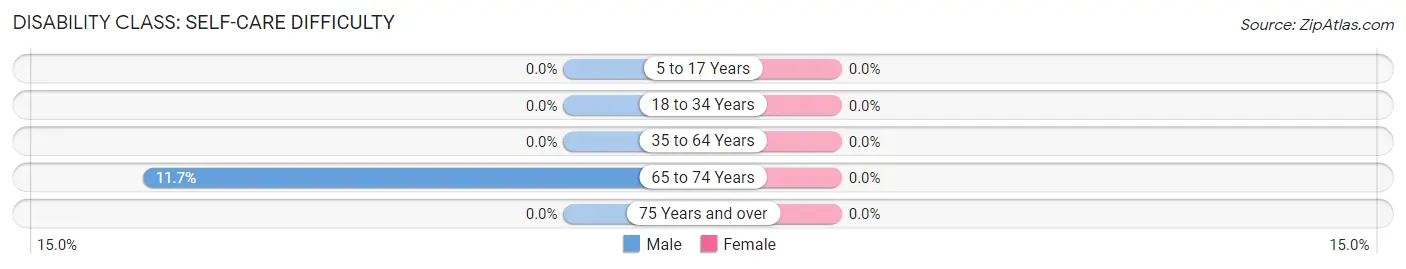
| Age Bracket | Male | Female |
| 5 to 17 Years | 0 (0.0%) | 0 (0.0%) |
| 18 to 34 Years | 0 (0.0%) | 0 (0.0%) |
| 35 to 64 Years | 0 (0.0%) | 0 (0.0%) |
| 65 to 74 Years | 26 (11.7%) | 0 (0.0%) |
| 75 Years and over | 0 (0.0%) | 0 (0.0%) |
Technology Access in North Hudson
Computing Device Access in North Hudson
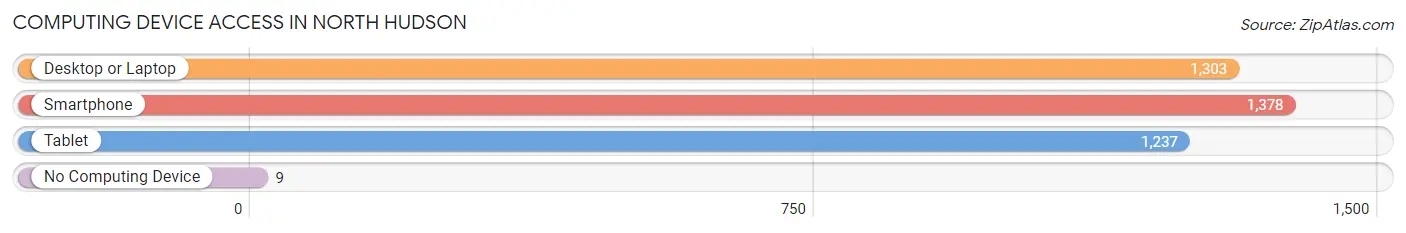
| Device Type | # Households | % Households |
| Desktop or Laptop | 1,303 | 90.5% |
| Smartphone | 1,378 | 95.7% |
| Tablet | 1,237 | 85.9% |
| No Computing Device | 9 | 0.6% |
| Total | 1,440 | 100.0% |
Internet Access in North Hudson
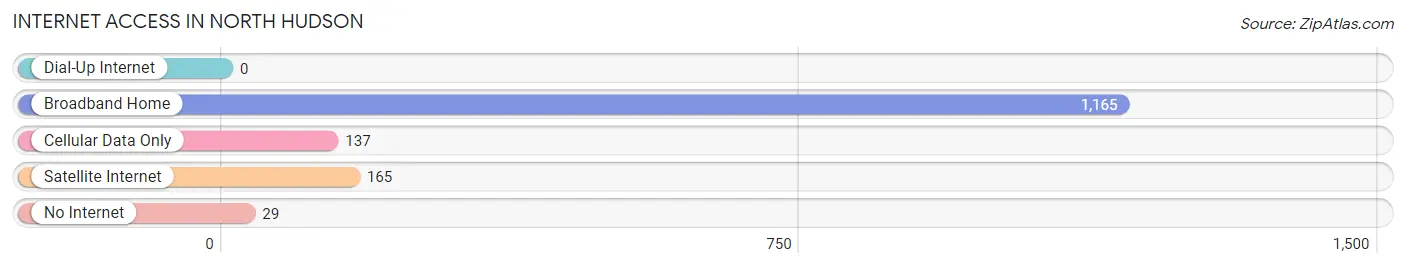
| Internet Type | # Households | % Households |
| Dial-Up Internet | 0 | 0.0% |
| Broadband Home | 1,165 | 80.9% |
| Cellular Data Only | 137 | 9.5% |
| Satellite Internet | 165 | 11.5% |
| No Internet | 29 | 2.0% |
| Total | 1,440 | 100.0% |
North Hudson Summary
Hudson, Wisconsin is a city located in St. Croix County, Wisconsin, United States. It is located on the western bank of the St. Croix River, which forms the border between Wisconsin and Minnesota. The city is part of the Minneapolis-St. Paul metropolitan area and is located approximately 25 miles east of Minneapolis. As of the 2010 census, the population of Hudson was 12,719.
History
The area that is now Hudson was first settled in 1837 by settlers from New England. The city was originally known as North Hudson, and was incorporated in 1854. The city was named after the Hudson River in New York.
In the late 19th century, Hudson was a major lumbering center, and the city was home to several sawmills and lumberyards. The city was also home to a number of manufacturing companies, including a paper mill, a brickyard, and a furniture factory.
Geography
Hudson is located at the confluence of the St. Croix River and the Kinnickinnic River. The city is located in the western part of St. Croix County, and is bordered by the cities of River Falls and New Richmond to the north, and the cities of Prescott and Bayport to the south. The city is located approximately 25 miles east of Minneapolis.
The city has a total area of 8.7 square miles, of which 8.3 square miles is land and 0.4 square miles is water.
Economy
Hudson is home to a number of businesses and industries, including manufacturing, retail, and healthcare. The city is home to several large employers, including 3M, Andersen Windows, and the Hudson Hospital & Clinic.
The city is also home to a number of small businesses, including restaurants, shops, and service providers. The city is also home to a number of tourist attractions, including the St. Croix River, the Kinnickinnic River, and the historic downtown area.
Demographics
As of the 2010 census, the population of Hudson was 12,719. The racial makeup of the city was 92.3% White, 2.2% African American, 0.4% Native American, 2.2% Asian, 0.1% Pacific Islander, 1.3% from other races, and 1.5% from two or more races. Hispanic or Latino of any race were 4.2% of the population.
The median income for a household in the city was $54,945, and the median income for a family was $64,945. The per capita income for the city was $25,945. About 5.2% of families and 7.2% of the population were below the poverty line, including 8.3% of those under age 18 and 6.2% of those age 65 or over.
Common Questions
What is Per Capita Income in North Hudson?
Per Capita income in North Hudson is $53,036.
What is the Median Family Income in North Hudson?
Median Family Income in North Hudson is $142,371.
What is the Median Household income in North Hudson?
Median Household Income in North Hudson is $127,982.
What is Income or Wage Gap in North Hudson?
Income or Wage Gap in North Hudson is 15.9%.
Women in North Hudson earn 84.1 cents for every dollar earned by a man.
What is Inequality or Gini Index in North Hudson?
Inequality or Gini Index in North Hudson is 0.33.
What is the Total Population of North Hudson?
Total Population of North Hudson is 3,837.
What is the Total Male Population of North Hudson?
Total Male Population of North Hudson is 1,943.
What is the Total Female Population of North Hudson?
Total Female Population of North Hudson is 1,894.
What is the Ratio of Males per 100 Females in North Hudson?
There are 102.59 Males per 100 Females in North Hudson.
What is the Ratio of Females per 100 Males in North Hudson?
There are 97.48 Females per 100 Males in North Hudson.
What is the Median Population Age in North Hudson?
Median Population Age in North Hudson is 43.3 Years.
What is the Average Family Size in North Hudson
Average Family Size in North Hudson is 3.2 People.
What is the Average Household Size in North Hudson
Average Household Size in North Hudson is 2.7 People.
How Large is the Labor Force in North Hudson?
There are 2,200 People in the Labor Forcein in North Hudson.
What is the Percentage of People in the Labor Force in North Hudson?
69.0% of People are in the Labor Force in North Hudson.
What is the Unemployment Rate in North Hudson?
Unemployment Rate in North Hudson is 2.2%.