Holmen, WI Map & Demographics
Holmen Map
Holmen Overview
$39,379
PER CAPITA INCOME
$105,127
AVG FAMILY INCOME
$77,880
AVG HOUSEHOLD INCOME
28.7%
WAGE / INCOME GAP [ % ]
71.3¢/ $1
WAGE / INCOME GAP [ $ ]
0.40
INEQUALITY / GINI INDEX
10,806
TOTAL POPULATION
5,540
MALE POPULATION
5,266
FEMALE POPULATION
105.20
MALES / 100 FEMALES
95.05
FEMALES / 100 MALES
37.8
MEDIAN AGE
3.2
AVG FAMILY SIZE
2.5
AVG HOUSEHOLD SIZE
5,849
LABOR FORCE [ PEOPLE ]
68.9%
PERCENT IN LABOR FORCE
1.8%
UNEMPLOYMENT RATE
Holmen Zip Codes
Holmen Area Codes
Income in Holmen
Income Overview in Holmen
Per Capita Income in Holmen is $39,379, while median incomes of families and households are $105,127 and $77,880 respectively.
| Characteristic | Number | Measure |
| Per Capita Income | 10,806 | $39,379 |
| Median Family Income | 2,657 | $105,127 |
| Mean Family Income | 2,657 | $110,772 |
| Median Household Income | 4,343 | $77,880 |
| Mean Household Income | 4,343 | $97,232 |
| Income Deficit | 2,657 | $0 |
| Wage / Income Gap (%) | 10,806 | 28.73% |
| Wage / Income Gap ($) | 10,806 | 71.27¢ per $1 |
| Gini / Inequality Index | 10,806 | 0.40 |
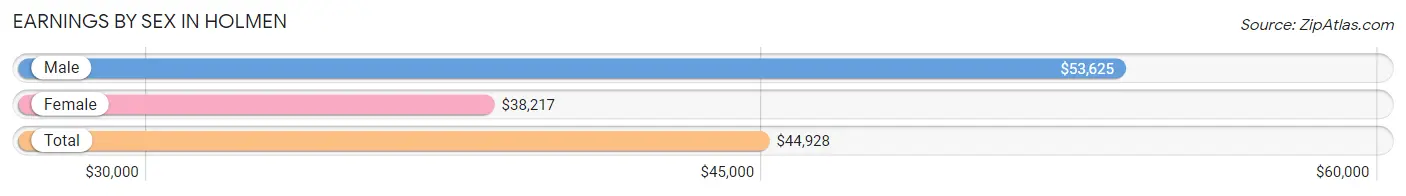
Earnings by Sex in Holmen
Average Earnings in Holmen are $44,928, $53,625 for men and $38,217 for women, a difference of 28.7%.
| Sex | Number | Average Earnings |
| Male | 3,428 (54.5%) | $53,625 |
| Female | 2,867 (45.5%) | $38,217 |
| Total | 6,295 (100.0%) | $44,928 |
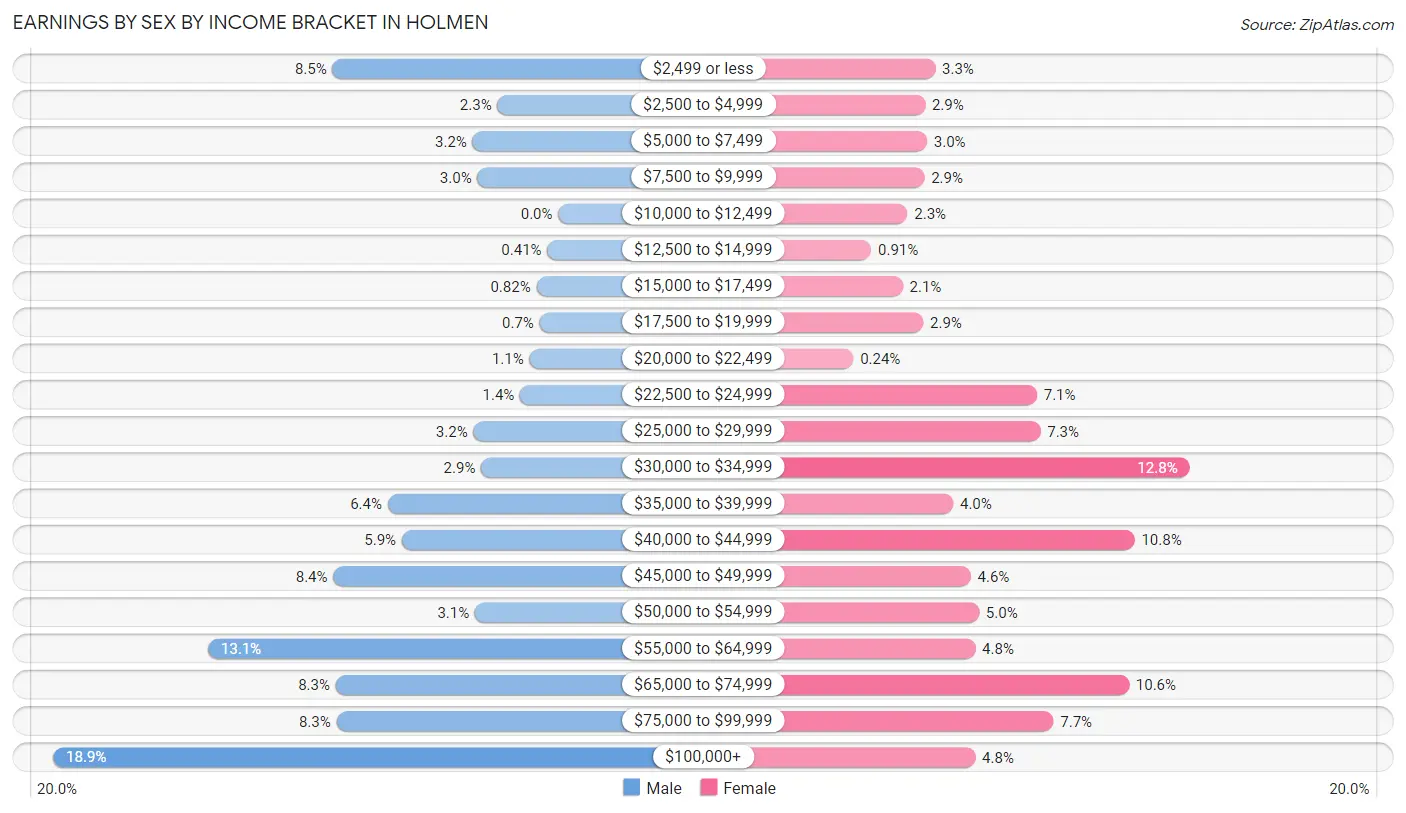
Earnings by Sex by Income Bracket in Holmen
The most common earnings brackets in Holmen are $100,000+ for men (649 | 18.9%) and $30,000 to $34,999 for women (368 | 12.8%).
| Income | Male | Female |
| $2,499 or less | 290 (8.5%) | 95 (3.3%) |
| $2,500 to $4,999 | 78 (2.3%) | 84 (2.9%) |
| $5,000 to $7,499 | 110 (3.2%) | 86 (3.0%) |
| $7,500 to $9,999 | 104 (3.0%) | 83 (2.9%) |
| $10,000 to $12,499 | 0 (0.0%) | 65 (2.3%) |
| $12,500 to $14,999 | 14 (0.4%) | 26 (0.9%) |
| $15,000 to $17,499 | 28 (0.8%) | 60 (2.1%) |
| $17,500 to $19,999 | 24 (0.7%) | 82 (2.9%) |
| $20,000 to $22,499 | 37 (1.1%) | 7 (0.2%) |
| $22,500 to $24,999 | 49 (1.4%) | 204 (7.1%) |
| $25,000 to $29,999 | 109 (3.2%) | 208 (7.2%) |
| $30,000 to $34,999 | 99 (2.9%) | 368 (12.8%) |
| $35,000 to $39,999 | 219 (6.4%) | 114 (4.0%) |
| $40,000 to $44,999 | 201 (5.9%) | 309 (10.8%) |
| $45,000 to $49,999 | 289 (8.4%) | 133 (4.6%) |
| $50,000 to $54,999 | 107 (3.1%) | 142 (5.0%) |
| $55,000 to $64,999 | 450 (13.1%) | 138 (4.8%) |
| $65,000 to $74,999 | 286 (8.3%) | 303 (10.6%) |
| $75,000 to $99,999 | 285 (8.3%) | 222 (7.7%) |
| $100,000+ | 649 (18.9%) | 138 (4.8%) |
| Total | 3,428 (100.0%) | 2,867 (100.0%) |
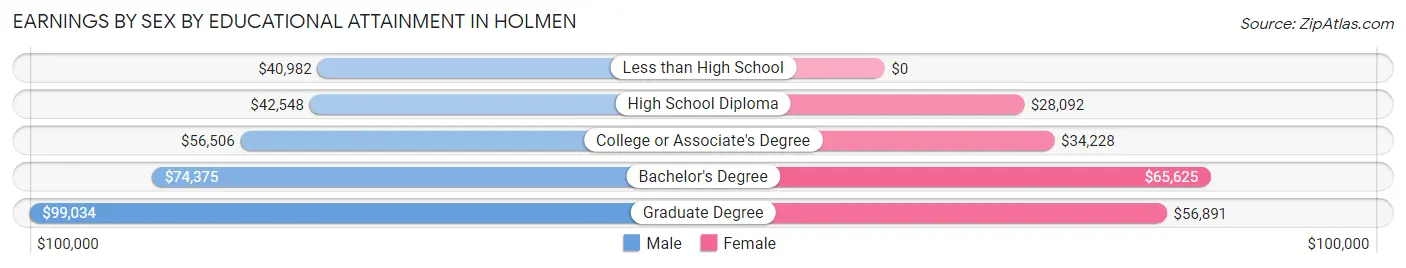
Earnings by Sex by Educational Attainment in Holmen
Average earnings in Holmen are $59,148 for men and $41,803 for women, a difference of 29.3%. Men with an educational attainment of graduate degree enjoy the highest average annual earnings of $99,034, while those with less than high school education earn the least with $40,982. Women with an educational attainment of bachelor's degree earn the most with the average annual earnings of $65,625, while those with high school diploma education have the smallest earnings of $28,092.
| Educational Attainment | Male Income | Female Income |
| Less than High School | $40,982 | $0 |
| High School Diploma | $42,548 | $28,092 |
| College or Associate's Degree | $56,506 | $34,228 |
| Bachelor's Degree | $74,375 | $65,625 |
| Graduate Degree | $99,034 | $56,891 |
| Total | $59,148 | $41,803 |
Family Income in Holmen
Family Income Brackets in Holmen
According to the Holmen family income data, there are 765 families falling into the $100,000 to $149,999 income range, which is the most common income bracket and makes up 28.8% of all families.
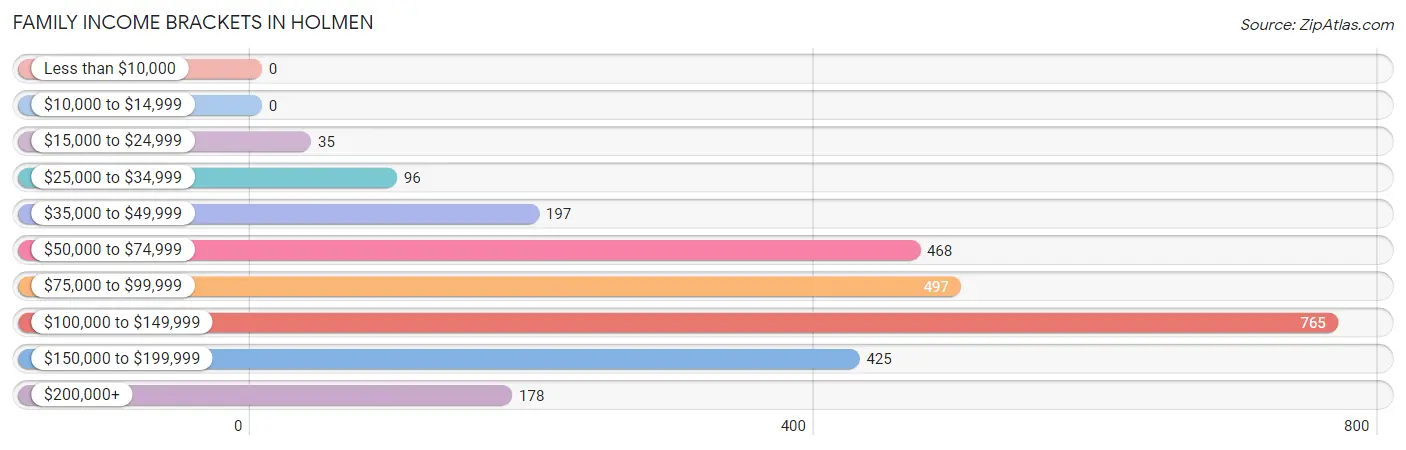
| Income Bracket | # Families | % Families |
| Less than $10,000 | 0 | 0.0% |
| $10,000 to $14,999 | 0 | 0.0% |
| $15,000 to $24,999 | 35 | 1.3% |
| $25,000 to $34,999 | 96 | 3.6% |
| $35,000 to $49,999 | 197 | 7.4% |
| $50,000 to $74,999 | 468 | 17.6% |
| $75,000 to $99,999 | 497 | 18.7% |
| $100,000 to $149,999 | 765 | 28.8% |
| $150,000 to $199,999 | 425 | 16.0% |
| $200,000+ | 178 | 6.7% |
Family Income by Famaliy Size in Holmen
4-person families (541 | 20.4%) account for the highest median family income in Holmen with $124,950 per family, while 2-person families (1,186 | 44.6%) have the highest median income of $40,514 per family member.
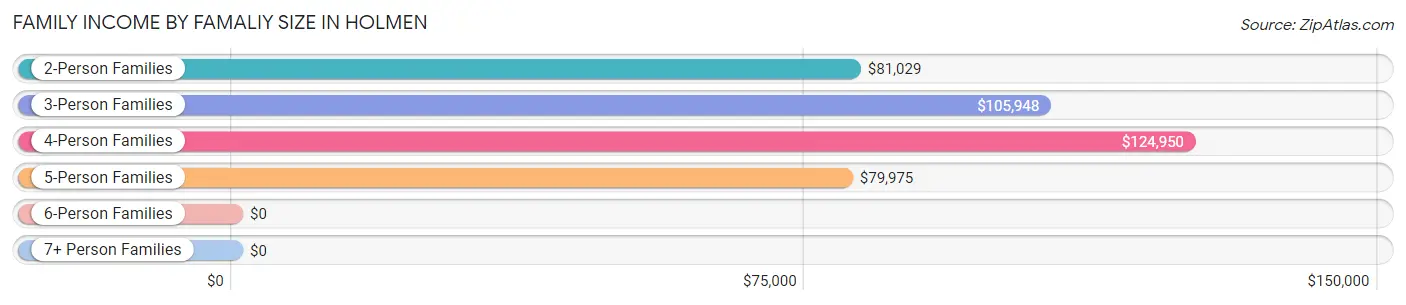
| Income Bracket | # Families | Median Income |
| 2-Person Families | 1,186 (44.6%) | $81,029 |
| 3-Person Families | 538 (20.3%) | $105,948 |
| 4-Person Families | 541 (20.4%) | $124,950 |
| 5-Person Families | 307 (11.6%) | $79,975 |
| 6-Person Families | 13 (0.5%) | $0 |
| 7+ Person Families | 72 (2.7%) | $0 |
| Total | 2,657 (100.0%) | $105,127 |
Family Income by Number of Earners in Holmen
The median family income in Holmen is $105,127, with families comprising 3+ earners (336) having the highest median family income of $179,474, while families with no earners (250) have the lowest median family income of $66,875, accounting for 12.7% and 9.4% of families, respectively.
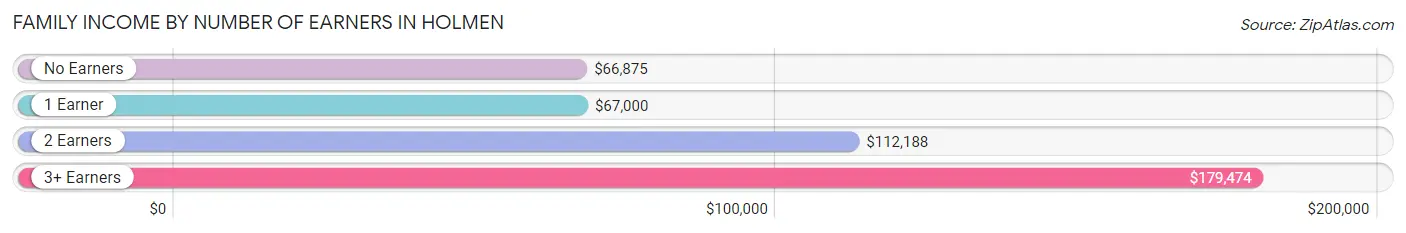
| Number of Earners | # Families | Median Income |
| No Earners | 250 (9.4%) | $66,875 |
| 1 Earner | 760 (28.6%) | $67,000 |
| 2 Earners | 1,311 (49.3%) | $112,188 |
| 3+ Earners | 336 (12.7%) | $179,474 |
| Total | 2,657 (100.0%) | $105,127 |
Household Income in Holmen
Household Income Brackets in Holmen
With 986 households falling in the category, the $100,000 to $149,999 income range is the most frequent in Holmen, accounting for 22.7% of all households. In contrast, only 43 households (1.0%) fall into the less than $10,000 income bracket, making it the least populous group.
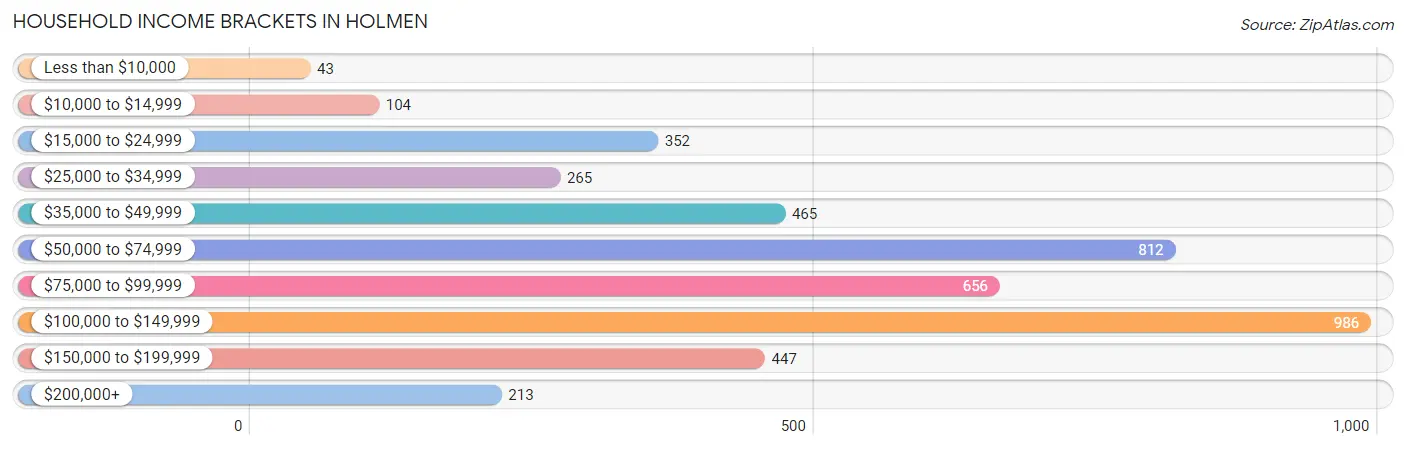
| Income Bracket | # Households | % Households |
| Less than $10,000 | 43 | 1.0% |
| $10,000 to $14,999 | 104 | 2.4% |
| $15,000 to $24,999 | 352 | 8.1% |
| $25,000 to $34,999 | 265 | 6.1% |
| $35,000 to $49,999 | 465 | 10.7% |
| $50,000 to $74,999 | 812 | 18.7% |
| $75,000 to $99,999 | 656 | 15.1% |
| $100,000 to $149,999 | 986 | 22.7% |
| $150,000 to $199,999 | 447 | 10.3% |
| $200,000+ | 213 | 4.9% |
Household Income by Householder Age in Holmen
The median household income in Holmen is $77,880, with the highest median household income of $107,475 found in the 45 to 64 years age bracket for the primary householder. A total of 1,537 households (35.4%) fall into this category. Meanwhile, the 65+ years age bracket for the primary householder has the lowest median household income of $48,327, with 1,045 households (24.1%) in this group.
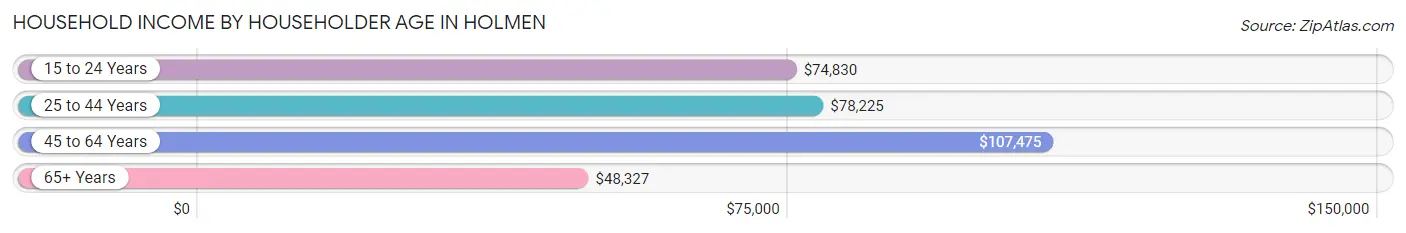
| Income Bracket | # Households | Median Income |
| 15 to 24 Years | 185 (4.3%) | $74,830 |
| 25 to 44 Years | 1,576 (36.3%) | $78,225 |
| 45 to 64 Years | 1,537 (35.4%) | $107,475 |
| 65+ Years | 1,045 (24.1%) | $48,327 |
| Total | 4,343 (100.0%) | $77,880 |
Poverty in Holmen
Income Below Poverty by Sex and Age in Holmen
With 4.5% poverty level for males and 4.2% for females among the residents of Holmen, 5 year old males and 65 to 74 year old females are the most vulnerable to poverty, with 44 males (58.7%) and 45 females (9.2%) in their respective age groups living below the poverty level.
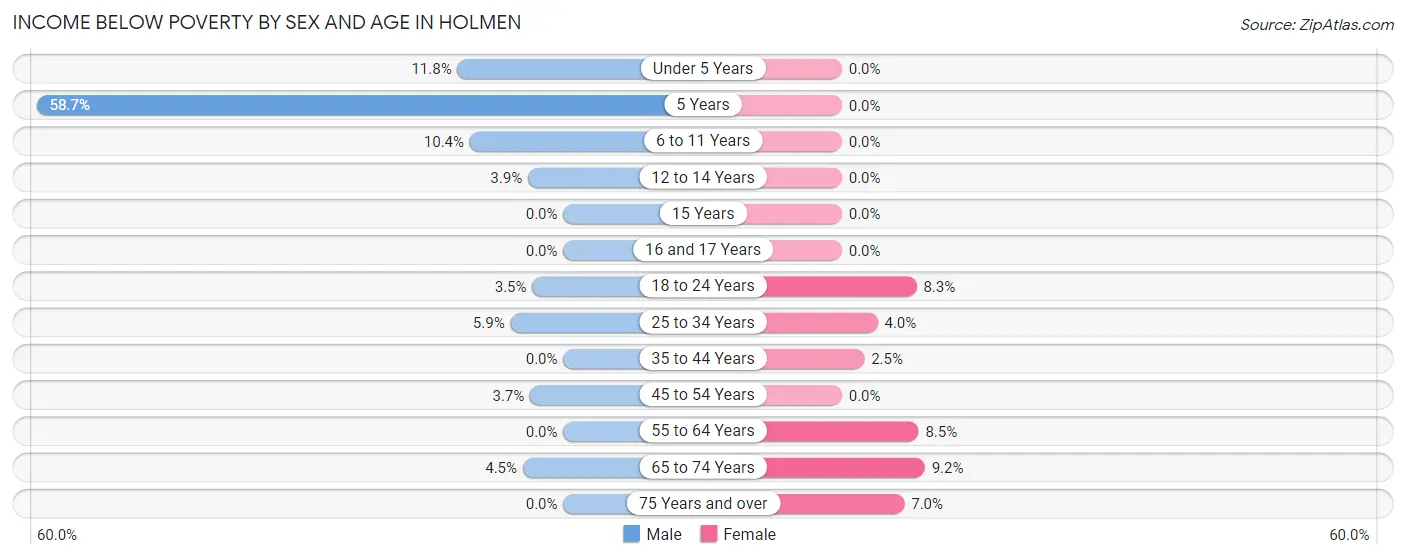
| Age Bracket | Male | Female |
| Under 5 Years | 25 (11.8%) | 0 (0.0%) |
| 5 Years | 44 (58.7%) | 0 (0.0%) |
| 6 to 11 Years | 59 (10.4%) | 0 (0.0%) |
| 12 to 14 Years | 11 (3.9%) | 0 (0.0%) |
| 15 Years | 0 (0.0%) | 0 (0.0%) |
| 16 and 17 Years | 0 (0.0%) | 0 (0.0%) |
| 18 to 24 Years | 17 (3.5%) | 41 (8.3%) |
| 25 to 34 Years | 40 (5.9%) | 20 (4.0%) |
| 35 to 44 Years | 0 (0.0%) | 22 (2.5%) |
| 45 to 54 Years | 35 (3.7%) | 0 (0.0%) |
| 55 to 64 Years | 0 (0.0%) | 64 (8.5%) |
| 65 to 74 Years | 16 (4.5%) | 45 (9.2%) |
| 75 Years and over | 0 (0.0%) | 30 (7.0%) |
| Total | 247 (4.5%) | 222 (4.2%) |
Income Above Poverty by Sex and Age in Holmen
According to the poverty statistics in Holmen, males aged 15 years and females aged under 5 years are the age groups that are most secure financially, with 100.0% of males and 100.0% of females in these age groups living above the poverty line.
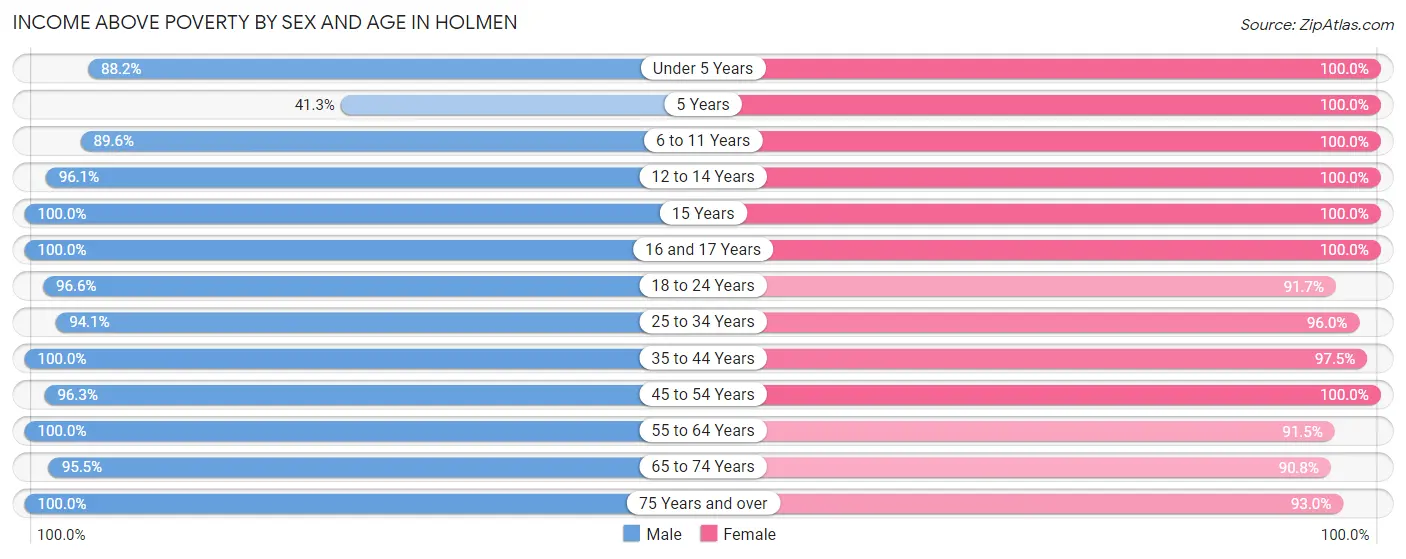
| Age Bracket | Male | Female |
| Under 5 Years | 187 (88.2%) | 352 (100.0%) |
| 5 Years | 31 (41.3%) | 26 (100.0%) |
| 6 to 11 Years | 508 (89.6%) | 208 (100.0%) |
| 12 to 14 Years | 268 (96.1%) | 275 (100.0%) |
| 15 Years | 182 (100.0%) | 112 (100.0%) |
| 16 and 17 Years | 248 (100.0%) | 181 (100.0%) |
| 18 to 24 Years | 476 (96.6%) | 452 (91.7%) |
| 25 to 34 Years | 639 (94.1%) | 482 (96.0%) |
| 35 to 44 Years | 662 (100.0%) | 858 (97.5%) |
| 45 to 54 Years | 912 (96.3%) | 553 (100.0%) |
| 55 to 64 Years | 440 (100.0%) | 685 (91.5%) |
| 65 to 74 Years | 339 (95.5%) | 442 (90.8%) |
| 75 Years and over | 378 (100.0%) | 401 (93.0%) |
| Total | 5,270 (95.5%) | 5,027 (95.8%) |
Income Below Poverty Among Married-Couple Families in Holmen
The poverty statistics for married-couple families in Holmen show that 0.9% or 20 of the total 2,184 families live below the poverty line. Families with 3 or 4 children have the highest poverty rate of 8.7%, comprising of 20 families. On the other hand, families with no children have the lowest poverty rate of 0.0%, which includes 0 families.
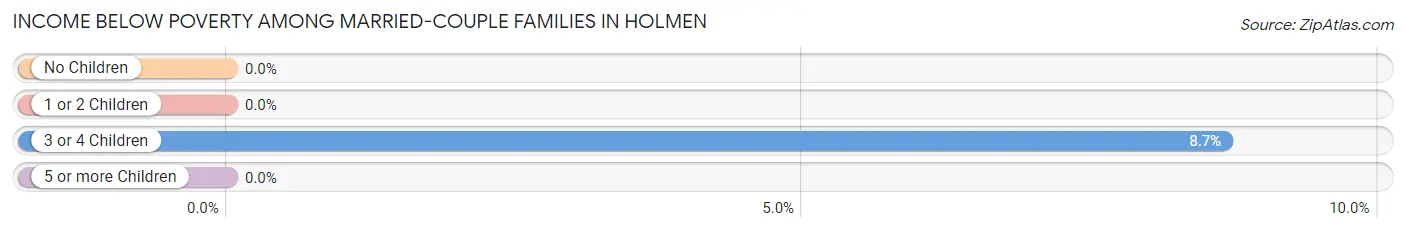
| Children | Above Poverty | Below Poverty |
| No Children | 1,150 (100.0%) | 0 (0.0%) |
| 1 or 2 Children | 768 (100.0%) | 0 (0.0%) |
| 3 or 4 Children | 211 (91.3%) | 20 (8.7%) |
| 5 or more Children | 35 (100.0%) | 0 (0.0%) |
| Total | 2,164 (99.1%) | 20 (0.9%) |
Income Below Poverty Among Single-Parent Households in Holmen
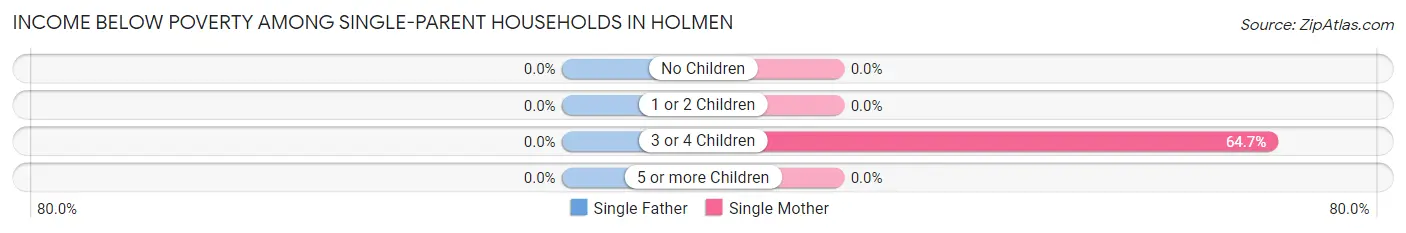
| Children | Single Father | Single Mother |
| No Children | 0 (0.0%) | 0 (0.0%) |
| 1 or 2 Children | 0 (0.0%) | 0 (0.0%) |
| 3 or 4 Children | 0 (0.0%) | 22 (64.7%) |
| 5 or more Children | 0 (0.0%) | 0 (0.0%) |
| Total | 0 (0.0%) | 22 (7.1%) |
Income Below Poverty Among Married-Couple vs Single-Parent Households in Holmen
The poverty data for Holmen shows that 20 of the married-couple family households (0.9%) and 22 of the single-parent households (4.6%) are living below the poverty level. Within the married-couple family households, those with 3 or 4 children have the highest poverty rate, with 20 households (8.7%) falling below the poverty line. Among the single-parent households, those with 3 or 4 children have the highest poverty rate, with 22 household (64.7%) living below poverty.
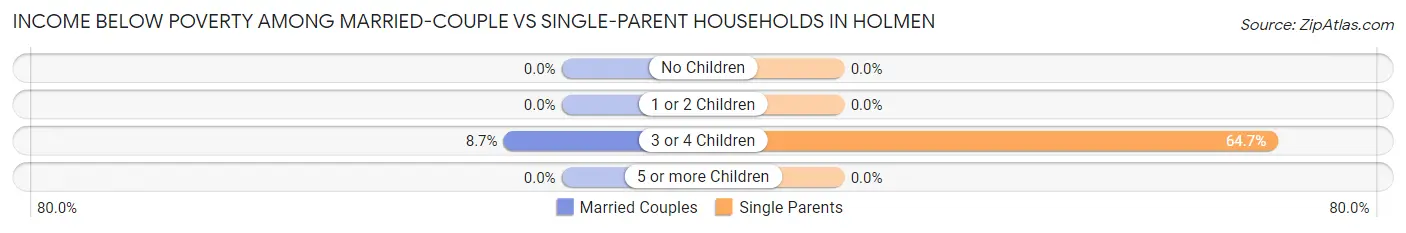
| Children | Married-Couple Families | Single-Parent Households |
| No Children | 0 (0.0%) | 0 (0.0%) |
| 1 or 2 Children | 0 (0.0%) | 0 (0.0%) |
| 3 or 4 Children | 20 (8.7%) | 22 (64.7%) |
| 5 or more Children | 0 (0.0%) | 0 (0.0%) |
| Total | 20 (0.9%) | 22 (4.6%) |
Race in Holmen
The most populous races in Holmen are White / Caucasian (9,551 | 88.4%), Asian (657 | 6.1%), and Two or more Races (432 | 4.0%).

| Race | # Population | % Population |
| Asian | 657 | 6.1% |
| Black / African American | 68 | 0.6% |
| Hawaiian / Pacific | 0 | 0.0% |
| Hispanic or Latino | 153 | 1.4% |
| Native / Alaskan | 0 | 0.0% |
| White / Caucasian | 9,551 | 88.4% |
| Two or more Races | 432 | 4.0% |
| Some other Race | 98 | 0.9% |
| Total | 10,806 | 100.0% |
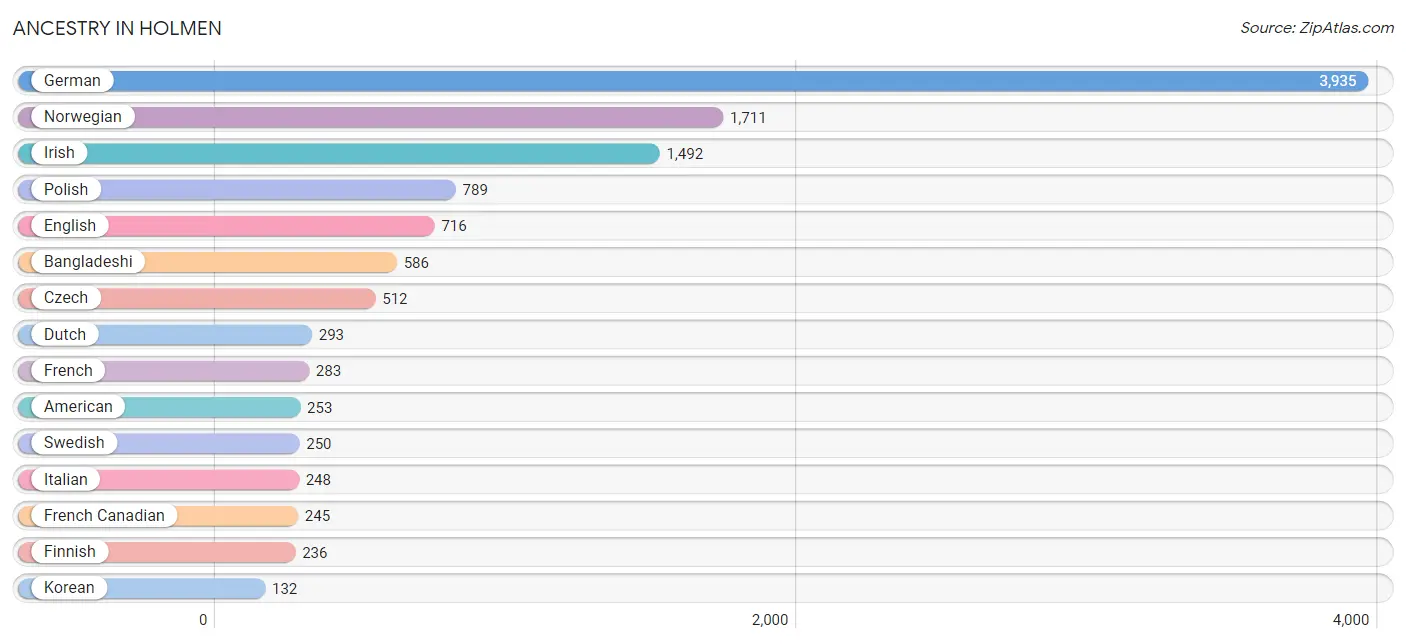
Ancestry in Holmen
The most populous ancestries reported in Holmen are German (3,935 | 36.4%), Norwegian (1,711 | 15.8%), Irish (1,492 | 13.8%), Polish (789 | 7.3%), and English (716 | 6.6%), together accounting for 80.0% of all Holmen residents.
| Ancestry | # Population | % Population |
| American | 253 | 2.3% |
| Apache | 94 | 0.9% |
| Arab | 23 | 0.2% |
| Austrian | 14 | 0.1% |
| Bangladeshi | 586 | 5.4% |
| British | 26 | 0.2% |
| Canadian | 26 | 0.2% |
| Cherokee | 5 | 0.1% |
| Chippewa | 65 | 0.6% |
| Colombian | 68 | 0.6% |
| Croatian | 20 | 0.2% |
| Czech | 512 | 4.7% |
| Danish | 9 | 0.1% |
| Dutch | 293 | 2.7% |
| Eastern European | 60 | 0.6% |
| English | 716 | 6.6% |
| European | 128 | 1.2% |
| Finnish | 236 | 2.2% |
| French | 283 | 2.6% |
| French Canadian | 245 | 2.3% |
| German | 3,935 | 36.4% |
| Greek | 46 | 0.4% |
| Hungarian | 59 | 0.5% |
| Indian (Asian) | 36 | 0.3% |
| Irish | 1,492 | 13.8% |
| Italian | 248 | 2.3% |
| Korean | 132 | 1.2% |
| Lebanese | 23 | 0.2% |
| Lithuanian | 12 | 0.1% |
| Mexican | 60 | 0.6% |
| Northern European | 24 | 0.2% |
| Norwegian | 1,711 | 15.8% |
| Polish | 789 | 7.3% |
| Puerto Rican | 25 | 0.2% |
| Russian | 22 | 0.2% |
| Scandinavian | 114 | 1.1% |
| Scottish | 87 | 0.8% |
| Sioux | 47 | 0.4% |
| Slovak | 12 | 0.1% |
| South American | 68 | 0.6% |
| Swedish | 250 | 2.3% |
| Swiss | 16 | 0.2% |
| Thai | 16 | 0.2% |
| Yugoslavian | 10 | 0.1% | View All 44 Rows |
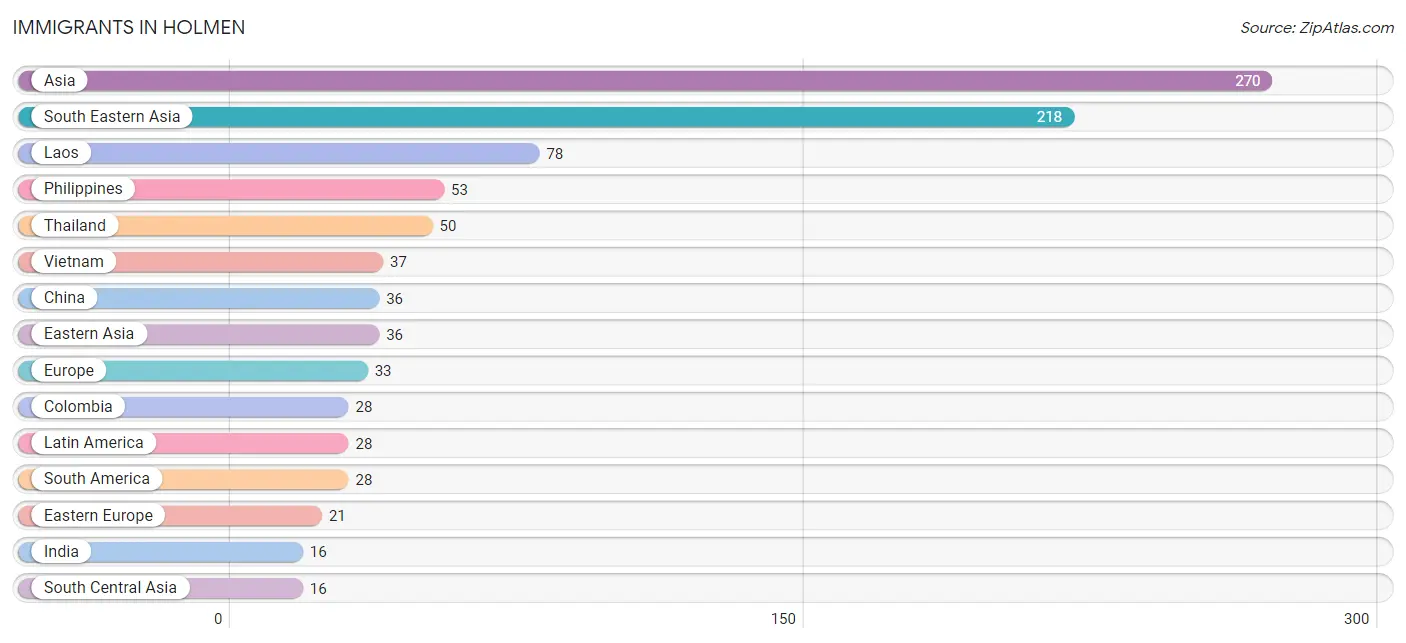
Immigrants in Holmen
The most numerous immigrant groups reported in Holmen came from Asia (270 | 2.5%), South Eastern Asia (218 | 2.0%), Laos (78 | 0.7%), Philippines (53 | 0.5%), and Thailand (50 | 0.5%), together accounting for 6.2% of all Holmen residents.
| Immigration Origin | # Population | % Population |
| Asia | 270 | 2.5% |
| China | 36 | 0.3% |
| Colombia | 28 | 0.3% |
| Eastern Asia | 36 | 0.3% |
| Eastern Europe | 21 | 0.2% |
| Europe | 33 | 0.3% |
| Hungary | 11 | 0.1% |
| India | 16 | 0.2% |
| Laos | 78 | 0.7% |
| Latin America | 28 | 0.3% |
| Netherlands | 12 | 0.1% |
| Philippines | 53 | 0.5% |
| South America | 28 | 0.3% |
| South Central Asia | 16 | 0.2% |
| South Eastern Asia | 218 | 2.0% |
| Thailand | 50 | 0.5% |
| Vietnam | 37 | 0.3% |
| Western Europe | 12 | 0.1% | View All 18 Rows |
Sex and Age in Holmen
Sex and Age in Holmen
The most populous age groups in Holmen are 45 to 49 Years (611 | 11.0%) for men and 40 to 44 Years (531 | 10.1%) for women.
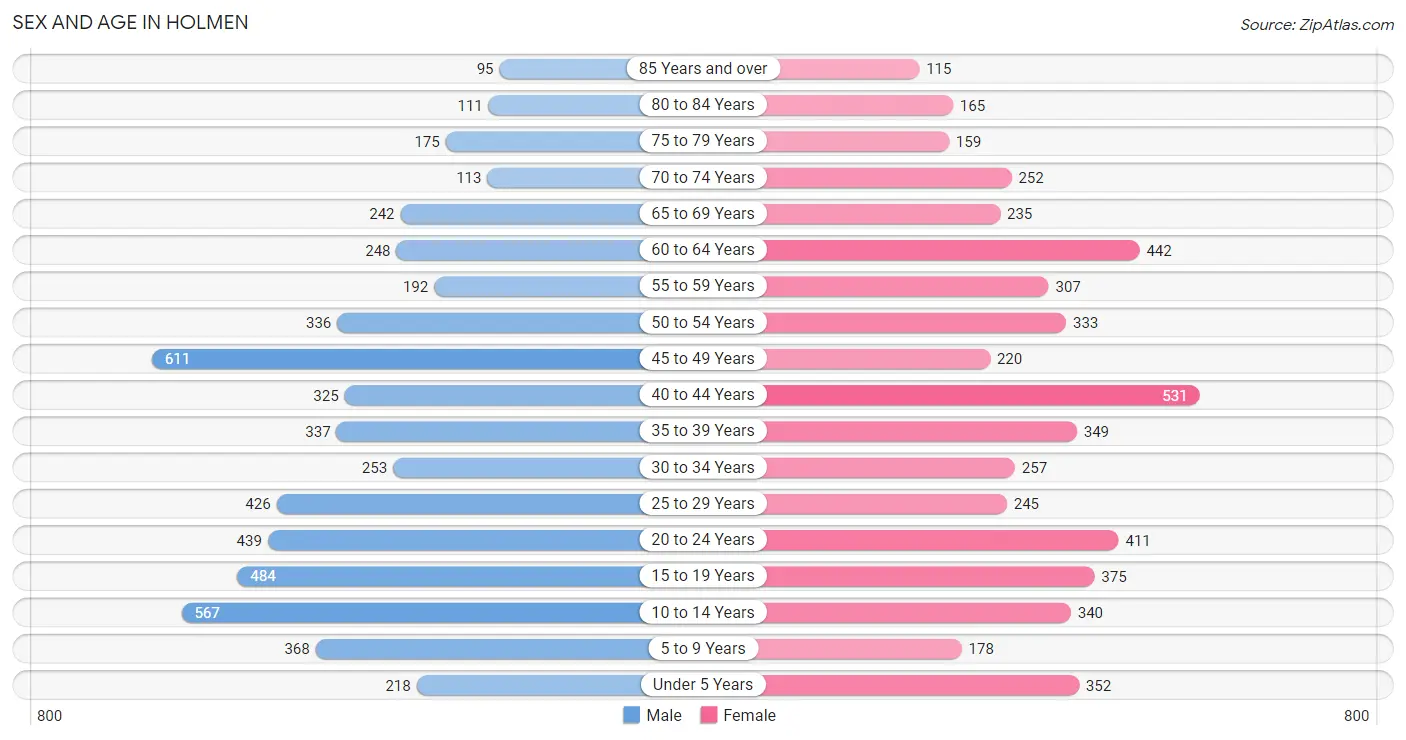
| Age Bracket | Male | Female |
| Under 5 Years | 218 (3.9%) | 352 (6.7%) |
| 5 to 9 Years | 368 (6.6%) | 178 (3.4%) |
| 10 to 14 Years | 567 (10.2%) | 340 (6.5%) |
| 15 to 19 Years | 484 (8.7%) | 375 (7.1%) |
| 20 to 24 Years | 439 (7.9%) | 411 (7.8%) |
| 25 to 29 Years | 426 (7.7%) | 245 (4.6%) |
| 30 to 34 Years | 253 (4.6%) | 257 (4.9%) |
| 35 to 39 Years | 337 (6.1%) | 349 (6.6%) |
| 40 to 44 Years | 325 (5.9%) | 531 (10.1%) |
| 45 to 49 Years | 611 (11.0%) | 220 (4.2%) |
| 50 to 54 Years | 336 (6.1%) | 333 (6.3%) |
| 55 to 59 Years | 192 (3.5%) | 307 (5.8%) |
| 60 to 64 Years | 248 (4.5%) | 442 (8.4%) |
| 65 to 69 Years | 242 (4.4%) | 235 (4.5%) |
| 70 to 74 Years | 113 (2.0%) | 252 (4.8%) |
| 75 to 79 Years | 175 (3.2%) | 159 (3.0%) |
| 80 to 84 Years | 111 (2.0%) | 165 (3.1%) |
| 85 Years and over | 95 (1.7%) | 115 (2.2%) |
| Total | 5,540 (100.0%) | 5,266 (100.0%) |
Families and Households in Holmen
Median Family Size in Holmen
The median family size in Holmen is 3.21 persons per family, with single female/mother families (309 | 11.6%) accounting for the largest median family size of 3.32 persons per family. On the other hand, single male/father families (164 | 6.2%) represent the smallest median family size with 2.55 persons per family.
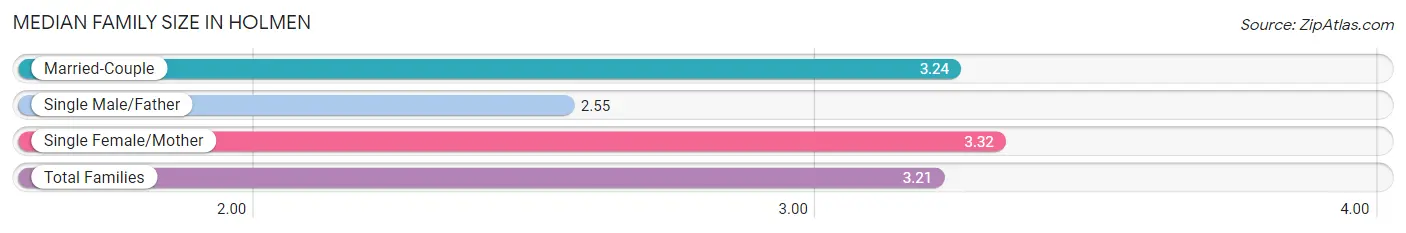
| Family Type | # Families | Family Size |
| Married-Couple | 2,184 (82.2%) | 3.24 |
| Single Male/Father | 164 (6.2%) | 2.55 |
| Single Female/Mother | 309 (11.6%) | 3.32 |
| Total Families | 2,657 (100.0%) | 3.21 |
Median Household Size in Holmen
The median household size in Holmen is 2.48 persons per household, with single female/mother households (309 | 7.1%) accounting for the largest median household size of 3.53 persons per household. non-family households (1,686 | 38.8%) represent the smallest median household size with 1.28 persons per household.
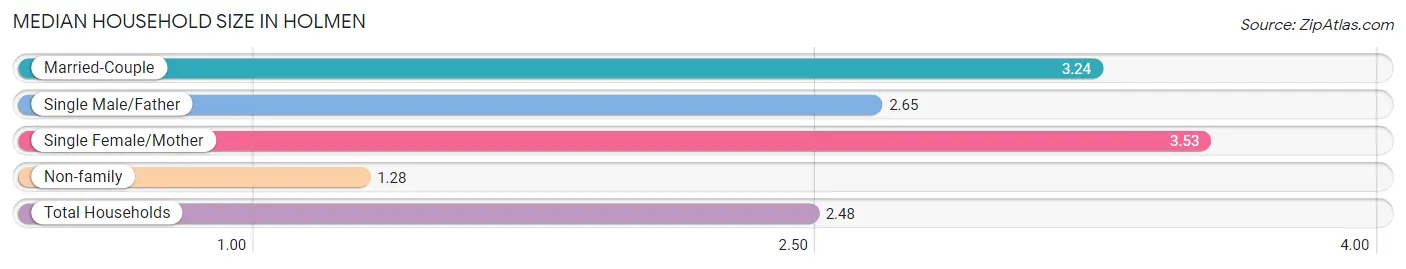
| Household Type | # Households | Household Size |
| Married-Couple | 2,184 (50.3%) | 3.24 |
| Single Male/Father | 164 (3.8%) | 2.65 |
| Single Female/Mother | 309 (7.1%) | 3.53 |
| Non-family | 1,686 (38.8%) | 1.28 |
| Total Households | 4,343 (100.0%) | 2.48 |
Household Size by Marriage Status in Holmen
Out of a total of 4,343 households in Holmen, 2,657 (61.2%) are family households, while 1,686 (38.8%) are nonfamily households. The most numerous type of family households are 2-person households, comprising 1,173, and the most common type of nonfamily households are 1-person households, comprising 1,331.
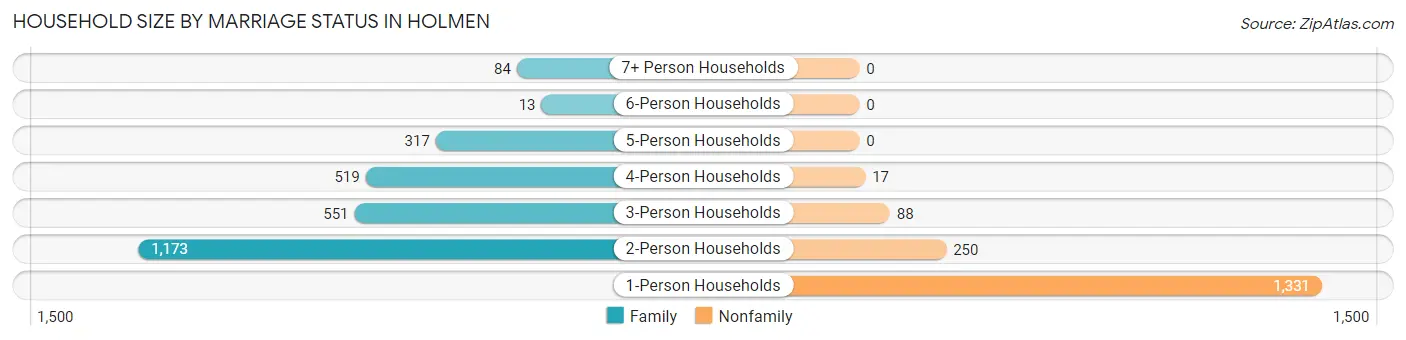
| Household Size | Family Households | Nonfamily Households |
| 1-Person Households | - | 1,331 (30.6%) |
| 2-Person Households | 1,173 (27.0%) | 250 (5.8%) |
| 3-Person Households | 551 (12.7%) | 88 (2.0%) |
| 4-Person Households | 519 (11.9%) | 17 (0.4%) |
| 5-Person Households | 317 (7.3%) | 0 (0.0%) |
| 6-Person Households | 13 (0.3%) | 0 (0.0%) |
| 7+ Person Households | 84 (1.9%) | 0 (0.0%) |
| Total | 2,657 (61.2%) | 1,686 (38.8%) |
Female Fertility in Holmen
Fertility by Age in Holmen
Average fertility rate in Holmen is 53.0 births per 1,000 women. Women in the age bracket of 20 to 34 years have the highest fertility rate with 129.0 births per 1,000 women. Women in the age bracket of 20 to 34 years acount for 90.8% of all women with births.
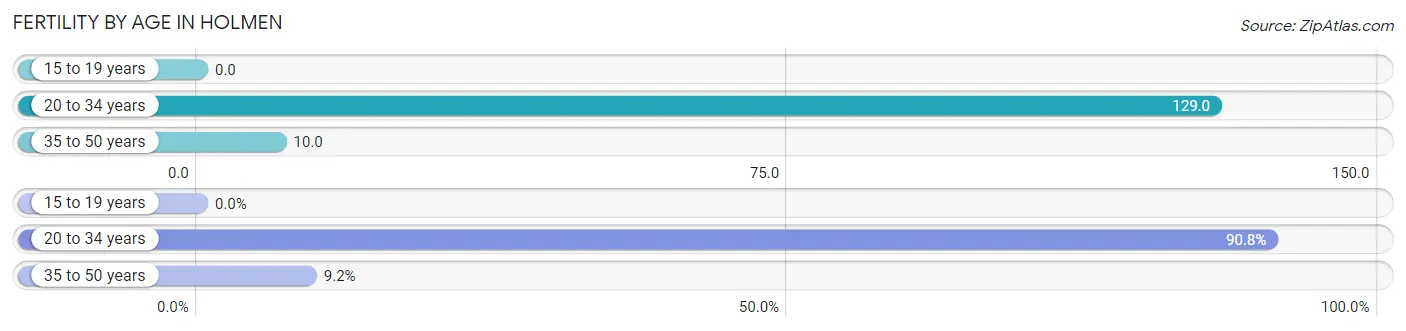
| Age Bracket | Women with Births | Births / 1,000 Women |
| 15 to 19 years | 0 (0.0%) | 0.0 |
| 20 to 34 years | 118 (90.8%) | 129.0 |
| 35 to 50 years | 12 (9.2%) | 10.0 |
| Total | 130 (100.0%) | 53.0 |
Fertility by Age by Marriage Status in Holmen
72.3% of women with births (130) in Holmen are married. The highest percentage of unmarried women with births falls into 35 to 50 years age bracket with 100.0% of them unmarried at the time of birth, while the lowest percentage of unmarried women with births belong to 20 to 34 years age bracket with 20.3% of them unmarried.
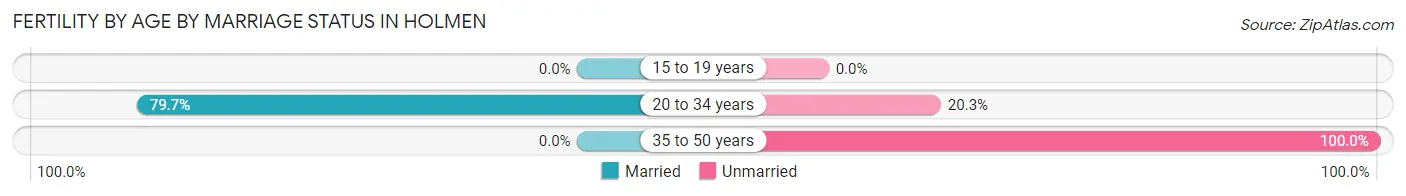
| Age Bracket | Married | Unmarried |
| 15 to 19 years | 0 (0.0%) | 0 (0.0%) |
| 20 to 34 years | 94 (79.7%) | 24 (20.3%) |
| 35 to 50 years | 0 (0.0%) | 12 (100.0%) |
| Total | 94 (72.3%) | 36 (27.7%) |
Fertility by Education in Holmen
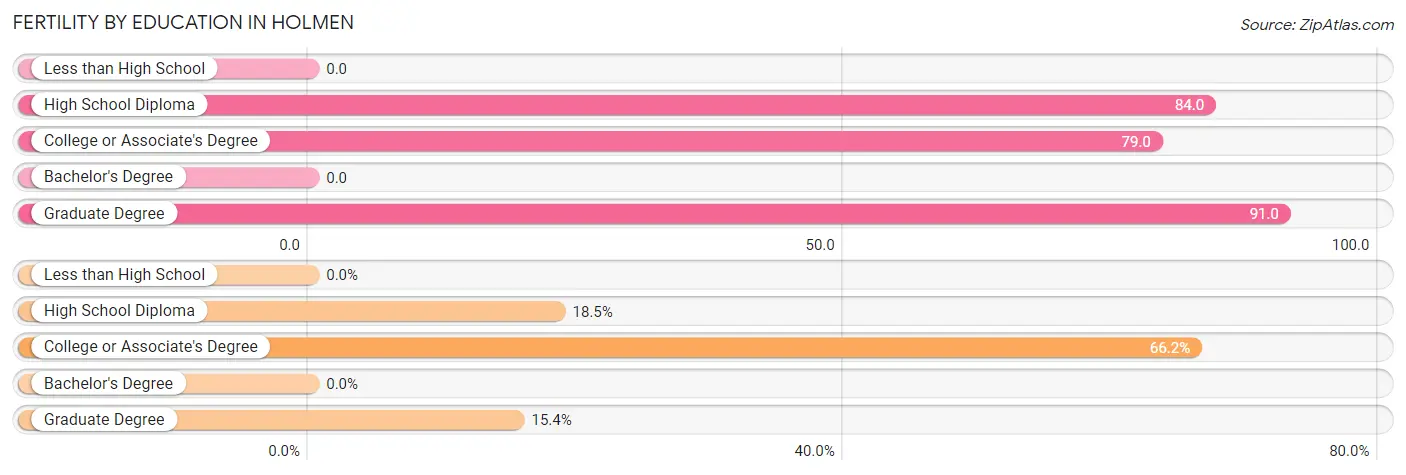
| Educational Attainment | Women with Births | Births / 1,000 Women |
| Less than High School | 0 (0.0%) | 0.0 |
| High School Diploma | 24 (18.5%) | 84.0 |
| College or Associate's Degree | 86 (66.1%) | 79.0 |
| Bachelor's Degree | 0 (0.0%) | 0.0 |
| Graduate Degree | 20 (15.4%) | 91.0 |
| Total | 130 (100.0%) | 53.0 |
Fertility by Education by Marriage Status in Holmen
27.7% of women with births in Holmen are unmarried. Women with the educational attainment of college or associate's degree are most likely to be married with 100.0% of them married at childbirth, while women with the educational attainment of high school diploma are least likely to be married with 100.0% of them unmarried at childbirth.
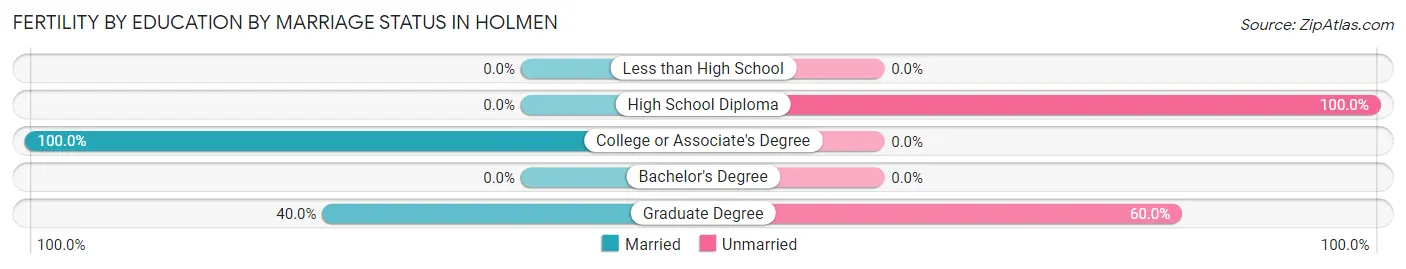
| Educational Attainment | Married | Unmarried |
| Less than High School | 0 (0.0%) | 0 (0.0%) |
| High School Diploma | 0 (0.0%) | 24 (100.0%) |
| College or Associate's Degree | 86 (100.0%) | 0 (0.0%) |
| Bachelor's Degree | 0 (0.0%) | 0 (0.0%) |
| Graduate Degree | 8 (40.0%) | 12 (60.0%) |
| Total | 94 (72.3%) | 36 (27.7%) |
Employment Characteristics in Holmen
Employment by Class of Employer in Holmen
Among the 5,725 employed individuals in Holmen, private company employees (4,115 | 71.9%), local government employees (513 | 9.0%), and not-for-profit organizations (454 | 7.9%) make up the most common classes of employment.
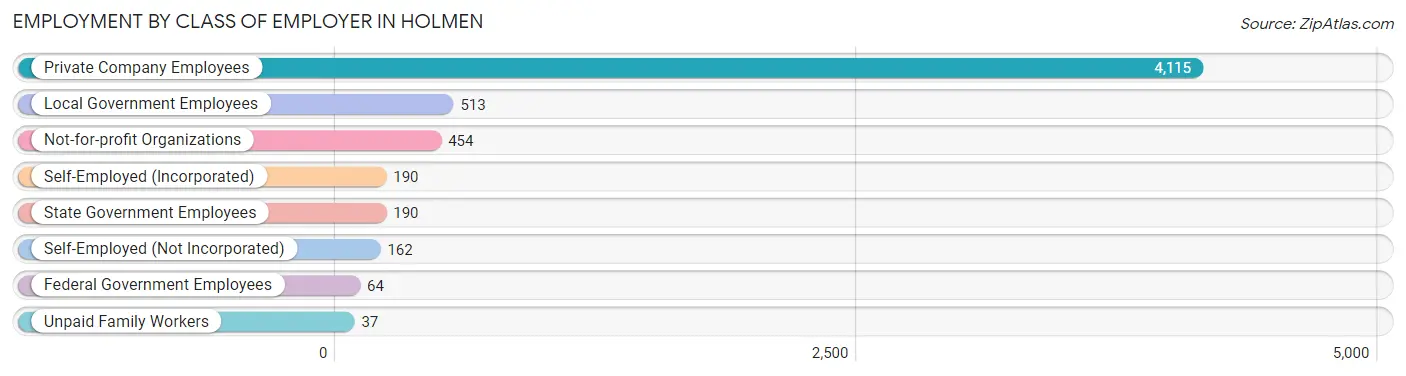
| Employer Class | # Employees | % Employees |
| Private Company Employees | 4,115 | 71.9% |
| Self-Employed (Incorporated) | 190 | 3.3% |
| Self-Employed (Not Incorporated) | 162 | 2.8% |
| Not-for-profit Organizations | 454 | 7.9% |
| Local Government Employees | 513 | 9.0% |
| State Government Employees | 190 | 3.3% |
| Federal Government Employees | 64 | 1.1% |
| Unpaid Family Workers | 37 | 0.6% |
| Total | 5,725 | 100.0% |
Employment Status by Age in Holmen
According to the labor force statistics for Holmen, out of the total population over 16 years of age (8,489), 68.9% or 5,849 individuals are in the labor force, with 1.8% or 105 of them unemployed. The age group with the highest labor force participation rate is 45 to 54 years, with 96.1% or 1,442 individuals in the labor force. Within the labor force, the 16 to 19 years age range has the highest percentage of unemployed individuals, with 6.6% or 18 of them being unemployed.
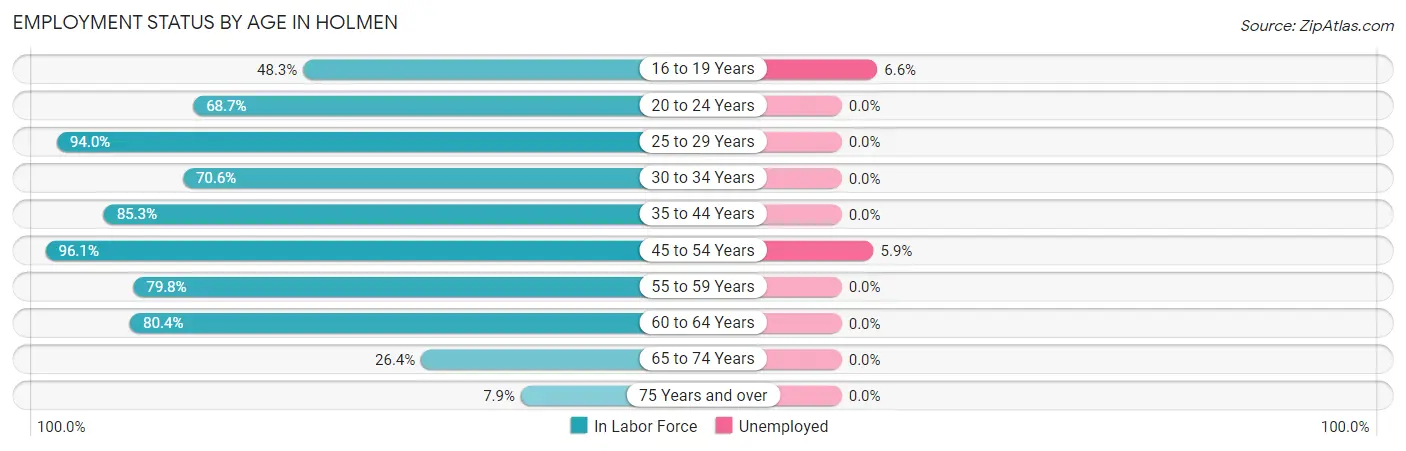
| Age Bracket | In Labor Force | Unemployed |
| 16 to 19 Years | 273 (48.3%) | 18 (6.6%) |
| 20 to 24 Years | 584 (68.7%) | 0 (0.0%) |
| 25 to 29 Years | 631 (94.0%) | 0 (0.0%) |
| 30 to 34 Years | 360 (70.6%) | 0 (0.0%) |
| 35 to 44 Years | 1,315 (85.3%) | 0 (0.0%) |
| 45 to 54 Years | 1,442 (96.1%) | 85 (5.9%) |
| 55 to 59 Years | 398 (79.8%) | 0 (0.0%) |
| 60 to 64 Years | 555 (80.4%) | 0 (0.0%) |
| 65 to 74 Years | 222 (26.4%) | 0 (0.0%) |
| 75 Years and over | 65 (7.9%) | 0 (0.0%) |
| Total | 5,849 (68.9%) | 105 (1.8%) |
Employment Status by Educational Attainment in Holmen
According to labor force statistics for Holmen, 86.9% of individuals (4,703) out of the total population between 25 and 64 years of age (5,412) are in the labor force, with 1.8% or 85 of them being unemployed. The group with the highest labor force participation rate are those with the educational attainment of college / associate degree, with 88.8% or 1,975 individuals in the labor force. Within the labor force, individuals with high school diploma education have the highest percentage of unemployment, with 4.0% or 36 of them being unemployed.
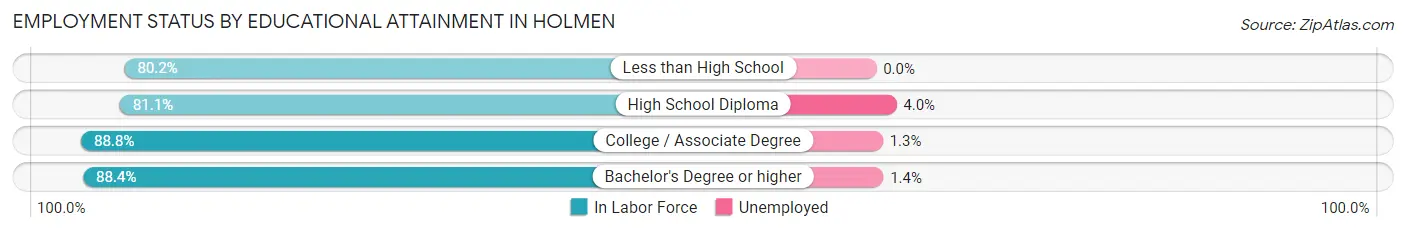
| Educational Attainment | In Labor Force | Unemployed |
| Less than High School | 101 (80.2%) | 0 (0.0%) |
| High School Diploma | 893 (81.1%) | 44 (4.0%) |
| College / Associate Degree | 1,975 (88.8%) | 29 (1.3%) |
| Bachelor's Degree or higher | 1,734 (88.4%) | 27 (1.4%) |
| Total | 4,703 (86.9%) | 97 (1.8%) |
Employment Occupations by Sex in Holmen
Management, Business, Science and Arts Occupations
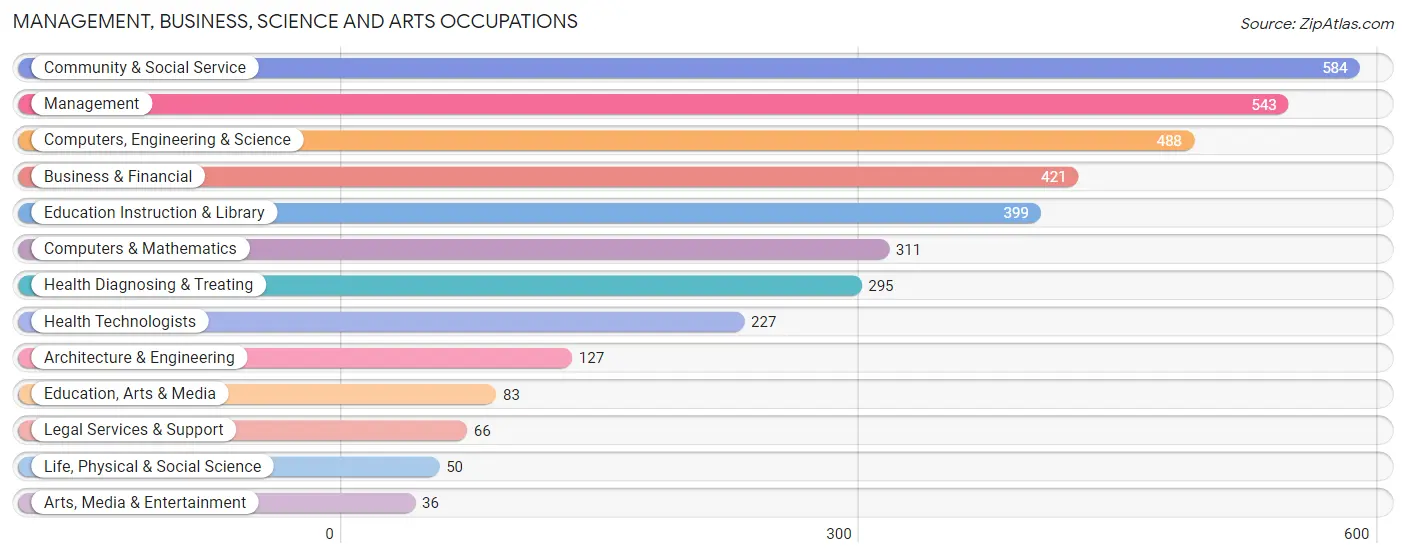
The most common Management, Business, Science and Arts occupations in Holmen are Community & Social Service (584 | 10.2%), Management (543 | 9.5%), Computers, Engineering & Science (488 | 8.5%), Business & Financial (421 | 7.3%), and Education Instruction & Library (399 | 7.0%).
Management, Business, Science and Arts Occupations by Sex
Within the Management, Business, Science and Arts occupations in Holmen, the most male-oriented occupations are Computers & Mathematics (73.6%), Architecture & Engineering (73.2%), and Computers, Engineering & Science (69.1%), while the most female-oriented occupations are Arts, Media & Entertainment (100.0%), Health Diagnosing & Treating (88.1%), and Education, Arts & Media (87.9%).
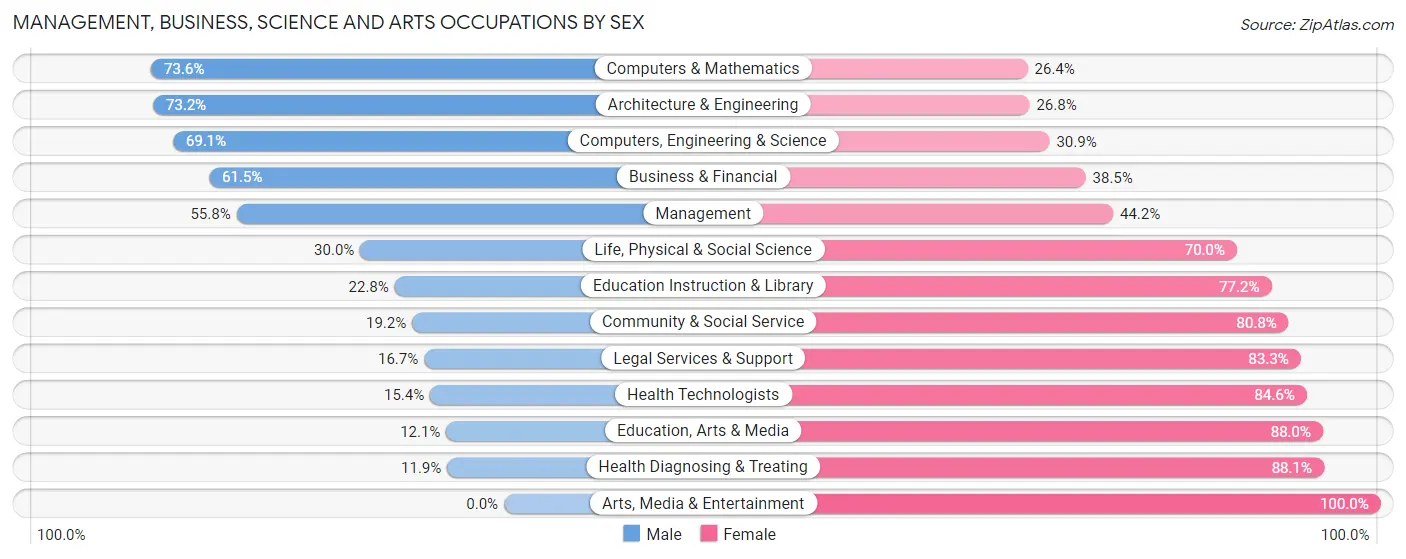
| Occupation | Male | Female |
| Management | 303 (55.8%) | 240 (44.2%) |
| Business & Financial | 259 (61.5%) | 162 (38.5%) |
| Computers, Engineering & Science | 337 (69.1%) | 151 (30.9%) |
| Computers & Mathematics | 229 (73.6%) | 82 (26.4%) |
| Architecture & Engineering | 93 (73.2%) | 34 (26.8%) |
| Life, Physical & Social Science | 15 (30.0%) | 35 (70.0%) |
| Community & Social Service | 112 (19.2%) | 472 (80.8%) |
| Education, Arts & Media | 10 (12.0%) | 73 (87.9%) |
| Legal Services & Support | 11 (16.7%) | 55 (83.3%) |
| Education Instruction & Library | 91 (22.8%) | 308 (77.2%) |
| Arts, Media & Entertainment | 0 (0.0%) | 36 (100.0%) |
| Health Diagnosing & Treating | 35 (11.9%) | 260 (88.1%) |
| Health Technologists | 35 (15.4%) | 192 (84.6%) |
| Total (Category) | 1,046 (44.9%) | 1,285 (55.1%) |
| Total (Overall) | 3,052 (53.1%) | 2,690 (46.9%) |
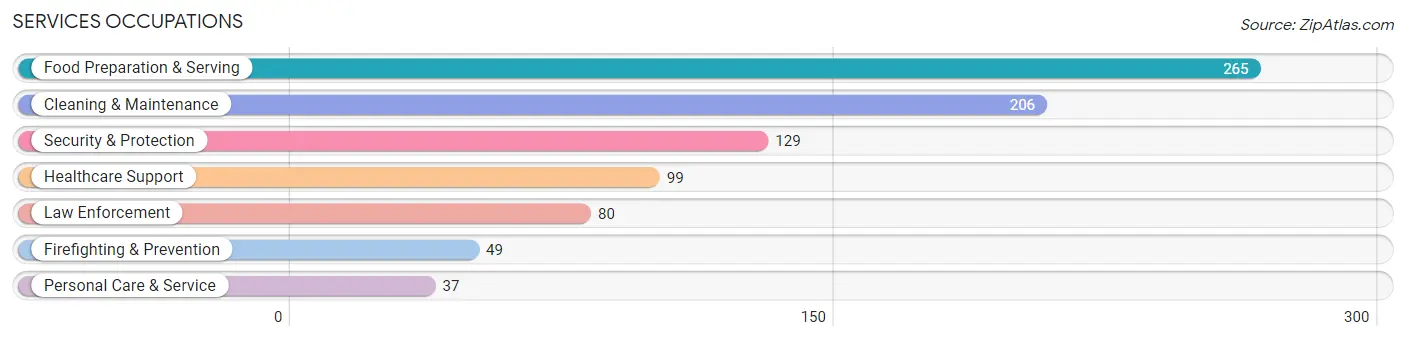
Services Occupations
The most common Services occupations in Holmen are Food Preparation & Serving (265 | 4.6%), Cleaning & Maintenance (206 | 3.6%), Security & Protection (129 | 2.2%), Healthcare Support (99 | 1.7%), and Law Enforcement (80 | 1.4%).
Services Occupations by Sex
Within the Services occupations in Holmen, the most male-oriented occupations are Law Enforcement (100.0%), Cleaning & Maintenance (100.0%), and Security & Protection (89.1%), while the most female-oriented occupations are Healthcare Support (100.0%), Personal Care & Service (100.0%), and Food Preparation & Serving (44.9%).
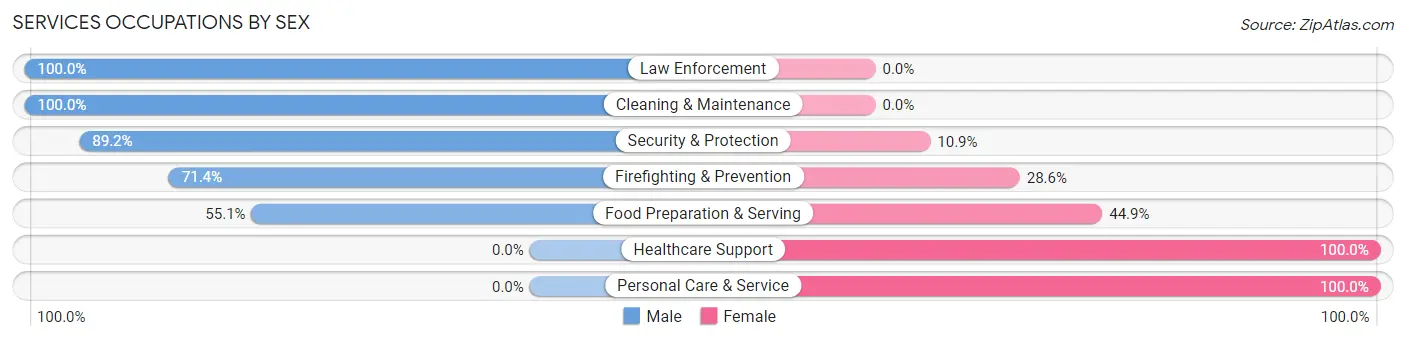
| Occupation | Male | Female |
| Healthcare Support | 0 (0.0%) | 99 (100.0%) |
| Security & Protection | 115 (89.1%) | 14 (10.8%) |
| Firefighting & Prevention | 35 (71.4%) | 14 (28.6%) |
| Law Enforcement | 80 (100.0%) | 0 (0.0%) |
| Food Preparation & Serving | 146 (55.1%) | 119 (44.9%) |
| Cleaning & Maintenance | 206 (100.0%) | 0 (0.0%) |
| Personal Care & Service | 0 (0.0%) | 37 (100.0%) |
| Total (Category) | 467 (63.4%) | 269 (36.5%) |
| Total (Overall) | 3,052 (53.1%) | 2,690 (46.9%) |
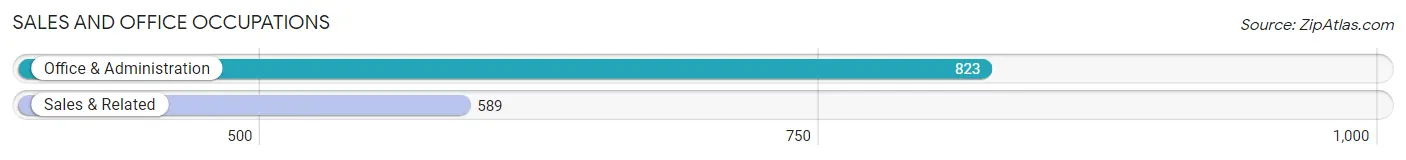
Sales and Office Occupations
The most common Sales and Office occupations in Holmen are Office & Administration (823 | 14.3%), and Sales & Related (589 | 10.3%).
Sales and Office Occupations by Sex
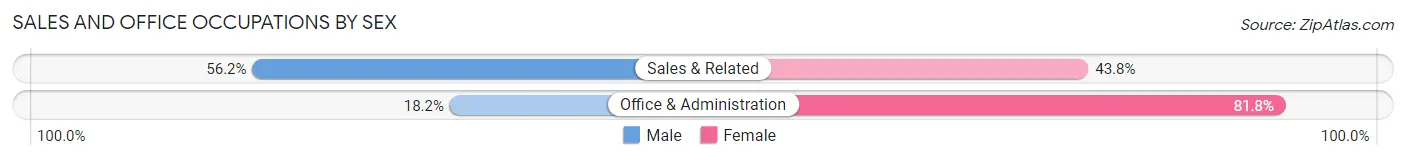
| Occupation | Male | Female |
| Sales & Related | 331 (56.2%) | 258 (43.8%) |
| Office & Administration | 150 (18.2%) | 673 (81.8%) |
| Total (Category) | 481 (34.1%) | 931 (65.9%) |
| Total (Overall) | 3,052 (53.1%) | 2,690 (46.9%) |
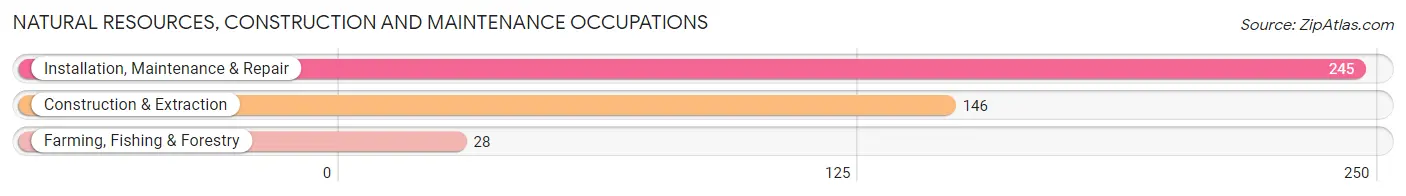
Natural Resources, Construction and Maintenance Occupations
The most common Natural Resources, Construction and Maintenance occupations in Holmen are Installation, Maintenance & Repair (245 | 4.3%), Construction & Extraction (146 | 2.5%), and Farming, Fishing & Forestry (28 | 0.5%).
Natural Resources, Construction and Maintenance Occupations by Sex
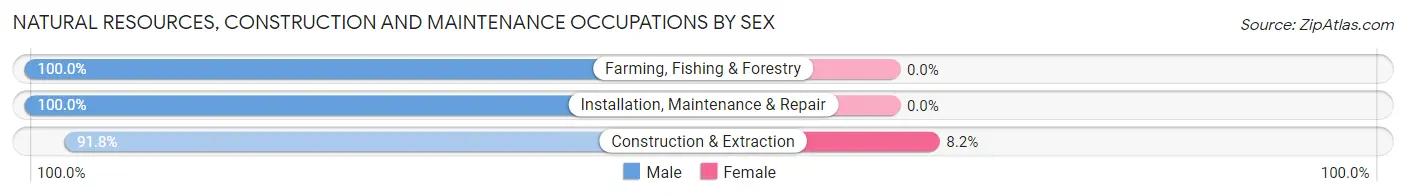
| Occupation | Male | Female |
| Farming, Fishing & Forestry | 28 (100.0%) | 0 (0.0%) |
| Construction & Extraction | 134 (91.8%) | 12 (8.2%) |
| Installation, Maintenance & Repair | 245 (100.0%) | 0 (0.0%) |
| Total (Category) | 407 (97.1%) | 12 (2.9%) |
| Total (Overall) | 3,052 (53.1%) | 2,690 (46.9%) |
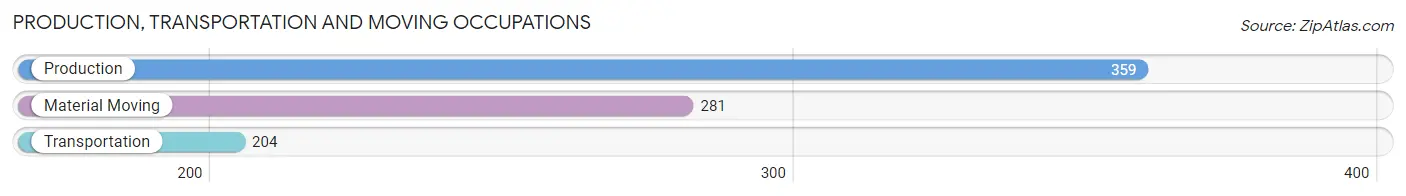
Production, Transportation and Moving Occupations
The most common Production, Transportation and Moving occupations in Holmen are Production (359 | 6.2%), Material Moving (281 | 4.9%), and Transportation (204 | 3.5%).
Production, Transportation and Moving Occupations by Sex
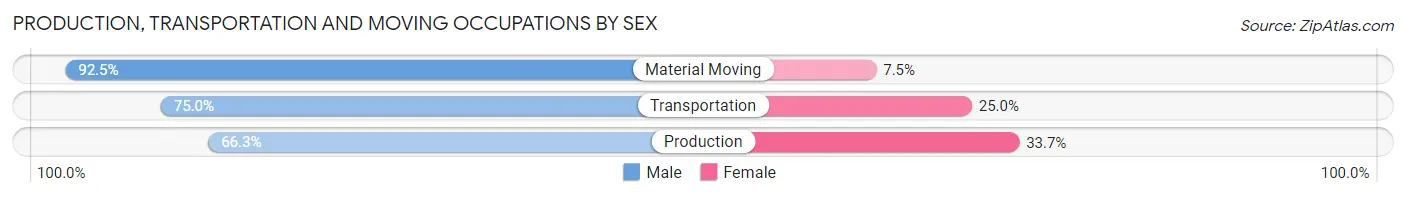
| Occupation | Male | Female |
| Production | 238 (66.3%) | 121 (33.7%) |
| Transportation | 153 (75.0%) | 51 (25.0%) |
| Material Moving | 260 (92.5%) | 21 (7.5%) |
| Total (Category) | 651 (77.1%) | 193 (22.9%) |
| Total (Overall) | 3,052 (53.1%) | 2,690 (46.9%) |
Employment Industries by Sex in Holmen
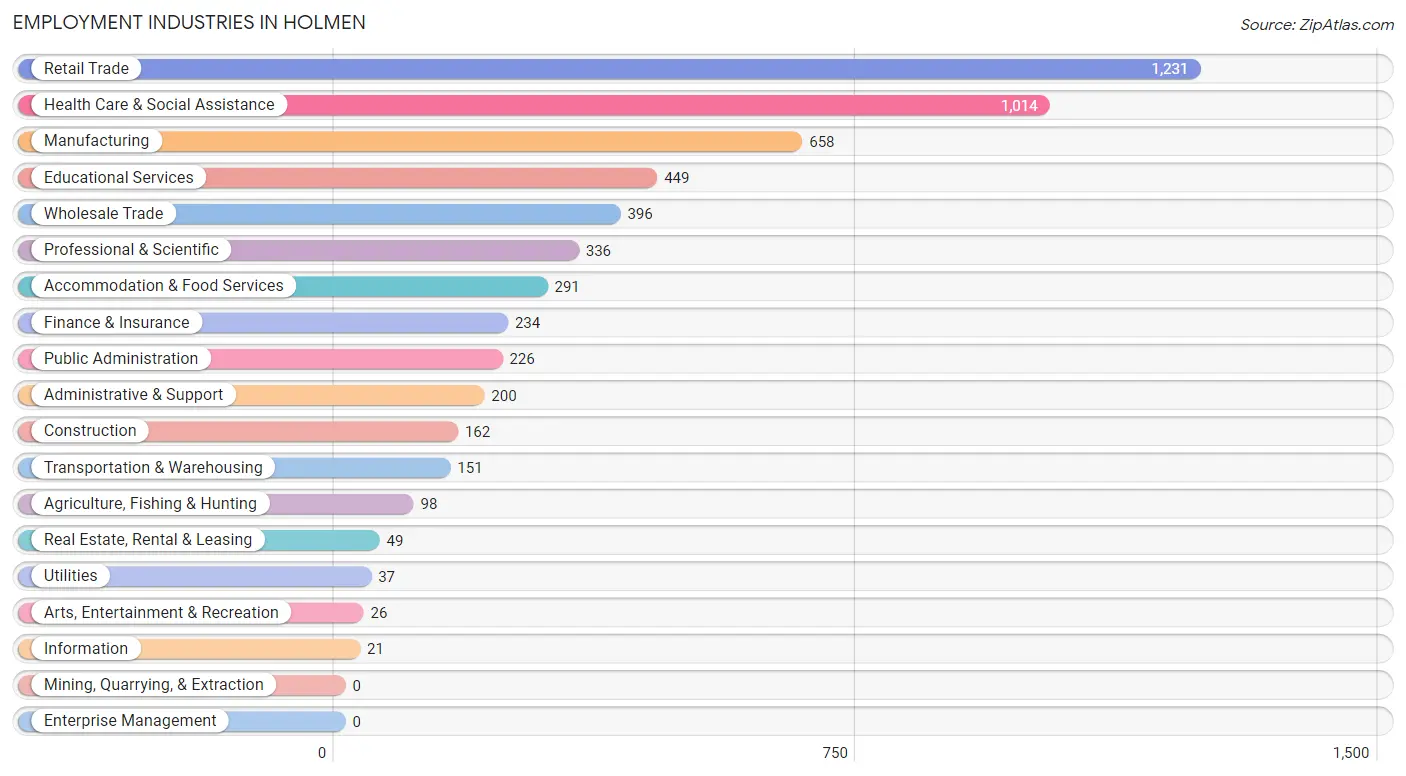
Employment Industries in Holmen
The major employment industries in Holmen include Retail Trade (1,231 | 21.4%), Health Care & Social Assistance (1,014 | 17.7%), Manufacturing (658 | 11.5%), Educational Services (449 | 7.8%), and Wholesale Trade (396 | 6.9%).
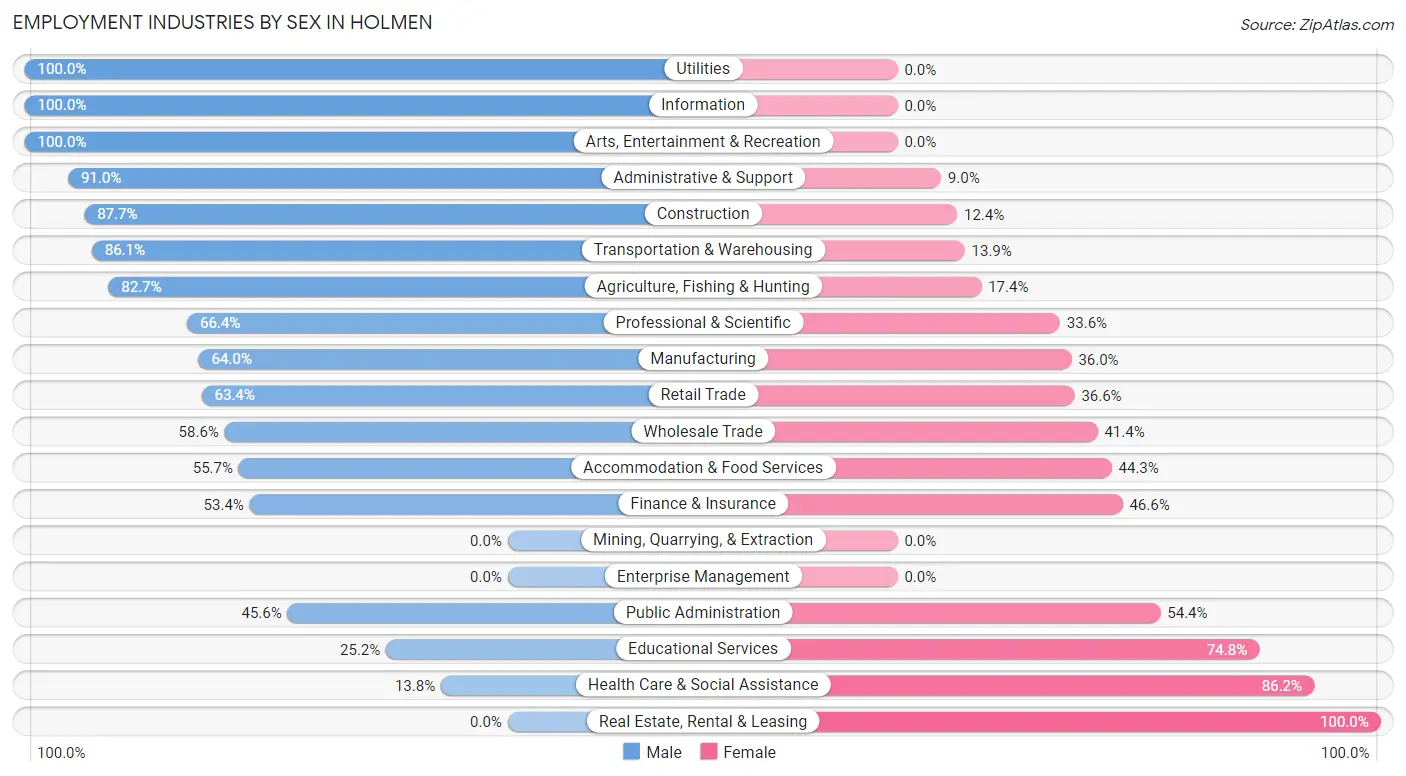
Employment Industries by Sex in Holmen
The Holmen industries that see more men than women are Utilities (100.0%), Information (100.0%), and Arts, Entertainment & Recreation (100.0%), whereas the industries that tend to have a higher number of women are Real Estate, Rental & Leasing (100.0%), Health Care & Social Assistance (86.2%), and Educational Services (74.8%).
| Industry | Male | Female |
| Agriculture, Fishing & Hunting | 81 (82.7%) | 17 (17.3%) |
| Mining, Quarrying, & Extraction | 0 (0.0%) | 0 (0.0%) |
| Construction | 142 (87.6%) | 20 (12.3%) |
| Manufacturing | 421 (64.0%) | 237 (36.0%) |
| Wholesale Trade | 232 (58.6%) | 164 (41.4%) |
| Retail Trade | 780 (63.4%) | 451 (36.6%) |
| Transportation & Warehousing | 130 (86.1%) | 21 (13.9%) |
| Utilities | 37 (100.0%) | 0 (0.0%) |
| Information | 21 (100.0%) | 0 (0.0%) |
| Finance & Insurance | 125 (53.4%) | 109 (46.6%) |
| Real Estate, Rental & Leasing | 0 (0.0%) | 49 (100.0%) |
| Professional & Scientific | 223 (66.4%) | 113 (33.6%) |
| Enterprise Management | 0 (0.0%) | 0 (0.0%) |
| Administrative & Support | 182 (91.0%) | 18 (9.0%) |
| Educational Services | 113 (25.2%) | 336 (74.8%) |
| Health Care & Social Assistance | 140 (13.8%) | 874 (86.2%) |
| Arts, Entertainment & Recreation | 26 (100.0%) | 0 (0.0%) |
| Accommodation & Food Services | 162 (55.7%) | 129 (44.3%) |
| Public Administration | 103 (45.6%) | 123 (54.4%) |
| Total | 3,052 (53.1%) | 2,690 (46.9%) |
Education in Holmen
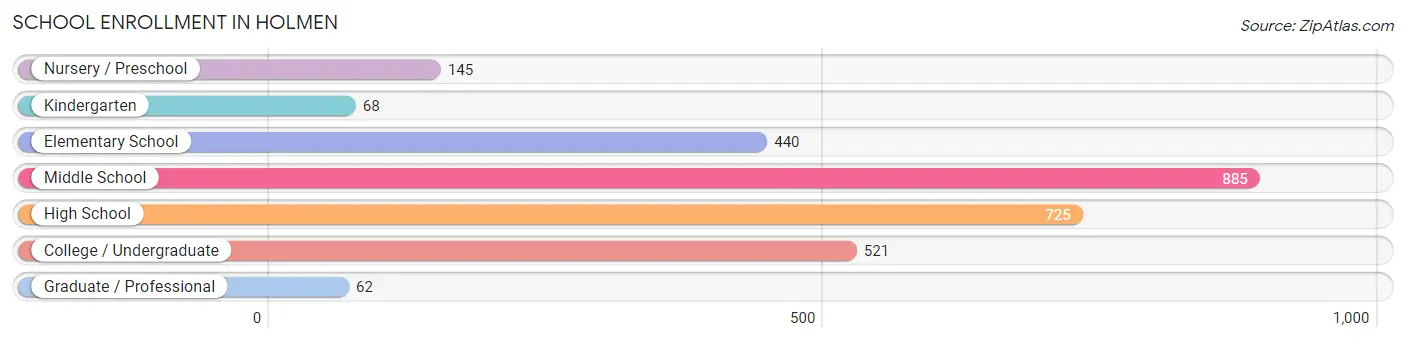
School Enrollment in Holmen
The most common levels of schooling among the 2,846 students in Holmen are middle school (885 | 31.1%), high school (725 | 25.5%), and college / undergraduate (521 | 18.3%).
| School Level | # Students | % Students |
| Nursery / Preschool | 145 | 5.1% |
| Kindergarten | 68 | 2.4% |
| Elementary School | 440 | 15.5% |
| Middle School | 885 | 31.1% |
| High School | 725 | 25.5% |
| College / Undergraduate | 521 | 18.3% |
| Graduate / Professional | 62 | 2.2% |
| Total | 2,846 | 100.0% |
School Enrollment by Age by Funding Source in Holmen
Out of a total of 2,846 students who are enrolled in schools in Holmen, 262 (9.2%) attend a private institution, while the remaining 2,584 (90.8%) are enrolled in public schools. The age group of 3 to 4 year olds has the highest likelihood of being enrolled in private schools, with 18 (25.7% in the age bracket) enrolled. Conversely, the age group of 20 to 24 year olds has the lowest likelihood of being enrolled in a private school, with 281 (100.0% in the age bracket) attending a public institution.
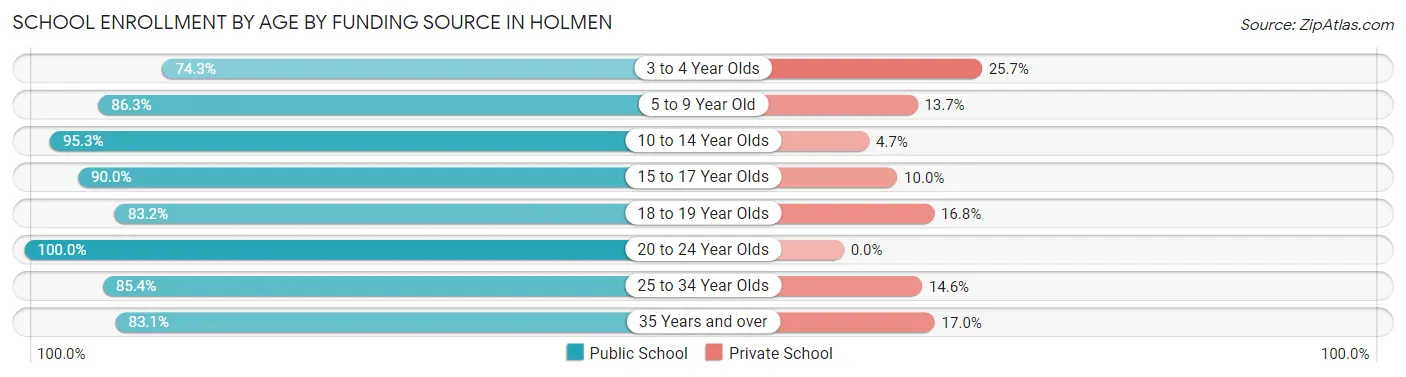
| Age Bracket | Public School | Private School |
| 3 to 4 Year Olds | 52 (74.3%) | 18 (25.7%) |
| 5 to 9 Year Old | 471 (86.3%) | 75 (13.7%) |
| 10 to 14 Year Olds | 864 (95.3%) | 43 (4.7%) |
| 15 to 17 Year Olds | 606 (90.0%) | 67 (10.0%) |
| 18 to 19 Year Olds | 89 (83.2%) | 18 (16.8%) |
| 20 to 24 Year Olds | 281 (100.0%) | 0 (0.0%) |
| 25 to 34 Year Olds | 123 (85.4%) | 21 (14.6%) |
| 35 Years and over | 98 (83.1%) | 20 (17.0%) |
| Total | 2,584 (90.8%) | 262 (9.2%) |
Educational Attainment by Field of Study in Holmen
Business (544 | 22.7%), science & technology (311 | 13.0%), education (244 | 10.2%), computers & mathematics (201 | 8.4%), and arts & humanities (191 | 8.0%) are the most common fields of study among 2,402 individuals in Holmen who have obtained a bachelor's degree or higher.
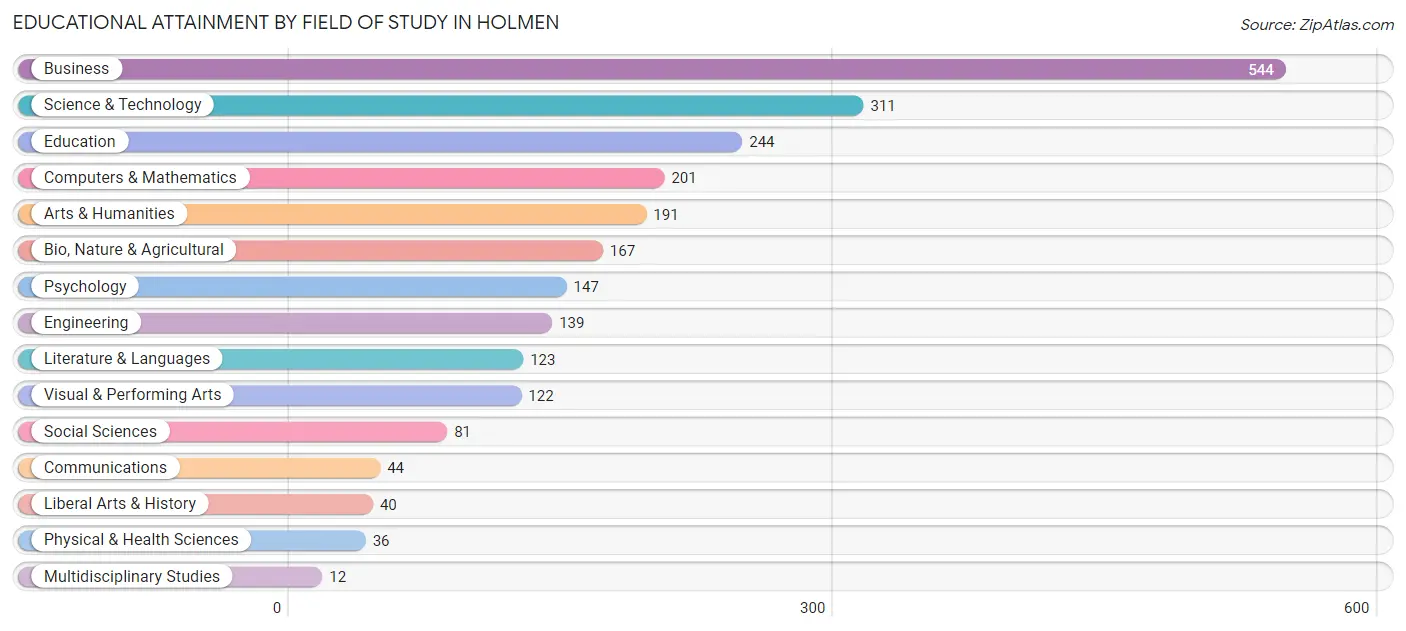
| Field of Study | # Graduates | % Graduates |
| Computers & Mathematics | 201 | 8.4% |
| Bio, Nature & Agricultural | 167 | 7.0% |
| Physical & Health Sciences | 36 | 1.5% |
| Psychology | 147 | 6.1% |
| Social Sciences | 81 | 3.4% |
| Engineering | 139 | 5.8% |
| Multidisciplinary Studies | 12 | 0.5% |
| Science & Technology | 311 | 13.0% |
| Business | 544 | 22.7% |
| Education | 244 | 10.2% |
| Literature & Languages | 123 | 5.1% |
| Liberal Arts & History | 40 | 1.7% |
| Visual & Performing Arts | 122 | 5.1% |
| Communications | 44 | 1.8% |
| Arts & Humanities | 191 | 8.0% |
| Total | 2,402 | 100.0% |
Transportation & Commute in Holmen
Vehicle Availability by Sex in Holmen
The most prevalent vehicle ownership categories in Holmen are males with 2 vehicles (1,176, accounting for 38.5%) and females with 2 vehicles (1,159, making up 44.0%).
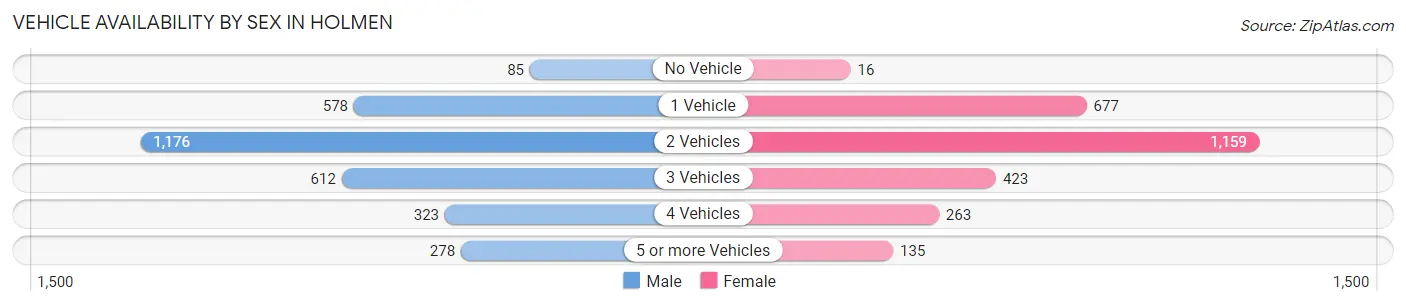
| Vehicles Available | Male | Female |
| No Vehicle | 85 (2.8%) | 16 (0.6%) |
| 1 Vehicle | 578 (18.9%) | 677 (25.3%) |
| 2 Vehicles | 1,176 (38.5%) | 1,159 (43.4%) |
| 3 Vehicles | 612 (20.1%) | 423 (15.8%) |
| 4 Vehicles | 323 (10.6%) | 263 (9.8%) |
| 5 or more Vehicles | 278 (9.1%) | 135 (5.1%) |
| Total | 3,052 (100.0%) | 2,673 (100.0%) |
Commute Time in Holmen
The most frequently occuring commute durations in Holmen are 15 to 19 minutes (1,013 commuters, 20.2%), 20 to 24 minutes (912 commuters, 18.2%), and 10 to 14 minutes (780 commuters, 15.5%).
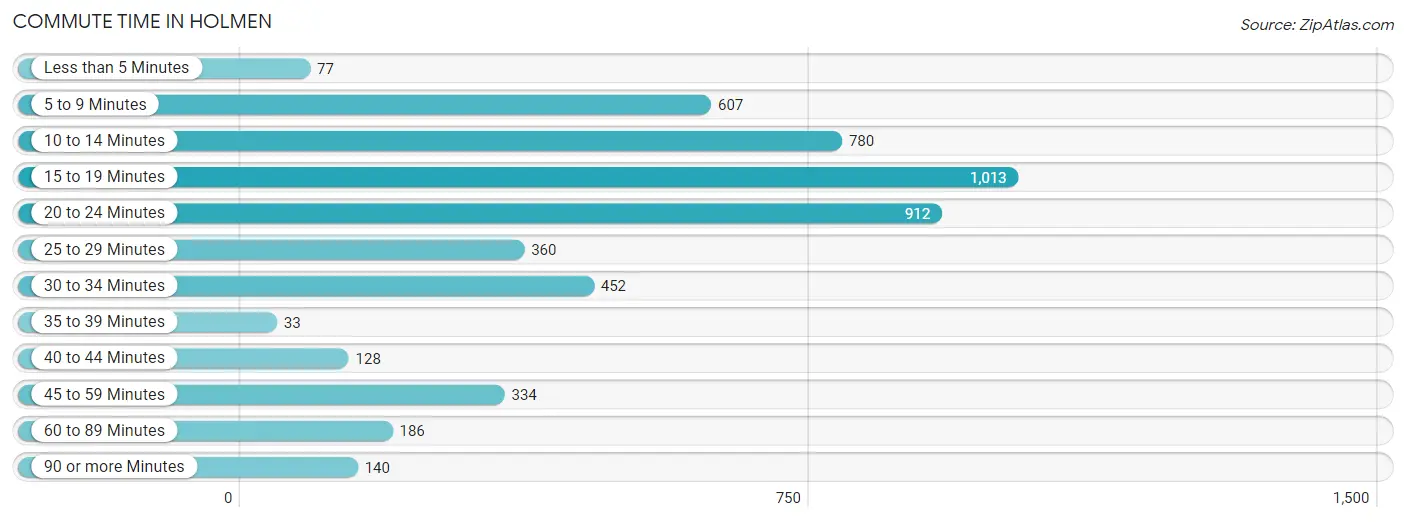
| Commute Time | # Commuters | % Commuters |
| Less than 5 Minutes | 77 | 1.5% |
| 5 to 9 Minutes | 607 | 12.1% |
| 10 to 14 Minutes | 780 | 15.5% |
| 15 to 19 Minutes | 1,013 | 20.2% |
| 20 to 24 Minutes | 912 | 18.2% |
| 25 to 29 Minutes | 360 | 7.2% |
| 30 to 34 Minutes | 452 | 9.0% |
| 35 to 39 Minutes | 33 | 0.7% |
| 40 to 44 Minutes | 128 | 2.5% |
| 45 to 59 Minutes | 334 | 6.7% |
| 60 to 89 Minutes | 186 | 3.7% |
| 90 or more Minutes | 140 | 2.8% |
Commute Time by Sex in Holmen
The most common commute times in Holmen are 15 to 19 minutes (585 commuters, 21.5%) for males and 10 to 14 minutes (433 commuters, 18.8%) for females.
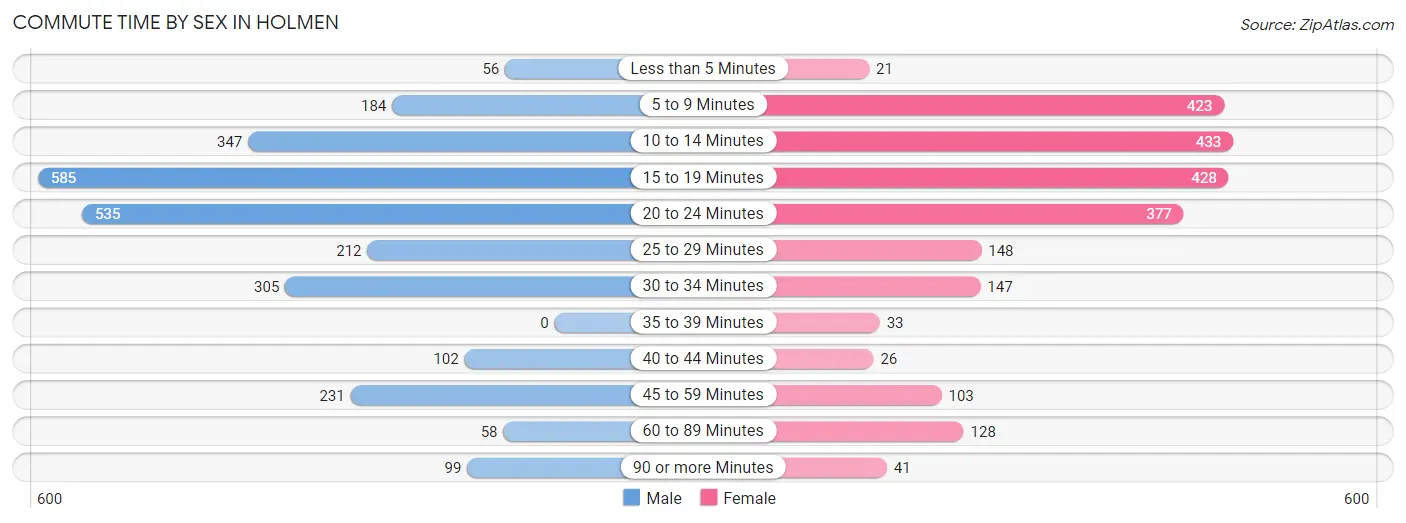
| Commute Time | Male | Female |
| Less than 5 Minutes | 56 (2.1%) | 21 (0.9%) |
| 5 to 9 Minutes | 184 (6.8%) | 423 (18.3%) |
| 10 to 14 Minutes | 347 (12.8%) | 433 (18.8%) |
| 15 to 19 Minutes | 585 (21.5%) | 428 (18.5%) |
| 20 to 24 Minutes | 535 (19.7%) | 377 (16.3%) |
| 25 to 29 Minutes | 212 (7.8%) | 148 (6.4%) |
| 30 to 34 Minutes | 305 (11.2%) | 147 (6.4%) |
| 35 to 39 Minutes | 0 (0.0%) | 33 (1.4%) |
| 40 to 44 Minutes | 102 (3.8%) | 26 (1.1%) |
| 45 to 59 Minutes | 231 (8.5%) | 103 (4.5%) |
| 60 to 89 Minutes | 58 (2.1%) | 128 (5.6%) |
| 90 or more Minutes | 99 (3.6%) | 41 (1.8%) |
Time of Departure to Work by Sex in Holmen
The most frequent times of departure to work in Holmen are 7:00 AM to 7:29 AM (447, 16.5%) for males and 7:30 AM to 7:59 AM (601, 26.0%) for females.
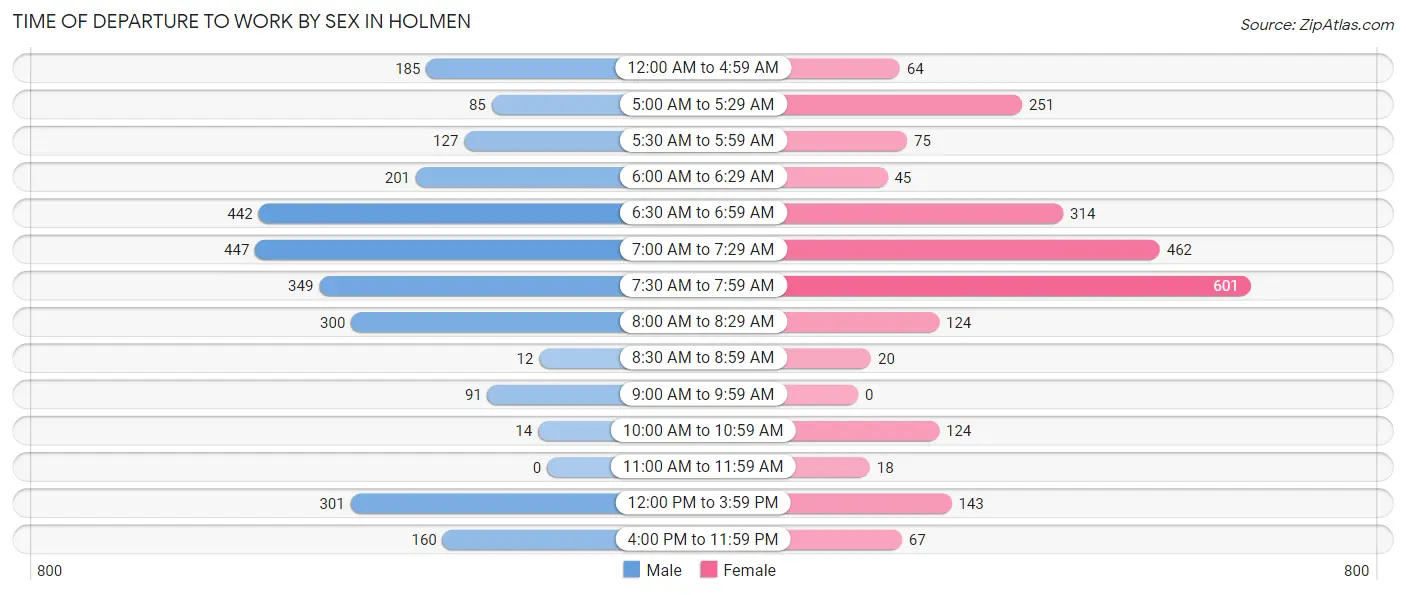
| Time of Departure | Male | Female |
| 12:00 AM to 4:59 AM | 185 (6.8%) | 64 (2.8%) |
| 5:00 AM to 5:29 AM | 85 (3.1%) | 251 (10.9%) |
| 5:30 AM to 5:59 AM | 127 (4.7%) | 75 (3.3%) |
| 6:00 AM to 6:29 AM | 201 (7.4%) | 45 (1.9%) |
| 6:30 AM to 6:59 AM | 442 (16.3%) | 314 (13.6%) |
| 7:00 AM to 7:29 AM | 447 (16.5%) | 462 (20.0%) |
| 7:30 AM to 7:59 AM | 349 (12.9%) | 601 (26.0%) |
| 8:00 AM to 8:29 AM | 300 (11.1%) | 124 (5.4%) |
| 8:30 AM to 8:59 AM | 12 (0.4%) | 20 (0.9%) |
| 9:00 AM to 9:59 AM | 91 (3.4%) | 0 (0.0%) |
| 10:00 AM to 10:59 AM | 14 (0.5%) | 124 (5.4%) |
| 11:00 AM to 11:59 AM | 0 (0.0%) | 18 (0.8%) |
| 12:00 PM to 3:59 PM | 301 (11.1%) | 143 (6.2%) |
| 4:00 PM to 11:59 PM | 160 (5.9%) | 67 (2.9%) |
| Total | 2,714 (100.0%) | 2,308 (100.0%) |
Housing Occupancy in Holmen
Occupancy by Ownership in Holmen
Of the total 4,343 dwellings in Holmen, owner-occupied units account for 2,830 (65.2%), while renter-occupied units make up 1,513 (34.8%).
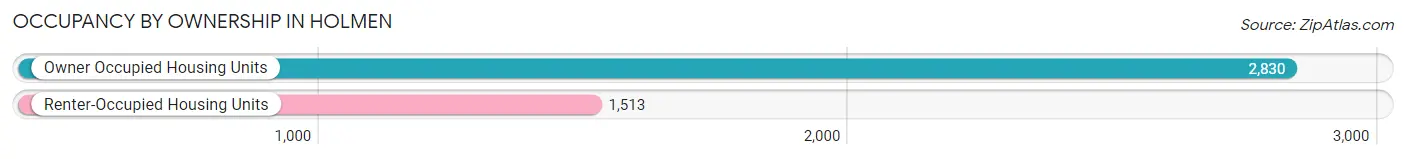
| Occupancy | # Housing Units | % Housing Units |
| Owner Occupied Housing Units | 2,830 | 65.2% |
| Renter-Occupied Housing Units | 1,513 | 34.8% |
| Total Occupied Housing Units | 4,343 | 100.0% |
Occupancy by Household Size in Holmen
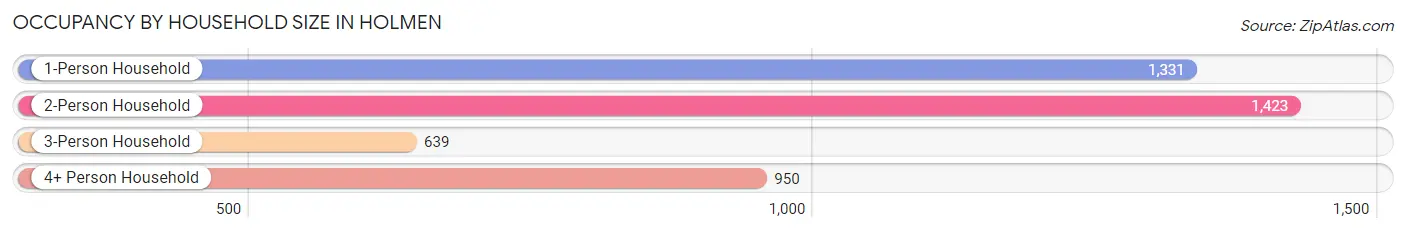
| Household Size | # Housing Units | % Housing Units |
| 1-Person Household | 1,331 | 30.6% |
| 2-Person Household | 1,423 | 32.8% |
| 3-Person Household | 639 | 14.7% |
| 4+ Person Household | 950 | 21.9% |
| Total Housing Units | 4,343 | 100.0% |
Occupancy by Ownership by Household Size in Holmen
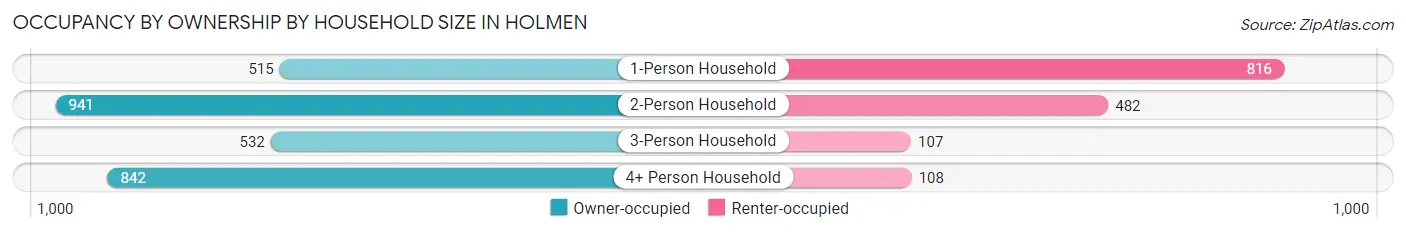
| Household Size | Owner-occupied | Renter-occupied |
| 1-Person Household | 515 (38.7%) | 816 (61.3%) |
| 2-Person Household | 941 (66.1%) | 482 (33.9%) |
| 3-Person Household | 532 (83.3%) | 107 (16.7%) |
| 4+ Person Household | 842 (88.6%) | 108 (11.4%) |
| Total Housing Units | 2,830 (65.2%) | 1,513 (34.8%) |
Occupancy by Educational Attainment in Holmen
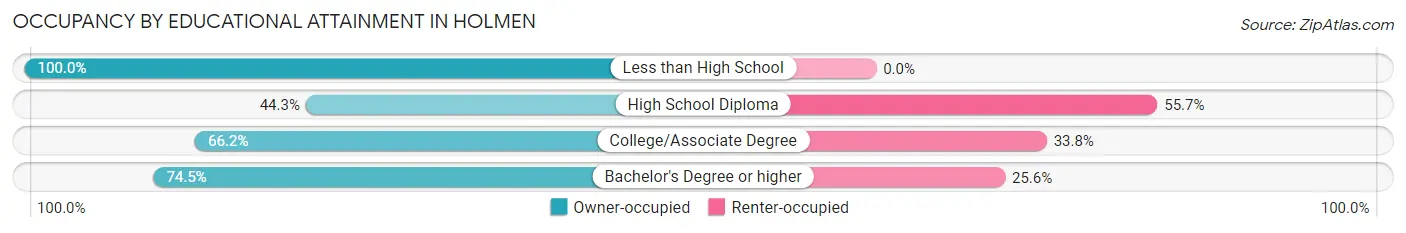
| Household Size | Owner-occupied | Renter-occupied |
| Less than High School | 86 (100.0%) | 0 (0.0%) |
| High School Diploma | 405 (44.3%) | 510 (55.7%) |
| College/Associate Degree | 1,194 (66.2%) | 610 (33.8%) |
| Bachelor's Degree or higher | 1,145 (74.5%) | 393 (25.6%) |
Occupancy by Age of Householder in Holmen
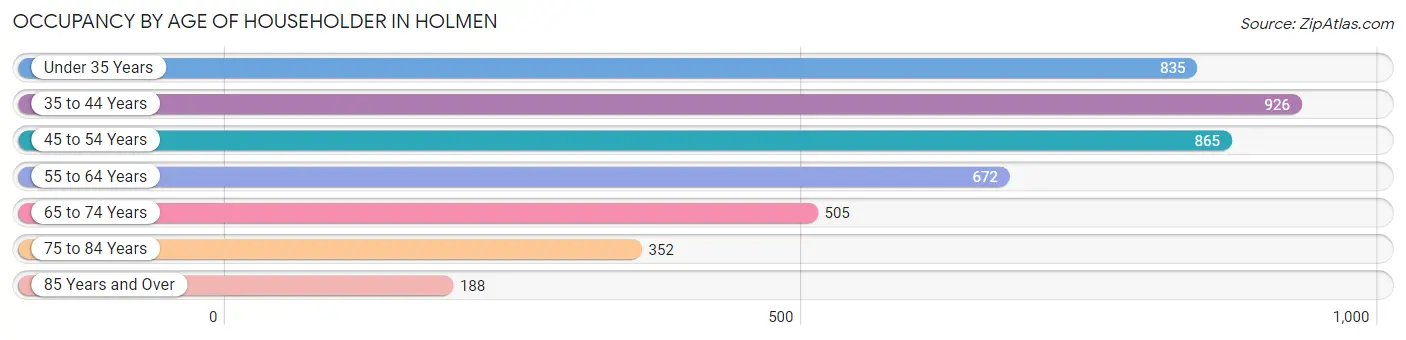
| Age Bracket | # Households | % Households |
| Under 35 Years | 835 | 19.2% |
| 35 to 44 Years | 926 | 21.3% |
| 45 to 54 Years | 865 | 19.9% |
| 55 to 64 Years | 672 | 15.5% |
| 65 to 74 Years | 505 | 11.6% |
| 75 to 84 Years | 352 | 8.1% |
| 85 Years and Over | 188 | 4.3% |
| Total | 4,343 | 100.0% |
Housing Finances in Holmen
Median Income by Occupancy in Holmen
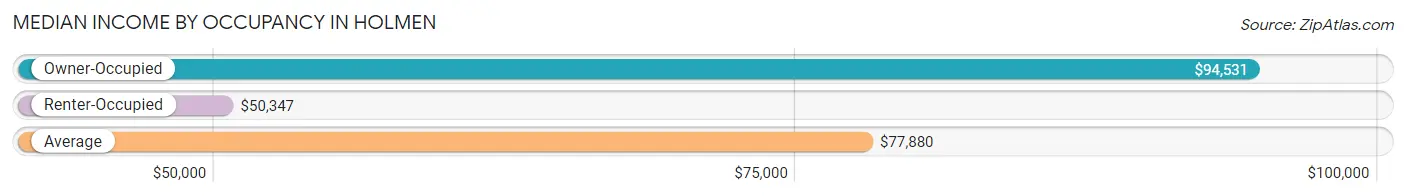
| Occupancy Type | # Households | Median Income |
| Owner-Occupied | 2,830 (65.2%) | $94,531 |
| Renter-Occupied | 1,513 (34.8%) | $50,347 |
| Average | 4,343 (100.0%) | $77,880 |
Occupancy by Householder Income Bracket in Holmen
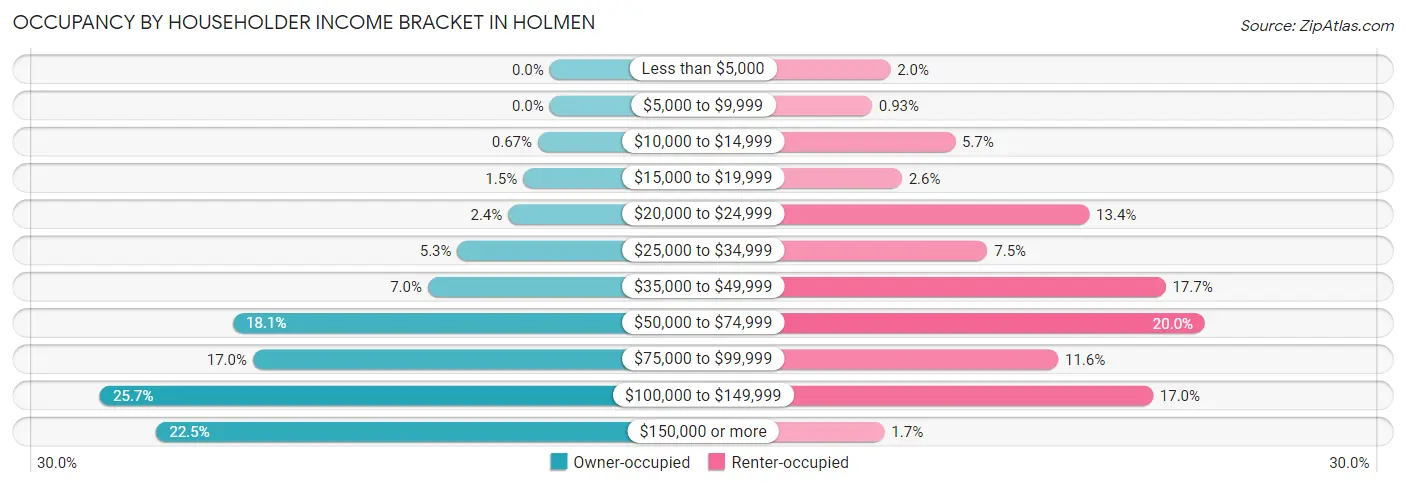
| Income Bracket | Owner-occupied | Renter-occupied |
| Less than $5,000 | 0 (0.0%) | 30 (2.0%) |
| $5,000 to $9,999 | 0 (0.0%) | 14 (0.9%) |
| $10,000 to $14,999 | 19 (0.7%) | 86 (5.7%) |
| $15,000 to $19,999 | 43 (1.5%) | 40 (2.6%) |
| $20,000 to $24,999 | 67 (2.4%) | 202 (13.4%) |
| $25,000 to $34,999 | 149 (5.3%) | 114 (7.5%) |
| $35,000 to $49,999 | 197 (7.0%) | 268 (17.7%) |
| $50,000 to $74,999 | 512 (18.1%) | 302 (20.0%) |
| $75,000 to $99,999 | 480 (17.0%) | 175 (11.6%) |
| $100,000 to $149,999 | 727 (25.7%) | 257 (17.0%) |
| $150,000 or more | 636 (22.5%) | 25 (1.7%) |
| Total | 2,830 (100.0%) | 1,513 (100.0%) |
Monthly Housing Cost Tiers in Holmen
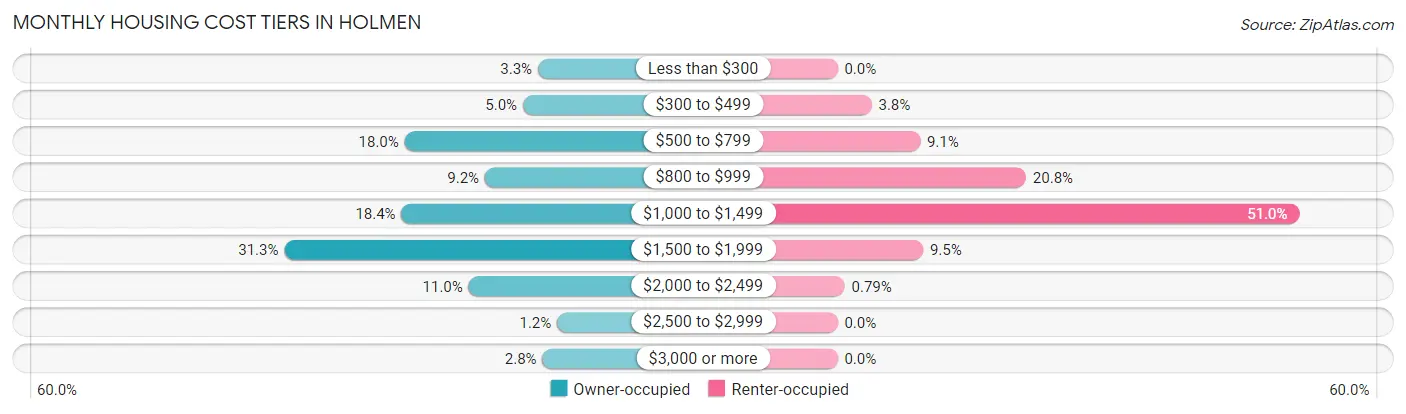
| Monthly Cost | Owner-occupied | Renter-occupied |
| Less than $300 | 93 (3.3%) | 0 (0.0%) |
| $300 to $499 | 140 (5.0%) | 57 (3.8%) |
| $500 to $799 | 510 (18.0%) | 138 (9.1%) |
| $800 to $999 | 259 (9.1%) | 315 (20.8%) |
| $1,000 to $1,499 | 520 (18.4%) | 772 (51.0%) |
| $1,500 to $1,999 | 886 (31.3%) | 143 (9.5%) |
| $2,000 to $2,499 | 310 (11.0%) | 12 (0.8%) |
| $2,500 to $2,999 | 33 (1.2%) | 0 (0.0%) |
| $3,000 or more | 79 (2.8%) | 0 (0.0%) |
| Total | 2,830 (100.0%) | 1,513 (100.0%) |
Physical Housing Characteristics in Holmen
Housing Structures in Holmen
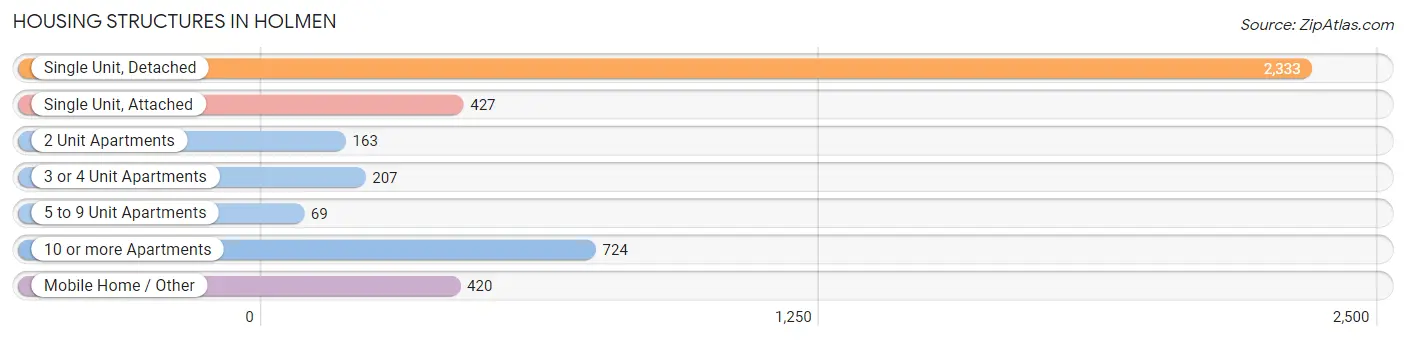
| Structure Type | # Housing Units | % Housing Units |
| Single Unit, Detached | 2,333 | 53.7% |
| Single Unit, Attached | 427 | 9.8% |
| 2 Unit Apartments | 163 | 3.7% |
| 3 or 4 Unit Apartments | 207 | 4.8% |
| 5 to 9 Unit Apartments | 69 | 1.6% |
| 10 or more Apartments | 724 | 16.7% |
| Mobile Home / Other | 420 | 9.7% |
| Total | 4,343 | 100.0% |
Housing Structures by Occupancy in Holmen
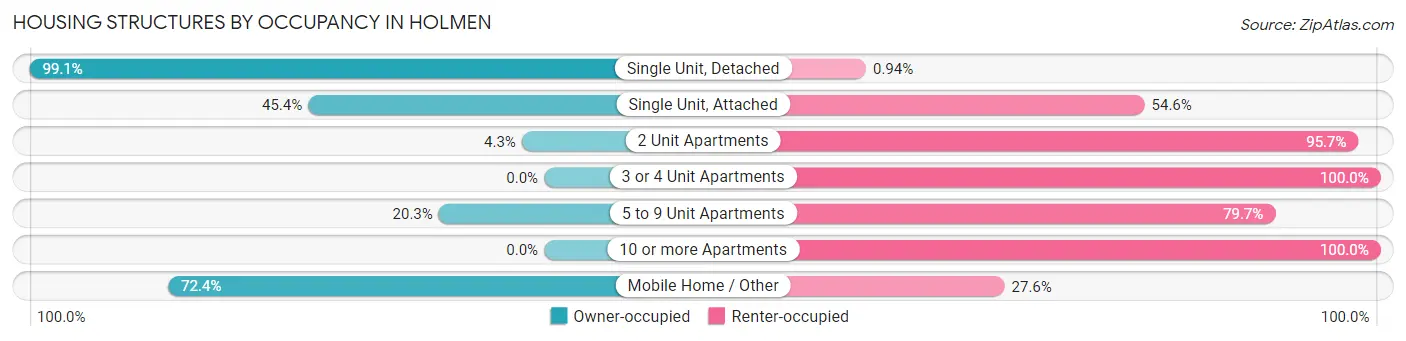
| Structure Type | Owner-occupied | Renter-occupied |
| Single Unit, Detached | 2,311 (99.1%) | 22 (0.9%) |
| Single Unit, Attached | 194 (45.4%) | 233 (54.6%) |
| 2 Unit Apartments | 7 (4.3%) | 156 (95.7%) |
| 3 or 4 Unit Apartments | 0 (0.0%) | 207 (100.0%) |
| 5 to 9 Unit Apartments | 14 (20.3%) | 55 (79.7%) |
| 10 or more Apartments | 0 (0.0%) | 724 (100.0%) |
| Mobile Home / Other | 304 (72.4%) | 116 (27.6%) |
| Total | 2,830 (65.2%) | 1,513 (34.8%) |
Housing Structures by Number of Rooms in Holmen
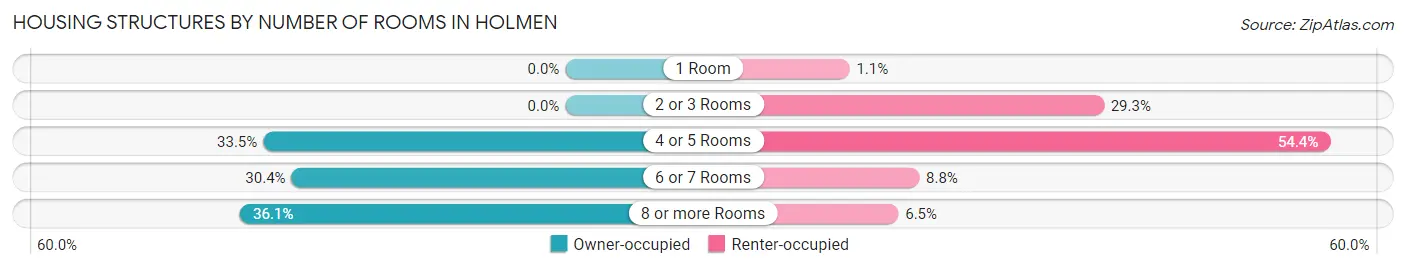
| Number of Rooms | Owner-occupied | Renter-occupied |
| 1 Room | 0 (0.0%) | 16 (1.1%) |
| 2 or 3 Rooms | 0 (0.0%) | 443 (29.3%) |
| 4 or 5 Rooms | 949 (33.5%) | 823 (54.4%) |
| 6 or 7 Rooms | 860 (30.4%) | 133 (8.8%) |
| 8 or more Rooms | 1,021 (36.1%) | 98 (6.5%) |
| Total | 2,830 (100.0%) | 1,513 (100.0%) |
Housing Structure by Heating Type in Holmen
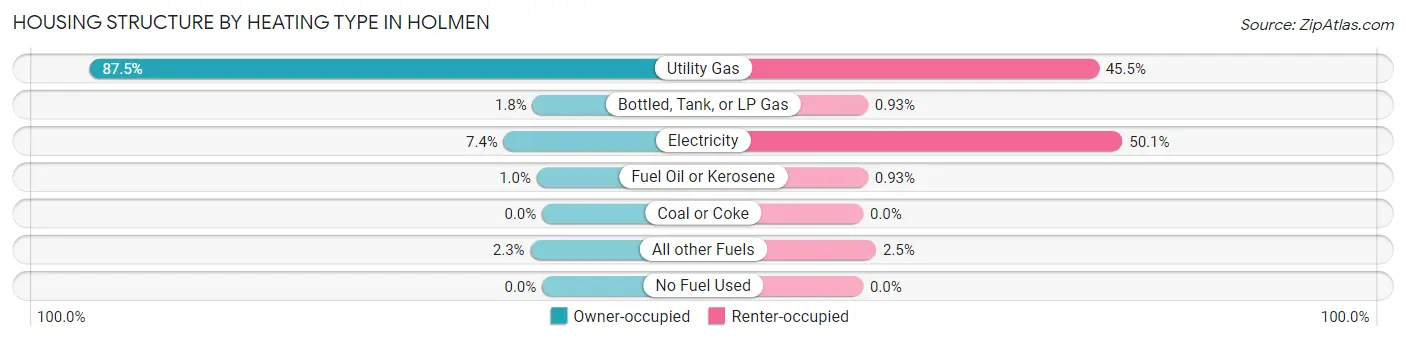
| Heating Type | Owner-occupied | Renter-occupied |
| Utility Gas | 2,475 (87.5%) | 689 (45.5%) |
| Bottled, Tank, or LP Gas | 52 (1.8%) | 14 (0.9%) |
| Electricity | 210 (7.4%) | 758 (50.1%) |
| Fuel Oil or Kerosene | 29 (1.0%) | 14 (0.9%) |
| Coal or Coke | 0 (0.0%) | 0 (0.0%) |
| All other Fuels | 64 (2.3%) | 38 (2.5%) |
| No Fuel Used | 0 (0.0%) | 0 (0.0%) |
| Total | 2,830 (100.0%) | 1,513 (100.0%) |
Household Vehicle Usage in Holmen
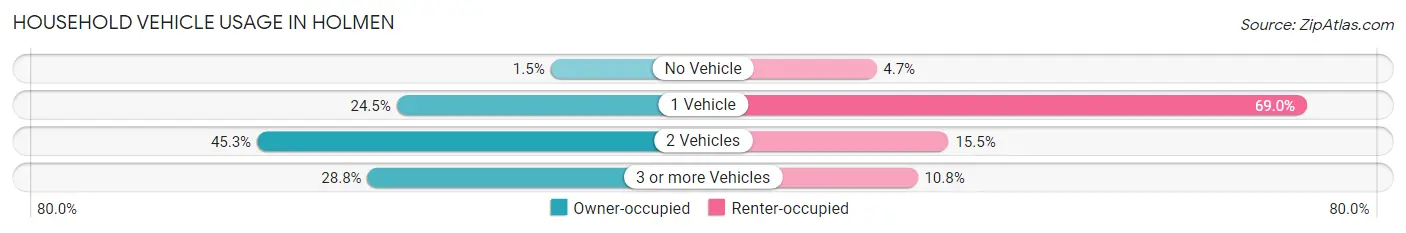
| Vehicles per Household | Owner-occupied | Renter-occupied |
| No Vehicle | 41 (1.5%) | 71 (4.7%) |
| 1 Vehicle | 692 (24.4%) | 1,044 (69.0%) |
| 2 Vehicles | 1,282 (45.3%) | 234 (15.5%) |
| 3 or more Vehicles | 815 (28.8%) | 164 (10.8%) |
| Total | 2,830 (100.0%) | 1,513 (100.0%) |
Real Estate & Mortgages in Holmen
Real Estate and Mortgage Overview in Holmen
| Characteristic | Without Mortgage | With Mortgage |
| Housing Units | 963 | 1,867 |
| Median Property Value | $233,000 | $267,000 |
| Median Household Income | $76,875 | $519 |
| Monthly Housing Costs | $597 | $79 |
| Real Estate Taxes | $3,531 | $0 |
Property Value by Mortgage Status in Holmen
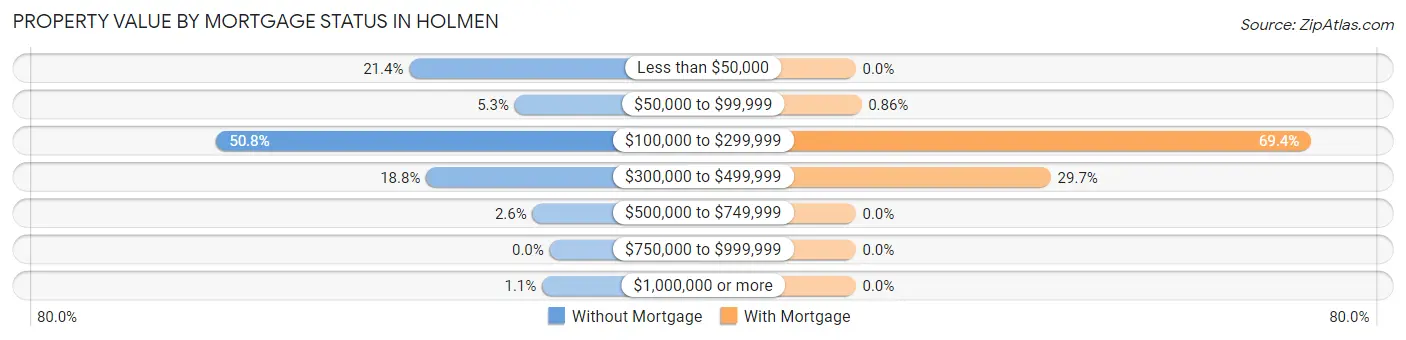
| Property Value | Without Mortgage | With Mortgage |
| Less than $50,000 | 206 (21.4%) | 0 (0.0%) |
| $50,000 to $99,999 | 51 (5.3%) | 16 (0.9%) |
| $100,000 to $299,999 | 489 (50.8%) | 1,296 (69.4%) |
| $300,000 to $499,999 | 181 (18.8%) | 555 (29.7%) |
| $500,000 to $749,999 | 25 (2.6%) | 0 (0.0%) |
| $750,000 to $999,999 | 0 (0.0%) | 0 (0.0%) |
| $1,000,000 or more | 11 (1.1%) | 0 (0.0%) |
| Total | 963 (100.0%) | 1,867 (100.0%) |
Household Income by Mortgage Status in Holmen
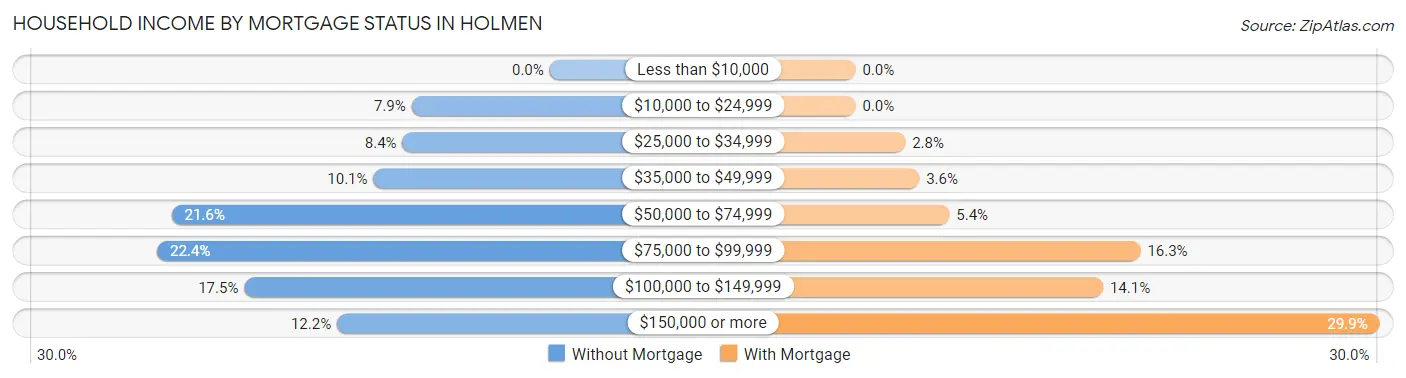
| Household Income | Without Mortgage | With Mortgage |
| Less than $10,000 | 0 (0.0%) | 0 (0.0%) |
| $10,000 to $24,999 | 76 (7.9%) | 0 (0.0%) |
| $25,000 to $34,999 | 81 (8.4%) | 53 (2.8%) |
| $35,000 to $49,999 | 97 (10.1%) | 68 (3.6%) |
| $50,000 to $74,999 | 208 (21.6%) | 100 (5.4%) |
| $75,000 to $99,999 | 216 (22.4%) | 304 (16.3%) |
| $100,000 to $149,999 | 168 (17.4%) | 264 (14.1%) |
| $150,000 or more | 117 (12.1%) | 559 (29.9%) |
| Total | 963 (100.0%) | 1,867 (100.0%) |
Property Value to Household Income Ratio in Holmen
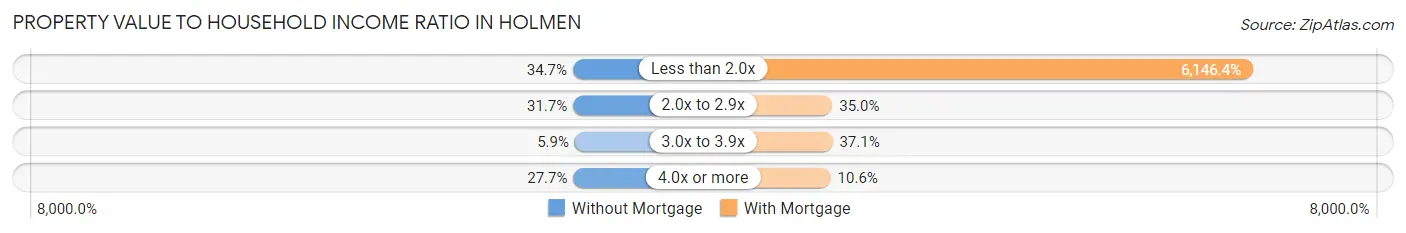
| Value-to-Income Ratio | Without Mortgage | With Mortgage |
| Less than 2.0x | 334 (34.7%) | 114,754 (6,146.4%) |
| 2.0x to 2.9x | 305 (31.7%) | 654 (35.0%) |
| 3.0x to 3.9x | 57 (5.9%) | 692 (37.1%) |
| 4.0x or more | 267 (27.7%) | 198 (10.6%) |
| Total | 963 (100.0%) | 1,867 (100.0%) |
Real Estate Taxes by Mortgage Status in Holmen
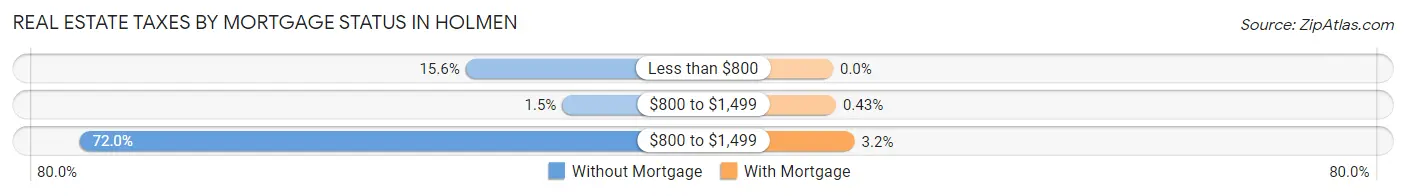
| Property Taxes | Without Mortgage | With Mortgage |
| Less than $800 | 150 (15.6%) | 0 (0.0%) |
| $800 to $1,499 | 14 (1.5%) | 8 (0.4%) |
| $800 to $1,499 | 693 (72.0%) | 59 (3.2%) |
| Total | 963 (100.0%) | 1,867 (100.0%) |
Health & Disability in Holmen
Health Insurance Coverage by Age in Holmen
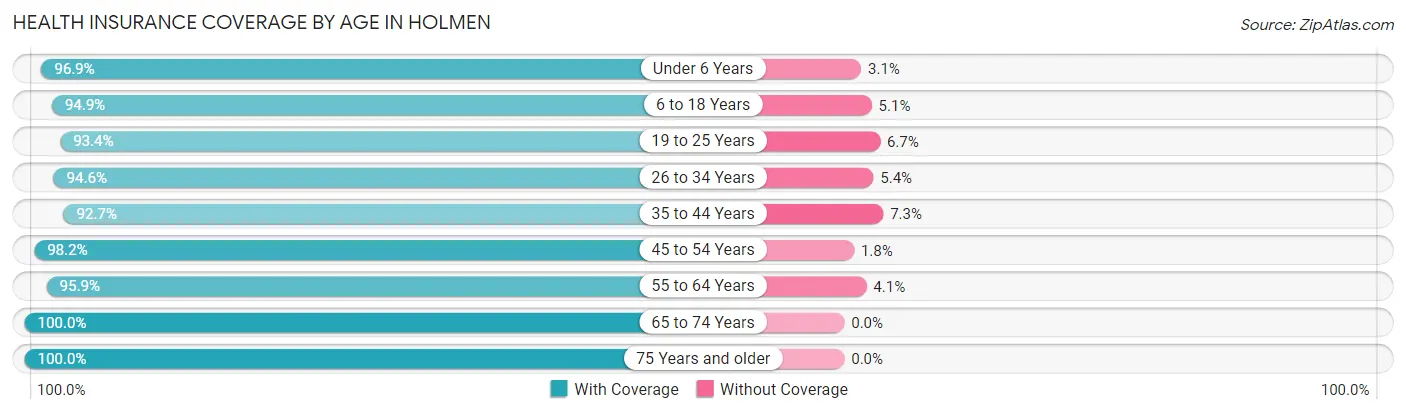
| Age Bracket | With Coverage | Without Coverage |
| Under 6 Years | 650 (96.9%) | 21 (3.1%) |
| 6 to 18 Years | 2,029 (94.9%) | 109 (5.1%) |
| 19 to 25 Years | 983 (93.3%) | 70 (6.7%) |
| 26 to 34 Years | 994 (94.6%) | 57 (5.4%) |
| 35 to 44 Years | 1,430 (92.7%) | 112 (7.3%) |
| 45 to 54 Years | 1,473 (98.2%) | 27 (1.8%) |
| 55 to 64 Years | 1,140 (95.9%) | 49 (4.1%) |
| 65 to 74 Years | 842 (100.0%) | 0 (0.0%) |
| 75 Years and older | 809 (100.0%) | 0 (0.0%) |
| Total | 10,350 (95.9%) | 445 (4.1%) |
Health Insurance Coverage by Citizenship Status in Holmen
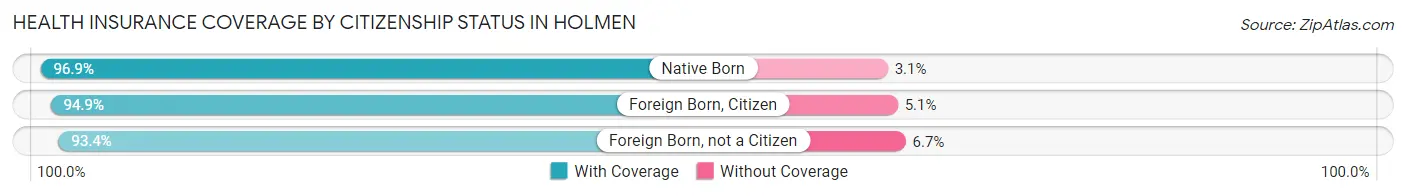
| Citizenship Status | With Coverage | Without Coverage |
| Native Born | 650 (96.9%) | 21 (3.1%) |
| Foreign Born, Citizen | 2,029 (94.9%) | 109 (5.1%) |
| Foreign Born, not a Citizen | 983 (93.3%) | 70 (6.7%) |
Health Insurance Coverage by Household Income in Holmen
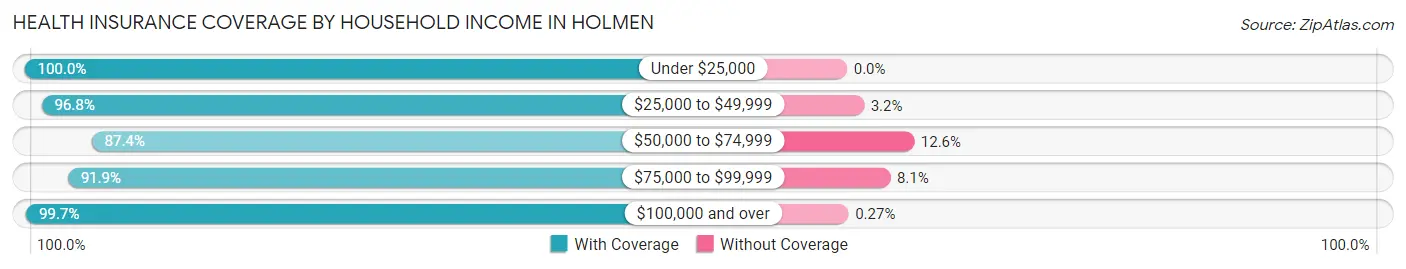
| Household Income | With Coverage | Without Coverage |
| Under $25,000 | 538 (100.0%) | 0 (0.0%) |
| $25,000 to $49,999 | 1,251 (96.8%) | 41 (3.2%) |
| $50,000 to $74,999 | 1,636 (87.4%) | 235 (12.6%) |
| $75,000 to $99,999 | 1,764 (91.9%) | 155 (8.1%) |
| $100,000 and over | 5,132 (99.7%) | 14 (0.3%) |
Public vs Private Health Insurance Coverage by Age in Holmen
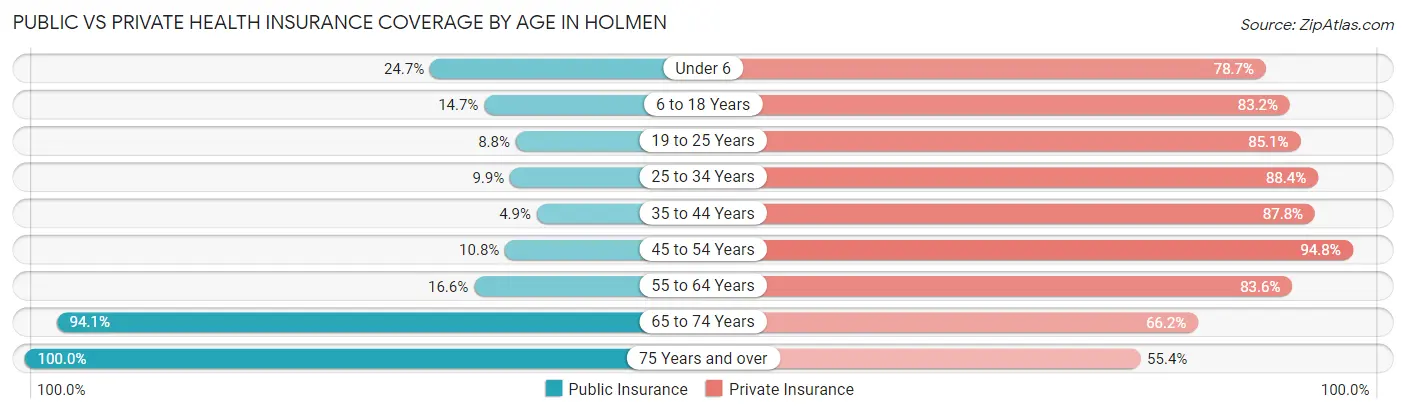
| Age Bracket | Public Insurance | Private Insurance |
| Under 6 | 166 (24.7%) | 528 (78.7%) |
| 6 to 18 Years | 314 (14.7%) | 1,778 (83.2%) |
| 19 to 25 Years | 93 (8.8%) | 896 (85.1%) |
| 25 to 34 Years | 104 (9.9%) | 929 (88.4%) |
| 35 to 44 Years | 76 (4.9%) | 1,354 (87.8%) |
| 45 to 54 Years | 162 (10.8%) | 1,422 (94.8%) |
| 55 to 64 Years | 197 (16.6%) | 994 (83.6%) |
| 65 to 74 Years | 792 (94.1%) | 557 (66.1%) |
| 75 Years and over | 809 (100.0%) | 448 (55.4%) |
| Total | 2,713 (25.1%) | 8,906 (82.5%) |
Disability Status by Sex by Age in Holmen
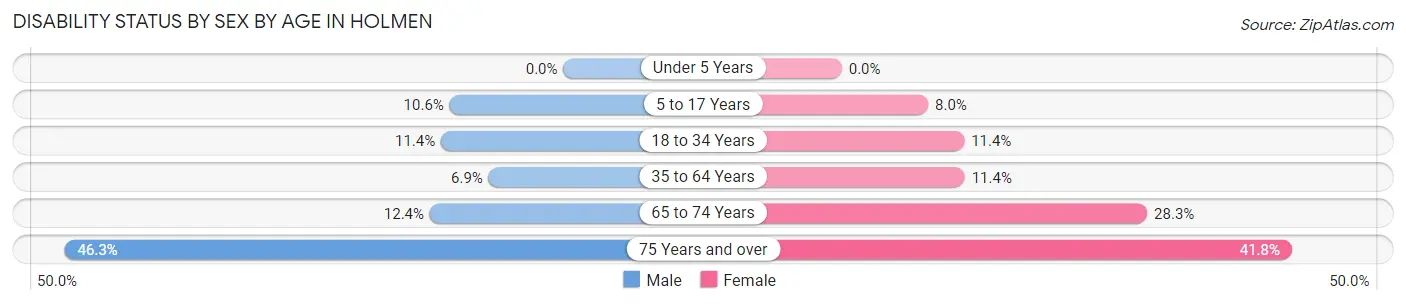
| Age Bracket | Male | Female |
| Under 5 Years | 0 (0.0%) | 0 (0.0%) |
| 5 to 17 Years | 144 (10.5%) | 65 (8.0%) |
| 18 to 34 Years | 133 (11.4%) | 113 (11.4%) |
| 35 to 64 Years | 142 (6.9%) | 249 (11.4%) |
| 65 to 74 Years | 44 (12.4%) | 138 (28.3%) |
| 75 Years and over | 175 (46.3%) | 180 (41.8%) |
Disability Class by Sex by Age in Holmen
Disability Class: Hearing Difficulty
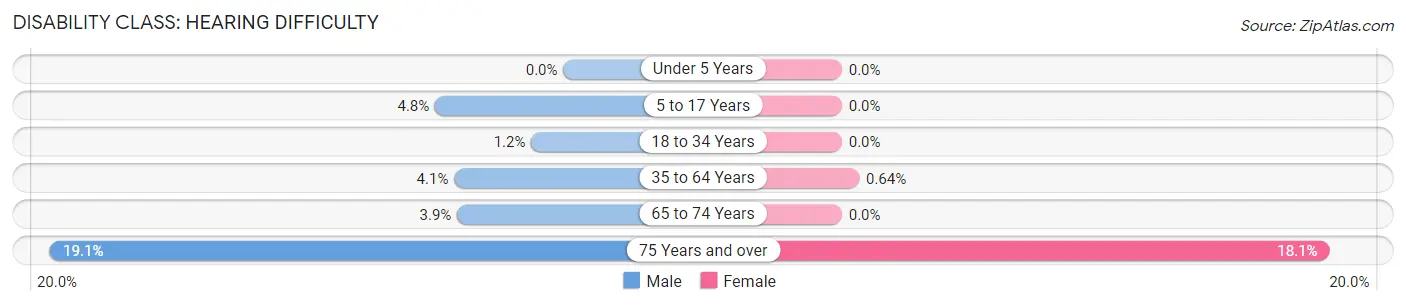
| Age Bracket | Male | Female |
| Under 5 Years | 0 (0.0%) | 0 (0.0%) |
| 5 to 17 Years | 65 (4.8%) | 0 (0.0%) |
| 18 to 34 Years | 14 (1.2%) | 0 (0.0%) |
| 35 to 64 Years | 83 (4.1%) | 14 (0.6%) |
| 65 to 74 Years | 14 (3.9%) | 0 (0.0%) |
| 75 Years and over | 72 (19.1%) | 78 (18.1%) |
Disability Class: Vision Difficulty
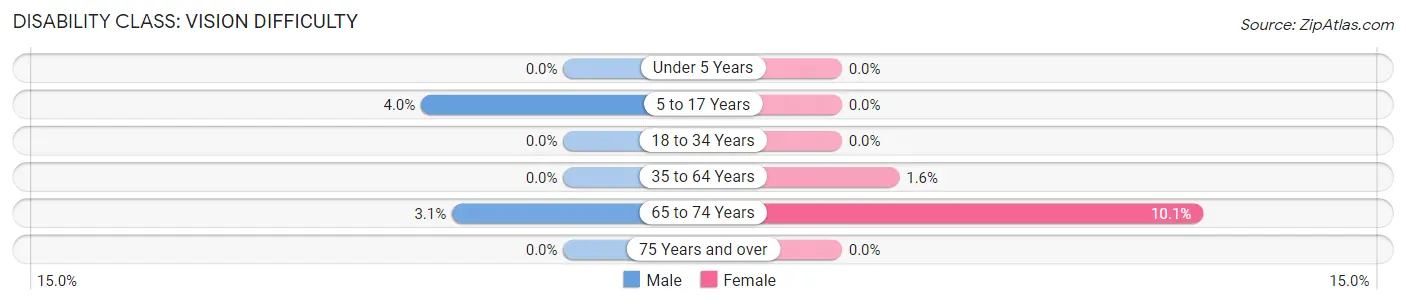
| Age Bracket | Male | Female |
| Under 5 Years | 0 (0.0%) | 0 (0.0%) |
| 5 to 17 Years | 54 (4.0%) | 0 (0.0%) |
| 18 to 34 Years | 0 (0.0%) | 0 (0.0%) |
| 35 to 64 Years | 0 (0.0%) | 35 (1.6%) |
| 65 to 74 Years | 11 (3.1%) | 49 (10.1%) |
| 75 Years and over | 0 (0.0%) | 0 (0.0%) |
Disability Class: Cognitive Difficulty
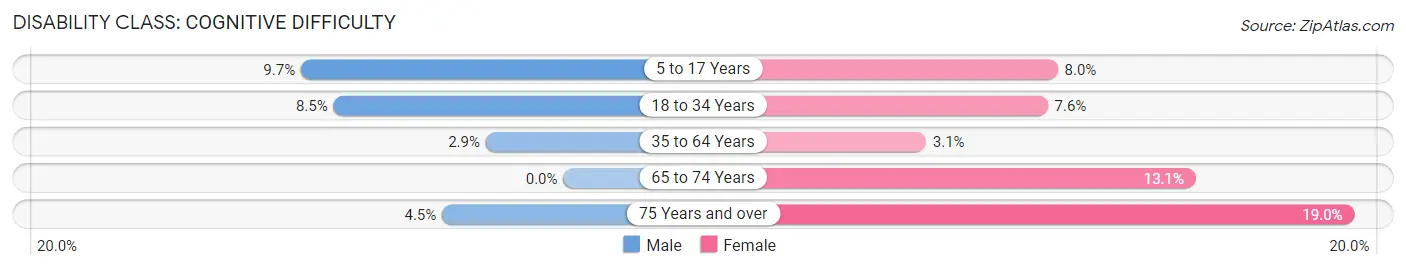
| Age Bracket | Male | Female |
| 5 to 17 Years | 133 (9.7%) | 65 (8.0%) |
| 18 to 34 Years | 100 (8.5%) | 76 (7.6%) |
| 35 to 64 Years | 59 (2.9%) | 68 (3.1%) |
| 65 to 74 Years | 0 (0.0%) | 64 (13.1%) |
| 75 Years and over | 17 (4.5%) | 82 (19.0%) |
Disability Class: Ambulatory Difficulty
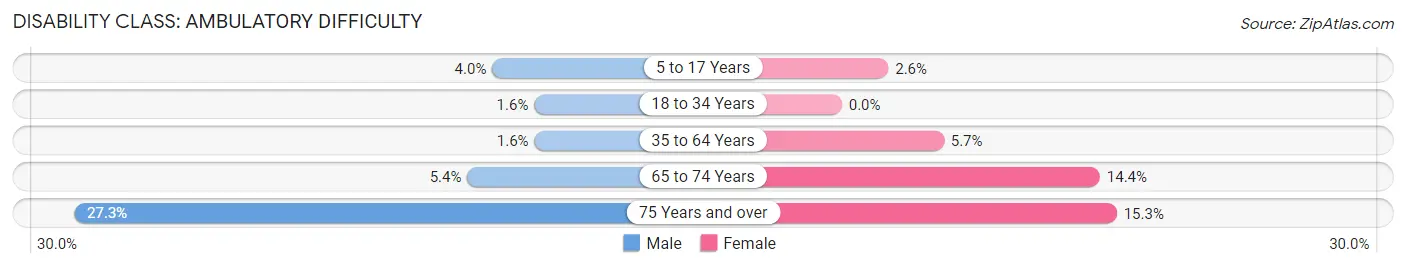
| Age Bracket | Male | Female |
| 5 to 17 Years | 54 (4.0%) | 21 (2.6%) |
| 18 to 34 Years | 19 (1.6%) | 0 (0.0%) |
| 35 to 64 Years | 33 (1.6%) | 124 (5.7%) |
| 65 to 74 Years | 19 (5.3%) | 70 (14.4%) |
| 75 Years and over | 103 (27.3%) | 66 (15.3%) |
Disability Class: Self-Care Difficulty
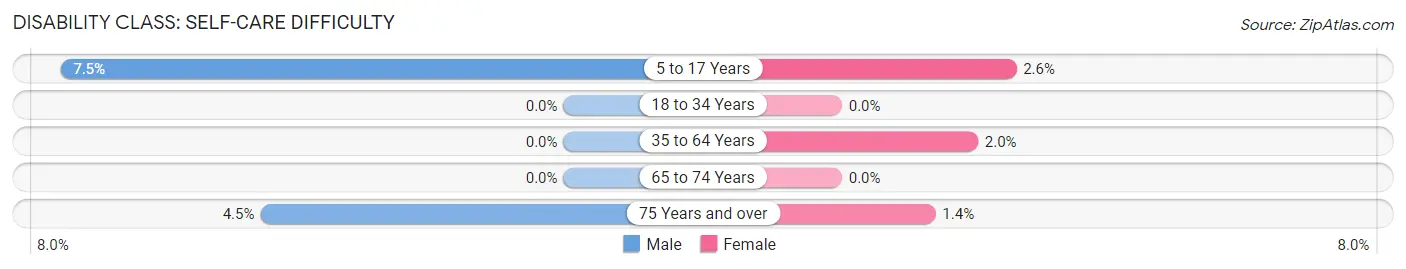
| Age Bracket | Male | Female |
| 5 to 17 Years | 102 (7.5%) | 21 (2.6%) |
| 18 to 34 Years | 0 (0.0%) | 0 (0.0%) |
| 35 to 64 Years | 0 (0.0%) | 44 (2.0%) |
| 65 to 74 Years | 0 (0.0%) | 0 (0.0%) |
| 75 Years and over | 17 (4.5%) | 6 (1.4%) |
Technology Access in Holmen
Computing Device Access in Holmen
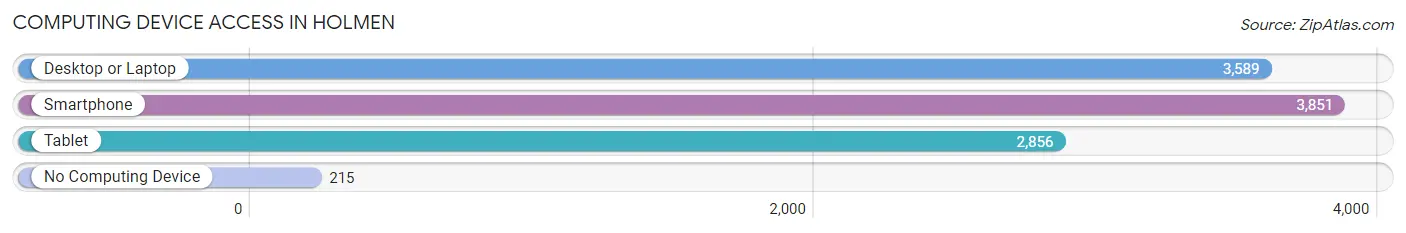
| Device Type | # Households | % Households |
| Desktop or Laptop | 3,589 | 82.6% |
| Smartphone | 3,851 | 88.7% |
| Tablet | 2,856 | 65.8% |
| No Computing Device | 215 | 5.0% |
| Total | 4,343 | 100.0% |
Internet Access in Holmen
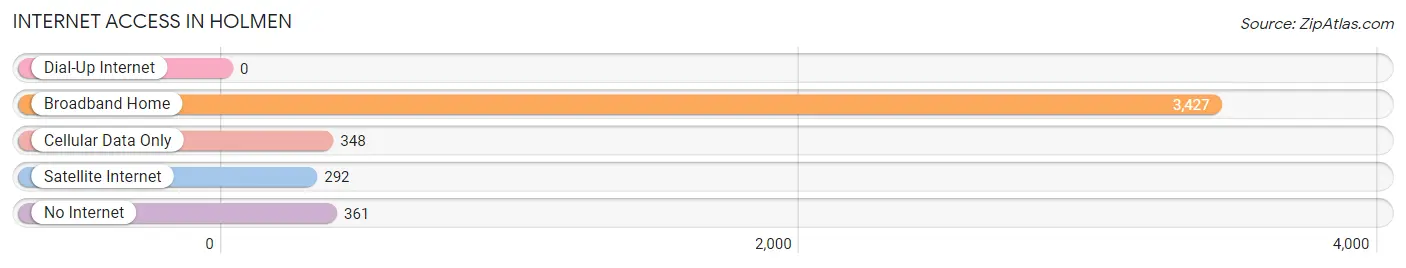
| Internet Type | # Households | % Households |
| Dial-Up Internet | 0 | 0.0% |
| Broadband Home | 3,427 | 78.9% |
| Cellular Data Only | 348 | 8.0% |
| Satellite Internet | 292 | 6.7% |
| No Internet | 361 | 8.3% |
| Total | 4,343 | 100.0% |
Holmen Summary
Holmen, Wisconsin is a small village located in La Crosse County, Wisconsin. It is situated on the banks of the Black River, and is part of the La Crosse-Onalaska Metropolitan Statistical Area. The village has a population of approximately 5,000 people, and is known for its rural charm and small-town atmosphere.
History
Holmen was first settled in 1854 by a group of Norwegian immigrants. The village was named after the Norwegian city of Holmestrand, and the settlers were attracted to the area due to its abundance of natural resources. The settlers quickly established a thriving agricultural community, and the village grew rapidly. By the early 1900s, Holmen had become a bustling community with a variety of businesses, including a sawmill, a flour mill, a creamery, and a cheese factory.
Geography
Holmen is located in the southwestern corner of La Crosse County, Wisconsin. It is situated on the banks of the Black River, and is surrounded by rolling hills and lush forests. The village is located approximately 10 miles north of La Crosse, and is easily accessible via Interstate 90.
Economy
Holmen’s economy is largely based on agriculture and manufacturing. The village is home to several large agricultural operations, including a dairy farm, a beef farm, and a vegetable farm. In addition, Holmen is home to several manufacturing companies, including a paper mill, a plastics factory, and a metal fabrication plant. The village also has a thriving retail sector, with several small businesses and shops located in the downtown area.
Demographics
As of the 2010 census, Holmen had a population of 5,000 people. The racial makeup of the village was 97.2% White, 0.7% African American, 0.3% Native American, 0.3% Asian, 0.2% from other races, and 1.5% from two or more races. The median household income was $50,000, and the median family income was $60,000. The per capita income was $25,000.
Holmen is a small village with a rich history and a vibrant economy. The village is home to a diverse population, and offers a variety of amenities and attractions. Holmen is a great place to live, work, and play, and is sure to provide a unique and enjoyable experience for all who visit.
Common Questions
What is Per Capita Income in Holmen?
Per Capita income in Holmen is $39,379.
What is the Median Family Income in Holmen?
Median Family Income in Holmen is $105,127.
What is the Median Household income in Holmen?
Median Household Income in Holmen is $77,880.
What is Income or Wage Gap in Holmen?
Income or Wage Gap in Holmen is 28.7%.
Women in Holmen earn 71.3 cents for every dollar earned by a man.
What is Inequality or Gini Index in Holmen?
Inequality or Gini Index in Holmen is 0.40.
What is the Total Population of Holmen?
Total Population of Holmen is 10,806.
What is the Total Male Population of Holmen?
Total Male Population of Holmen is 5,540.
What is the Total Female Population of Holmen?
Total Female Population of Holmen is 5,266.
What is the Ratio of Males per 100 Females in Holmen?
There are 105.20 Males per 100 Females in Holmen.
What is the Ratio of Females per 100 Males in Holmen?
There are 95.05 Females per 100 Males in Holmen.
What is the Median Population Age in Holmen?
Median Population Age in Holmen is 37.8 Years.
What is the Average Family Size in Holmen
Average Family Size in Holmen is 3.2 People.
What is the Average Household Size in Holmen
Average Household Size in Holmen is 2.5 People.
How Large is the Labor Force in Holmen?
There are 5,849 People in the Labor Forcein in Holmen.
What is the Percentage of People in the Labor Force in Holmen?
68.9% of People are in the Labor Force in Holmen.
What is the Unemployment Rate in Holmen?
Unemployment Rate in Holmen is 1.8%.