Oakfield, WI Map & Demographics
Oakfield Map
Oakfield Overview
$45,774
PER CAPITA INCOME
$101,429
AVG FAMILY INCOME
$100,804
AVG HOUSEHOLD INCOME
24.4%
WAGE / INCOME GAP [ % ]
75.6¢/ $1
WAGE / INCOME GAP [ $ ]
$16,025
FAMILY INCOME DEFICIT
0.30
INEQUALITY / GINI INDEX
1,218
TOTAL POPULATION
665
MALE POPULATION
553
FEMALE POPULATION
120.25
MALES / 100 FEMALES
83.16
FEMALES / 100 MALES
41.6
MEDIAN AGE
3.1
AVG FAMILY SIZE
2.4
AVG HOUSEHOLD SIZE
690
LABOR FORCE [ PEOPLE ]
70.4%
PERCENT IN LABOR FORCE
1.6%
UNEMPLOYMENT RATE
Oakfield Zip Codes
Oakfield Area Codes
Income in Oakfield
Income Overview in Oakfield
Per Capita Income in Oakfield is $45,774, while median incomes of families and households are $101,429 and $100,804 respectively.
| Characteristic | Number | Measure |
| Per Capita Income | 1,218 | $45,774 |
| Median Family Income | 292 | $101,429 |
| Mean Family Income | 292 | $108,355 |
| Median Household Income | 507 | $100,804 |
| Mean Household Income | 507 | $106,197 |
| Income Deficit | 292 | $16,025 |
| Wage / Income Gap (%) | 1,218 | 24.38% |
| Wage / Income Gap ($) | 1,218 | 75.62¢ per $1 |
| Gini / Inequality Index | 1,218 | 0.30 |
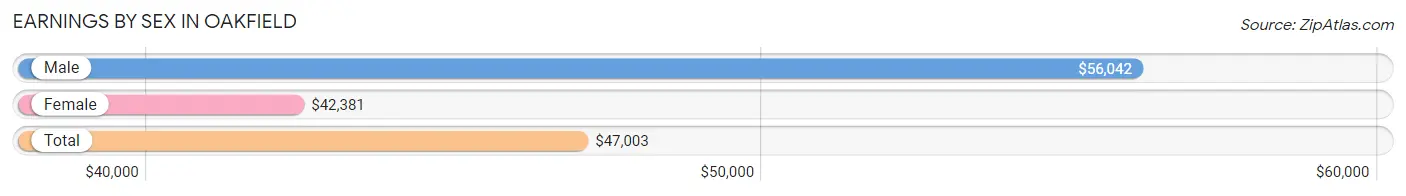
Earnings by Sex in Oakfield
Average Earnings in Oakfield are $47,003, $56,042 for men and $42,381 for women, a difference of 24.4%.
| Sex | Number | Average Earnings |
| Male | 423 (60.9%) | $56,042 |
| Female | 272 (39.1%) | $42,381 |
| Total | 695 (100.0%) | $47,003 |
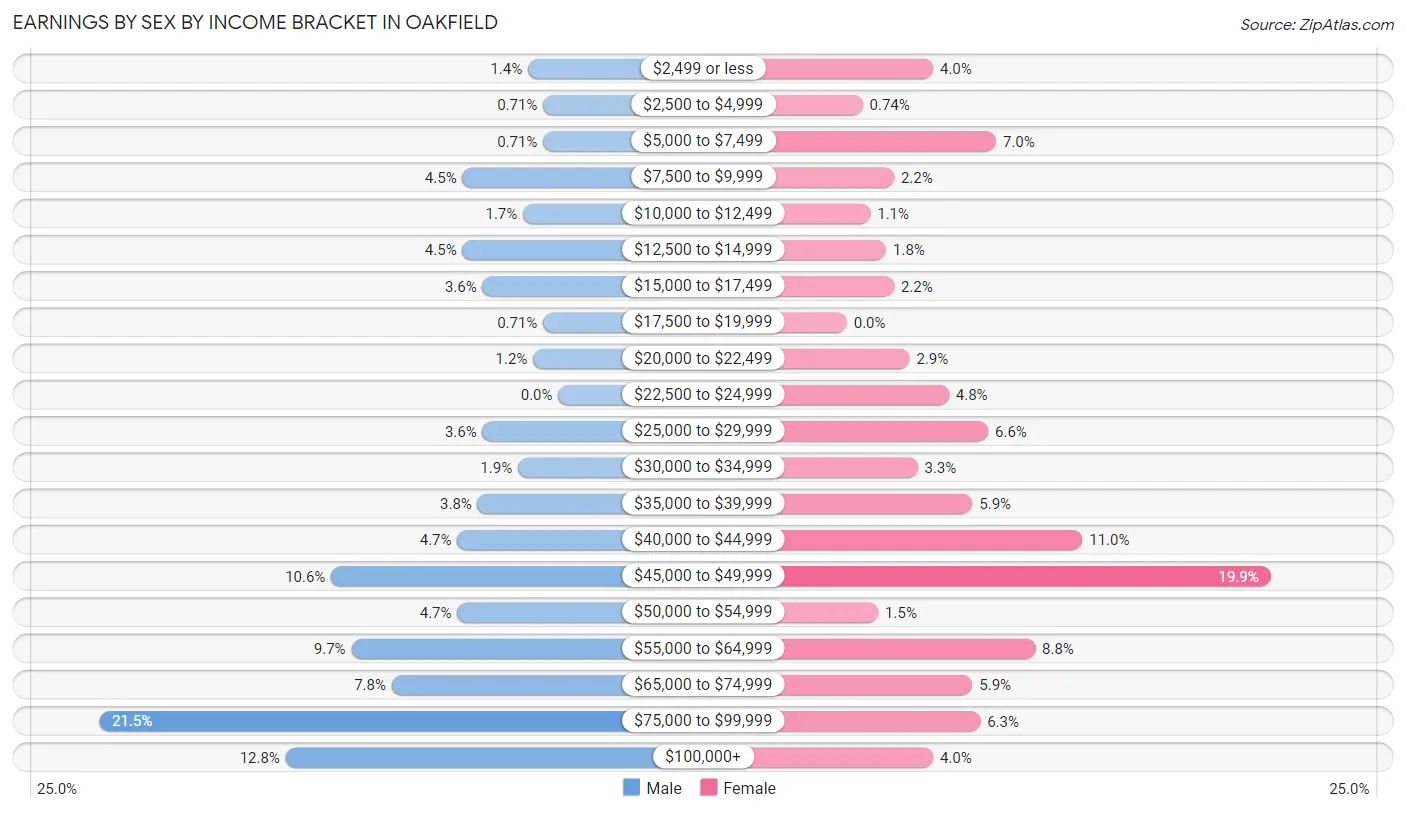
Earnings by Sex by Income Bracket in Oakfield
The most common earnings brackets in Oakfield are $75,000 to $99,999 for men (91 | 21.5%) and $45,000 to $49,999 for women (54 | 19.9%).
| Income | Male | Female |
| $2,499 or less | 6 (1.4%) | 11 (4.0%) |
| $2,500 to $4,999 | 3 (0.7%) | 2 (0.7%) |
| $5,000 to $7,499 | 3 (0.7%) | 19 (7.0%) |
| $7,500 to $9,999 | 19 (4.5%) | 6 (2.2%) |
| $10,000 to $12,499 | 7 (1.7%) | 3 (1.1%) |
| $12,500 to $14,999 | 19 (4.5%) | 5 (1.8%) |
| $15,000 to $17,499 | 15 (3.5%) | 6 (2.2%) |
| $17,500 to $19,999 | 3 (0.7%) | 0 (0.0%) |
| $20,000 to $22,499 | 5 (1.2%) | 8 (2.9%) |
| $22,500 to $24,999 | 0 (0.0%) | 13 (4.8%) |
| $25,000 to $29,999 | 15 (3.5%) | 18 (6.6%) |
| $30,000 to $34,999 | 8 (1.9%) | 9 (3.3%) |
| $35,000 to $39,999 | 16 (3.8%) | 16 (5.9%) |
| $40,000 to $44,999 | 20 (4.7%) | 30 (11.0%) |
| $45,000 to $49,999 | 45 (10.6%) | 54 (19.9%) |
| $50,000 to $54,999 | 20 (4.7%) | 4 (1.5%) |
| $55,000 to $64,999 | 41 (9.7%) | 24 (8.8%) |
| $65,000 to $74,999 | 33 (7.8%) | 16 (5.9%) |
| $75,000 to $99,999 | 91 (21.5%) | 17 (6.2%) |
| $100,000+ | 54 (12.8%) | 11 (4.0%) |
| Total | 423 (100.0%) | 272 (100.0%) |
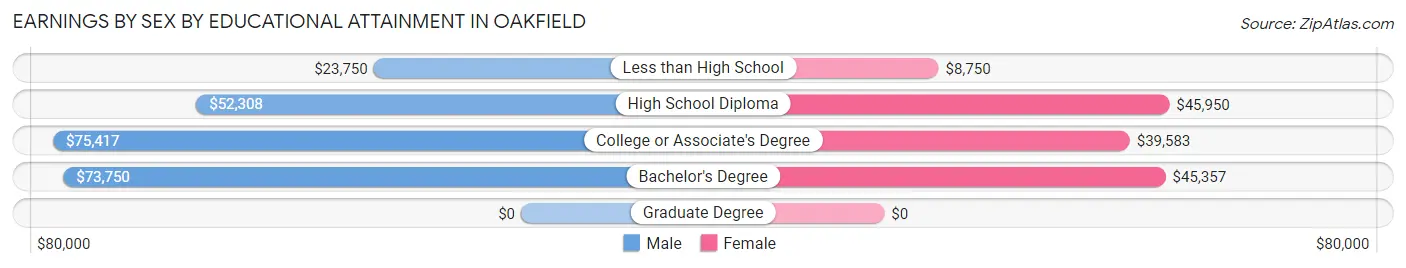
Earnings by Sex by Educational Attainment in Oakfield
Average earnings in Oakfield are $61,250 for men and $45,313 for women, a difference of 26.0%. Men with an educational attainment of college or associate's degree enjoy the highest average annual earnings of $75,417, while those with less than high school education earn the least with $23,750. Women with an educational attainment of high school diploma earn the most with the average annual earnings of $45,950, while those with less than high school education have the smallest earnings of $8,750.
| Educational Attainment | Male Income | Female Income |
| Less than High School | $23,750 | $8,750 |
| High School Diploma | $52,308 | $45,950 |
| College or Associate's Degree | $75,417 | $39,583 |
| Bachelor's Degree | $73,750 | $45,357 |
| Graduate Degree | - | - |
| Total | $61,250 | $45,313 |
Family Income in Oakfield
Family Income Brackets in Oakfield
According to the Oakfield family income data, there are 99 families falling into the $100,000 to $149,999 income range, which is the most common income bracket and makes up 33.9% of all families.
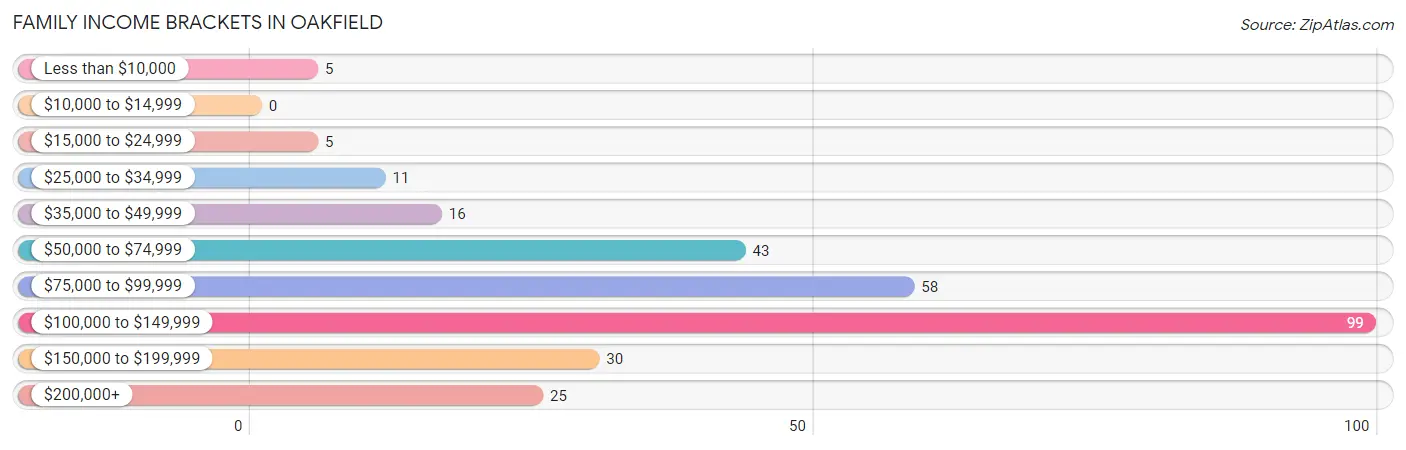
| Income Bracket | # Families | % Families |
| Less than $10,000 | 5 | 1.7% |
| $10,000 to $14,999 | 0 | 0.0% |
| $15,000 to $24,999 | 5 | 1.7% |
| $25,000 to $34,999 | 11 | 3.8% |
| $35,000 to $49,999 | 16 | 5.5% |
| $50,000 to $74,999 | 43 | 14.7% |
| $75,000 to $99,999 | 58 | 19.9% |
| $100,000 to $149,999 | 99 | 33.9% |
| $150,000 to $199,999 | 30 | 10.3% |
| $200,000+ | 25 | 8.6% |
Family Income by Famaliy Size in Oakfield
4-person families (50 | 17.1%) account for the highest median family income in Oakfield with $128,125 per family, while 2-person families (143 | 49.0%) have the highest median income of $43,527 per family member.
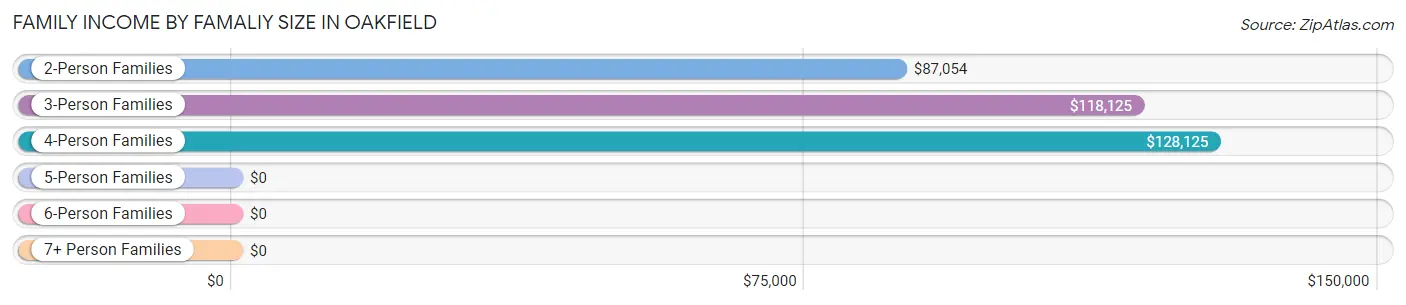
| Income Bracket | # Families | Median Income |
| 2-Person Families | 143 (49.0%) | $87,054 |
| 3-Person Families | 56 (19.2%) | $118,125 |
| 4-Person Families | 50 (17.1%) | $128,125 |
| 5-Person Families | 36 (12.3%) | $0 |
| 6-Person Families | 5 (1.7%) | $0 |
| 7+ Person Families | 2 (0.7%) | $0 |
| Total | 292 (100.0%) | $101,429 |
Family Income by Number of Earners in Oakfield
The median family income in Oakfield is $101,429, with families comprising 3+ earners (33) having the highest median family income of $158,750, while families with no earners (40) have the lowest median family income of $63,750, accounting for 11.3% and 13.7% of families, respectively.
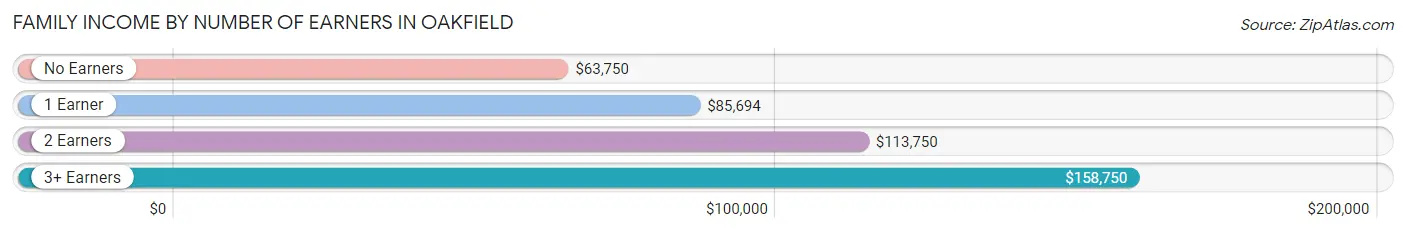
| Number of Earners | # Families | Median Income |
| No Earners | 40 (13.7%) | $63,750 |
| 1 Earner | 65 (22.3%) | $85,694 |
| 2 Earners | 154 (52.7%) | $113,750 |
| 3+ Earners | 33 (11.3%) | $158,750 |
| Total | 292 (100.0%) | $101,429 |
Household Income in Oakfield
Household Income Brackets in Oakfield
With 124 households falling in the category, the $150,000 to $199,999 income range is the most frequent in Oakfield, accounting for 24.5% of all households. In contrast, only 2 households (0.4%) fall into the $10,000 to $14,999 income bracket, making it the least populous group.
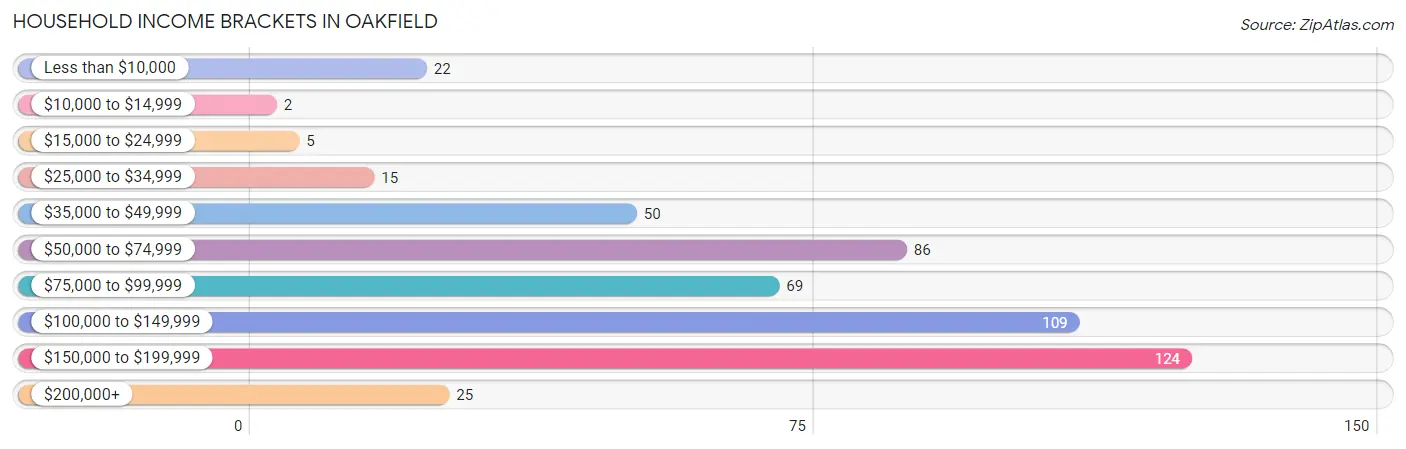
| Income Bracket | # Households | % Households |
| Less than $10,000 | 22 | 4.3% |
| $10,000 to $14,999 | 2 | 0.4% |
| $15,000 to $24,999 | 5 | 1.0% |
| $25,000 to $34,999 | 15 | 3.0% |
| $35,000 to $49,999 | 50 | 9.9% |
| $50,000 to $74,999 | 86 | 17.0% |
| $75,000 to $99,999 | 69 | 13.6% |
| $100,000 to $149,999 | 109 | 21.5% |
| $150,000 to $199,999 | 124 | 24.5% |
| $200,000+ | 25 | 4.9% |
Household Income by Householder Age in Oakfield
The median household income in Oakfield is $100,804, with the highest median household income of $115,625 found in the 25 to 44 years age bracket for the primary householder. A total of 140 households (27.6%) fall into this category. Meanwhile, the 15 to 24 years age bracket for the primary householder has the lowest median household income of $0, with 25 households (4.9%) in this group.
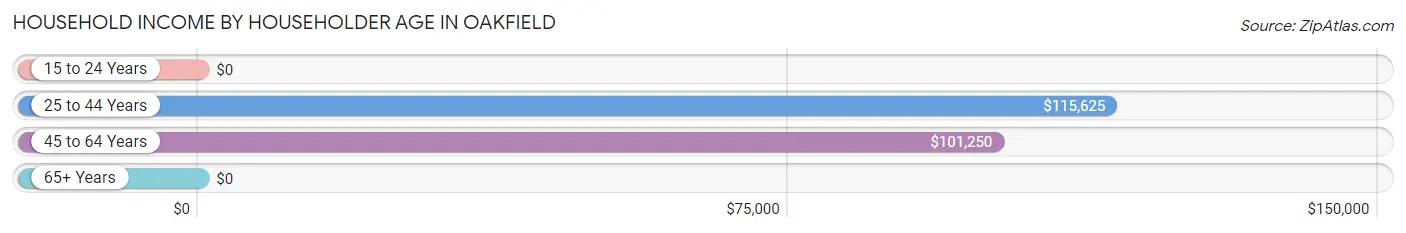
| Income Bracket | # Households | Median Income |
| 15 to 24 Years | 25 (4.9%) | $0 |
| 25 to 44 Years | 140 (27.6%) | $115,625 |
| 45 to 64 Years | 160 (31.6%) | $101,250 |
| 65+ Years | 182 (35.9%) | $0 |
| Total | 507 (100.0%) | $100,804 |
Poverty in Oakfield
Income Below Poverty by Sex and Age in Oakfield
With 4.2% poverty level for males and 11.9% for females among the residents of Oakfield, 15 year old males and 16 and 17 year old females are the most vulnerable to poverty, with 7 males (77.8%) and 12 females (60.0%) in their respective age groups living below the poverty level.
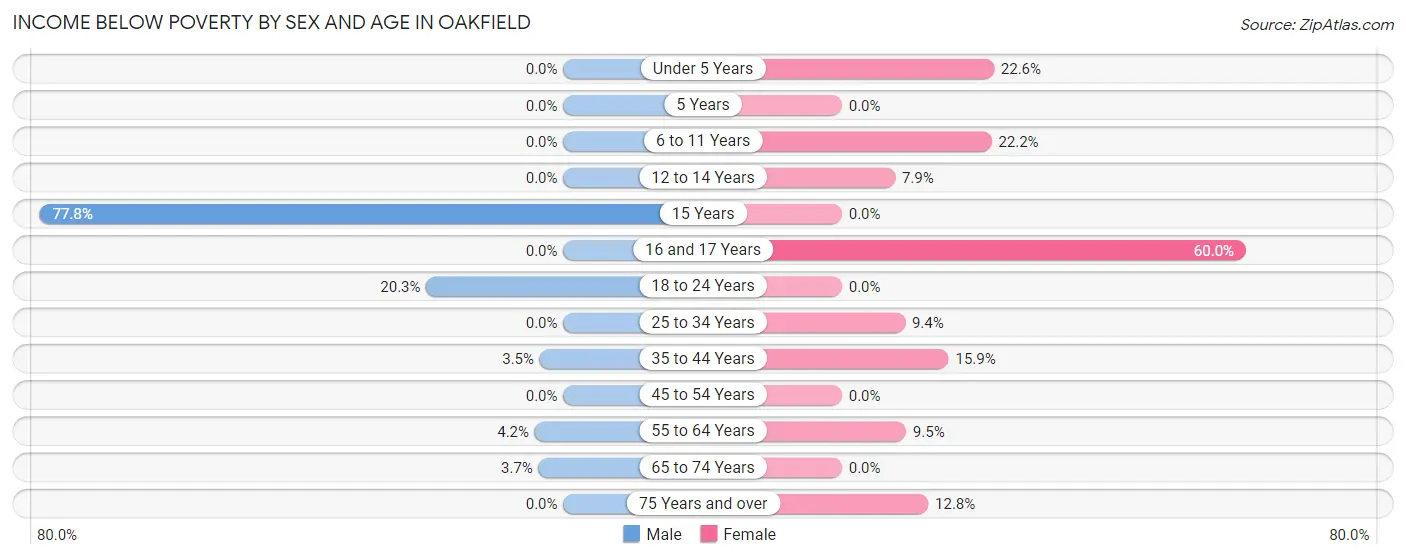
| Age Bracket | Male | Female |
| Under 5 Years | 0 (0.0%) | 7 (22.6%) |
| 5 Years | 0 (0.0%) | 0 (0.0%) |
| 6 to 11 Years | 0 (0.0%) | 8 (22.2%) |
| 12 to 14 Years | 0 (0.0%) | 3 (7.9%) |
| 15 Years | 7 (77.8%) | 0 (0.0%) |
| 16 and 17 Years | 0 (0.0%) | 12 (60.0%) |
| 18 to 24 Years | 12 (20.3%) | 0 (0.0%) |
| 25 to 34 Years | 0 (0.0%) | 6 (9.4%) |
| 35 to 44 Years | 3 (3.5%) | 13 (15.9%) |
| 45 to 54 Years | 0 (0.0%) | 0 (0.0%) |
| 55 to 64 Years | 3 (4.2%) | 8 (9.5%) |
| 65 to 74 Years | 3 (3.7%) | 0 (0.0%) |
| 75 Years and over | 0 (0.0%) | 5 (12.8%) |
| Total | 28 (4.2%) | 62 (11.9%) |
Income Above Poverty by Sex and Age in Oakfield
According to the poverty statistics in Oakfield, males aged under 5 years and females aged 5 years are the age groups that are most secure financially, with 100.0% of males and 100.0% of females in these age groups living above the poverty line.
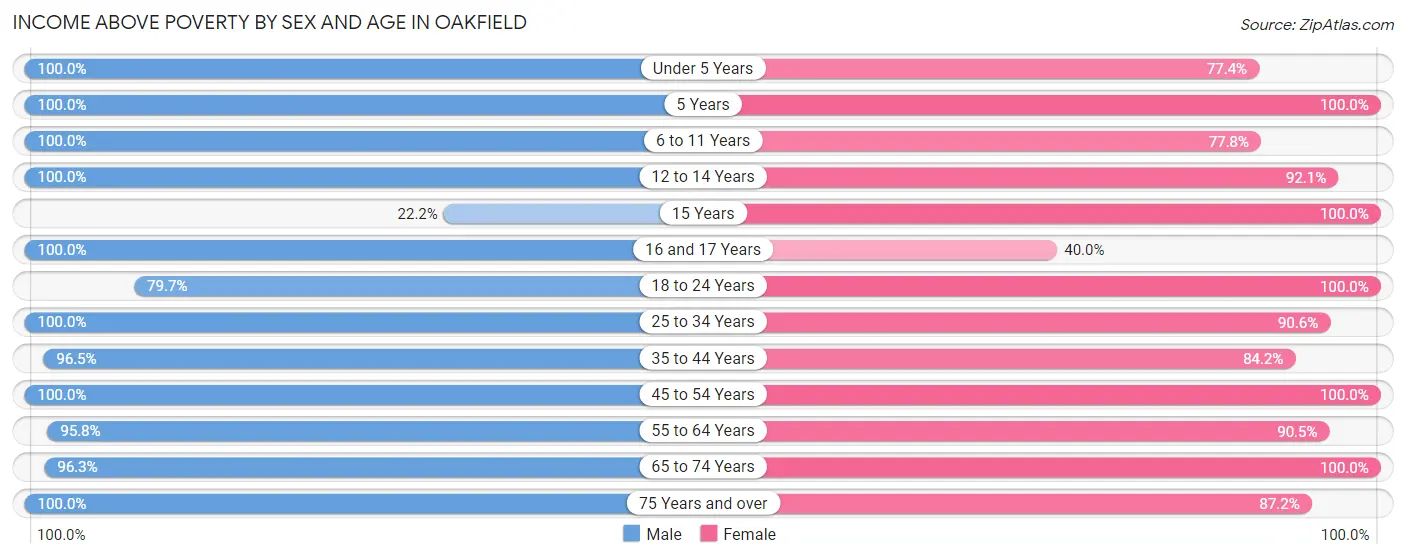
| Age Bracket | Male | Female |
| Under 5 Years | 20 (100.0%) | 24 (77.4%) |
| 5 Years | 3 (100.0%) | 4 (100.0%) |
| 6 to 11 Years | 43 (100.0%) | 28 (77.8%) |
| 12 to 14 Years | 13 (100.0%) | 35 (92.1%) |
| 15 Years | 2 (22.2%) | 9 (100.0%) |
| 16 and 17 Years | 15 (100.0%) | 8 (40.0%) |
| 18 to 24 Years | 47 (79.7%) | 23 (100.0%) |
| 25 to 34 Years | 79 (100.0%) | 58 (90.6%) |
| 35 to 44 Years | 83 (96.5%) | 69 (84.2%) |
| 45 to 54 Years | 73 (100.0%) | 69 (100.0%) |
| 55 to 64 Years | 68 (95.8%) | 76 (90.5%) |
| 65 to 74 Years | 79 (96.3%) | 22 (100.0%) |
| 75 Years and over | 112 (100.0%) | 34 (87.2%) |
| Total | 637 (95.8%) | 459 (88.1%) |
Income Below Poverty Among Married-Couple Families in Oakfield
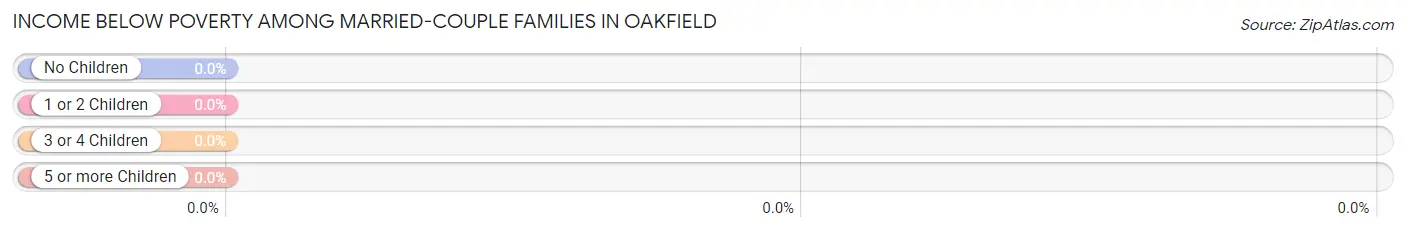
| Children | Above Poverty | Below Poverty |
| No Children | 153 (100.0%) | 0 (0.0%) |
| 1 or 2 Children | 77 (100.0%) | 0 (0.0%) |
| 3 or 4 Children | 23 (100.0%) | 0 (0.0%) |
| 5 or more Children | 0 (0.0%) | 0 (0.0%) |
| Total | 253 (100.0%) | 0 (0.0%) |
Income Below Poverty Among Single-Parent Households in Oakfield
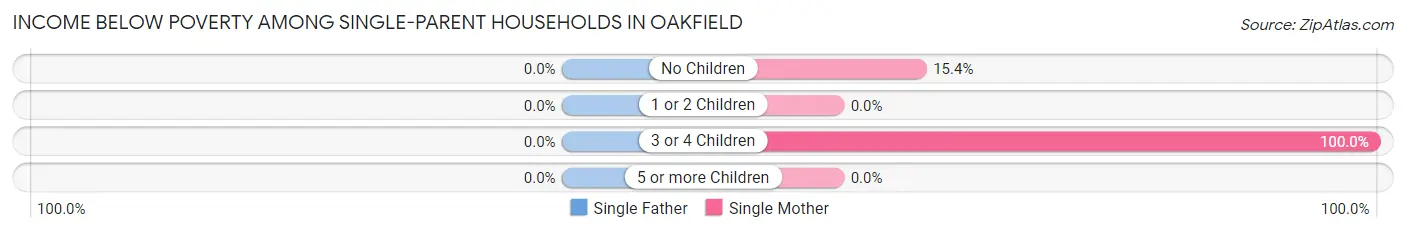
| Children | Single Father | Single Mother |
| No Children | 0 (0.0%) | 2 (15.4%) |
| 1 or 2 Children | 0 (0.0%) | 0 (0.0%) |
| 3 or 4 Children | 0 (0.0%) | 6 (100.0%) |
| 5 or more Children | 0 (0.0%) | 0 (0.0%) |
| Total | 0 (0.0%) | 8 (42.1%) |
Income Below Poverty Among Married-Couple vs Single-Parent Households in Oakfield
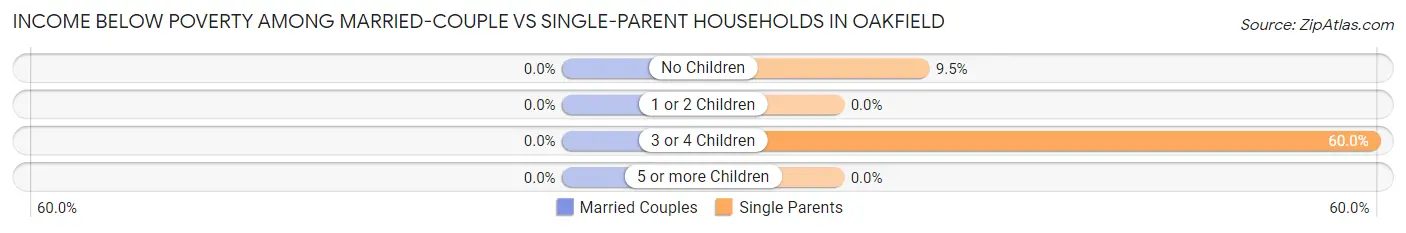
| Children | Married-Couple Families | Single-Parent Households |
| No Children | 0 (0.0%) | 2 (9.5%) |
| 1 or 2 Children | 0 (0.0%) | 0 (0.0%) |
| 3 or 4 Children | 0 (0.0%) | 6 (60.0%) |
| 5 or more Children | 0 (0.0%) | 0 (0.0%) |
| Total | 0 (0.0%) | 8 (20.5%) |
Race in Oakfield
The most populous races in Oakfield are White / Caucasian (1,121 | 92.0%), Two or more Races (64 | 5.2%), and Hispanic or Latino (37 | 3.0%).
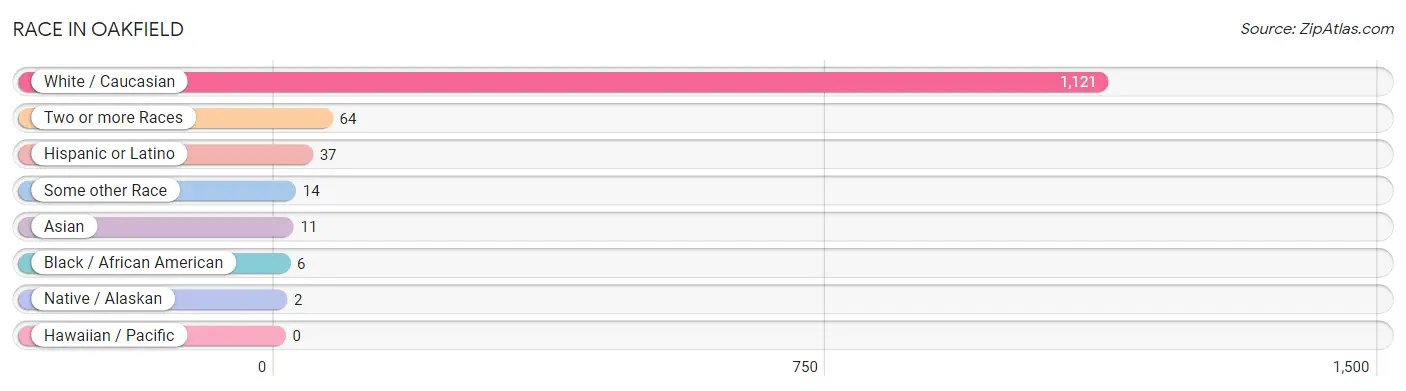
| Race | # Population | % Population |
| Asian | 11 | 0.9% |
| Black / African American | 6 | 0.5% |
| Hawaiian / Pacific | 0 | 0.0% |
| Hispanic or Latino | 37 | 3.0% |
| Native / Alaskan | 2 | 0.2% |
| White / Caucasian | 1,121 | 92.0% |
| Two or more Races | 64 | 5.2% |
| Some other Race | 14 | 1.1% |
| Total | 1,218 | 100.0% |
Ancestry in Oakfield
The most populous ancestries reported in Oakfield are German (527 | 43.3%), Irish (140 | 11.5%), English (132 | 10.8%), American (91 | 7.5%), and Danish (82 | 6.7%), together accounting for 79.8% of all Oakfield residents.
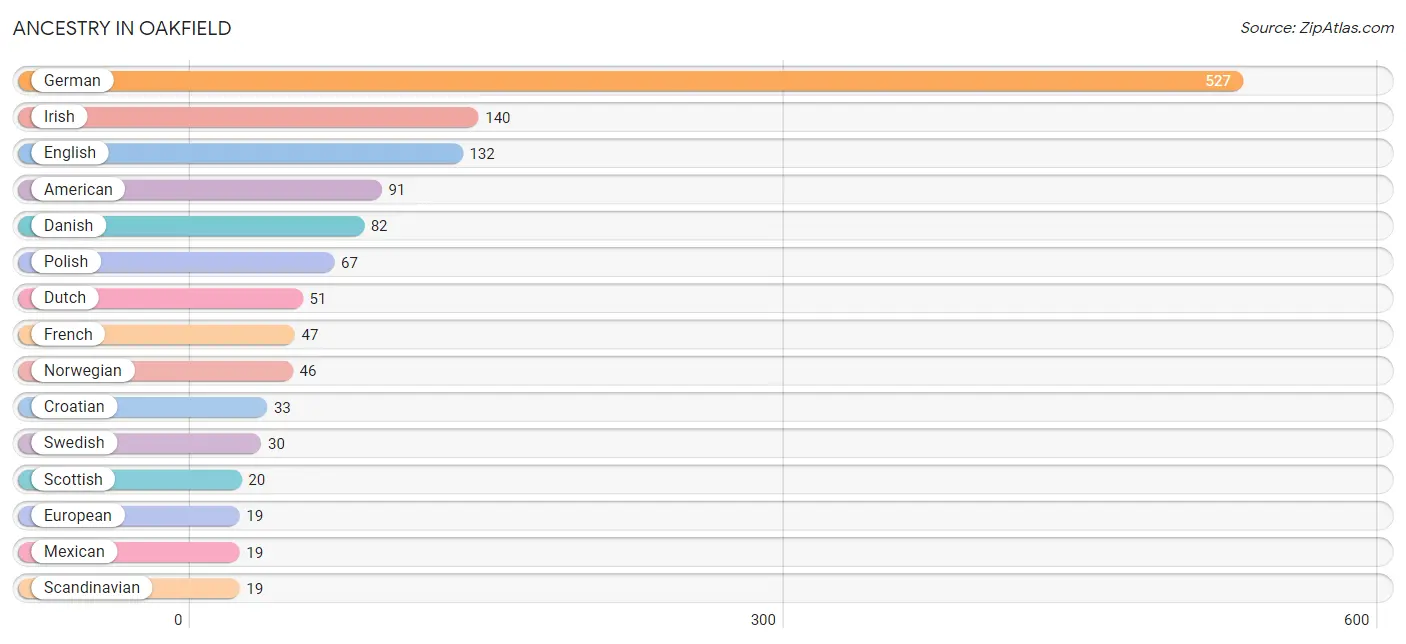
| Ancestry | # Population | % Population |
| American | 91 | 7.5% |
| Austrian | 4 | 0.3% |
| Bangladeshi | 4 | 0.3% |
| Chippewa | 2 | 0.2% |
| Croatian | 33 | 2.7% |
| Czech | 9 | 0.7% |
| Danish | 82 | 6.7% |
| Dutch | 51 | 4.2% |
| English | 132 | 10.8% |
| European | 19 | 1.6% |
| French | 47 | 3.9% |
| French Canadian | 8 | 0.7% |
| German | 527 | 43.3% |
| Greek | 7 | 0.6% |
| Irish | 140 | 11.5% |
| Italian | 4 | 0.3% |
| Korean | 14 | 1.1% |
| Mexican | 19 | 1.6% |
| Norwegian | 46 | 3.8% |
| Polish | 67 | 5.5% |
| Russian | 3 | 0.3% |
| Scandinavian | 19 | 1.6% |
| Scottish | 20 | 1.6% |
| Slovak | 12 | 1.0% |
| South American | 4 | 0.3% |
| Spanish | 11 | 0.9% |
| Subsaharan African | 2 | 0.2% |
| Swedish | 30 | 2.5% |
| Swiss | 11 | 0.9% |
| Venezuelan | 4 | 0.3% |
| Welsh | 2 | 0.2% | View All 31 Rows |
Immigrants in Oakfield
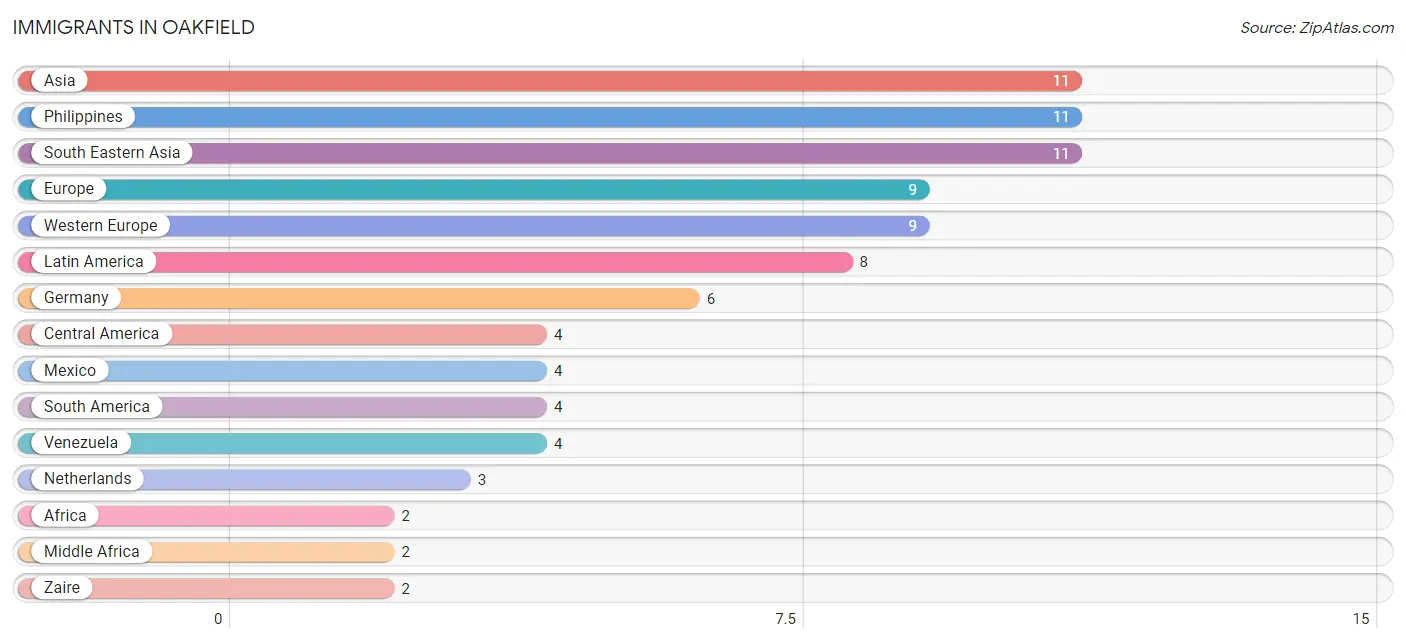
The most numerous immigrant groups reported in Oakfield came from Asia (11 | 0.9%), Philippines (11 | 0.9%), South Eastern Asia (11 | 0.9%), Europe (9 | 0.7%), and Western Europe (9 | 0.7%), together accounting for 4.2% of all Oakfield residents.
| Immigration Origin | # Population | % Population |
| Africa | 2 | 0.2% |
| Asia | 11 | 0.9% |
| Central America | 4 | 0.3% |
| Europe | 9 | 0.7% |
| Germany | 6 | 0.5% |
| Latin America | 8 | 0.7% |
| Mexico | 4 | 0.3% |
| Middle Africa | 2 | 0.2% |
| Netherlands | 3 | 0.3% |
| Philippines | 11 | 0.9% |
| South America | 4 | 0.3% |
| South Eastern Asia | 11 | 0.9% |
| Venezuela | 4 | 0.3% |
| Western Europe | 9 | 0.7% |
| Zaire | 2 | 0.2% | View All 15 Rows |
Sex and Age in Oakfield
Sex and Age in Oakfield
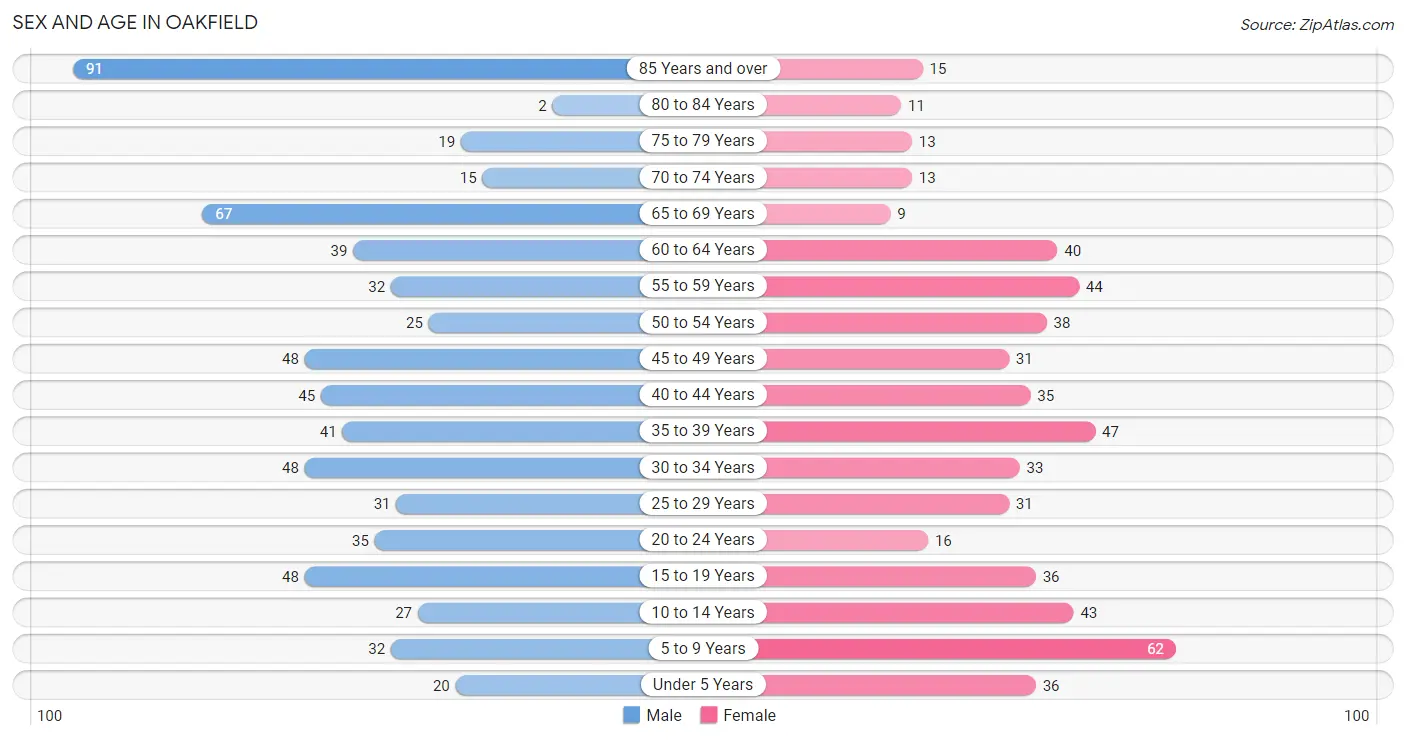
The most populous age groups in Oakfield are 85 Years and over (91 | 13.7%) for men and 5 to 9 Years (62 | 11.2%) for women.
| Age Bracket | Male | Female |
| Under 5 Years | 20 (3.0%) | 36 (6.5%) |
| 5 to 9 Years | 32 (4.8%) | 62 (11.2%) |
| 10 to 14 Years | 27 (4.1%) | 43 (7.8%) |
| 15 to 19 Years | 48 (7.2%) | 36 (6.5%) |
| 20 to 24 Years | 35 (5.3%) | 16 (2.9%) |
| 25 to 29 Years | 31 (4.7%) | 31 (5.6%) |
| 30 to 34 Years | 48 (7.2%) | 33 (6.0%) |
| 35 to 39 Years | 41 (6.2%) | 47 (8.5%) |
| 40 to 44 Years | 45 (6.8%) | 35 (6.3%) |
| 45 to 49 Years | 48 (7.2%) | 31 (5.6%) |
| 50 to 54 Years | 25 (3.8%) | 38 (6.9%) |
| 55 to 59 Years | 32 (4.8%) | 44 (8.0%) |
| 60 to 64 Years | 39 (5.9%) | 40 (7.2%) |
| 65 to 69 Years | 67 (10.1%) | 9 (1.6%) |
| 70 to 74 Years | 15 (2.3%) | 13 (2.4%) |
| 75 to 79 Years | 19 (2.9%) | 13 (2.4%) |
| 80 to 84 Years | 2 (0.3%) | 11 (2.0%) |
| 85 Years and over | 91 (13.7%) | 15 (2.7%) |
| Total | 665 (100.0%) | 553 (100.0%) |
Families and Households in Oakfield
Median Family Size in Oakfield
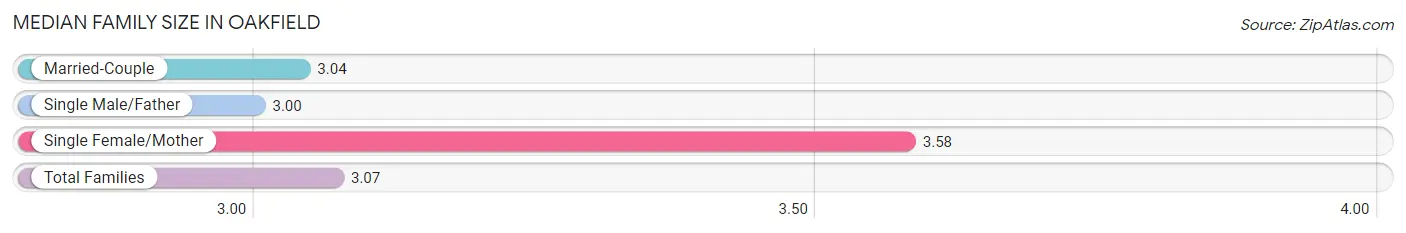
The median family size in Oakfield is 3.07 persons per family, with single female/mother families (19 | 6.5%) accounting for the largest median family size of 3.58 persons per family. On the other hand, single male/father families (20 | 6.9%) represent the smallest median family size with 3.00 persons per family.
| Family Type | # Families | Family Size |
| Married-Couple | 253 (86.6%) | 3.04 |
| Single Male/Father | 20 (6.9%) | 3.00 |
| Single Female/Mother | 19 (6.5%) | 3.58 |
| Total Families | 292 (100.0%) | 3.07 |
Median Household Size in Oakfield
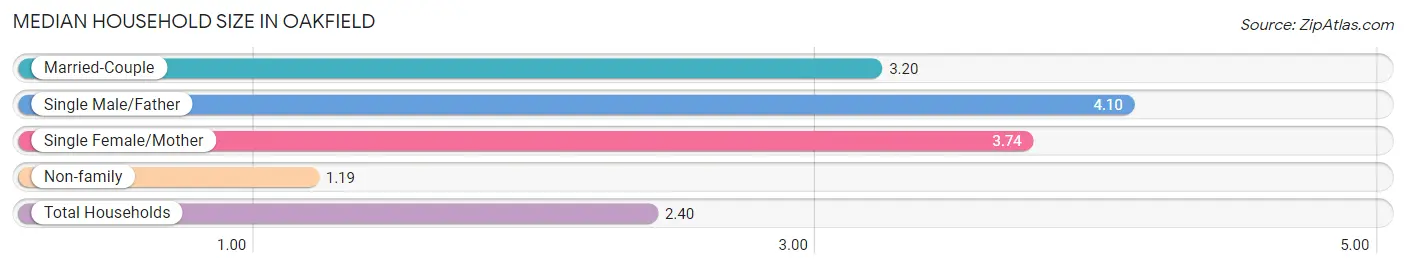
The median household size in Oakfield is 2.40 persons per household, with single male/father households (20 | 3.9%) accounting for the largest median household size of 4.1 persons per household. non-family households (215 | 42.4%) represent the smallest median household size with 1.19 persons per household.
| Household Type | # Households | Household Size |
| Married-Couple | 253 (49.9%) | 3.20 |
| Single Male/Father | 20 (3.9%) | 4.10 |
| Single Female/Mother | 19 (3.7%) | 3.74 |
| Non-family | 215 (42.4%) | 1.19 |
| Total Households | 507 (100.0%) | 2.40 |
Household Size by Marriage Status in Oakfield
Out of a total of 507 households in Oakfield, 292 (57.6%) are family households, while 215 (42.4%) are nonfamily households. The most numerous type of family households are 2-person households, comprising 143, and the most common type of nonfamily households are 1-person households, comprising 184.
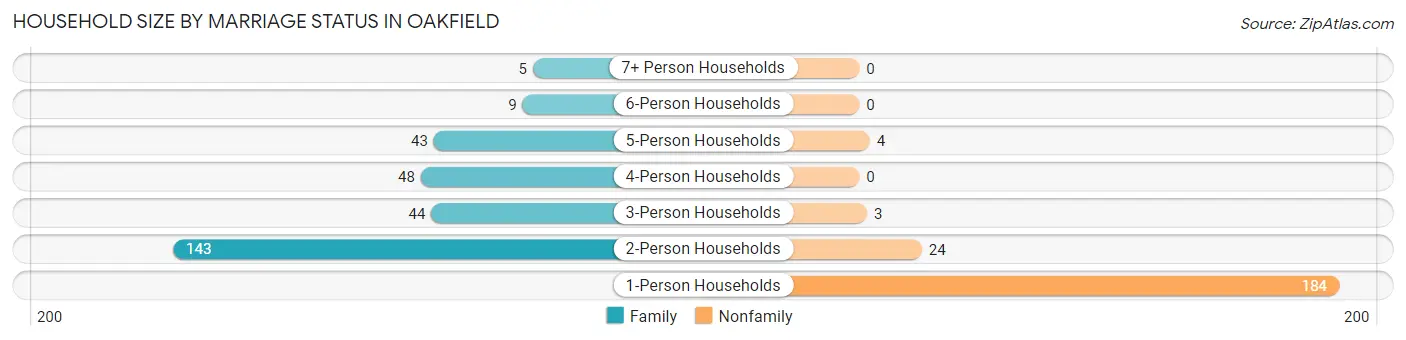
| Household Size | Family Households | Nonfamily Households |
| 1-Person Households | - | 184 (36.3%) |
| 2-Person Households | 143 (28.2%) | 24 (4.7%) |
| 3-Person Households | 44 (8.7%) | 3 (0.6%) |
| 4-Person Households | 48 (9.5%) | 0 (0.0%) |
| 5-Person Households | 43 (8.5%) | 4 (0.8%) |
| 6-Person Households | 9 (1.8%) | 0 (0.0%) |
| 7+ Person Households | 5 (1.0%) | 0 (0.0%) |
| Total | 292 (57.6%) | 215 (42.4%) |
Female Fertility in Oakfield
Fertility by Age in Oakfield
Average fertility rate in Oakfield is 37.0 births per 1,000 women. Women in the age bracket of 20 to 34 years have the highest fertility rate with 113.0 births per 1,000 women. Women in the age bracket of 20 to 34 years acount for 100.0% of all women with births.
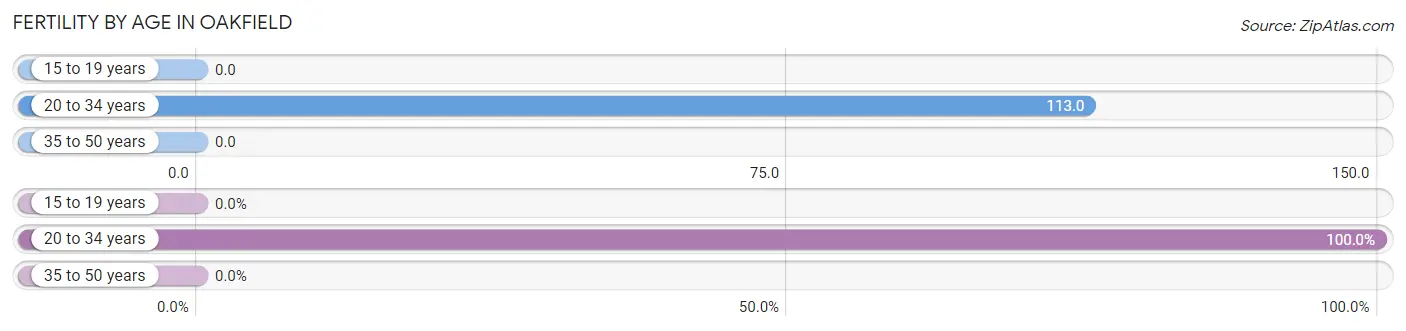
| Age Bracket | Women with Births | Births / 1,000 Women |
| 15 to 19 years | 0 (0.0%) | 0.0 |
| 20 to 34 years | 9 (100.0%) | 113.0 |
| 35 to 50 years | 0 (0.0%) | 0.0 |
| Total | 9 (100.0%) | 37.0 |
Fertility by Age by Marriage Status in Oakfield
33.3% of women with births (9) in Oakfield are married. The highest percentage of unmarried women with births falls into 20 to 34 years age bracket with 66.7% of them unmarried at the time of birth, while the lowest percentage of unmarried women with births belong to 20 to 34 years age bracket with 66.7% of them unmarried.
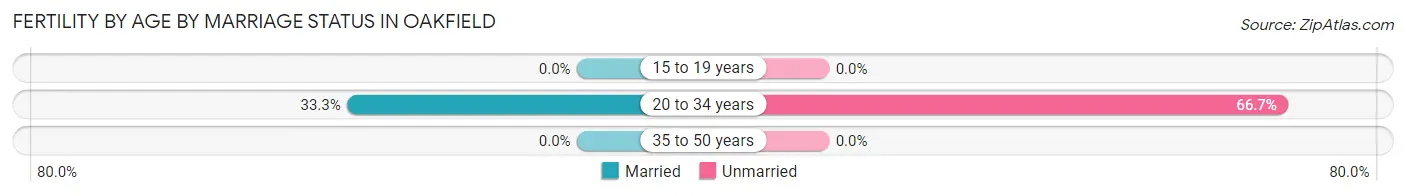
| Age Bracket | Married | Unmarried |
| 15 to 19 years | 0 (0.0%) | 0 (0.0%) |
| 20 to 34 years | 3 (33.3%) | 6 (66.7%) |
| 35 to 50 years | 0 (0.0%) | 0 (0.0%) |
| Total | 3 (33.3%) | 6 (66.7%) |
Fertility by Education in Oakfield
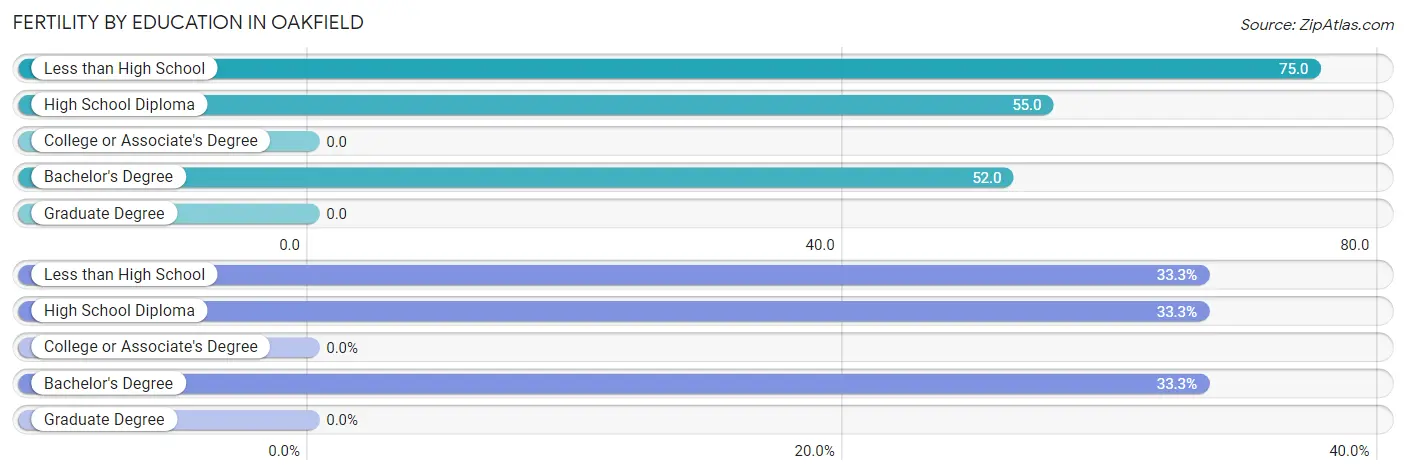
| Educational Attainment | Women with Births | Births / 1,000 Women |
| Less than High School | 3 (33.3%) | 75.0 |
| High School Diploma | 3 (33.3%) | 55.0 |
| College or Associate's Degree | 0 (0.0%) | 0.0 |
| Bachelor's Degree | 3 (33.3%) | 52.0 |
| Graduate Degree | 0 (0.0%) | 0.0 |
| Total | 9 (100.0%) | 37.0 |
Fertility by Education by Marriage Status in Oakfield
66.7% of women with births in Oakfield are unmarried. Women with the educational attainment of bachelor's degree are most likely to be married with 100.0% of them married at childbirth, while women with the educational attainment of less than high school are least likely to be married with 100.0% of them unmarried at childbirth.
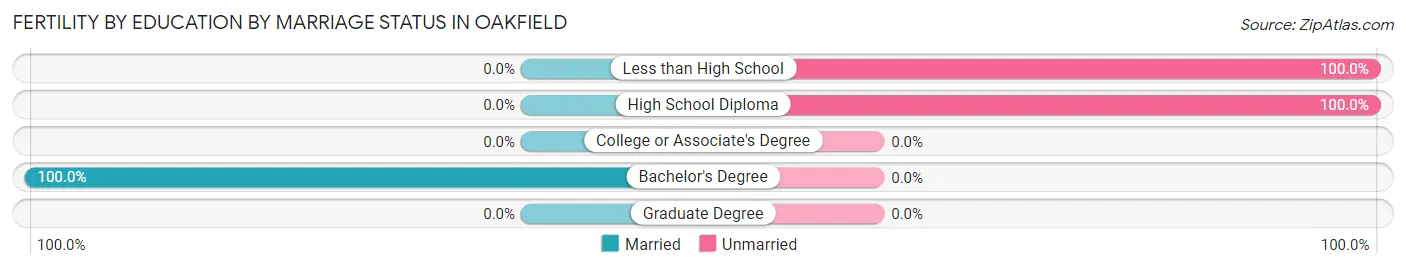
| Educational Attainment | Married | Unmarried |
| Less than High School | 0 (0.0%) | 3 (100.0%) |
| High School Diploma | 0 (0.0%) | 3 (100.0%) |
| College or Associate's Degree | 0 (0.0%) | 0 (0.0%) |
| Bachelor's Degree | 3 (100.0%) | 0 (0.0%) |
| Graduate Degree | 0 (0.0%) | 0 (0.0%) |
| Total | 3 (33.3%) | 6 (66.7%) |
Employment Characteristics in Oakfield
Employment by Class of Employer in Oakfield
Among the 674 employed individuals in Oakfield, private company employees (539 | 80.0%), not-for-profit organizations (45 | 6.7%), and local government employees (27 | 4.0%) make up the most common classes of employment.
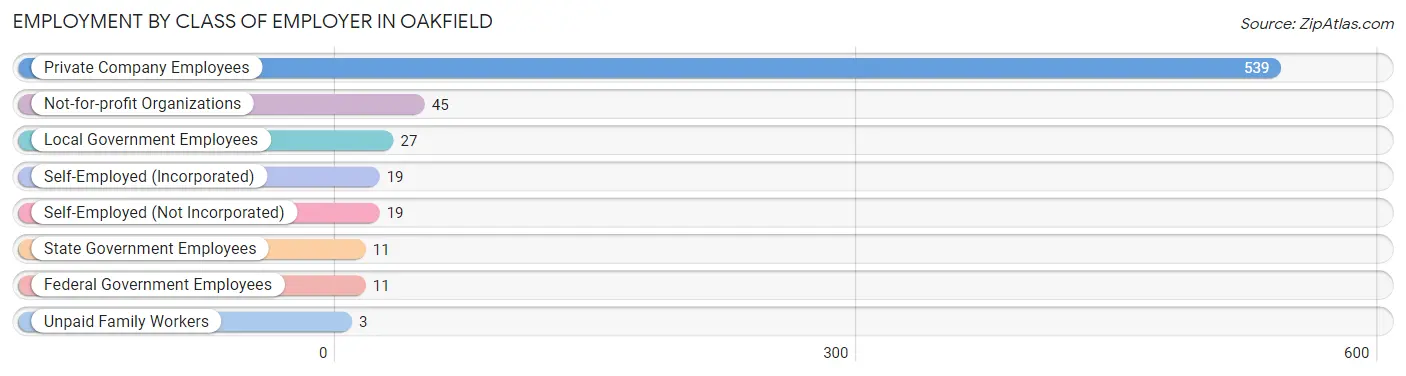
| Employer Class | # Employees | % Employees |
| Private Company Employees | 539 | 80.0% |
| Self-Employed (Incorporated) | 19 | 2.8% |
| Self-Employed (Not Incorporated) | 19 | 2.8% |
| Not-for-profit Organizations | 45 | 6.7% |
| Local Government Employees | 27 | 4.0% |
| State Government Employees | 11 | 1.6% |
| Federal Government Employees | 11 | 1.6% |
| Unpaid Family Workers | 3 | 0.4% |
| Total | 674 | 100.0% |
Employment Status by Age in Oakfield
According to the labor force statistics for Oakfield, out of the total population over 16 years of age (980), 70.4% or 690 individuals are in the labor force, with 1.6% or 11 of them unemployed. The age group with the highest labor force participation rate is 20 to 24 years, with 100.0% or 51 individuals in the labor force. Within the labor force, the 30 to 34 years age range has the highest percentage of unemployed individuals, with 10.7% or 8 of them being unemployed.
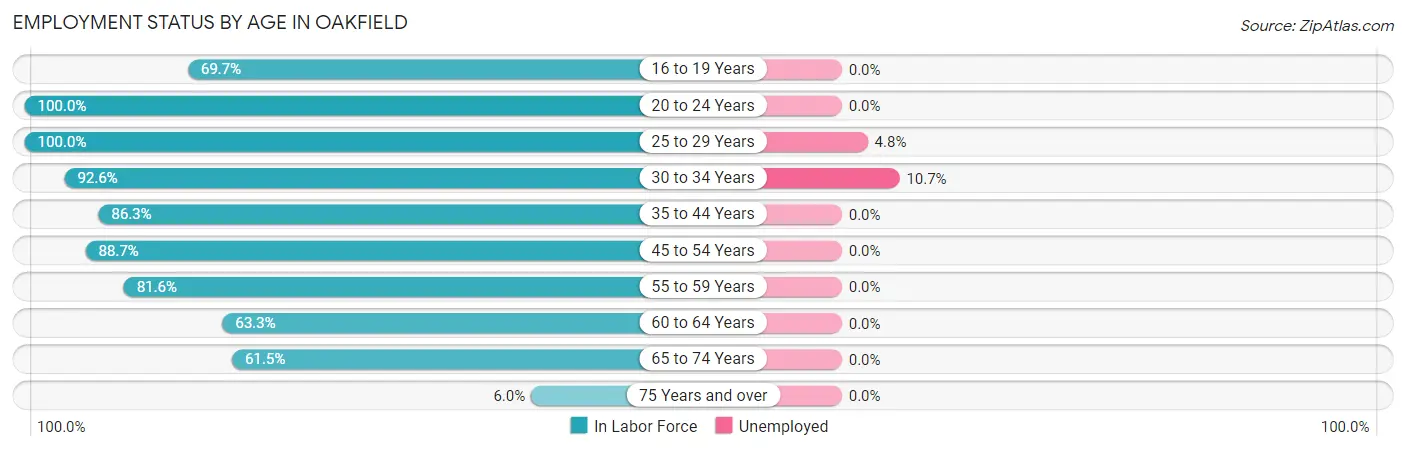
| Age Bracket | In Labor Force | Unemployed |
| 16 to 19 Years | 46 (69.7%) | 0 (0.0%) |
| 20 to 24 Years | 51 (100.0%) | 0 (0.0%) |
| 25 to 29 Years | 62 (100.0%) | 3 (4.8%) |
| 30 to 34 Years | 75 (92.6%) | 8 (10.7%) |
| 35 to 44 Years | 145 (86.3%) | 0 (0.0%) |
| 45 to 54 Years | 126 (88.7%) | 0 (0.0%) |
| 55 to 59 Years | 62 (81.6%) | 0 (0.0%) |
| 60 to 64 Years | 50 (63.3%) | 0 (0.0%) |
| 65 to 74 Years | 64 (61.5%) | 0 (0.0%) |
| 75 Years and over | 9 (6.0%) | 0 (0.0%) |
| Total | 690 (70.4%) | 11 (1.6%) |
Employment Status by Educational Attainment in Oakfield
According to labor force statistics for Oakfield, 85.5% of individuals (520) out of the total population between 25 and 64 years of age (608) are in the labor force, with 2.1% or 11 of them being unemployed. The group with the highest labor force participation rate are those with the educational attainment of less than high school, with 100.0% or 26 individuals in the labor force. Within the labor force, individuals with less than high school education have the highest percentage of unemployment, with 42.3% or 11 of them being unemployed.
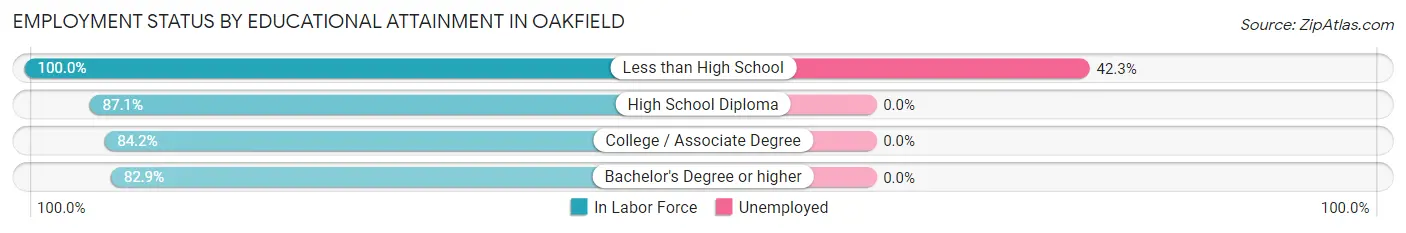
| Educational Attainment | In Labor Force | Unemployed |
| Less than High School | 26 (100.0%) | 11 (42.3%) |
| High School Diploma | 182 (87.1%) | 0 (0.0%) |
| College / Associate Degree | 176 (84.2%) | 0 (0.0%) |
| Bachelor's Degree or higher | 136 (82.9%) | 0 (0.0%) |
| Total | 520 (85.5%) | 13 (2.1%) |
Employment Occupations by Sex in Oakfield
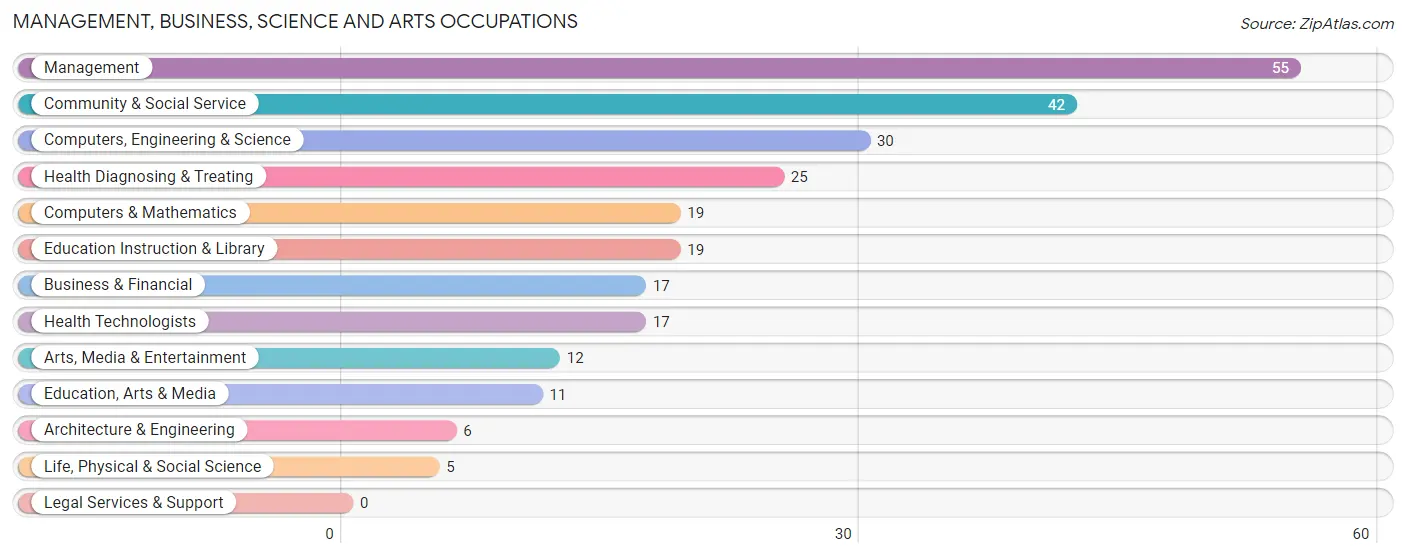
Management, Business, Science and Arts Occupations
The most common Management, Business, Science and Arts occupations in Oakfield are Management (55 | 8.2%), Community & Social Service (42 | 6.2%), Computers, Engineering & Science (30 | 4.4%), Health Diagnosing & Treating (25 | 3.7%), and Computers & Mathematics (19 | 2.8%).
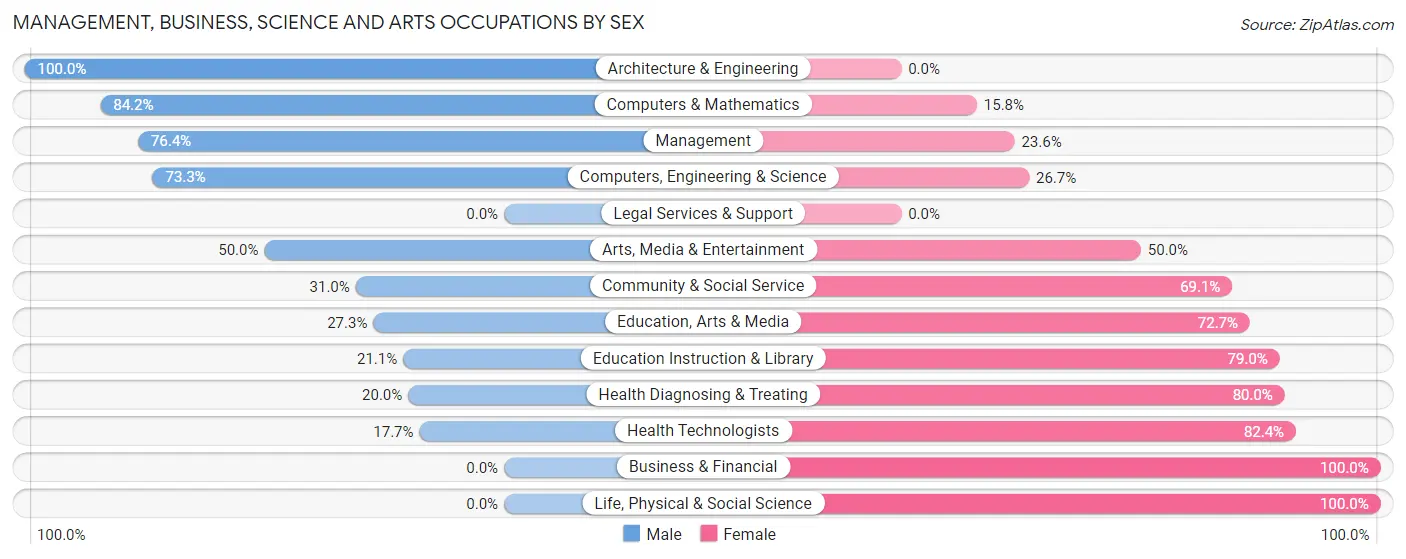
Management, Business, Science and Arts Occupations by Sex
Within the Management, Business, Science and Arts occupations in Oakfield, the most male-oriented occupations are Architecture & Engineering (100.0%), Computers & Mathematics (84.2%), and Management (76.4%), while the most female-oriented occupations are Business & Financial (100.0%), Life, Physical & Social Science (100.0%), and Health Technologists (82.4%).
| Occupation | Male | Female |
| Management | 42 (76.4%) | 13 (23.6%) |
| Business & Financial | 0 (0.0%) | 17 (100.0%) |
| Computers, Engineering & Science | 22 (73.3%) | 8 (26.7%) |
| Computers & Mathematics | 16 (84.2%) | 3 (15.8%) |
| Architecture & Engineering | 6 (100.0%) | 0 (0.0%) |
| Life, Physical & Social Science | 0 (0.0%) | 5 (100.0%) |
| Community & Social Service | 13 (30.9%) | 29 (69.1%) |
| Education, Arts & Media | 3 (27.3%) | 8 (72.7%) |
| Legal Services & Support | 0 (0.0%) | 0 (0.0%) |
| Education Instruction & Library | 4 (21.0%) | 15 (78.9%) |
| Arts, Media & Entertainment | 6 (50.0%) | 6 (50.0%) |
| Health Diagnosing & Treating | 5 (20.0%) | 20 (80.0%) |
| Health Technologists | 3 (17.6%) | 14 (82.4%) |
| Total (Category) | 82 (48.5%) | 87 (51.5%) |
| Total (Overall) | 416 (61.6%) | 259 (38.4%) |
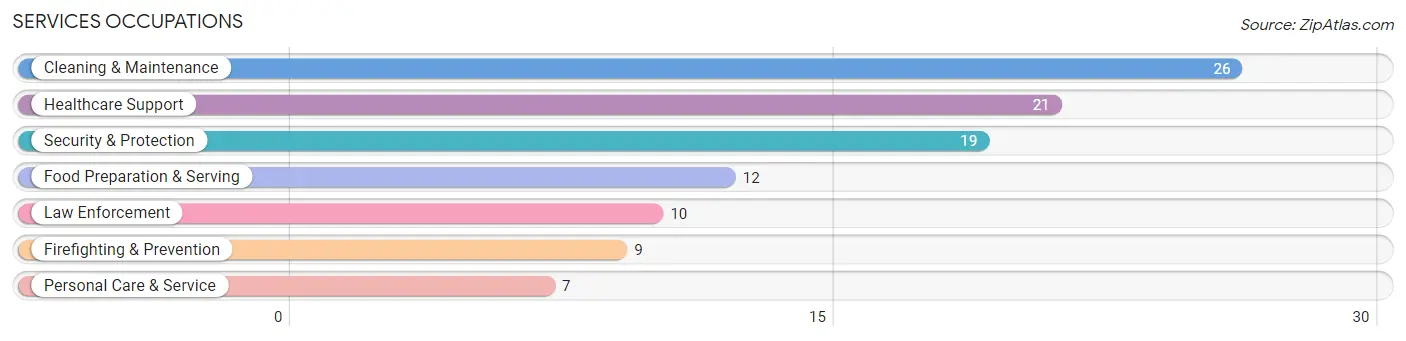
Services Occupations
The most common Services occupations in Oakfield are Cleaning & Maintenance (26 | 3.8%), Healthcare Support (21 | 3.1%), Security & Protection (19 | 2.8%), Food Preparation & Serving (12 | 1.8%), and Law Enforcement (10 | 1.5%).
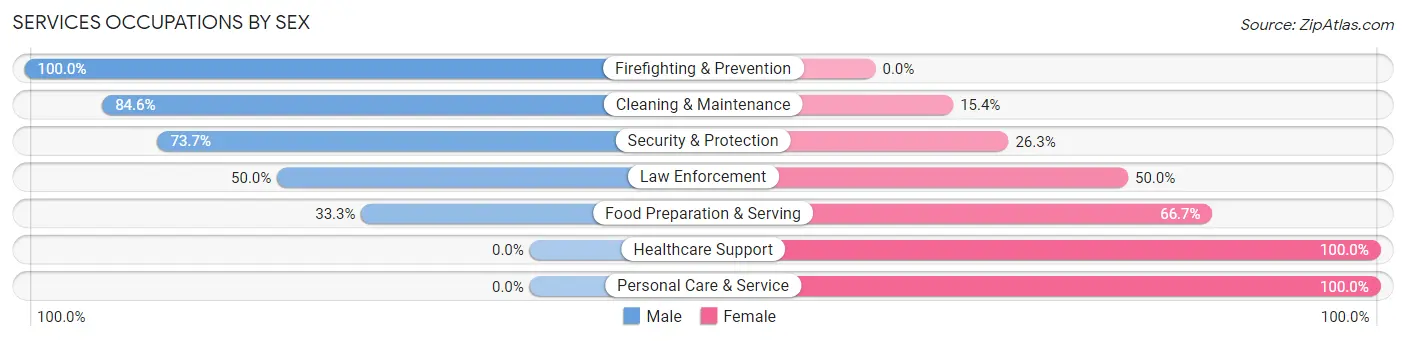
Services Occupations by Sex
Within the Services occupations in Oakfield, the most male-oriented occupations are Firefighting & Prevention (100.0%), Cleaning & Maintenance (84.6%), and Security & Protection (73.7%), while the most female-oriented occupations are Healthcare Support (100.0%), Personal Care & Service (100.0%), and Food Preparation & Serving (66.7%).
| Occupation | Male | Female |
| Healthcare Support | 0 (0.0%) | 21 (100.0%) |
| Security & Protection | 14 (73.7%) | 5 (26.3%) |
| Firefighting & Prevention | 9 (100.0%) | 0 (0.0%) |
| Law Enforcement | 5 (50.0%) | 5 (50.0%) |
| Food Preparation & Serving | 4 (33.3%) | 8 (66.7%) |
| Cleaning & Maintenance | 22 (84.6%) | 4 (15.4%) |
| Personal Care & Service | 0 (0.0%) | 7 (100.0%) |
| Total (Category) | 40 (47.1%) | 45 (52.9%) |
| Total (Overall) | 416 (61.6%) | 259 (38.4%) |
Sales and Office Occupations
The most common Sales and Office occupations in Oakfield are Office & Administration (119 | 17.6%), and Sales & Related (29 | 4.3%).
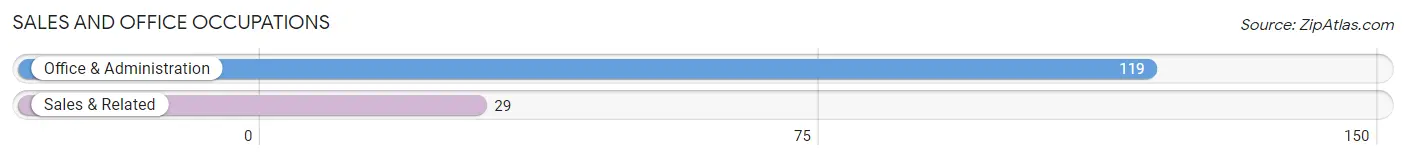
Sales and Office Occupations by Sex
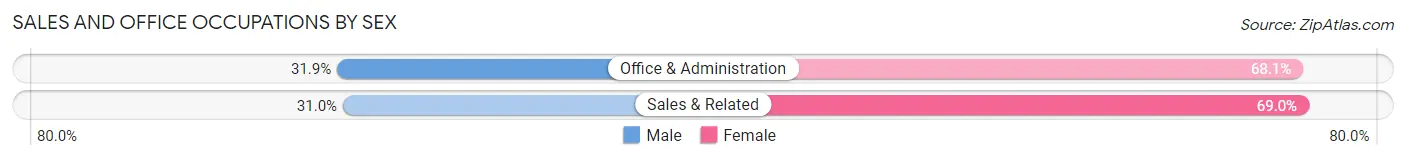
| Occupation | Male | Female |
| Sales & Related | 9 (31.0%) | 20 (69.0%) |
| Office & Administration | 38 (31.9%) | 81 (68.1%) |
| Total (Category) | 47 (31.8%) | 101 (68.2%) |
| Total (Overall) | 416 (61.6%) | 259 (38.4%) |
Natural Resources, Construction and Maintenance Occupations
The most common Natural Resources, Construction and Maintenance occupations in Oakfield are Construction & Extraction (49 | 7.3%), and Installation, Maintenance & Repair (31 | 4.6%).
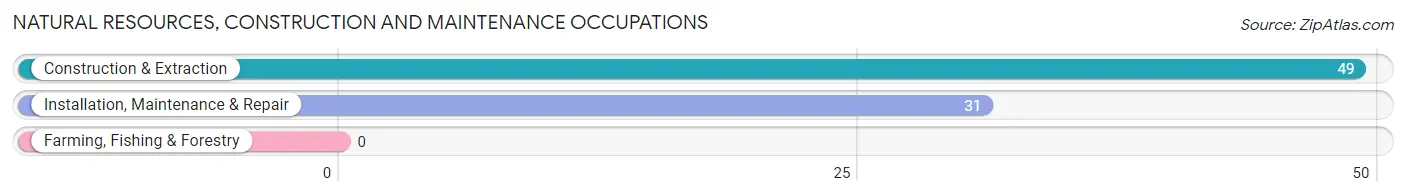
Natural Resources, Construction and Maintenance Occupations by Sex
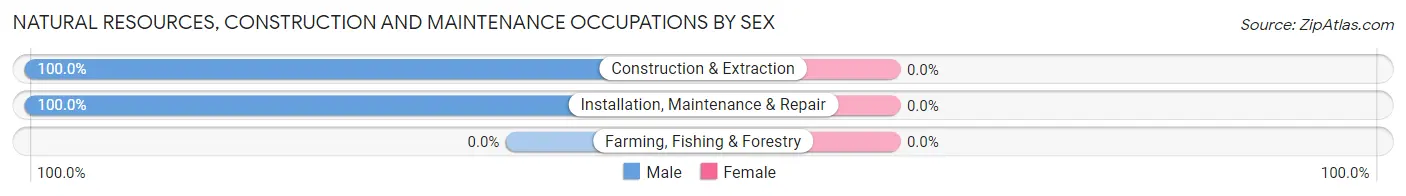
| Occupation | Male | Female |
| Farming, Fishing & Forestry | 0 (0.0%) | 0 (0.0%) |
| Construction & Extraction | 49 (100.0%) | 0 (0.0%) |
| Installation, Maintenance & Repair | 31 (100.0%) | 0 (0.0%) |
| Total (Category) | 80 (100.0%) | 0 (0.0%) |
| Total (Overall) | 416 (61.6%) | 259 (38.4%) |
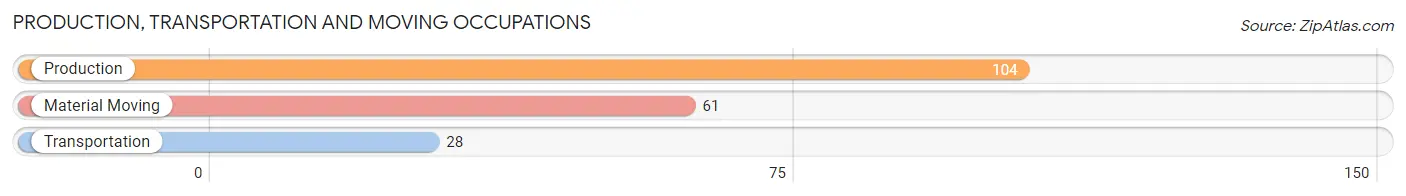
Production, Transportation and Moving Occupations
The most common Production, Transportation and Moving occupations in Oakfield are Production (104 | 15.4%), Material Moving (61 | 9.0%), and Transportation (28 | 4.2%).
Production, Transportation and Moving Occupations by Sex
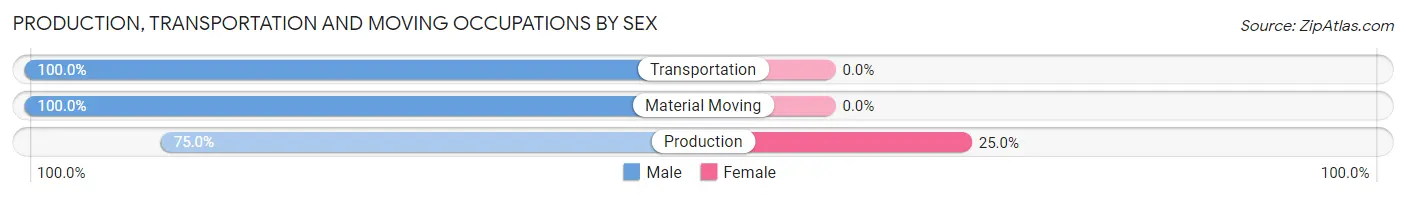
| Occupation | Male | Female |
| Production | 78 (75.0%) | 26 (25.0%) |
| Transportation | 28 (100.0%) | 0 (0.0%) |
| Material Moving | 61 (100.0%) | 0 (0.0%) |
| Total (Category) | 167 (86.5%) | 26 (13.5%) |
| Total (Overall) | 416 (61.6%) | 259 (38.4%) |
Employment Industries by Sex in Oakfield
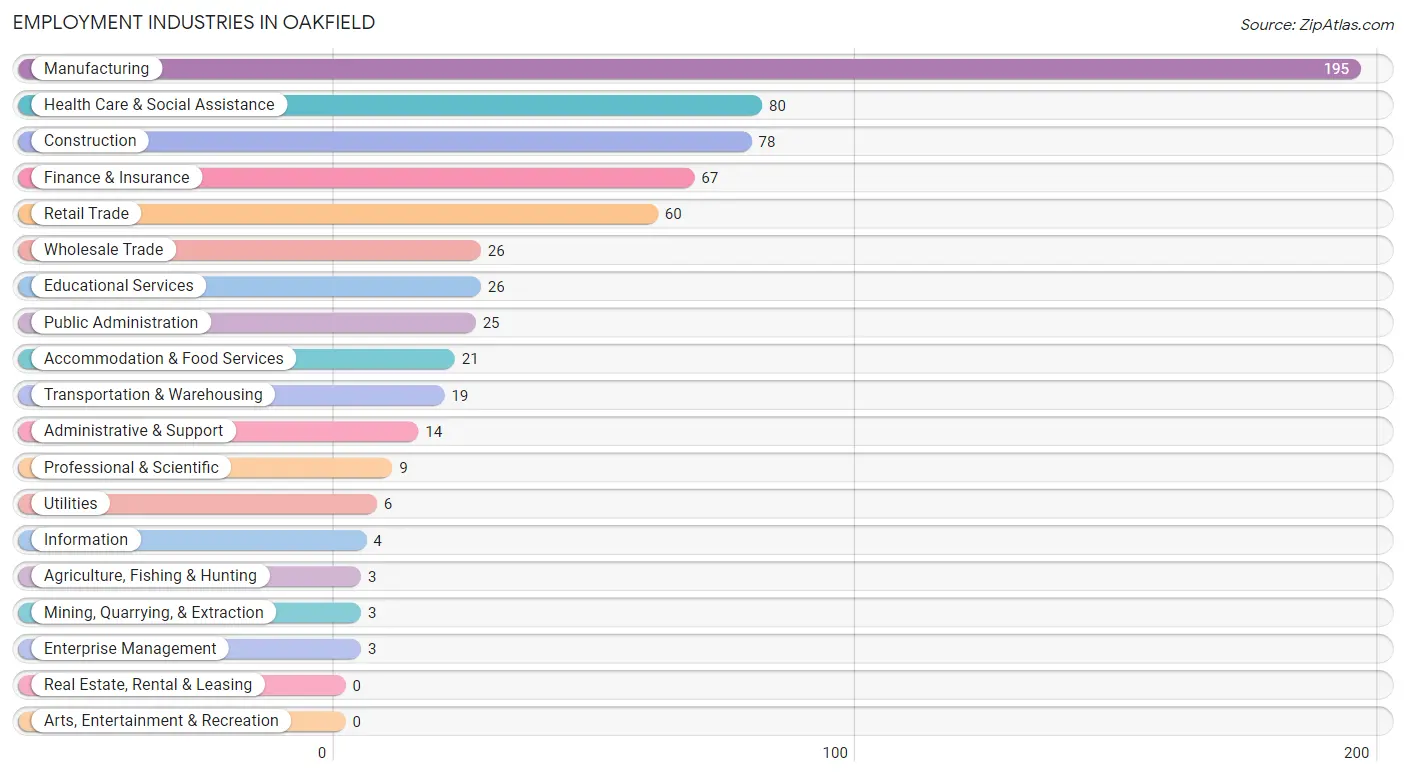
Employment Industries in Oakfield
The major employment industries in Oakfield include Manufacturing (195 | 28.9%), Health Care & Social Assistance (80 | 11.8%), Construction (78 | 11.6%), Finance & Insurance (67 | 9.9%), and Retail Trade (60 | 8.9%).
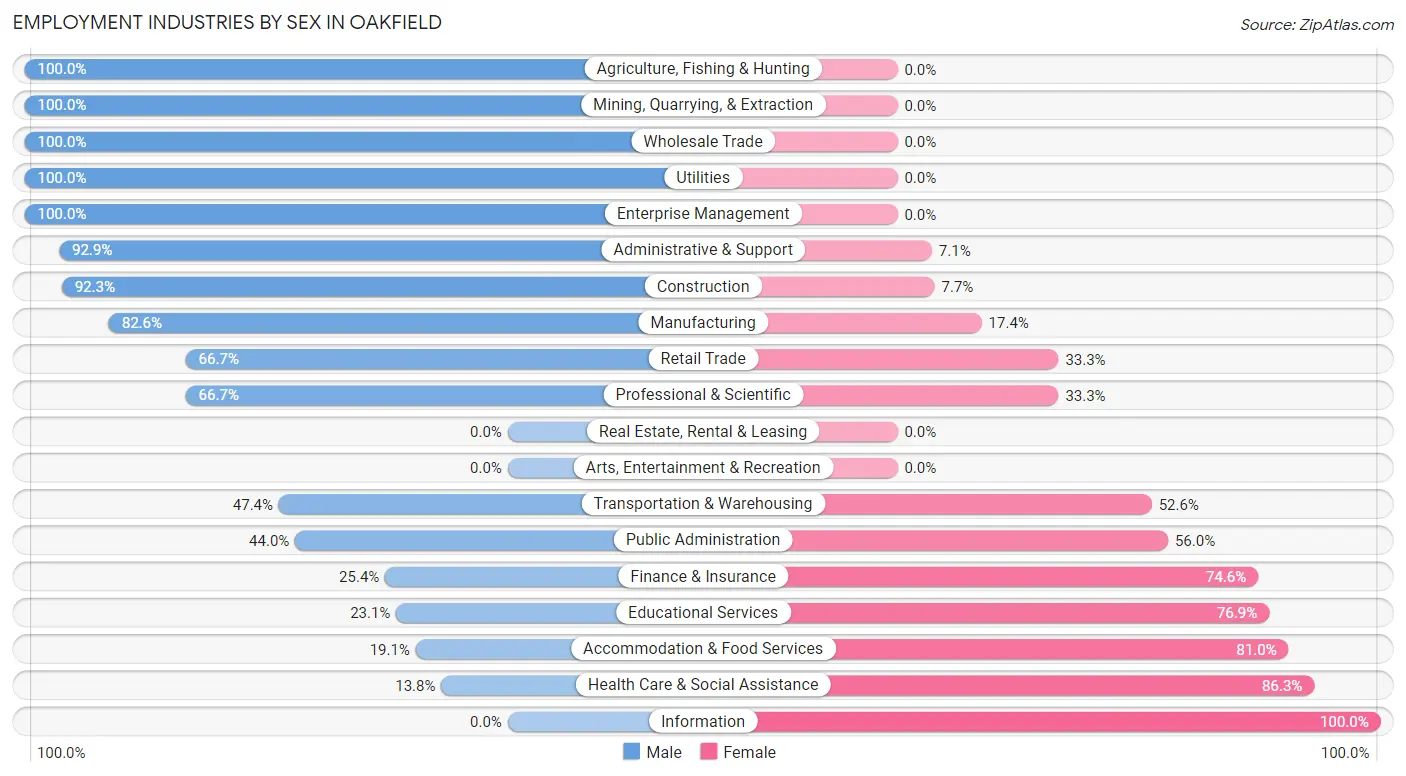
Employment Industries by Sex in Oakfield
The Oakfield industries that see more men than women are Agriculture, Fishing & Hunting (100.0%), Mining, Quarrying, & Extraction (100.0%), and Wholesale Trade (100.0%), whereas the industries that tend to have a higher number of women are Information (100.0%), Health Care & Social Assistance (86.3%), and Accommodation & Food Services (80.9%).
| Industry | Male | Female |
| Agriculture, Fishing & Hunting | 3 (100.0%) | 0 (0.0%) |
| Mining, Quarrying, & Extraction | 3 (100.0%) | 0 (0.0%) |
| Construction | 72 (92.3%) | 6 (7.7%) |
| Manufacturing | 161 (82.6%) | 34 (17.4%) |
| Wholesale Trade | 26 (100.0%) | 0 (0.0%) |
| Retail Trade | 40 (66.7%) | 20 (33.3%) |
| Transportation & Warehousing | 9 (47.4%) | 10 (52.6%) |
| Utilities | 6 (100.0%) | 0 (0.0%) |
| Information | 0 (0.0%) | 4 (100.0%) |
| Finance & Insurance | 17 (25.4%) | 50 (74.6%) |
| Real Estate, Rental & Leasing | 0 (0.0%) | 0 (0.0%) |
| Professional & Scientific | 6 (66.7%) | 3 (33.3%) |
| Enterprise Management | 3 (100.0%) | 0 (0.0%) |
| Administrative & Support | 13 (92.9%) | 1 (7.1%) |
| Educational Services | 6 (23.1%) | 20 (76.9%) |
| Health Care & Social Assistance | 11 (13.8%) | 69 (86.3%) |
| Arts, Entertainment & Recreation | 0 (0.0%) | 0 (0.0%) |
| Accommodation & Food Services | 4 (19.1%) | 17 (80.9%) |
| Public Administration | 11 (44.0%) | 14 (56.0%) |
| Total | 416 (61.6%) | 259 (38.4%) |
Education in Oakfield
School Enrollment in Oakfield
The most common levels of schooling among the 279 students in Oakfield are elementary school (94 | 33.7%), middle school (67 | 24.0%), and high school (52 | 18.6%).
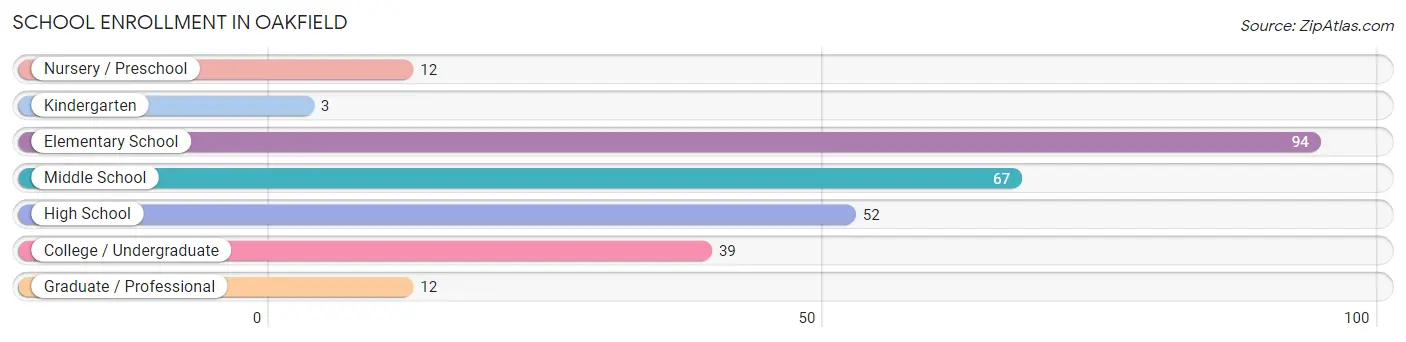
| School Level | # Students | % Students |
| Nursery / Preschool | 12 | 4.3% |
| Kindergarten | 3 | 1.1% |
| Elementary School | 94 | 33.7% |
| Middle School | 67 | 24.0% |
| High School | 52 | 18.6% |
| College / Undergraduate | 39 | 14.0% |
| Graduate / Professional | 12 | 4.3% |
| Total | 279 | 100.0% |
School Enrollment by Age by Funding Source in Oakfield
Out of a total of 279 students who are enrolled in schools in Oakfield, 26 (9.3%) attend a private institution, while the remaining 253 (90.7%) are enrolled in public schools. The age group of 25 to 34 year olds has the highest likelihood of being enrolled in private schools, with 4 (66.7% in the age bracket) enrolled. Conversely, the age group of 5 to 9 year old has the lowest likelihood of being enrolled in a private school, with 94 (100.0% in the age bracket) attending a public institution.
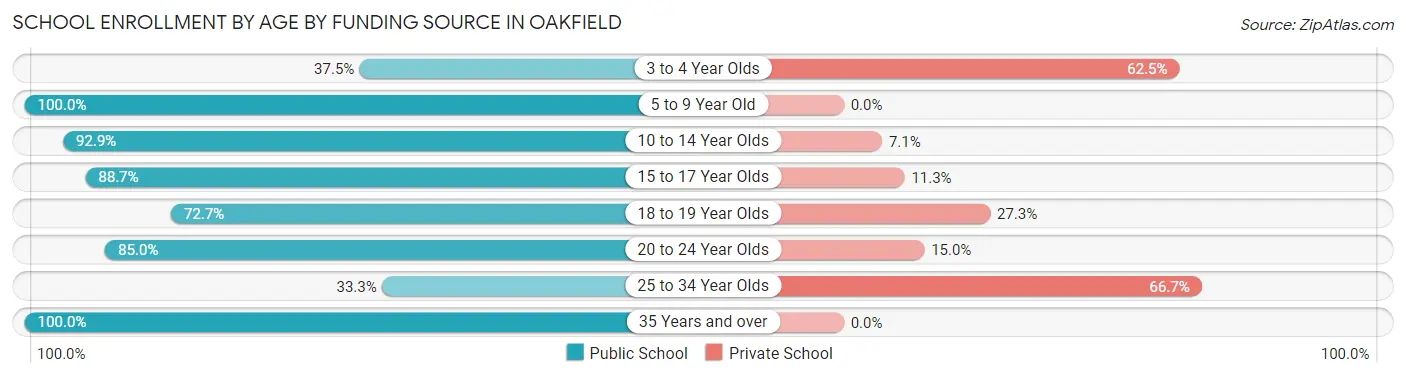
| Age Bracket | Public School | Private School |
| 3 to 4 Year Olds | 3 (37.5%) | 5 (62.5%) |
| 5 to 9 Year Old | 94 (100.0%) | 0 (0.0%) |
| 10 to 14 Year Olds | 65 (92.9%) | 5 (7.1%) |
| 15 to 17 Year Olds | 47 (88.7%) | 6 (11.3%) |
| 18 to 19 Year Olds | 8 (72.7%) | 3 (27.3%) |
| 20 to 24 Year Olds | 17 (85.0%) | 3 (15.0%) |
| 25 to 34 Year Olds | 2 (33.3%) | 4 (66.7%) |
| 35 Years and over | 17 (100.0%) | 0 (0.0%) |
| Total | 253 (90.7%) | 26 (9.3%) |
Educational Attainment by Field of Study in Oakfield
Business (128 | 46.6%), education (25 | 9.1%), science & technology (24 | 8.7%), psychology (16 | 5.8%), and engineering (13 | 4.7%) are the most common fields of study among 275 individuals in Oakfield who have obtained a bachelor's degree or higher.
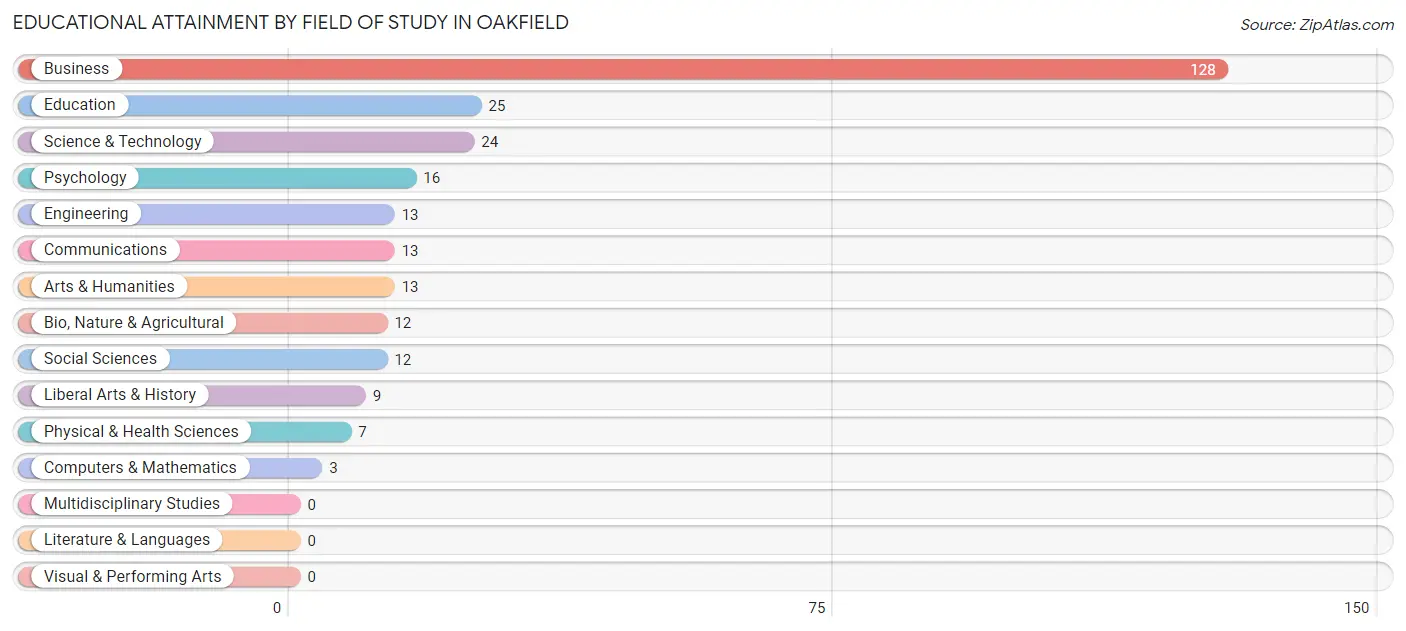
| Field of Study | # Graduates | % Graduates |
| Computers & Mathematics | 3 | 1.1% |
| Bio, Nature & Agricultural | 12 | 4.4% |
| Physical & Health Sciences | 7 | 2.5% |
| Psychology | 16 | 5.8% |
| Social Sciences | 12 | 4.4% |
| Engineering | 13 | 4.7% |
| Multidisciplinary Studies | 0 | 0.0% |
| Science & Technology | 24 | 8.7% |
| Business | 128 | 46.6% |
| Education | 25 | 9.1% |
| Literature & Languages | 0 | 0.0% |
| Liberal Arts & History | 9 | 3.3% |
| Visual & Performing Arts | 0 | 0.0% |
| Communications | 13 | 4.7% |
| Arts & Humanities | 13 | 4.7% |
| Total | 275 | 100.0% |
Transportation & Commute in Oakfield
Vehicle Availability by Sex in Oakfield
The most prevalent vehicle ownership categories in Oakfield are males with 3 vehicles (126, accounting for 30.5%) and females with 3 vehicles (79, making up 48.3%).
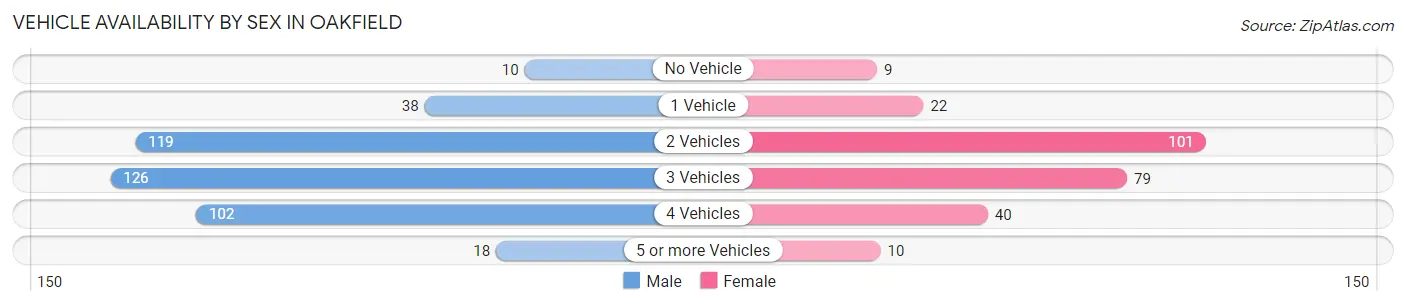
| Vehicles Available | Male | Female |
| No Vehicle | 10 (2.4%) | 9 (3.5%) |
| 1 Vehicle | 38 (9.2%) | 22 (8.4%) |
| 2 Vehicles | 119 (28.8%) | 101 (38.7%) |
| 3 Vehicles | 126 (30.5%) | 79 (30.3%) |
| 4 Vehicles | 102 (24.7%) | 40 (15.3%) |
| 5 or more Vehicles | 18 (4.4%) | 10 (3.8%) |
| Total | 413 (100.0%) | 261 (100.0%) |
Commute Time in Oakfield
The most frequently occuring commute durations in Oakfield are 15 to 19 minutes (157 commuters, 25.7%), 10 to 14 minutes (116 commuters, 19.0%), and 20 to 24 minutes (107 commuters, 17.5%).
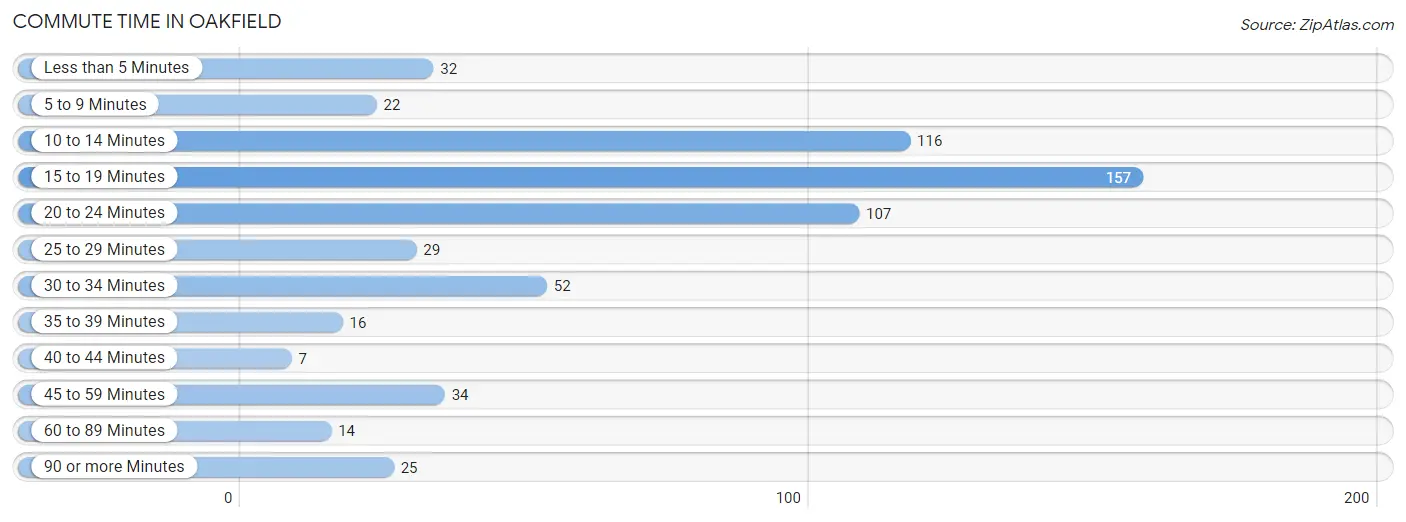
| Commute Time | # Commuters | % Commuters |
| Less than 5 Minutes | 32 | 5.2% |
| 5 to 9 Minutes | 22 | 3.6% |
| 10 to 14 Minutes | 116 | 19.0% |
| 15 to 19 Minutes | 157 | 25.7% |
| 20 to 24 Minutes | 107 | 17.5% |
| 25 to 29 Minutes | 29 | 4.8% |
| 30 to 34 Minutes | 52 | 8.5% |
| 35 to 39 Minutes | 16 | 2.6% |
| 40 to 44 Minutes | 7 | 1.1% |
| 45 to 59 Minutes | 34 | 5.6% |
| 60 to 89 Minutes | 14 | 2.3% |
| 90 or more Minutes | 25 | 4.1% |
Commute Time by Sex in Oakfield
The most common commute times in Oakfield are 10 to 14 minutes (102 commuters, 26.4%) for males and 15 to 19 minutes (64 commuters, 28.4%) for females.
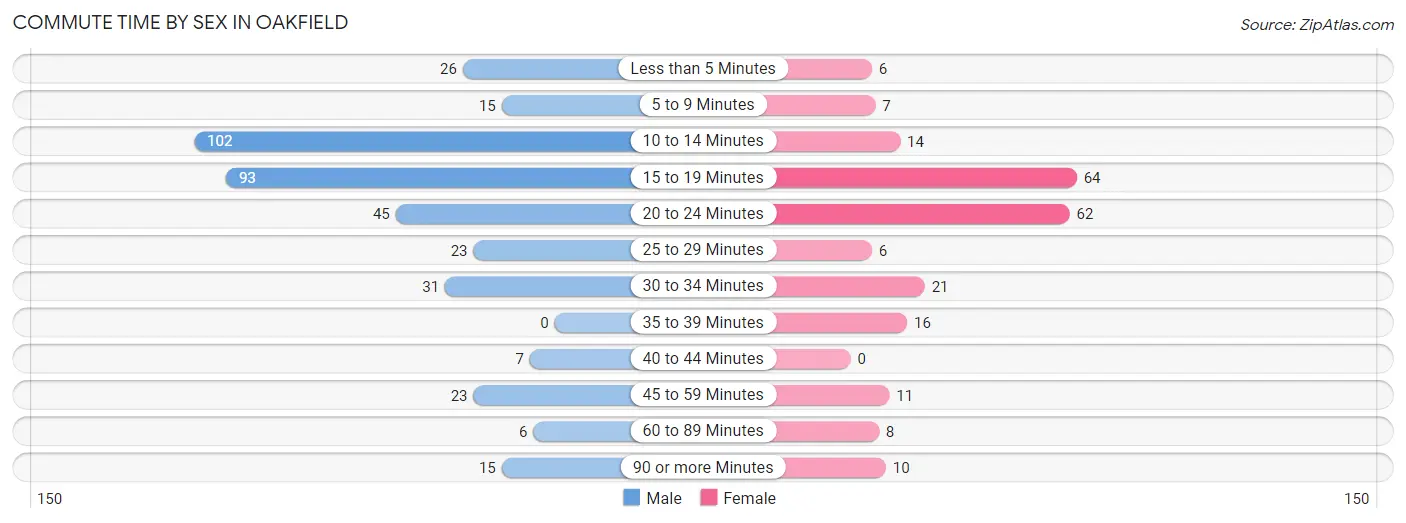
| Commute Time | Male | Female |
| Less than 5 Minutes | 26 (6.7%) | 6 (2.7%) |
| 5 to 9 Minutes | 15 (3.9%) | 7 (3.1%) |
| 10 to 14 Minutes | 102 (26.4%) | 14 (6.2%) |
| 15 to 19 Minutes | 93 (24.1%) | 64 (28.4%) |
| 20 to 24 Minutes | 45 (11.7%) | 62 (27.6%) |
| 25 to 29 Minutes | 23 (6.0%) | 6 (2.7%) |
| 30 to 34 Minutes | 31 (8.0%) | 21 (9.3%) |
| 35 to 39 Minutes | 0 (0.0%) | 16 (7.1%) |
| 40 to 44 Minutes | 7 (1.8%) | 0 (0.0%) |
| 45 to 59 Minutes | 23 (6.0%) | 11 (4.9%) |
| 60 to 89 Minutes | 6 (1.5%) | 8 (3.6%) |
| 90 or more Minutes | 15 (3.9%) | 10 (4.4%) |
Time of Departure to Work by Sex in Oakfield
The most frequent times of departure to work in Oakfield are 6:00 AM to 6:29 AM (61, 15.8%) for males and 7:30 AM to 7:59 AM (52, 23.1%) for females.
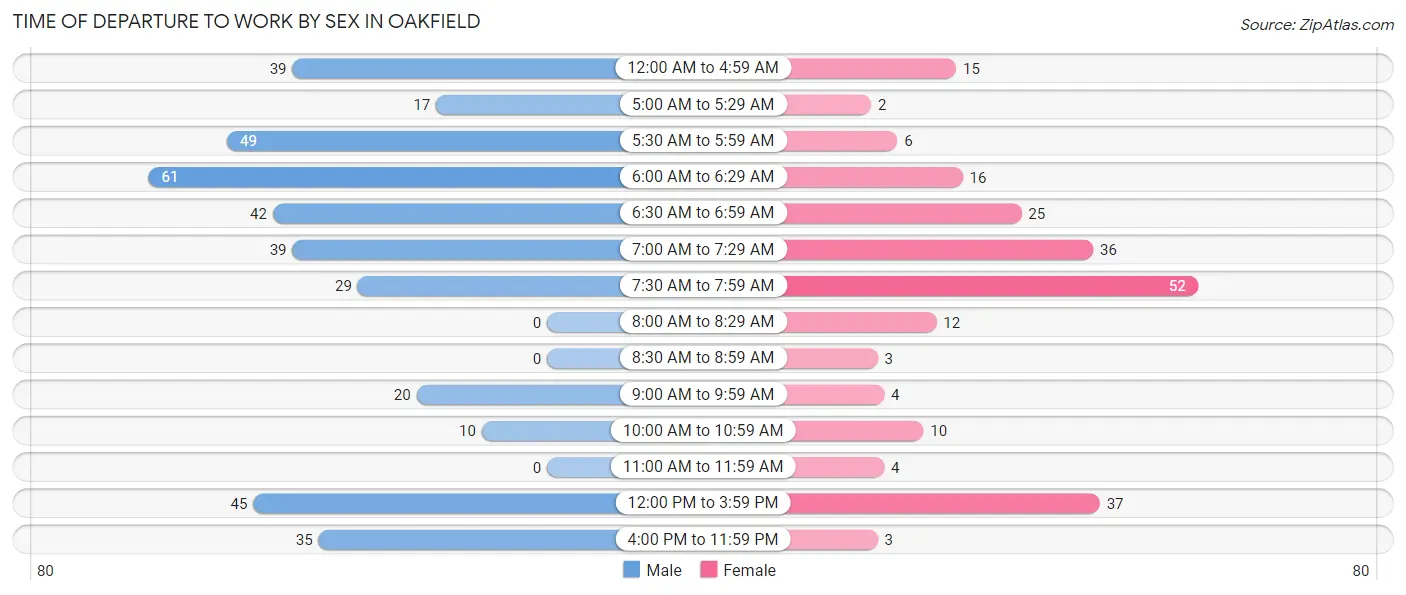
| Time of Departure | Male | Female |
| 12:00 AM to 4:59 AM | 39 (10.1%) | 15 (6.7%) |
| 5:00 AM to 5:29 AM | 17 (4.4%) | 2 (0.9%) |
| 5:30 AM to 5:59 AM | 49 (12.7%) | 6 (2.7%) |
| 6:00 AM to 6:29 AM | 61 (15.8%) | 16 (7.1%) |
| 6:30 AM to 6:59 AM | 42 (10.9%) | 25 (11.1%) |
| 7:00 AM to 7:29 AM | 39 (10.1%) | 36 (16.0%) |
| 7:30 AM to 7:59 AM | 29 (7.5%) | 52 (23.1%) |
| 8:00 AM to 8:29 AM | 0 (0.0%) | 12 (5.3%) |
| 8:30 AM to 8:59 AM | 0 (0.0%) | 3 (1.3%) |
| 9:00 AM to 9:59 AM | 20 (5.2%) | 4 (1.8%) |
| 10:00 AM to 10:59 AM | 10 (2.6%) | 10 (4.4%) |
| 11:00 AM to 11:59 AM | 0 (0.0%) | 4 (1.8%) |
| 12:00 PM to 3:59 PM | 45 (11.7%) | 37 (16.4%) |
| 4:00 PM to 11:59 PM | 35 (9.1%) | 3 (1.3%) |
| Total | 386 (100.0%) | 225 (100.0%) |
Housing Occupancy in Oakfield
Occupancy by Ownership in Oakfield
Of the total 507 dwellings in Oakfield, owner-occupied units account for 411 (81.1%), while renter-occupied units make up 96 (18.9%).
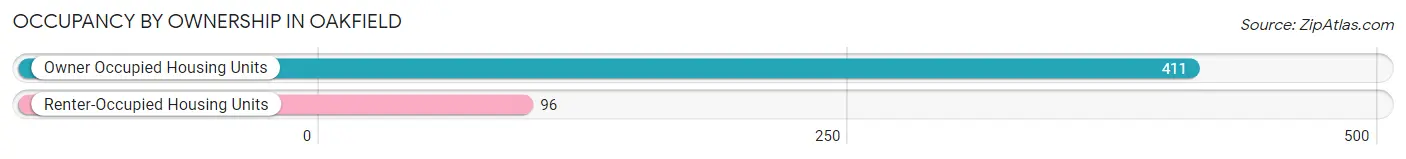
| Occupancy | # Housing Units | % Housing Units |
| Owner Occupied Housing Units | 411 | 81.1% |
| Renter-Occupied Housing Units | 96 | 18.9% |
| Total Occupied Housing Units | 507 | 100.0% |
Occupancy by Household Size in Oakfield
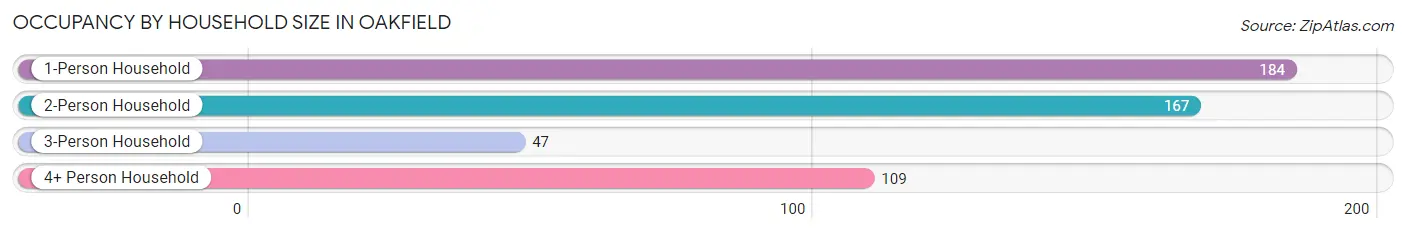
| Household Size | # Housing Units | % Housing Units |
| 1-Person Household | 184 | 36.3% |
| 2-Person Household | 167 | 32.9% |
| 3-Person Household | 47 | 9.3% |
| 4+ Person Household | 109 | 21.5% |
| Total Housing Units | 507 | 100.0% |
Occupancy by Ownership by Household Size in Oakfield
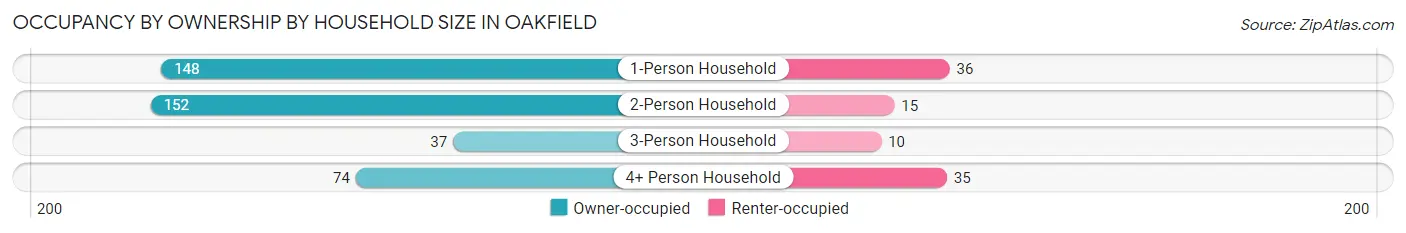
| Household Size | Owner-occupied | Renter-occupied |
| 1-Person Household | 148 (80.4%) | 36 (19.6%) |
| 2-Person Household | 152 (91.0%) | 15 (9.0%) |
| 3-Person Household | 37 (78.7%) | 10 (21.3%) |
| 4+ Person Household | 74 (67.9%) | 35 (32.1%) |
| Total Housing Units | 411 (81.1%) | 96 (18.9%) |
Occupancy by Educational Attainment in Oakfield
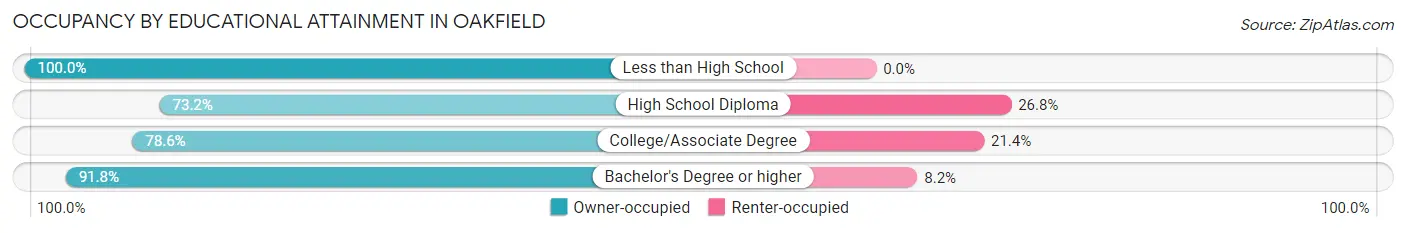
| Household Size | Owner-occupied | Renter-occupied |
| Less than High School | 17 (100.0%) | 0 (0.0%) |
| High School Diploma | 145 (73.2%) | 53 (26.8%) |
| College/Associate Degree | 114 (78.6%) | 31 (21.4%) |
| Bachelor's Degree or higher | 135 (91.8%) | 12 (8.2%) |
Occupancy by Age of Householder in Oakfield
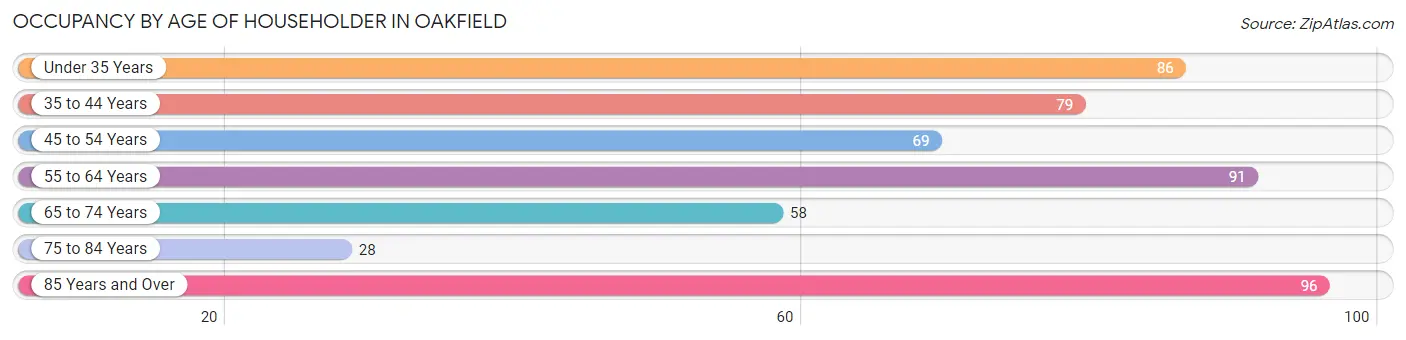
| Age Bracket | # Households | % Households |
| Under 35 Years | 86 | 17.0% |
| 35 to 44 Years | 79 | 15.6% |
| 45 to 54 Years | 69 | 13.6% |
| 55 to 64 Years | 91 | 17.9% |
| 65 to 74 Years | 58 | 11.4% |
| 75 to 84 Years | 28 | 5.5% |
| 85 Years and Over | 96 | 18.9% |
| Total | 507 | 100.0% |
Housing Finances in Oakfield
Median Income by Occupancy in Oakfield
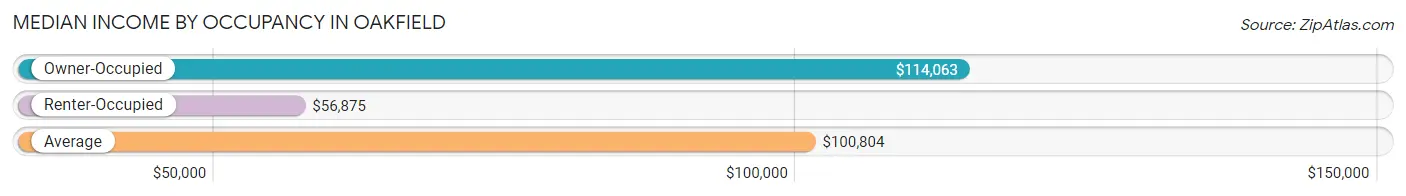
| Occupancy Type | # Households | Median Income |
| Owner-Occupied | 411 (81.1%) | $114,063 |
| Renter-Occupied | 96 (18.9%) | $56,875 |
| Average | 507 (100.0%) | $100,804 |
Occupancy by Householder Income Bracket in Oakfield
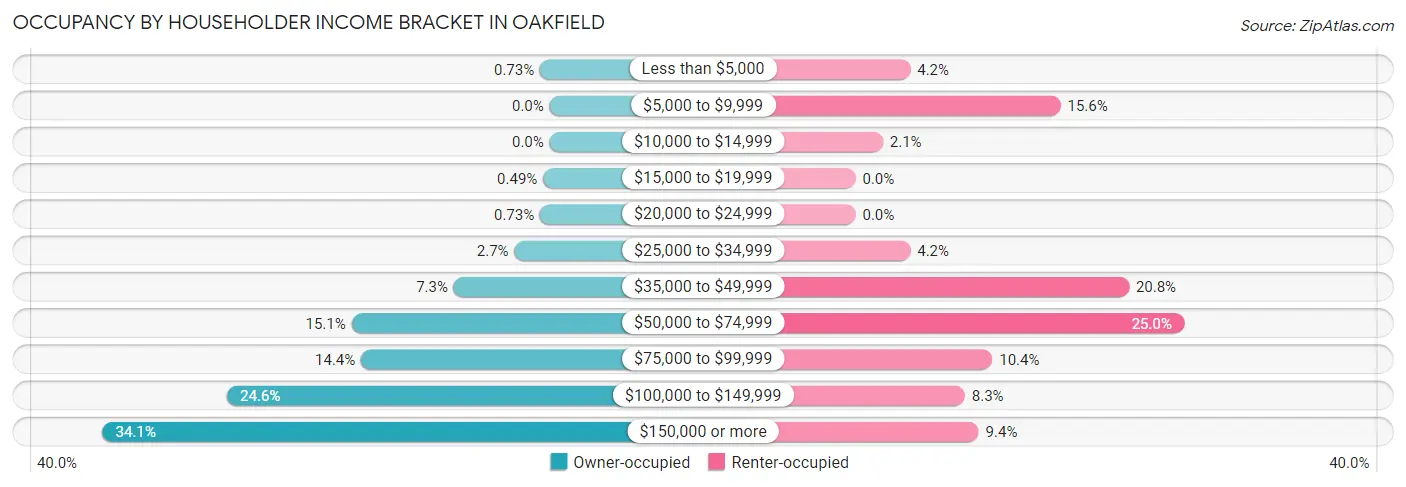
| Income Bracket | Owner-occupied | Renter-occupied |
| Less than $5,000 | 3 (0.7%) | 4 (4.2%) |
| $5,000 to $9,999 | 0 (0.0%) | 15 (15.6%) |
| $10,000 to $14,999 | 0 (0.0%) | 2 (2.1%) |
| $15,000 to $19,999 | 2 (0.5%) | 0 (0.0%) |
| $20,000 to $24,999 | 3 (0.7%) | 0 (0.0%) |
| $25,000 to $34,999 | 11 (2.7%) | 4 (4.2%) |
| $35,000 to $49,999 | 30 (7.3%) | 20 (20.8%) |
| $50,000 to $74,999 | 62 (15.1%) | 24 (25.0%) |
| $75,000 to $99,999 | 59 (14.4%) | 10 (10.4%) |
| $100,000 to $149,999 | 101 (24.6%) | 8 (8.3%) |
| $150,000 or more | 140 (34.1%) | 9 (9.4%) |
| Total | 411 (100.0%) | 96 (100.0%) |
Monthly Housing Cost Tiers in Oakfield
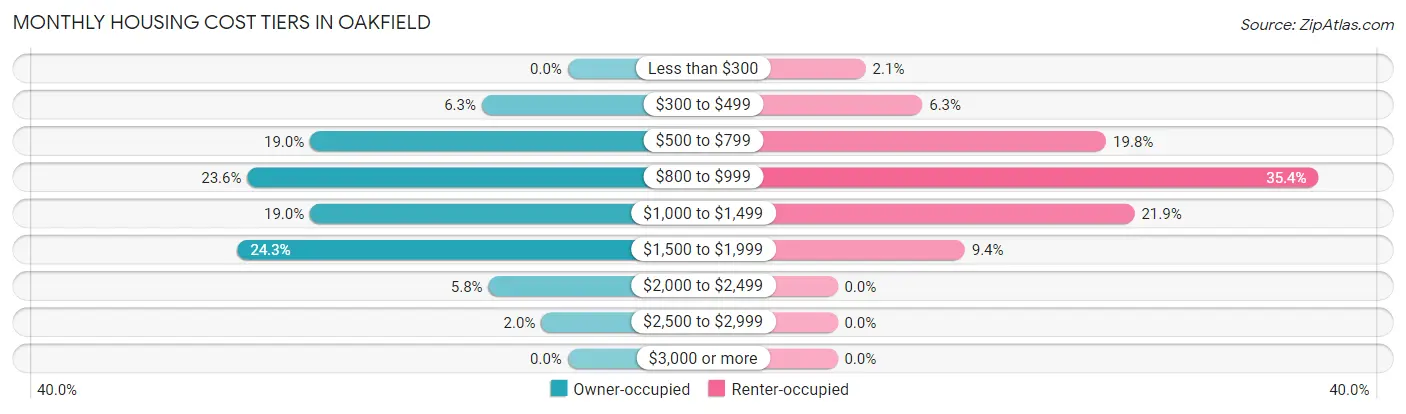
| Monthly Cost | Owner-occupied | Renter-occupied |
| Less than $300 | 0 (0.0%) | 2 (2.1%) |
| $300 to $499 | 26 (6.3%) | 6 (6.2%) |
| $500 to $799 | 78 (19.0%) | 19 (19.8%) |
| $800 to $999 | 97 (23.6%) | 34 (35.4%) |
| $1,000 to $1,499 | 78 (19.0%) | 21 (21.9%) |
| $1,500 to $1,999 | 100 (24.3%) | 9 (9.4%) |
| $2,000 to $2,499 | 24 (5.8%) | 0 (0.0%) |
| $2,500 to $2,999 | 8 (1.9%) | 0 (0.0%) |
| $3,000 or more | 0 (0.0%) | 0 (0.0%) |
| Total | 411 (100.0%) | 96 (100.0%) |
Physical Housing Characteristics in Oakfield
Housing Structures in Oakfield
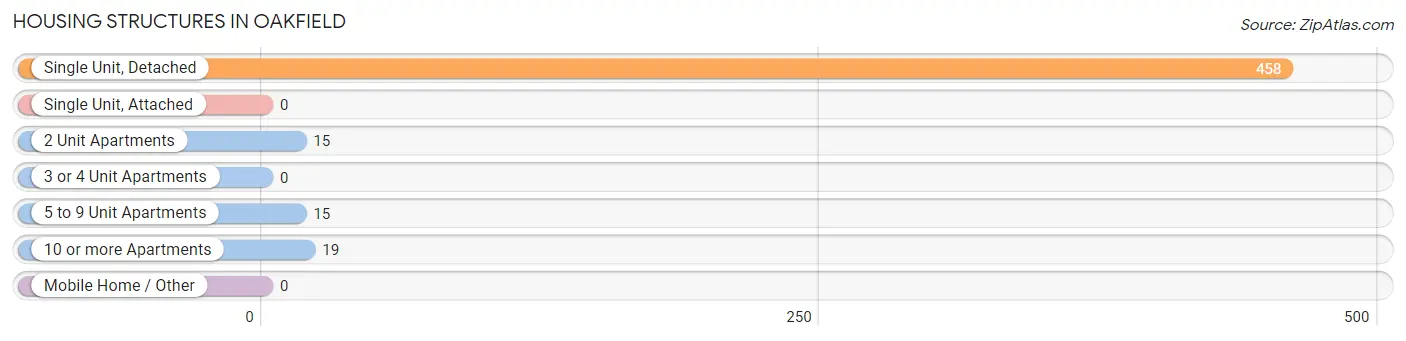
| Structure Type | # Housing Units | % Housing Units |
| Single Unit, Detached | 458 | 90.3% |
| Single Unit, Attached | 0 | 0.0% |
| 2 Unit Apartments | 15 | 3.0% |
| 3 or 4 Unit Apartments | 0 | 0.0% |
| 5 to 9 Unit Apartments | 15 | 3.0% |
| 10 or more Apartments | 19 | 3.7% |
| Mobile Home / Other | 0 | 0.0% |
| Total | 507 | 100.0% |
Housing Structures by Occupancy in Oakfield
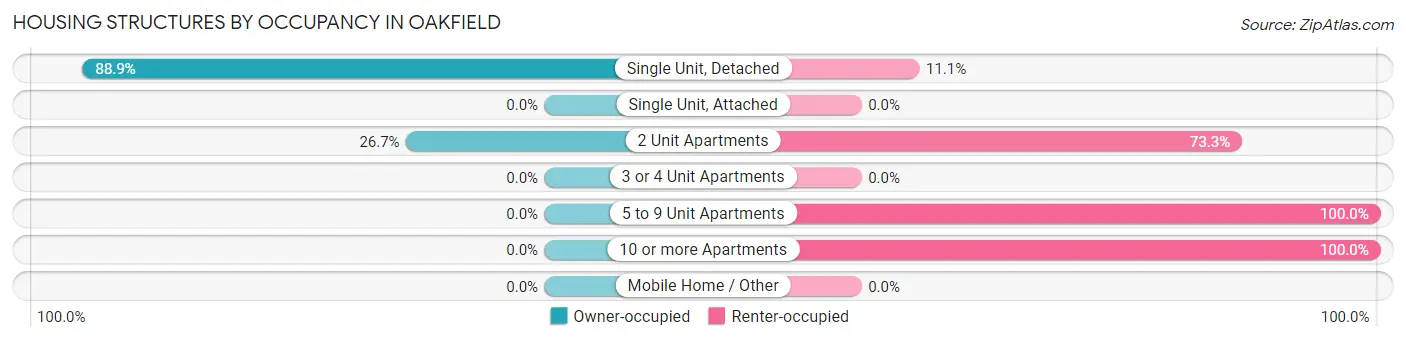
| Structure Type | Owner-occupied | Renter-occupied |
| Single Unit, Detached | 407 (88.9%) | 51 (11.1%) |
| Single Unit, Attached | 0 (0.0%) | 0 (0.0%) |
| 2 Unit Apartments | 4 (26.7%) | 11 (73.3%) |
| 3 or 4 Unit Apartments | 0 (0.0%) | 0 (0.0%) |
| 5 to 9 Unit Apartments | 0 (0.0%) | 15 (100.0%) |
| 10 or more Apartments | 0 (0.0%) | 19 (100.0%) |
| Mobile Home / Other | 0 (0.0%) | 0 (0.0%) |
| Total | 411 (81.1%) | 96 (18.9%) |
Housing Structures by Number of Rooms in Oakfield
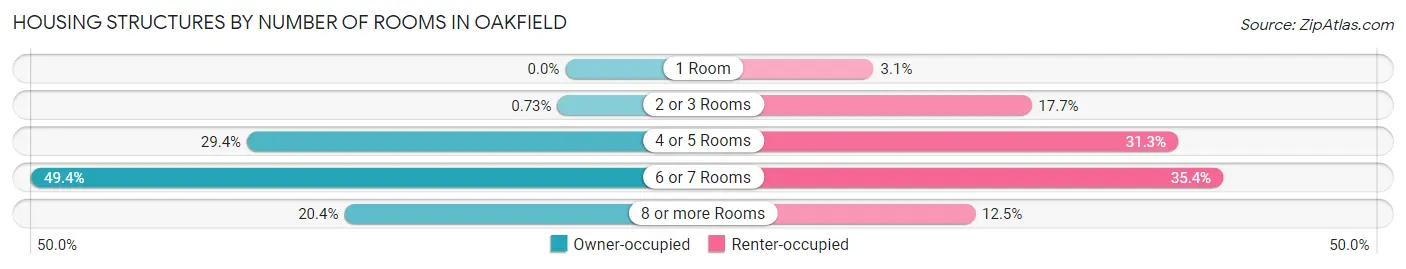
| Number of Rooms | Owner-occupied | Renter-occupied |
| 1 Room | 0 (0.0%) | 3 (3.1%) |
| 2 or 3 Rooms | 3 (0.7%) | 17 (17.7%) |
| 4 or 5 Rooms | 121 (29.4%) | 30 (31.2%) |
| 6 or 7 Rooms | 203 (49.4%) | 34 (35.4%) |
| 8 or more Rooms | 84 (20.4%) | 12 (12.5%) |
| Total | 411 (100.0%) | 96 (100.0%) |
Housing Structure by Heating Type in Oakfield
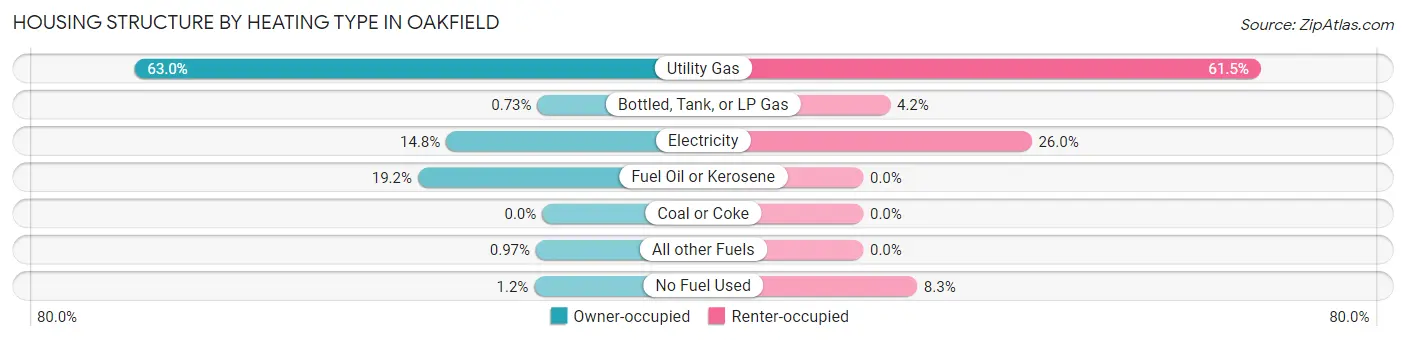
| Heating Type | Owner-occupied | Renter-occupied |
| Utility Gas | 259 (63.0%) | 59 (61.5%) |
| Bottled, Tank, or LP Gas | 3 (0.7%) | 4 (4.2%) |
| Electricity | 61 (14.8%) | 25 (26.0%) |
| Fuel Oil or Kerosene | 79 (19.2%) | 0 (0.0%) |
| Coal or Coke | 0 (0.0%) | 0 (0.0%) |
| All other Fuels | 4 (1.0%) | 0 (0.0%) |
| No Fuel Used | 5 (1.2%) | 8 (8.3%) |
| Total | 411 (100.0%) | 96 (100.0%) |
Household Vehicle Usage in Oakfield
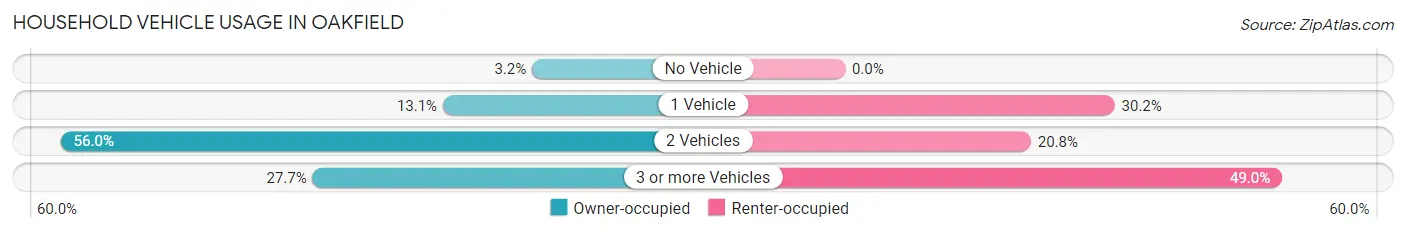
| Vehicles per Household | Owner-occupied | Renter-occupied |
| No Vehicle | 13 (3.2%) | 0 (0.0%) |
| 1 Vehicle | 54 (13.1%) | 29 (30.2%) |
| 2 Vehicles | 230 (56.0%) | 20 (20.8%) |
| 3 or more Vehicles | 114 (27.7%) | 47 (49.0%) |
| Total | 411 (100.0%) | 96 (100.0%) |
Real Estate & Mortgages in Oakfield
Real Estate and Mortgage Overview in Oakfield
| Characteristic | Without Mortgage | With Mortgage |
| Housing Units | 187 | 224 |
| Median Property Value | $253,400 | $200,800 |
| Median Household Income | $101,750 | $67 |
| Monthly Housing Costs | $758 | $0 |
| Real Estate Taxes | $4,200 | $0 |
Property Value by Mortgage Status in Oakfield
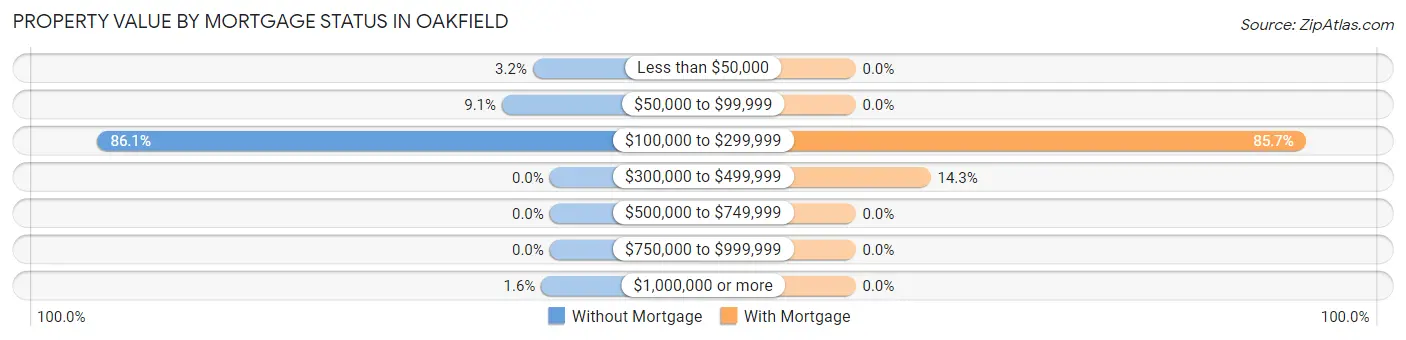
| Property Value | Without Mortgage | With Mortgage |
| Less than $50,000 | 6 (3.2%) | 0 (0.0%) |
| $50,000 to $99,999 | 17 (9.1%) | 0 (0.0%) |
| $100,000 to $299,999 | 161 (86.1%) | 192 (85.7%) |
| $300,000 to $499,999 | 0 (0.0%) | 32 (14.3%) |
| $500,000 to $749,999 | 0 (0.0%) | 0 (0.0%) |
| $750,000 to $999,999 | 0 (0.0%) | 0 (0.0%) |
| $1,000,000 or more | 3 (1.6%) | 0 (0.0%) |
| Total | 187 (100.0%) | 224 (100.0%) |
Household Income by Mortgage Status in Oakfield
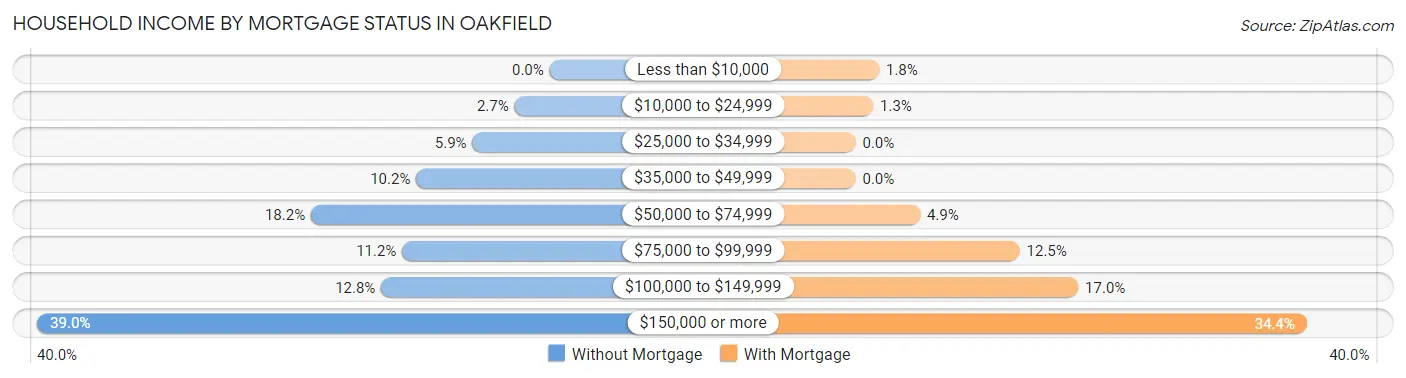
| Household Income | Without Mortgage | With Mortgage |
| Less than $10,000 | 0 (0.0%) | 4 (1.8%) |
| $10,000 to $24,999 | 5 (2.7%) | 3 (1.3%) |
| $25,000 to $34,999 | 11 (5.9%) | 0 (0.0%) |
| $35,000 to $49,999 | 19 (10.2%) | 0 (0.0%) |
| $50,000 to $74,999 | 34 (18.2%) | 11 (4.9%) |
| $75,000 to $99,999 | 21 (11.2%) | 28 (12.5%) |
| $100,000 to $149,999 | 24 (12.8%) | 38 (17.0%) |
| $150,000 or more | 73 (39.0%) | 77 (34.4%) |
| Total | 187 (100.0%) | 224 (100.0%) |
Property Value to Household Income Ratio in Oakfield
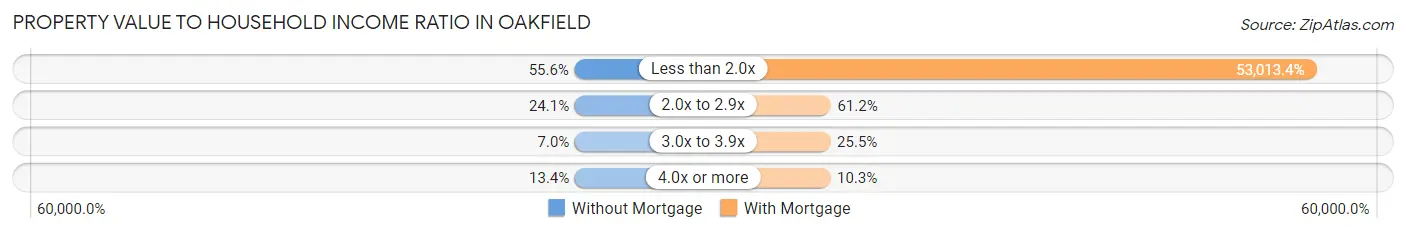
| Value-to-Income Ratio | Without Mortgage | With Mortgage |
| Less than 2.0x | 104 (55.6%) | 118,750 (53,013.4%) |
| 2.0x to 2.9x | 45 (24.1%) | 137 (61.2%) |
| 3.0x to 3.9x | 13 (7.0%) | 57 (25.5%) |
| 4.0x or more | 25 (13.4%) | 23 (10.3%) |
| Total | 187 (100.0%) | 224 (100.0%) |
Real Estate Taxes by Mortgage Status in Oakfield
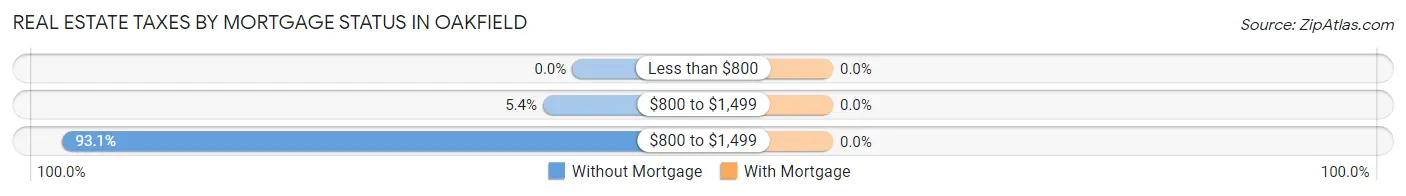
| Property Taxes | Without Mortgage | With Mortgage |
| Less than $800 | 0 (0.0%) | 0 (0.0%) |
| $800 to $1,499 | 10 (5.3%) | 0 (0.0%) |
| $800 to $1,499 | 174 (93.0%) | 0 (0.0%) |
| Total | 187 (100.0%) | 224 (100.0%) |
Health & Disability in Oakfield
Health Insurance Coverage by Age in Oakfield
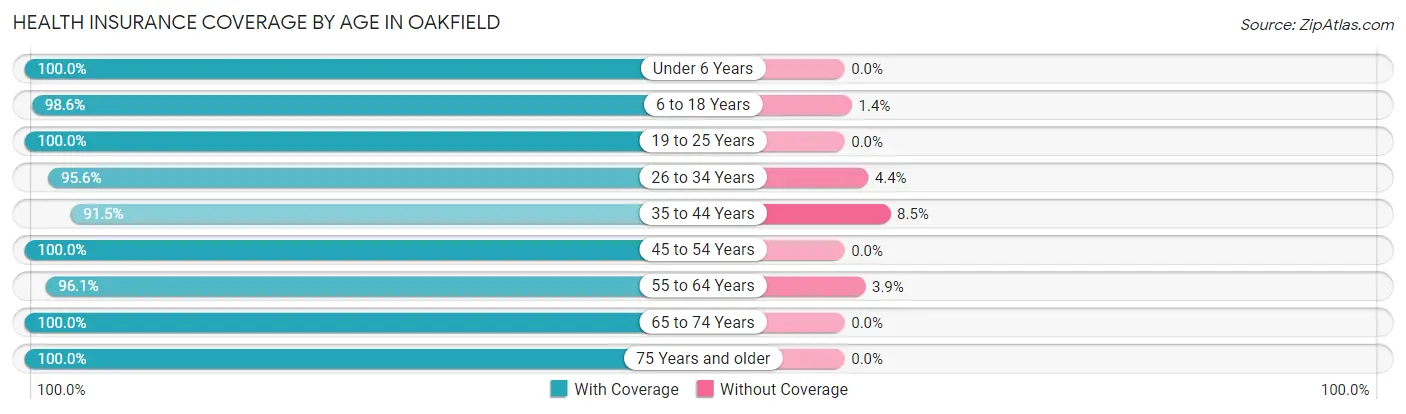
| Age Bracket | With Coverage | Without Coverage |
| Under 6 Years | 63 (100.0%) | 0 (0.0%) |
| 6 to 18 Years | 218 (98.6%) | 3 (1.4%) |
| 19 to 25 Years | 100 (100.0%) | 0 (0.0%) |
| 26 to 34 Years | 109 (95.6%) | 5 (4.4%) |
| 35 to 44 Years | 150 (91.5%) | 14 (8.5%) |
| 45 to 54 Years | 142 (100.0%) | 0 (0.0%) |
| 55 to 64 Years | 149 (96.1%) | 6 (3.9%) |
| 65 to 74 Years | 104 (100.0%) | 0 (0.0%) |
| 75 Years and older | 151 (100.0%) | 0 (0.0%) |
| Total | 1,186 (97.7%) | 28 (2.3%) |
Health Insurance Coverage by Citizenship Status in Oakfield
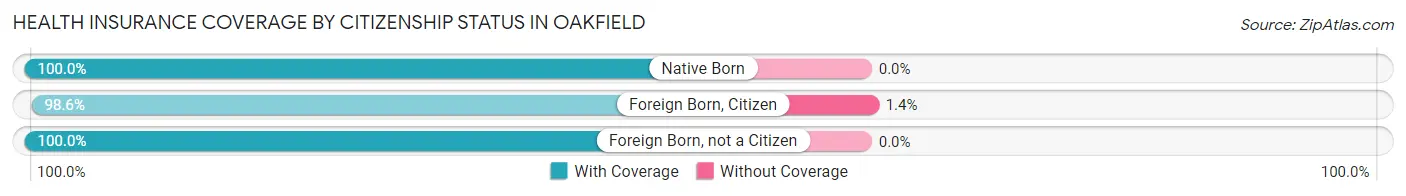
| Citizenship Status | With Coverage | Without Coverage |
| Native Born | 63 (100.0%) | 0 (0.0%) |
| Foreign Born, Citizen | 218 (98.6%) | 3 (1.4%) |
| Foreign Born, not a Citizen | 100 (100.0%) | 0 (0.0%) |
Health Insurance Coverage by Household Income in Oakfield
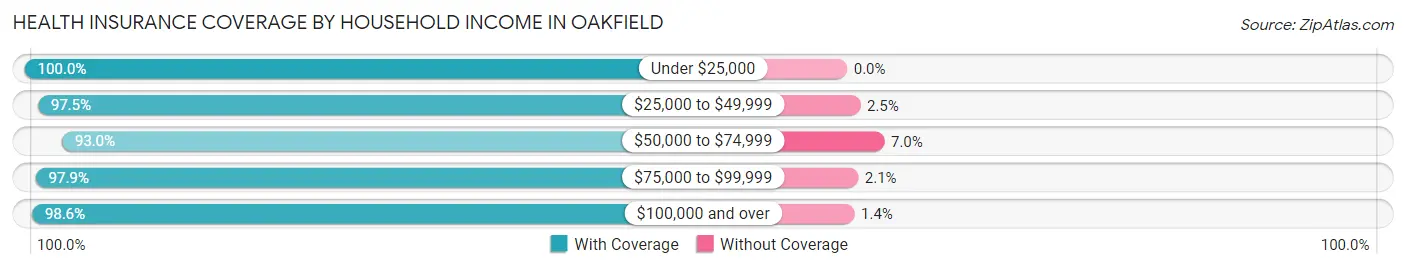
| Household Income | With Coverage | Without Coverage |
| Under $25,000 | 45 (100.0%) | 0 (0.0%) |
| $25,000 to $49,999 | 118 (97.5%) | 3 (2.5%) |
| $50,000 to $74,999 | 160 (93.0%) | 12 (7.0%) |
| $75,000 to $99,999 | 142 (97.9%) | 3 (2.1%) |
| $100,000 and over | 721 (98.6%) | 10 (1.4%) |
Public vs Private Health Insurance Coverage by Age in Oakfield
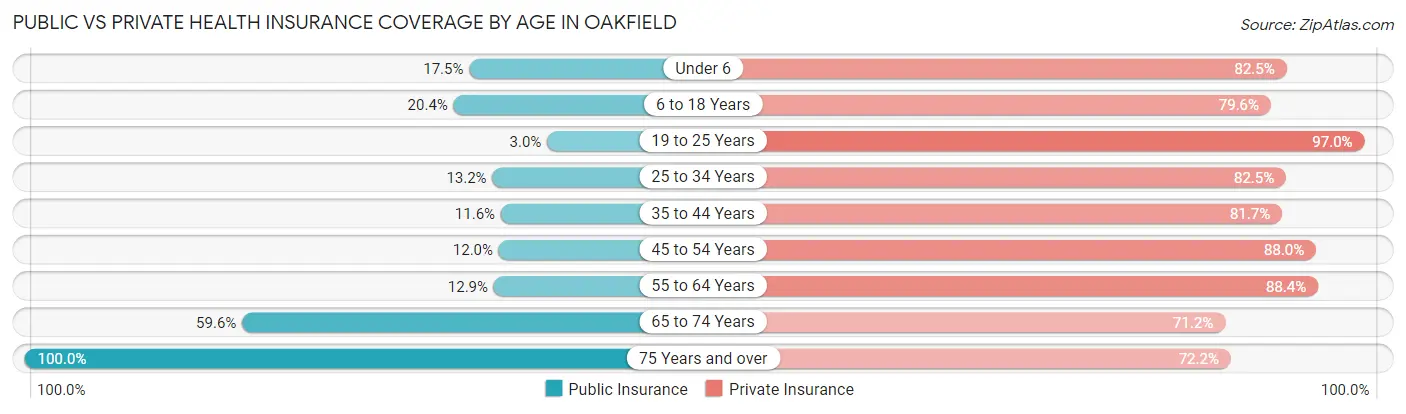
| Age Bracket | Public Insurance | Private Insurance |
| Under 6 | 11 (17.5%) | 52 (82.5%) |
| 6 to 18 Years | 45 (20.4%) | 176 (79.6%) |
| 19 to 25 Years | 3 (3.0%) | 97 (97.0%) |
| 25 to 34 Years | 15 (13.2%) | 94 (82.5%) |
| 35 to 44 Years | 19 (11.6%) | 134 (81.7%) |
| 45 to 54 Years | 17 (12.0%) | 125 (88.0%) |
| 55 to 64 Years | 20 (12.9%) | 137 (88.4%) |
| 65 to 74 Years | 62 (59.6%) | 74 (71.2%) |
| 75 Years and over | 151 (100.0%) | 109 (72.2%) |
| Total | 343 (28.2%) | 998 (82.2%) |
Disability Status by Sex by Age in Oakfield
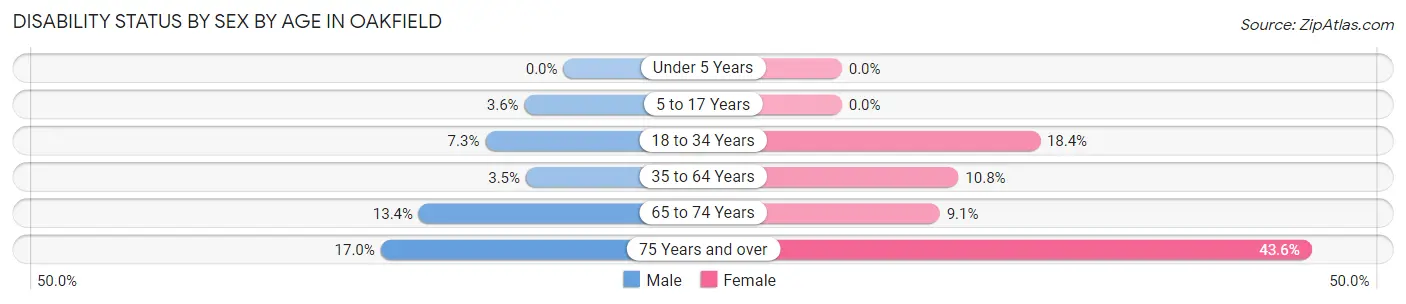
| Age Bracket | Male | Female |
| Under 5 Years | 0 (0.0%) | 0 (0.0%) |
| 5 to 17 Years | 3 (3.6%) | 0 (0.0%) |
| 18 to 34 Years | 10 (7.2%) | 16 (18.4%) |
| 35 to 64 Years | 8 (3.5%) | 25 (10.8%) |
| 65 to 74 Years | 11 (13.4%) | 2 (9.1%) |
| 75 Years and over | 19 (17.0%) | 17 (43.6%) |
Disability Class by Sex by Age in Oakfield
Disability Class: Hearing Difficulty
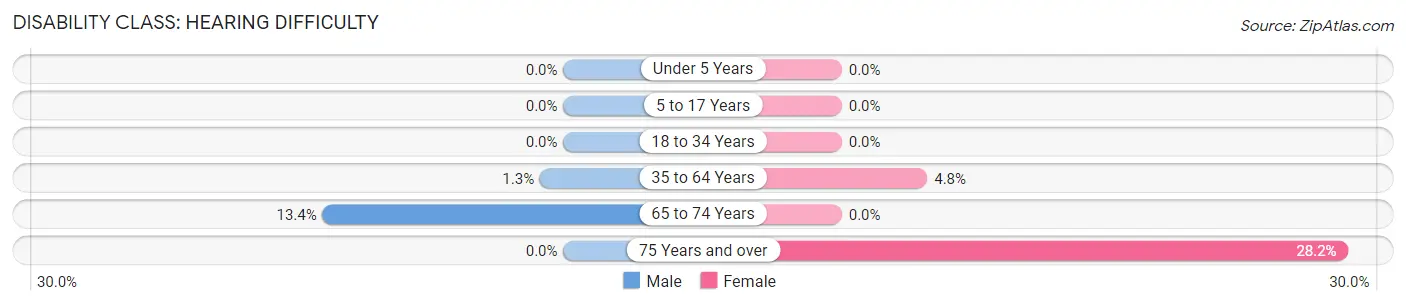
| Age Bracket | Male | Female |
| Under 5 Years | 0 (0.0%) | 0 (0.0%) |
| 5 to 17 Years | 0 (0.0%) | 0 (0.0%) |
| 18 to 34 Years | 0 (0.0%) | 0 (0.0%) |
| 35 to 64 Years | 3 (1.3%) | 11 (4.8%) |
| 65 to 74 Years | 11 (13.4%) | 0 (0.0%) |
| 75 Years and over | 0 (0.0%) | 11 (28.2%) |
Disability Class: Vision Difficulty
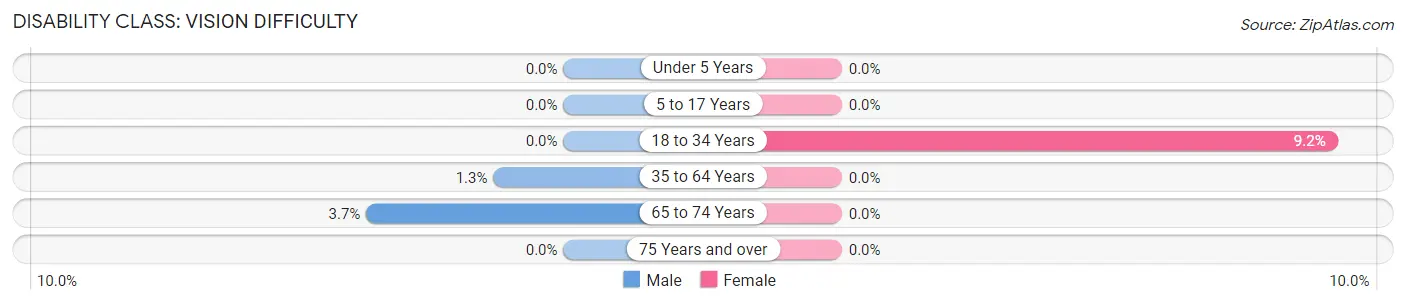
| Age Bracket | Male | Female |
| Under 5 Years | 0 (0.0%) | 0 (0.0%) |
| 5 to 17 Years | 0 (0.0%) | 0 (0.0%) |
| 18 to 34 Years | 0 (0.0%) | 8 (9.2%) |
| 35 to 64 Years | 3 (1.3%) | 0 (0.0%) |
| 65 to 74 Years | 3 (3.7%) | 0 (0.0%) |
| 75 Years and over | 0 (0.0%) | 0 (0.0%) |
Disability Class: Cognitive Difficulty
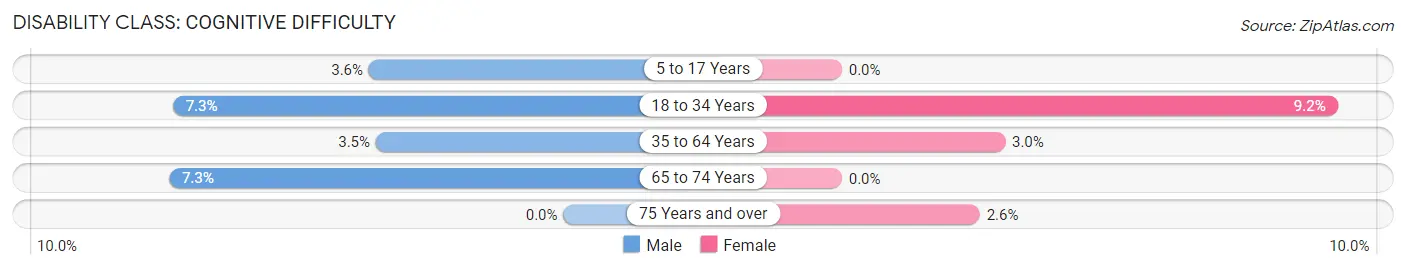
| Age Bracket | Male | Female |
| 5 to 17 Years | 3 (3.6%) | 0 (0.0%) |
| 18 to 34 Years | 10 (7.2%) | 8 (9.2%) |
| 35 to 64 Years | 8 (3.5%) | 7 (3.0%) |
| 65 to 74 Years | 6 (7.3%) | 0 (0.0%) |
| 75 Years and over | 0 (0.0%) | 1 (2.6%) |
Disability Class: Ambulatory Difficulty
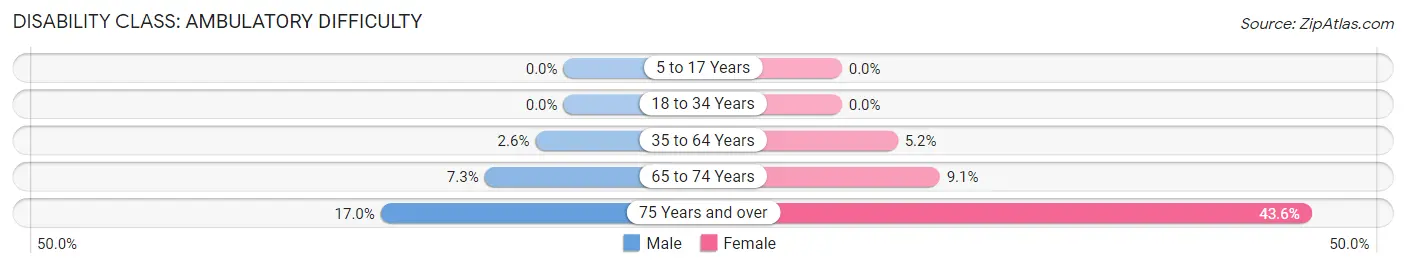
| Age Bracket | Male | Female |
| 5 to 17 Years | 0 (0.0%) | 0 (0.0%) |
| 18 to 34 Years | 0 (0.0%) | 0 (0.0%) |
| 35 to 64 Years | 6 (2.6%) | 12 (5.2%) |
| 65 to 74 Years | 6 (7.3%) | 2 (9.1%) |
| 75 Years and over | 19 (17.0%) | 17 (43.6%) |
Disability Class: Self-Care Difficulty
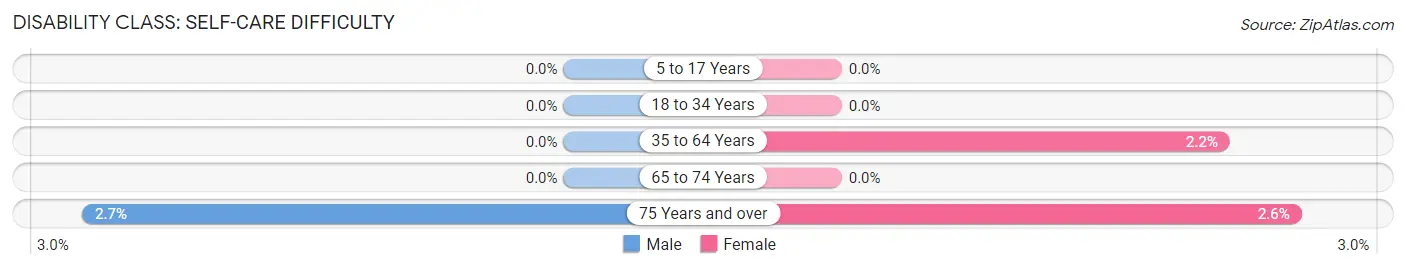
| Age Bracket | Male | Female |
| 5 to 17 Years | 0 (0.0%) | 0 (0.0%) |
| 18 to 34 Years | 0 (0.0%) | 0 (0.0%) |
| 35 to 64 Years | 0 (0.0%) | 5 (2.2%) |
| 65 to 74 Years | 0 (0.0%) | 0 (0.0%) |
| 75 Years and over | 3 (2.7%) | 1 (2.6%) |
Technology Access in Oakfield
Computing Device Access in Oakfield
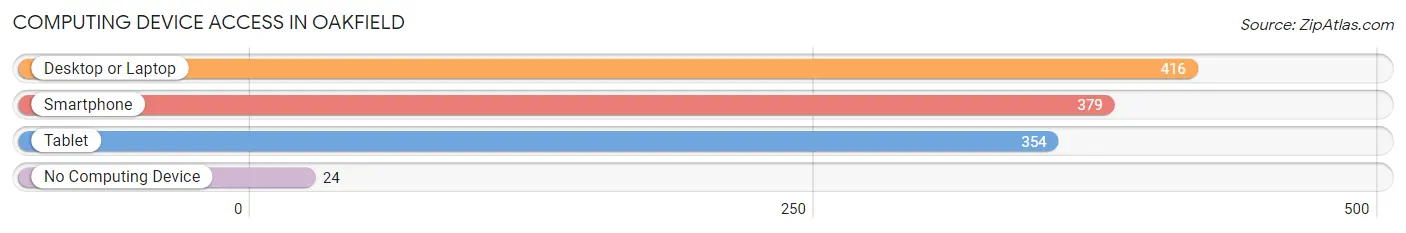
| Device Type | # Households | % Households |
| Desktop or Laptop | 416 | 82.1% |
| Smartphone | 379 | 74.8% |
| Tablet | 354 | 69.8% |
| No Computing Device | 24 | 4.7% |
| Total | 507 | 100.0% |
Internet Access in Oakfield
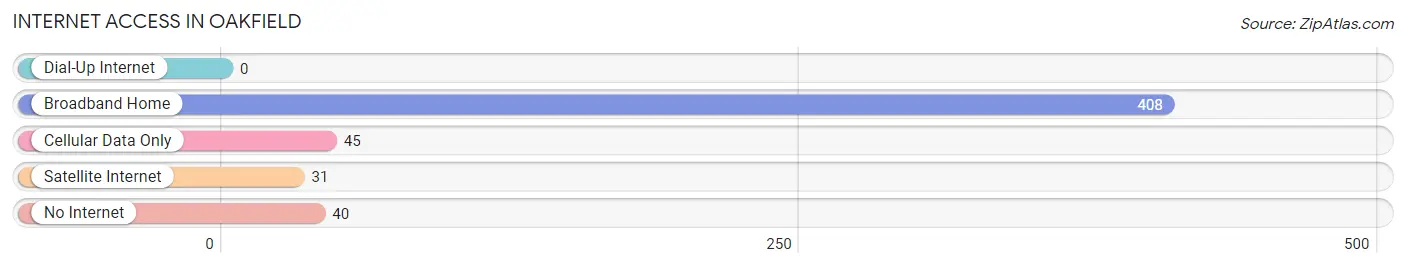
| Internet Type | # Households | % Households |
| Dial-Up Internet | 0 | 0.0% |
| Broadband Home | 408 | 80.5% |
| Cellular Data Only | 45 | 8.9% |
| Satellite Internet | 31 | 6.1% |
| No Internet | 40 | 7.9% |
| Total | 507 | 100.0% |
Oakfield Summary
History
Oakfield, Wisconsin is a small village located in Fond du Lac County, Wisconsin. It is situated on the banks of the Fond du Lac River, and is part of the Fox Valley region. The village was first settled in 1845 by a group of German immigrants, and was originally known as “Oakfield Station”. The name was changed to Oakfield in 1856.
The village was originally a farming community, and the main crops grown were wheat, corn, and oats. The village also had a sawmill, a gristmill, and a blacksmith shop. In the late 1800s, the village began to grow and develop, and by the early 1900s, it had become a thriving community.
The village was incorporated in 1891, and the first mayor was John H. Schuette. The village was home to several businesses, including a general store, a hotel, a bank, and a post office. The village also had a school, a library, and a fire department.
In the early 1900s, the village was home to several churches, including the First Congregational Church, the First Methodist Church, and the First Presbyterian Church. The village also had a movie theater, a bowling alley, and a roller skating rink.
The village continued to grow and develop throughout the 20th century. In the 1950s, the village was home to several factories, including a paper mill, a canning factory, and a furniture factory. The village also had a hospital, a library, and a police department.
In the late 20th century, the village began to decline. Many of the factories closed, and the population began to decline. In the early 2000s, the village began to experience a resurgence, and the population began to increase.
Geography
Oakfield is located in Fond du Lac County, Wisconsin. It is situated on the banks of the Fond du Lac River, and is part of the Fox Valley region. The village is located approximately 25 miles north of Milwaukee, and approximately 50 miles south of Green Bay.
The village is located in a rural area, and is surrounded by farmland. The terrain is mostly flat, with some rolling hills. The village is located in a temperate climate, with warm summers and cold winters.
Economy
Oakfield’s economy is largely based on agriculture. The village is home to several farms, and the main crops grown are wheat, corn, and oats. The village also has several small businesses, including a general store, a hotel, a bank, and a post office.
The village is also home to several factories, including a paper mill, a canning factory, and a furniture factory. The village also has a hospital, a library, and a police department.
Demographics
As of the 2010 census, the population of Oakfield was 1,845. The population is largely white (97.2%), with a small percentage of African Americans (1.2%) and Hispanics (1.6%). The median household income is $50,000, and the median age is 43.
The village is home to several churches, including the First Congregational Church, the First Methodist Church, and the First Presbyterian Church. The village also has a movie theater, a bowling alley, and a roller skating rink.
Common Questions
What is Per Capita Income in Oakfield?
Per Capita income in Oakfield is $45,774.
What is the Median Family Income in Oakfield?
Median Family Income in Oakfield is $101,429.
What is the Median Household income in Oakfield?
Median Household Income in Oakfield is $100,804.
What is Income or Wage Gap in Oakfield?
Income or Wage Gap in Oakfield is 24.4%.
Women in Oakfield earn 75.6 cents for every dollar earned by a man.
What is Family Income Deficit in Oakfield?
Family Income Deficit in Oakfield is $16,025.
Families that are below poverty line in Oakfield earn $16,025 less on average than the poverty threshold level.
What is Inequality or Gini Index in Oakfield?
Inequality or Gini Index in Oakfield is 0.30.
What is the Total Population of Oakfield?
Total Population of Oakfield is 1,218.
What is the Total Male Population of Oakfield?
Total Male Population of Oakfield is 665.
What is the Total Female Population of Oakfield?
Total Female Population of Oakfield is 553.
What is the Ratio of Males per 100 Females in Oakfield?
There are 120.25 Males per 100 Females in Oakfield.
What is the Ratio of Females per 100 Males in Oakfield?
There are 83.16 Females per 100 Males in Oakfield.
What is the Median Population Age in Oakfield?
Median Population Age in Oakfield is 41.6 Years.
What is the Average Family Size in Oakfield
Average Family Size in Oakfield is 3.1 People.
What is the Average Household Size in Oakfield
Average Household Size in Oakfield is 2.4 People.
How Large is the Labor Force in Oakfield?
There are 690 People in the Labor Forcein in Oakfield.
What is the Percentage of People in the Labor Force in Oakfield?
70.4% of People are in the Labor Force in Oakfield.
What is the Unemployment Rate in Oakfield?
Unemployment Rate in Oakfield is 1.6%.