Horicon, WI Map & Demographics
Horicon Map
Horicon Overview
$28,596
PER CAPITA INCOME
$72,768
AVG FAMILY INCOME
$48,266
AVG HOUSEHOLD INCOME
41.3%
WAGE / INCOME GAP [ % ]
58.7¢/ $1
WAGE / INCOME GAP [ $ ]
0.38
INEQUALITY / GINI INDEX
3,793
TOTAL POPULATION
1,719
MALE POPULATION
2,074
FEMALE POPULATION
82.88
MALES / 100 FEMALES
120.65
FEMALES / 100 MALES
38.8
MEDIAN AGE
3.0
AVG FAMILY SIZE
2.1
AVG HOUSEHOLD SIZE
2,025
LABOR FORCE [ PEOPLE ]
67.2%
PERCENT IN LABOR FORCE
4.9%
UNEMPLOYMENT RATE
Horicon Zip Codes
Horicon Area Codes
Income in Horicon
Income Overview in Horicon
Per Capita Income in Horicon is $28,596, while median incomes of families and households are $72,768 and $48,266 respectively.
| Characteristic | Number | Measure |
| Per Capita Income | 3,793 | $28,596 |
| Median Family Income | 869 | $72,768 |
| Mean Family Income | 869 | $78,703 |
| Median Household Income | 1,757 | $48,266 |
| Mean Household Income | 1,757 | $60,718 |
| Income Deficit | 869 | $0 |
| Wage / Income Gap (%) | 3,793 | 41.33% |
| Wage / Income Gap ($) | 3,793 | 58.67¢ per $1 |
| Gini / Inequality Index | 3,793 | 0.38 |
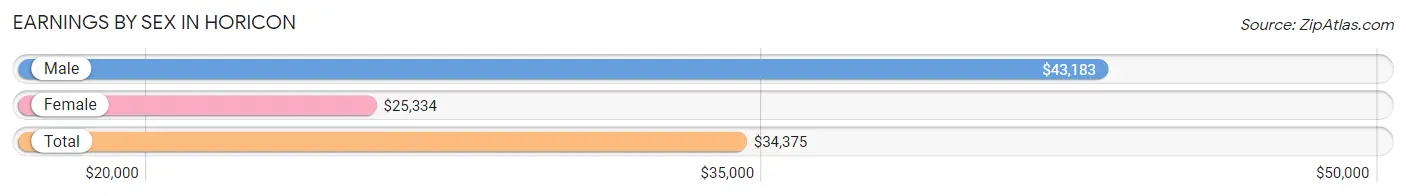
Earnings by Sex in Horicon
Average Earnings in Horicon are $34,375, $43,183 for men and $25,334 for women, a difference of 41.3%.
| Sex | Number | Average Earnings |
| Male | 1,023 (47.7%) | $43,183 |
| Female | 1,121 (52.3%) | $25,334 |
| Total | 2,144 (100.0%) | $34,375 |
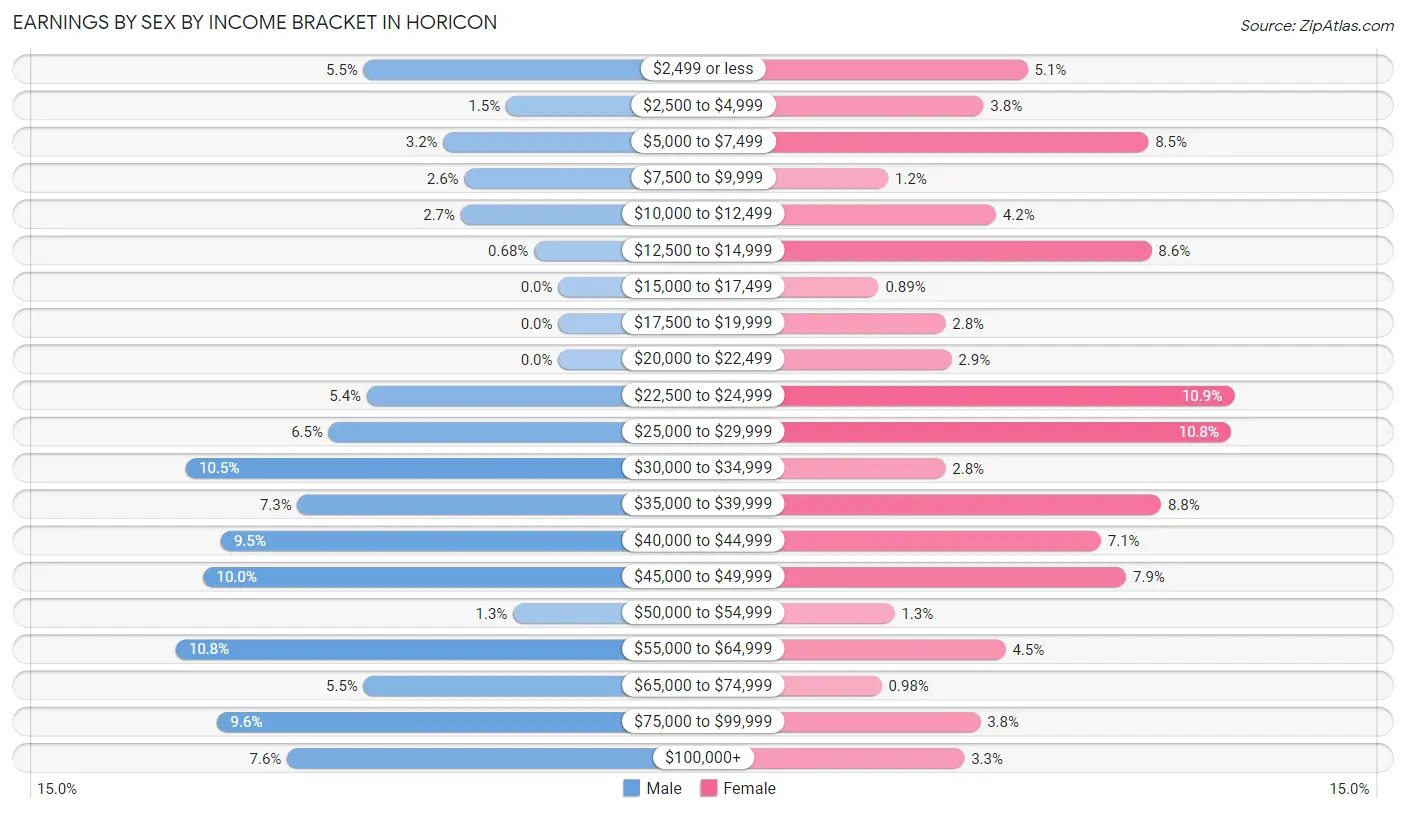
Earnings by Sex by Income Bracket in Horicon
The most common earnings brackets in Horicon are $55,000 to $64,999 for men (110 | 10.7%) and $22,500 to $24,999 for women (122 | 10.9%).
| Income | Male | Female |
| $2,499 or less | 56 (5.5%) | 57 (5.1%) |
| $2,500 to $4,999 | 15 (1.5%) | 43 (3.8%) |
| $5,000 to $7,499 | 33 (3.2%) | 95 (8.5%) |
| $7,500 to $9,999 | 27 (2.6%) | 13 (1.2%) |
| $10,000 to $12,499 | 28 (2.7%) | 47 (4.2%) |
| $12,500 to $14,999 | 7 (0.7%) | 96 (8.6%) |
| $15,000 to $17,499 | 0 (0.0%) | 10 (0.9%) |
| $17,500 to $19,999 | 0 (0.0%) | 31 (2.8%) |
| $20,000 to $22,499 | 0 (0.0%) | 33 (2.9%) |
| $22,500 to $24,999 | 55 (5.4%) | 122 (10.9%) |
| $25,000 to $29,999 | 66 (6.5%) | 121 (10.8%) |
| $30,000 to $34,999 | 107 (10.5%) | 31 (2.8%) |
| $35,000 to $39,999 | 75 (7.3%) | 99 (8.8%) |
| $40,000 to $44,999 | 97 (9.5%) | 80 (7.1%) |
| $45,000 to $49,999 | 102 (10.0%) | 88 (7.9%) |
| $50,000 to $54,999 | 13 (1.3%) | 15 (1.3%) |
| $55,000 to $64,999 | 110 (10.7%) | 50 (4.5%) |
| $65,000 to $74,999 | 56 (5.5%) | 11 (1.0%) |
| $75,000 to $99,999 | 98 (9.6%) | 42 (3.7%) |
| $100,000+ | 78 (7.6%) | 37 (3.3%) |
| Total | 1,023 (100.0%) | 1,121 (100.0%) |
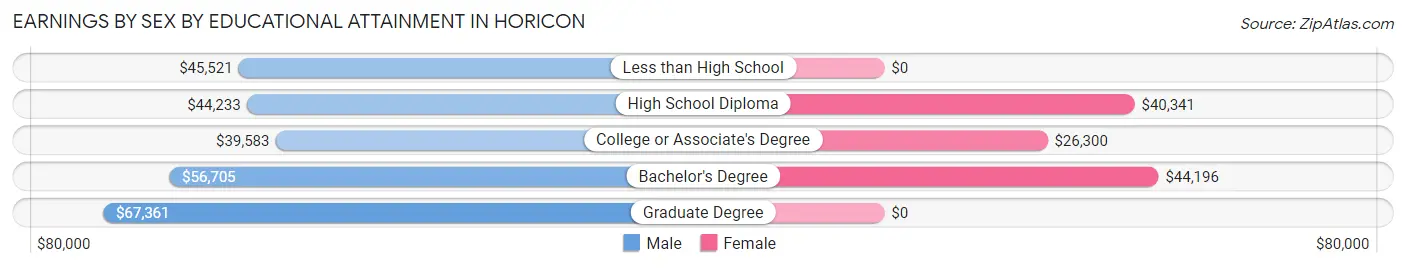
Earnings by Sex by Educational Attainment in Horicon
Average earnings in Horicon are $45,352 for men and $29,125 for women, a difference of 35.8%. Men with an educational attainment of graduate degree enjoy the highest average annual earnings of $67,361, while those with college or associate's degree education earn the least with $39,583. Women with an educational attainment of bachelor's degree earn the most with the average annual earnings of $44,196, while those with college or associate's degree education have the smallest earnings of $26,300.
| Educational Attainment | Male Income | Female Income |
| Less than High School | $45,521 | $0 |
| High School Diploma | $44,233 | $40,341 |
| College or Associate's Degree | $39,583 | $26,300 |
| Bachelor's Degree | $56,705 | $44,196 |
| Graduate Degree | $67,361 | $0 |
| Total | $45,352 | $29,125 |
Family Income in Horicon
Family Income Brackets in Horicon
According to the Horicon family income data, there are 251 families falling into the $100,000 to $149,999 income range, which is the most common income bracket and makes up 28.9% of all families. Conversely, the $15,000 to $24,999 income bracket is the least frequent group with only 8 families (0.9%) belonging to this category.
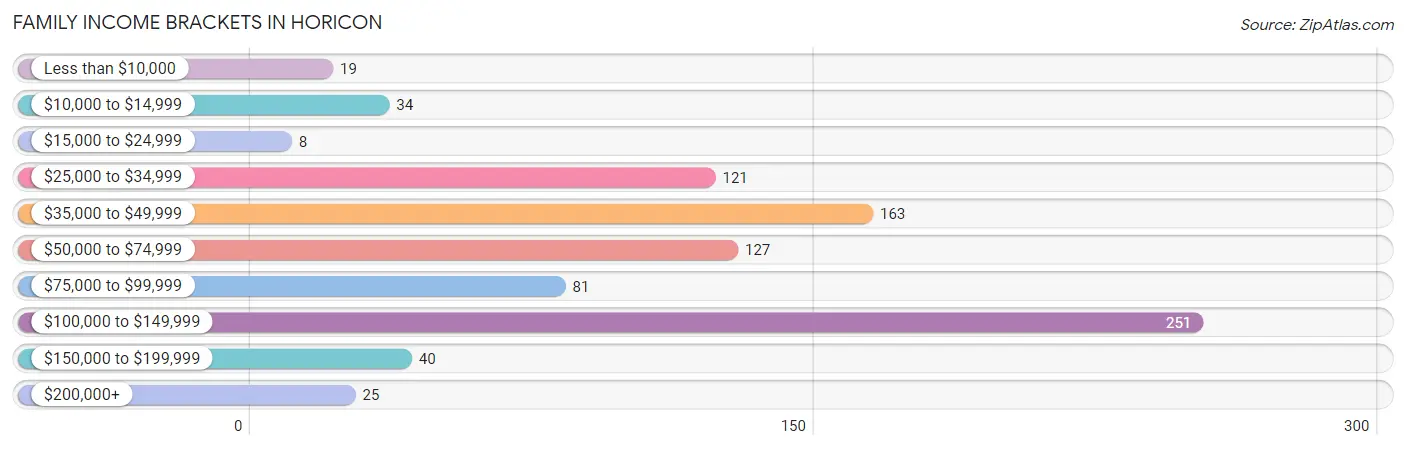
| Income Bracket | # Families | % Families |
| Less than $10,000 | 19 | 2.2% |
| $10,000 to $14,999 | 34 | 3.9% |
| $15,000 to $24,999 | 8 | 0.9% |
| $25,000 to $34,999 | 121 | 13.9% |
| $35,000 to $49,999 | 163 | 18.8% |
| $50,000 to $74,999 | 127 | 14.6% |
| $75,000 to $99,999 | 81 | 9.3% |
| $100,000 to $149,999 | 251 | 28.9% |
| $150,000 to $199,999 | 40 | 4.6% |
| $200,000+ | 25 | 2.9% |
Family Income by Famaliy Size in Horicon
4-person families (164 | 18.9%) account for the highest median family income in Horicon with $126,071 per family, while 4-person families (164 | 18.9%) have the highest median income of $31,518 per family member.
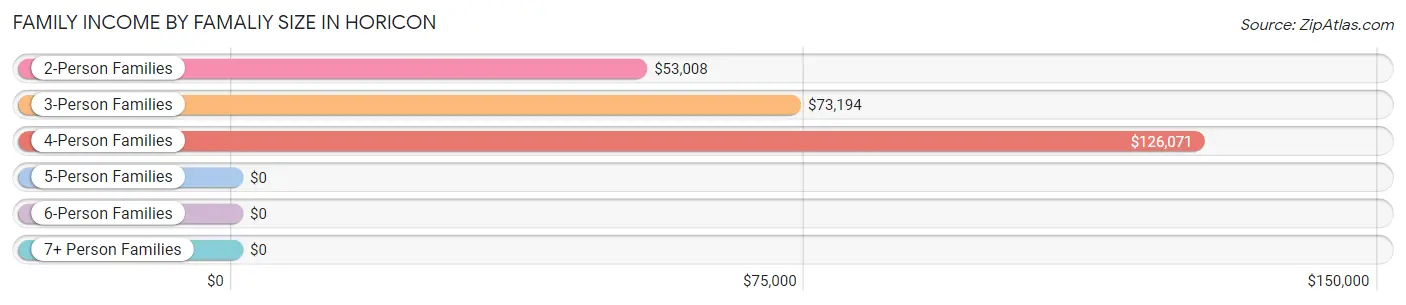
| Income Bracket | # Families | Median Income |
| 2-Person Families | 407 (46.8%) | $53,008 |
| 3-Person Families | 187 (21.5%) | $73,194 |
| 4-Person Families | 164 (18.9%) | $126,071 |
| 5-Person Families | 77 (8.9%) | $0 |
| 6-Person Families | 9 (1.0%) | $0 |
| 7+ Person Families | 25 (2.9%) | $0 |
| Total | 869 (100.0%) | $72,768 |
Family Income by Number of Earners in Horicon
The median family income in Horicon is $72,768, with families comprising 3+ earners (116) having the highest median family income of $110,682, while families with 1 earner (319) have the lowest median family income of $39,632, accounting for 13.4% and 36.7% of families, respectively.
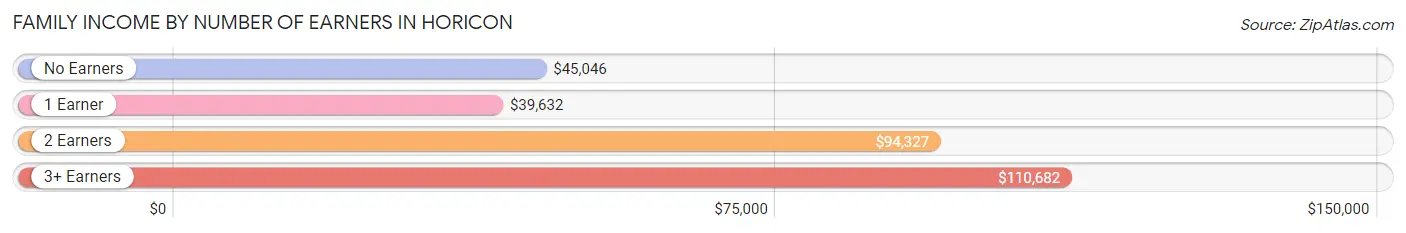
| Number of Earners | # Families | Median Income |
| No Earners | 107 (12.3%) | $45,046 |
| 1 Earner | 319 (36.7%) | $39,632 |
| 2 Earners | 327 (37.6%) | $94,327 |
| 3+ Earners | 116 (13.4%) | $110,682 |
| Total | 869 (100.0%) | $72,768 |
Household Income in Horicon
Household Income Brackets in Horicon
With 327 households falling in the category, the $50,000 to $74,999 income range is the most frequent in Horicon, accounting for 18.6% of all households. In contrast, only 25 households (1.4%) fall into the $200,000+ income bracket, making it the least populous group.
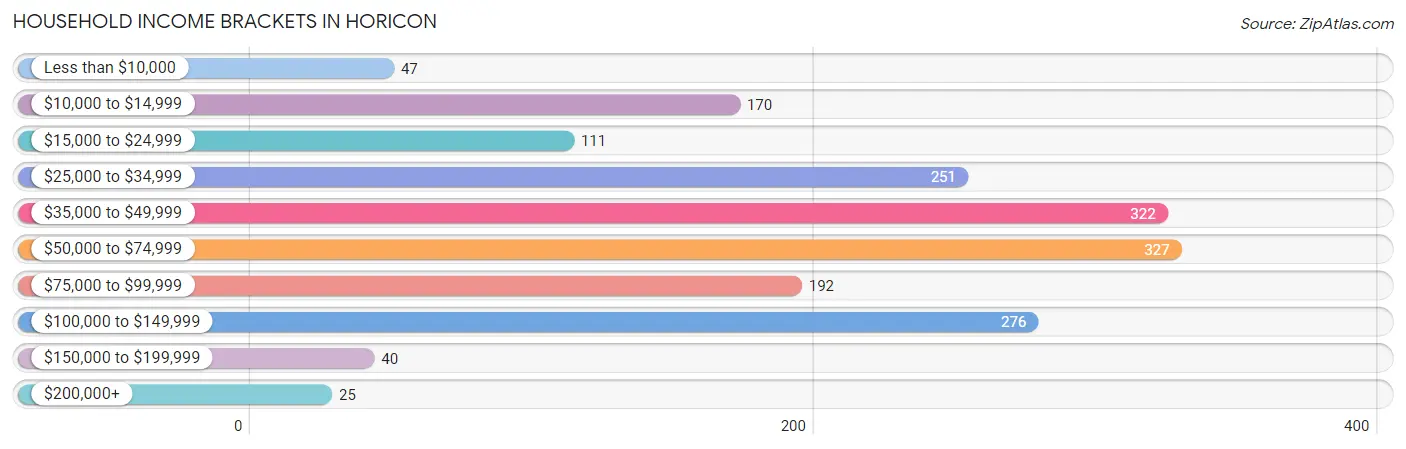
| Income Bracket | # Households | % Households |
| Less than $10,000 | 47 | 2.7% |
| $10,000 to $14,999 | 170 | 9.7% |
| $15,000 to $24,999 | 111 | 6.3% |
| $25,000 to $34,999 | 251 | 14.3% |
| $35,000 to $49,999 | 322 | 18.3% |
| $50,000 to $74,999 | 327 | 18.6% |
| $75,000 to $99,999 | 192 | 10.9% |
| $100,000 to $149,999 | 276 | 15.7% |
| $150,000 to $199,999 | 40 | 2.3% |
| $200,000+ | 25 | 1.4% |
Household Income by Householder Age in Horicon
The median household income in Horicon is $48,266, with the highest median household income of $53,333 found in the 45 to 64 years age bracket for the primary householder. A total of 684 households (38.9%) fall into this category. Meanwhile, the 65+ years age bracket for the primary householder has the lowest median household income of $42,371, with 411 households (23.4%) in this group.
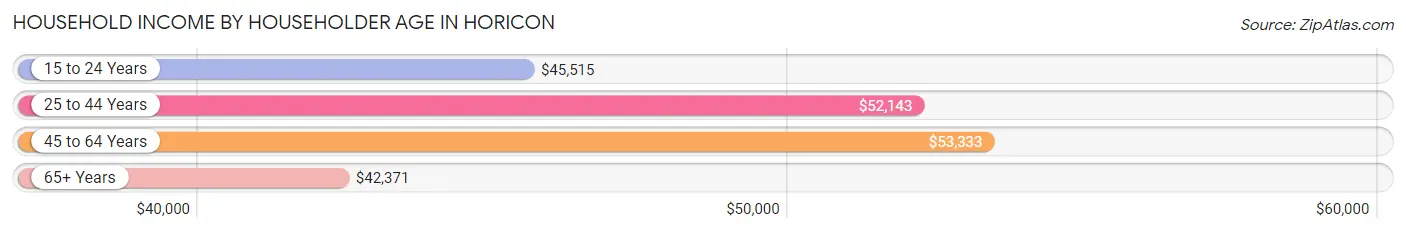
| Income Bracket | # Households | Median Income |
| 15 to 24 Years | 106 (6.0%) | $45,515 |
| 25 to 44 Years | 556 (31.6%) | $52,143 |
| 45 to 64 Years | 684 (38.9%) | $53,333 |
| 65+ Years | 411 (23.4%) | $42,371 |
| Total | 1,757 (100.0%) | $48,266 |
Poverty in Horicon
Income Below Poverty by Sex and Age in Horicon
With 14.6% poverty level for males and 12.9% for females among the residents of Horicon, under 5 year old males and 18 to 24 year old females are the most vulnerable to poverty, with 55 males (59.8%) and 53 females (34.6%) in their respective age groups living below the poverty level.
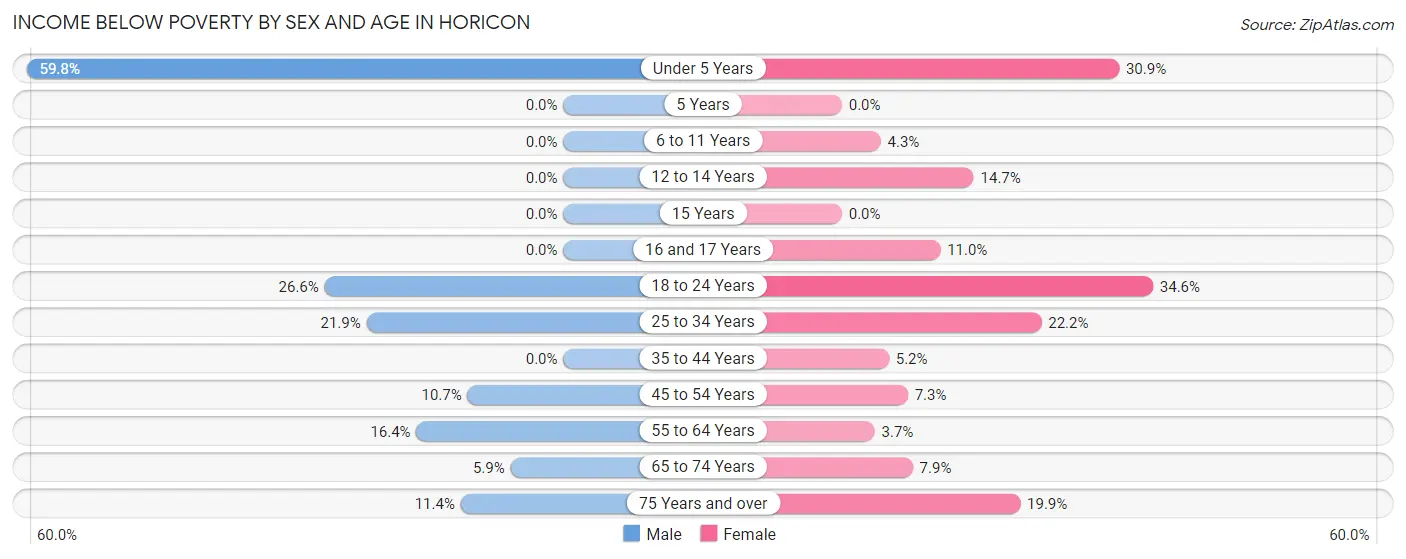
| Age Bracket | Male | Female |
| Under 5 Years | 55 (59.8%) | 46 (30.9%) |
| 5 Years | 0 (0.0%) | 0 (0.0%) |
| 6 to 11 Years | 0 (0.0%) | 7 (4.3%) |
| 12 to 14 Years | 0 (0.0%) | 16 (14.7%) |
| 15 Years | 0 (0.0%) | 0 (0.0%) |
| 16 and 17 Years | 0 (0.0%) | 8 (11.0%) |
| 18 to 24 Years | 46 (26.6%) | 53 (34.6%) |
| 25 to 34 Years | 80 (21.9%) | 46 (22.2%) |
| 35 to 44 Years | 0 (0.0%) | 8 (5.2%) |
| 45 to 54 Years | 16 (10.7%) | 16 (7.3%) |
| 55 to 64 Years | 36 (16.4%) | 12 (3.6%) |
| 65 to 74 Years | 10 (5.9%) | 25 (7.9%) |
| 75 Years and over | 8 (11.4%) | 28 (19.9%) |
| Total | 251 (14.6%) | 265 (12.9%) |
Income Above Poverty by Sex and Age in Horicon
According to the poverty statistics in Horicon, males aged 5 years and females aged 5 years are the age groups that are most secure financially, with 100.0% of males and 100.0% of females in these age groups living above the poverty line.
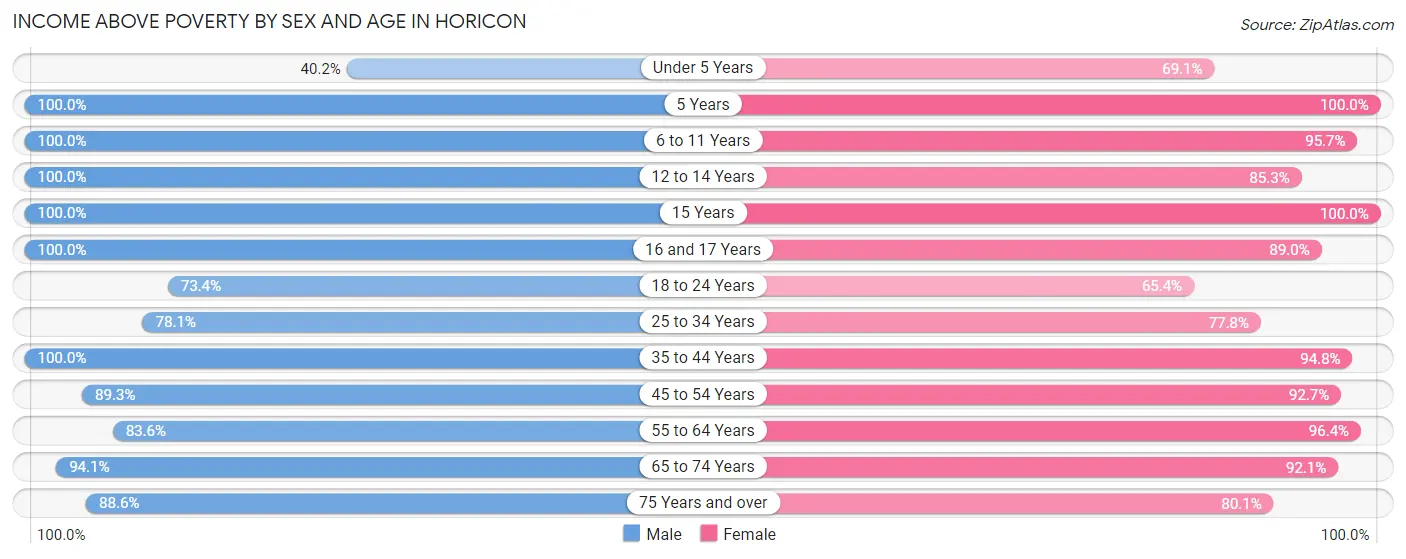
| Age Bracket | Male | Female |
| Under 5 Years | 37 (40.2%) | 103 (69.1%) |
| 5 Years | 55 (100.0%) | 7 (100.0%) |
| 6 to 11 Years | 100 (100.0%) | 155 (95.7%) |
| 12 to 14 Years | 32 (100.0%) | 93 (85.3%) |
| 15 Years | 29 (100.0%) | 45 (100.0%) |
| 16 and 17 Years | 38 (100.0%) | 65 (89.0%) |
| 18 to 24 Years | 127 (73.4%) | 100 (65.4%) |
| 25 to 34 Years | 285 (78.1%) | 161 (77.8%) |
| 35 to 44 Years | 225 (100.0%) | 145 (94.8%) |
| 45 to 54 Years | 134 (89.3%) | 202 (92.7%) |
| 55 to 64 Years | 184 (83.6%) | 317 (96.4%) |
| 65 to 74 Years | 160 (94.1%) | 292 (92.1%) |
| 75 Years and over | 62 (88.6%) | 113 (80.1%) |
| Total | 1,468 (85.4%) | 1,798 (87.2%) |
Income Below Poverty Among Married-Couple Families in Horicon
The poverty statistics for married-couple families in Horicon show that 7.0% or 40 of the total 572 families live below the poverty line. Families with 3 or 4 children have the highest poverty rate of 33.0%, comprising of 30 families. On the other hand, families with 1 or 2 children have the lowest poverty rate of 0.0%, which includes 0 families.
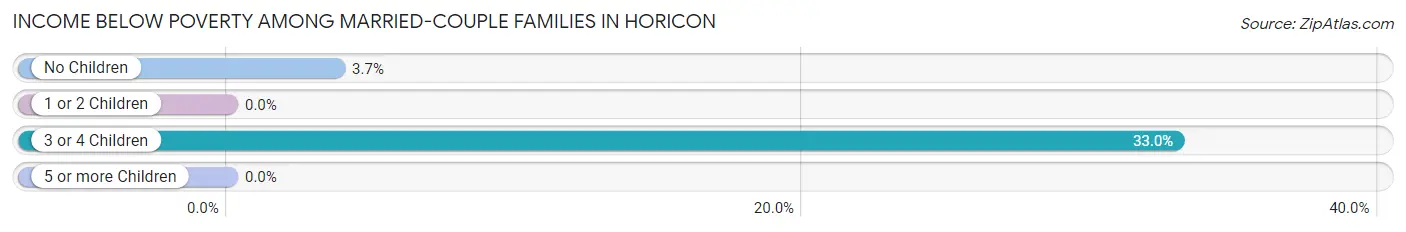
| Children | Above Poverty | Below Poverty |
| No Children | 258 (96.3%) | 10 (3.7%) |
| 1 or 2 Children | 213 (100.0%) | 0 (0.0%) |
| 3 or 4 Children | 61 (67.0%) | 30 (33.0%) |
| 5 or more Children | 0 (0.0%) | 0 (0.0%) |
| Total | 532 (93.0%) | 40 (7.0%) |
Income Below Poverty Among Single-Parent Households in Horicon
According to the poverty data in Horicon, 6.6% or 9 single-father households and 26.3% or 42 single-mother households are living below the poverty line. Among single-father households, those with no children have the highest poverty rate, with 9 households (25.0%) experiencing poverty. Likewise, among single-mother households, those with 1 or 2 children have the highest poverty rate, with 42 households (37.8%) falling below the poverty line.
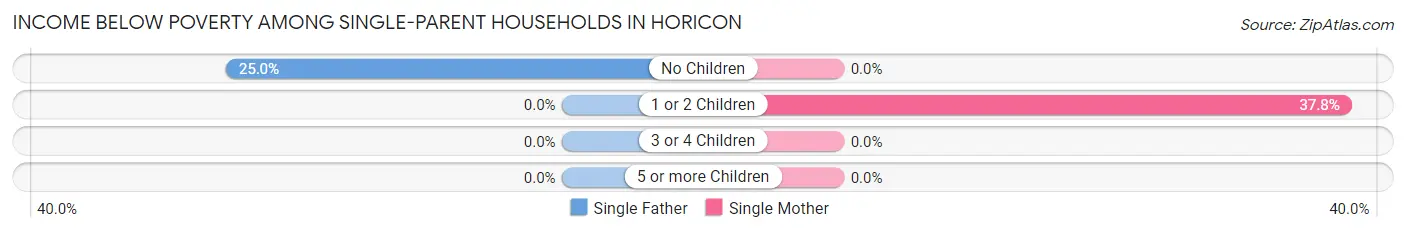
| Children | Single Father | Single Mother |
| No Children | 9 (25.0%) | 0 (0.0%) |
| 1 or 2 Children | 0 (0.0%) | 42 (37.8%) |
| 3 or 4 Children | 0 (0.0%) | 0 (0.0%) |
| 5 or more Children | 0 (0.0%) | 0 (0.0%) |
| Total | 9 (6.6%) | 42 (26.3%) |
Income Below Poverty Among Married-Couple vs Single-Parent Households in Horicon
The poverty data for Horicon shows that 40 of the married-couple family households (7.0%) and 51 of the single-parent households (17.2%) are living below the poverty level. Within the married-couple family households, those with 3 or 4 children have the highest poverty rate, with 30 households (33.0%) falling below the poverty line. Among the single-parent households, those with 1 or 2 children have the highest poverty rate, with 42 household (23.3%) living below poverty.
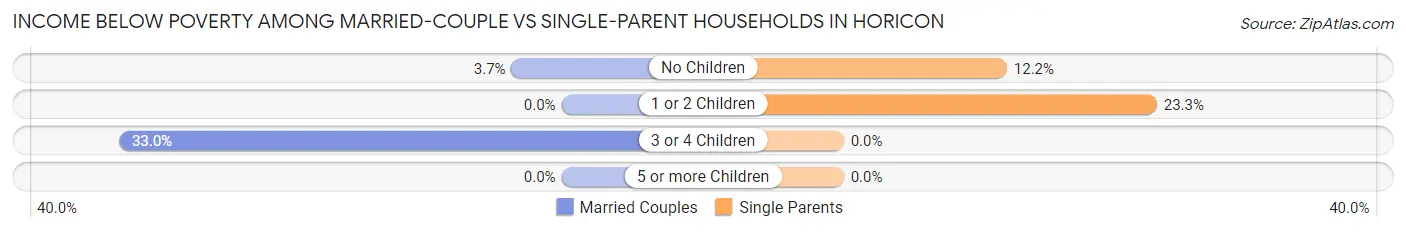
| Children | Married-Couple Families | Single-Parent Households |
| No Children | 10 (3.7%) | 9 (12.2%) |
| 1 or 2 Children | 0 (0.0%) | 42 (23.3%) |
| 3 or 4 Children | 30 (33.0%) | 0 (0.0%) |
| 5 or more Children | 0 (0.0%) | 0 (0.0%) |
| Total | 40 (7.0%) | 51 (17.2%) |
Race in Horicon
The most populous races in Horicon are White / Caucasian (3,684 | 97.1%), Black / African American (78 | 2.1%), and Hispanic or Latino (27 | 0.7%).
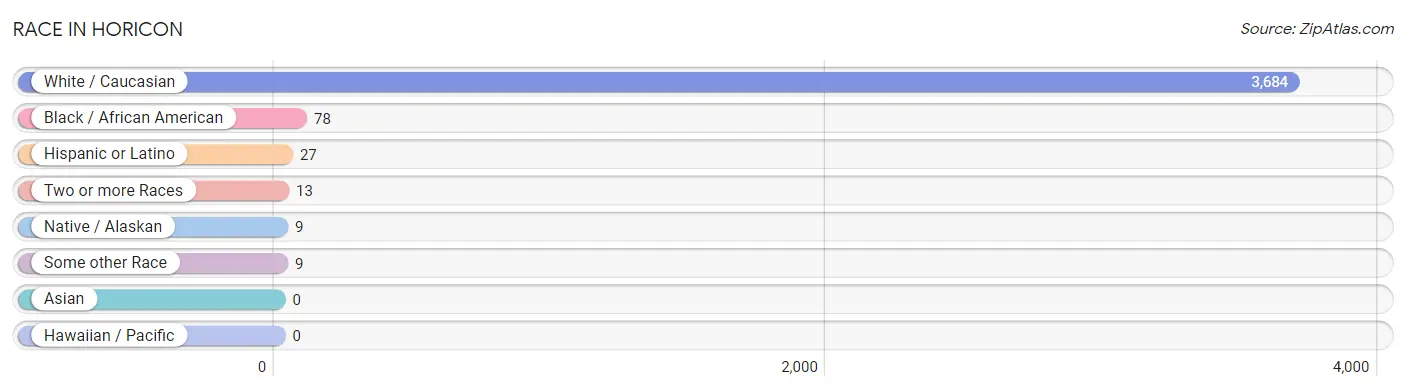
| Race | # Population | % Population |
| Asian | 0 | 0.0% |
| Black / African American | 78 | 2.1% |
| Hawaiian / Pacific | 0 | 0.0% |
| Hispanic or Latino | 27 | 0.7% |
| Native / Alaskan | 9 | 0.2% |
| White / Caucasian | 3,684 | 97.1% |
| Two or more Races | 13 | 0.3% |
| Some other Race | 9 | 0.2% |
| Total | 3,793 | 100.0% |
Ancestry in Horicon
The most populous ancestries reported in Horicon are German (2,344 | 61.8%), Irish (588 | 15.5%), Polish (161 | 4.2%), American (146 | 3.8%), and English (134 | 3.5%), together accounting for 88.9% of all Horicon residents.
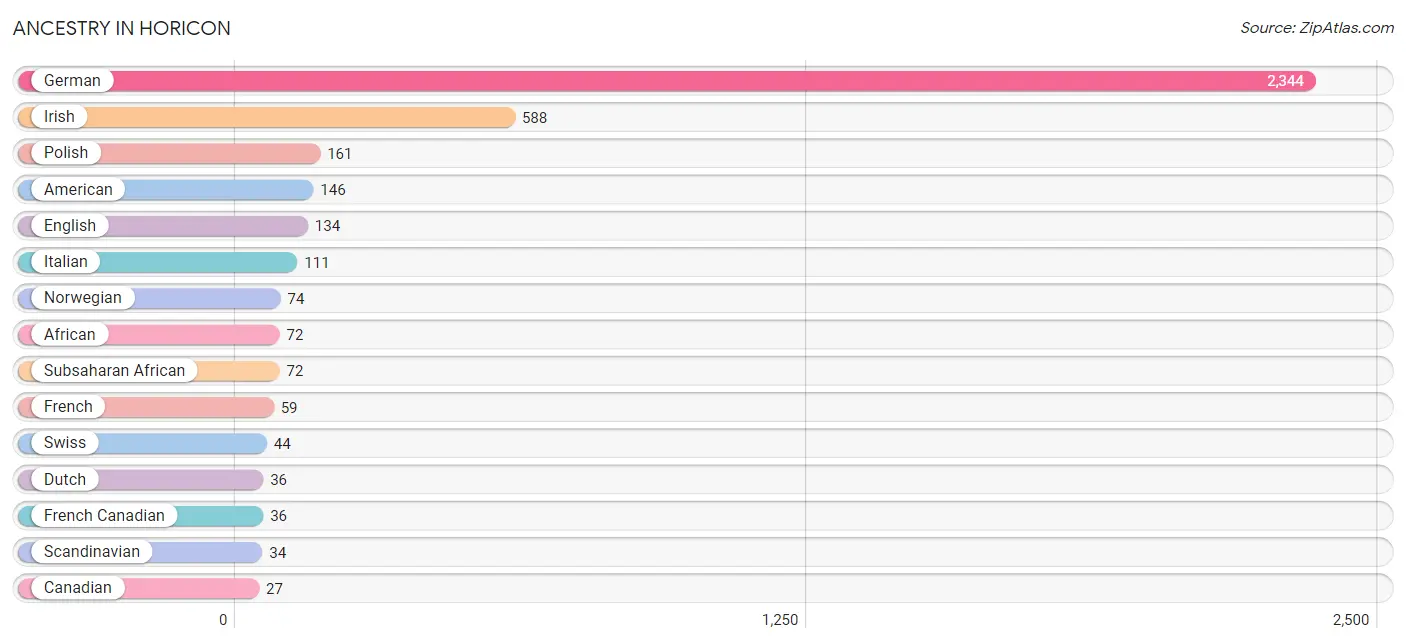
| Ancestry | # Population | % Population |
| African | 72 | 1.9% |
| American | 146 | 3.8% |
| Brazilian | 9 | 0.2% |
| Canadian | 27 | 0.7% |
| Chippewa | 9 | 0.2% |
| Czech | 11 | 0.3% |
| Danish | 27 | 0.7% |
| Dutch | 36 | 0.9% |
| English | 134 | 3.5% |
| Finnish | 12 | 0.3% |
| French | 59 | 1.6% |
| French Canadian | 36 | 0.9% |
| German | 2,344 | 61.8% |
| Greek | 11 | 0.3% |
| Hungarian | 7 | 0.2% |
| Irish | 588 | 15.5% |
| Iroquois | 5 | 0.1% |
| Italian | 111 | 2.9% |
| Norwegian | 74 | 1.9% |
| Polish | 161 | 4.2% |
| Puerto Rican | 27 | 0.7% |
| Scandinavian | 34 | 0.9% |
| Scotch-Irish | 13 | 0.3% |
| Scottish | 14 | 0.4% |
| Subsaharan African | 72 | 1.9% |
| Swedish | 7 | 0.2% |
| Swiss | 44 | 1.2% |
| Welsh | 12 | 0.3% | View All 28 Rows |
Immigrants in Horicon
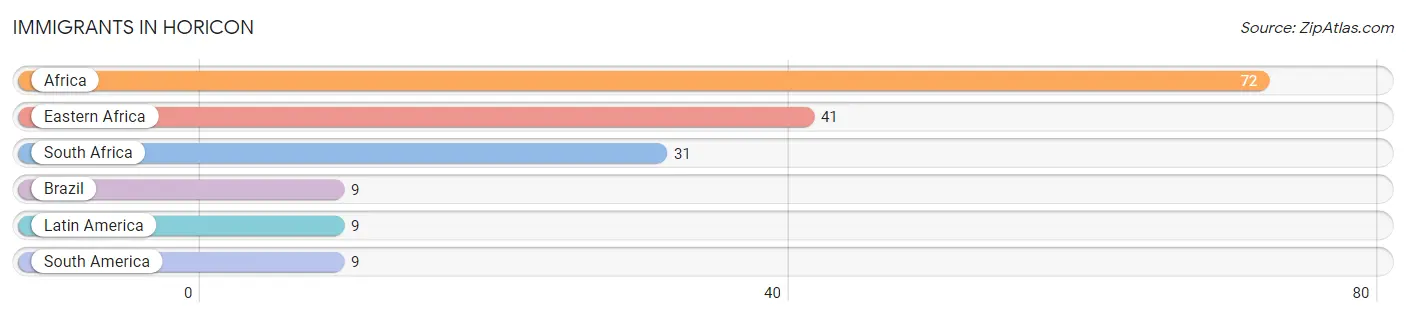
The most numerous immigrant groups reported in Horicon came from Africa (72 | 1.9%), Eastern Africa (41 | 1.1%), South Africa (31 | 0.8%), Brazil (9 | 0.2%), and Latin America (9 | 0.2%), together accounting for 4.3% of all Horicon residents.
| Immigration Origin | # Population | % Population |
| Africa | 72 | 1.9% |
| Brazil | 9 | 0.2% |
| Eastern Africa | 41 | 1.1% |
| Latin America | 9 | 0.2% |
| South Africa | 31 | 0.8% |
| South America | 9 | 0.2% | View All 6 Rows |
Sex and Age in Horicon
Sex and Age in Horicon
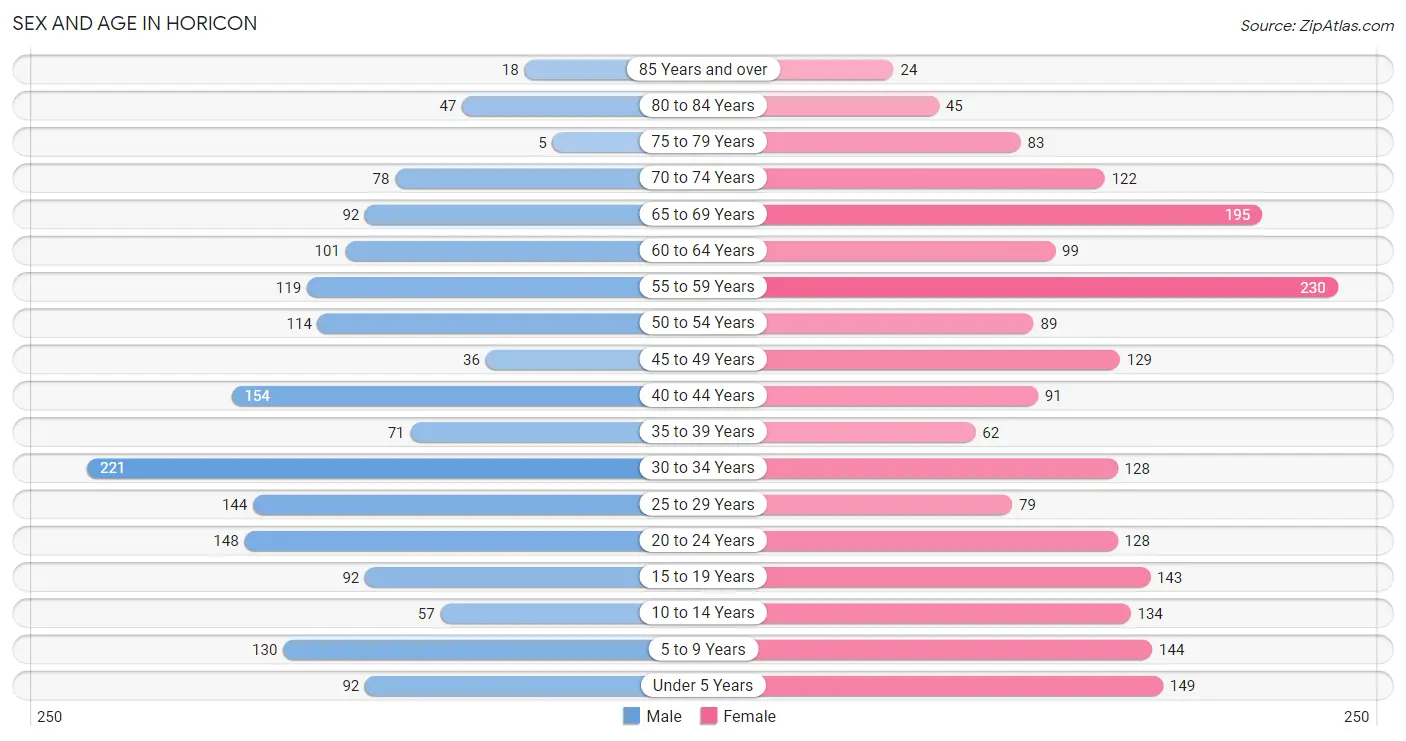
The most populous age groups in Horicon are 30 to 34 Years (221 | 12.9%) for men and 55 to 59 Years (230 | 11.1%) for women.
| Age Bracket | Male | Female |
| Under 5 Years | 92 (5.3%) | 149 (7.2%) |
| 5 to 9 Years | 130 (7.6%) | 144 (6.9%) |
| 10 to 14 Years | 57 (3.3%) | 134 (6.5%) |
| 15 to 19 Years | 92 (5.3%) | 143 (6.9%) |
| 20 to 24 Years | 148 (8.6%) | 128 (6.2%) |
| 25 to 29 Years | 144 (8.4%) | 79 (3.8%) |
| 30 to 34 Years | 221 (12.9%) | 128 (6.2%) |
| 35 to 39 Years | 71 (4.1%) | 62 (3.0%) |
| 40 to 44 Years | 154 (9.0%) | 91 (4.4%) |
| 45 to 49 Years | 36 (2.1%) | 129 (6.2%) |
| 50 to 54 Years | 114 (6.6%) | 89 (4.3%) |
| 55 to 59 Years | 119 (6.9%) | 230 (11.1%) |
| 60 to 64 Years | 101 (5.9%) | 99 (4.8%) |
| 65 to 69 Years | 92 (5.3%) | 195 (9.4%) |
| 70 to 74 Years | 78 (4.5%) | 122 (5.9%) |
| 75 to 79 Years | 5 (0.3%) | 83 (4.0%) |
| 80 to 84 Years | 47 (2.7%) | 45 (2.2%) |
| 85 Years and over | 18 (1.1%) | 24 (1.2%) |
| Total | 1,719 (100.0%) | 2,074 (100.0%) |
Families and Households in Horicon
Median Family Size in Horicon
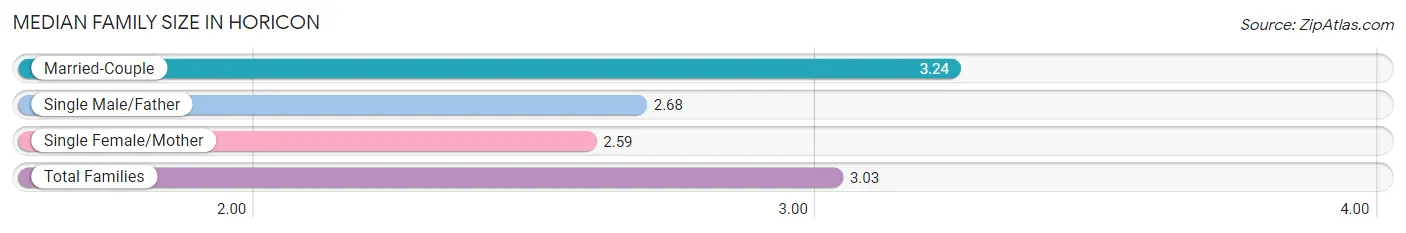
The median family size in Horicon is 3.03 persons per family, with married-couple families (572 | 65.8%) accounting for the largest median family size of 3.24 persons per family. On the other hand, single female/mother families (160 | 18.4%) represent the smallest median family size with 2.59 persons per family.
| Family Type | # Families | Family Size |
| Married-Couple | 572 (65.8%) | 3.24 |
| Single Male/Father | 137 (15.8%) | 2.68 |
| Single Female/Mother | 160 (18.4%) | 2.59 |
| Total Families | 869 (100.0%) | 3.03 |
Median Household Size in Horicon
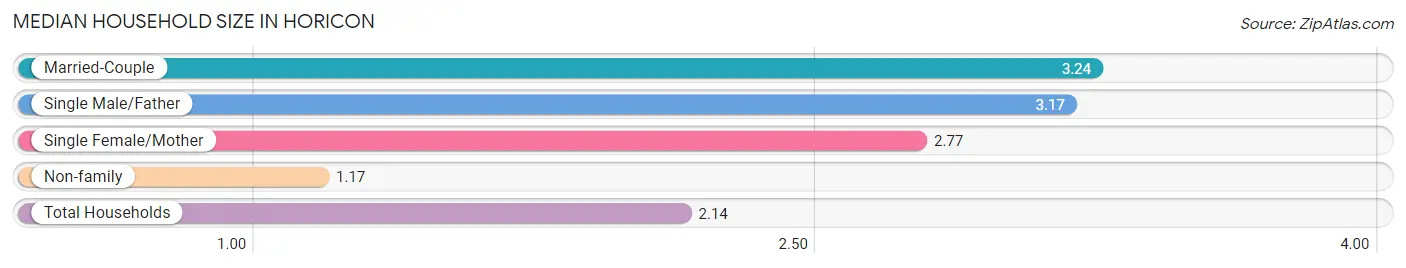
The median household size in Horicon is 2.14 persons per household, with married-couple households (572 | 32.6%) accounting for the largest median household size of 3.24 persons per household. non-family households (888 | 50.5%) represent the smallest median household size with 1.17 persons per household.
| Household Type | # Households | Household Size |
| Married-Couple | 572 (32.6%) | 3.24 |
| Single Male/Father | 137 (7.8%) | 3.17 |
| Single Female/Mother | 160 (9.1%) | 2.77 |
| Non-family | 888 (50.5%) | 1.17 |
| Total Households | 1,757 (100.0%) | 2.14 |
Household Size by Marriage Status in Horicon
Out of a total of 1,757 households in Horicon, 869 (49.5%) are family households, while 888 (50.5%) are nonfamily households. The most numerous type of family households are 2-person households, comprising 338, and the most common type of nonfamily households are 1-person households, comprising 762.
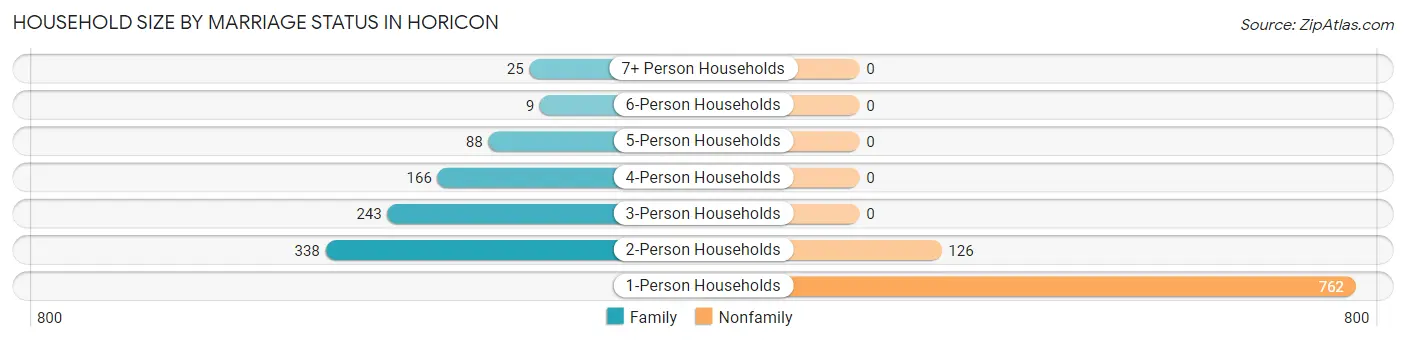
| Household Size | Family Households | Nonfamily Households |
| 1-Person Households | - | 762 (43.4%) |
| 2-Person Households | 338 (19.2%) | 126 (7.2%) |
| 3-Person Households | 243 (13.8%) | 0 (0.0%) |
| 4-Person Households | 166 (9.5%) | 0 (0.0%) |
| 5-Person Households | 88 (5.0%) | 0 (0.0%) |
| 6-Person Households | 9 (0.5%) | 0 (0.0%) |
| 7+ Person Households | 25 (1.4%) | 0 (0.0%) |
| Total | 869 (49.5%) | 888 (50.5%) |
Female Fertility in Horicon
Fertility by Age in Horicon
Average fertility rate in Horicon is 93.0 births per 1,000 women. Women in the age bracket of 20 to 34 years have the highest fertility rate with 215.0 births per 1,000 women. Women in the age bracket of 20 to 34 years acount for 100.0% of all women with births.
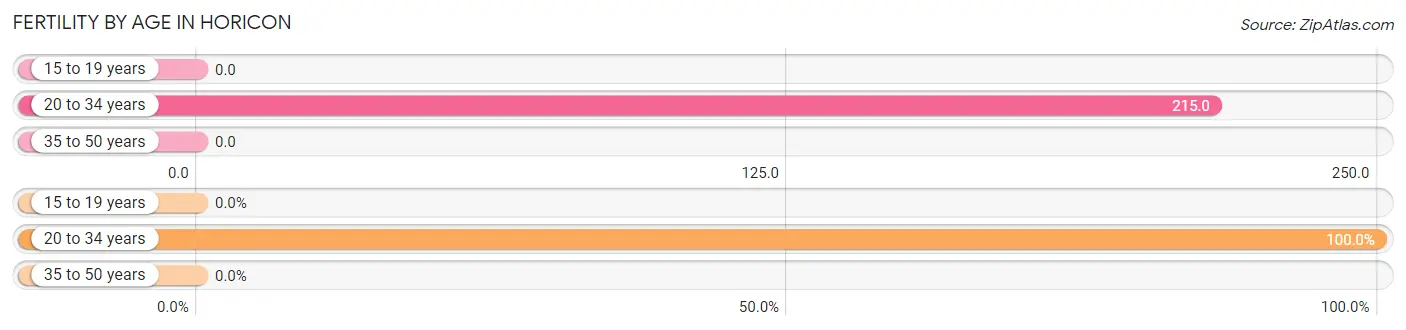
| Age Bracket | Women with Births | Births / 1,000 Women |
| 15 to 19 years | 0 (0.0%) | 0.0 |
| 20 to 34 years | 72 (100.0%) | 215.0 |
| 35 to 50 years | 0 (0.0%) | 0.0 |
| Total | 72 (100.0%) | 93.0 |
Fertility by Age by Marriage Status in Horicon
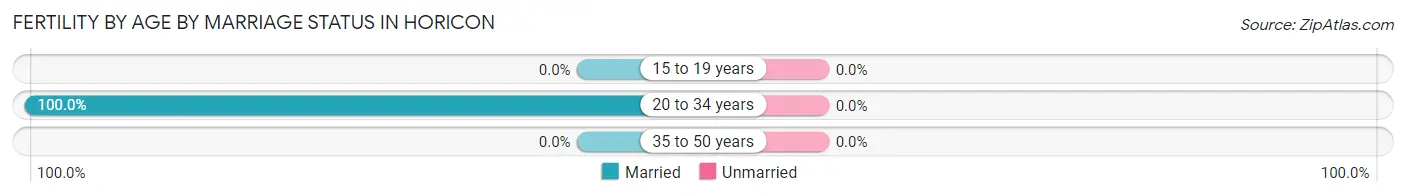
| Age Bracket | Married | Unmarried |
| 15 to 19 years | 0 (0.0%) | 0 (0.0%) |
| 20 to 34 years | 72 (100.0%) | 0 (0.0%) |
| 35 to 50 years | 0 (0.0%) | 0 (0.0%) |
| Total | 72 (100.0%) | 0 (0.0%) |
Fertility by Education in Horicon
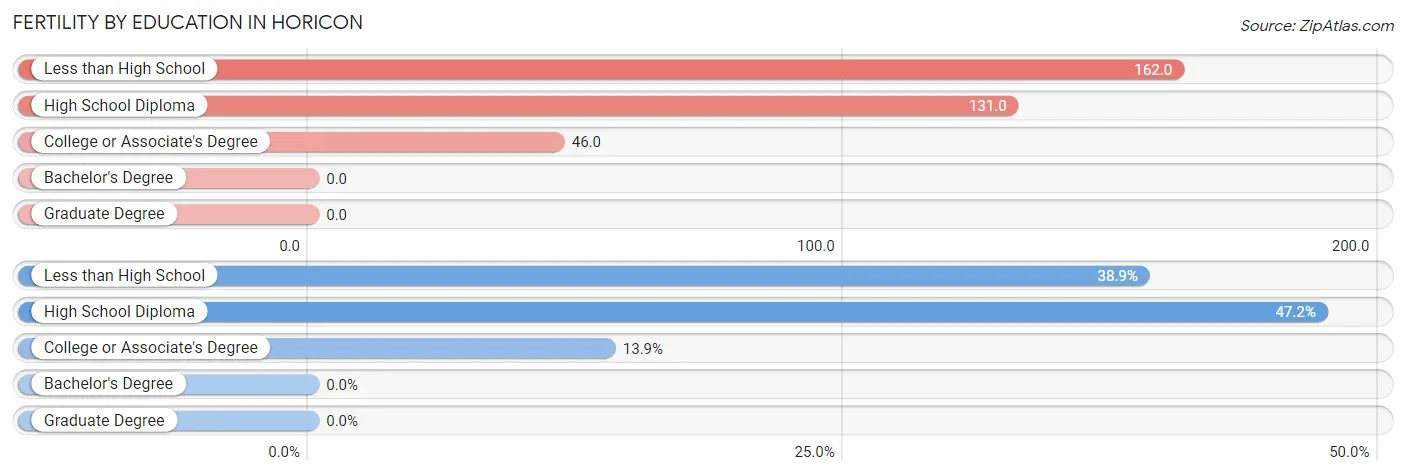
| Educational Attainment | Women with Births | Births / 1,000 Women |
| Less than High School | 28 (38.9%) | 162.0 |
| High School Diploma | 34 (47.2%) | 131.0 |
| College or Associate's Degree | 10 (13.9%) | 46.0 |
| Bachelor's Degree | 0 (0.0%) | 0.0 |
| Graduate Degree | 0 (0.0%) | 0.0 |
| Total | 72 (100.0%) | 93.0 |
Fertility by Education by Marriage Status in Horicon
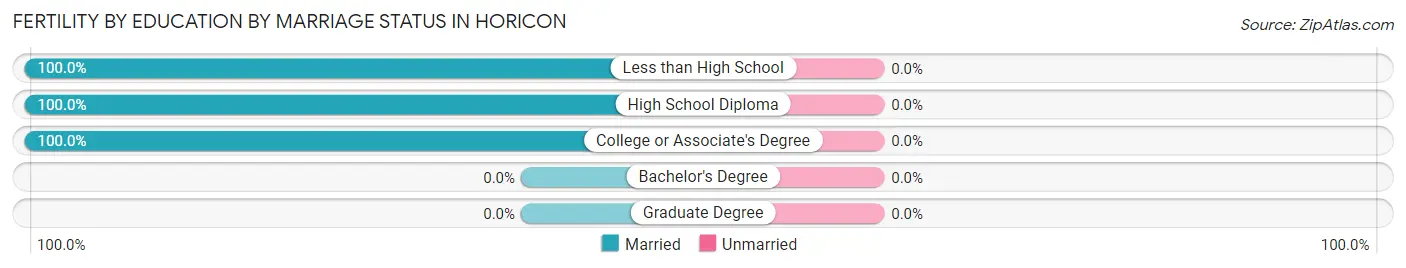
| Educational Attainment | Married | Unmarried |
| Less than High School | 28 (100.0%) | 0 (0.0%) |
| High School Diploma | 34 (100.0%) | 0 (0.0%) |
| College or Associate's Degree | 10 (100.0%) | 0 (0.0%) |
| Bachelor's Degree | 0 (0.0%) | 0 (0.0%) |
| Graduate Degree | 0 (0.0%) | 0 (0.0%) |
| Total | 72 (100.0%) | 0 (0.0%) |
Employment Characteristics in Horicon
Employment by Class of Employer in Horicon
Among the 1,858 employed individuals in Horicon, private company employees (1,342 | 72.2%), not-for-profit organizations (206 | 11.1%), and self-employed (not incorporated) (139 | 7.5%) make up the most common classes of employment.
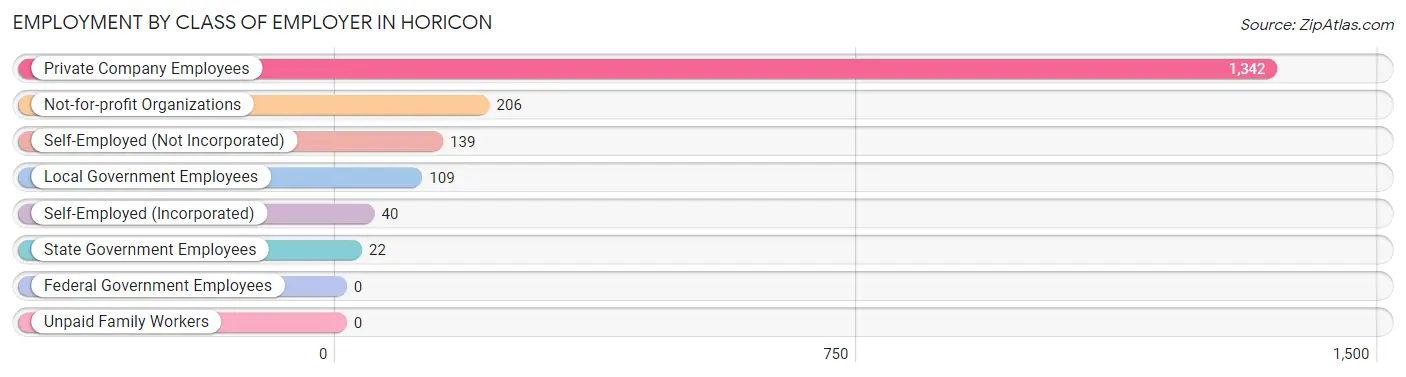
| Employer Class | # Employees | % Employees |
| Private Company Employees | 1,342 | 72.2% |
| Self-Employed (Incorporated) | 40 | 2.1% |
| Self-Employed (Not Incorporated) | 139 | 7.5% |
| Not-for-profit Organizations | 206 | 11.1% |
| Local Government Employees | 109 | 5.9% |
| State Government Employees | 22 | 1.2% |
| Federal Government Employees | 0 | 0.0% |
| Unpaid Family Workers | 0 | 0.0% |
| Total | 1,858 | 100.0% |
Employment Status by Age in Horicon
According to the labor force statistics for Horicon, out of the total population over 16 years of age (3,013), 67.2% or 2,025 individuals are in the labor force, with 4.9% or 99 of them unemployed. The age group with the highest labor force participation rate is 45 to 54 years, with 91.3% or 336 individuals in the labor force. Within the labor force, the 16 to 19 years age range has the highest percentage of unemployed individuals, with 40.4% or 40 of them being unemployed.
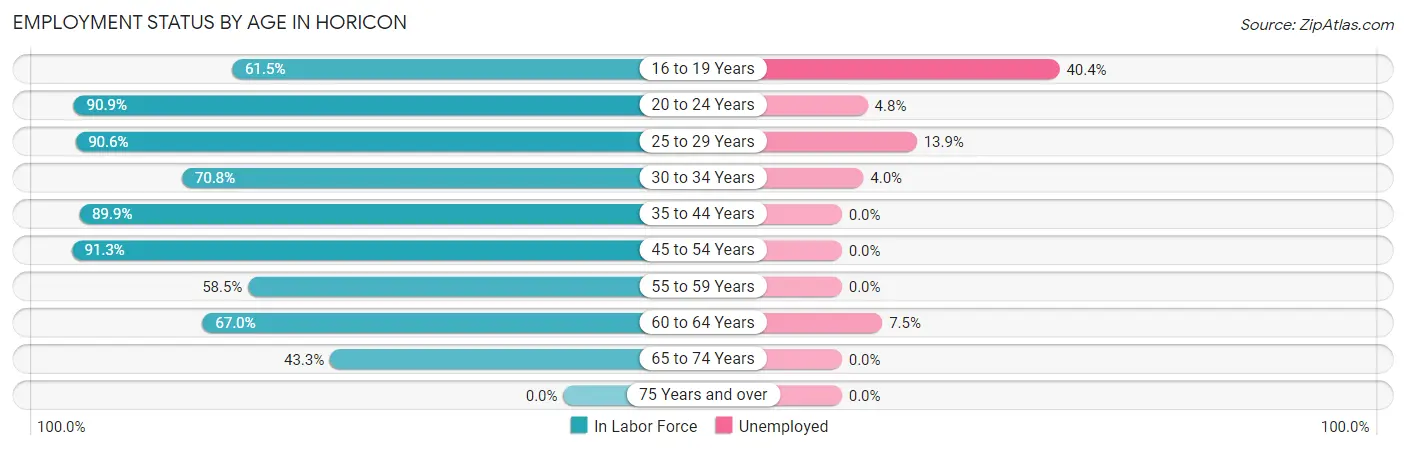
| Age Bracket | In Labor Force | Unemployed |
| 16 to 19 Years | 99 (61.5%) | 40 (40.4%) |
| 20 to 24 Years | 251 (90.9%) | 12 (4.8%) |
| 25 to 29 Years | 202 (90.6%) | 28 (13.9%) |
| 30 to 34 Years | 247 (70.8%) | 10 (4.0%) |
| 35 to 44 Years | 340 (89.9%) | 0 (0.0%) |
| 45 to 54 Years | 336 (91.3%) | 0 (0.0%) |
| 55 to 59 Years | 204 (58.5%) | 0 (0.0%) |
| 60 to 64 Years | 134 (67.0%) | 10 (7.5%) |
| 65 to 74 Years | 211 (43.3%) | 0 (0.0%) |
| 75 Years and over | 0 (0.0%) | 0 (0.0%) |
| Total | 2,025 (67.2%) | 99 (4.9%) |
Employment Status by Educational Attainment in Horicon
According to labor force statistics for Horicon, 78.4% of individuals (1,464) out of the total population between 25 and 64 years of age (1,867) are in the labor force, with 3.3% or 48 of them being unemployed. The group with the highest labor force participation rate are those with the educational attainment of bachelor's degree or higher, with 90.3% or 234 individuals in the labor force. Within the labor force, individuals with less than high school education have the highest percentage of unemployment, with 30.4% or 28 of them being unemployed.
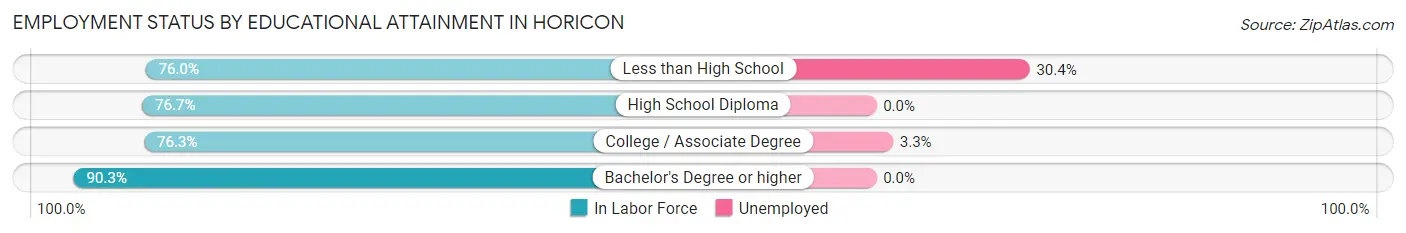
| Educational Attainment | In Labor Force | Unemployed |
| Less than High School | 92 (76.0%) | 37 (30.4%) |
| High School Diploma | 536 (76.7%) | 0 (0.0%) |
| College / Associate Degree | 601 (76.3%) | 26 (3.3%) |
| Bachelor's Degree or higher | 234 (90.3%) | 0 (0.0%) |
| Total | 1,464 (78.4%) | 62 (3.3%) |
Employment Occupations by Sex in Horicon
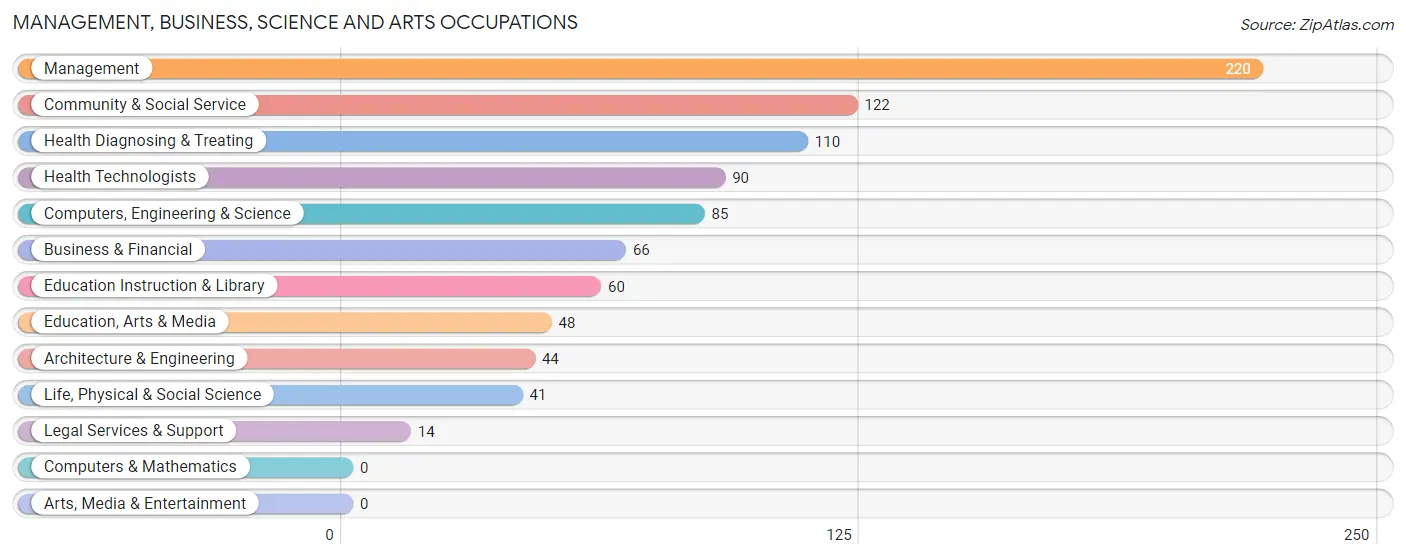
Management, Business, Science and Arts Occupations
The most common Management, Business, Science and Arts occupations in Horicon are Management (220 | 11.4%), Community & Social Service (122 | 6.3%), Health Diagnosing & Treating (110 | 5.7%), Health Technologists (90 | 4.7%), and Computers, Engineering & Science (85 | 4.4%).
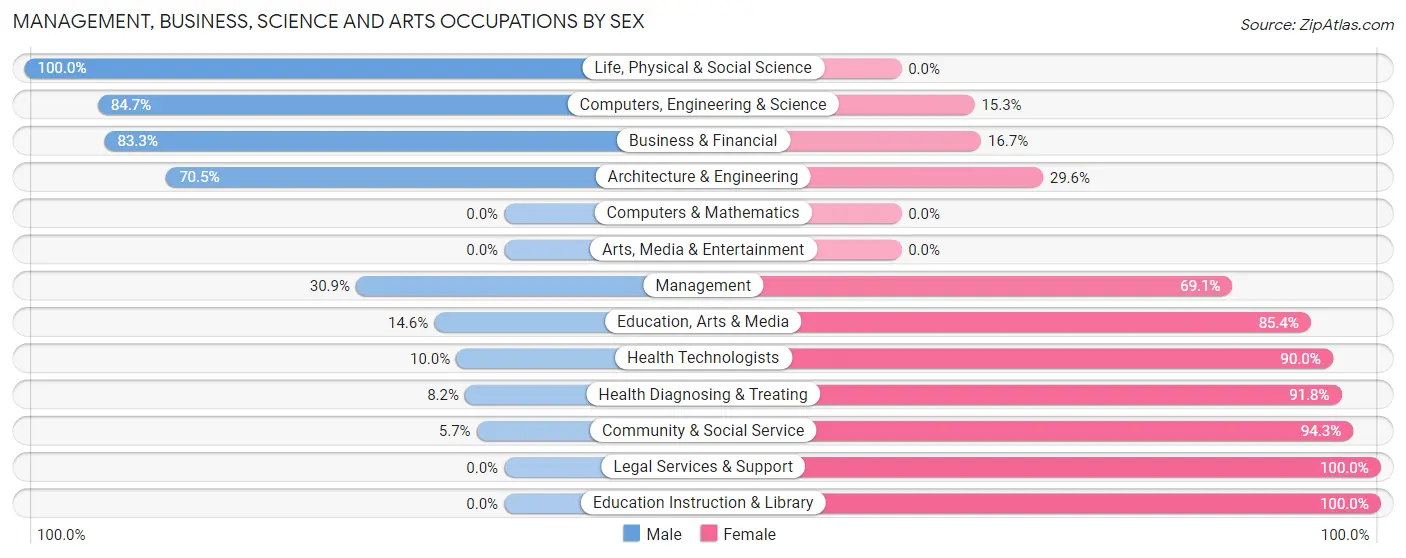
Management, Business, Science and Arts Occupations by Sex
Within the Management, Business, Science and Arts occupations in Horicon, the most male-oriented occupations are Life, Physical & Social Science (100.0%), Computers, Engineering & Science (84.7%), and Business & Financial (83.3%), while the most female-oriented occupations are Legal Services & Support (100.0%), Education Instruction & Library (100.0%), and Community & Social Service (94.3%).
| Occupation | Male | Female |
| Management | 68 (30.9%) | 152 (69.1%) |
| Business & Financial | 55 (83.3%) | 11 (16.7%) |
| Computers, Engineering & Science | 72 (84.7%) | 13 (15.3%) |
| Computers & Mathematics | 0 (0.0%) | 0 (0.0%) |
| Architecture & Engineering | 31 (70.5%) | 13 (29.5%) |
| Life, Physical & Social Science | 41 (100.0%) | 0 (0.0%) |
| Community & Social Service | 7 (5.7%) | 115 (94.3%) |
| Education, Arts & Media | 7 (14.6%) | 41 (85.4%) |
| Legal Services & Support | 0 (0.0%) | 14 (100.0%) |
| Education Instruction & Library | 0 (0.0%) | 60 (100.0%) |
| Arts, Media & Entertainment | 0 (0.0%) | 0 (0.0%) |
| Health Diagnosing & Treating | 9 (8.2%) | 101 (91.8%) |
| Health Technologists | 9 (10.0%) | 81 (90.0%) |
| Total (Category) | 211 (35.0%) | 392 (65.0%) |
| Total (Overall) | 991 (51.5%) | 933 (48.5%) |
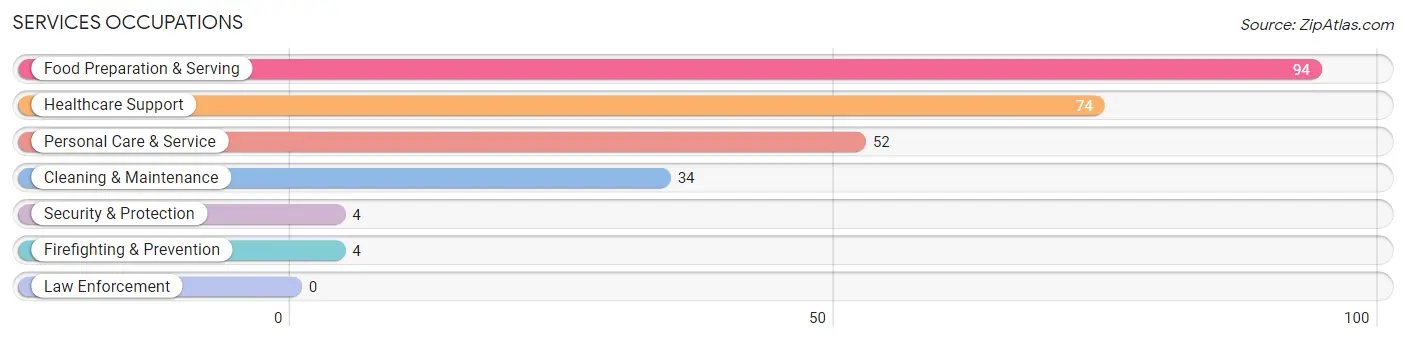
Services Occupations
The most common Services occupations in Horicon are Food Preparation & Serving (94 | 4.9%), Healthcare Support (74 | 3.8%), Personal Care & Service (52 | 2.7%), Cleaning & Maintenance (34 | 1.8%), and Security & Protection (4 | 0.2%).
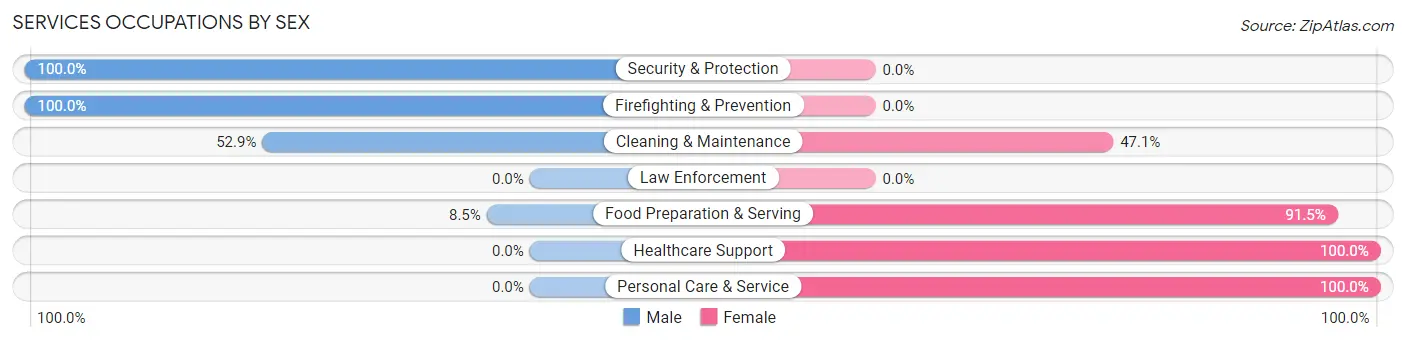
Services Occupations by Sex
Within the Services occupations in Horicon, the most male-oriented occupations are Security & Protection (100.0%), Firefighting & Prevention (100.0%), and Cleaning & Maintenance (52.9%), while the most female-oriented occupations are Healthcare Support (100.0%), Personal Care & Service (100.0%), and Food Preparation & Serving (91.5%).
| Occupation | Male | Female |
| Healthcare Support | 0 (0.0%) | 74 (100.0%) |
| Security & Protection | 4 (100.0%) | 0 (0.0%) |
| Firefighting & Prevention | 4 (100.0%) | 0 (0.0%) |
| Law Enforcement | 0 (0.0%) | 0 (0.0%) |
| Food Preparation & Serving | 8 (8.5%) | 86 (91.5%) |
| Cleaning & Maintenance | 18 (52.9%) | 16 (47.1%) |
| Personal Care & Service | 0 (0.0%) | 52 (100.0%) |
| Total (Category) | 30 (11.6%) | 228 (88.4%) |
| Total (Overall) | 991 (51.5%) | 933 (48.5%) |
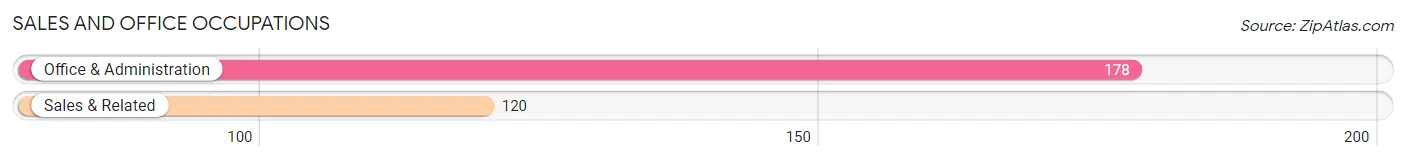
Sales and Office Occupations
The most common Sales and Office occupations in Horicon are Office & Administration (178 | 9.2%), and Sales & Related (120 | 6.2%).
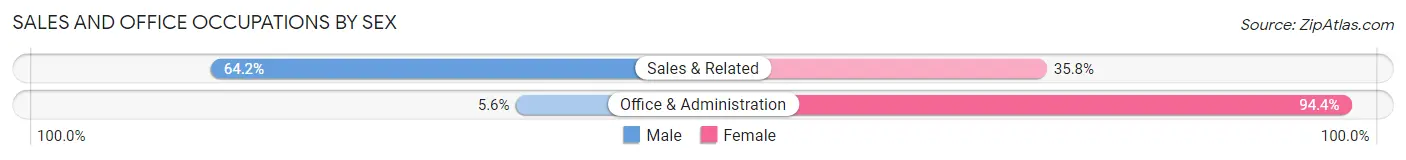
Sales and Office Occupations by Sex
| Occupation | Male | Female |
| Sales & Related | 77 (64.2%) | 43 (35.8%) |
| Office & Administration | 10 (5.6%) | 168 (94.4%) |
| Total (Category) | 87 (29.2%) | 211 (70.8%) |
| Total (Overall) | 991 (51.5%) | 933 (48.5%) |
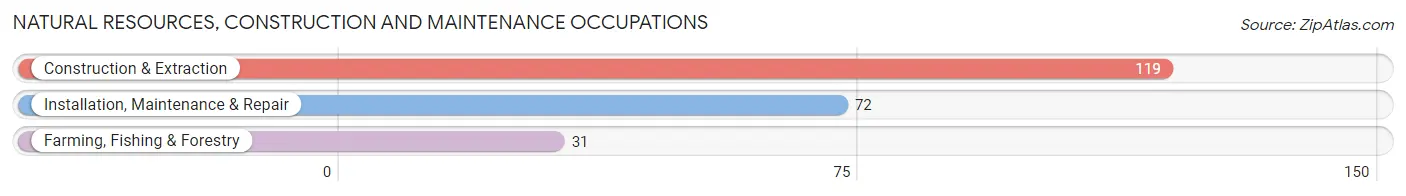
Natural Resources, Construction and Maintenance Occupations
The most common Natural Resources, Construction and Maintenance occupations in Horicon are Construction & Extraction (119 | 6.2%), Installation, Maintenance & Repair (72 | 3.7%), and Farming, Fishing & Forestry (31 | 1.6%).
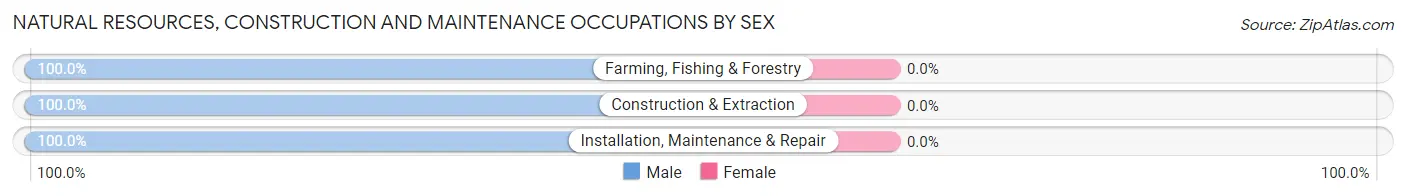
Natural Resources, Construction and Maintenance Occupations by Sex
| Occupation | Male | Female |
| Farming, Fishing & Forestry | 31 (100.0%) | 0 (0.0%) |
| Construction & Extraction | 119 (100.0%) | 0 (0.0%) |
| Installation, Maintenance & Repair | 72 (100.0%) | 0 (0.0%) |
| Total (Category) | 222 (100.0%) | 0 (0.0%) |
| Total (Overall) | 991 (51.5%) | 933 (48.5%) |
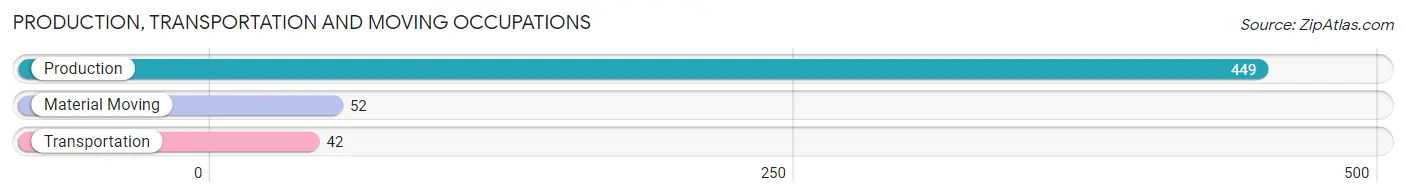
Production, Transportation and Moving Occupations
The most common Production, Transportation and Moving occupations in Horicon are Production (449 | 23.3%), Material Moving (52 | 2.7%), and Transportation (42 | 2.2%).
Production, Transportation and Moving Occupations by Sex
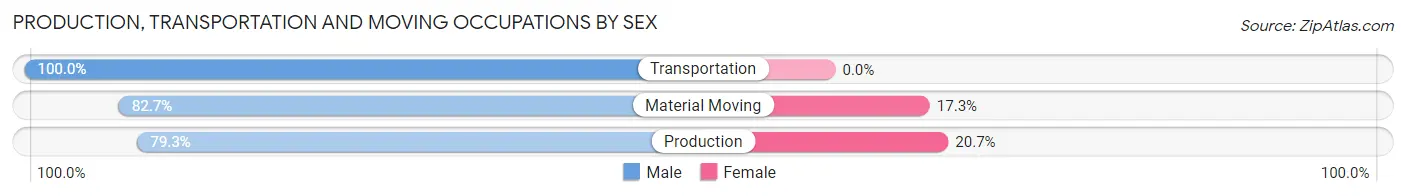
| Occupation | Male | Female |
| Production | 356 (79.3%) | 93 (20.7%) |
| Transportation | 42 (100.0%) | 0 (0.0%) |
| Material Moving | 43 (82.7%) | 9 (17.3%) |
| Total (Category) | 441 (81.2%) | 102 (18.8%) |
| Total (Overall) | 991 (51.5%) | 933 (48.5%) |
Employment Industries by Sex in Horicon
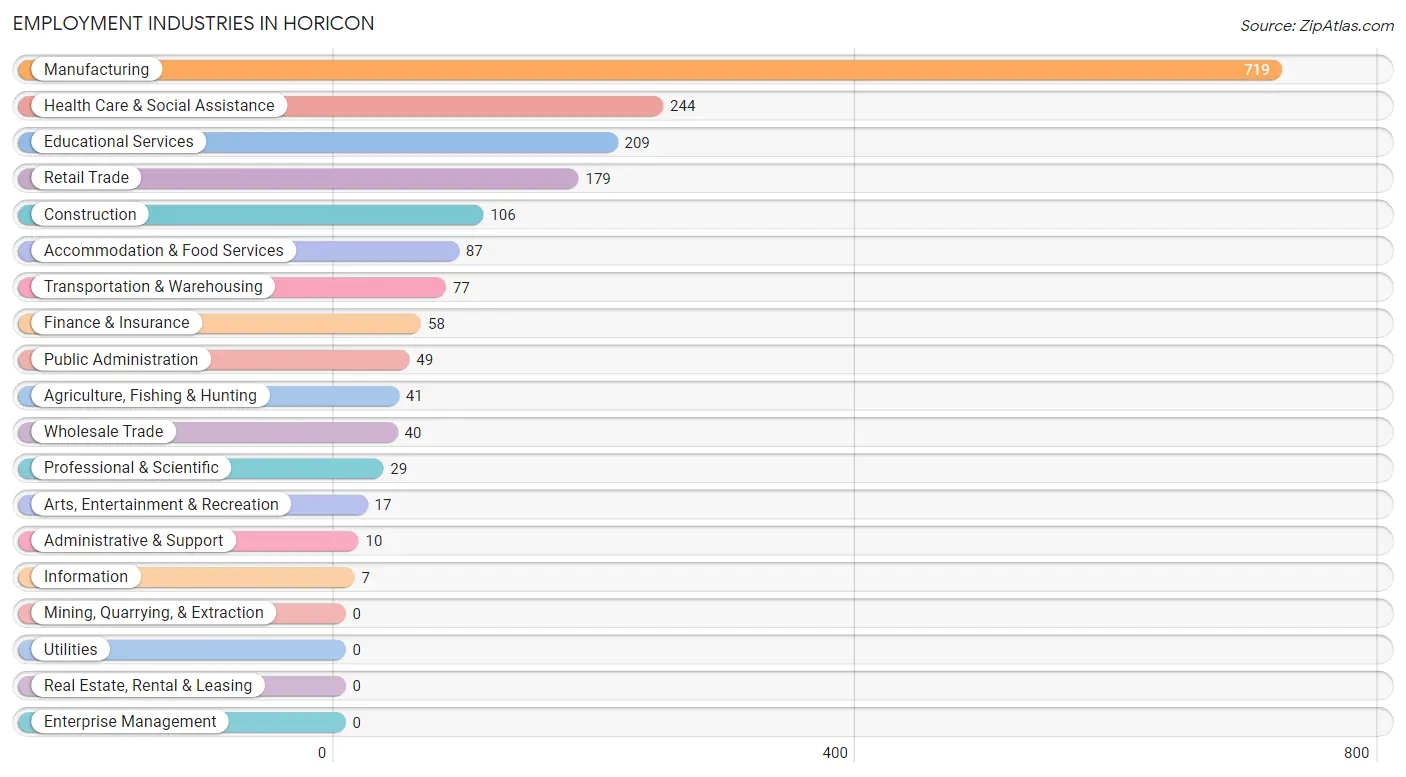
Employment Industries in Horicon
The major employment industries in Horicon include Manufacturing (719 | 37.4%), Health Care & Social Assistance (244 | 12.7%), Educational Services (209 | 10.9%), Retail Trade (179 | 9.3%), and Construction (106 | 5.5%).
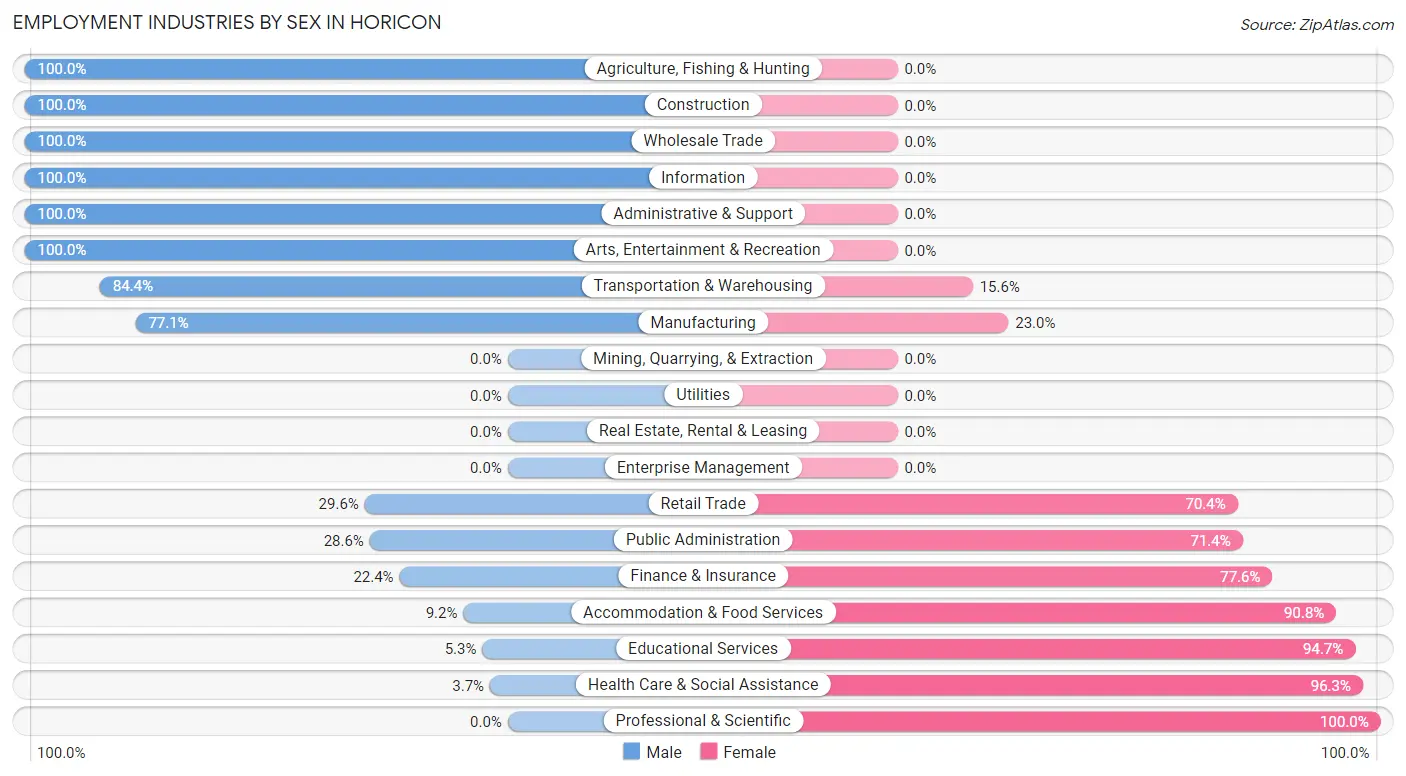
Employment Industries by Sex in Horicon
The Horicon industries that see more men than women are Agriculture, Fishing & Hunting (100.0%), Construction (100.0%), and Wholesale Trade (100.0%), whereas the industries that tend to have a higher number of women are Professional & Scientific (100.0%), Health Care & Social Assistance (96.3%), and Educational Services (94.7%).
| Industry | Male | Female |
| Agriculture, Fishing & Hunting | 41 (100.0%) | 0 (0.0%) |
| Mining, Quarrying, & Extraction | 0 (0.0%) | 0 (0.0%) |
| Construction | 106 (100.0%) | 0 (0.0%) |
| Manufacturing | 554 (77.0%) | 165 (23.0%) |
| Wholesale Trade | 40 (100.0%) | 0 (0.0%) |
| Retail Trade | 53 (29.6%) | 126 (70.4%) |
| Transportation & Warehousing | 65 (84.4%) | 12 (15.6%) |
| Utilities | 0 (0.0%) | 0 (0.0%) |
| Information | 7 (100.0%) | 0 (0.0%) |
| Finance & Insurance | 13 (22.4%) | 45 (77.6%) |
| Real Estate, Rental & Leasing | 0 (0.0%) | 0 (0.0%) |
| Professional & Scientific | 0 (0.0%) | 29 (100.0%) |
| Enterprise Management | 0 (0.0%) | 0 (0.0%) |
| Administrative & Support | 10 (100.0%) | 0 (0.0%) |
| Educational Services | 11 (5.3%) | 198 (94.7%) |
| Health Care & Social Assistance | 9 (3.7%) | 235 (96.3%) |
| Arts, Entertainment & Recreation | 17 (100.0%) | 0 (0.0%) |
| Accommodation & Food Services | 8 (9.2%) | 79 (90.8%) |
| Public Administration | 14 (28.6%) | 35 (71.4%) |
| Total | 991 (51.5%) | 933 (48.5%) |
Education in Horicon
School Enrollment in Horicon
The most common levels of schooling among the 764 students in Horicon are high school (218 | 28.5%), elementary school (212 | 27.8%), and middle school (182 | 23.8%).
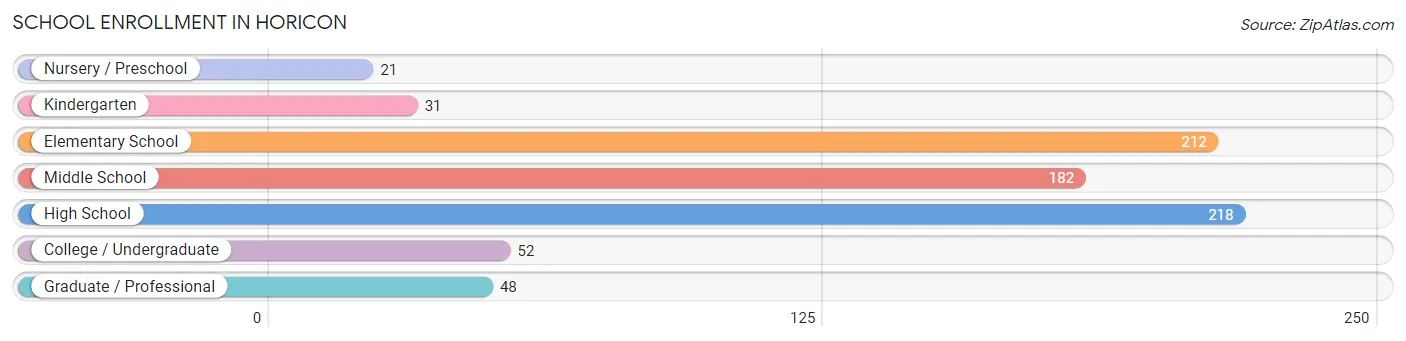
| School Level | # Students | % Students |
| Nursery / Preschool | 21 | 2.8% |
| Kindergarten | 31 | 4.1% |
| Elementary School | 212 | 27.8% |
| Middle School | 182 | 23.8% |
| High School | 218 | 28.5% |
| College / Undergraduate | 52 | 6.8% |
| Graduate / Professional | 48 | 6.3% |
| Total | 764 | 100.0% |
School Enrollment by Age by Funding Source in Horicon
Out of a total of 764 students who are enrolled in schools in Horicon, 86 (11.3%) attend a private institution, while the remaining 678 (88.7%) are enrolled in public schools. The age group of 3 to 4 year olds has the highest likelihood of being enrolled in private schools, with 8 (100.0% in the age bracket) enrolled. Conversely, the age group of 15 to 17 year olds has the lowest likelihood of being enrolled in a private school, with 175 (100.0% in the age bracket) attending a public institution.
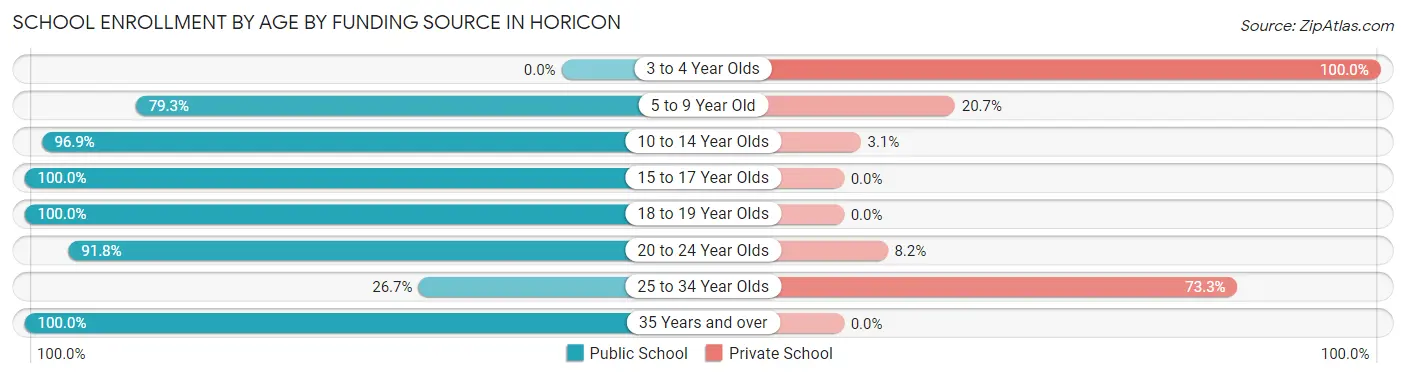
| Age Bracket | Public School | Private School |
| 3 to 4 Year Olds | 0 (0.0%) | 8 (100.0%) |
| 5 to 9 Year Old | 203 (79.3%) | 53 (20.7%) |
| 10 to 14 Year Olds | 185 (96.9%) | 6 (3.1%) |
| 15 to 17 Year Olds | 175 (100.0%) | 0 (0.0%) |
| 18 to 19 Year Olds | 13 (100.0%) | 0 (0.0%) |
| 20 to 24 Year Olds | 90 (91.8%) | 8 (8.2%) |
| 25 to 34 Year Olds | 4 (26.7%) | 11 (73.3%) |
| 35 Years and over | 8 (100.0%) | 0 (0.0%) |
| Total | 678 (88.7%) | 86 (11.3%) |
Educational Attainment by Field of Study in Horicon
Education (178 | 35.7%), arts & humanities (61 | 12.2%), business (42 | 8.4%), social sciences (41 | 8.2%), and psychology (35 | 7.0%) are the most common fields of study among 499 individuals in Horicon who have obtained a bachelor's degree or higher.
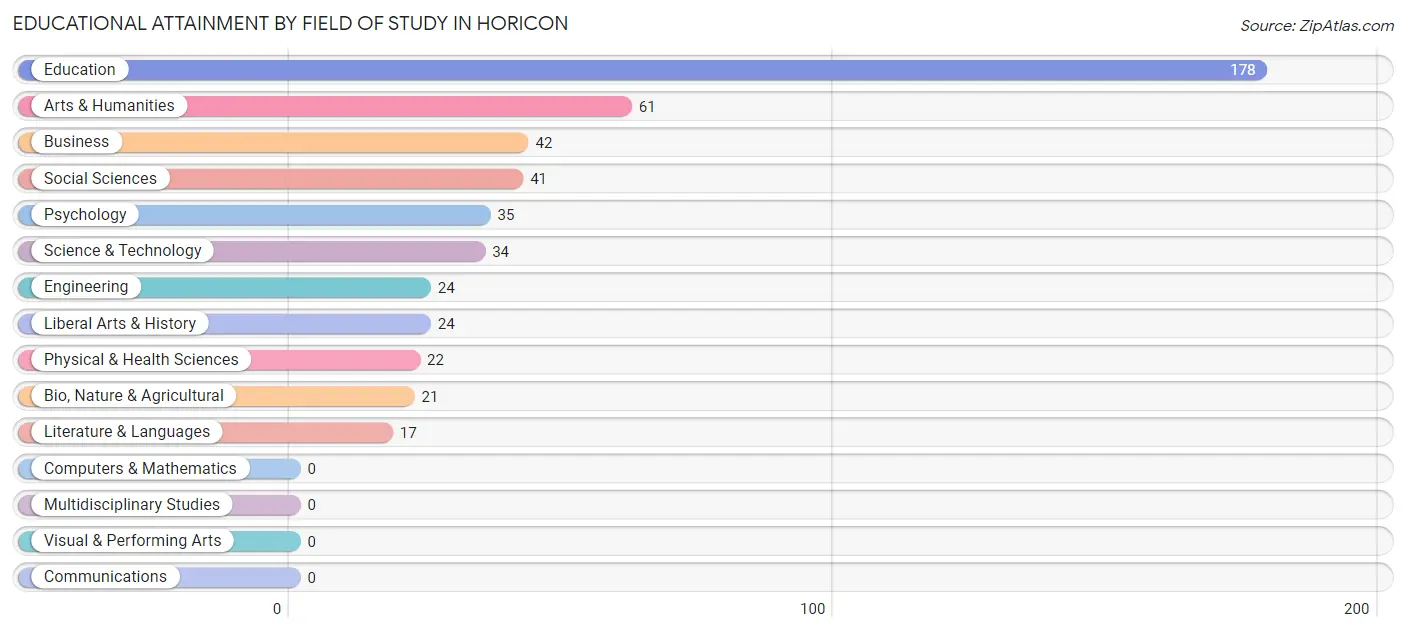
| Field of Study | # Graduates | % Graduates |
| Computers & Mathematics | 0 | 0.0% |
| Bio, Nature & Agricultural | 21 | 4.2% |
| Physical & Health Sciences | 22 | 4.4% |
| Psychology | 35 | 7.0% |
| Social Sciences | 41 | 8.2% |
| Engineering | 24 | 4.8% |
| Multidisciplinary Studies | 0 | 0.0% |
| Science & Technology | 34 | 6.8% |
| Business | 42 | 8.4% |
| Education | 178 | 35.7% |
| Literature & Languages | 17 | 3.4% |
| Liberal Arts & History | 24 | 4.8% |
| Visual & Performing Arts | 0 | 0.0% |
| Communications | 0 | 0.0% |
| Arts & Humanities | 61 | 12.2% |
| Total | 499 | 100.0% |
Transportation & Commute in Horicon
Vehicle Availability by Sex in Horicon
The most prevalent vehicle ownership categories in Horicon are males with 2 vehicles (494, accounting for 52.8%) and females with 2 vehicles (394, making up 53.5%).
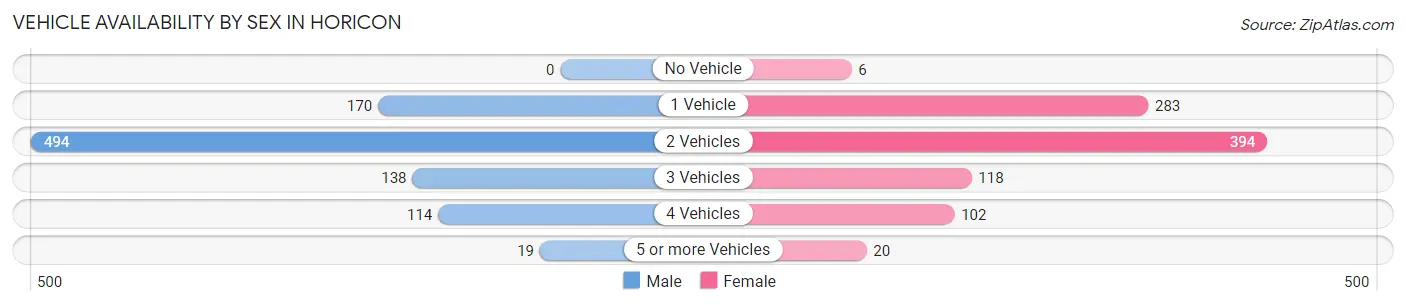
| Vehicles Available | Male | Female |
| No Vehicle | 0 (0.0%) | 6 (0.6%) |
| 1 Vehicle | 170 (18.2%) | 283 (30.7%) |
| 2 Vehicles | 494 (52.8%) | 394 (42.7%) |
| 3 Vehicles | 138 (14.8%) | 118 (12.8%) |
| 4 Vehicles | 114 (12.2%) | 102 (11.1%) |
| 5 or more Vehicles | 19 (2.0%) | 20 (2.2%) |
| Total | 935 (100.0%) | 923 (100.0%) |
Commute Time in Horicon
The most frequently occuring commute durations in Horicon are 10 to 14 minutes (420 commuters, 25.7%), 5 to 9 minutes (326 commuters, 20.0%), and 20 to 24 minutes (251 commuters, 15.4%).
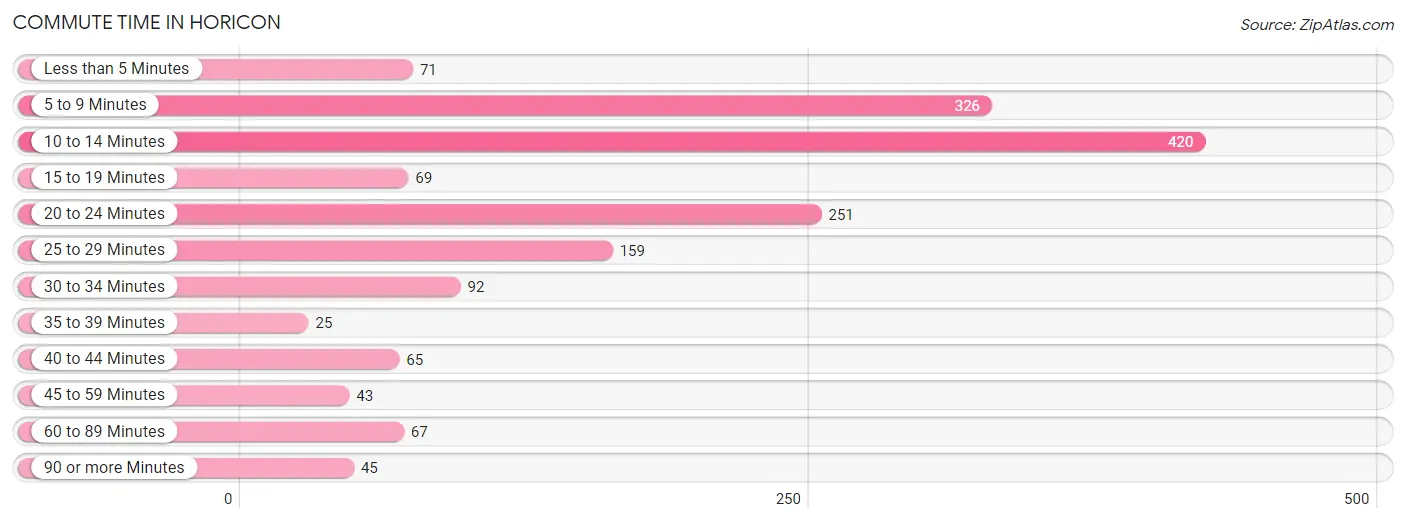
| Commute Time | # Commuters | % Commuters |
| Less than 5 Minutes | 71 | 4.3% |
| 5 to 9 Minutes | 326 | 20.0% |
| 10 to 14 Minutes | 420 | 25.7% |
| 15 to 19 Minutes | 69 | 4.2% |
| 20 to 24 Minutes | 251 | 15.4% |
| 25 to 29 Minutes | 159 | 9.7% |
| 30 to 34 Minutes | 92 | 5.6% |
| 35 to 39 Minutes | 25 | 1.5% |
| 40 to 44 Minutes | 65 | 4.0% |
| 45 to 59 Minutes | 43 | 2.6% |
| 60 to 89 Minutes | 67 | 4.1% |
| 90 or more Minutes | 45 | 2.8% |
Commute Time by Sex in Horicon
The most common commute times in Horicon are 10 to 14 minutes (284 commuters, 32.2%) for males and 20 to 24 minutes (163 commuters, 21.7%) for females.
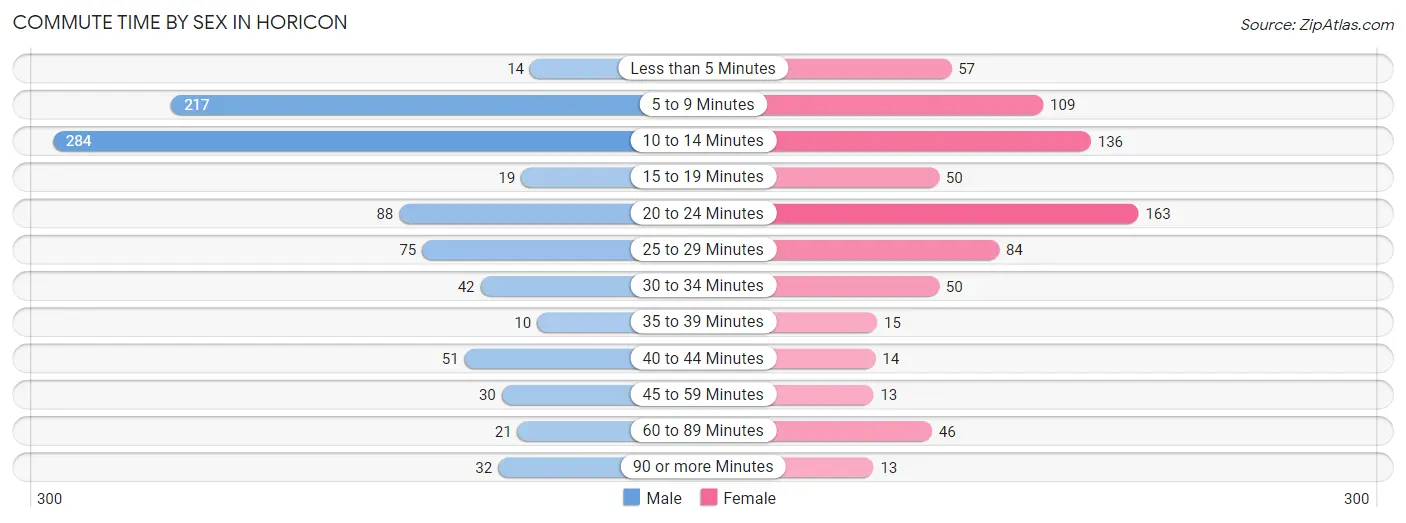
| Commute Time | Male | Female |
| Less than 5 Minutes | 14 (1.6%) | 57 (7.6%) |
| 5 to 9 Minutes | 217 (24.6%) | 109 (14.5%) |
| 10 to 14 Minutes | 284 (32.2%) | 136 (18.1%) |
| 15 to 19 Minutes | 19 (2.1%) | 50 (6.7%) |
| 20 to 24 Minutes | 88 (10.0%) | 163 (21.7%) |
| 25 to 29 Minutes | 75 (8.5%) | 84 (11.2%) |
| 30 to 34 Minutes | 42 (4.8%) | 50 (6.7%) |
| 35 to 39 Minutes | 10 (1.1%) | 15 (2.0%) |
| 40 to 44 Minutes | 51 (5.8%) | 14 (1.9%) |
| 45 to 59 Minutes | 30 (3.4%) | 13 (1.7%) |
| 60 to 89 Minutes | 21 (2.4%) | 46 (6.1%) |
| 90 or more Minutes | 32 (3.6%) | 13 (1.7%) |
Time of Departure to Work by Sex in Horicon
The most frequent times of departure to work in Horicon are 12:00 AM to 4:59 AM (207, 23.4%) for males and 7:00 AM to 7:29 AM (149, 19.9%) for females.
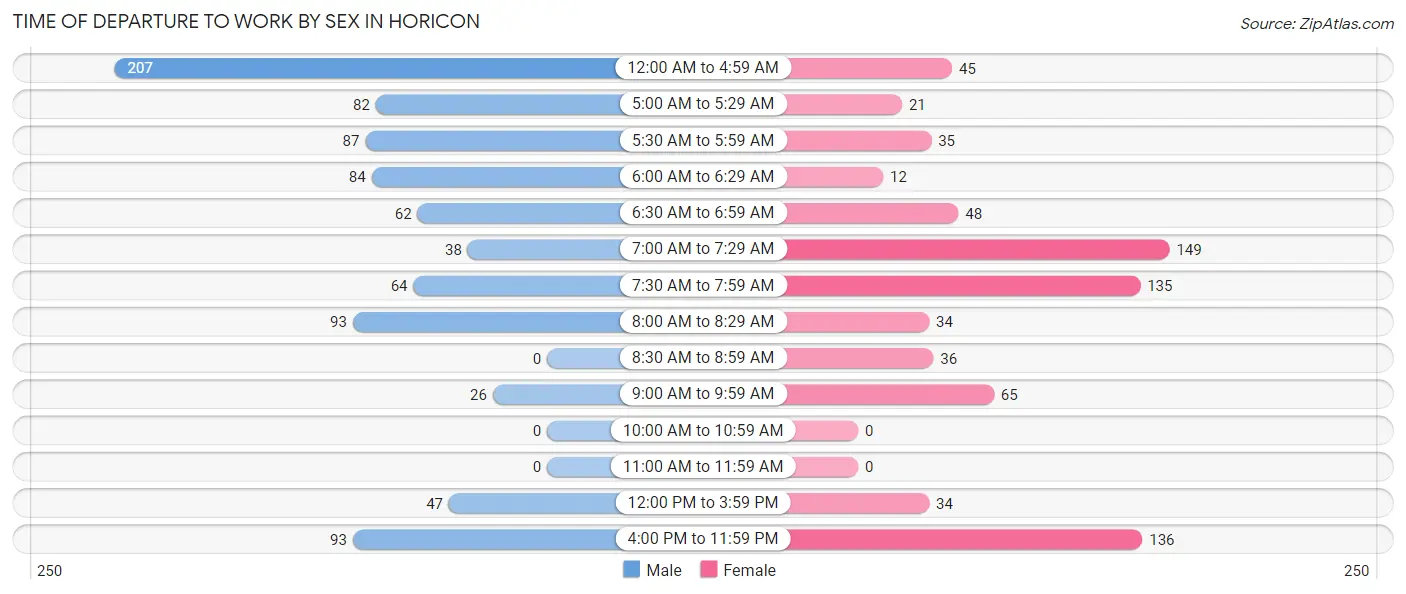
| Time of Departure | Male | Female |
| 12:00 AM to 4:59 AM | 207 (23.4%) | 45 (6.0%) |
| 5:00 AM to 5:29 AM | 82 (9.3%) | 21 (2.8%) |
| 5:30 AM to 5:59 AM | 87 (9.9%) | 35 (4.7%) |
| 6:00 AM to 6:29 AM | 84 (9.5%) | 12 (1.6%) |
| 6:30 AM to 6:59 AM | 62 (7.0%) | 48 (6.4%) |
| 7:00 AM to 7:29 AM | 38 (4.3%) | 149 (19.9%) |
| 7:30 AM to 7:59 AM | 64 (7.2%) | 135 (18.0%) |
| 8:00 AM to 8:29 AM | 93 (10.5%) | 34 (4.5%) |
| 8:30 AM to 8:59 AM | 0 (0.0%) | 36 (4.8%) |
| 9:00 AM to 9:59 AM | 26 (2.9%) | 65 (8.7%) |
| 10:00 AM to 10:59 AM | 0 (0.0%) | 0 (0.0%) |
| 11:00 AM to 11:59 AM | 0 (0.0%) | 0 (0.0%) |
| 12:00 PM to 3:59 PM | 47 (5.3%) | 34 (4.5%) |
| 4:00 PM to 11:59 PM | 93 (10.5%) | 136 (18.1%) |
| Total | 883 (100.0%) | 750 (100.0%) |
Housing Occupancy in Horicon
Occupancy by Ownership in Horicon
Of the total 1,757 dwellings in Horicon, owner-occupied units account for 1,175 (66.9%), while renter-occupied units make up 582 (33.1%).
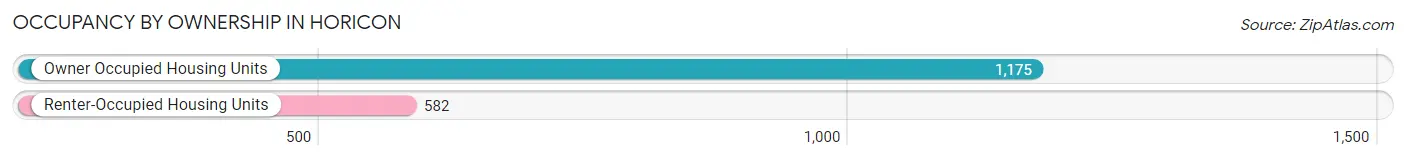
| Occupancy | # Housing Units | % Housing Units |
| Owner Occupied Housing Units | 1,175 | 66.9% |
| Renter-Occupied Housing Units | 582 | 33.1% |
| Total Occupied Housing Units | 1,757 | 100.0% |
Occupancy by Household Size in Horicon
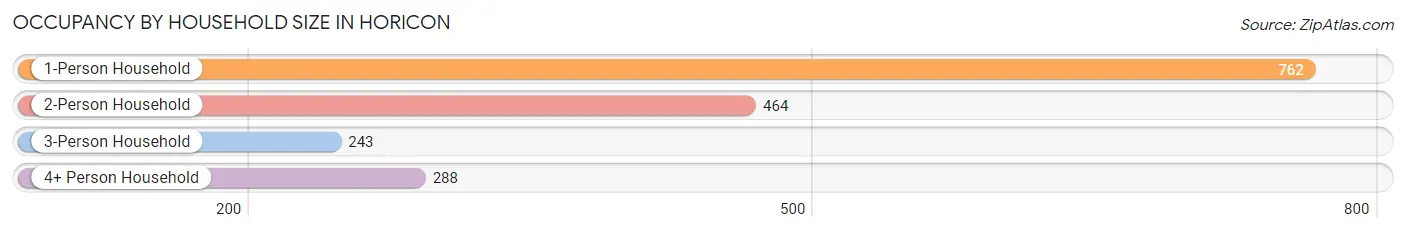
| Household Size | # Housing Units | % Housing Units |
| 1-Person Household | 762 | 43.4% |
| 2-Person Household | 464 | 26.4% |
| 3-Person Household | 243 | 13.8% |
| 4+ Person Household | 288 | 16.4% |
| Total Housing Units | 1,757 | 100.0% |
Occupancy by Ownership by Household Size in Horicon
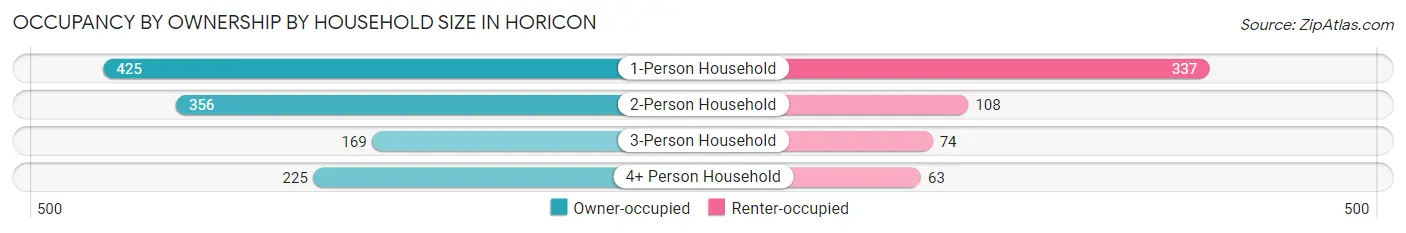
| Household Size | Owner-occupied | Renter-occupied |
| 1-Person Household | 425 (55.8%) | 337 (44.2%) |
| 2-Person Household | 356 (76.7%) | 108 (23.3%) |
| 3-Person Household | 169 (69.6%) | 74 (30.4%) |
| 4+ Person Household | 225 (78.1%) | 63 (21.9%) |
| Total Housing Units | 1,175 (66.9%) | 582 (33.1%) |
Occupancy by Educational Attainment in Horicon
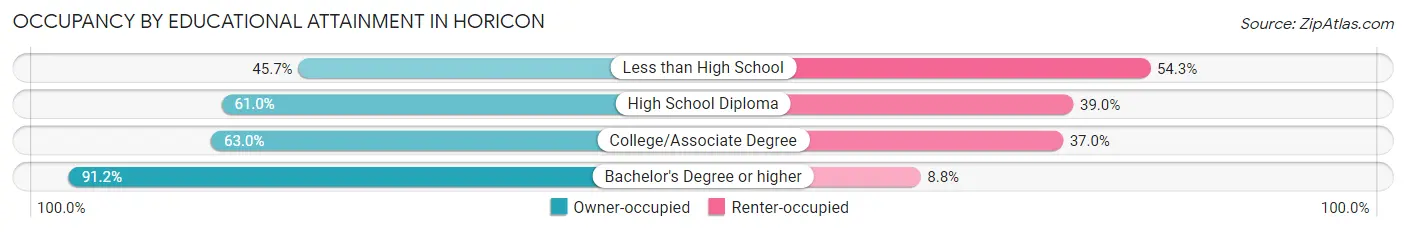
| Household Size | Owner-occupied | Renter-occupied |
| Less than High School | 32 (45.7%) | 38 (54.3%) |
| High School Diploma | 403 (61.0%) | 258 (39.0%) |
| College/Associate Degree | 438 (63.0%) | 257 (37.0%) |
| Bachelor's Degree or higher | 302 (91.2%) | 29 (8.8%) |
Occupancy by Age of Householder in Horicon
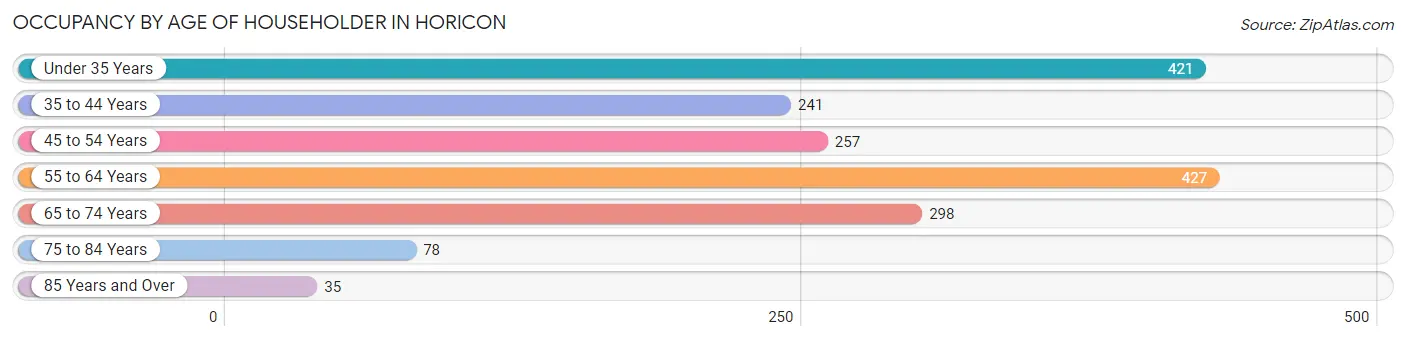
| Age Bracket | # Households | % Households |
| Under 35 Years | 421 | 24.0% |
| 35 to 44 Years | 241 | 13.7% |
| 45 to 54 Years | 257 | 14.6% |
| 55 to 64 Years | 427 | 24.3% |
| 65 to 74 Years | 298 | 17.0% |
| 75 to 84 Years | 78 | 4.4% |
| 85 Years and Over | 35 | 2.0% |
| Total | 1,757 | 100.0% |
Housing Finances in Horicon
Median Income by Occupancy in Horicon
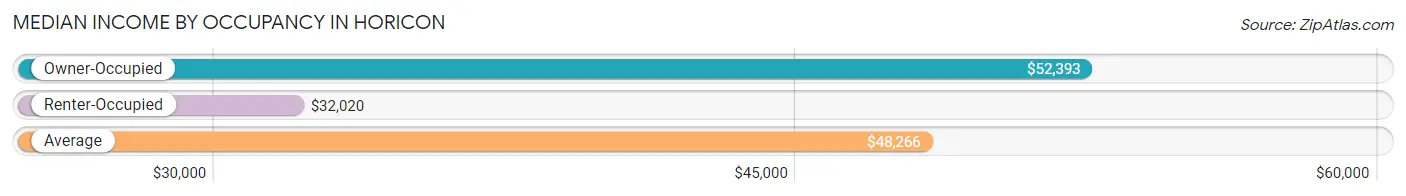
| Occupancy Type | # Households | Median Income |
| Owner-Occupied | 1,175 (66.9%) | $52,393 |
| Renter-Occupied | 582 (33.1%) | $32,020 |
| Average | 1,757 (100.0%) | $48,266 |
Occupancy by Householder Income Bracket in Horicon
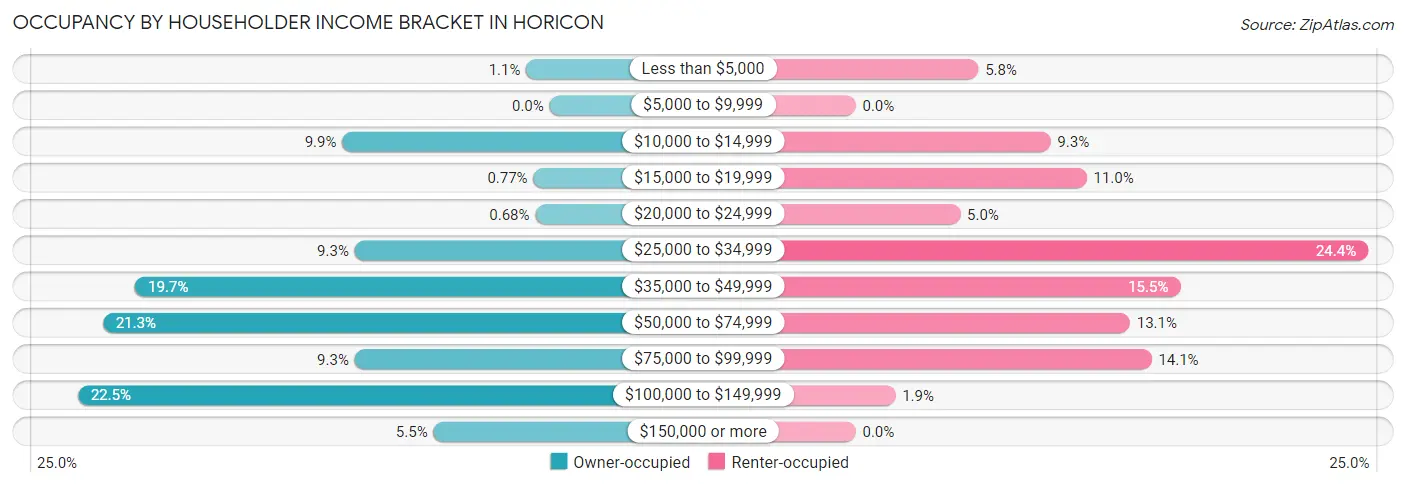
| Income Bracket | Owner-occupied | Renter-occupied |
| Less than $5,000 | 13 (1.1%) | 34 (5.8%) |
| $5,000 to $9,999 | 0 (0.0%) | 0 (0.0%) |
| $10,000 to $14,999 | 116 (9.9%) | 54 (9.3%) |
| $15,000 to $19,999 | 9 (0.8%) | 64 (11.0%) |
| $20,000 to $24,999 | 8 (0.7%) | 29 (5.0%) |
| $25,000 to $34,999 | 109 (9.3%) | 142 (24.4%) |
| $35,000 to $49,999 | 232 (19.7%) | 90 (15.5%) |
| $50,000 to $74,999 | 250 (21.3%) | 76 (13.1%) |
| $75,000 to $99,999 | 109 (9.3%) | 82 (14.1%) |
| $100,000 to $149,999 | 264 (22.5%) | 11 (1.9%) |
| $150,000 or more | 65 (5.5%) | 0 (0.0%) |
| Total | 1,175 (100.0%) | 582 (100.0%) |
Monthly Housing Cost Tiers in Horicon
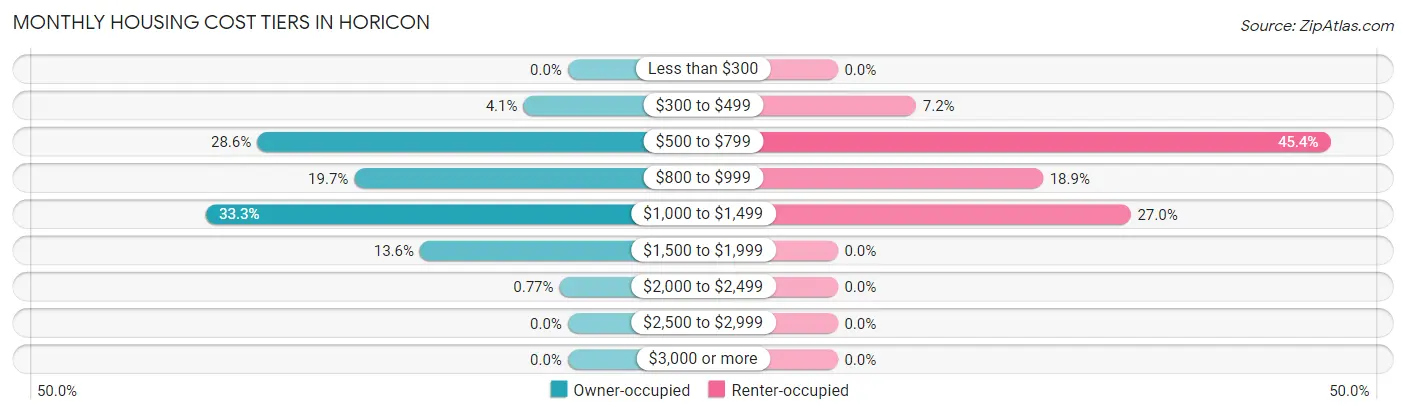
| Monthly Cost | Owner-occupied | Renter-occupied |
| Less than $300 | 0 (0.0%) | 0 (0.0%) |
| $300 to $499 | 48 (4.1%) | 42 (7.2%) |
| $500 to $799 | 336 (28.6%) | 264 (45.4%) |
| $800 to $999 | 231 (19.7%) | 110 (18.9%) |
| $1,000 to $1,499 | 391 (33.3%) | 157 (27.0%) |
| $1,500 to $1,999 | 160 (13.6%) | 0 (0.0%) |
| $2,000 to $2,499 | 9 (0.8%) | 0 (0.0%) |
| $2,500 to $2,999 | 0 (0.0%) | 0 (0.0%) |
| $3,000 or more | 0 (0.0%) | 0 (0.0%) |
| Total | 1,175 (100.0%) | 582 (100.0%) |
Physical Housing Characteristics in Horicon
Housing Structures in Horicon
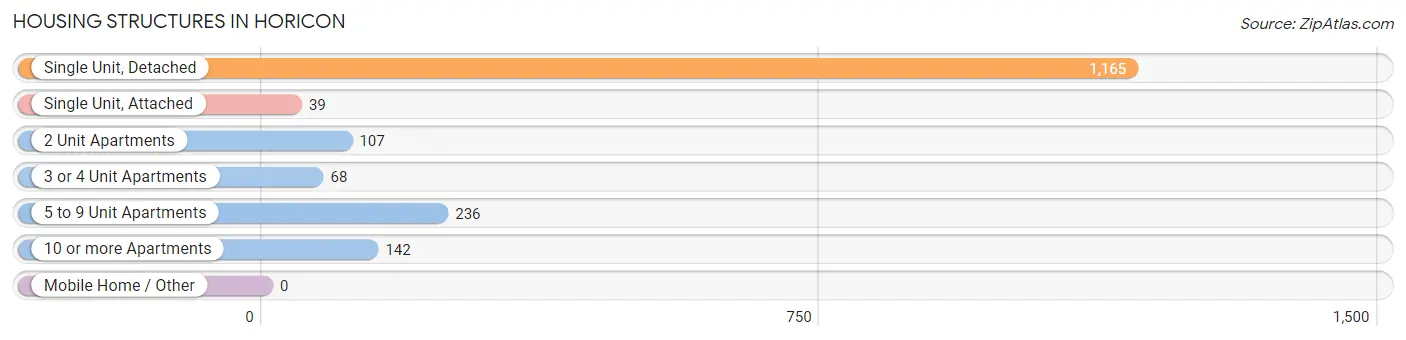
| Structure Type | # Housing Units | % Housing Units |
| Single Unit, Detached | 1,165 | 66.3% |
| Single Unit, Attached | 39 | 2.2% |
| 2 Unit Apartments | 107 | 6.1% |
| 3 or 4 Unit Apartments | 68 | 3.9% |
| 5 to 9 Unit Apartments | 236 | 13.4% |
| 10 or more Apartments | 142 | 8.1% |
| Mobile Home / Other | 0 | 0.0% |
| Total | 1,757 | 100.0% |
Housing Structures by Occupancy in Horicon
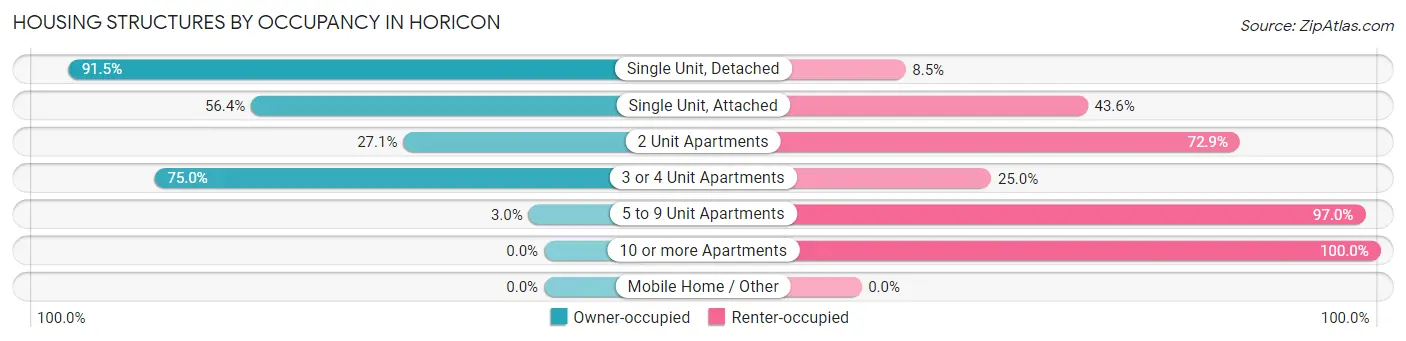
| Structure Type | Owner-occupied | Renter-occupied |
| Single Unit, Detached | 1,066 (91.5%) | 99 (8.5%) |
| Single Unit, Attached | 22 (56.4%) | 17 (43.6%) |
| 2 Unit Apartments | 29 (27.1%) | 78 (72.9%) |
| 3 or 4 Unit Apartments | 51 (75.0%) | 17 (25.0%) |
| 5 to 9 Unit Apartments | 7 (3.0%) | 229 (97.0%) |
| 10 or more Apartments | 0 (0.0%) | 142 (100.0%) |
| Mobile Home / Other | 0 (0.0%) | 0 (0.0%) |
| Total | 1,175 (66.9%) | 582 (33.1%) |
Housing Structures by Number of Rooms in Horicon
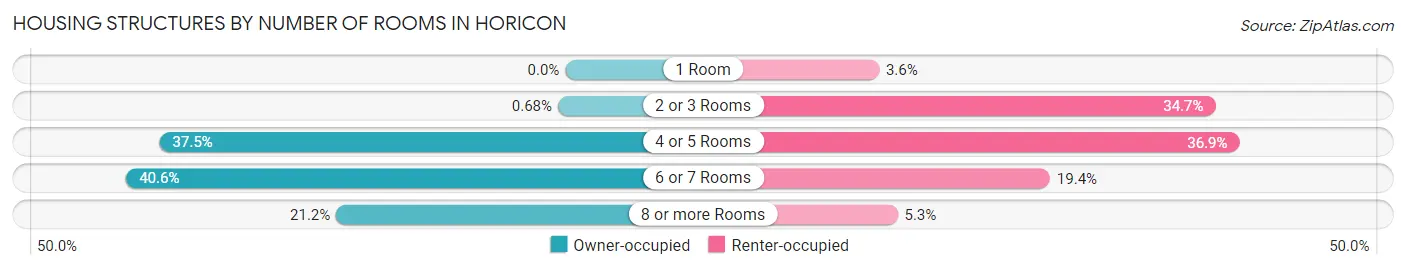
| Number of Rooms | Owner-occupied | Renter-occupied |
| 1 Room | 0 (0.0%) | 21 (3.6%) |
| 2 or 3 Rooms | 8 (0.7%) | 202 (34.7%) |
| 4 or 5 Rooms | 441 (37.5%) | 215 (36.9%) |
| 6 or 7 Rooms | 477 (40.6%) | 113 (19.4%) |
| 8 or more Rooms | 249 (21.2%) | 31 (5.3%) |
| Total | 1,175 (100.0%) | 582 (100.0%) |
Housing Structure by Heating Type in Horicon
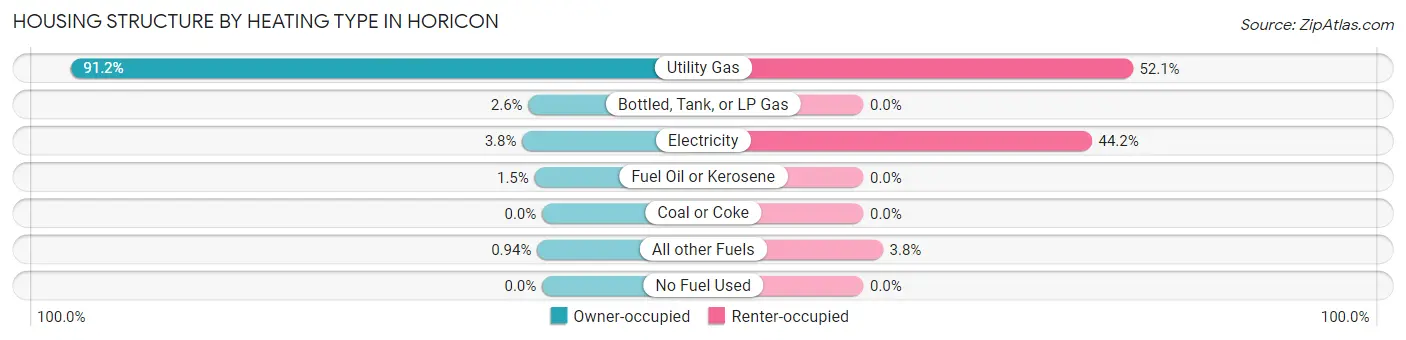
| Heating Type | Owner-occupied | Renter-occupied |
| Utility Gas | 1,071 (91.1%) | 303 (52.1%) |
| Bottled, Tank, or LP Gas | 31 (2.6%) | 0 (0.0%) |
| Electricity | 45 (3.8%) | 257 (44.2%) |
| Fuel Oil or Kerosene | 17 (1.5%) | 0 (0.0%) |
| Coal or Coke | 0 (0.0%) | 0 (0.0%) |
| All other Fuels | 11 (0.9%) | 22 (3.8%) |
| No Fuel Used | 0 (0.0%) | 0 (0.0%) |
| Total | 1,175 (100.0%) | 582 (100.0%) |
Household Vehicle Usage in Horicon
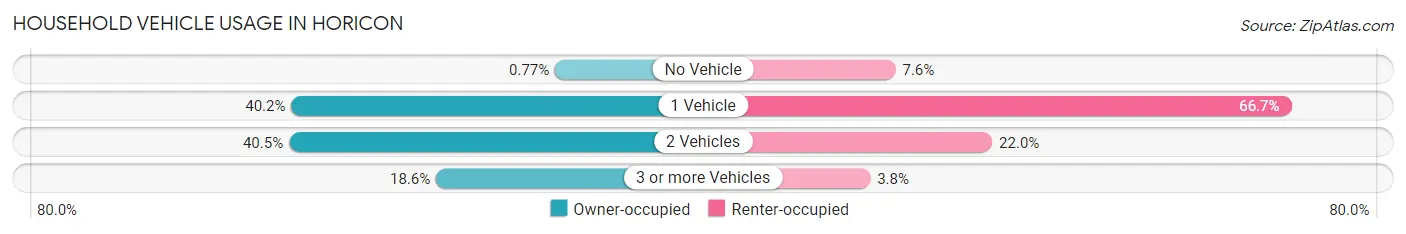
| Vehicles per Household | Owner-occupied | Renter-occupied |
| No Vehicle | 9 (0.8%) | 44 (7.6%) |
| 1 Vehicle | 472 (40.2%) | 388 (66.7%) |
| 2 Vehicles | 476 (40.5%) | 128 (22.0%) |
| 3 or more Vehicles | 218 (18.5%) | 22 (3.8%) |
| Total | 1,175 (100.0%) | 582 (100.0%) |
Real Estate & Mortgages in Horicon
Real Estate and Mortgage Overview in Horicon
| Characteristic | Without Mortgage | With Mortgage |
| Housing Units | 418 | 757 |
| Median Property Value | $246,800 | $155,000 |
| Median Household Income | $52,119 | $49 |
| Monthly Housing Costs | $726 | $0 |
| Real Estate Taxes | $4,943 | $39 |
Property Value by Mortgage Status in Horicon
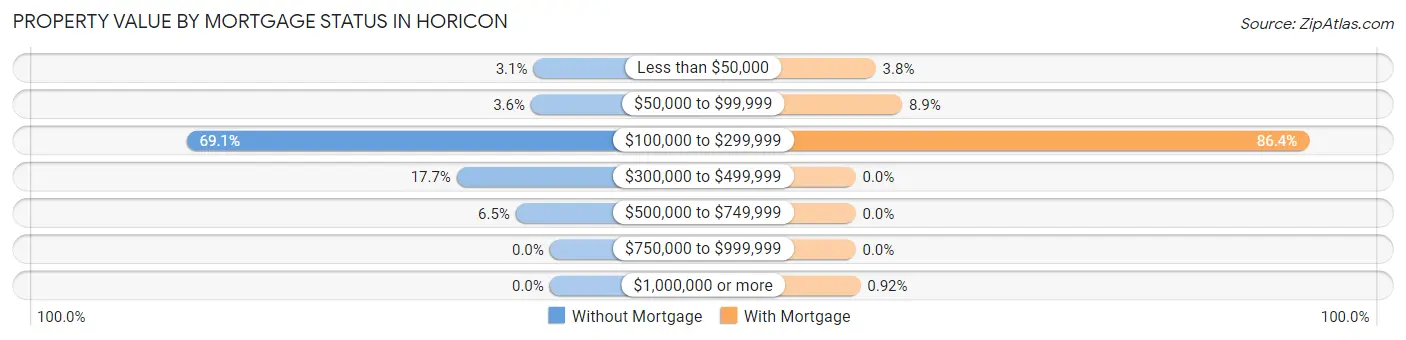
| Property Value | Without Mortgage | With Mortgage |
| Less than $50,000 | 13 (3.1%) | 29 (3.8%) |
| $50,000 to $99,999 | 15 (3.6%) | 67 (8.8%) |
| $100,000 to $299,999 | 289 (69.1%) | 654 (86.4%) |
| $300,000 to $499,999 | 74 (17.7%) | 0 (0.0%) |
| $500,000 to $749,999 | 27 (6.5%) | 0 (0.0%) |
| $750,000 to $999,999 | 0 (0.0%) | 0 (0.0%) |
| $1,000,000 or more | 0 (0.0%) | 7 (0.9%) |
| Total | 418 (100.0%) | 757 (100.0%) |
Household Income by Mortgage Status in Horicon
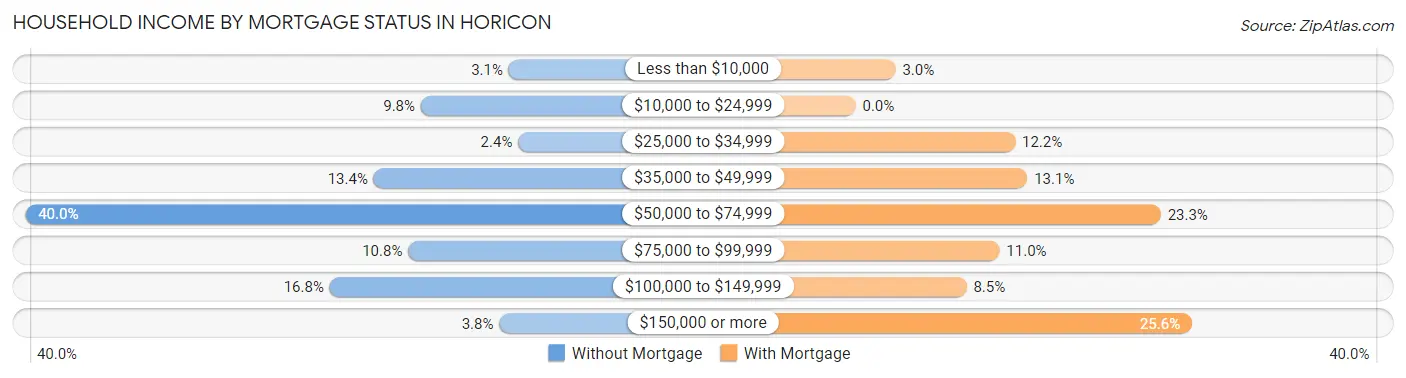
| Household Income | Without Mortgage | With Mortgage |
| Less than $10,000 | 13 (3.1%) | 23 (3.0%) |
| $10,000 to $24,999 | 41 (9.8%) | 0 (0.0%) |
| $25,000 to $34,999 | 10 (2.4%) | 92 (12.1%) |
| $35,000 to $49,999 | 56 (13.4%) | 99 (13.1%) |
| $50,000 to $74,999 | 167 (40.0%) | 176 (23.3%) |
| $75,000 to $99,999 | 45 (10.8%) | 83 (11.0%) |
| $100,000 to $149,999 | 70 (16.8%) | 64 (8.5%) |
| $150,000 or more | 16 (3.8%) | 194 (25.6%) |
| Total | 418 (100.0%) | 757 (100.0%) |
Property Value to Household Income Ratio in Horicon
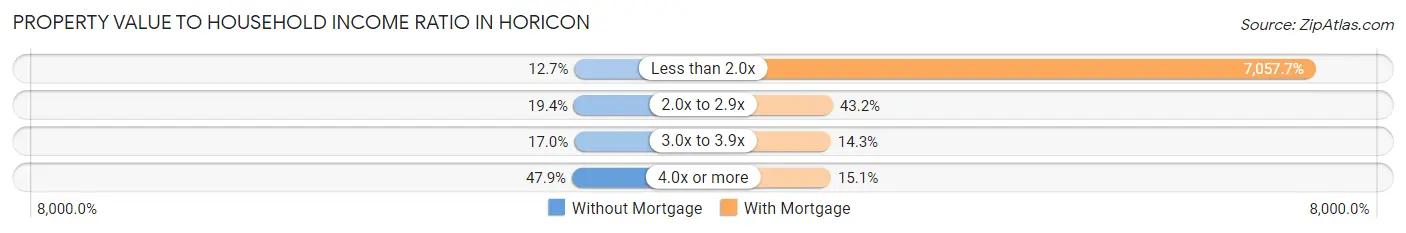
| Value-to-Income Ratio | Without Mortgage | With Mortgage |
| Less than 2.0x | 53 (12.7%) | 53,427 (7,057.7%) |
| 2.0x to 2.9x | 81 (19.4%) | 327 (43.2%) |
| 3.0x to 3.9x | 71 (17.0%) | 108 (14.3%) |
| 4.0x or more | 200 (47.8%) | 114 (15.1%) |
| Total | 418 (100.0%) | 757 (100.0%) |
Real Estate Taxes by Mortgage Status in Horicon
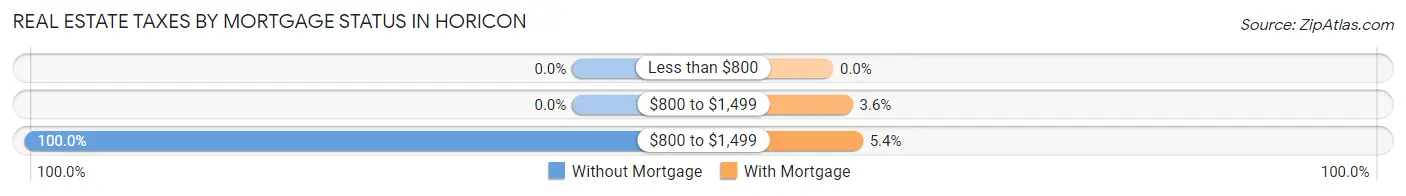
| Property Taxes | Without Mortgage | With Mortgage |
| Less than $800 | 0 (0.0%) | 0 (0.0%) |
| $800 to $1,499 | 0 (0.0%) | 27 (3.6%) |
| $800 to $1,499 | 418 (100.0%) | 41 (5.4%) |
| Total | 418 (100.0%) | 757 (100.0%) |
Health & Disability in Horicon
Health Insurance Coverage by Age in Horicon
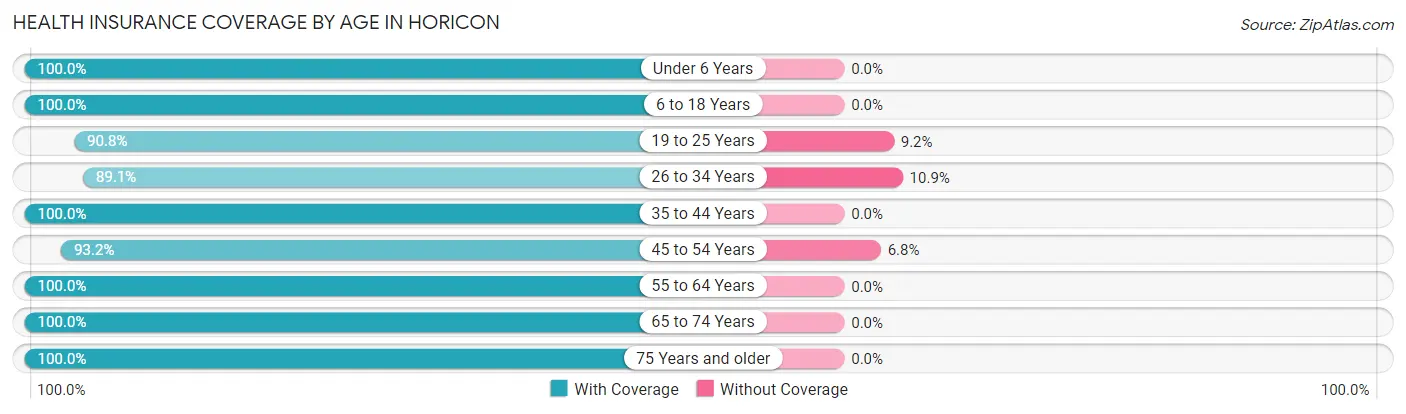
| Age Bracket | With Coverage | Without Coverage |
| Under 6 Years | 303 (100.0%) | 0 (0.0%) |
| 6 to 18 Years | 626 (100.0%) | 0 (0.0%) |
| 19 to 25 Years | 305 (90.8%) | 31 (9.2%) |
| 26 to 34 Years | 467 (89.1%) | 57 (10.9%) |
| 35 to 44 Years | 378 (100.0%) | 0 (0.0%) |
| 45 to 54 Years | 343 (93.2%) | 25 (6.8%) |
| 55 to 64 Years | 549 (100.0%) | 0 (0.0%) |
| 65 to 74 Years | 487 (100.0%) | 0 (0.0%) |
| 75 Years and older | 211 (100.0%) | 0 (0.0%) |
| Total | 3,669 (97.0%) | 113 (3.0%) |
Health Insurance Coverage by Citizenship Status in Horicon
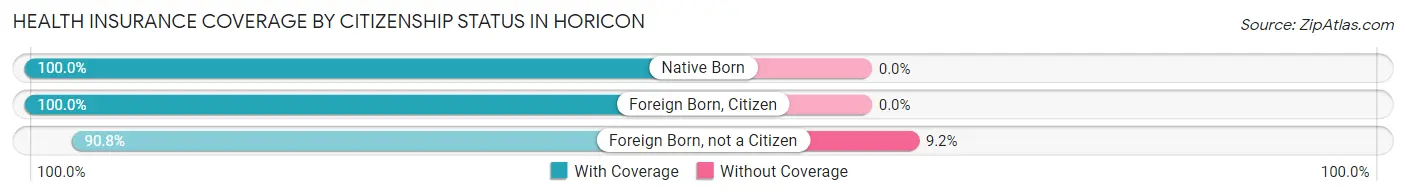
| Citizenship Status | With Coverage | Without Coverage |
| Native Born | 303 (100.0%) | 0 (0.0%) |
| Foreign Born, Citizen | 626 (100.0%) | 0 (0.0%) |
| Foreign Born, not a Citizen | 305 (90.8%) | 31 (9.2%) |
Health Insurance Coverage by Household Income in Horicon
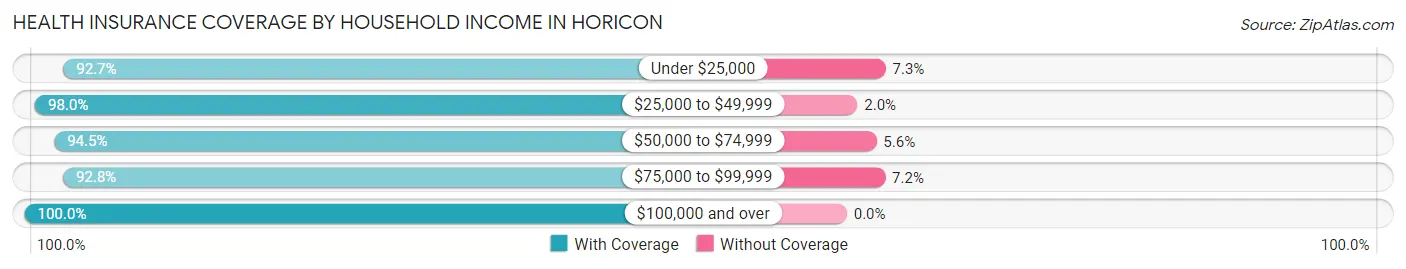
| Household Income | With Coverage | Without Coverage |
| Under $25,000 | 357 (92.7%) | 28 (7.3%) |
| $25,000 to $49,999 | 1,196 (98.0%) | 24 (2.0%) |
| $50,000 to $74,999 | 528 (94.5%) | 31 (5.6%) |
| $75,000 to $99,999 | 387 (92.8%) | 30 (7.2%) |
| $100,000 and over | 1,187 (100.0%) | 0 (0.0%) |
Public vs Private Health Insurance Coverage by Age in Horicon
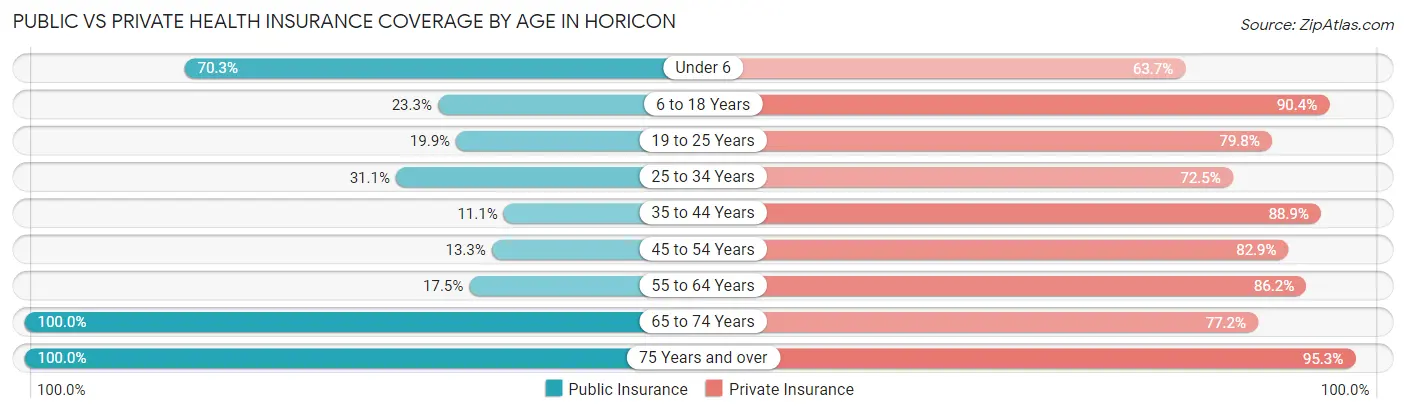
| Age Bracket | Public Insurance | Private Insurance |
| Under 6 | 213 (70.3%) | 193 (63.7%) |
| 6 to 18 Years | 146 (23.3%) | 566 (90.4%) |
| 19 to 25 Years | 67 (19.9%) | 268 (79.8%) |
| 25 to 34 Years | 163 (31.1%) | 380 (72.5%) |
| 35 to 44 Years | 42 (11.1%) | 336 (88.9%) |
| 45 to 54 Years | 49 (13.3%) | 305 (82.9%) |
| 55 to 64 Years | 96 (17.5%) | 473 (86.2%) |
| 65 to 74 Years | 487 (100.0%) | 376 (77.2%) |
| 75 Years and over | 211 (100.0%) | 201 (95.3%) |
| Total | 1,474 (39.0%) | 3,098 (81.9%) |
Disability Status by Sex by Age in Horicon
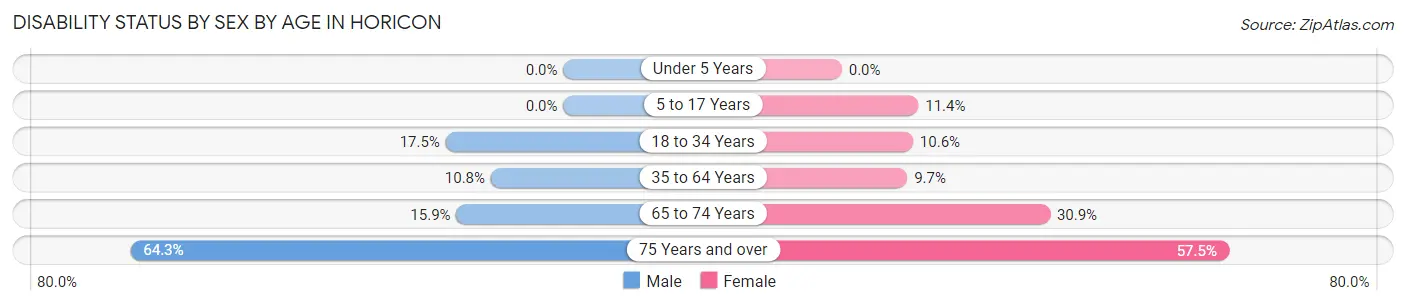
| Age Bracket | Male | Female |
| Under 5 Years | 0 (0.0%) | 0 (0.0%) |
| 5 to 17 Years | 0 (0.0%) | 45 (11.4%) |
| 18 to 34 Years | 94 (17.5%) | 38 (10.6%) |
| 35 to 64 Years | 64 (10.8%) | 68 (9.7%) |
| 65 to 74 Years | 27 (15.9%) | 98 (30.9%) |
| 75 Years and over | 45 (64.3%) | 81 (57.5%) |
Disability Class by Sex by Age in Horicon
Disability Class: Hearing Difficulty
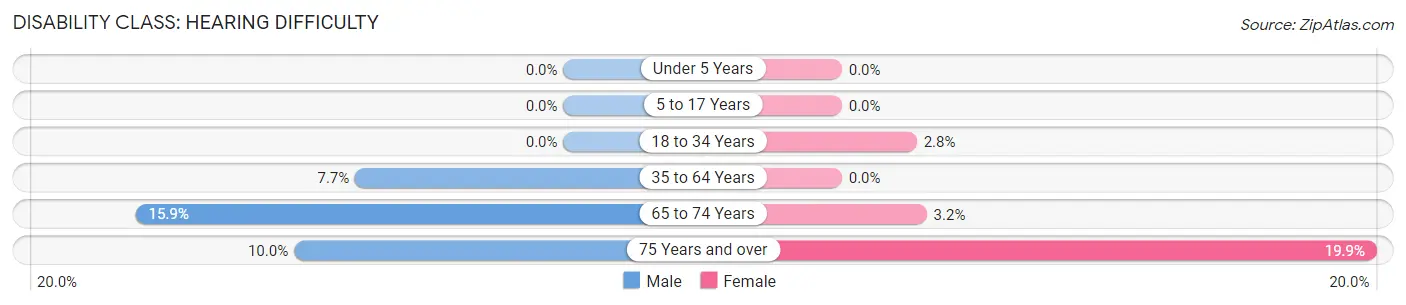
| Age Bracket | Male | Female |
| Under 5 Years | 0 (0.0%) | 0 (0.0%) |
| 5 to 17 Years | 0 (0.0%) | 0 (0.0%) |
| 18 to 34 Years | 0 (0.0%) | 10 (2.8%) |
| 35 to 64 Years | 46 (7.7%) | 0 (0.0%) |
| 65 to 74 Years | 27 (15.9%) | 10 (3.2%) |
| 75 Years and over | 7 (10.0%) | 28 (19.9%) |
Disability Class: Vision Difficulty
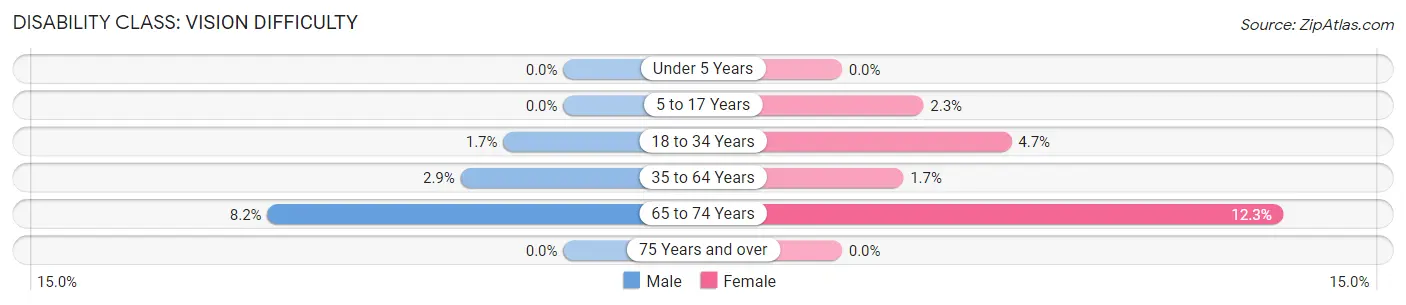
| Age Bracket | Male | Female |
| Under 5 Years | 0 (0.0%) | 0 (0.0%) |
| 5 to 17 Years | 0 (0.0%) | 9 (2.3%) |
| 18 to 34 Years | 9 (1.7%) | 17 (4.7%) |
| 35 to 64 Years | 17 (2.9%) | 12 (1.7%) |
| 65 to 74 Years | 14 (8.2%) | 39 (12.3%) |
| 75 Years and over | 0 (0.0%) | 0 (0.0%) |
Disability Class: Cognitive Difficulty
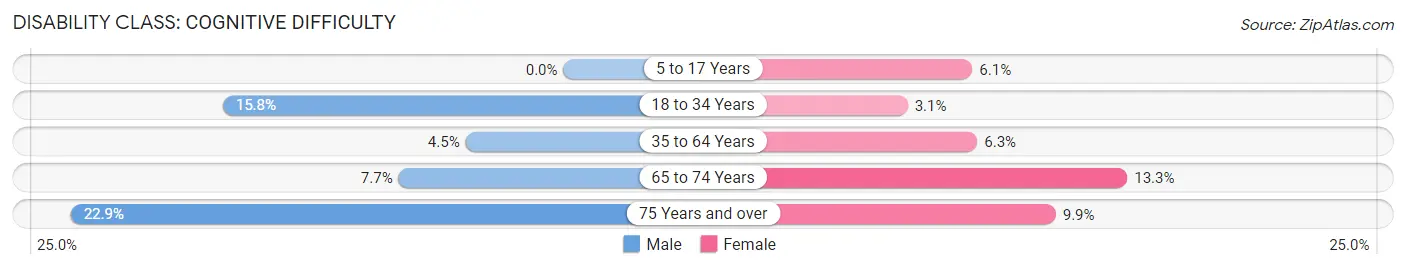
| Age Bracket | Male | Female |
| 5 to 17 Years | 0 (0.0%) | 24 (6.1%) |
| 18 to 34 Years | 85 (15.8%) | 11 (3.1%) |
| 35 to 64 Years | 27 (4.5%) | 44 (6.3%) |
| 65 to 74 Years | 13 (7.6%) | 42 (13.3%) |
| 75 Years and over | 16 (22.9%) | 14 (9.9%) |
Disability Class: Ambulatory Difficulty
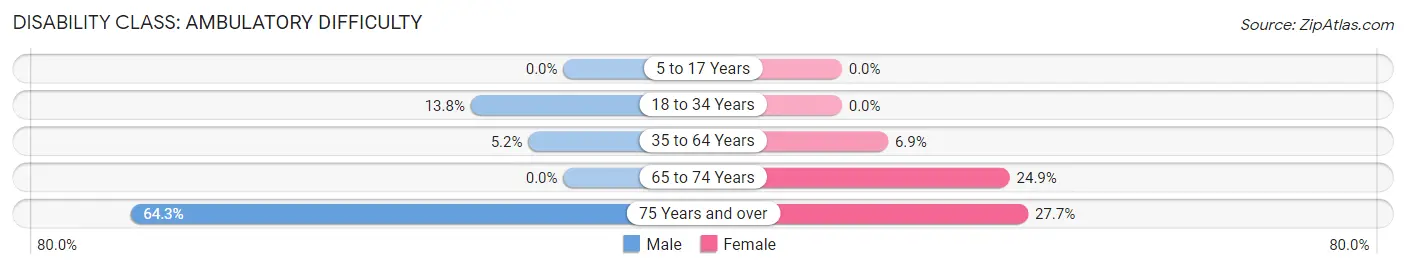
| Age Bracket | Male | Female |
| 5 to 17 Years | 0 (0.0%) | 0 (0.0%) |
| 18 to 34 Years | 74 (13.8%) | 0 (0.0%) |
| 35 to 64 Years | 31 (5.2%) | 48 (6.9%) |
| 65 to 74 Years | 0 (0.0%) | 79 (24.9%) |
| 75 Years and over | 45 (64.3%) | 39 (27.7%) |
Disability Class: Self-Care Difficulty
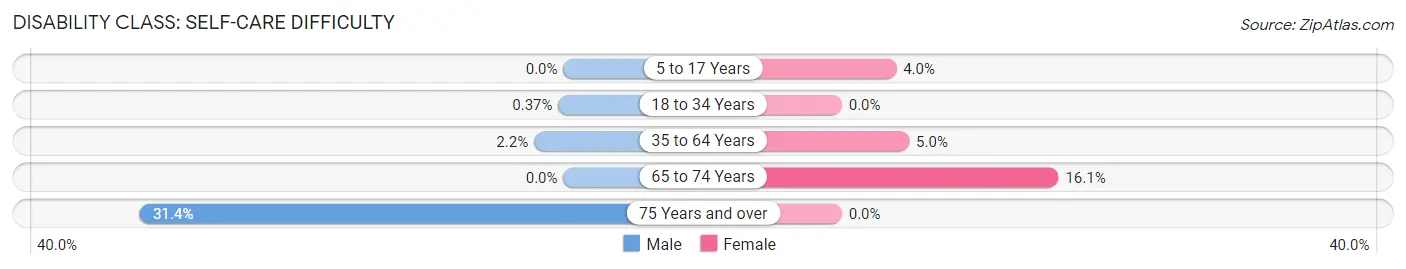
| Age Bracket | Male | Female |
| 5 to 17 Years | 0 (0.0%) | 16 (4.0%) |
| 18 to 34 Years | 2 (0.4%) | 0 (0.0%) |
| 35 to 64 Years | 13 (2.2%) | 35 (5.0%) |
| 65 to 74 Years | 0 (0.0%) | 51 (16.1%) |
| 75 Years and over | 22 (31.4%) | 0 (0.0%) |
Technology Access in Horicon
Computing Device Access in Horicon
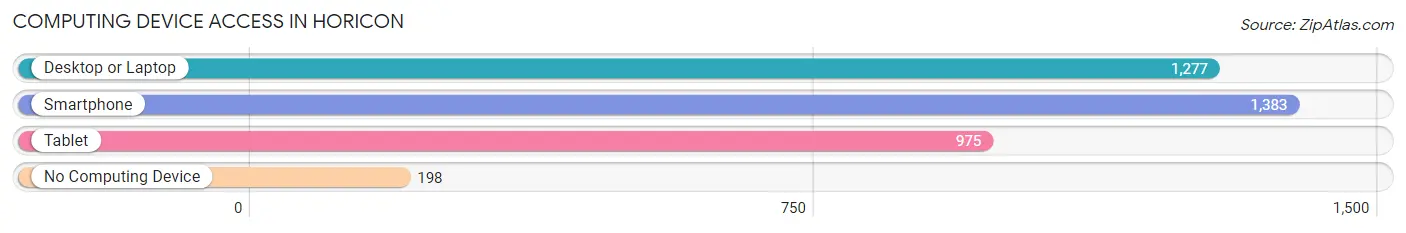
| Device Type | # Households | % Households |
| Desktop or Laptop | 1,277 | 72.7% |
| Smartphone | 1,383 | 78.7% |
| Tablet | 975 | 55.5% |
| No Computing Device | 198 | 11.3% |
| Total | 1,757 | 100.0% |
Internet Access in Horicon
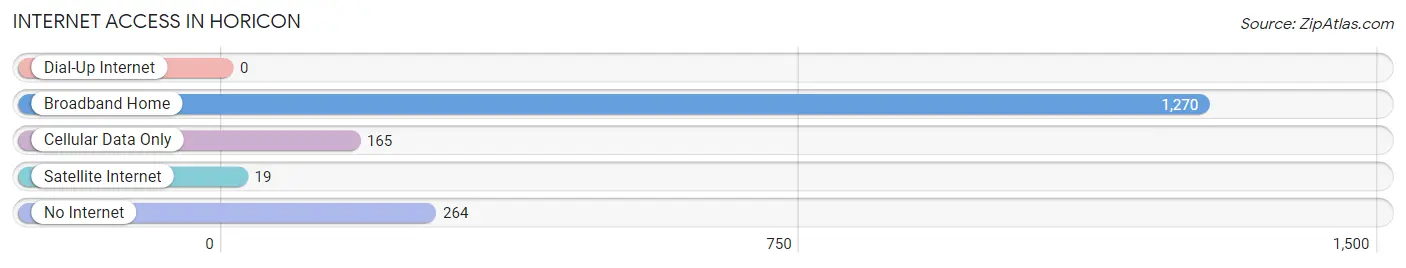
| Internet Type | # Households | % Households |
| Dial-Up Internet | 0 | 0.0% |
| Broadband Home | 1,270 | 72.3% |
| Cellular Data Only | 165 | 9.4% |
| Satellite Internet | 19 | 1.1% |
| No Internet | 264 | 15.0% |
| Total | 1,757 | 100.0% |
Horicon Summary
Horicon, Wisconsin is a small city located in Dodge County, Wisconsin. It is situated on the banks of the Horicon Marsh, a large wetland area that is home to a variety of wildlife. The city has a population of 3,541 as of the 2020 census, and is part of the larger Fox Cities metropolitan area.
History
The area that is now Horicon was first settled in the early 1800s by German immigrants. The city was officially incorporated in 1856 and was named after the nearby Horicon Marsh. The marsh was named after the Ho-Chunk (Winnebago) word “horicon” which means “duck hunter”.
The city was an important stop on the Chicago and North Western Railway, which connected the city to the larger cities of Milwaukee and Chicago. This allowed the city to become an important hub for the agricultural industry in the area.
In the late 19th century, the city was home to a number of factories, including a paper mill, a brickyard, and a foundry. These factories provided employment for many of the city’s residents.
Geography
Horicon is located in southeastern Wisconsin, about 40 miles northwest of Milwaukee and about 70 miles east of Madison. The city is situated on the banks of the Horicon Marsh, a large wetland area that is home to a variety of wildlife. The marsh is the largest freshwater cattail marsh in the United States and is home to a variety of birds, fish, and other wildlife.
The city is located in the Fox River Valley, which is part of the larger Fox Cities metropolitan area. The city is surrounded by a number of small towns and villages, including Mayville, Iron Ridge, and Brownsville.
Economy
The economy of Horicon is largely based on agriculture and manufacturing. The city is home to a number of agricultural businesses, including dairy farms, grain elevators, and feed mills. The city is also home to a number of manufacturing businesses, including a paper mill, a brickyard, and a foundry.
The city is also home to a number of retail businesses, including grocery stores, restaurants, and clothing stores. The city is also home to a number of service businesses, including banks, insurance companies, and medical offices.
Demographics
As of the 2020 census, the population of Horicon was 3,541. The racial makeup of the city was 94.3% White, 0.7% African American, 0.3% Native American, 0.7% Asian, 0.1% Pacific Islander, 1.7% from other races, and 2.0% from two or more races. Hispanic or Latino of any race were 4.2% of the population.
The median household income in Horicon was $50,945, and the median family income was $60,945. The per capita income in the city was $25,945. About 8.3% of the population was below the poverty line.
Common Questions
What is Per Capita Income in Horicon?
Per Capita income in Horicon is $28,596.
What is the Median Family Income in Horicon?
Median Family Income in Horicon is $72,768.
What is the Median Household income in Horicon?
Median Household Income in Horicon is $48,266.
What is Income or Wage Gap in Horicon?
Income or Wage Gap in Horicon is 41.3%.
Women in Horicon earn 58.7 cents for every dollar earned by a man.
What is Inequality or Gini Index in Horicon?
Inequality or Gini Index in Horicon is 0.38.
What is the Total Population of Horicon?
Total Population of Horicon is 3,793.
What is the Total Male Population of Horicon?
Total Male Population of Horicon is 1,719.
What is the Total Female Population of Horicon?
Total Female Population of Horicon is 2,074.
What is the Ratio of Males per 100 Females in Horicon?
There are 82.88 Males per 100 Females in Horicon.
What is the Ratio of Females per 100 Males in Horicon?
There are 120.65 Females per 100 Males in Horicon.
What is the Median Population Age in Horicon?
Median Population Age in Horicon is 38.8 Years.
What is the Average Family Size in Horicon
Average Family Size in Horicon is 3.0 People.
What is the Average Household Size in Horicon
Average Household Size in Horicon is 2.1 People.
How Large is the Labor Force in Horicon?
There are 2,025 People in the Labor Forcein in Horicon.
What is the Percentage of People in the Labor Force in Horicon?
67.2% of People are in the Labor Force in Horicon.
What is the Unemployment Rate in Horicon?
Unemployment Rate in Horicon is 4.9%.