Milltown, WI Map & Demographics
Milltown Map
Milltown Overview
$30,073
PER CAPITA INCOME
$72,396
AVG FAMILY INCOME
$41,071
AVG HOUSEHOLD INCOME
34.2%
WAGE / INCOME GAP [ % ]
65.8¢/ $1
WAGE / INCOME GAP [ $ ]
$17,433
FAMILY INCOME DEFICIT
0.45
INEQUALITY / GINI INDEX
809
TOTAL POPULATION
353
MALE POPULATION
456
FEMALE POPULATION
77.41
MALES / 100 FEMALES
129.18
FEMALES / 100 MALES
52.5
MEDIAN AGE
2.7
AVG FAMILY SIZE
1.9
AVG HOUSEHOLD SIZE
434
LABOR FORCE [ PEOPLE ]
60.4%
PERCENT IN LABOR FORCE
3.9%
UNEMPLOYMENT RATE
Milltown Zip Codes
Milltown Area Codes
Income in Milltown
Income Overview in Milltown
Per Capita Income in Milltown is $30,073, while median incomes of families and households are $72,396 and $41,071 respectively.
| Characteristic | Number | Measure |
| Per Capita Income | 809 | $30,073 |
| Median Family Income | 199 | $72,396 |
| Mean Family Income | 199 | $77,863 |
| Median Household Income | 424 | $41,071 |
| Mean Household Income | 424 | $54,351 |
| Income Deficit | 199 | $17,433 |
| Wage / Income Gap (%) | 809 | 34.21% |
| Wage / Income Gap ($) | 809 | 65.79¢ per $1 |
| Gini / Inequality Index | 809 | 0.45 |
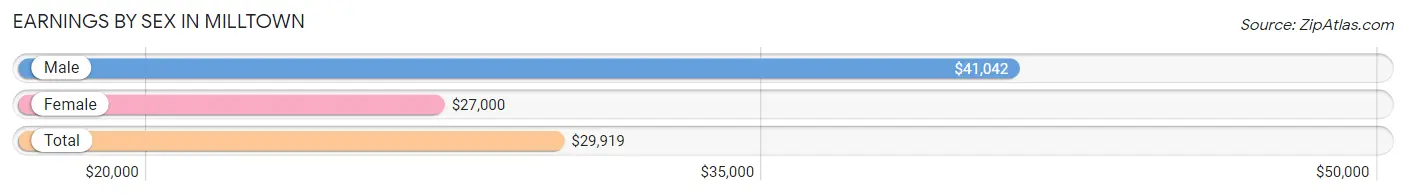
Earnings by Sex in Milltown
Average Earnings in Milltown are $29,919, $41,042 for men and $27,000 for women, a difference of 34.2%.
| Sex | Number | Average Earnings |
| Male | 202 (42.3%) | $41,042 |
| Female | 276 (57.7%) | $27,000 |
| Total | 478 (100.0%) | $29,919 |
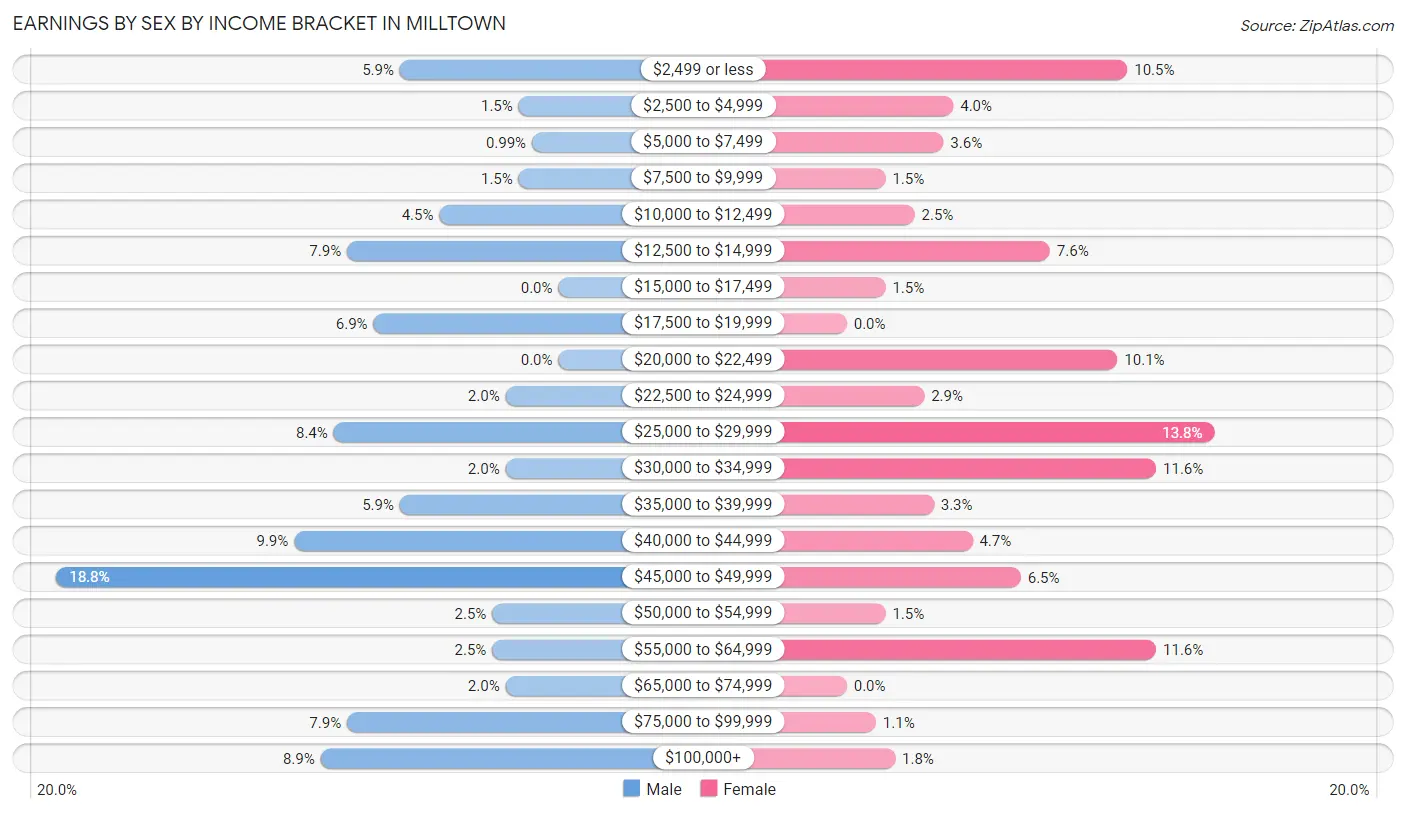
Earnings by Sex by Income Bracket in Milltown
The most common earnings brackets in Milltown are $45,000 to $49,999 for men (38 | 18.8%) and $25,000 to $29,999 for women (38 | 13.8%).
| Income | Male | Female |
| $2,499 or less | 12 (5.9%) | 29 (10.5%) |
| $2,500 to $4,999 | 3 (1.5%) | 11 (4.0%) |
| $5,000 to $7,499 | 2 (1.0%) | 10 (3.6%) |
| $7,500 to $9,999 | 3 (1.5%) | 4 (1.5%) |
| $10,000 to $12,499 | 9 (4.5%) | 7 (2.5%) |
| $12,500 to $14,999 | 16 (7.9%) | 21 (7.6%) |
| $15,000 to $17,499 | 0 (0.0%) | 4 (1.5%) |
| $17,500 to $19,999 | 14 (6.9%) | 0 (0.0%) |
| $20,000 to $22,499 | 0 (0.0%) | 28 (10.1%) |
| $22,500 to $24,999 | 4 (2.0%) | 8 (2.9%) |
| $25,000 to $29,999 | 17 (8.4%) | 38 (13.8%) |
| $30,000 to $34,999 | 4 (2.0%) | 32 (11.6%) |
| $35,000 to $39,999 | 12 (5.9%) | 9 (3.3%) |
| $40,000 to $44,999 | 20 (9.9%) | 13 (4.7%) |
| $45,000 to $49,999 | 38 (18.8%) | 18 (6.5%) |
| $50,000 to $54,999 | 5 (2.5%) | 4 (1.5%) |
| $55,000 to $64,999 | 5 (2.5%) | 32 (11.6%) |
| $65,000 to $74,999 | 4 (2.0%) | 0 (0.0%) |
| $75,000 to $99,999 | 16 (7.9%) | 3 (1.1%) |
| $100,000+ | 18 (8.9%) | 5 (1.8%) |
| Total | 202 (100.0%) | 276 (100.0%) |
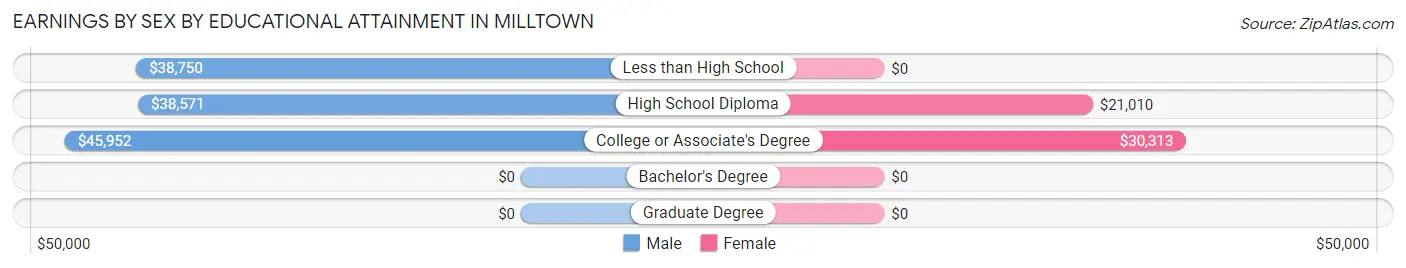
Earnings by Sex by Educational Attainment in Milltown
Average earnings in Milltown are $44,531 for men and $26,563 for women, a difference of 40.4%. Men with an educational attainment of college or associate's degree enjoy the highest average annual earnings of $45,952, while those with high school diploma education earn the least with $38,571. Women with an educational attainment of college or associate's degree earn the most with the average annual earnings of $30,313, while those with high school diploma education have the smallest earnings of $21,010.
| Educational Attainment | Male Income | Female Income |
| Less than High School | $38,750 | $0 |
| High School Diploma | $38,571 | $21,010 |
| College or Associate's Degree | $45,952 | $30,313 |
| Bachelor's Degree | - | - |
| Graduate Degree | - | - |
| Total | $44,531 | $26,563 |
Family Income in Milltown
Family Income Brackets in Milltown
According to the Milltown family income data, there are 53 families falling into the $50,000 to $74,999 income range, which is the most common income bracket and makes up 26.6% of all families.
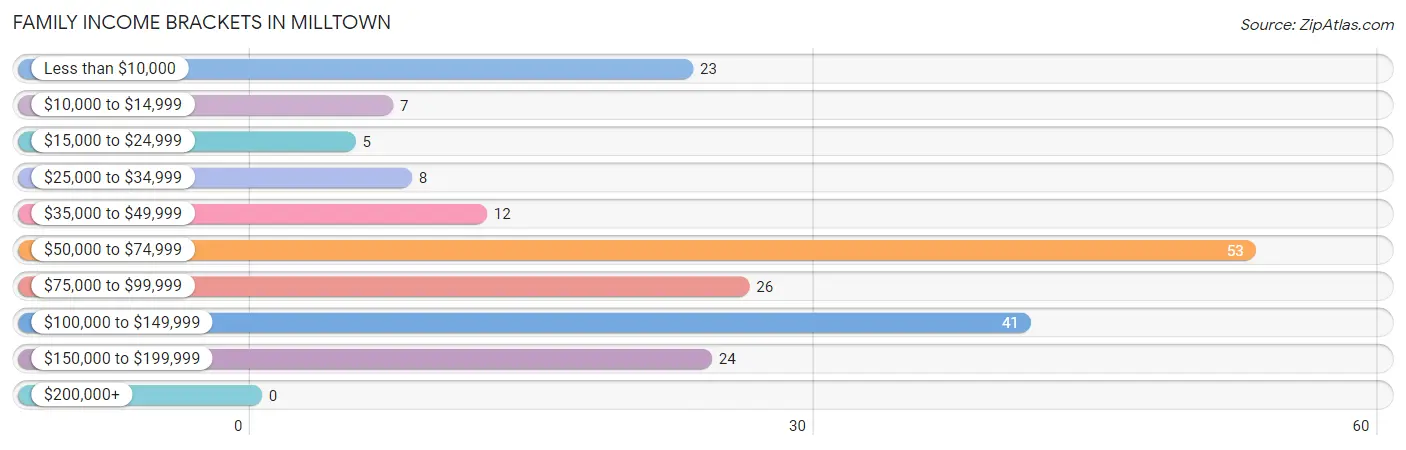
| Income Bracket | # Families | % Families |
| Less than $10,000 | 23 | 11.6% |
| $10,000 to $14,999 | 7 | 3.5% |
| $15,000 to $24,999 | 5 | 2.5% |
| $25,000 to $34,999 | 8 | 4.0% |
| $35,000 to $49,999 | 12 | 6.0% |
| $50,000 to $74,999 | 53 | 26.6% |
| $75,000 to $99,999 | 26 | 13.1% |
| $100,000 to $149,999 | 41 | 20.6% |
| $150,000 to $199,999 | 24 | 12.1% |
| $200,000+ | 0 | 0.0% |
Family Income by Famaliy Size in Milltown
3-person families (47 | 23.6%) account for the highest median family income in Milltown with $79,583 per family, while 2-person families (120 | 60.3%) have the highest median income of $39,000 per family member.
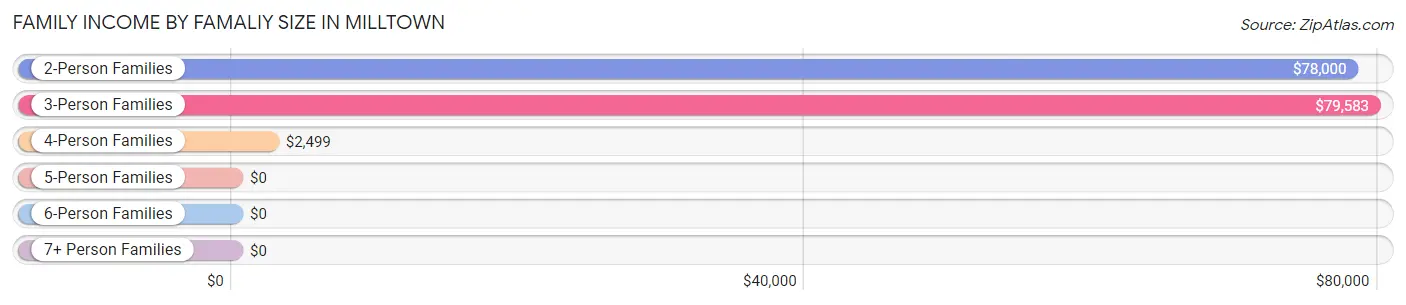
| Income Bracket | # Families | Median Income |
| 2-Person Families | 120 (60.3%) | $78,000 |
| 3-Person Families | 47 (23.6%) | $79,583 |
| 4-Person Families | 23 (11.6%) | $2,499 |
| 5-Person Families | 5 (2.5%) | $0 |
| 6-Person Families | 0 (0.0%) | $0 |
| 7+ Person Families | 4 (2.0%) | $0 |
| Total | 199 (100.0%) | $72,396 |
Family Income by Number of Earners in Milltown
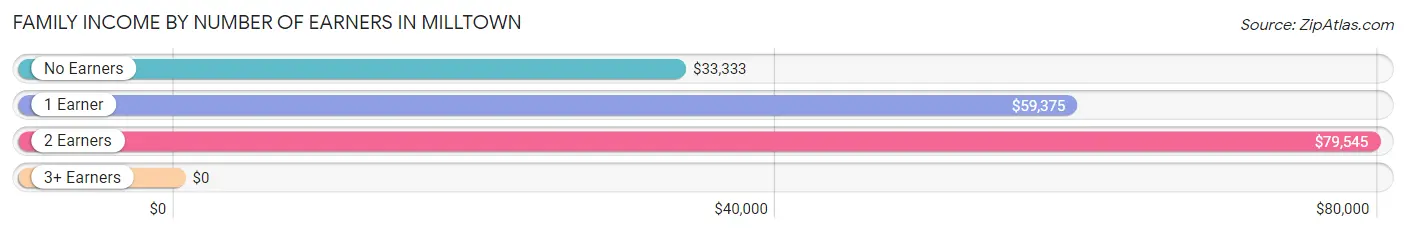
| Number of Earners | # Families | Median Income |
| No Earners | 24 (12.1%) | $33,333 |
| 1 Earner | 53 (26.6%) | $59,375 |
| 2 Earners | 112 (56.3%) | $79,545 |
| 3+ Earners | 10 (5.0%) | $0 |
| Total | 199 (100.0%) | $72,396 |
Household Income in Milltown
Household Income Brackets in Milltown
With 63 households falling in the category, the $15,000 to $24,999 income range is the most frequent in Milltown, accounting for 14.9% of all households.
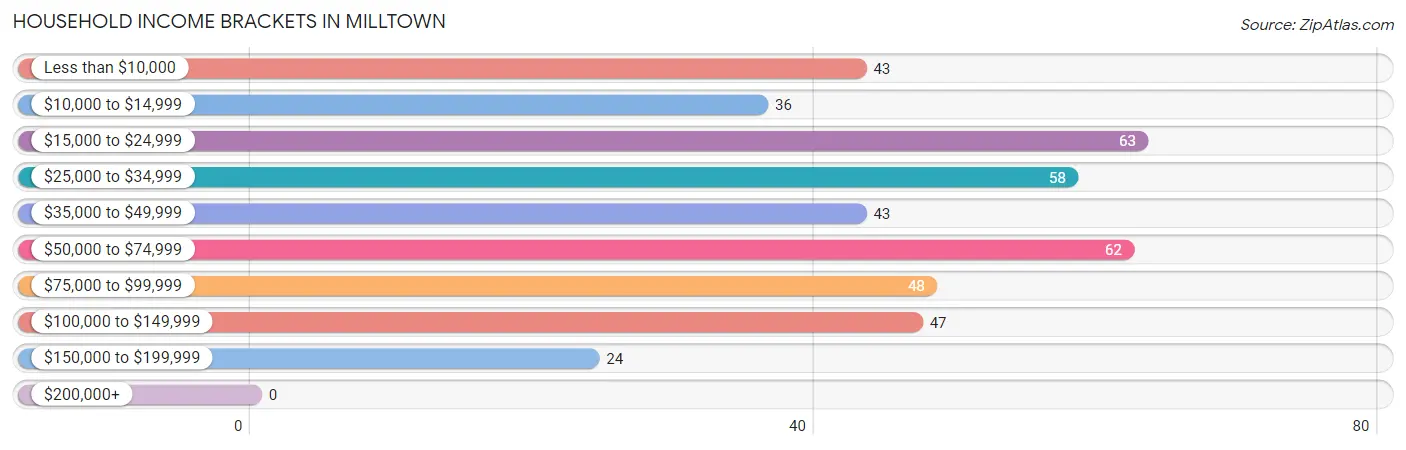
| Income Bracket | # Households | % Households |
| Less than $10,000 | 43 | 10.1% |
| $10,000 to $14,999 | 36 | 8.5% |
| $15,000 to $24,999 | 63 | 14.9% |
| $25,000 to $34,999 | 58 | 13.7% |
| $35,000 to $49,999 | 43 | 10.1% |
| $50,000 to $74,999 | 62 | 14.6% |
| $75,000 to $99,999 | 48 | 11.3% |
| $100,000 to $149,999 | 47 | 11.1% |
| $150,000 to $199,999 | 24 | 5.7% |
| $200,000+ | 0 | 0.0% |
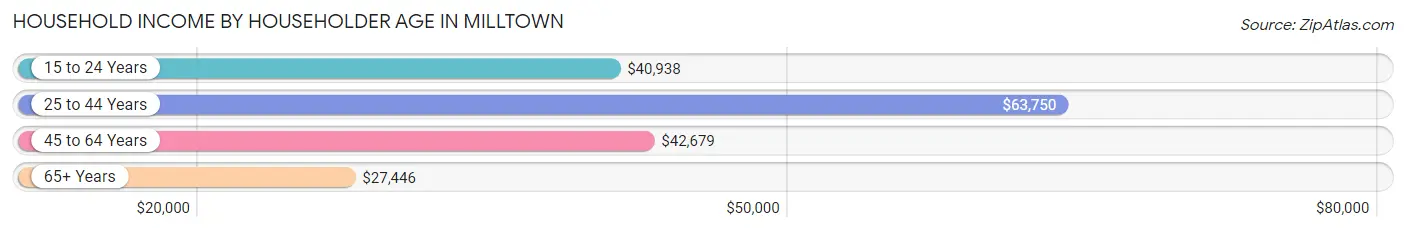
Household Income by Householder Age in Milltown
The median household income in Milltown is $41,071, with the highest median household income of $63,750 found in the 25 to 44 years age bracket for the primary householder. A total of 101 households (23.8%) fall into this category. Meanwhile, the 65+ years age bracket for the primary householder has the lowest median household income of $27,446, with 155 households (36.6%) in this group.
| Income Bracket | # Households | Median Income |
| 15 to 24 Years | 11 (2.6%) | $40,938 |
| 25 to 44 Years | 101 (23.8%) | $63,750 |
| 45 to 64 Years | 157 (37.0%) | $42,679 |
| 65+ Years | 155 (36.6%) | $27,446 |
| Total | 424 (100.0%) | $41,071 |
Poverty in Milltown
Income Below Poverty by Sex and Age in Milltown
With 17.0% poverty level for males and 20.6% for females among the residents of Milltown, 12 to 14 year old males and 12 to 14 year old females are the most vulnerable to poverty, with 7 males (58.3%) and 13 females (86.7%) in their respective age groups living below the poverty level.
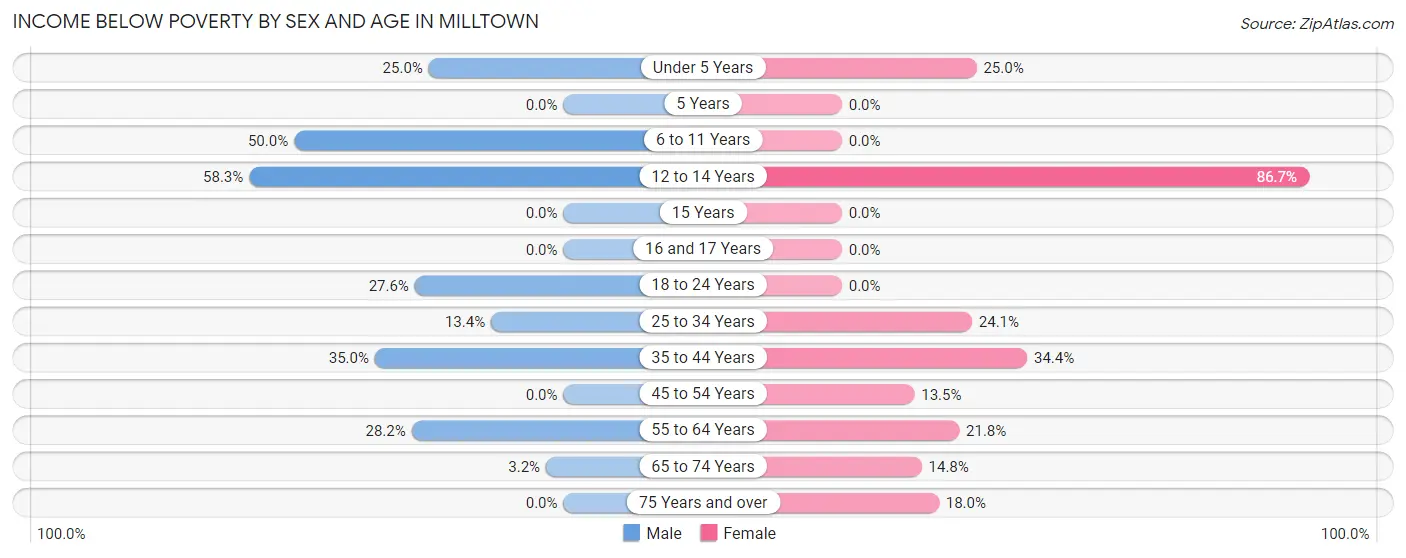
| Age Bracket | Male | Female |
| Under 5 Years | 3 (25.0%) | 3 (25.0%) |
| 5 Years | 0 (0.0%) | 0 (0.0%) |
| 6 to 11 Years | 4 (50.0%) | 0 (0.0%) |
| 12 to 14 Years | 7 (58.3%) | 13 (86.7%) |
| 15 Years | 0 (0.0%) | 0 (0.0%) |
| 16 and 17 Years | 0 (0.0%) | 0 (0.0%) |
| 18 to 24 Years | 8 (27.6%) | 0 (0.0%) |
| 25 to 34 Years | 9 (13.4%) | 21 (24.1%) |
| 35 to 44 Years | 7 (35.0%) | 11 (34.4%) |
| 45 to 54 Years | 0 (0.0%) | 7 (13.5%) |
| 55 to 64 Years | 20 (28.2%) | 22 (21.8%) |
| 65 to 74 Years | 2 (3.2%) | 8 (14.8%) |
| 75 Years and over | 0 (0.0%) | 9 (18.0%) |
| Total | 60 (17.0%) | 94 (20.6%) |
Income Above Poverty by Sex and Age in Milltown
According to the poverty statistics in Milltown, males aged 45 to 54 years and females aged 5 years are the age groups that are most secure financially, with 100.0% of males and 100.0% of females in these age groups living above the poverty line.
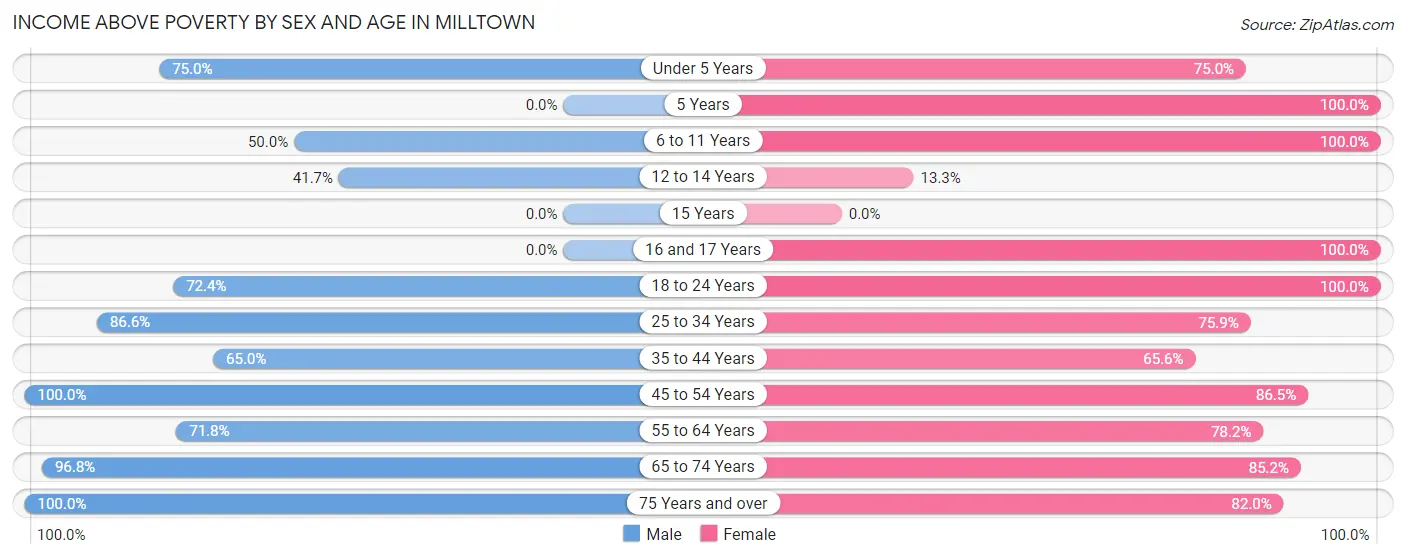
| Age Bracket | Male | Female |
| Under 5 Years | 9 (75.0%) | 9 (75.0%) |
| 5 Years | 0 (0.0%) | 2 (100.0%) |
| 6 to 11 Years | 4 (50.0%) | 30 (100.0%) |
| 12 to 14 Years | 5 (41.7%) | 2 (13.3%) |
| 15 Years | 0 (0.0%) | 0 (0.0%) |
| 16 and 17 Years | 0 (0.0%) | 3 (100.0%) |
| 18 to 24 Years | 21 (72.4%) | 18 (100.0%) |
| 25 to 34 Years | 58 (86.6%) | 66 (75.9%) |
| 35 to 44 Years | 13 (65.0%) | 21 (65.6%) |
| 45 to 54 Years | 47 (100.0%) | 45 (86.5%) |
| 55 to 64 Years | 51 (71.8%) | 79 (78.2%) |
| 65 to 74 Years | 60 (96.8%) | 46 (85.2%) |
| 75 Years and over | 25 (100.0%) | 41 (82.0%) |
| Total | 293 (83.0%) | 362 (79.4%) |
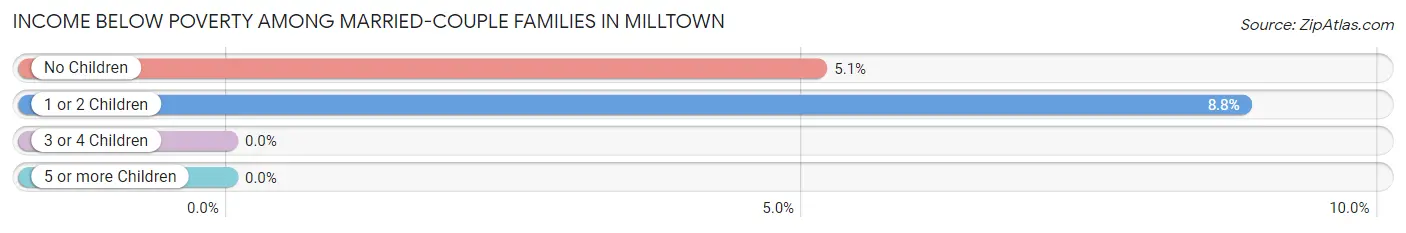
Income Below Poverty Among Married-Couple Families in Milltown
The poverty statistics for married-couple families in Milltown show that 5.8% or 9 of the total 156 families live below the poverty line. Families with 1 or 2 children have the highest poverty rate of 8.8%, comprising of 3 families. On the other hand, families with 3 or 4 children have the lowest poverty rate of 0.0%, which includes 0 families.
| Children | Above Poverty | Below Poverty |
| No Children | 111 (94.9%) | 6 (5.1%) |
| 1 or 2 Children | 31 (91.2%) | 3 (8.8%) |
| 3 or 4 Children | 5 (100.0%) | 0 (0.0%) |
| 5 or more Children | 0 (0.0%) | 0 (0.0%) |
| Total | 147 (94.2%) | 9 (5.8%) |
Income Below Poverty Among Single-Parent Households in Milltown
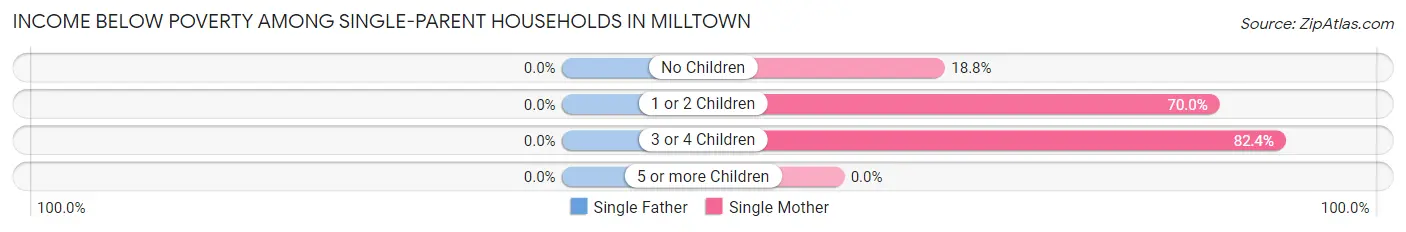
| Children | Single Father | Single Mother |
| No Children | 0 (0.0%) | 3 (18.8%) |
| 1 or 2 Children | 0 (0.0%) | 7 (70.0%) |
| 3 or 4 Children | 0 (0.0%) | 14 (82.4%) |
| 5 or more Children | 0 (0.0%) | 0 (0.0%) |
| Total | 0 (0.0%) | 24 (55.8%) |
Income Below Poverty Among Married-Couple vs Single-Parent Households in Milltown
The poverty data for Milltown shows that 9 of the married-couple family households (5.8%) and 24 of the single-parent households (55.8%) are living below the poverty level. Within the married-couple family households, those with 1 or 2 children have the highest poverty rate, with 3 households (8.8%) falling below the poverty line. Among the single-parent households, those with 3 or 4 children have the highest poverty rate, with 14 household (82.4%) living below poverty.
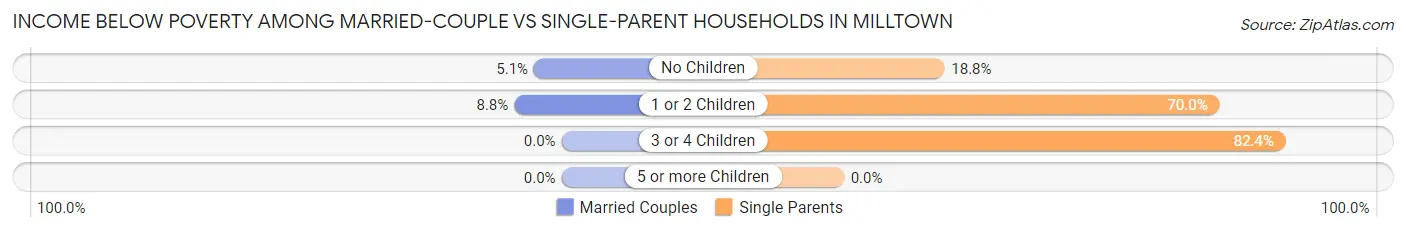
| Children | Married-Couple Families | Single-Parent Households |
| No Children | 6 (5.1%) | 3 (18.8%) |
| 1 or 2 Children | 3 (8.8%) | 7 (70.0%) |
| 3 or 4 Children | 0 (0.0%) | 14 (82.4%) |
| 5 or more Children | 0 (0.0%) | 0 (0.0%) |
| Total | 9 (5.8%) | 24 (55.8%) |
Race in Milltown
The most populous races in Milltown are White / Caucasian (744 | 92.0%), Two or more Races (50 | 6.2%), and Hispanic or Latino (38 | 4.7%).
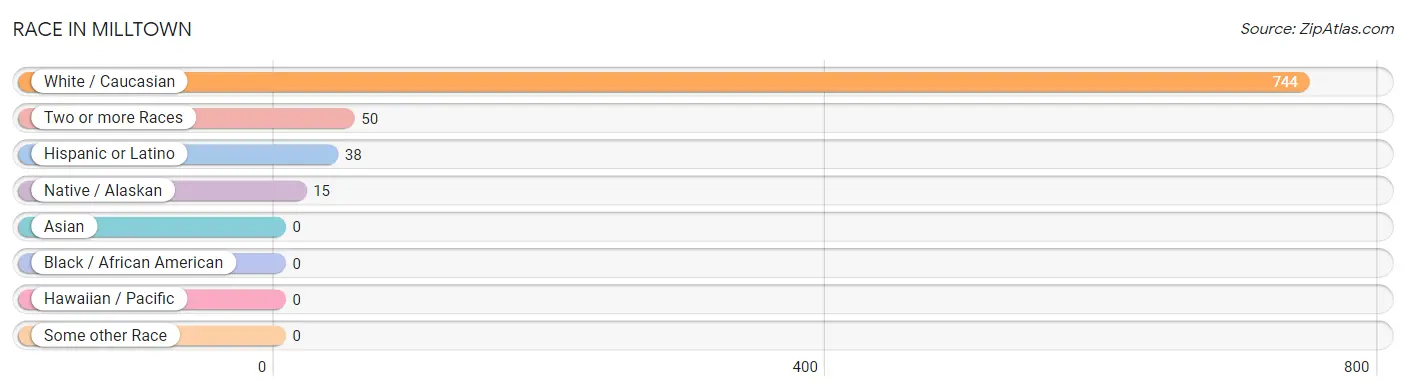
| Race | # Population | % Population |
| Asian | 0 | 0.0% |
| Black / African American | 0 | 0.0% |
| Hawaiian / Pacific | 0 | 0.0% |
| Hispanic or Latino | 38 | 4.7% |
| Native / Alaskan | 15 | 1.8% |
| White / Caucasian | 744 | 92.0% |
| Two or more Races | 50 | 6.2% |
| Some other Race | 0 | 0.0% |
| Total | 809 | 100.0% |
Ancestry in Milltown
The most populous ancestries reported in Milltown are German (230 | 28.4%), Norwegian (112 | 13.8%), Swedish (69 | 8.5%), Irish (67 | 8.3%), and Italian (40 | 4.9%), together accounting for 64.0% of all Milltown residents.
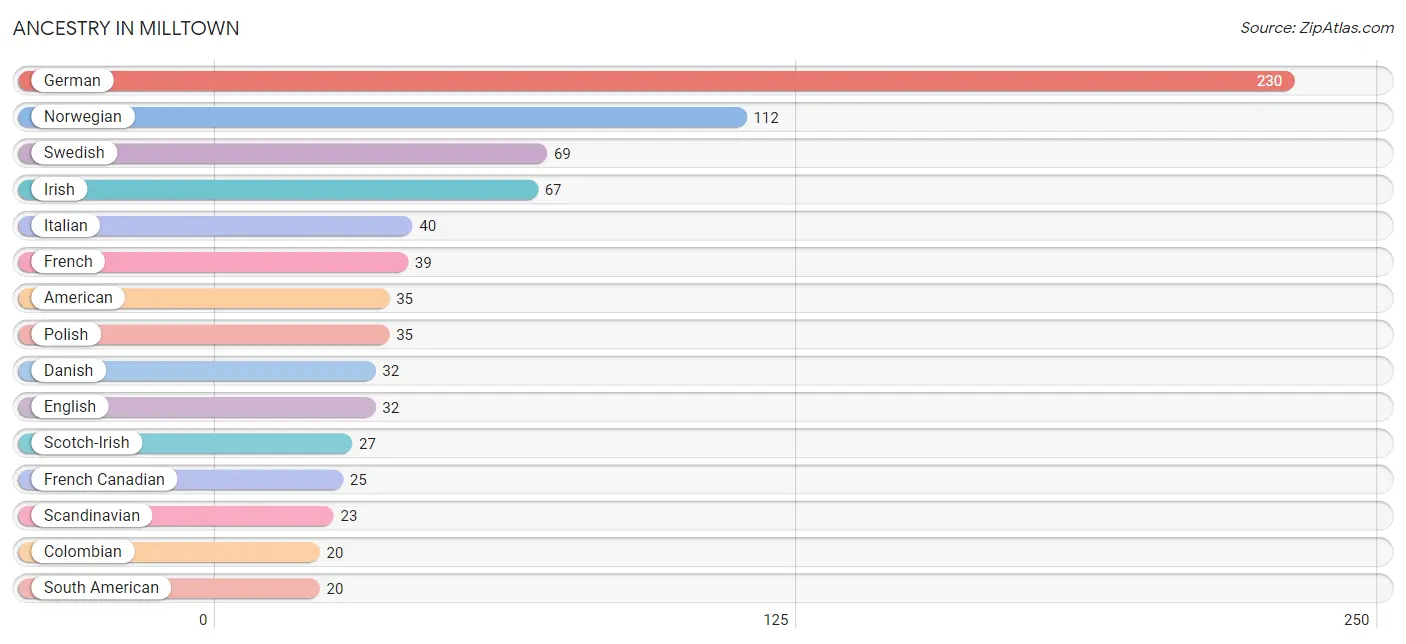
| Ancestry | # Population | % Population |
| American | 35 | 4.3% |
| Belgian | 4 | 0.5% |
| Chippewa | 8 | 1.0% |
| Colombian | 20 | 2.5% |
| Czech | 8 | 1.0% |
| Danish | 32 | 4.0% |
| Dutch | 8 | 1.0% |
| English | 32 | 4.0% |
| Finnish | 2 | 0.3% |
| French | 39 | 4.8% |
| French Canadian | 25 | 3.1% |
| German | 230 | 28.4% |
| Hungarian | 3 | 0.4% |
| Irish | 67 | 8.3% |
| Italian | 40 | 4.9% |
| Korean | 4 | 0.5% |
| Mexican | 18 | 2.2% |
| Norwegian | 112 | 13.8% |
| Polish | 35 | 4.3% |
| Russian | 9 | 1.1% |
| Scandinavian | 23 | 2.8% |
| Scotch-Irish | 27 | 3.3% |
| Scottish | 8 | 1.0% |
| Sioux | 15 | 1.8% |
| South American | 20 | 2.5% |
| Swedish | 69 | 8.5% |
| Swiss | 14 | 1.7% |
| Welsh | 1 | 0.1% | View All 28 Rows |
Immigrants in Milltown
The most numerous immigrant groups reported in Milltown came from Colombia (20 | 2.5%), Latin America (20 | 2.5%), and South America (20 | 2.5%), together accounting for 7.4% of all Milltown residents.
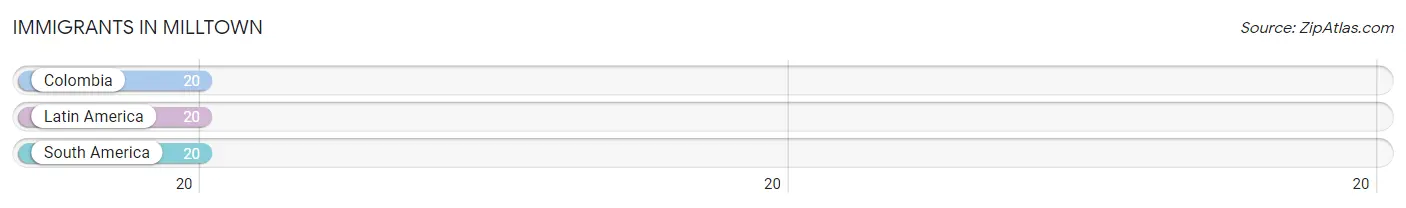
| Immigration Origin | # Population | % Population |
| Colombia | 20 | 2.5% |
| Latin America | 20 | 2.5% |
| South America | 20 | 2.5% | View All 3 Rows |
Sex and Age in Milltown
Sex and Age in Milltown
The most populous age groups in Milltown are 60 to 64 Years (49 | 13.9%) for men and 60 to 64 Years (70 | 15.3%) for women.
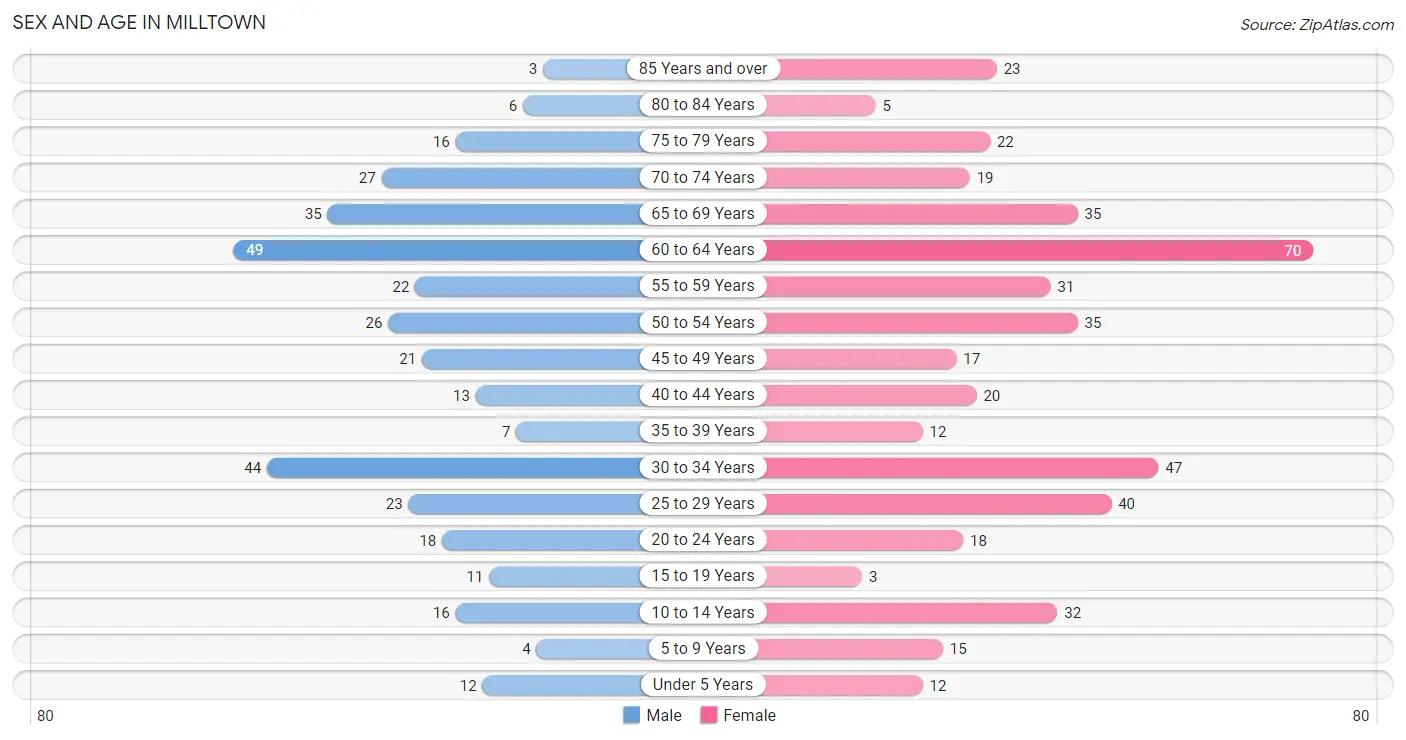
| Age Bracket | Male | Female |
| Under 5 Years | 12 (3.4%) | 12 (2.6%) |
| 5 to 9 Years | 4 (1.1%) | 15 (3.3%) |
| 10 to 14 Years | 16 (4.5%) | 32 (7.0%) |
| 15 to 19 Years | 11 (3.1%) | 3 (0.7%) |
| 20 to 24 Years | 18 (5.1%) | 18 (4.0%) |
| 25 to 29 Years | 23 (6.5%) | 40 (8.8%) |
| 30 to 34 Years | 44 (12.5%) | 47 (10.3%) |
| 35 to 39 Years | 7 (2.0%) | 12 (2.6%) |
| 40 to 44 Years | 13 (3.7%) | 20 (4.4%) |
| 45 to 49 Years | 21 (5.9%) | 17 (3.7%) |
| 50 to 54 Years | 26 (7.4%) | 35 (7.7%) |
| 55 to 59 Years | 22 (6.2%) | 31 (6.8%) |
| 60 to 64 Years | 49 (13.9%) | 70 (15.3%) |
| 65 to 69 Years | 35 (9.9%) | 35 (7.7%) |
| 70 to 74 Years | 27 (7.6%) | 19 (4.2%) |
| 75 to 79 Years | 16 (4.5%) | 22 (4.8%) |
| 80 to 84 Years | 6 (1.7%) | 5 (1.1%) |
| 85 Years and over | 3 (0.9%) | 23 (5.0%) |
| Total | 353 (100.0%) | 456 (100.0%) |
Families and Households in Milltown
Median Family Size in Milltown
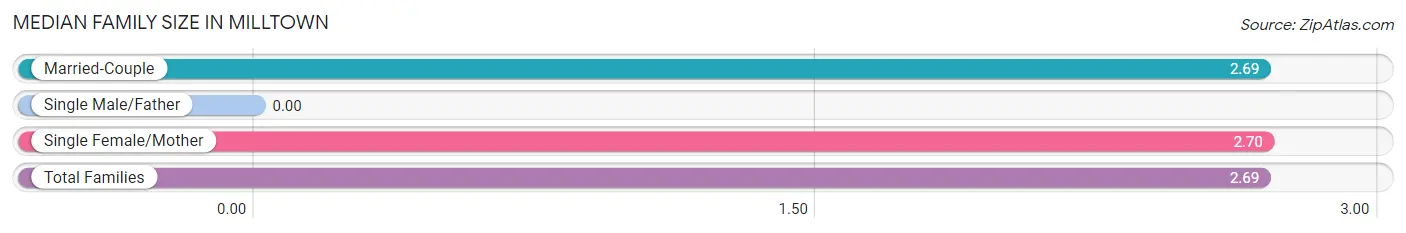
| Family Type | # Families | Family Size |
| Married-Couple | 156 (78.4%) | 2.69 |
| Single Male/Father | 0 (0.0%) | - |
| Single Female/Mother | 43 (21.6%) | 2.70 |
| Total Families | 199 (100.0%) | 2.69 |
Median Household Size in Milltown
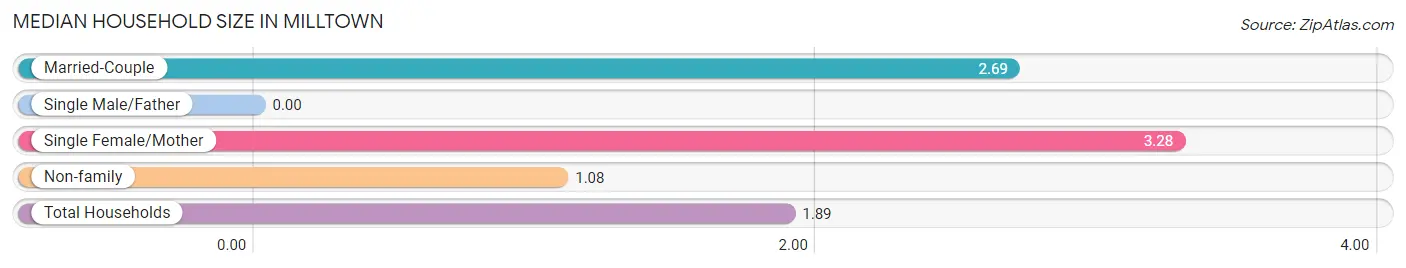
| Household Type | # Households | Household Size |
| Married-Couple | 156 (36.8%) | 2.69 |
| Single Male/Father | 0 (0.0%) | - |
| Single Female/Mother | 43 (10.1%) | 3.28 |
| Non-family | 225 (53.1%) | 1.08 |
| Total Households | 424 (100.0%) | 1.89 |
Household Size by Marriage Status in Milltown
Out of a total of 424 households in Milltown, 199 (46.9%) are family households, while 225 (53.1%) are nonfamily households. The most numerous type of family households are 2-person households, comprising 112, and the most common type of nonfamily households are 1-person households, comprising 209.
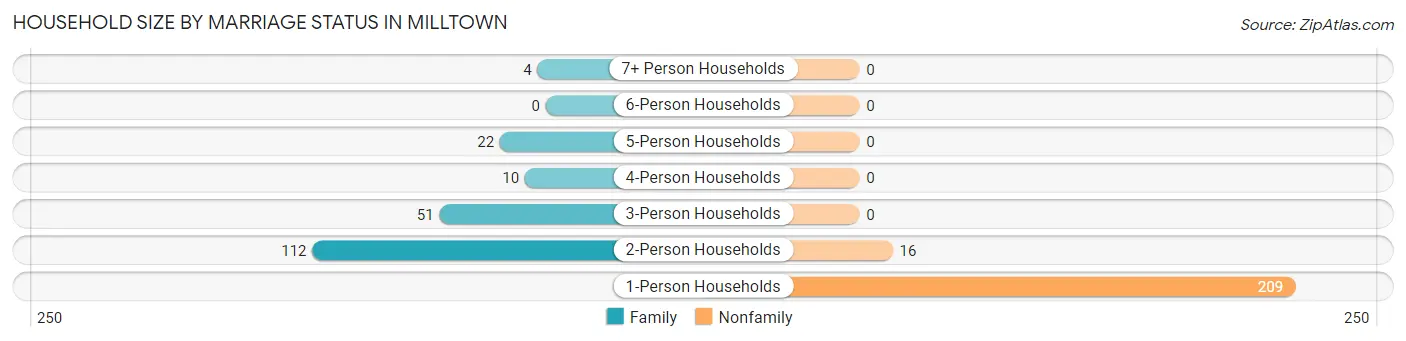
| Household Size | Family Households | Nonfamily Households |
| 1-Person Households | - | 209 (49.3%) |
| 2-Person Households | 112 (26.4%) | 16 (3.8%) |
| 3-Person Households | 51 (12.0%) | 0 (0.0%) |
| 4-Person Households | 10 (2.4%) | 0 (0.0%) |
| 5-Person Households | 22 (5.2%) | 0 (0.0%) |
| 6-Person Households | 0 (0.0%) | 0 (0.0%) |
| 7+ Person Households | 4 (0.9%) | 0 (0.0%) |
| Total | 199 (46.9%) | 225 (53.1%) |
Female Fertility in Milltown
Fertility by Age in Milltown
Average fertility rate in Milltown is 49.0 births per 1,000 women. Women in the age bracket of 20 to 34 years have the highest fertility rate with 76.0 births per 1,000 women. Women in the age bracket of 20 to 34 years acount for 100.0% of all women with births.
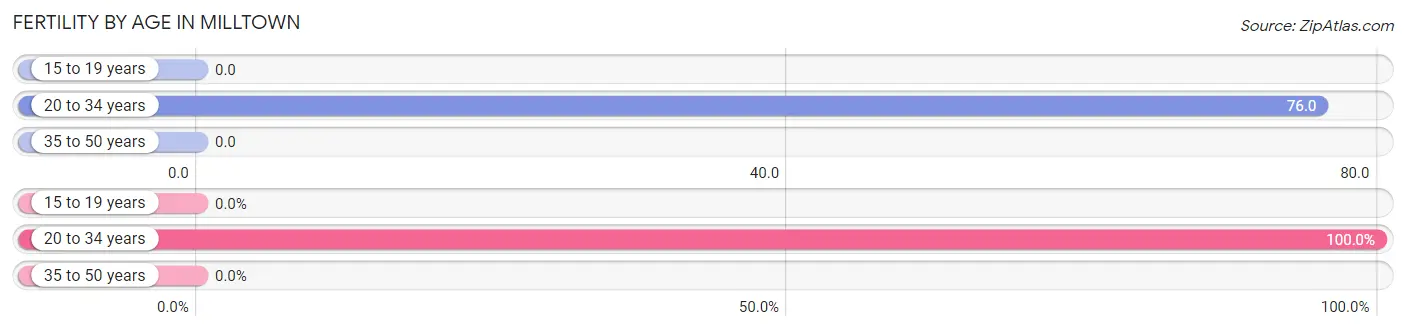
| Age Bracket | Women with Births | Births / 1,000 Women |
| 15 to 19 years | 0 (0.0%) | 0.0 |
| 20 to 34 years | 8 (100.0%) | 76.0 |
| 35 to 50 years | 0 (0.0%) | 0.0 |
| Total | 8 (100.0%) | 49.0 |
Fertility by Age by Marriage Status in Milltown
62.5% of women with births (8) in Milltown are married. The highest percentage of unmarried women with births falls into 20 to 34 years age bracket with 37.5% of them unmarried at the time of birth, while the lowest percentage of unmarried women with births belong to 20 to 34 years age bracket with 37.5% of them unmarried.
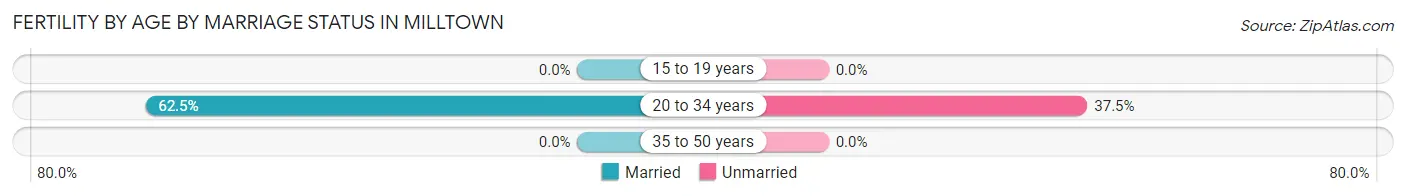
| Age Bracket | Married | Unmarried |
| 15 to 19 years | 0 (0.0%) | 0 (0.0%) |
| 20 to 34 years | 5 (62.5%) | 3 (37.5%) |
| 35 to 50 years | 0 (0.0%) | 0 (0.0%) |
| Total | 5 (62.5%) | 3 (37.5%) |
Fertility by Education in Milltown
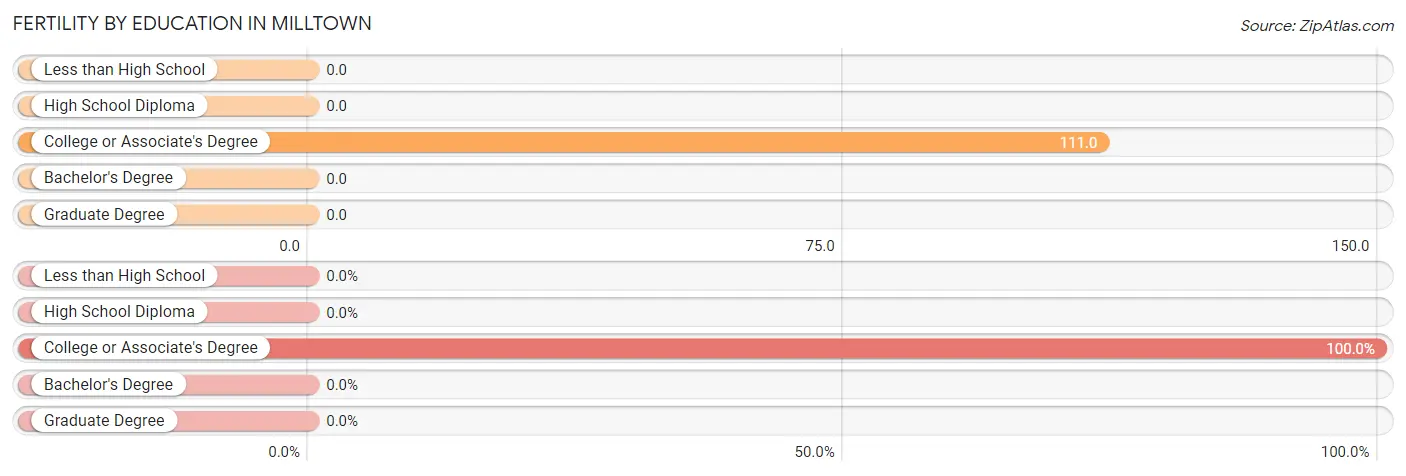
| Educational Attainment | Women with Births | Births / 1,000 Women |
| Less than High School | 0 (0.0%) | 0.0 |
| High School Diploma | 0 (0.0%) | 0.0 |
| College or Associate's Degree | 8 (100.0%) | 111.0 |
| Bachelor's Degree | 0 (0.0%) | 0.0 |
| Graduate Degree | 0 (0.0%) | 0.0 |
| Total | 8 (100.0%) | 49.0 |
Fertility by Education by Marriage Status in Milltown
37.5% of women with births in Milltown are unmarried. Women with the educational attainment of college or associate's degree are most likely to be married with 62.5% of them married at childbirth, while women with the educational attainment of college or associate's degree are least likely to be married with 37.5% of them unmarried at childbirth.
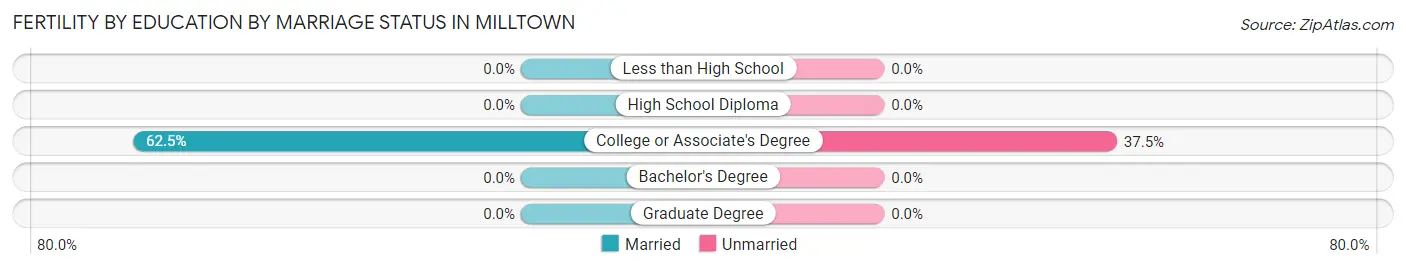
| Educational Attainment | Married | Unmarried |
| Less than High School | 0 (0.0%) | 0 (0.0%) |
| High School Diploma | 0 (0.0%) | 0 (0.0%) |
| College or Associate's Degree | 5 (62.5%) | 3 (37.5%) |
| Bachelor's Degree | 0 (0.0%) | 0 (0.0%) |
| Graduate Degree | 0 (0.0%) | 0 (0.0%) |
| Total | 5 (62.5%) | 3 (37.5%) |
Employment Characteristics in Milltown
Employment by Class of Employer in Milltown
Among the 408 employed individuals in Milltown, private company employees (325 | 79.7%), local government employees (31 | 7.6%), and not-for-profit organizations (24 | 5.9%) make up the most common classes of employment.
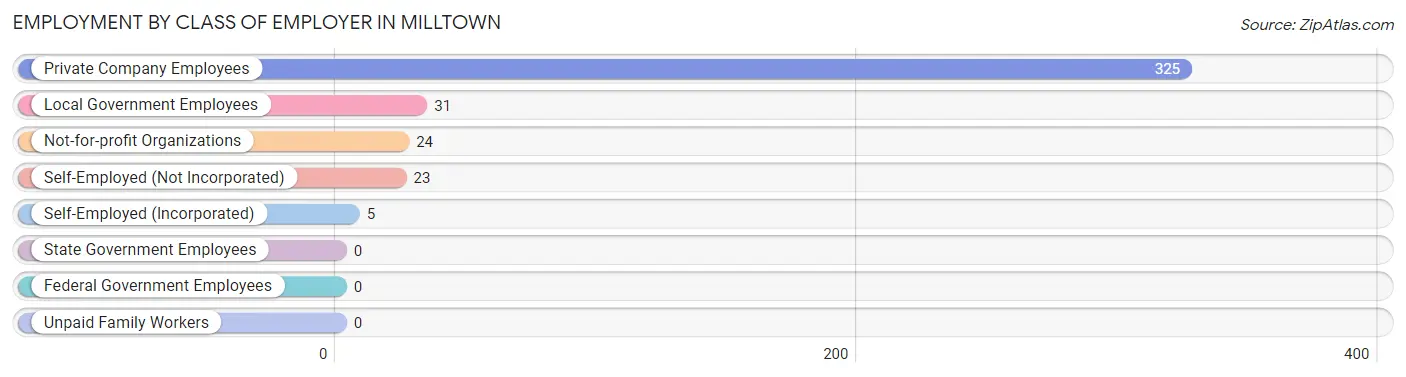
| Employer Class | # Employees | % Employees |
| Private Company Employees | 325 | 79.7% |
| Self-Employed (Incorporated) | 5 | 1.2% |
| Self-Employed (Not Incorporated) | 23 | 5.6% |
| Not-for-profit Organizations | 24 | 5.9% |
| Local Government Employees | 31 | 7.6% |
| State Government Employees | 0 | 0.0% |
| Federal Government Employees | 0 | 0.0% |
| Unpaid Family Workers | 0 | 0.0% |
| Total | 408 | 100.0% |
Employment Status by Age in Milltown
According to the labor force statistics for Milltown, out of the total population over 16 years of age (718), 60.4% or 434 individuals are in the labor force, with 3.9% or 17 of them unemployed. The age group with the highest labor force participation rate is 16 to 19 years, with 100.0% or 14 individuals in the labor force. Within the labor force, the 25 to 29 years age range has the highest percentage of unemployed individuals, with 23.7% or 14 of them being unemployed.
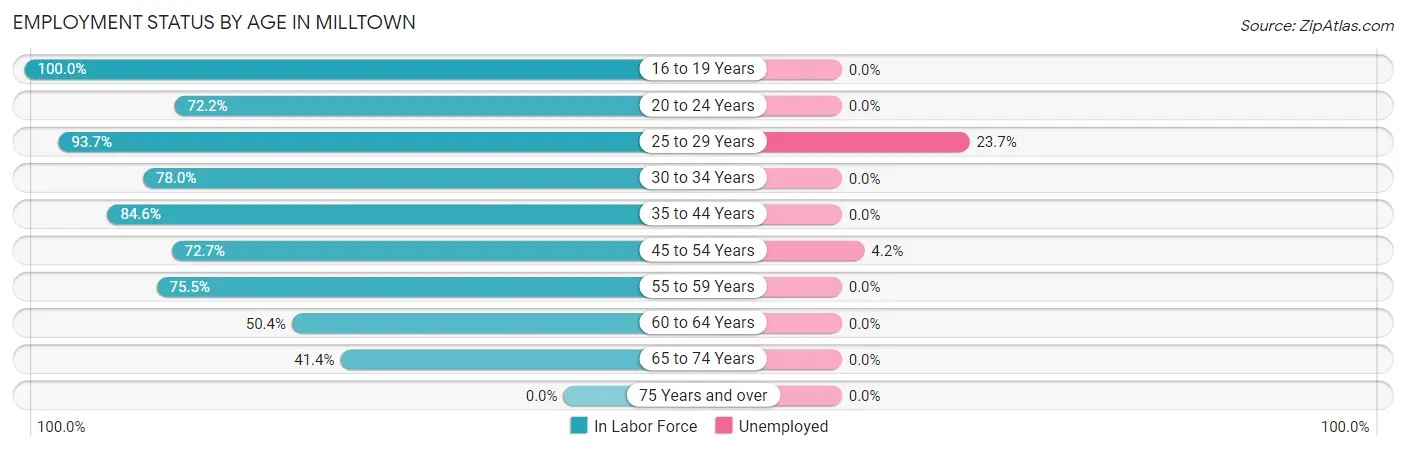
| Age Bracket | In Labor Force | Unemployed |
| 16 to 19 Years | 14 (100.0%) | 0 (0.0%) |
| 20 to 24 Years | 26 (72.2%) | 0 (0.0%) |
| 25 to 29 Years | 59 (93.7%) | 14 (23.7%) |
| 30 to 34 Years | 71 (78.0%) | 0 (0.0%) |
| 35 to 44 Years | 44 (84.6%) | 0 (0.0%) |
| 45 to 54 Years | 72 (72.7%) | 3 (4.2%) |
| 55 to 59 Years | 40 (75.5%) | 0 (0.0%) |
| 60 to 64 Years | 60 (50.4%) | 0 (0.0%) |
| 65 to 74 Years | 48 (41.4%) | 0 (0.0%) |
| 75 Years and over | 0 (0.0%) | 0 (0.0%) |
| Total | 434 (60.4%) | 17 (3.9%) |
Employment Status by Educational Attainment in Milltown
According to labor force statistics for Milltown, 72.5% of individuals (346) out of the total population between 25 and 64 years of age (477) are in the labor force, with 4.9% or 17 of them being unemployed. The group with the highest labor force participation rate are those with the educational attainment of bachelor's degree or higher, with 90.9% or 40 individuals in the labor force. Within the labor force, individuals with less than high school education have the highest percentage of unemployment, with 20.0% or 3 of them being unemployed.
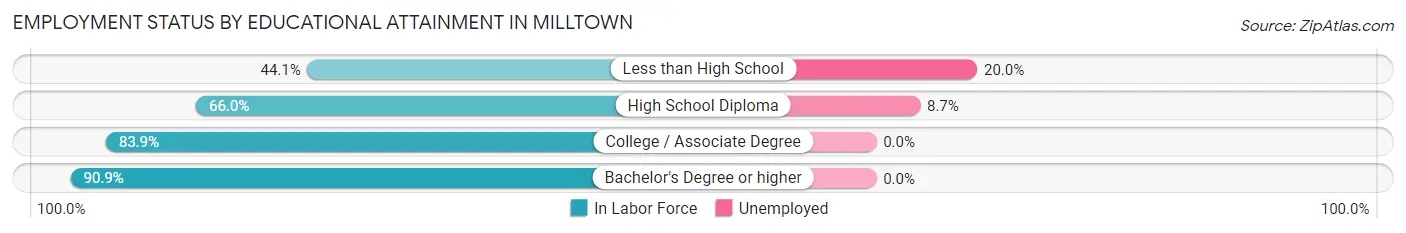
| Educational Attainment | In Labor Force | Unemployed |
| Less than High School | 15 (44.1%) | 7 (20.0%) |
| High School Diploma | 161 (66.0%) | 21 (8.7%) |
| College / Associate Degree | 130 (83.9%) | 0 (0.0%) |
| Bachelor's Degree or higher | 40 (90.9%) | 0 (0.0%) |
| Total | 346 (72.5%) | 23 (4.9%) |
Employment Occupations by Sex in Milltown
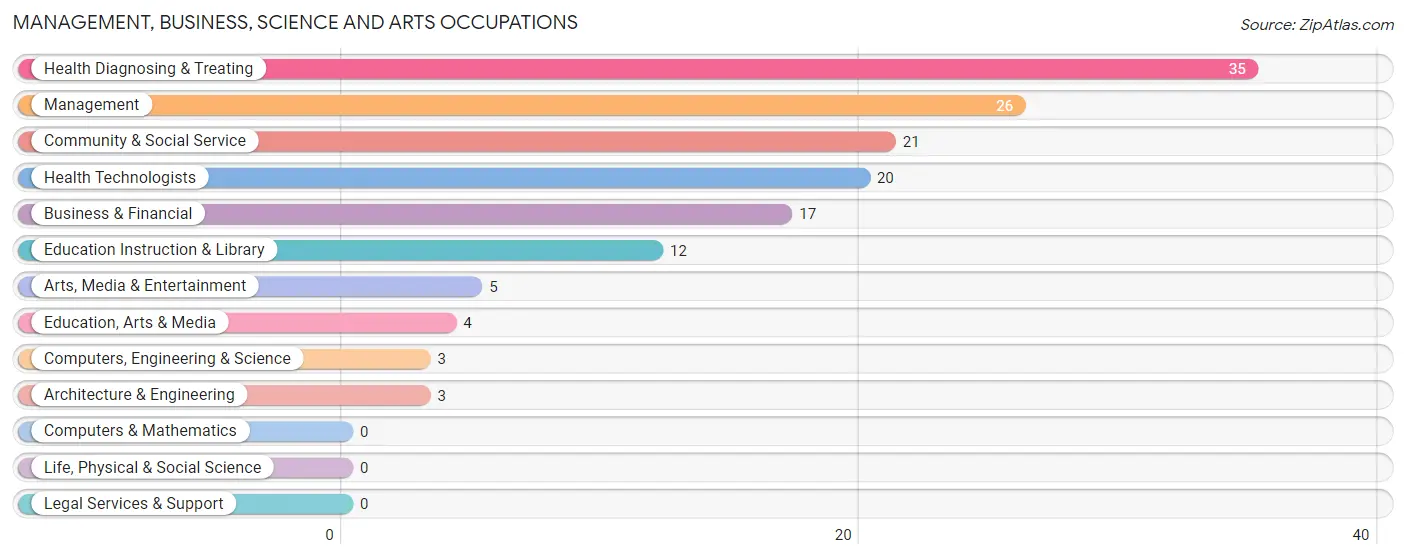
Management, Business, Science and Arts Occupations
The most common Management, Business, Science and Arts occupations in Milltown are Health Diagnosing & Treating (35 | 8.4%), Management (26 | 6.2%), Community & Social Service (21 | 5.0%), Health Technologists (20 | 4.8%), and Business & Financial (17 | 4.1%).
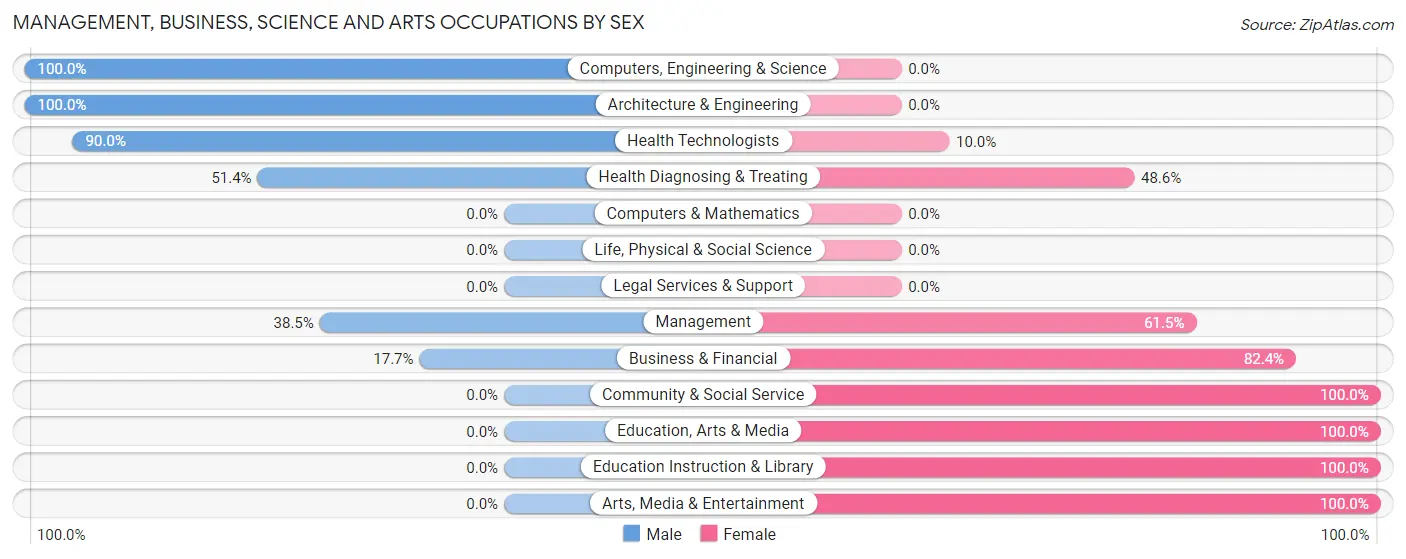
Management, Business, Science and Arts Occupations by Sex
Within the Management, Business, Science and Arts occupations in Milltown, the most male-oriented occupations are Computers, Engineering & Science (100.0%), Architecture & Engineering (100.0%), and Health Technologists (90.0%), while the most female-oriented occupations are Community & Social Service (100.0%), Education, Arts & Media (100.0%), and Education Instruction & Library (100.0%).
| Occupation | Male | Female |
| Management | 10 (38.5%) | 16 (61.5%) |
| Business & Financial | 3 (17.6%) | 14 (82.4%) |
| Computers, Engineering & Science | 3 (100.0%) | 0 (0.0%) |
| Computers & Mathematics | 0 (0.0%) | 0 (0.0%) |
| Architecture & Engineering | 3 (100.0%) | 0 (0.0%) |
| Life, Physical & Social Science | 0 (0.0%) | 0 (0.0%) |
| Community & Social Service | 0 (0.0%) | 21 (100.0%) |
| Education, Arts & Media | 0 (0.0%) | 4 (100.0%) |
| Legal Services & Support | 0 (0.0%) | 0 (0.0%) |
| Education Instruction & Library | 0 (0.0%) | 12 (100.0%) |
| Arts, Media & Entertainment | 0 (0.0%) | 5 (100.0%) |
| Health Diagnosing & Treating | 18 (51.4%) | 17 (48.6%) |
| Health Technologists | 18 (90.0%) | 2 (10.0%) |
| Total (Category) | 34 (33.3%) | 68 (66.7%) |
| Total (Overall) | 186 (44.6%) | 231 (55.4%) |
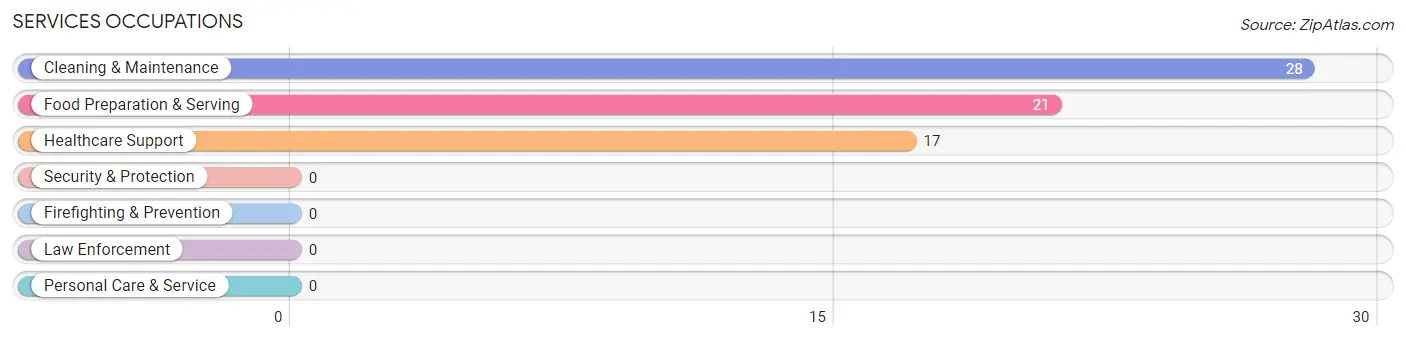
Services Occupations
The most common Services occupations in Milltown are Cleaning & Maintenance (28 | 6.7%), Food Preparation & Serving (21 | 5.0%), and Healthcare Support (17 | 4.1%).
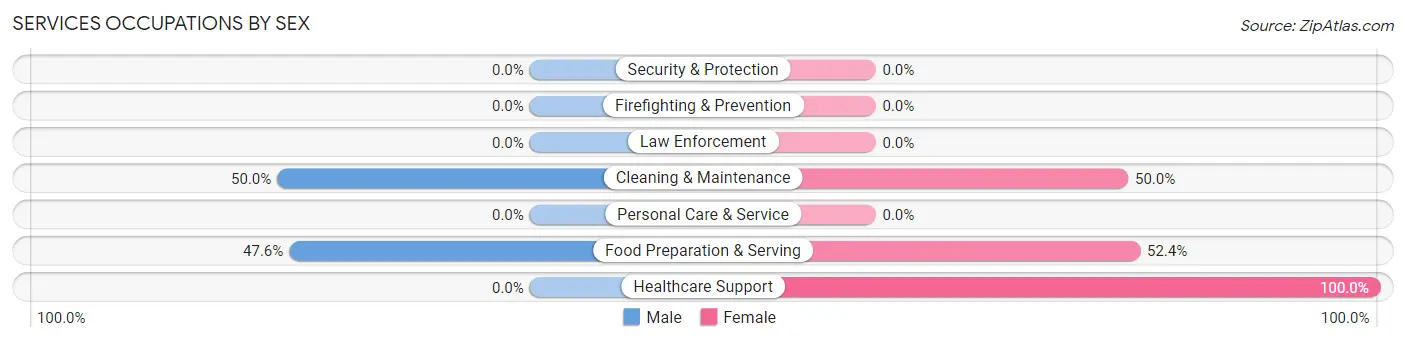
Services Occupations by Sex
Within the Services occupations in Milltown, the most male-oriented occupations are Cleaning & Maintenance (50.0%), and Food Preparation & Serving (47.6%), while the most female-oriented occupations are Healthcare Support (100.0%), Food Preparation & Serving (52.4%), and Cleaning & Maintenance (50.0%).
| Occupation | Male | Female |
| Healthcare Support | 0 (0.0%) | 17 (100.0%) |
| Security & Protection | 0 (0.0%) | 0 (0.0%) |
| Firefighting & Prevention | 0 (0.0%) | 0 (0.0%) |
| Law Enforcement | 0 (0.0%) | 0 (0.0%) |
| Food Preparation & Serving | 10 (47.6%) | 11 (52.4%) |
| Cleaning & Maintenance | 14 (50.0%) | 14 (50.0%) |
| Personal Care & Service | 0 (0.0%) | 0 (0.0%) |
| Total (Category) | 24 (36.4%) | 42 (63.6%) |
| Total (Overall) | 186 (44.6%) | 231 (55.4%) |
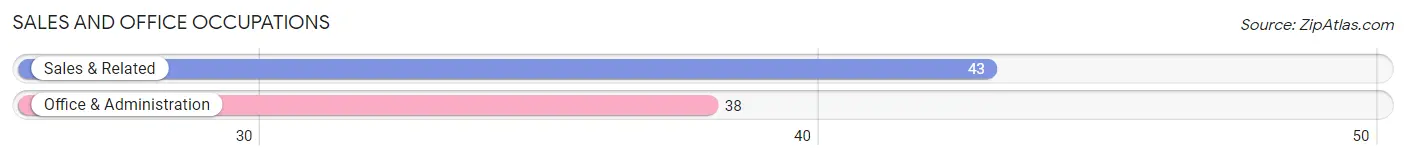
Sales and Office Occupations
The most common Sales and Office occupations in Milltown are Sales & Related (43 | 10.3%), and Office & Administration (38 | 9.1%).
Sales and Office Occupations by Sex
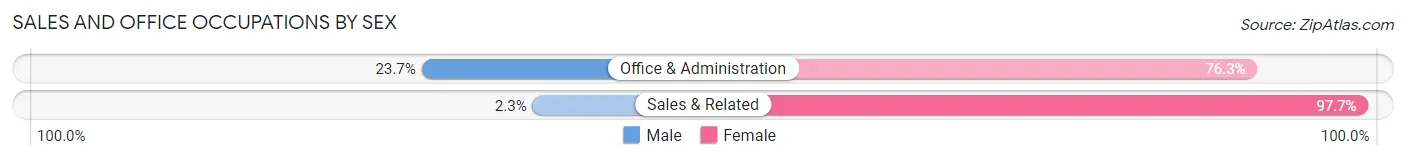
| Occupation | Male | Female |
| Sales & Related | 1 (2.3%) | 42 (97.7%) |
| Office & Administration | 9 (23.7%) | 29 (76.3%) |
| Total (Category) | 10 (12.3%) | 71 (87.6%) |
| Total (Overall) | 186 (44.6%) | 231 (55.4%) |
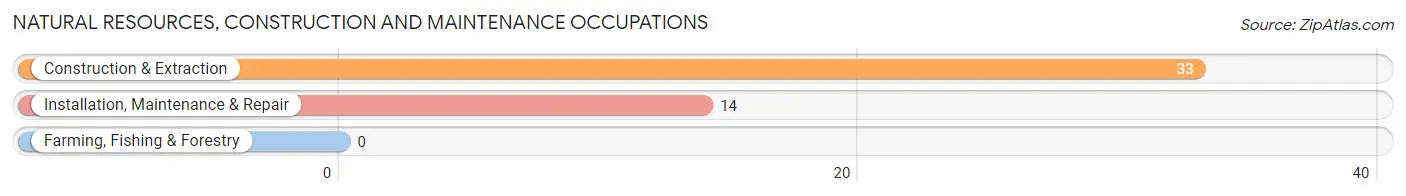
Natural Resources, Construction and Maintenance Occupations
The most common Natural Resources, Construction and Maintenance occupations in Milltown are Construction & Extraction (33 | 7.9%), and Installation, Maintenance & Repair (14 | 3.4%).
Natural Resources, Construction and Maintenance Occupations by Sex
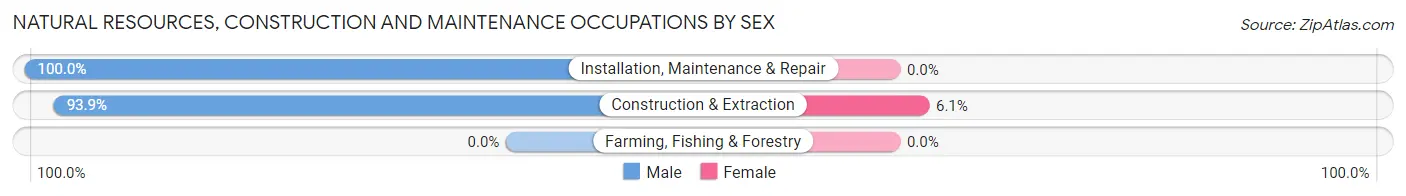
| Occupation | Male | Female |
| Farming, Fishing & Forestry | 0 (0.0%) | 0 (0.0%) |
| Construction & Extraction | 31 (93.9%) | 2 (6.1%) |
| Installation, Maintenance & Repair | 14 (100.0%) | 0 (0.0%) |
| Total (Category) | 45 (95.7%) | 2 (4.3%) |
| Total (Overall) | 186 (44.6%) | 231 (55.4%) |
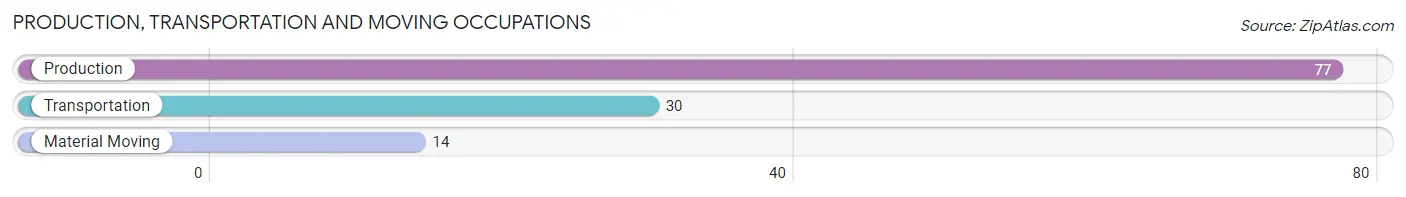
Production, Transportation and Moving Occupations
The most common Production, Transportation and Moving occupations in Milltown are Production (77 | 18.5%), Transportation (30 | 7.2%), and Material Moving (14 | 3.4%).
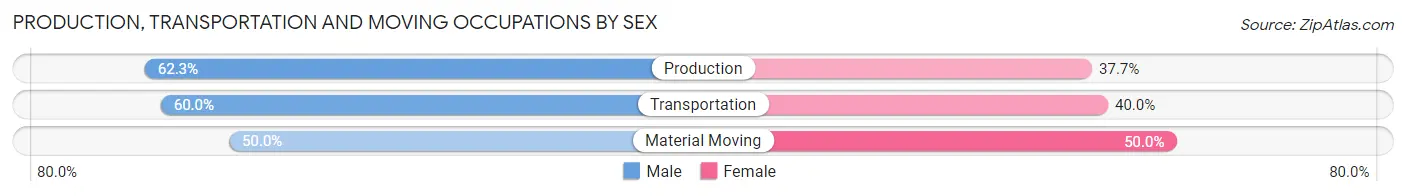
Production, Transportation and Moving Occupations by Sex
| Occupation | Male | Female |
| Production | 48 (62.3%) | 29 (37.7%) |
| Transportation | 18 (60.0%) | 12 (40.0%) |
| Material Moving | 7 (50.0%) | 7 (50.0%) |
| Total (Category) | 73 (60.3%) | 48 (39.7%) |
| Total (Overall) | 186 (44.6%) | 231 (55.4%) |
Employment Industries by Sex in Milltown
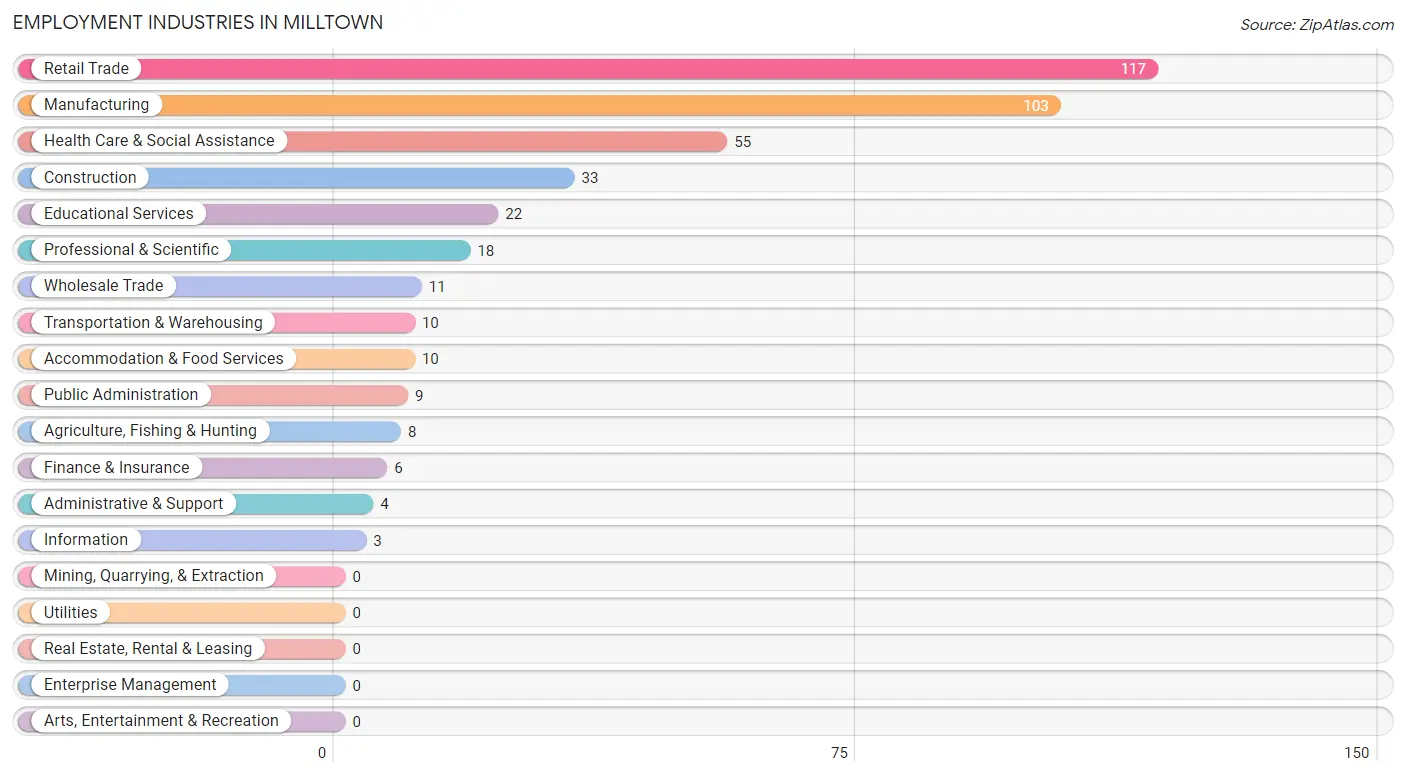
Employment Industries in Milltown
The major employment industries in Milltown include Retail Trade (117 | 28.1%), Manufacturing (103 | 24.7%), Health Care & Social Assistance (55 | 13.2%), Construction (33 | 7.9%), and Educational Services (22 | 5.3%).
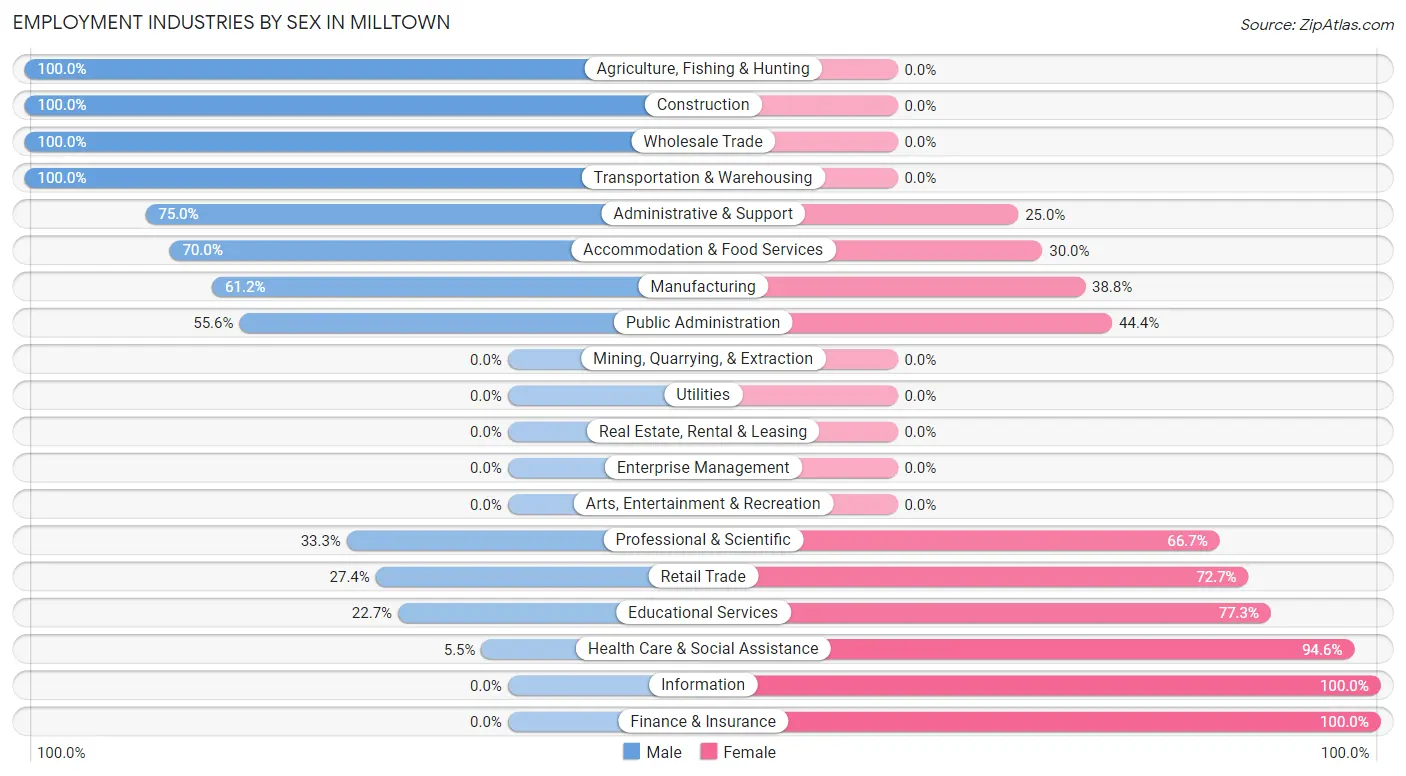
Employment Industries by Sex in Milltown
The Milltown industries that see more men than women are Agriculture, Fishing & Hunting (100.0%), Construction (100.0%), and Wholesale Trade (100.0%), whereas the industries that tend to have a higher number of women are Information (100.0%), Finance & Insurance (100.0%), and Health Care & Social Assistance (94.6%).
| Industry | Male | Female |
| Agriculture, Fishing & Hunting | 8 (100.0%) | 0 (0.0%) |
| Mining, Quarrying, & Extraction | 0 (0.0%) | 0 (0.0%) |
| Construction | 33 (100.0%) | 0 (0.0%) |
| Manufacturing | 63 (61.2%) | 40 (38.8%) |
| Wholesale Trade | 11 (100.0%) | 0 (0.0%) |
| Retail Trade | 32 (27.4%) | 85 (72.7%) |
| Transportation & Warehousing | 10 (100.0%) | 0 (0.0%) |
| Utilities | 0 (0.0%) | 0 (0.0%) |
| Information | 0 (0.0%) | 3 (100.0%) |
| Finance & Insurance | 0 (0.0%) | 6 (100.0%) |
| Real Estate, Rental & Leasing | 0 (0.0%) | 0 (0.0%) |
| Professional & Scientific | 6 (33.3%) | 12 (66.7%) |
| Enterprise Management | 0 (0.0%) | 0 (0.0%) |
| Administrative & Support | 3 (75.0%) | 1 (25.0%) |
| Educational Services | 5 (22.7%) | 17 (77.3%) |
| Health Care & Social Assistance | 3 (5.4%) | 52 (94.6%) |
| Arts, Entertainment & Recreation | 0 (0.0%) | 0 (0.0%) |
| Accommodation & Food Services | 7 (70.0%) | 3 (30.0%) |
| Public Administration | 5 (55.6%) | 4 (44.4%) |
| Total | 186 (44.6%) | 231 (55.4%) |
Education in Milltown
School Enrollment in Milltown
The most common levels of schooling among the 80 students in Milltown are middle school (31 | 38.8%), elementary school (27 | 33.8%), and high school (10 | 12.5%).
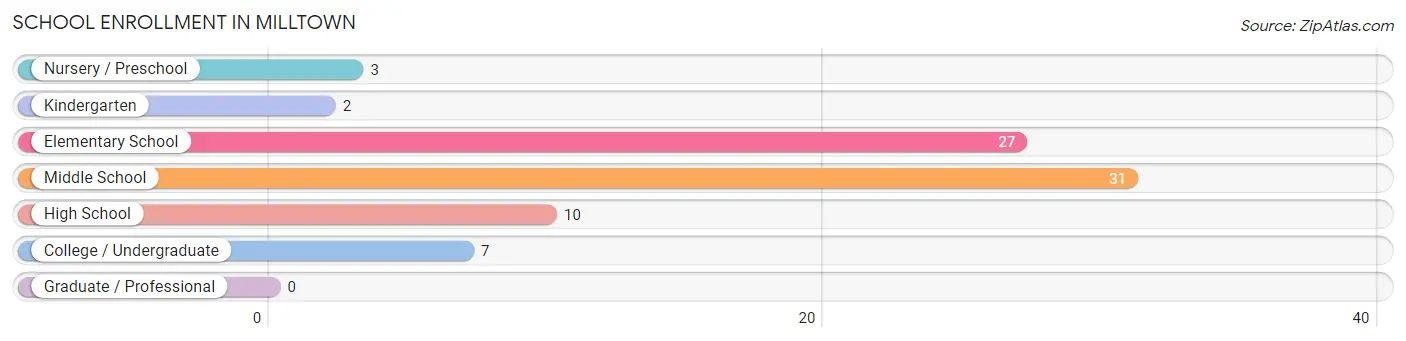
| School Level | # Students | % Students |
| Nursery / Preschool | 3 | 3.7% |
| Kindergarten | 2 | 2.5% |
| Elementary School | 27 | 33.8% |
| Middle School | 31 | 38.8% |
| High School | 10 | 12.5% |
| College / Undergraduate | 7 | 8.7% |
| Graduate / Professional | 0 | 0.0% |
| Total | 80 | 100.0% |
School Enrollment by Age by Funding Source in Milltown
Out of a total of 80 students who are enrolled in schools in Milltown, 4 (5.0%) attend a private institution, while the remaining 76 (95.0%) are enrolled in public schools. The age group of 35 years and over has the highest likelihood of being enrolled in private schools, with 4 (57.1% in the age bracket) enrolled. Conversely, the age group of 3 to 4 year olds has the lowest likelihood of being enrolled in a private school, with 3 (100.0% in the age bracket) attending a public institution.
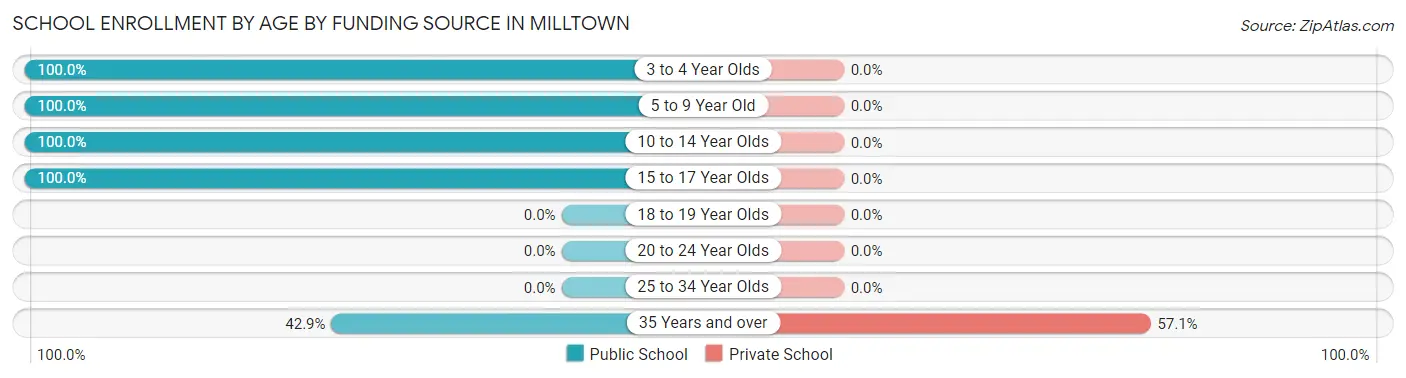
| Age Bracket | Public School | Private School |
| 3 to 4 Year Olds | 3 (100.0%) | 0 (0.0%) |
| 5 to 9 Year Old | 19 (100.0%) | 0 (0.0%) |
| 10 to 14 Year Olds | 48 (100.0%) | 0 (0.0%) |
| 15 to 17 Year Olds | 3 (100.0%) | 0 (0.0%) |
| 18 to 19 Year Olds | 0 (0.0%) | 0 (0.0%) |
| 20 to 24 Year Olds | 0 (0.0%) | 0 (0.0%) |
| 25 to 34 Year Olds | 0 (0.0%) | 0 (0.0%) |
| 35 Years and over | 3 (42.9%) | 4 (57.1%) |
| Total | 76 (95.0%) | 4 (5.0%) |
Educational Attainment by Field of Study in Milltown
Science & technology (21 | 30.4%), bio, nature & agricultural (12 | 17.4%), social sciences (11 | 15.9%), education (9 | 13.0%), and physical & health sciences (5 | 7.2%) are the most common fields of study among 69 individuals in Milltown who have obtained a bachelor's degree or higher.
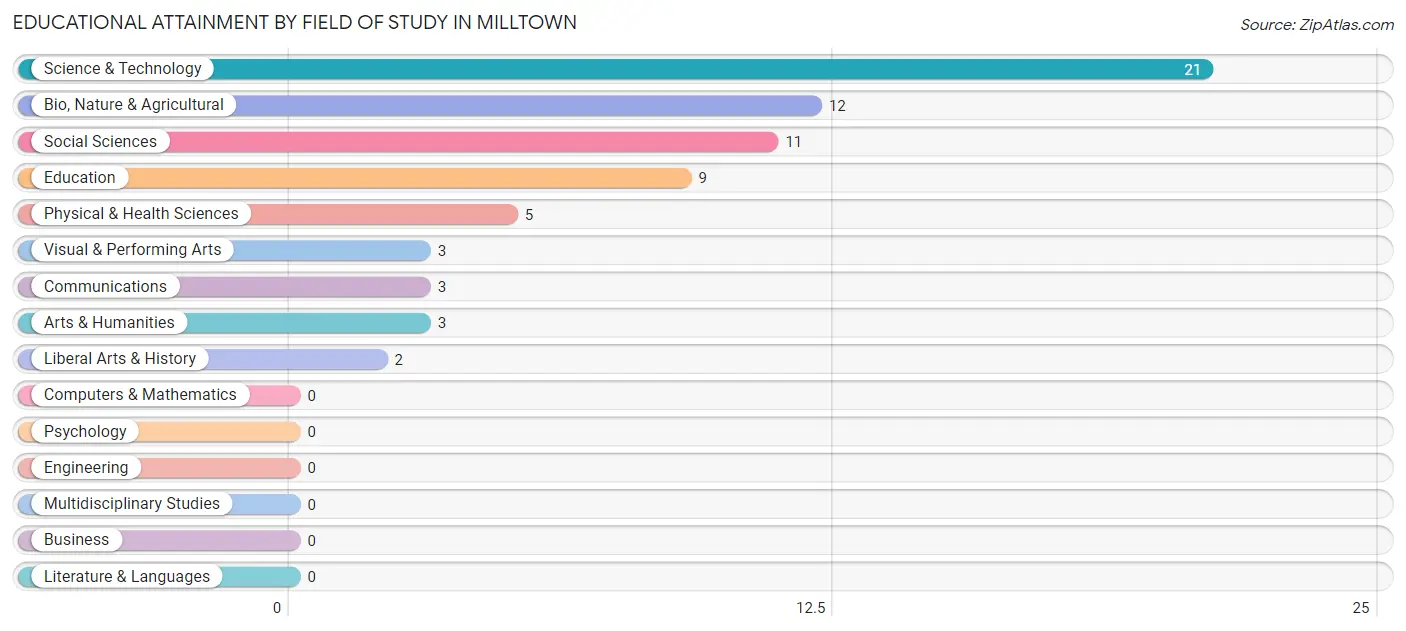
| Field of Study | # Graduates | % Graduates |
| Computers & Mathematics | 0 | 0.0% |
| Bio, Nature & Agricultural | 12 | 17.4% |
| Physical & Health Sciences | 5 | 7.2% |
| Psychology | 0 | 0.0% |
| Social Sciences | 11 | 15.9% |
| Engineering | 0 | 0.0% |
| Multidisciplinary Studies | 0 | 0.0% |
| Science & Technology | 21 | 30.4% |
| Business | 0 | 0.0% |
| Education | 9 | 13.0% |
| Literature & Languages | 0 | 0.0% |
| Liberal Arts & History | 2 | 2.9% |
| Visual & Performing Arts | 3 | 4.3% |
| Communications | 3 | 4.3% |
| Arts & Humanities | 3 | 4.3% |
| Total | 69 | 100.0% |
Transportation & Commute in Milltown
Vehicle Availability by Sex in Milltown
The most prevalent vehicle ownership categories in Milltown are males with 2 vehicles (126, accounting for 67.7%) and females with 2 vehicles (133, making up 57.0%).
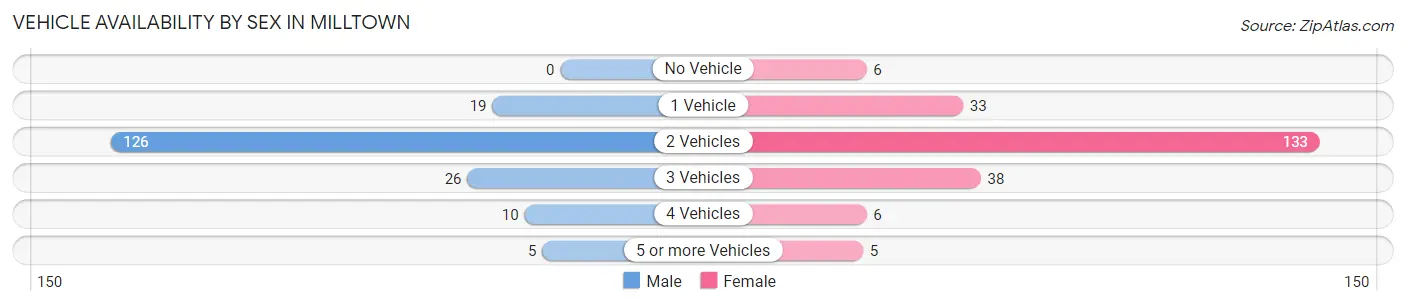
| Vehicles Available | Male | Female |
| No Vehicle | 0 (0.0%) | 6 (2.7%) |
| 1 Vehicle | 19 (10.2%) | 33 (14.9%) |
| 2 Vehicles | 126 (67.7%) | 133 (60.2%) |
| 3 Vehicles | 26 (14.0%) | 38 (17.2%) |
| 4 Vehicles | 10 (5.4%) | 6 (2.7%) |
| 5 or more Vehicles | 5 (2.7%) | 5 (2.3%) |
| Total | 186 (100.0%) | 221 (100.0%) |
Commute Time in Milltown
The most frequently occuring commute durations in Milltown are 30 to 34 minutes (51 commuters, 13.0%), 15 to 19 minutes (48 commuters, 12.3%), and 25 to 29 minutes (44 commuters, 11.3%).
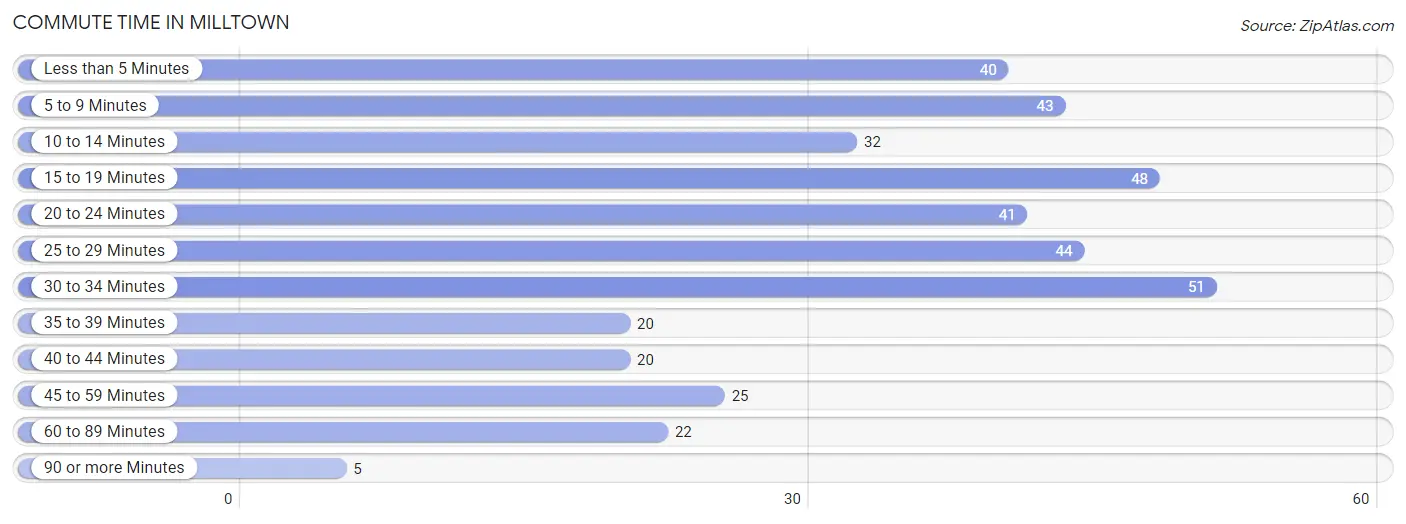
| Commute Time | # Commuters | % Commuters |
| Less than 5 Minutes | 40 | 10.2% |
| 5 to 9 Minutes | 43 | 11.0% |
| 10 to 14 Minutes | 32 | 8.2% |
| 15 to 19 Minutes | 48 | 12.3% |
| 20 to 24 Minutes | 41 | 10.5% |
| 25 to 29 Minutes | 44 | 11.3% |
| 30 to 34 Minutes | 51 | 13.0% |
| 35 to 39 Minutes | 20 | 5.1% |
| 40 to 44 Minutes | 20 | 5.1% |
| 45 to 59 Minutes | 25 | 6.4% |
| 60 to 89 Minutes | 22 | 5.6% |
| 90 or more Minutes | 5 | 1.3% |
Commute Time by Sex in Milltown
The most common commute times in Milltown are 25 to 29 minutes (34 commuters, 18.3%) for males and 15 to 19 minutes (45 commuters, 22.0%) for females.
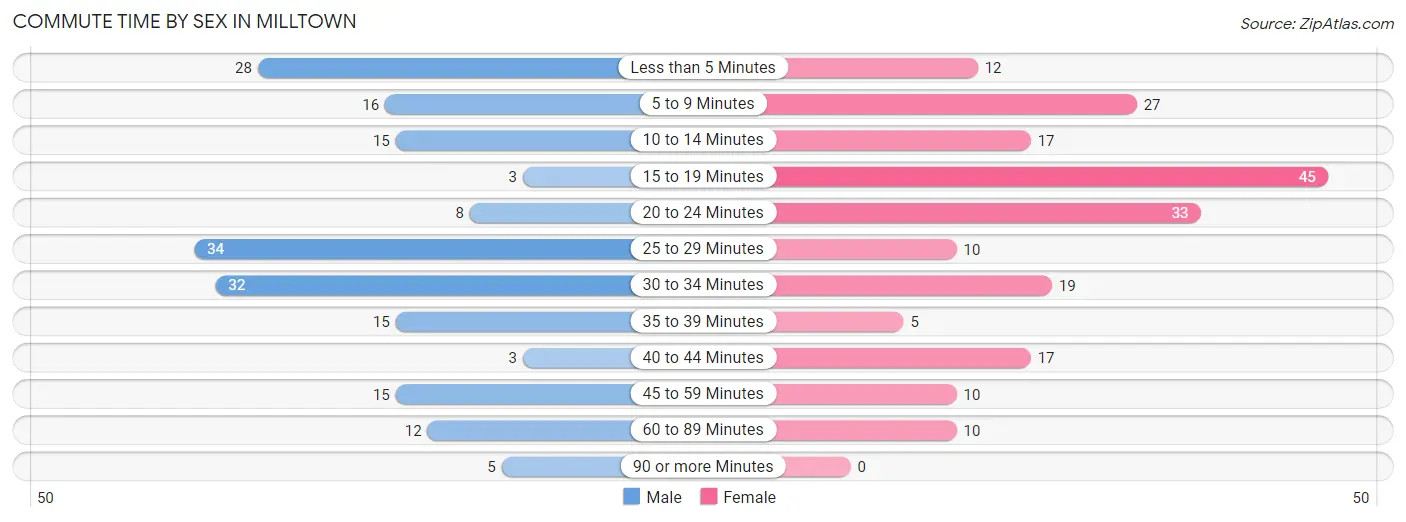
| Commute Time | Male | Female |
| Less than 5 Minutes | 28 (15.0%) | 12 (5.9%) |
| 5 to 9 Minutes | 16 (8.6%) | 27 (13.2%) |
| 10 to 14 Minutes | 15 (8.1%) | 17 (8.3%) |
| 15 to 19 Minutes | 3 (1.6%) | 45 (22.0%) |
| 20 to 24 Minutes | 8 (4.3%) | 33 (16.1%) |
| 25 to 29 Minutes | 34 (18.3%) | 10 (4.9%) |
| 30 to 34 Minutes | 32 (17.2%) | 19 (9.3%) |
| 35 to 39 Minutes | 15 (8.1%) | 5 (2.4%) |
| 40 to 44 Minutes | 3 (1.6%) | 17 (8.3%) |
| 45 to 59 Minutes | 15 (8.1%) | 10 (4.9%) |
| 60 to 89 Minutes | 12 (6.5%) | 10 (4.9%) |
| 90 or more Minutes | 5 (2.7%) | 0 (0.0%) |
Time of Departure to Work by Sex in Milltown
The most frequent times of departure to work in Milltown are 8:00 AM to 8:29 AM (32, 17.2%) for males and 5:00 AM to 5:29 AM (33, 16.1%) for females.
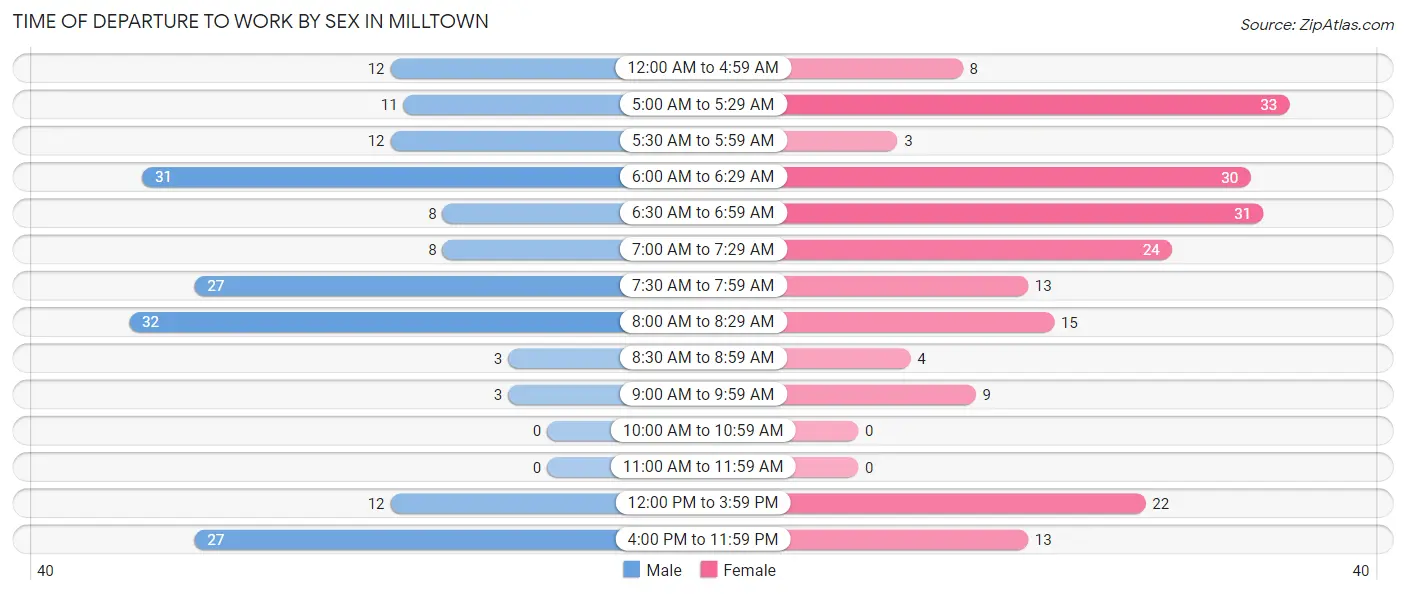
| Time of Departure | Male | Female |
| 12:00 AM to 4:59 AM | 12 (6.5%) | 8 (3.9%) |
| 5:00 AM to 5:29 AM | 11 (5.9%) | 33 (16.1%) |
| 5:30 AM to 5:59 AM | 12 (6.5%) | 3 (1.5%) |
| 6:00 AM to 6:29 AM | 31 (16.7%) | 30 (14.6%) |
| 6:30 AM to 6:59 AM | 8 (4.3%) | 31 (15.1%) |
| 7:00 AM to 7:29 AM | 8 (4.3%) | 24 (11.7%) |
| 7:30 AM to 7:59 AM | 27 (14.5%) | 13 (6.3%) |
| 8:00 AM to 8:29 AM | 32 (17.2%) | 15 (7.3%) |
| 8:30 AM to 8:59 AM | 3 (1.6%) | 4 (1.9%) |
| 9:00 AM to 9:59 AM | 3 (1.6%) | 9 (4.4%) |
| 10:00 AM to 10:59 AM | 0 (0.0%) | 0 (0.0%) |
| 11:00 AM to 11:59 AM | 0 (0.0%) | 0 (0.0%) |
| 12:00 PM to 3:59 PM | 12 (6.5%) | 22 (10.7%) |
| 4:00 PM to 11:59 PM | 27 (14.5%) | 13 (6.3%) |
| Total | 186 (100.0%) | 205 (100.0%) |
Housing Occupancy in Milltown
Occupancy by Ownership in Milltown
Of the total 424 dwellings in Milltown, owner-occupied units account for 274 (64.6%), while renter-occupied units make up 150 (35.4%).
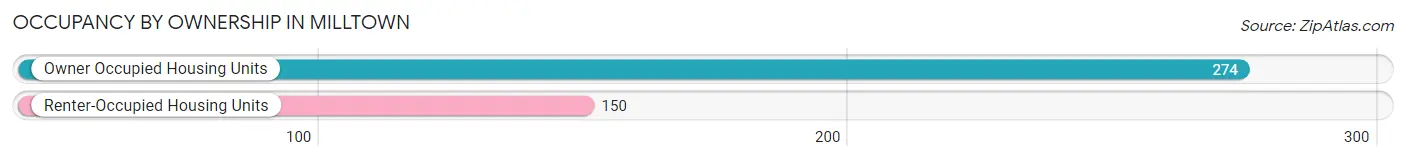
| Occupancy | # Housing Units | % Housing Units |
| Owner Occupied Housing Units | 274 | 64.6% |
| Renter-Occupied Housing Units | 150 | 35.4% |
| Total Occupied Housing Units | 424 | 100.0% |
Occupancy by Household Size in Milltown
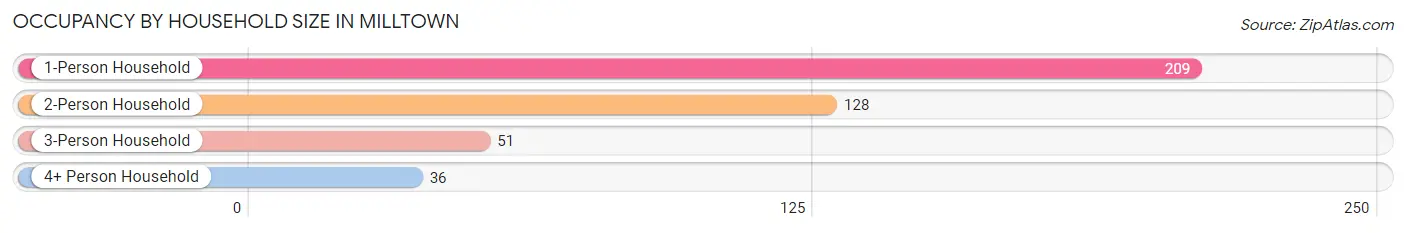
| Household Size | # Housing Units | % Housing Units |
| 1-Person Household | 209 | 49.3% |
| 2-Person Household | 128 | 30.2% |
| 3-Person Household | 51 | 12.0% |
| 4+ Person Household | 36 | 8.5% |
| Total Housing Units | 424 | 100.0% |
Occupancy by Ownership by Household Size in Milltown
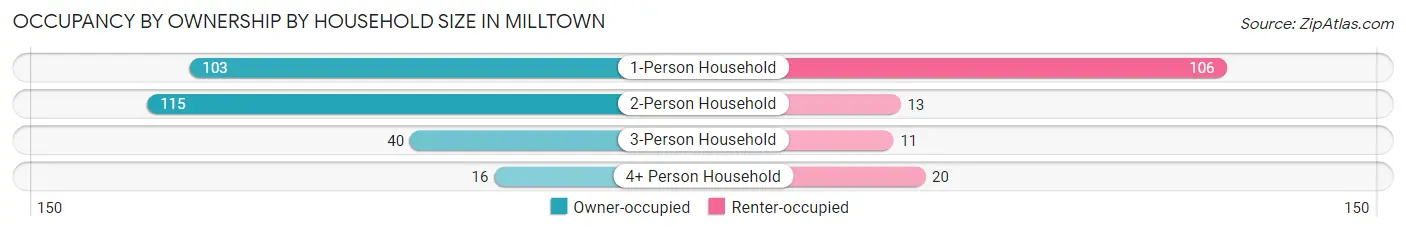
| Household Size | Owner-occupied | Renter-occupied |
| 1-Person Household | 103 (49.3%) | 106 (50.7%) |
| 2-Person Household | 115 (89.8%) | 13 (10.2%) |
| 3-Person Household | 40 (78.4%) | 11 (21.6%) |
| 4+ Person Household | 16 (44.4%) | 20 (55.6%) |
| Total Housing Units | 274 (64.6%) | 150 (35.4%) |
Occupancy by Educational Attainment in Milltown
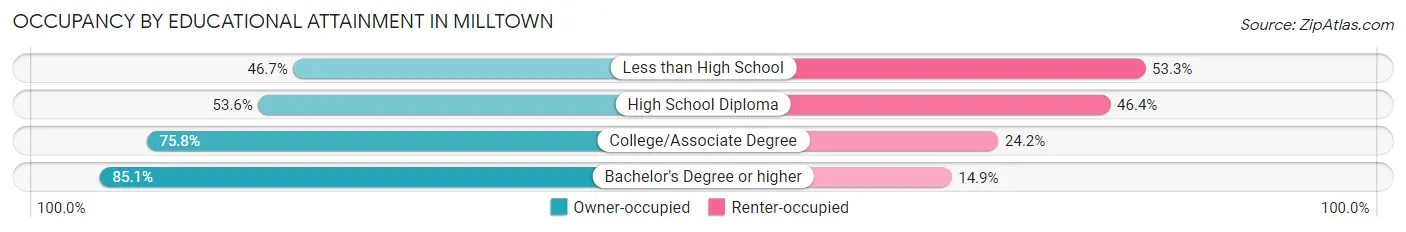
| Household Size | Owner-occupied | Renter-occupied |
| Less than High School | 14 (46.7%) | 16 (53.3%) |
| High School Diploma | 104 (53.6%) | 90 (46.4%) |
| College/Associate Degree | 116 (75.8%) | 37 (24.2%) |
| Bachelor's Degree or higher | 40 (85.1%) | 7 (14.9%) |
Occupancy by Age of Householder in Milltown
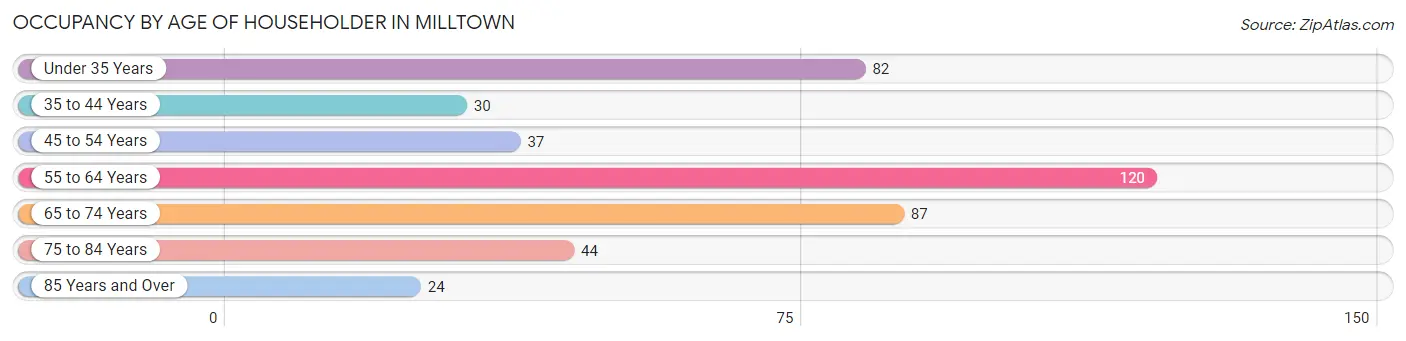
| Age Bracket | # Households | % Households |
| Under 35 Years | 82 | 19.3% |
| 35 to 44 Years | 30 | 7.1% |
| 45 to 54 Years | 37 | 8.7% |
| 55 to 64 Years | 120 | 28.3% |
| 65 to 74 Years | 87 | 20.5% |
| 75 to 84 Years | 44 | 10.4% |
| 85 Years and Over | 24 | 5.7% |
| Total | 424 | 100.0% |
Housing Finances in Milltown
Median Income by Occupancy in Milltown
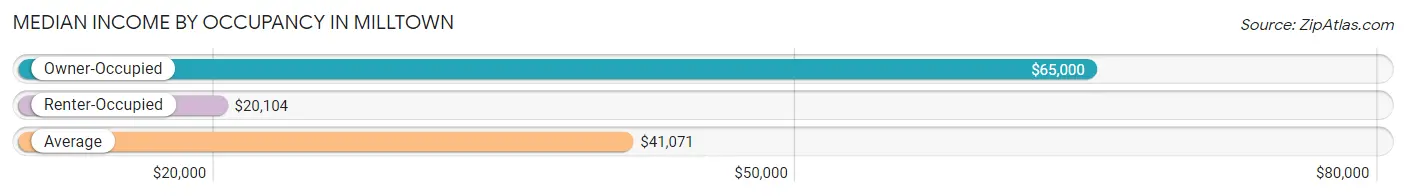
| Occupancy Type | # Households | Median Income |
| Owner-Occupied | 274 (64.6%) | $65,000 |
| Renter-Occupied | 150 (35.4%) | $20,104 |
| Average | 424 (100.0%) | $41,071 |
Occupancy by Householder Income Bracket in Milltown
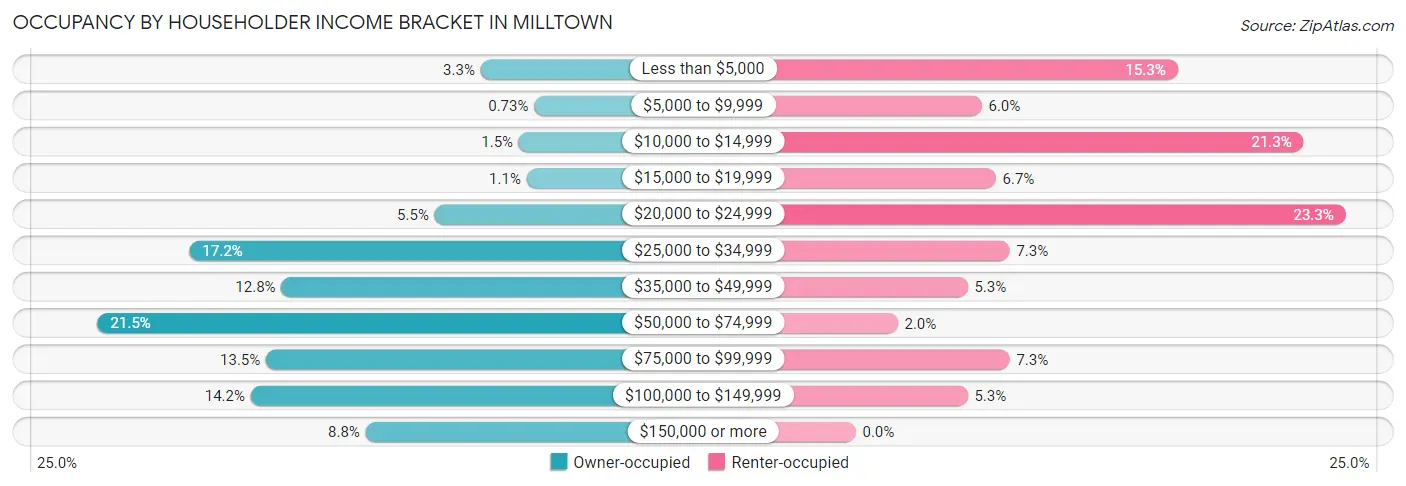
| Income Bracket | Owner-occupied | Renter-occupied |
| Less than $5,000 | 9 (3.3%) | 23 (15.3%) |
| $5,000 to $9,999 | 2 (0.7%) | 9 (6.0%) |
| $10,000 to $14,999 | 4 (1.5%) | 32 (21.3%) |
| $15,000 to $19,999 | 3 (1.1%) | 10 (6.7%) |
| $20,000 to $24,999 | 15 (5.5%) | 35 (23.3%) |
| $25,000 to $34,999 | 47 (17.2%) | 11 (7.3%) |
| $35,000 to $49,999 | 35 (12.8%) | 8 (5.3%) |
| $50,000 to $74,999 | 59 (21.5%) | 3 (2.0%) |
| $75,000 to $99,999 | 37 (13.5%) | 11 (7.3%) |
| $100,000 to $149,999 | 39 (14.2%) | 8 (5.3%) |
| $150,000 or more | 24 (8.8%) | 0 (0.0%) |
| Total | 274 (100.0%) | 150 (100.0%) |
Monthly Housing Cost Tiers in Milltown
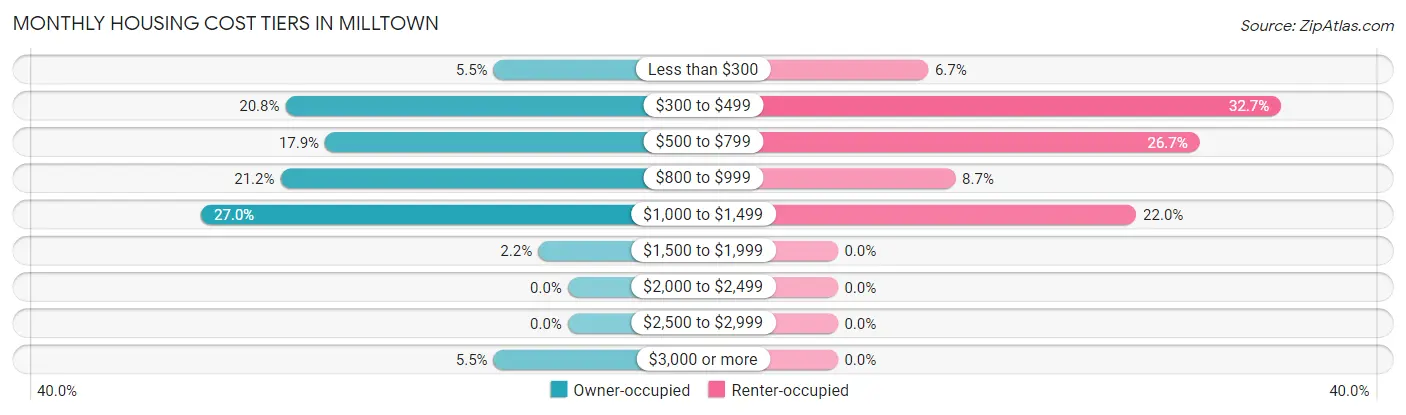
| Monthly Cost | Owner-occupied | Renter-occupied |
| Less than $300 | 15 (5.5%) | 10 (6.7%) |
| $300 to $499 | 57 (20.8%) | 49 (32.7%) |
| $500 to $799 | 49 (17.9%) | 40 (26.7%) |
| $800 to $999 | 58 (21.2%) | 13 (8.7%) |
| $1,000 to $1,499 | 74 (27.0%) | 33 (22.0%) |
| $1,500 to $1,999 | 6 (2.2%) | 0 (0.0%) |
| $2,000 to $2,499 | 0 (0.0%) | 0 (0.0%) |
| $2,500 to $2,999 | 0 (0.0%) | 0 (0.0%) |
| $3,000 or more | 15 (5.5%) | 0 (0.0%) |
| Total | 274 (100.0%) | 150 (100.0%) |
Physical Housing Characteristics in Milltown
Housing Structures in Milltown
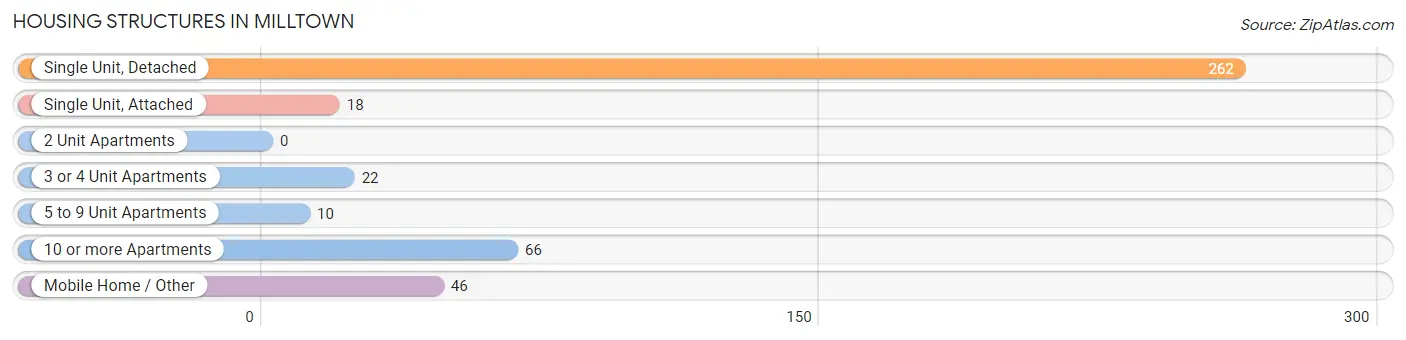
| Structure Type | # Housing Units | % Housing Units |
| Single Unit, Detached | 262 | 61.8% |
| Single Unit, Attached | 18 | 4.3% |
| 2 Unit Apartments | 0 | 0.0% |
| 3 or 4 Unit Apartments | 22 | 5.2% |
| 5 to 9 Unit Apartments | 10 | 2.4% |
| 10 or more Apartments | 66 | 15.6% |
| Mobile Home / Other | 46 | 10.8% |
| Total | 424 | 100.0% |
Housing Structures by Occupancy in Milltown
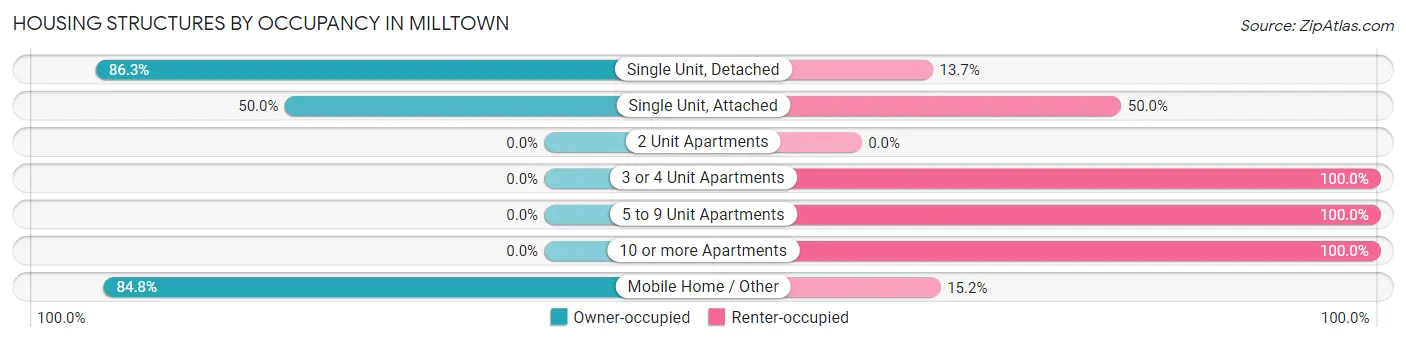
| Structure Type | Owner-occupied | Renter-occupied |
| Single Unit, Detached | 226 (86.3%) | 36 (13.7%) |
| Single Unit, Attached | 9 (50.0%) | 9 (50.0%) |
| 2 Unit Apartments | 0 (0.0%) | 0 (0.0%) |
| 3 or 4 Unit Apartments | 0 (0.0%) | 22 (100.0%) |
| 5 to 9 Unit Apartments | 0 (0.0%) | 10 (100.0%) |
| 10 or more Apartments | 0 (0.0%) | 66 (100.0%) |
| Mobile Home / Other | 39 (84.8%) | 7 (15.2%) |
| Total | 274 (64.6%) | 150 (35.4%) |
Housing Structures by Number of Rooms in Milltown
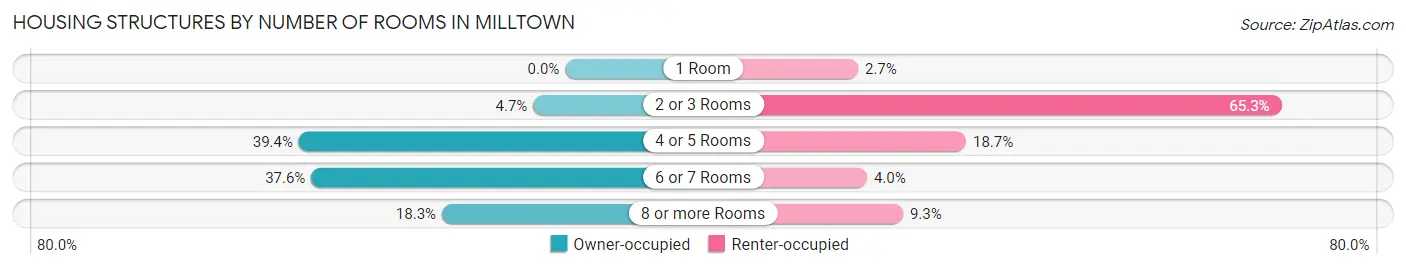
| Number of Rooms | Owner-occupied | Renter-occupied |
| 1 Room | 0 (0.0%) | 4 (2.7%) |
| 2 or 3 Rooms | 13 (4.7%) | 98 (65.3%) |
| 4 or 5 Rooms | 108 (39.4%) | 28 (18.7%) |
| 6 or 7 Rooms | 103 (37.6%) | 6 (4.0%) |
| 8 or more Rooms | 50 (18.2%) | 14 (9.3%) |
| Total | 274 (100.0%) | 150 (100.0%) |
Housing Structure by Heating Type in Milltown
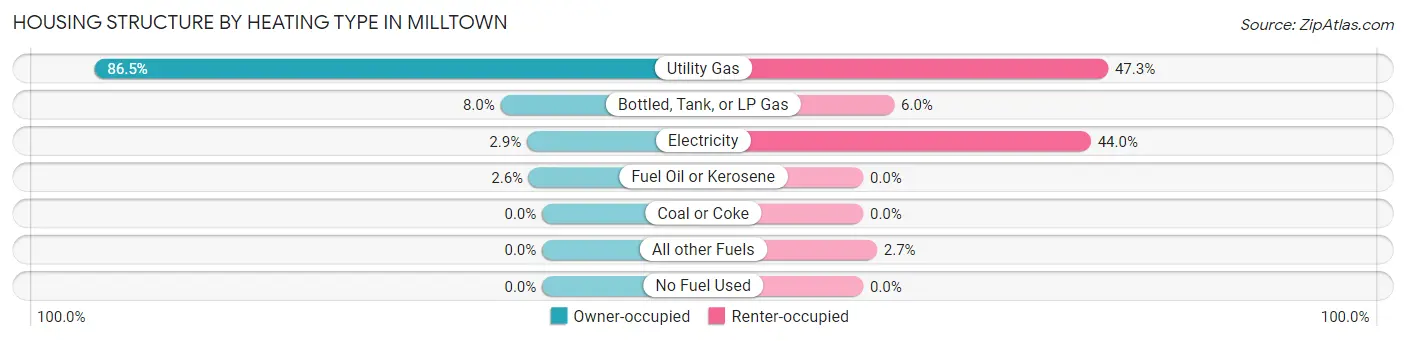
| Heating Type | Owner-occupied | Renter-occupied |
| Utility Gas | 237 (86.5%) | 71 (47.3%) |
| Bottled, Tank, or LP Gas | 22 (8.0%) | 9 (6.0%) |
| Electricity | 8 (2.9%) | 66 (44.0%) |
| Fuel Oil or Kerosene | 7 (2.5%) | 0 (0.0%) |
| Coal or Coke | 0 (0.0%) | 0 (0.0%) |
| All other Fuels | 0 (0.0%) | 4 (2.7%) |
| No Fuel Used | 0 (0.0%) | 0 (0.0%) |
| Total | 274 (100.0%) | 150 (100.0%) |
Household Vehicle Usage in Milltown
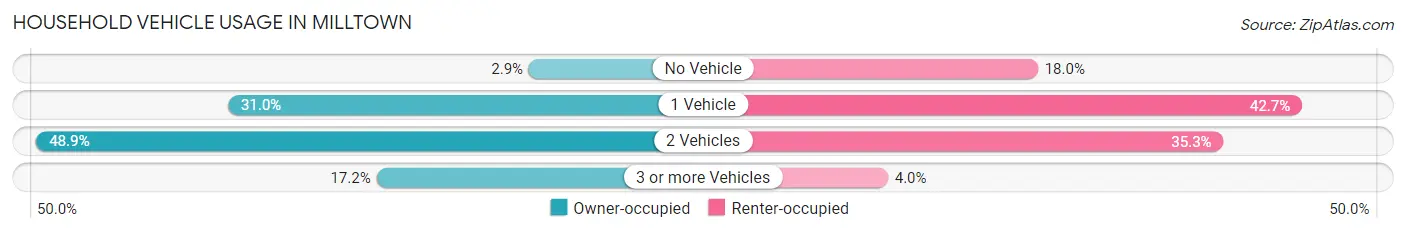
| Vehicles per Household | Owner-occupied | Renter-occupied |
| No Vehicle | 8 (2.9%) | 27 (18.0%) |
| 1 Vehicle | 85 (31.0%) | 64 (42.7%) |
| 2 Vehicles | 134 (48.9%) | 53 (35.3%) |
| 3 or more Vehicles | 47 (17.2%) | 6 (4.0%) |
| Total | 274 (100.0%) | 150 (100.0%) |
Real Estate & Mortgages in Milltown
Real Estate and Mortgage Overview in Milltown
| Characteristic | Without Mortgage | With Mortgage |
| Housing Units | 100 | 174 |
| Median Property Value | $101,900 | $113,800 |
| Median Household Income | $38,333 | $22 |
| Monthly Housing Costs | $437 | $15 |
| Real Estate Taxes | $2,000 | $0 |
Property Value by Mortgage Status in Milltown
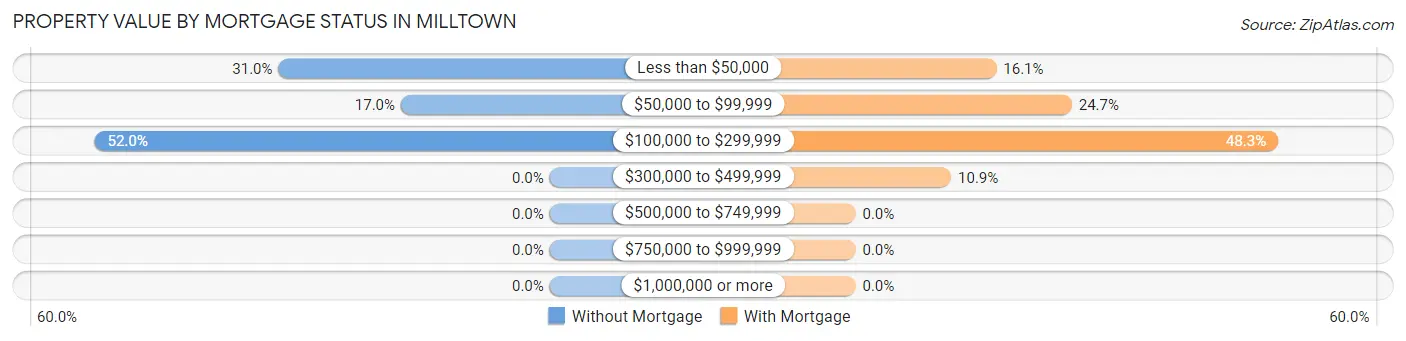
| Property Value | Without Mortgage | With Mortgage |
| Less than $50,000 | 31 (31.0%) | 28 (16.1%) |
| $50,000 to $99,999 | 17 (17.0%) | 43 (24.7%) |
| $100,000 to $299,999 | 52 (52.0%) | 84 (48.3%) |
| $300,000 to $499,999 | 0 (0.0%) | 19 (10.9%) |
| $500,000 to $749,999 | 0 (0.0%) | 0 (0.0%) |
| $750,000 to $999,999 | 0 (0.0%) | 0 (0.0%) |
| $1,000,000 or more | 0 (0.0%) | 0 (0.0%) |
| Total | 100 (100.0%) | 174 (100.0%) |
Household Income by Mortgage Status in Milltown
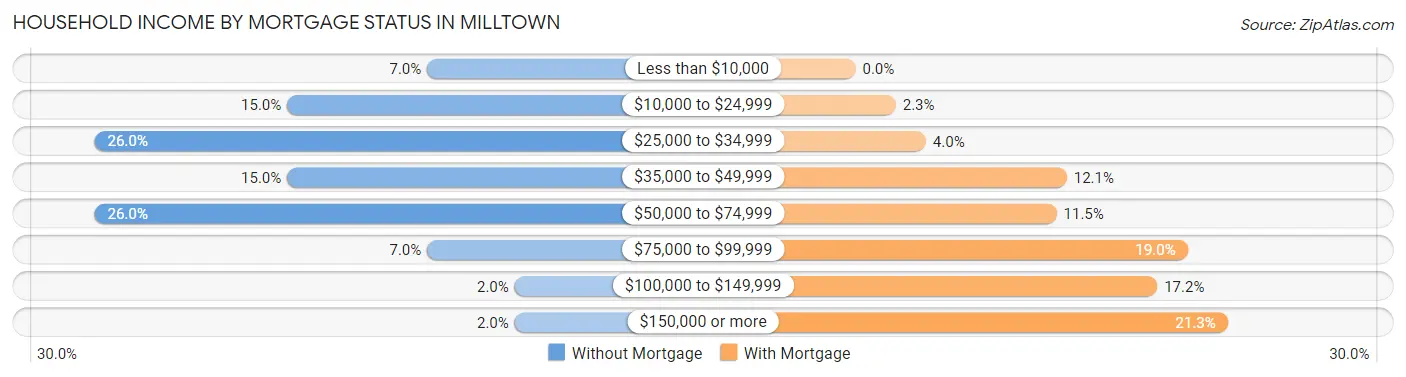
| Household Income | Without Mortgage | With Mortgage |
| Less than $10,000 | 7 (7.0%) | 0 (0.0%) |
| $10,000 to $24,999 | 15 (15.0%) | 4 (2.3%) |
| $25,000 to $34,999 | 26 (26.0%) | 7 (4.0%) |
| $35,000 to $49,999 | 15 (15.0%) | 21 (12.1%) |
| $50,000 to $74,999 | 26 (26.0%) | 20 (11.5%) |
| $75,000 to $99,999 | 7 (7.0%) | 33 (19.0%) |
| $100,000 to $149,999 | 2 (2.0%) | 30 (17.2%) |
| $150,000 or more | 2 (2.0%) | 37 (21.3%) |
| Total | 100 (100.0%) | 174 (100.0%) |
Property Value to Household Income Ratio in Milltown
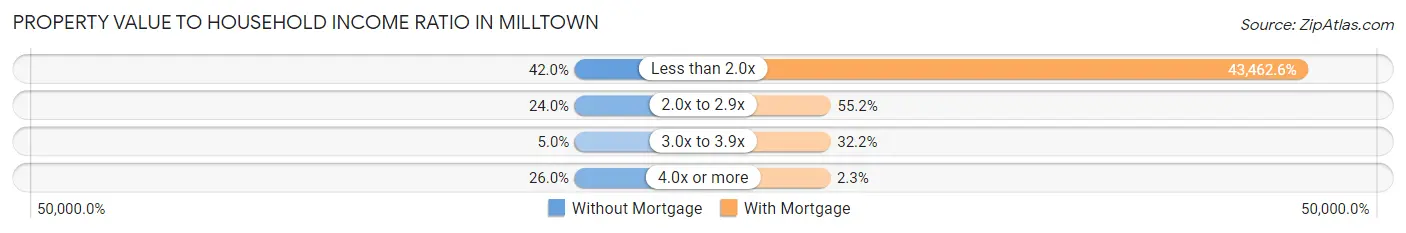
| Value-to-Income Ratio | Without Mortgage | With Mortgage |
| Less than 2.0x | 42 (42.0%) | 75,625 (43,462.6%) |
| 2.0x to 2.9x | 24 (24.0%) | 96 (55.2%) |
| 3.0x to 3.9x | 5 (5.0%) | 56 (32.2%) |
| 4.0x or more | 26 (26.0%) | 4 (2.3%) |
| Total | 100 (100.0%) | 174 (100.0%) |
Real Estate Taxes by Mortgage Status in Milltown
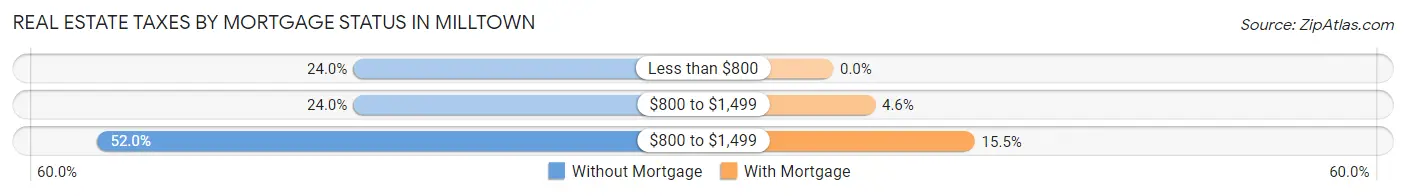
| Property Taxes | Without Mortgage | With Mortgage |
| Less than $800 | 24 (24.0%) | 0 (0.0%) |
| $800 to $1,499 | 24 (24.0%) | 8 (4.6%) |
| $800 to $1,499 | 52 (52.0%) | 27 (15.5%) |
| Total | 100 (100.0%) | 174 (100.0%) |
Health & Disability in Milltown
Health Insurance Coverage by Age in Milltown
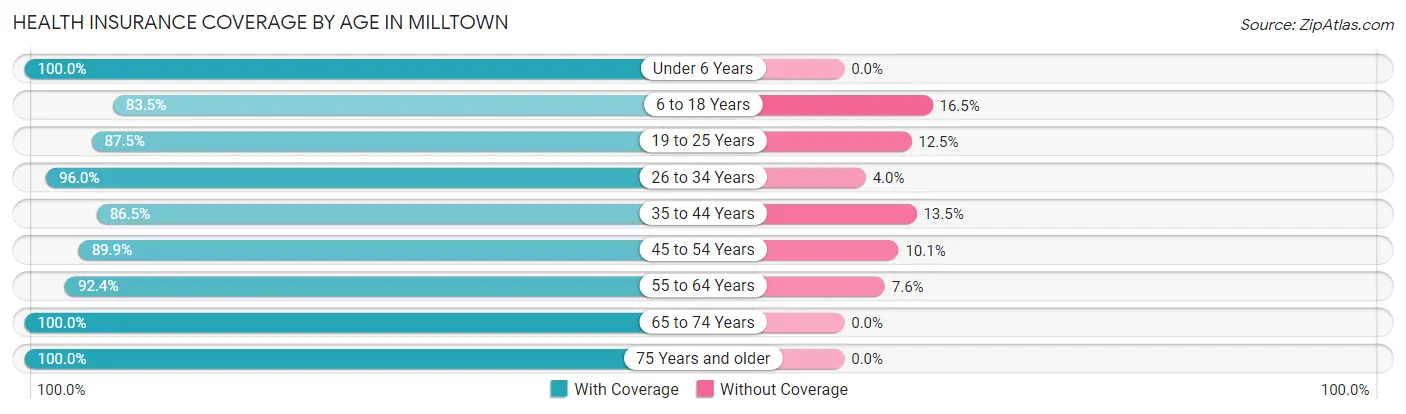
| Age Bracket | With Coverage | Without Coverage |
| Under 6 Years | 26 (100.0%) | 0 (0.0%) |
| 6 to 18 Years | 66 (83.5%) | 13 (16.5%) |
| 19 to 25 Years | 35 (87.5%) | 5 (12.5%) |
| 26 to 34 Years | 144 (96.0%) | 6 (4.0%) |
| 35 to 44 Years | 45 (86.5%) | 7 (13.5%) |
| 45 to 54 Years | 89 (89.9%) | 10 (10.1%) |
| 55 to 64 Years | 159 (92.4%) | 13 (7.6%) |
| 65 to 74 Years | 116 (100.0%) | 0 (0.0%) |
| 75 Years and older | 75 (100.0%) | 0 (0.0%) |
| Total | 755 (93.3%) | 54 (6.7%) |
Health Insurance Coverage by Citizenship Status in Milltown
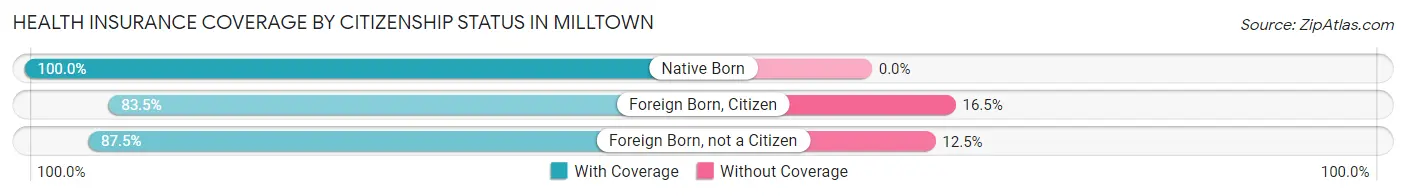
| Citizenship Status | With Coverage | Without Coverage |
| Native Born | 26 (100.0%) | 0 (0.0%) |
| Foreign Born, Citizen | 66 (83.5%) | 13 (16.5%) |
| Foreign Born, not a Citizen | 35 (87.5%) | 5 (12.5%) |
Health Insurance Coverage by Household Income in Milltown
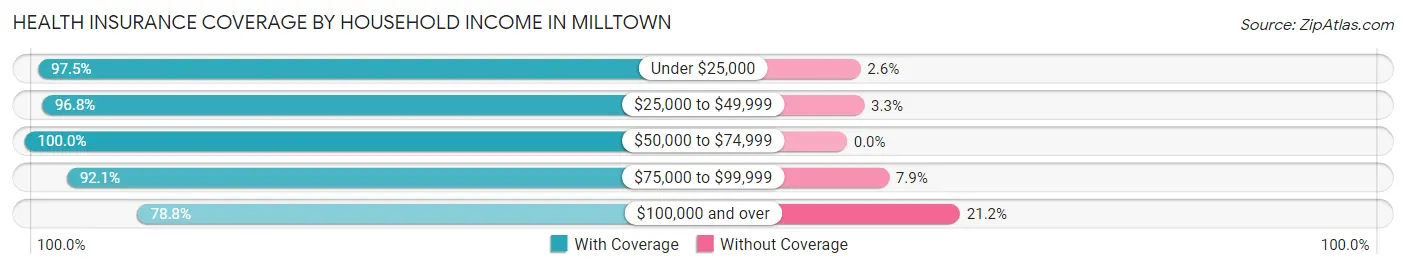
| Household Income | With Coverage | Without Coverage |
| Under $25,000 | 191 (97.5%) | 5 (2.5%) |
| $25,000 to $49,999 | 119 (96.8%) | 4 (3.3%) |
| $50,000 to $74,999 | 200 (100.0%) | 0 (0.0%) |
| $75,000 to $99,999 | 105 (92.1%) | 9 (7.9%) |
| $100,000 and over | 134 (78.8%) | 36 (21.2%) |
Public vs Private Health Insurance Coverage by Age in Milltown
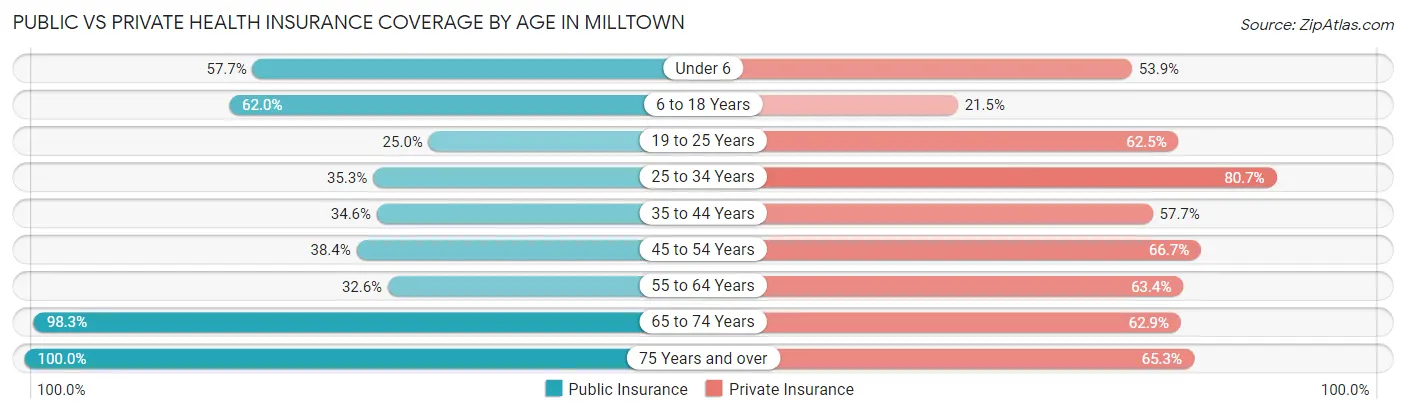
| Age Bracket | Public Insurance | Private Insurance |
| Under 6 | 15 (57.7%) | 14 (53.8%) |
| 6 to 18 Years | 49 (62.0%) | 17 (21.5%) |
| 19 to 25 Years | 10 (25.0%) | 25 (62.5%) |
| 25 to 34 Years | 53 (35.3%) | 121 (80.7%) |
| 35 to 44 Years | 18 (34.6%) | 30 (57.7%) |
| 45 to 54 Years | 38 (38.4%) | 66 (66.7%) |
| 55 to 64 Years | 56 (32.6%) | 109 (63.4%) |
| 65 to 74 Years | 114 (98.3%) | 73 (62.9%) |
| 75 Years and over | 75 (100.0%) | 49 (65.3%) |
| Total | 428 (52.9%) | 504 (62.3%) |
Disability Status by Sex by Age in Milltown
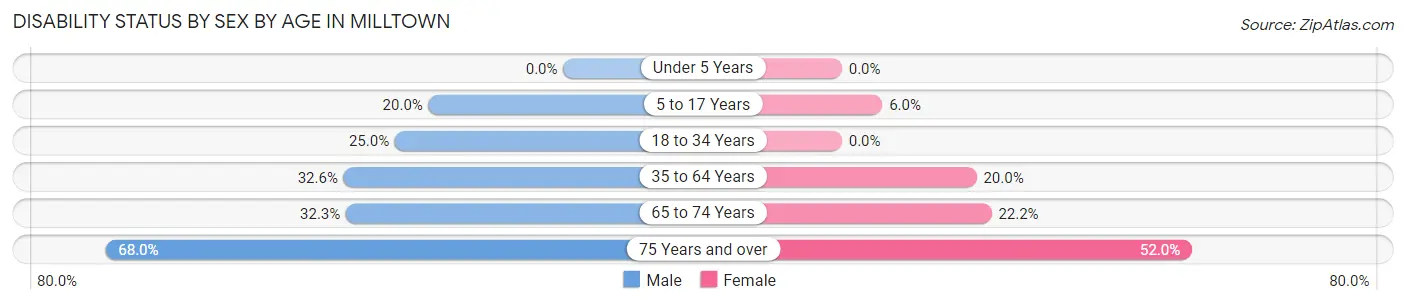
| Age Bracket | Male | Female |
| Under 5 Years | 0 (0.0%) | 0 (0.0%) |
| 5 to 17 Years | 4 (20.0%) | 3 (6.0%) |
| 18 to 34 Years | 24 (25.0%) | 0 (0.0%) |
| 35 to 64 Years | 45 (32.6%) | 37 (20.0%) |
| 65 to 74 Years | 20 (32.3%) | 12 (22.2%) |
| 75 Years and over | 17 (68.0%) | 26 (52.0%) |
Disability Class by Sex by Age in Milltown
Disability Class: Hearing Difficulty
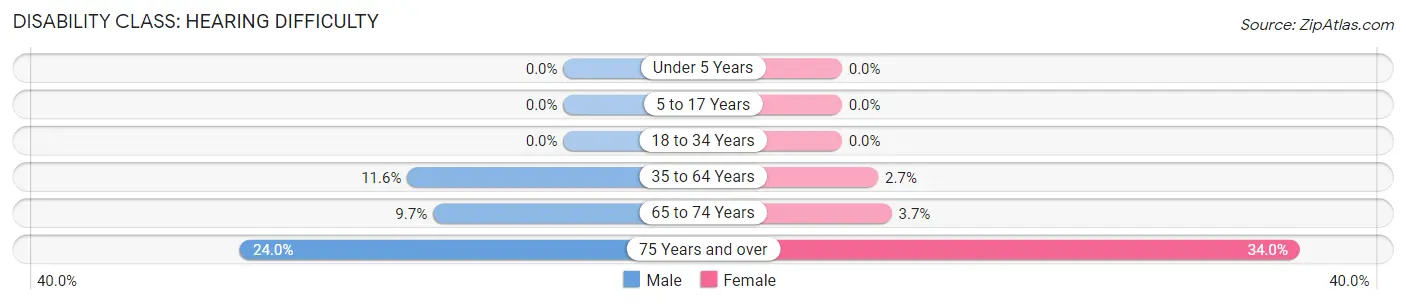
| Age Bracket | Male | Female |
| Under 5 Years | 0 (0.0%) | 0 (0.0%) |
| 5 to 17 Years | 0 (0.0%) | 0 (0.0%) |
| 18 to 34 Years | 0 (0.0%) | 0 (0.0%) |
| 35 to 64 Years | 16 (11.6%) | 5 (2.7%) |
| 65 to 74 Years | 6 (9.7%) | 2 (3.7%) |
| 75 Years and over | 6 (24.0%) | 17 (34.0%) |
Disability Class: Vision Difficulty
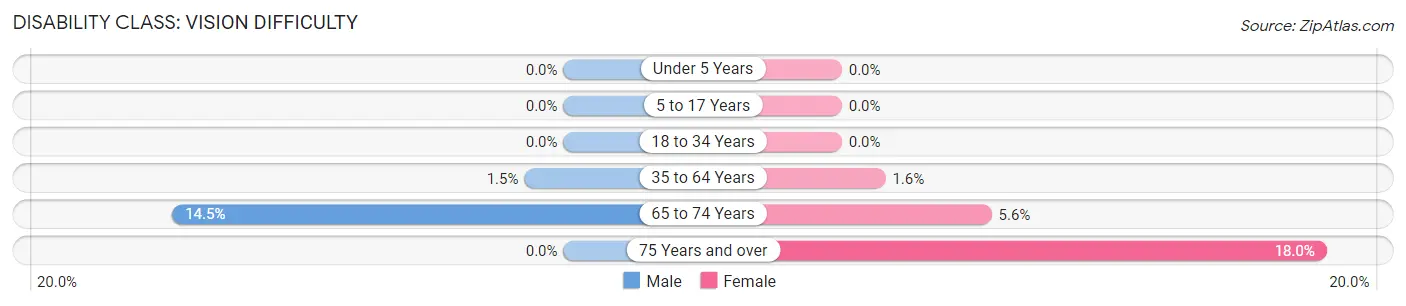
| Age Bracket | Male | Female |
| Under 5 Years | 0 (0.0%) | 0 (0.0%) |
| 5 to 17 Years | 0 (0.0%) | 0 (0.0%) |
| 18 to 34 Years | 0 (0.0%) | 0 (0.0%) |
| 35 to 64 Years | 2 (1.5%) | 3 (1.6%) |
| 65 to 74 Years | 9 (14.5%) | 3 (5.6%) |
| 75 Years and over | 0 (0.0%) | 9 (18.0%) |
Disability Class: Cognitive Difficulty
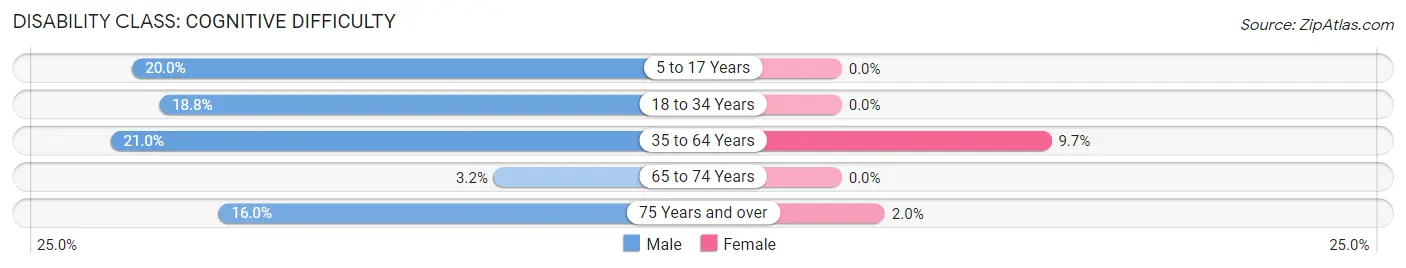
| Age Bracket | Male | Female |
| 5 to 17 Years | 4 (20.0%) | 0 (0.0%) |
| 18 to 34 Years | 18 (18.8%) | 0 (0.0%) |
| 35 to 64 Years | 29 (21.0%) | 18 (9.7%) |
| 65 to 74 Years | 2 (3.2%) | 0 (0.0%) |
| 75 Years and over | 4 (16.0%) | 1 (2.0%) |
Disability Class: Ambulatory Difficulty
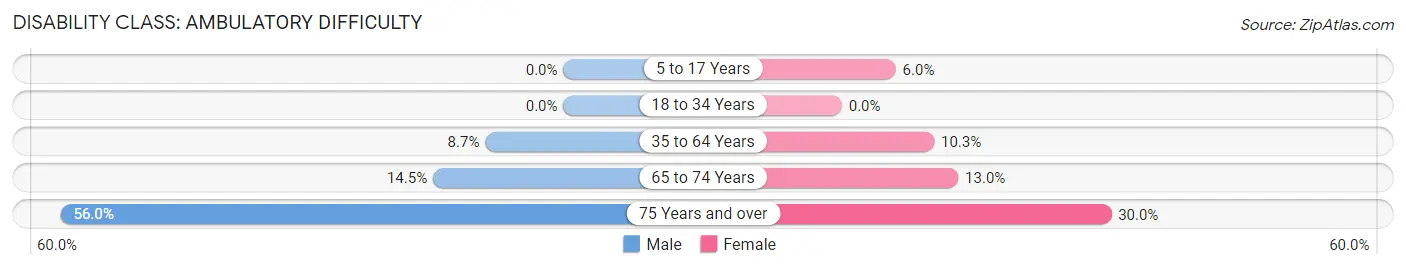
| Age Bracket | Male | Female |
| 5 to 17 Years | 0 (0.0%) | 3 (6.0%) |
| 18 to 34 Years | 0 (0.0%) | 0 (0.0%) |
| 35 to 64 Years | 12 (8.7%) | 19 (10.3%) |
| 65 to 74 Years | 9 (14.5%) | 7 (13.0%) |
| 75 Years and over | 14 (56.0%) | 15 (30.0%) |
Disability Class: Self-Care Difficulty
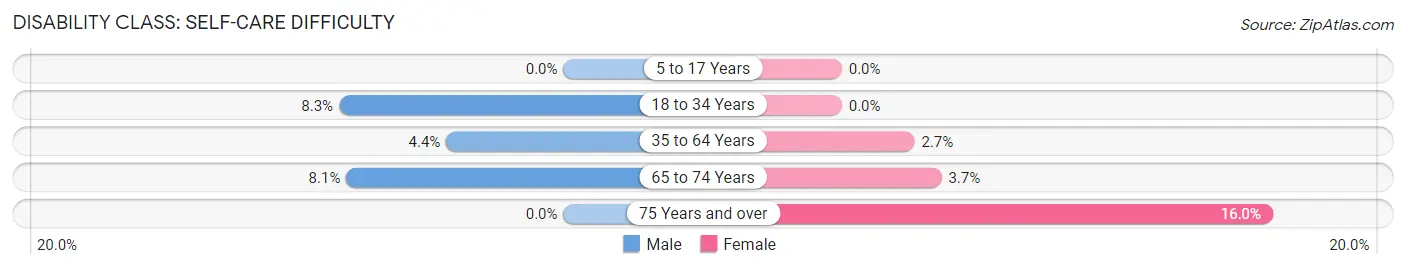
| Age Bracket | Male | Female |
| 5 to 17 Years | 0 (0.0%) | 0 (0.0%) |
| 18 to 34 Years | 8 (8.3%) | 0 (0.0%) |
| 35 to 64 Years | 6 (4.3%) | 5 (2.7%) |
| 65 to 74 Years | 5 (8.1%) | 2 (3.7%) |
| 75 Years and over | 0 (0.0%) | 8 (16.0%) |
Technology Access in Milltown
Computing Device Access in Milltown
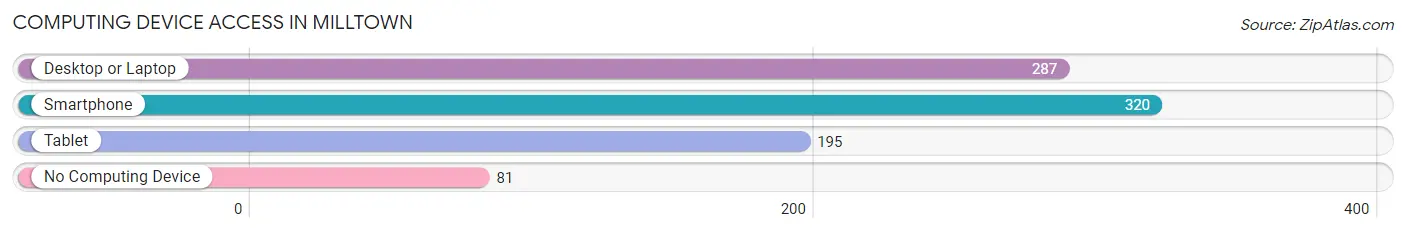
| Device Type | # Households | % Households |
| Desktop or Laptop | 287 | 67.7% |
| Smartphone | 320 | 75.5% |
| Tablet | 195 | 46.0% |
| No Computing Device | 81 | 19.1% |
| Total | 424 | 100.0% |
Internet Access in Milltown
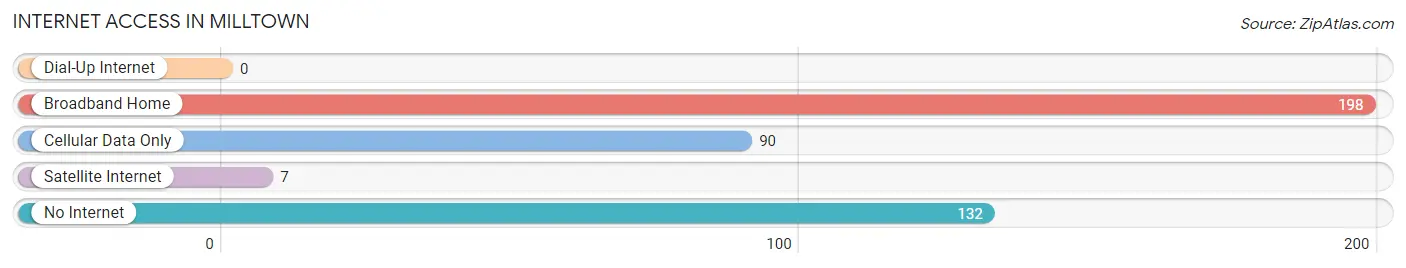
| Internet Type | # Households | % Households |
| Dial-Up Internet | 0 | 0.0% |
| Broadband Home | 198 | 46.7% |
| Cellular Data Only | 90 | 21.2% |
| Satellite Internet | 7 | 1.7% |
| No Internet | 132 | 31.1% |
| Total | 424 | 100.0% |
Milltown Summary
Town History
The small town of Milltown, Wisconsin is located in the western part of the state, in the county of Dunn. It was founded in 1856 by a group of settlers from the nearby town of Menomonie. The settlers were looking for a place to build a mill, and they chose the area around Milltown because of its abundance of water and timber. The first mill was built in 1858, and it was used to grind wheat and corn. The mill was a success, and soon other businesses began to spring up in the area.
The town grew steadily over the years, and by the early 1900s it had become a thriving community. The town was home to several businesses, including a general store, a blacksmith, a sawmill, and a cheese factory. The town also had a school, a post office, and a church.
In the 1920s, the town began to decline as the lumber industry moved away from the area. The mill closed in the 1930s, and the town’s population began to dwindle. However, the town was able to survive due to its strong agricultural base.
Today, Milltown is a small, rural community with a population of just over 500 people. The town is still home to several businesses, including a grocery store, a hardware store, and a restaurant. The town also has a post office, a library, and a fire station.
Geography
Milltown is located in the western part of Wisconsin, in the county of Dunn. The town is situated on the banks of the Red Cedar River, which flows through the area. The town is surrounded by rolling hills and farmland, and is located about 25 miles from the city of Menomonie.
The town has a total area of 1.2 square miles, all of which is land. The town has a humid continental climate, with cold winters and hot summers. The average temperature in the winter is around 20 degrees Fahrenheit, and the average temperature in the summer is around 75 degrees Fahrenheit.
Economy
Milltown’s economy is largely based on agriculture. The town is home to several farms, which produce a variety of crops, including corn, soybeans, and hay. The town also has a few small businesses, including a grocery store, a hardware store, and a restaurant.
The town is also home to a few manufacturing companies, which produce a variety of products, including furniture, clothing, and electronics. The town also has a few small service businesses, such as auto repair shops and hair salons.
Demographics
As of the 2010 census, the population of Milltown was 514 people. The town has a median age of 44.7 years, and the median household income is $45,000. The town is predominantly white, with 94.3% of the population identifying as such. The town also has a small Hispanic population, with 4.3% of the population identifying as Hispanic or Latino.
Conclusion
Milltown, Wisconsin is a small, rural community located in the western part of the state. The town was founded in 1856, and it has a long history of being a thriving agricultural community. The town has a population of just over 500 people, and its economy is largely based on agriculture. The town also has a few small businesses, and a few manufacturing companies. The town is predominantly white, with 94.3% of the population identifying as such.
Common Questions
What is Per Capita Income in Milltown?
Per Capita income in Milltown is $30,073.
What is the Median Family Income in Milltown?
Median Family Income in Milltown is $72,396.
What is the Median Household income in Milltown?
Median Household Income in Milltown is $41,071.
What is Income or Wage Gap in Milltown?
Income or Wage Gap in Milltown is 34.2%.
Women in Milltown earn 65.8 cents for every dollar earned by a man.
What is Family Income Deficit in Milltown?
Family Income Deficit in Milltown is $17,433.
Families that are below poverty line in Milltown earn $17,433 less on average than the poverty threshold level.
What is Inequality or Gini Index in Milltown?
Inequality or Gini Index in Milltown is 0.45.
What is the Total Population of Milltown?
Total Population of Milltown is 809.
What is the Total Male Population of Milltown?
Total Male Population of Milltown is 353.
What is the Total Female Population of Milltown?
Total Female Population of Milltown is 456.
What is the Ratio of Males per 100 Females in Milltown?
There are 77.41 Males per 100 Females in Milltown.
What is the Ratio of Females per 100 Males in Milltown?
There are 129.18 Females per 100 Males in Milltown.
What is the Median Population Age in Milltown?
Median Population Age in Milltown is 52.5 Years.
What is the Average Family Size in Milltown
Average Family Size in Milltown is 2.7 People.
What is the Average Household Size in Milltown
Average Household Size in Milltown is 1.9 People.
How Large is the Labor Force in Milltown?
There are 434 People in the Labor Forcein in Milltown.
What is the Percentage of People in the Labor Force in Milltown?
60.4% of People are in the Labor Force in Milltown.
What is the Unemployment Rate in Milltown?
Unemployment Rate in Milltown is 3.9%.