Grapeview, WA Map & Demographics
Grapeview Map
Grapeview Overview
$51,323
PER CAPITA INCOME
$109,870
AVG FAMILY INCOME
$108,539
AVG HOUSEHOLD INCOME
0.37
INEQUALITY / GINI INDEX
1,128
TOTAL POPULATION
667
MALE POPULATION
461
FEMALE POPULATION
144.69
MALES / 100 FEMALES
69.12
FEMALES / 100 MALES
59.2
MEDIAN AGE
2.8
AVG FAMILY SIZE
2.4
AVG HOUSEHOLD SIZE
550
LABOR FORCE [ PEOPLE ]
64.8%
PERCENT IN LABOR FORCE
Grapeview Zip Codes
Income in Grapeview
Income Overview in Grapeview
Per Capita Income in Grapeview is $51,323, while median incomes of families and households are $109,870 and $108,539 respectively.
| Characteristic | Number | Measure |
| Per Capita Income | 1,128 | $51,323 |
| Median Family Income | 370 | $109,870 |
| Mean Family Income | 370 | $146,563 |
| Median Household Income | 472 | $108,539 |
| Mean Household Income | 472 | $125,578 |
| Income Deficit | 370 | $0 |
| Wage / Income Gap (%) | 1,128 | 0.00% |
| Wage / Income Gap ($) | 1,128 | 100.00¢ per $1 |
| Gini / Inequality Index | 1,128 | 0.37 |
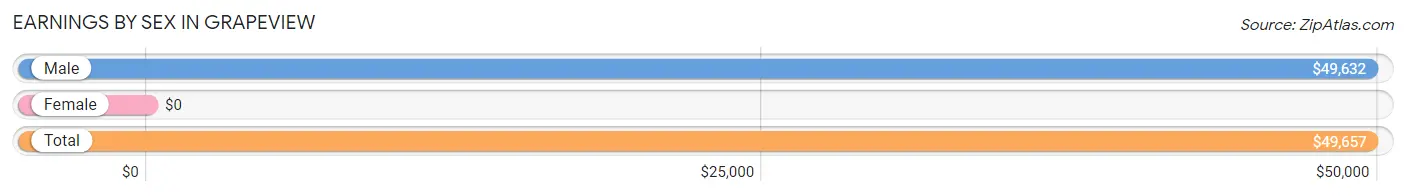
Earnings by Sex in Grapeview
| Sex | Number | Average Earnings |
| Male | 245 (43.9%) | $49,632 |
| Female | 313 (56.1%) | $0 |
| Total | 558 (100.0%) | $49,657 |
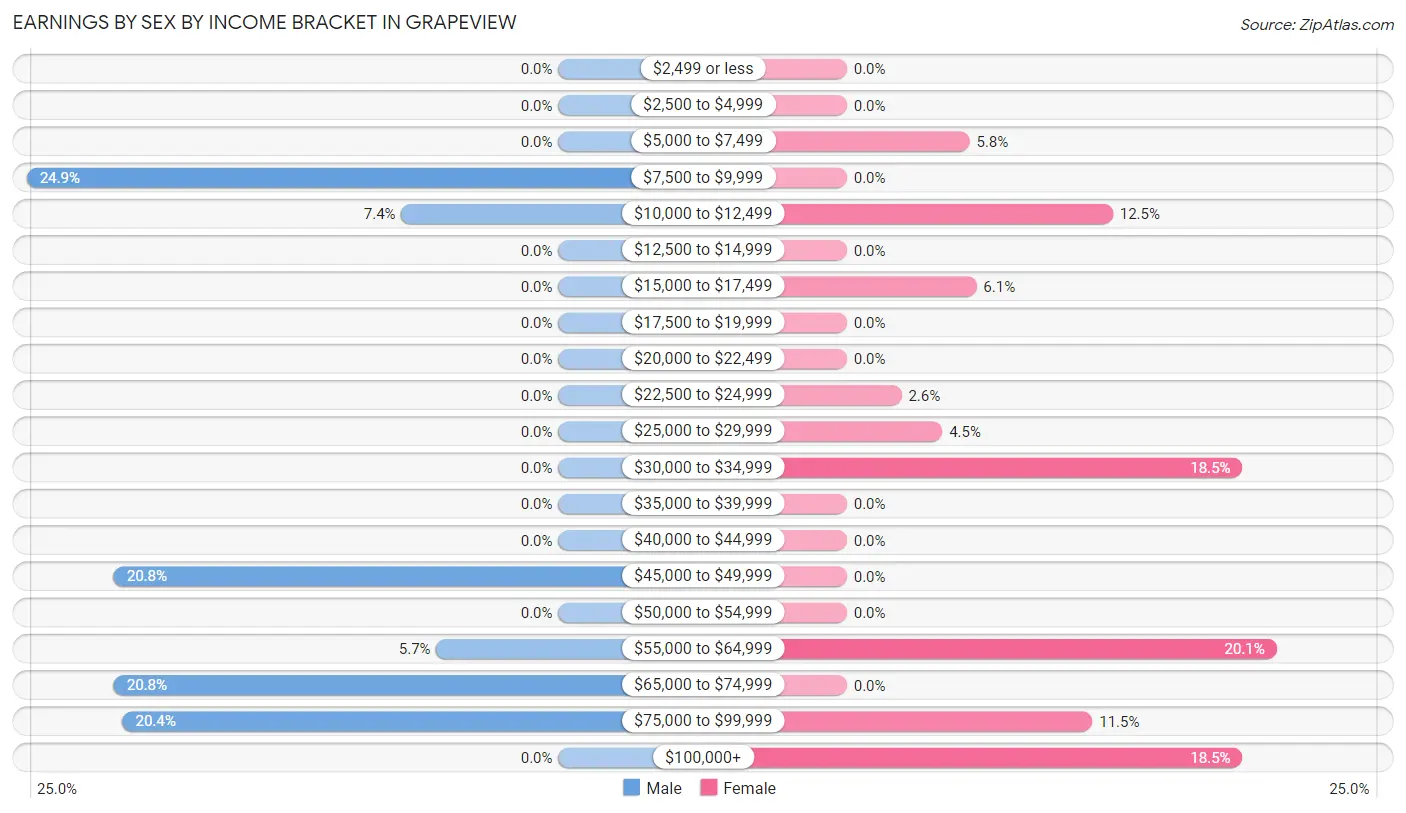
Earnings by Sex by Income Bracket in Grapeview
The most common earnings brackets in Grapeview are $7,500 to $9,999 for men (61 | 24.9%) and $55,000 to $64,999 for women (63 | 20.1%).
| Income | Male | Female |
| $2,499 or less | 0 (0.0%) | 0 (0.0%) |
| $2,500 to $4,999 | 0 (0.0%) | 0 (0.0%) |
| $5,000 to $7,499 | 0 (0.0%) | 18 (5.8%) |
| $7,500 to $9,999 | 61 (24.9%) | 0 (0.0%) |
| $10,000 to $12,499 | 18 (7.3%) | 39 (12.5%) |
| $12,500 to $14,999 | 0 (0.0%) | 0 (0.0%) |
| $15,000 to $17,499 | 0 (0.0%) | 19 (6.1%) |
| $17,500 to $19,999 | 0 (0.0%) | 0 (0.0%) |
| $20,000 to $22,499 | 0 (0.0%) | 0 (0.0%) |
| $22,500 to $24,999 | 0 (0.0%) | 8 (2.6%) |
| $25,000 to $29,999 | 0 (0.0%) | 14 (4.5%) |
| $30,000 to $34,999 | 0 (0.0%) | 58 (18.5%) |
| $35,000 to $39,999 | 0 (0.0%) | 0 (0.0%) |
| $40,000 to $44,999 | 0 (0.0%) | 0 (0.0%) |
| $45,000 to $49,999 | 51 (20.8%) | 0 (0.0%) |
| $50,000 to $54,999 | 0 (0.0%) | 0 (0.0%) |
| $55,000 to $64,999 | 14 (5.7%) | 63 (20.1%) |
| $65,000 to $74,999 | 51 (20.8%) | 0 (0.0%) |
| $75,000 to $99,999 | 50 (20.4%) | 36 (11.5%) |
| $100,000+ | 0 (0.0%) | 58 (18.5%) |
| Total | 245 (100.0%) | 313 (100.0%) |
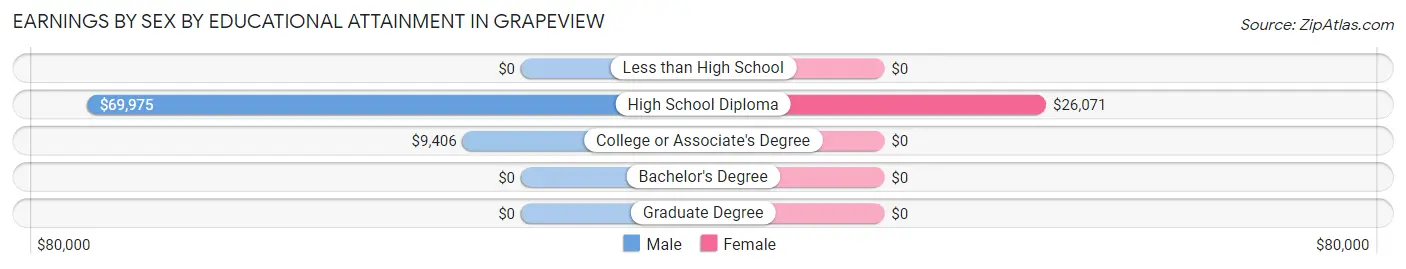
Earnings by Sex by Educational Attainment in Grapeview
| Educational Attainment | Male Income | Female Income |
| Less than High School | - | - |
| High School Diploma | $69,975 | $26,071 |
| College or Associate's Degree | $9,406 | $0 |
| Bachelor's Degree | - | - |
| Graduate Degree | - | - |
| Total | $49,632 | $0 |
Family Income in Grapeview
Family Income Brackets in Grapeview
According to the Grapeview family income data, there are 181 families falling into the $100,000 to $149,999 income range, which is the most common income bracket and makes up 48.9% of all families.
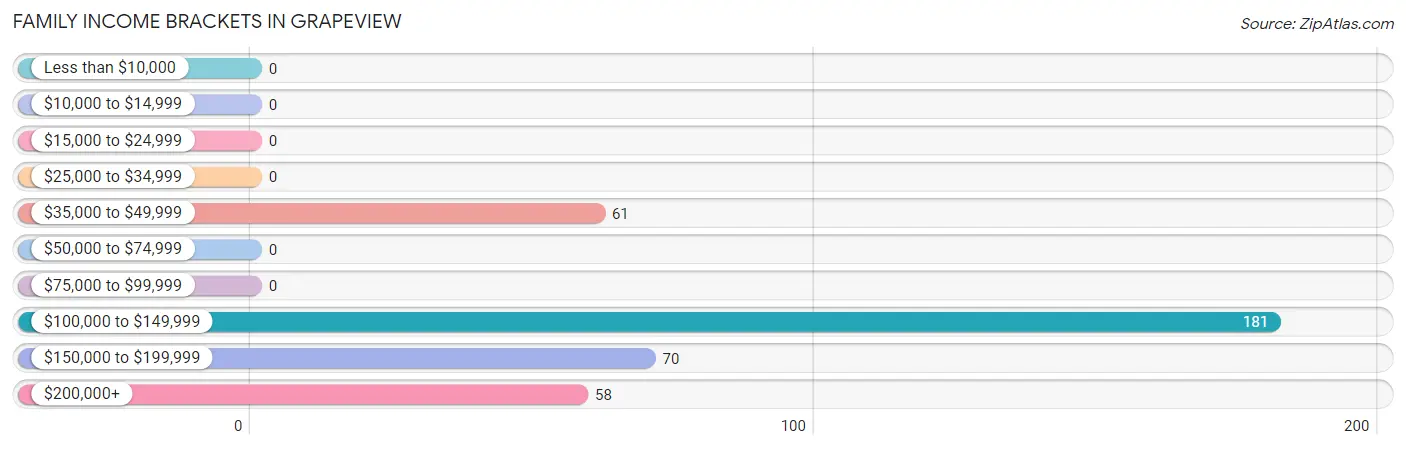
| Income Bracket | # Families | % Families |
| Less than $10,000 | 0 | 0.0% |
| $10,000 to $14,999 | 0 | 0.0% |
| $15,000 to $24,999 | 0 | 0.0% |
| $25,000 to $34,999 | 0 | 0.0% |
| $35,000 to $49,999 | 61 | 16.5% |
| $50,000 to $74,999 | 0 | 0.0% |
| $75,000 to $99,999 | 0 | 0.0% |
| $100,000 to $149,999 | 181 | 48.9% |
| $150,000 to $199,999 | 70 | 18.9% |
| $200,000+ | 58 | 15.7% |
Family Income by Famaliy Size in Grapeview
2-person families (253 | 68.4%) account for the highest median family income in Grapeview with $148,429 per family, while 2-person families (253 | 68.4%) have the highest median income of $74,214 per family member.
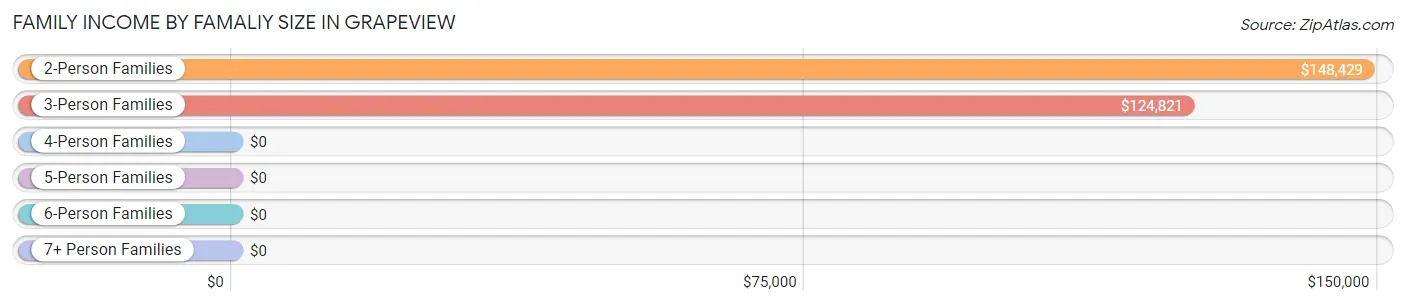
| Income Bracket | # Families | Median Income |
| 2-Person Families | 253 (68.4%) | $148,429 |
| 3-Person Families | 54 (14.6%) | $124,821 |
| 4-Person Families | 0 (0.0%) | $0 |
| 5-Person Families | 0 (0.0%) | $0 |
| 6-Person Families | 63 (17.0%) | $0 |
| 7+ Person Families | 0 (0.0%) | $0 |
| Total | 370 (100.0%) | $109,870 |
Family Income by Number of Earners in Grapeview
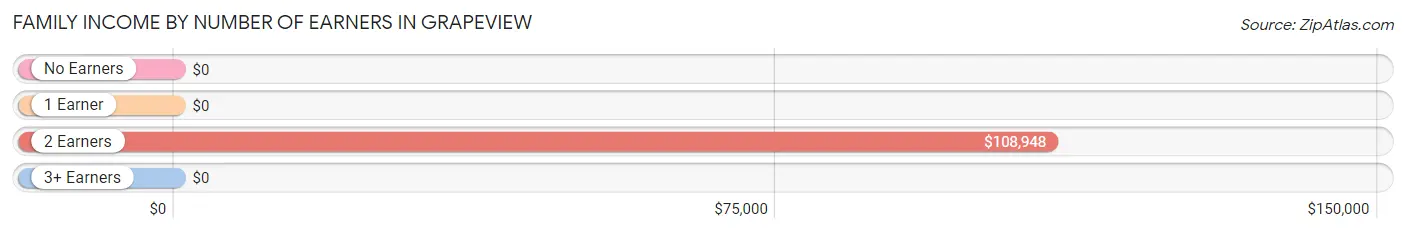
| Number of Earners | # Families | Median Income |
| No Earners | 87 (23.5%) | $0 |
| 1 Earner | 58 (15.7%) | $0 |
| 2 Earners | 211 (57.0%) | $108,948 |
| 3+ Earners | 14 (3.8%) | $0 |
| Total | 370 (100.0%) | $109,870 |
Household Income in Grapeview
Household Income Brackets in Grapeview
With 181 households falling in the category, the $100,000 to $149,999 income range is the most frequent in Grapeview, accounting for 38.4% of all households.
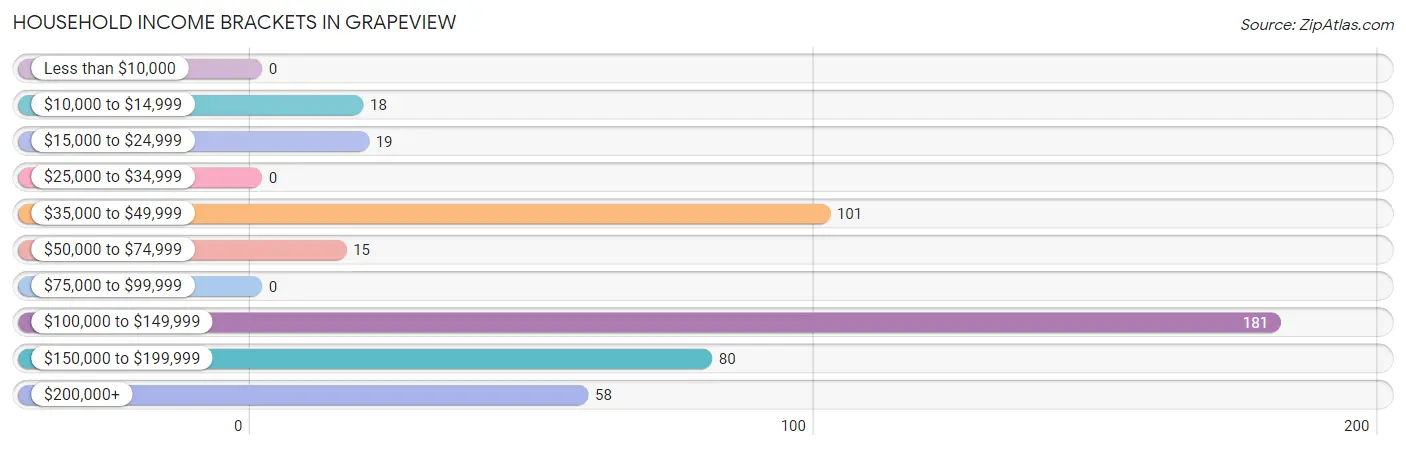
| Income Bracket | # Households | % Households |
| Less than $10,000 | 0 | 0.0% |
| $10,000 to $14,999 | 18 | 3.8% |
| $15,000 to $24,999 | 19 | 4.0% |
| $25,000 to $34,999 | 0 | 0.0% |
| $35,000 to $49,999 | 101 | 21.4% |
| $50,000 to $74,999 | 15 | 3.2% |
| $75,000 to $99,999 | 0 | 0.0% |
| $100,000 to $149,999 | 181 | 38.3% |
| $150,000 to $199,999 | 80 | 16.9% |
| $200,000+ | 58 | 12.3% |
Household Income by Householder Age in Grapeview
The median household income in Grapeview is $108,539, with the highest median household income of $109,087 found in the 25 to 44 years age bracket for the primary householder. A total of 118 households (25.0%) fall into this category.
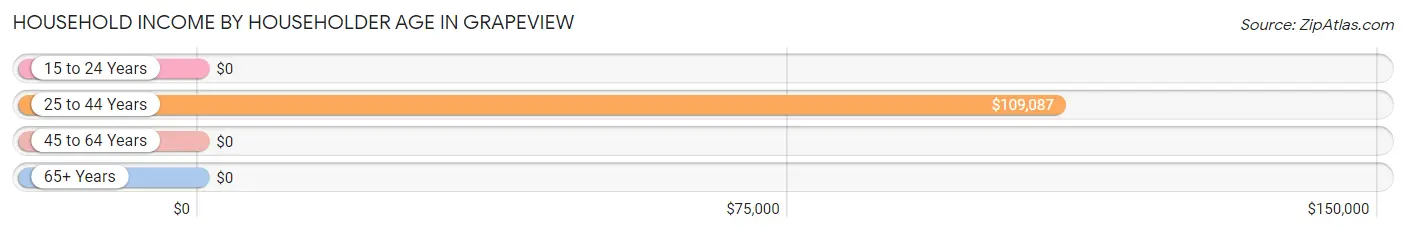
| Income Bracket | # Households | Median Income |
| 15 to 24 Years | 0 (0.0%) | $0 |
| 25 to 44 Years | 118 (25.0%) | $109,087 |
| 45 to 64 Years | 173 (36.6%) | $0 |
| 65+ Years | 181 (38.4%) | $0 |
| Total | 472 (100.0%) | $108,539 |
Poverty in Grapeview
Income Below Poverty by Sex and Age in Grapeview
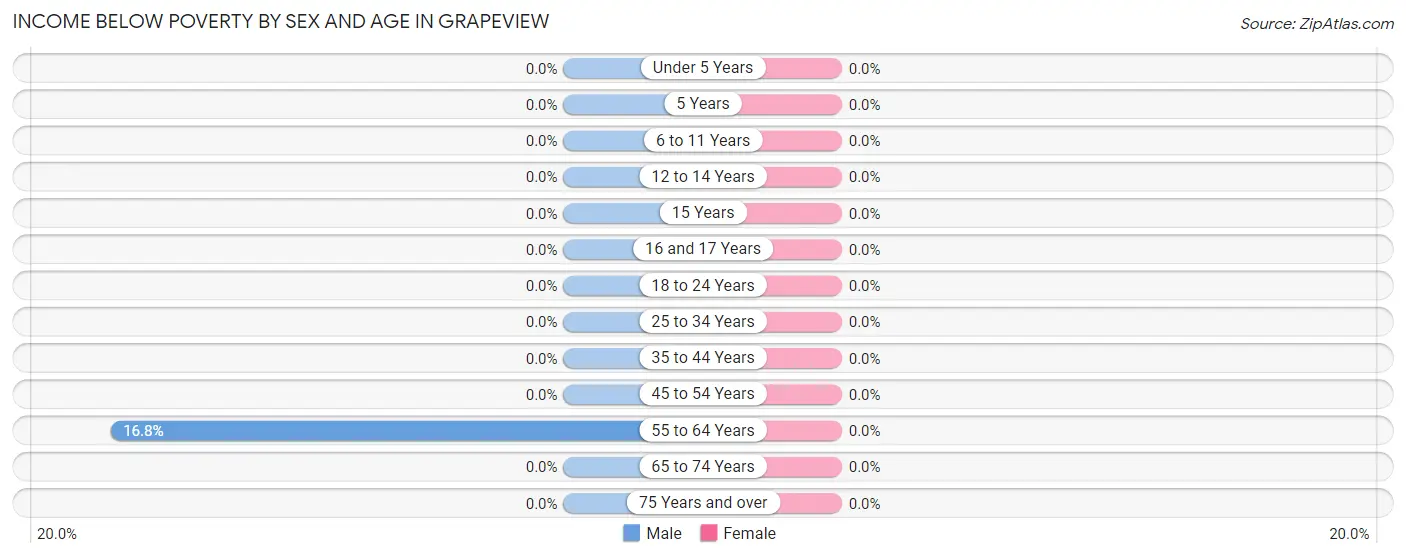
| Age Bracket | Male | Female |
| Under 5 Years | 0 (0.0%) | 0 (0.0%) |
| 5 Years | 0 (0.0%) | 0 (0.0%) |
| 6 to 11 Years | 0 (0.0%) | 0 (0.0%) |
| 12 to 14 Years | 0 (0.0%) | 0 (0.0%) |
| 15 Years | 0 (0.0%) | 0 (0.0%) |
| 16 and 17 Years | 0 (0.0%) | 0 (0.0%) |
| 18 to 24 Years | 0 (0.0%) | 0 (0.0%) |
| 25 to 34 Years | 0 (0.0%) | 0 (0.0%) |
| 35 to 44 Years | 0 (0.0%) | 0 (0.0%) |
| 45 to 54 Years | 0 (0.0%) | 0 (0.0%) |
| 55 to 64 Years | 18 (16.8%) | 0 (0.0%) |
| 65 to 74 Years | 0 (0.0%) | 0 (0.0%) |
| 75 Years and over | 0 (0.0%) | 0 (0.0%) |
| Total | 18 (2.7%) | 0 (0.0%) |
Income Above Poverty by Sex and Age in Grapeview
According to the poverty statistics in Grapeview, males aged under 5 years and females aged 12 to 14 years are the age groups that are most secure financially, with 100.0% of males and 100.0% of females in these age groups living above the poverty line.
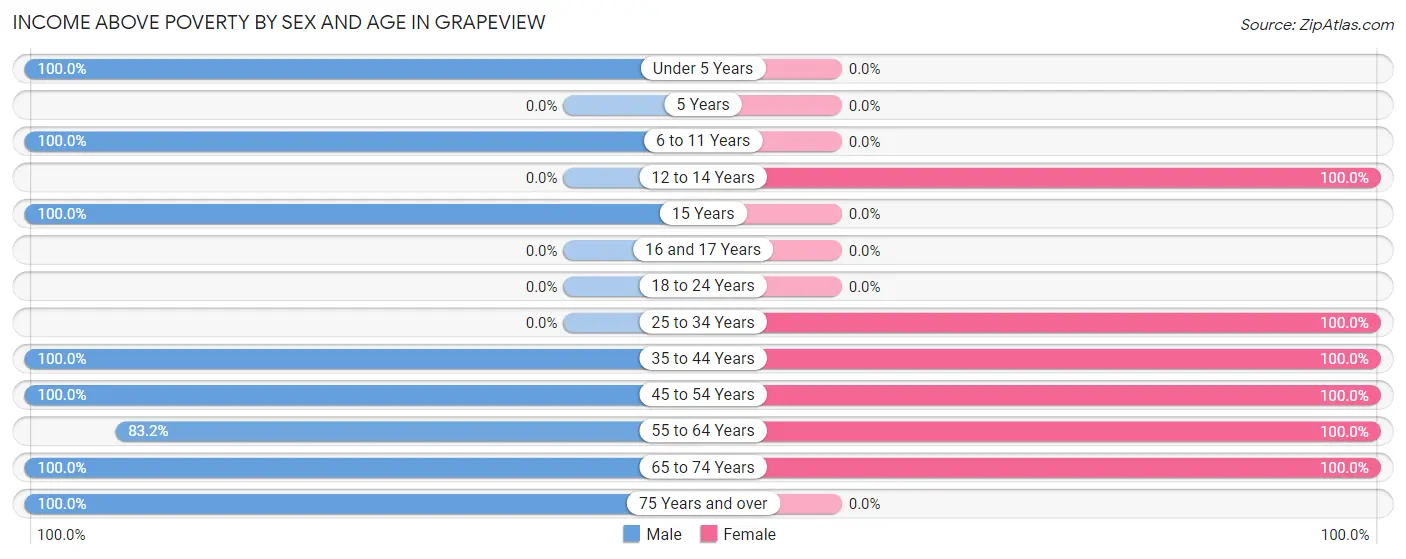
| Age Bracket | Male | Female |
| Under 5 Years | 96 (100.0%) | 0 (0.0%) |
| 5 Years | 0 (0.0%) | 0 (0.0%) |
| 6 to 11 Years | 58 (100.0%) | 0 (0.0%) |
| 12 to 14 Years | 0 (0.0%) | 63 (100.0%) |
| 15 Years | 62 (100.0%) | 0 (0.0%) |
| 16 and 17 Years | 0 (0.0%) | 0 (0.0%) |
| 18 to 24 Years | 0 (0.0%) | 0 (0.0%) |
| 25 to 34 Years | 0 (0.0%) | 100 (100.0%) |
| 35 to 44 Years | 85 (100.0%) | 36 (100.0%) |
| 45 to 54 Years | 14 (100.0%) | 6 (100.0%) |
| 55 to 64 Years | 89 (83.2%) | 132 (100.0%) |
| 65 to 74 Years | 182 (100.0%) | 124 (100.0%) |
| 75 Years and over | 63 (100.0%) | 0 (0.0%) |
| Total | 649 (97.3%) | 461 (100.0%) |
Income Below Poverty Among Married-Couple Families in Grapeview
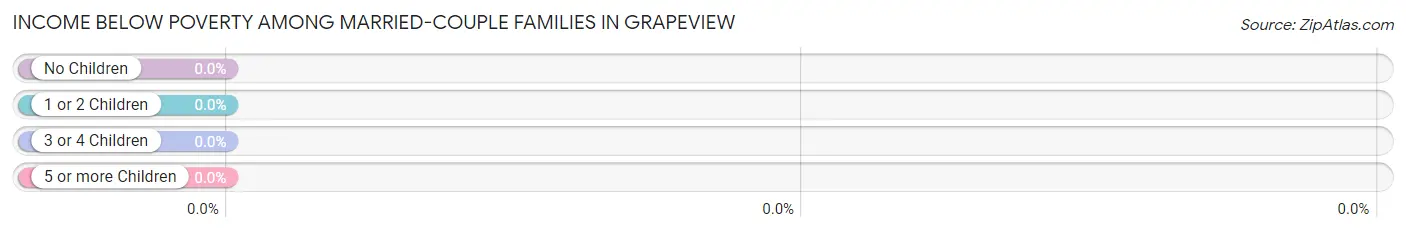
| Children | Above Poverty | Below Poverty |
| No Children | 281 (100.0%) | 0 (0.0%) |
| 1 or 2 Children | 26 (100.0%) | 0 (0.0%) |
| 3 or 4 Children | 63 (100.0%) | 0 (0.0%) |
| 5 or more Children | 0 (0.0%) | 0 (0.0%) |
| Total | 370 (100.0%) | 0 (0.0%) |
Income Below Poverty Among Single-Parent Households in Grapeview
| Children | Single Father | Single Mother |
| No Children | 0 (0.0%) | 0 (0.0%) |
| 1 or 2 Children | 0 (0.0%) | 0 (0.0%) |
| 3 or 4 Children | 0 (0.0%) | 0 (0.0%) |
| 5 or more Children | 0 (0.0%) | 0 (0.0%) |
| Total | 0 (0.0%) | 0 (0.0%) |
Income Below Poverty Among Married-Couple vs Single-Parent Households in Grapeview
| Children | Married-Couple Families | Single-Parent Households |
| No Children | 0 (0.0%) | 0 (0.0%) |
| 1 or 2 Children | 0 (0.0%) | 0 (0.0%) |
| 3 or 4 Children | 0 (0.0%) | 0 (0.0%) |
| 5 or more Children | 0 (0.0%) | 0 (0.0%) |
| Total | 0 (0.0%) | 0 (0.0%) |
Race in Grapeview
The most populous races in Grapeview are , and White / Caucasian (1,128 | 100.0%).
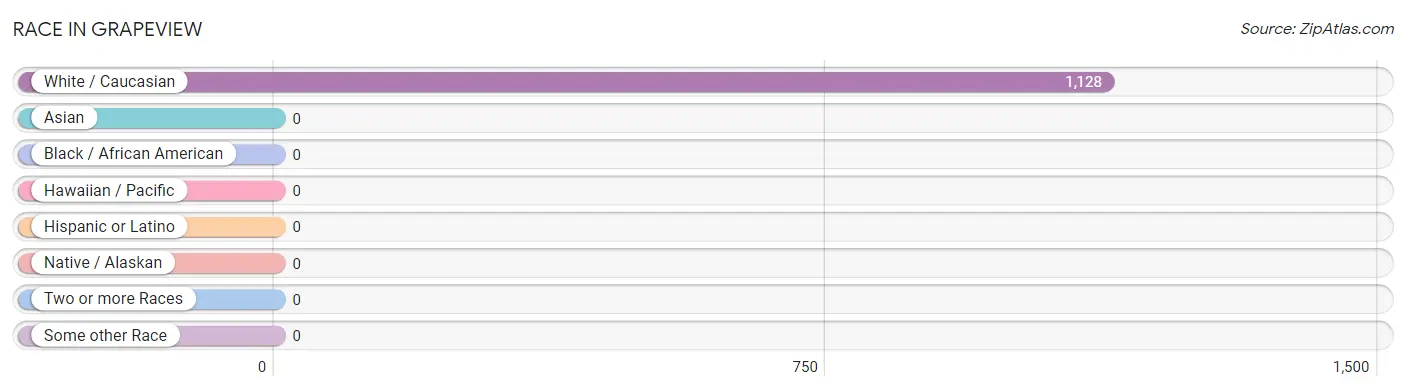
| Race | # Population | % Population |
| Asian | 0 | 0.0% |
| Black / African American | 0 | 0.0% |
| Hawaiian / Pacific | 0 | 0.0% |
| Hispanic or Latino | 0 | 0.0% |
| Native / Alaskan | 0 | 0.0% |
| White / Caucasian | 1,128 | 100.0% |
| Two or more Races | 0 | 0.0% |
| Some other Race | 0 | 0.0% |
| Total | 1,128 | 100.0% |
Ancestry in Grapeview
The most populous ancestries reported in Grapeview are English (153 | 13.6%), European (113 | 10.0%), German (106 | 9.4%), American (93 | 8.2%), and Irish (69 | 6.1%), together accounting for 47.3% of all Grapeview residents.
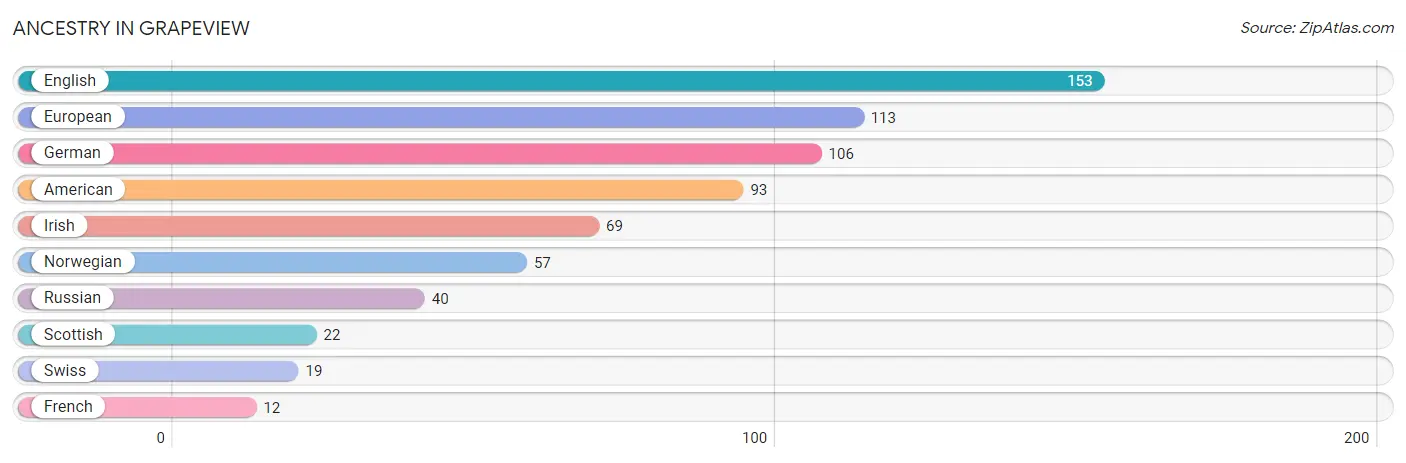
| Ancestry | # Population | % Population |
| American | 93 | 8.2% |
| English | 153 | 13.6% |
| European | 113 | 10.0% |
| French | 12 | 1.1% |
| German | 106 | 9.4% |
| Irish | 69 | 6.1% |
| Norwegian | 57 | 5.1% |
| Russian | 40 | 3.5% |
| Scottish | 22 | 1.9% |
| Swiss | 19 | 1.7% | View All 10 Rows |
Immigrants in Grapeview

| Immigration Origin | # Population | % Population | View All 0 Rows |
Sex and Age in Grapeview
Sex and Age in Grapeview
The most populous age groups in Grapeview are Under 5 Years (96 | 14.4%) for men and 65 to 69 Years (124 | 26.9%) for women.
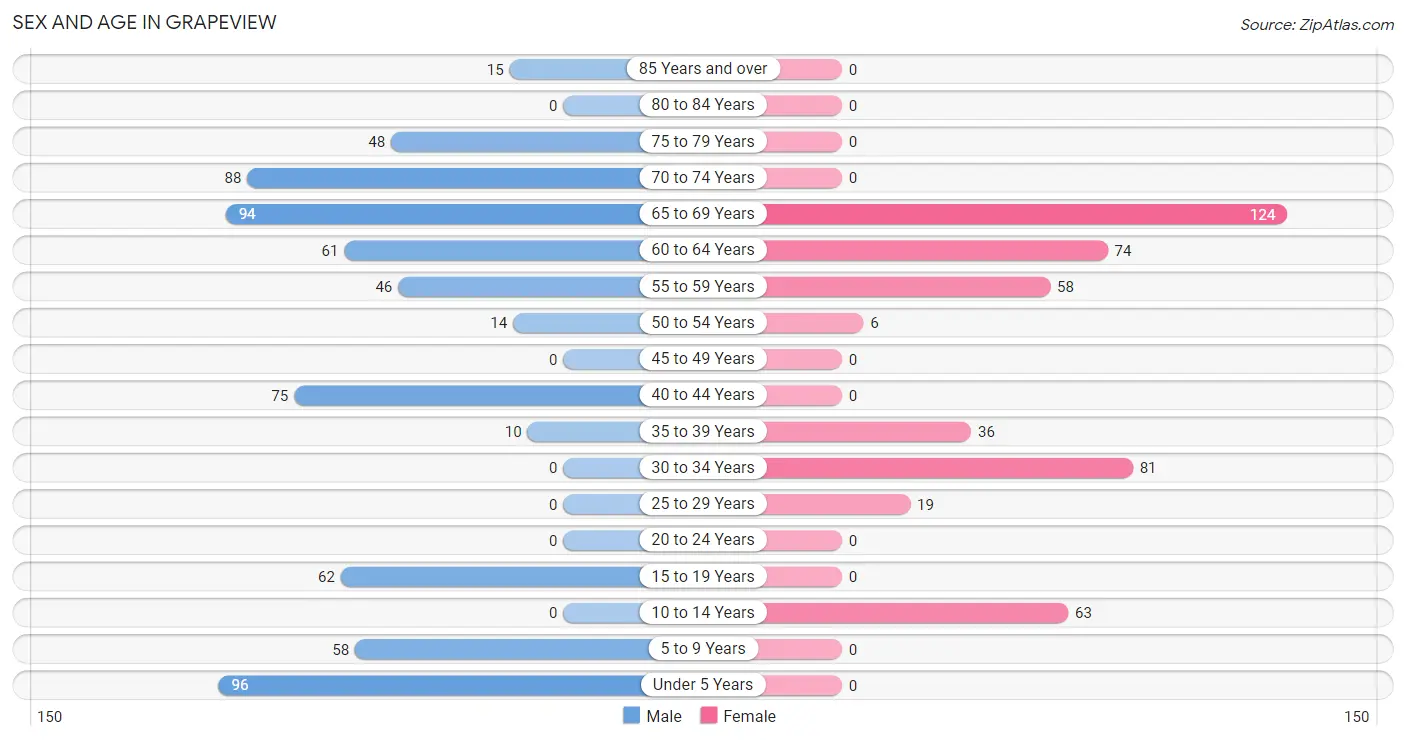
| Age Bracket | Male | Female |
| Under 5 Years | 96 (14.4%) | 0 (0.0%) |
| 5 to 9 Years | 58 (8.7%) | 0 (0.0%) |
| 10 to 14 Years | 0 (0.0%) | 63 (13.7%) |
| 15 to 19 Years | 62 (9.3%) | 0 (0.0%) |
| 20 to 24 Years | 0 (0.0%) | 0 (0.0%) |
| 25 to 29 Years | 0 (0.0%) | 19 (4.1%) |
| 30 to 34 Years | 0 (0.0%) | 81 (17.6%) |
| 35 to 39 Years | 10 (1.5%) | 36 (7.8%) |
| 40 to 44 Years | 75 (11.2%) | 0 (0.0%) |
| 45 to 49 Years | 0 (0.0%) | 0 (0.0%) |
| 50 to 54 Years | 14 (2.1%) | 6 (1.3%) |
| 55 to 59 Years | 46 (6.9%) | 58 (12.6%) |
| 60 to 64 Years | 61 (9.1%) | 74 (16.1%) |
| 65 to 69 Years | 94 (14.1%) | 124 (26.9%) |
| 70 to 74 Years | 88 (13.2%) | 0 (0.0%) |
| 75 to 79 Years | 48 (7.2%) | 0 (0.0%) |
| 80 to 84 Years | 0 (0.0%) | 0 (0.0%) |
| 85 Years and over | 15 (2.2%) | 0 (0.0%) |
| Total | 667 (100.0%) | 461 (100.0%) |
Families and Households in Grapeview
Median Family Size in Grapeview
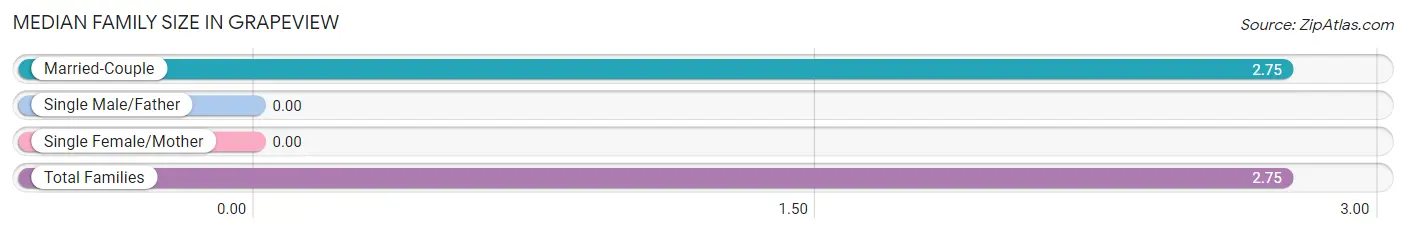
| Family Type | # Families | Family Size |
| Married-Couple | 370 (100.0%) | 2.75 |
| Single Male/Father | 0 (0.0%) | - |
| Single Female/Mother | 0 (0.0%) | - |
| Total Families | 370 (100.0%) | 2.75 |
Median Household Size in Grapeview
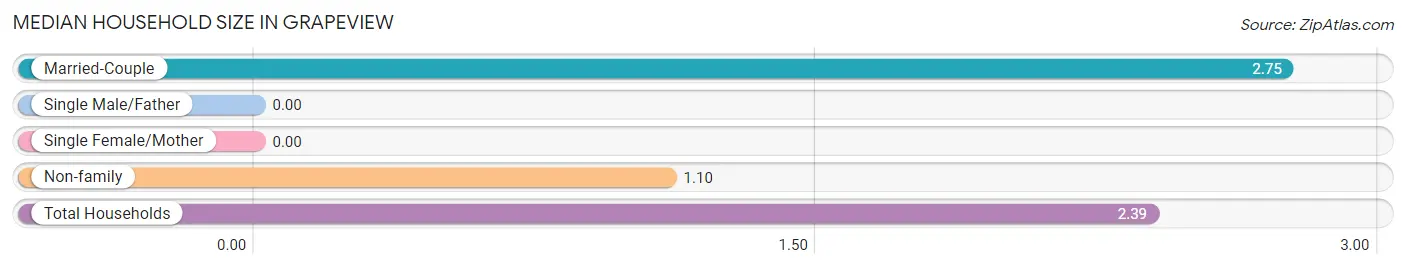
| Household Type | # Households | Household Size |
| Married-Couple | 370 (78.4%) | 2.75 |
| Single Male/Father | 0 (0.0%) | - |
| Single Female/Mother | 0 (0.0%) | - |
| Non-family | 102 (21.6%) | 1.10 |
| Total Households | 472 (100.0%) | 2.39 |
Household Size by Marriage Status in Grapeview
Out of a total of 472 households in Grapeview, 370 (78.4%) are family households, while 102 (21.6%) are nonfamily households. The most numerous type of family households are 2-person households, comprising 253, and the most common type of nonfamily households are 1-person households, comprising 92.
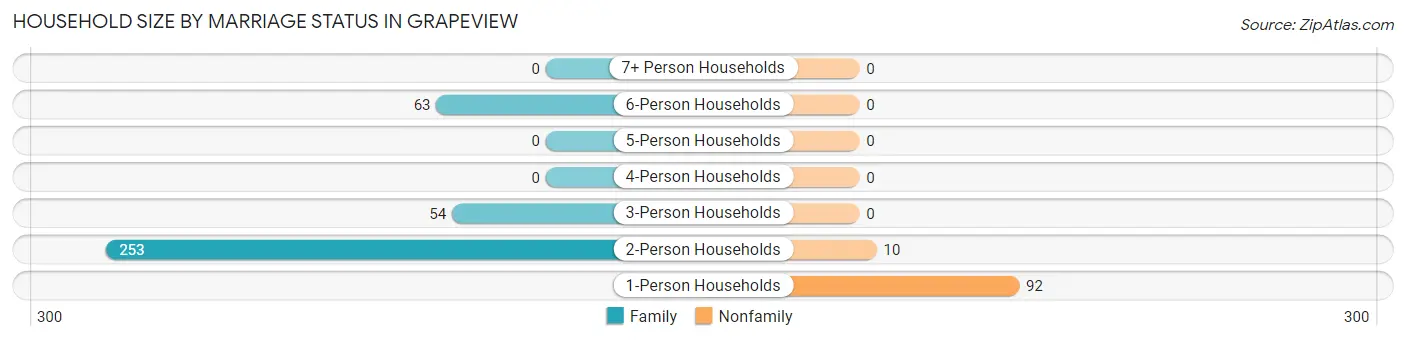
| Household Size | Family Households | Nonfamily Households |
| 1-Person Households | - | 92 (19.5%) |
| 2-Person Households | 253 (53.6%) | 10 (2.1%) |
| 3-Person Households | 54 (11.4%) | 0 (0.0%) |
| 4-Person Households | 0 (0.0%) | 0 (0.0%) |
| 5-Person Households | 0 (0.0%) | 0 (0.0%) |
| 6-Person Households | 63 (13.4%) | 0 (0.0%) |
| 7+ Person Households | 0 (0.0%) | 0 (0.0%) |
| Total | 370 (78.4%) | 102 (21.6%) |
Female Fertility in Grapeview
Fertility by Age in Grapeview
| Age Bracket | Women with Births | Births / 1,000 Women |
| 15 to 19 years | 0 (0.0%) | 0.0 |
| 20 to 34 years | 0 (0.0%) | 0.0 |
| 35 to 50 years | 0 (0.0%) | 0.0 |
| Total | 0 (0.0%) | 0.0 |
Fertility by Age by Marriage Status in Grapeview
| Age Bracket | Married | Unmarried |
| 15 to 19 years | 0 (0.0%) | 0 (0.0%) |
| 20 to 34 years | 0 (0.0%) | 0 (0.0%) |
| 35 to 50 years | 0 (0.0%) | 0 (0.0%) |
| Total | 0 (0.0%) | 0 (0.0%) |
Fertility by Education in Grapeview
| Educational Attainment | Women with Births | Births / 1,000 Women |
| Less than High School | 0 (0.0%) | 0.0 |
| High School Diploma | 0 (0.0%) | 0.0 |
| College or Associate's Degree | 0 (0.0%) | 0.0 |
| Bachelor's Degree | 0 (0.0%) | 0.0 |
| Graduate Degree | 0 (0.0%) | 0.0 |
| Total | 0 (0.0%) | 0.0 |
Fertility by Education by Marriage Status in Grapeview
| Educational Attainment | Married | Unmarried |
| Less than High School | 0 (0.0%) | 0 (0.0%) |
| High School Diploma | 0 (0.0%) | 0 (0.0%) |
| College or Associate's Degree | 0 (0.0%) | 0 (0.0%) |
| Bachelor's Degree | 0 (0.0%) | 0 (0.0%) |
| Graduate Degree | 0 (0.0%) | 0 (0.0%) |
| Total | 0 (0.0%) | 0 (0.0%) |
Employment Characteristics in Grapeview
Employment by Class of Employer in Grapeview
Among the 550 employed individuals in Grapeview, private company employees (349 | 63.4%), not-for-profit organizations (71 | 12.9%), and self-employed (not incorporated) (61 | 11.1%) make up the most common classes of employment.
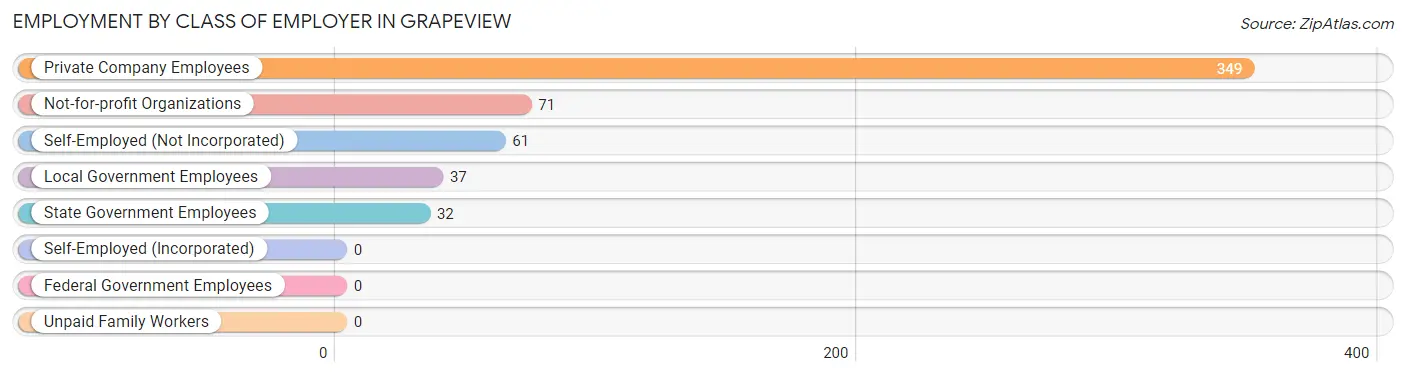
| Employer Class | # Employees | % Employees |
| Private Company Employees | 349 | 63.4% |
| Self-Employed (Incorporated) | 0 | 0.0% |
| Self-Employed (Not Incorporated) | 61 | 11.1% |
| Not-for-profit Organizations | 71 | 12.9% |
| Local Government Employees | 37 | 6.7% |
| State Government Employees | 32 | 5.8% |
| Federal Government Employees | 0 | 0.0% |
| Unpaid Family Workers | 0 | 0.0% |
| Total | 550 | 100.0% |
Employment Status by Age in Grapeview
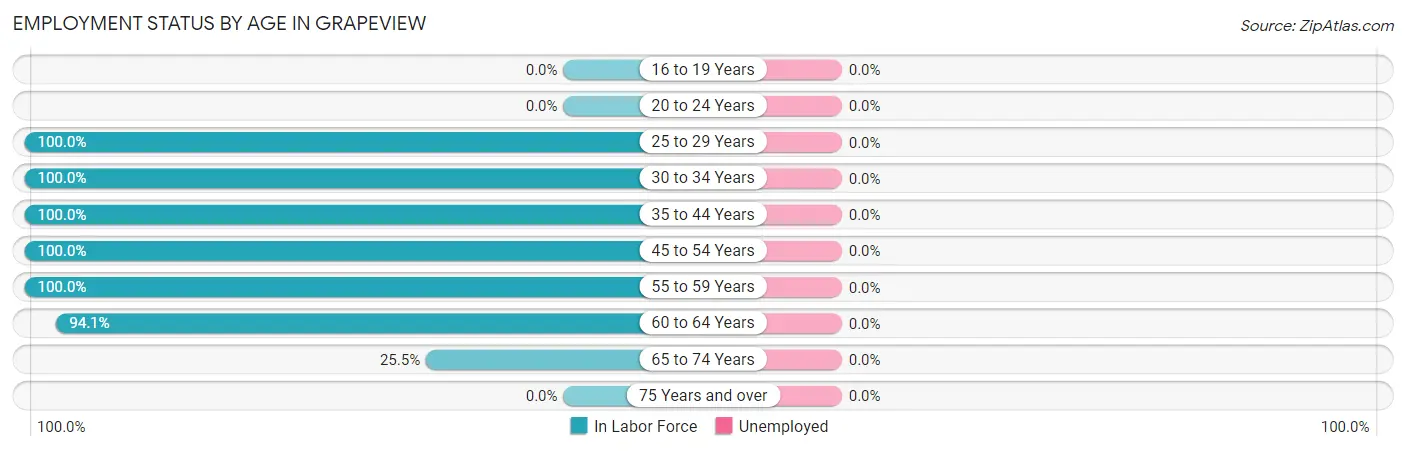
| Age Bracket | In Labor Force | Unemployed |
| 16 to 19 Years | 0 (0.0%) | 0 (0.0%) |
| 20 to 24 Years | 0 (0.0%) | 0 (0.0%) |
| 25 to 29 Years | 19 (100.0%) | 0 (0.0%) |
| 30 to 34 Years | 81 (100.0%) | 0 (0.0%) |
| 35 to 44 Years | 121 (100.0%) | 0 (0.0%) |
| 45 to 54 Years | 20 (100.0%) | 0 (0.0%) |
| 55 to 59 Years | 104 (100.0%) | 0 (0.0%) |
| 60 to 64 Years | 127 (94.1%) | 0 (0.0%) |
| 65 to 74 Years | 78 (25.5%) | 0 (0.0%) |
| 75 Years and over | 0 (0.0%) | 0 (0.0%) |
| Total | 550 (64.8%) | 0 (0.0%) |
Employment Status by Educational Attainment in Grapeview
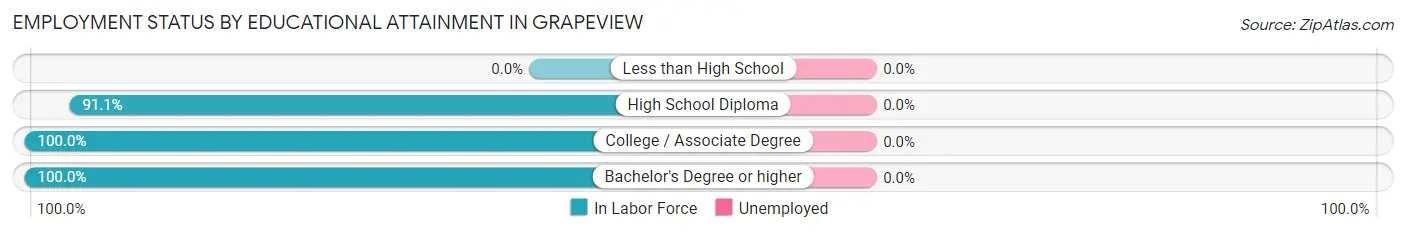
| Educational Attainment | In Labor Force | Unemployed |
| Less than High School | 0 (0.0%) | 0 (0.0%) |
| High School Diploma | 82 (91.1%) | 0 (0.0%) |
| College / Associate Degree | 276 (100.0%) | 0 (0.0%) |
| Bachelor's Degree or higher | 114 (100.0%) | 0 (0.0%) |
| Total | 472 (98.3%) | 0 (0.0%) |
Employment Occupations by Sex in Grapeview
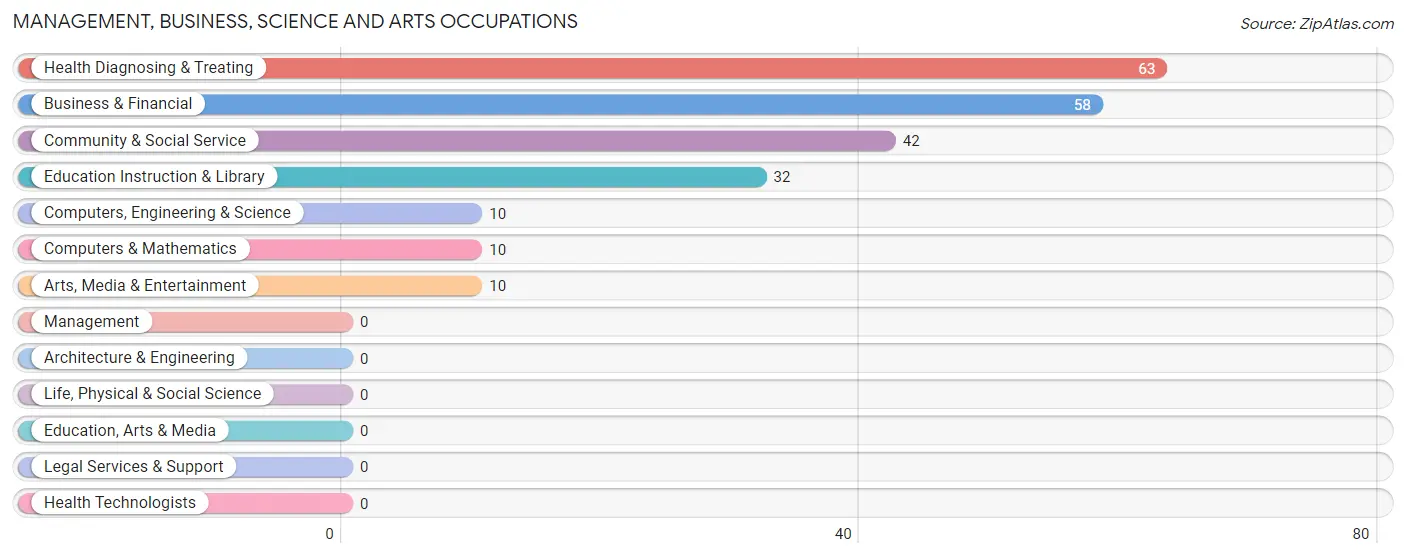
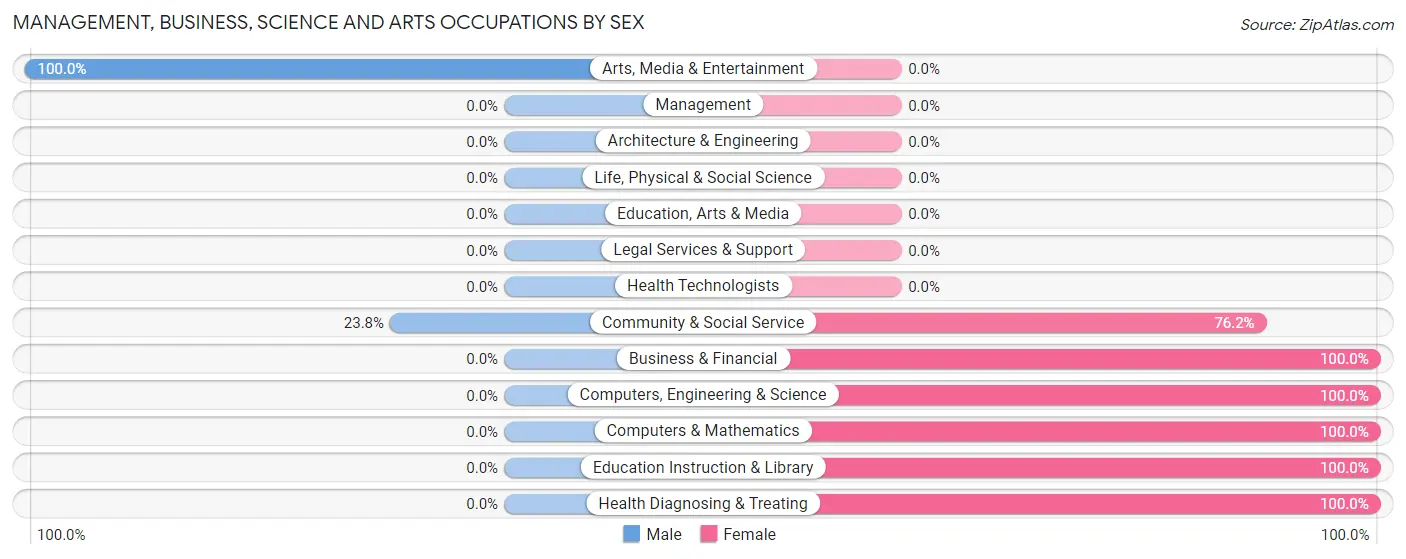
Management, Business, Science and Arts Occupations
The most common Management, Business, Science and Arts occupations in Grapeview are Health Diagnosing & Treating (63 | 11.5%), Business & Financial (58 | 10.5%), Community & Social Service (42 | 7.6%), Education Instruction & Library (32 | 5.8%), and Computers, Engineering & Science (10 | 1.8%).
Management, Business, Science and Arts Occupations by Sex
Within the Management, Business, Science and Arts occupations in Grapeview, the most male-oriented occupations are Arts, Media & Entertainment (100.0%), and Community & Social Service (23.8%), while the most female-oriented occupations are Business & Financial (100.0%), Computers, Engineering & Science (100.0%), and Computers & Mathematics (100.0%).
| Occupation | Male | Female |
| Management | 0 (0.0%) | 0 (0.0%) |
| Business & Financial | 0 (0.0%) | 58 (100.0%) |
| Computers, Engineering & Science | 0 (0.0%) | 10 (100.0%) |
| Computers & Mathematics | 0 (0.0%) | 10 (100.0%) |
| Architecture & Engineering | 0 (0.0%) | 0 (0.0%) |
| Life, Physical & Social Science | 0 (0.0%) | 0 (0.0%) |
| Community & Social Service | 10 (23.8%) | 32 (76.2%) |
| Education, Arts & Media | 0 (0.0%) | 0 (0.0%) |
| Legal Services & Support | 0 (0.0%) | 0 (0.0%) |
| Education Instruction & Library | 0 (0.0%) | 32 (100.0%) |
| Arts, Media & Entertainment | 10 (100.0%) | 0 (0.0%) |
| Health Diagnosing & Treating | 0 (0.0%) | 63 (100.0%) |
| Health Technologists | 0 (0.0%) | 0 (0.0%) |
| Total (Category) | 10 (5.8%) | 163 (94.2%) |
| Total (Overall) | 245 (44.6%) | 305 (55.4%) |
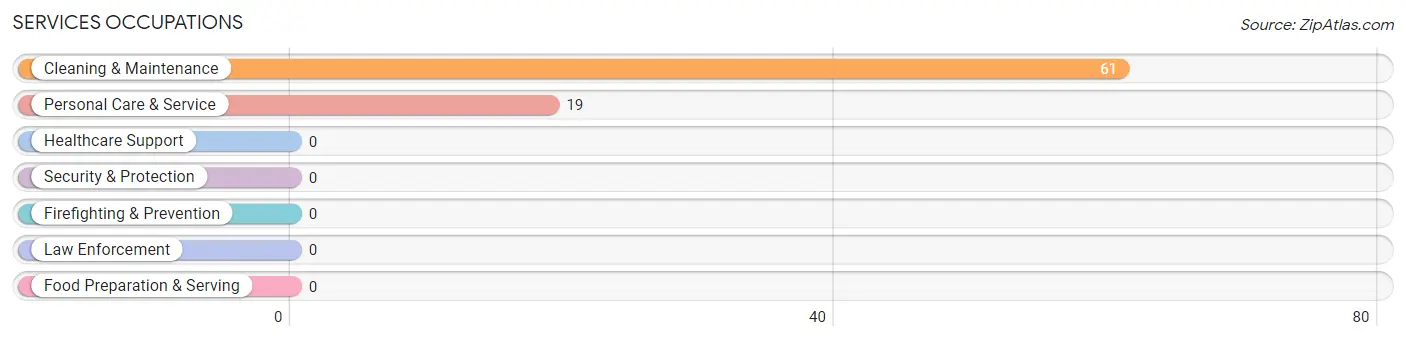
Services Occupations
The most common Services occupations in Grapeview are Cleaning & Maintenance (61 | 11.1%), and Personal Care & Service (19 | 3.5%).
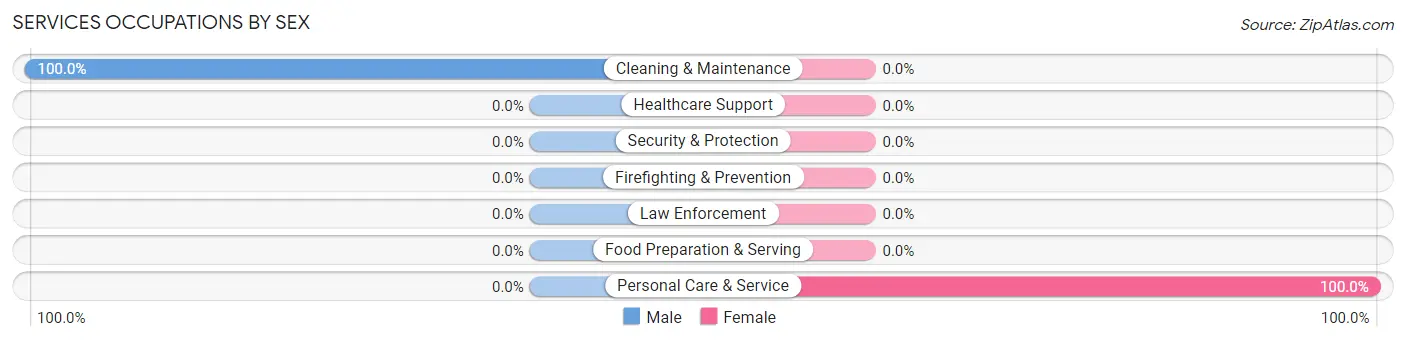
Services Occupations by Sex
| Occupation | Male | Female |
| Healthcare Support | 0 (0.0%) | 0 (0.0%) |
| Security & Protection | 0 (0.0%) | 0 (0.0%) |
| Firefighting & Prevention | 0 (0.0%) | 0 (0.0%) |
| Law Enforcement | 0 (0.0%) | 0 (0.0%) |
| Food Preparation & Serving | 0 (0.0%) | 0 (0.0%) |
| Cleaning & Maintenance | 61 (100.0%) | 0 (0.0%) |
| Personal Care & Service | 0 (0.0%) | 19 (100.0%) |
| Total (Category) | 61 (76.2%) | 19 (23.7%) |
| Total (Overall) | 245 (44.6%) | 305 (55.4%) |
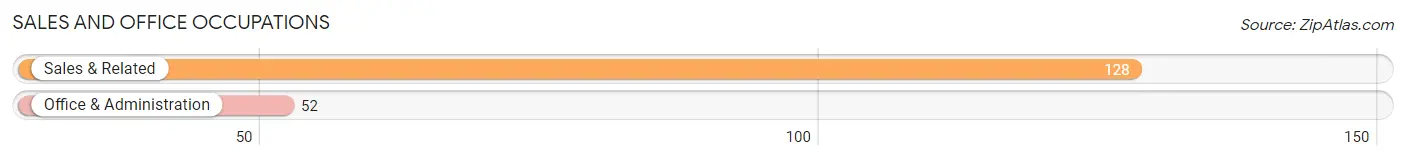
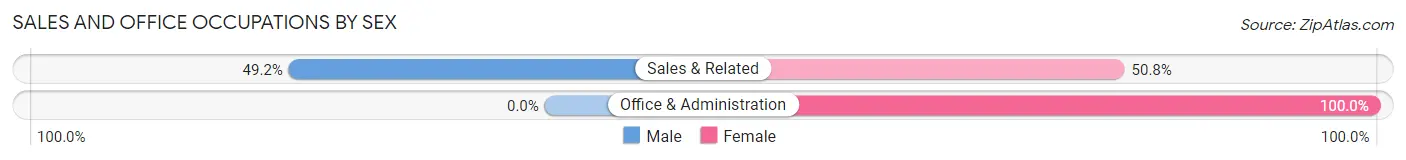
Sales and Office Occupations
The most common Sales and Office occupations in Grapeview are Sales & Related (128 | 23.3%), and Office & Administration (52 | 9.5%).
Sales and Office Occupations by Sex
| Occupation | Male | Female |
| Sales & Related | 63 (49.2%) | 65 (50.8%) |
| Office & Administration | 0 (0.0%) | 52 (100.0%) |
| Total (Category) | 63 (35.0%) | 117 (65.0%) |
| Total (Overall) | 245 (44.6%) | 305 (55.4%) |
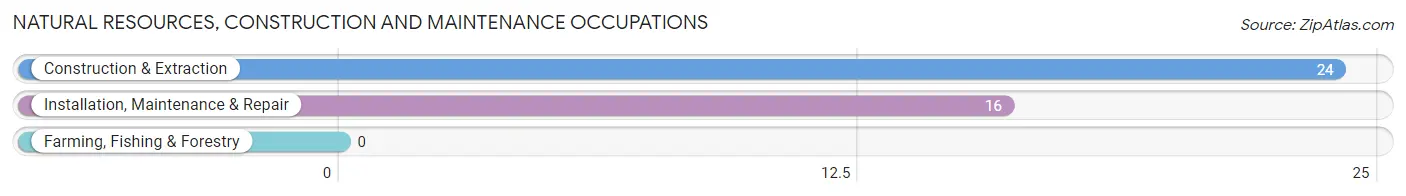
Natural Resources, Construction and Maintenance Occupations
The most common Natural Resources, Construction and Maintenance occupations in Grapeview are Construction & Extraction (24 | 4.4%), and Installation, Maintenance & Repair (16 | 2.9%).
Natural Resources, Construction and Maintenance Occupations by Sex
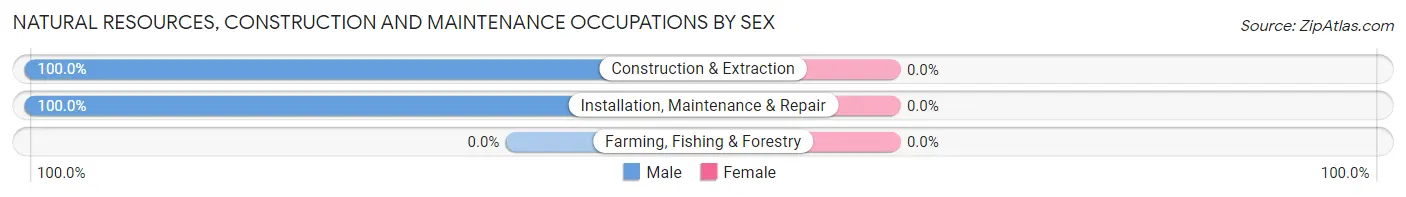
| Occupation | Male | Female |
| Farming, Fishing & Forestry | 0 (0.0%) | 0 (0.0%) |
| Construction & Extraction | 24 (100.0%) | 0 (0.0%) |
| Installation, Maintenance & Repair | 16 (100.0%) | 0 (0.0%) |
| Total (Category) | 40 (100.0%) | 0 (0.0%) |
| Total (Overall) | 245 (44.6%) | 305 (55.4%) |
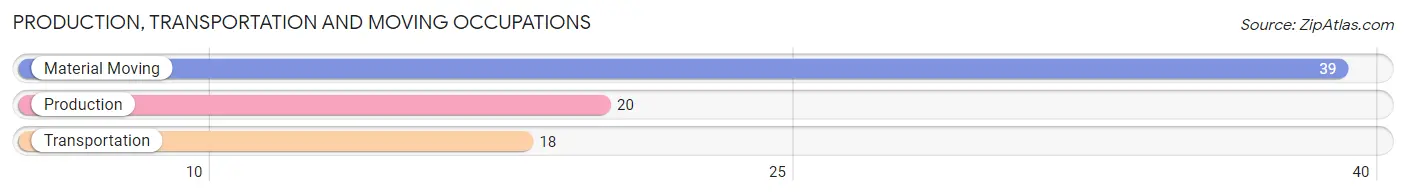
Production, Transportation and Moving Occupations
The most common Production, Transportation and Moving occupations in Grapeview are Material Moving (39 | 7.1%), Production (20 | 3.6%), and Transportation (18 | 3.3%).
Production, Transportation and Moving Occupations by Sex
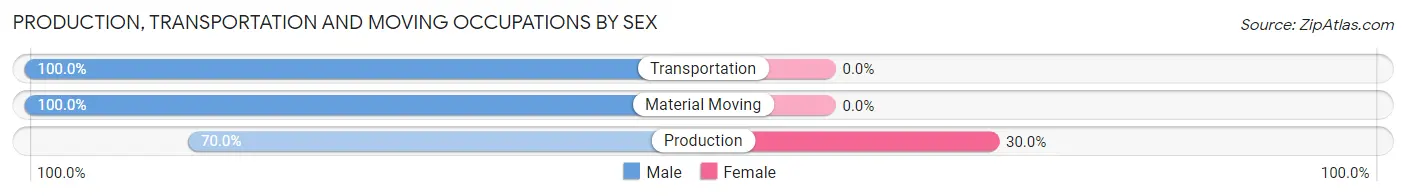
| Occupation | Male | Female |
| Production | 14 (70.0%) | 6 (30.0%) |
| Transportation | 18 (100.0%) | 0 (0.0%) |
| Material Moving | 39 (100.0%) | 0 (0.0%) |
| Total (Category) | 71 (92.2%) | 6 (7.8%) |
| Total (Overall) | 245 (44.6%) | 305 (55.4%) |
Employment Industries by Sex in Grapeview
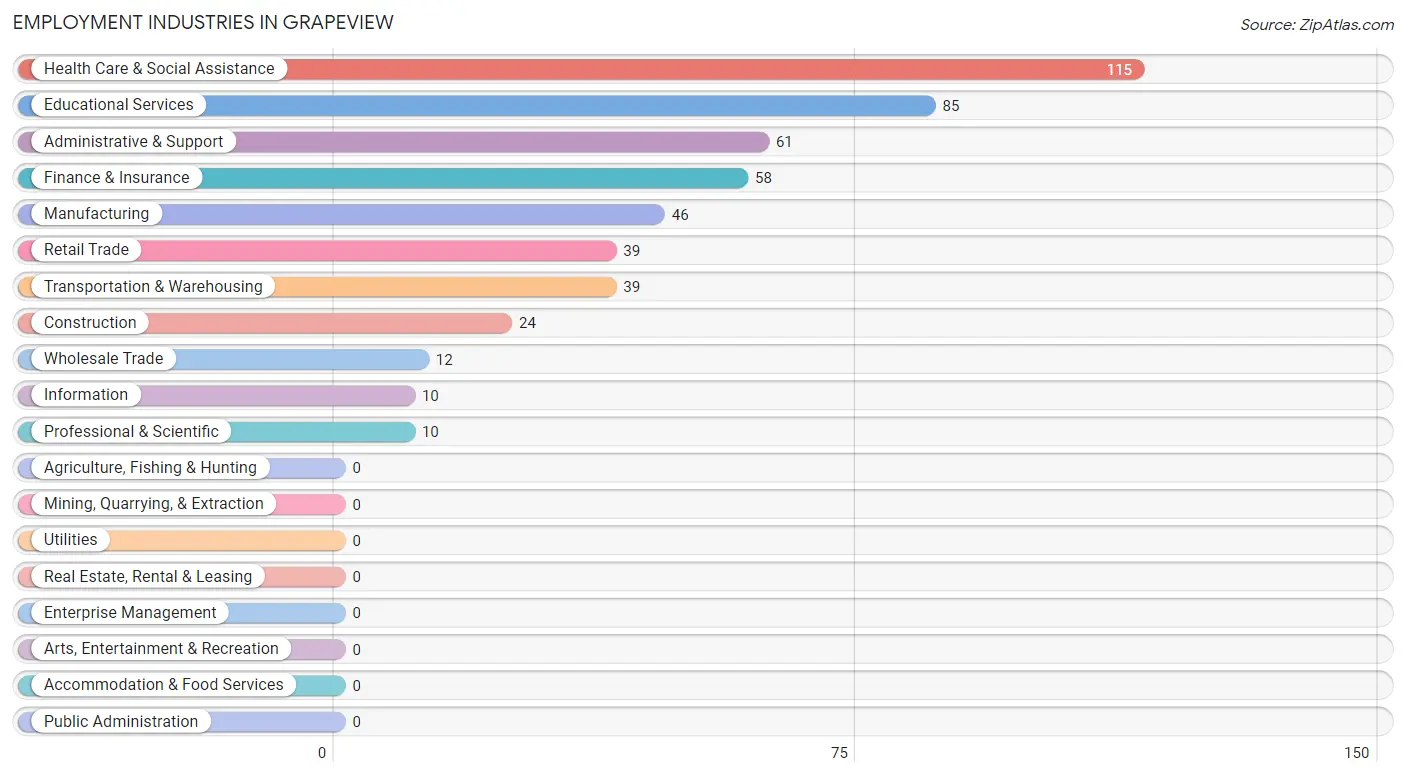
Employment Industries in Grapeview
The major employment industries in Grapeview include Health Care & Social Assistance (115 | 20.9%), Educational Services (85 | 15.4%), Administrative & Support (61 | 11.1%), Finance & Insurance (58 | 10.5%), and Manufacturing (46 | 8.4%).
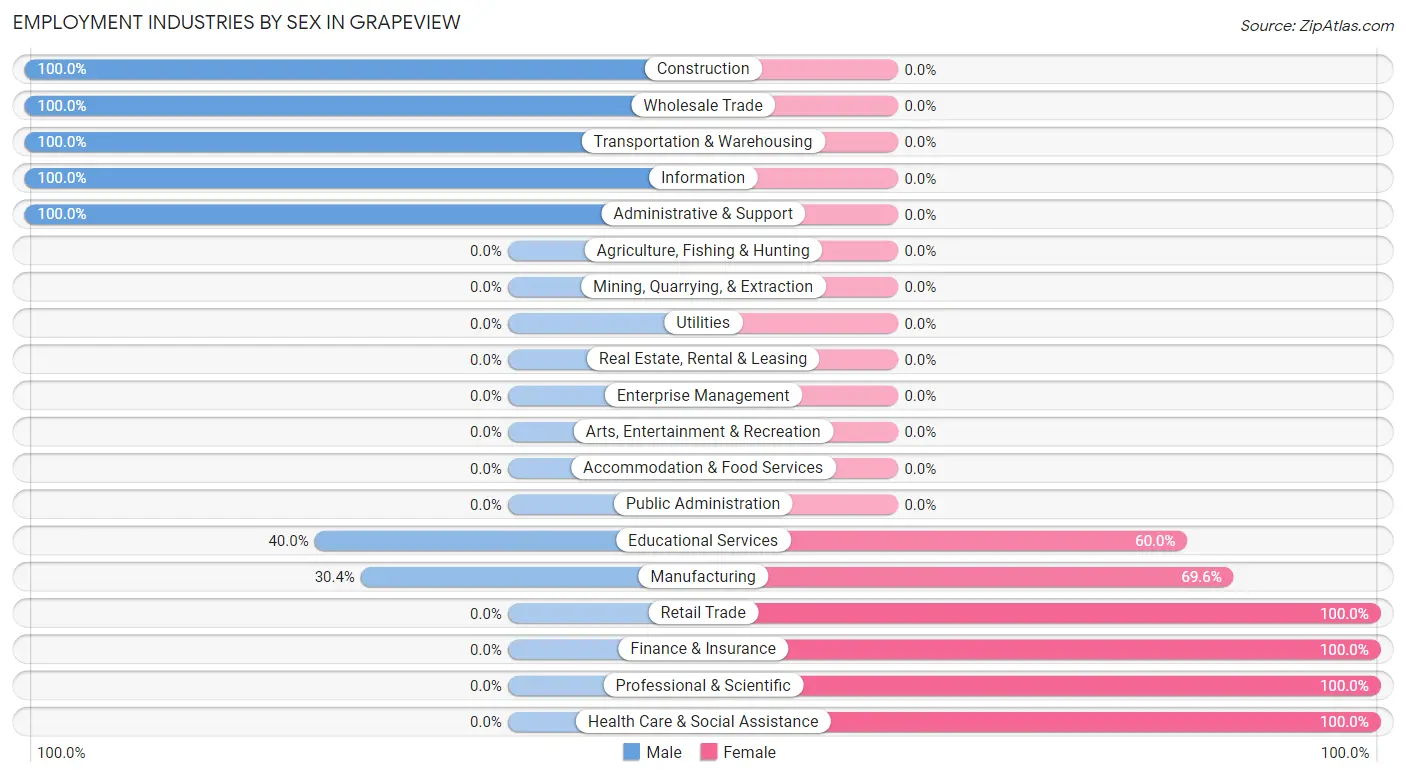
Employment Industries by Sex in Grapeview
The Grapeview industries that see more men than women are Construction (100.0%), Wholesale Trade (100.0%), and Transportation & Warehousing (100.0%), whereas the industries that tend to have a higher number of women are Retail Trade (100.0%), Finance & Insurance (100.0%), and Professional & Scientific (100.0%).
| Industry | Male | Female |
| Agriculture, Fishing & Hunting | 0 (0.0%) | 0 (0.0%) |
| Mining, Quarrying, & Extraction | 0 (0.0%) | 0 (0.0%) |
| Construction | 24 (100.0%) | 0 (0.0%) |
| Manufacturing | 14 (30.4%) | 32 (69.6%) |
| Wholesale Trade | 12 (100.0%) | 0 (0.0%) |
| Retail Trade | 0 (0.0%) | 39 (100.0%) |
| Transportation & Warehousing | 39 (100.0%) | 0 (0.0%) |
| Utilities | 0 (0.0%) | 0 (0.0%) |
| Information | 10 (100.0%) | 0 (0.0%) |
| Finance & Insurance | 0 (0.0%) | 58 (100.0%) |
| Real Estate, Rental & Leasing | 0 (0.0%) | 0 (0.0%) |
| Professional & Scientific | 0 (0.0%) | 10 (100.0%) |
| Enterprise Management | 0 (0.0%) | 0 (0.0%) |
| Administrative & Support | 61 (100.0%) | 0 (0.0%) |
| Educational Services | 34 (40.0%) | 51 (60.0%) |
| Health Care & Social Assistance | 0 (0.0%) | 115 (100.0%) |
| Arts, Entertainment & Recreation | 0 (0.0%) | 0 (0.0%) |
| Accommodation & Food Services | 0 (0.0%) | 0 (0.0%) |
| Public Administration | 0 (0.0%) | 0 (0.0%) |
| Total | 245 (44.6%) | 305 (55.4%) |
Education in Grapeview
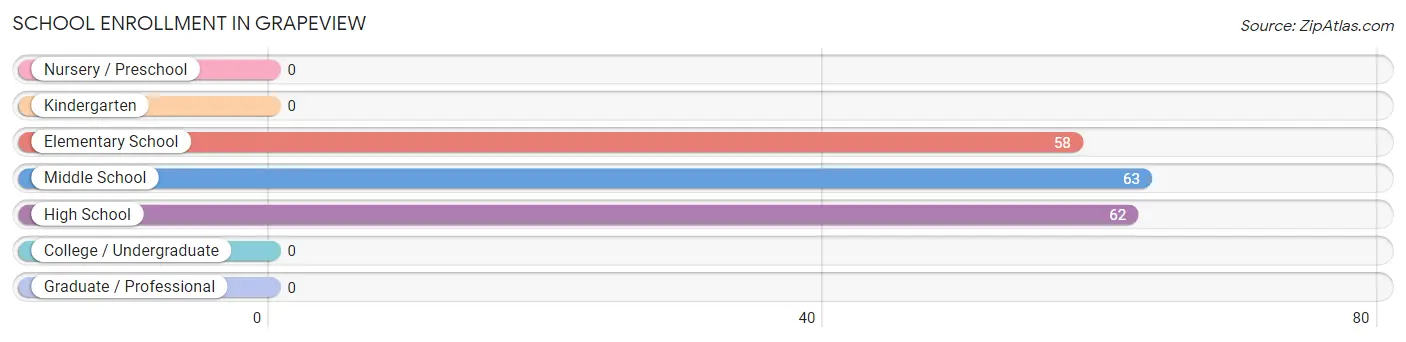
School Enrollment in Grapeview
The most common levels of schooling among the 183 students in Grapeview are middle school (63 | 34.4%), high school (62 | 33.9%), and elementary school (58 | 31.7%).
| School Level | # Students | % Students |
| Nursery / Preschool | 0 | 0.0% |
| Kindergarten | 0 | 0.0% |
| Elementary School | 58 | 31.7% |
| Middle School | 63 | 34.4% |
| High School | 62 | 33.9% |
| College / Undergraduate | 0 | 0.0% |
| Graduate / Professional | 0 | 0.0% |
| Total | 183 | 100.0% |
School Enrollment by Age by Funding Source in Grapeview
Out of a total of 183 students who are enrolled in schools in Grapeview, 63 (34.4%) attend a private institution, while the remaining 120 (65.6%) are enrolled in public schools. The age group of 10 to 14 year olds has the highest likelihood of being enrolled in private schools, with 63 (100.0% in the age bracket) enrolled. Conversely, the age group of 5 to 9 year old has the lowest likelihood of being enrolled in a private school, with 58 (100.0% in the age bracket) attending a public institution.
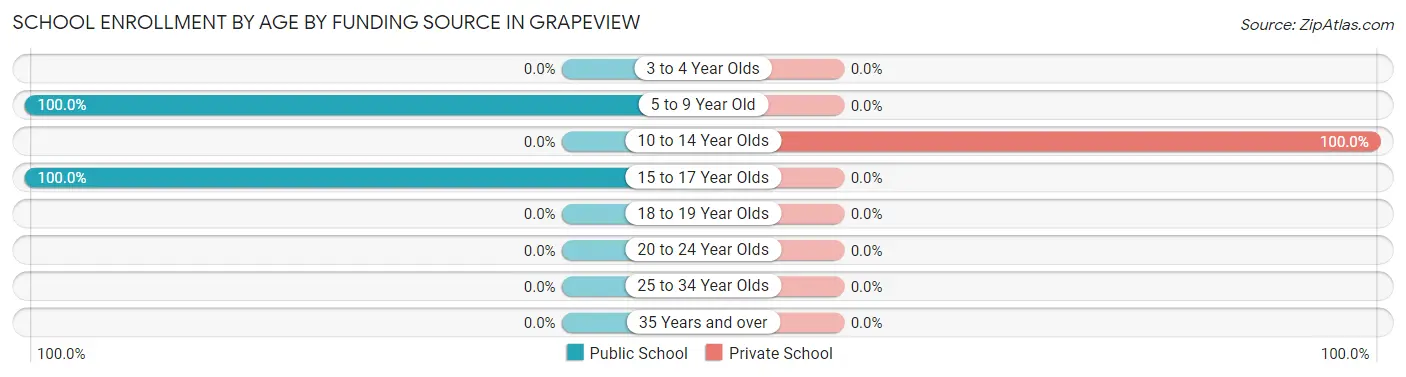
| Age Bracket | Public School | Private School |
| 3 to 4 Year Olds | 0 (0.0%) | 0 (0.0%) |
| 5 to 9 Year Old | 58 (100.0%) | 0 (0.0%) |
| 10 to 14 Year Olds | 0 (0.0%) | 63 (100.0%) |
| 15 to 17 Year Olds | 62 (100.0%) | 0 (0.0%) |
| 18 to 19 Year Olds | 0 (0.0%) | 0 (0.0%) |
| 20 to 24 Year Olds | 0 (0.0%) | 0 (0.0%) |
| 25 to 34 Year Olds | 0 (0.0%) | 0 (0.0%) |
| 35 Years and over | 0 (0.0%) | 0 (0.0%) |
| Total | 120 (65.6%) | 63 (34.4%) |
Educational Attainment by Field of Study in Grapeview
Computers & mathematics (51 | 23.2%), business (45 | 20.4%), engineering (44 | 20.0%), education (43 | 19.6%), and visual & performing arts (19 | 8.6%) are the most common fields of study among 220 individuals in Grapeview who have obtained a bachelor's degree or higher.
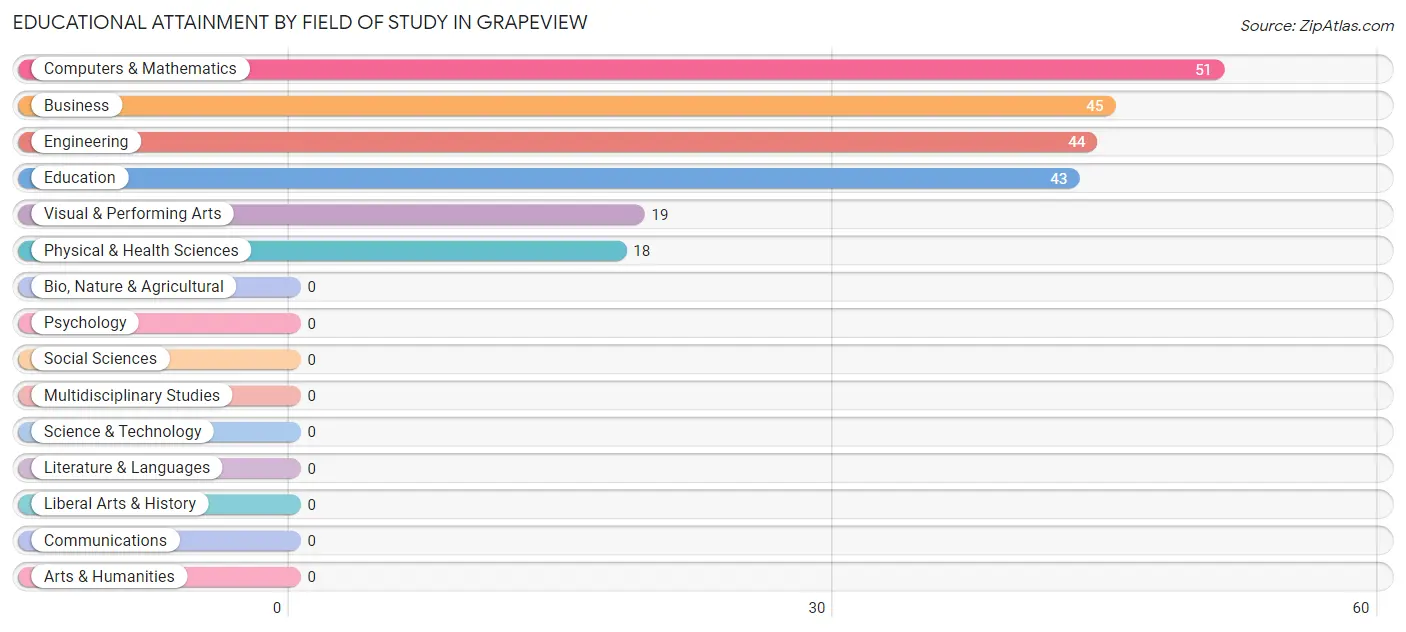
| Field of Study | # Graduates | % Graduates |
| Computers & Mathematics | 51 | 23.2% |
| Bio, Nature & Agricultural | 0 | 0.0% |
| Physical & Health Sciences | 18 | 8.2% |
| Psychology | 0 | 0.0% |
| Social Sciences | 0 | 0.0% |
| Engineering | 44 | 20.0% |
| Multidisciplinary Studies | 0 | 0.0% |
| Science & Technology | 0 | 0.0% |
| Business | 45 | 20.4% |
| Education | 43 | 19.6% |
| Literature & Languages | 0 | 0.0% |
| Liberal Arts & History | 0 | 0.0% |
| Visual & Performing Arts | 19 | 8.6% |
| Communications | 0 | 0.0% |
| Arts & Humanities | 0 | 0.0% |
| Total | 220 | 100.0% |
Transportation & Commute in Grapeview
Vehicle Availability by Sex in Grapeview
The most prevalent vehicle ownership categories in Grapeview are males with 3 vehicles (114, accounting for 46.5%) and females with 3 vehicles (128, making up 37.4%).
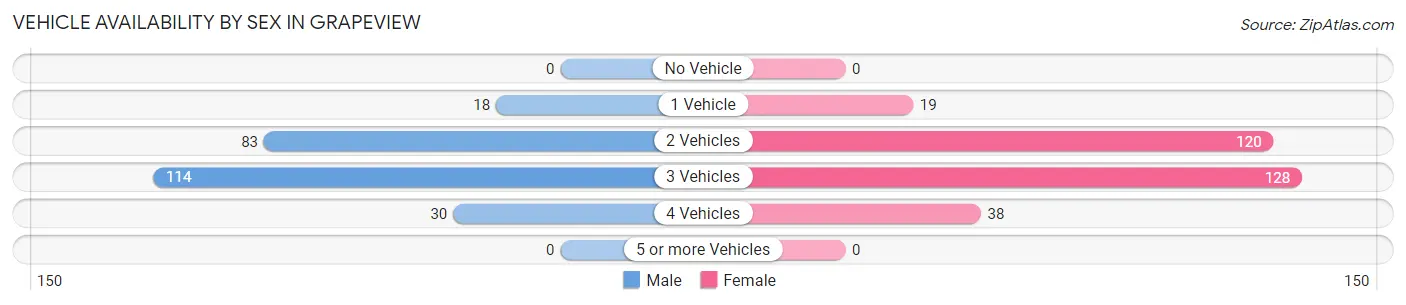
| Vehicles Available | Male | Female |
| No Vehicle | 0 (0.0%) | 0 (0.0%) |
| 1 Vehicle | 18 (7.3%) | 19 (6.2%) |
| 2 Vehicles | 83 (33.9%) | 120 (39.3%) |
| 3 Vehicles | 114 (46.5%) | 128 (42.0%) |
| 4 Vehicles | 30 (12.2%) | 38 (12.5%) |
| 5 or more Vehicles | 0 (0.0%) | 0 (0.0%) |
| Total | 245 (100.0%) | 305 (100.0%) |
Commute Time in Grapeview
The most frequently occuring commute durations in Grapeview are 45 to 59 minutes (160 commuters, 31.2%), 40 to 44 minutes (154 commuters, 30.1%), and 60 to 89 minutes (63 commuters, 12.3%).
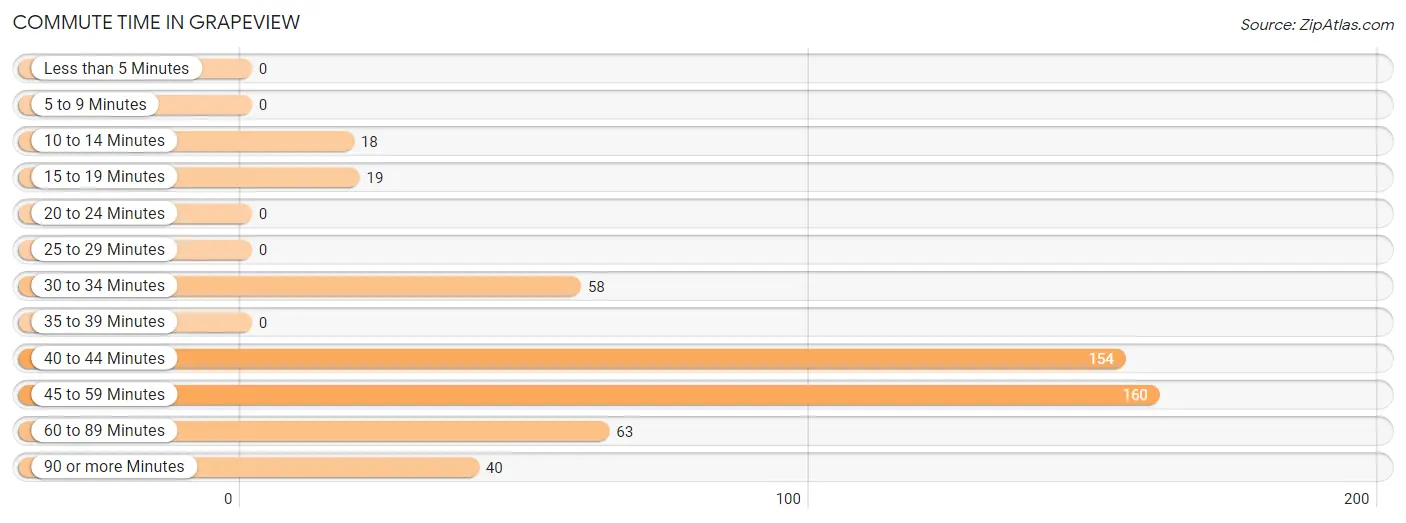
| Commute Time | # Commuters | % Commuters |
| Less than 5 Minutes | 0 | 0.0% |
| 5 to 9 Minutes | 0 | 0.0% |
| 10 to 14 Minutes | 18 | 3.5% |
| 15 to 19 Minutes | 19 | 3.7% |
| 20 to 24 Minutes | 0 | 0.0% |
| 25 to 29 Minutes | 0 | 0.0% |
| 30 to 34 Minutes | 58 | 11.3% |
| 35 to 39 Minutes | 0 | 0.0% |
| 40 to 44 Minutes | 154 | 30.1% |
| 45 to 59 Minutes | 160 | 31.2% |
| 60 to 89 Minutes | 63 | 12.3% |
| 90 or more Minutes | 40 | 7.8% |
Commute Time by Sex in Grapeview
The most common commute times in Grapeview are 40 to 44 minutes (77 commuters, 33.1%) for males and 45 to 59 minutes (109 commuters, 39.1%) for females.
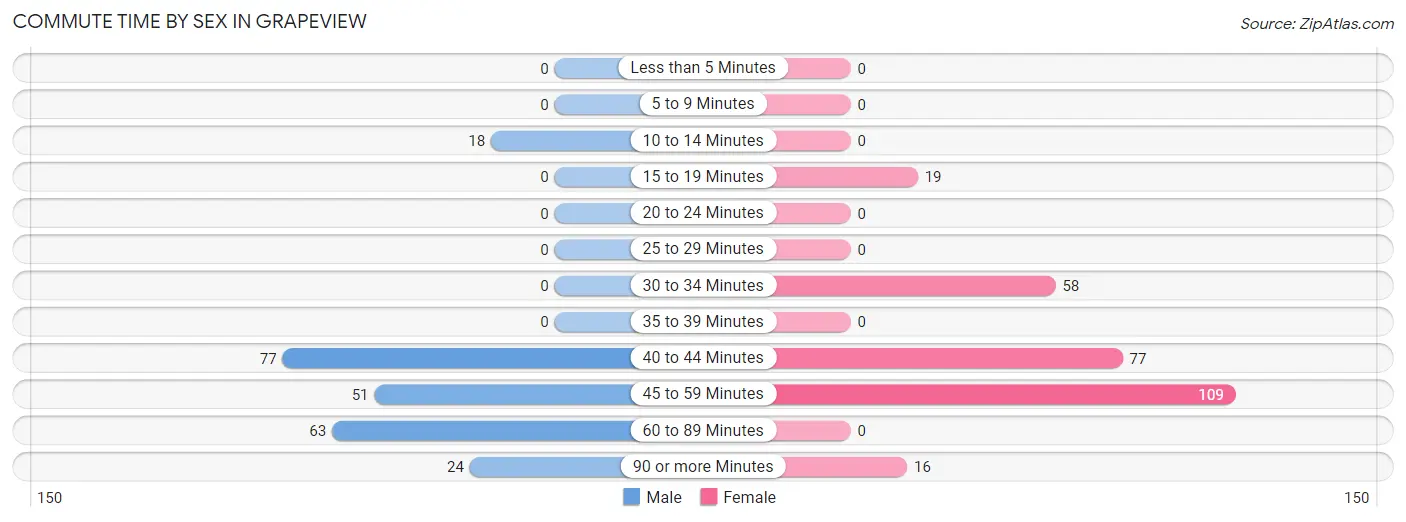
| Commute Time | Male | Female |
| Less than 5 Minutes | 0 (0.0%) | 0 (0.0%) |
| 5 to 9 Minutes | 0 (0.0%) | 0 (0.0%) |
| 10 to 14 Minutes | 18 (7.7%) | 0 (0.0%) |
| 15 to 19 Minutes | 0 (0.0%) | 19 (6.8%) |
| 20 to 24 Minutes | 0 (0.0%) | 0 (0.0%) |
| 25 to 29 Minutes | 0 (0.0%) | 0 (0.0%) |
| 30 to 34 Minutes | 0 (0.0%) | 58 (20.8%) |
| 35 to 39 Minutes | 0 (0.0%) | 0 (0.0%) |
| 40 to 44 Minutes | 77 (33.1%) | 77 (27.6%) |
| 45 to 59 Minutes | 51 (21.9%) | 109 (39.1%) |
| 60 to 89 Minutes | 63 (27.0%) | 0 (0.0%) |
| 90 or more Minutes | 24 (10.3%) | 16 (5.7%) |
Time of Departure to Work by Sex in Grapeview
The most frequent times of departure to work in Grapeview are 6:30 AM to 6:59 AM (95, 40.8%) for males and 6:30 AM to 6:59 AM (116, 41.6%) for females.
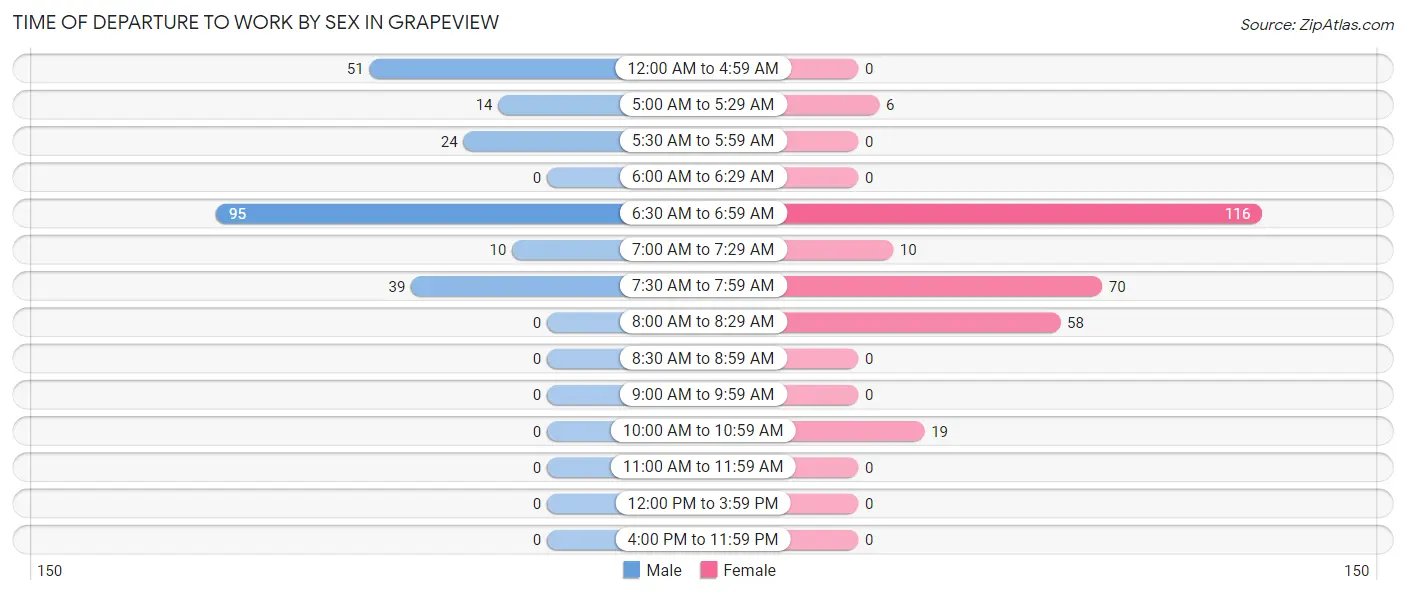
| Time of Departure | Male | Female |
| 12:00 AM to 4:59 AM | 51 (21.9%) | 0 (0.0%) |
| 5:00 AM to 5:29 AM | 14 (6.0%) | 6 (2.1%) |
| 5:30 AM to 5:59 AM | 24 (10.3%) | 0 (0.0%) |
| 6:00 AM to 6:29 AM | 0 (0.0%) | 0 (0.0%) |
| 6:30 AM to 6:59 AM | 95 (40.8%) | 116 (41.6%) |
| 7:00 AM to 7:29 AM | 10 (4.3%) | 10 (3.6%) |
| 7:30 AM to 7:59 AM | 39 (16.7%) | 70 (25.1%) |
| 8:00 AM to 8:29 AM | 0 (0.0%) | 58 (20.8%) |
| 8:30 AM to 8:59 AM | 0 (0.0%) | 0 (0.0%) |
| 9:00 AM to 9:59 AM | 0 (0.0%) | 0 (0.0%) |
| 10:00 AM to 10:59 AM | 0 (0.0%) | 19 (6.8%) |
| 11:00 AM to 11:59 AM | 0 (0.0%) | 0 (0.0%) |
| 12:00 PM to 3:59 PM | 0 (0.0%) | 0 (0.0%) |
| 4:00 PM to 11:59 PM | 0 (0.0%) | 0 (0.0%) |
| Total | 233 (100.0%) | 279 (100.0%) |
Housing Occupancy in Grapeview
Occupancy by Ownership in Grapeview
Of the total 472 dwellings in Grapeview, owner-occupied units account for 453 (96.0%), while renter-occupied units make up 19 (4.0%).
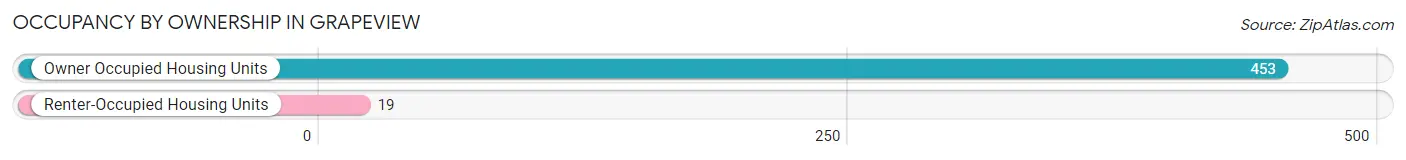
| Occupancy | # Housing Units | % Housing Units |
| Owner Occupied Housing Units | 453 | 96.0% |
| Renter-Occupied Housing Units | 19 | 4.0% |
| Total Occupied Housing Units | 472 | 100.0% |
Occupancy by Household Size in Grapeview
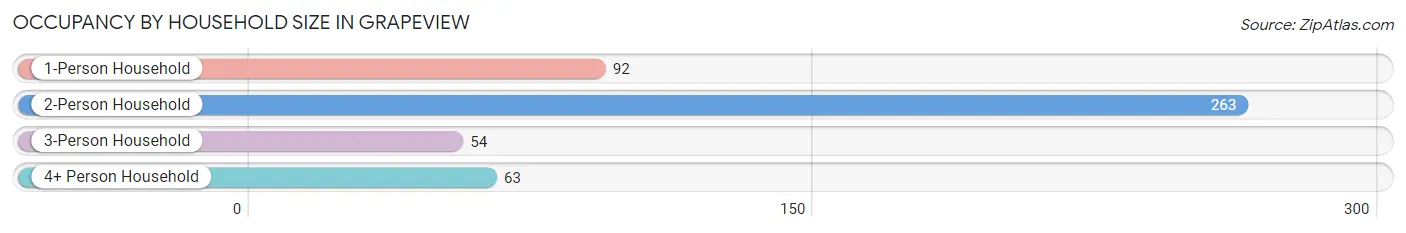
| Household Size | # Housing Units | % Housing Units |
| 1-Person Household | 92 | 19.5% |
| 2-Person Household | 263 | 55.7% |
| 3-Person Household | 54 | 11.4% |
| 4+ Person Household | 63 | 13.4% |
| Total Housing Units | 472 | 100.0% |
Occupancy by Ownership by Household Size in Grapeview
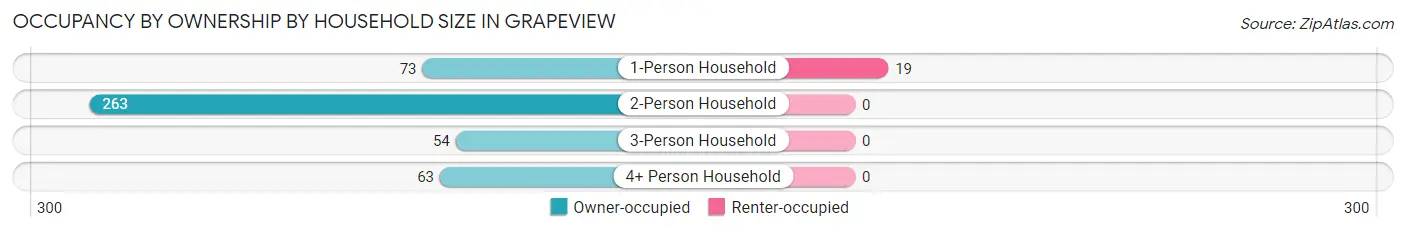
| Household Size | Owner-occupied | Renter-occupied |
| 1-Person Household | 73 (79.3%) | 19 (20.6%) |
| 2-Person Household | 263 (100.0%) | 0 (0.0%) |
| 3-Person Household | 54 (100.0%) | 0 (0.0%) |
| 4+ Person Household | 63 (100.0%) | 0 (0.0%) |
| Total Housing Units | 453 (96.0%) | 19 (4.0%) |
Occupancy by Educational Attainment in Grapeview
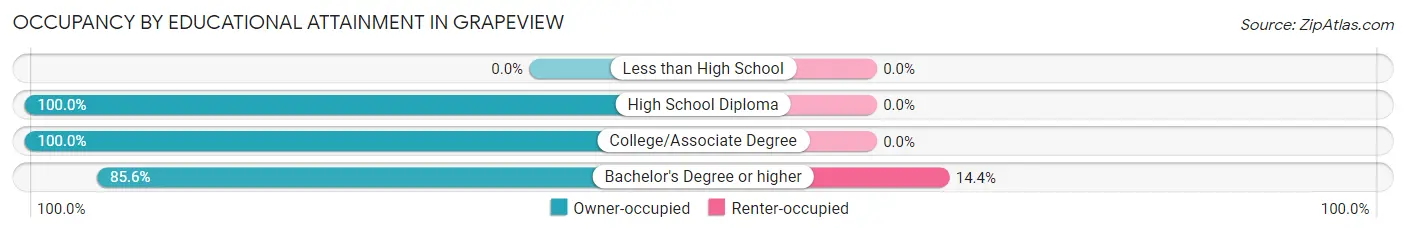
| Household Size | Owner-occupied | Renter-occupied |
| Less than High School | 0 (0.0%) | 0 (0.0%) |
| High School Diploma | 126 (100.0%) | 0 (0.0%) |
| College/Associate Degree | 214 (100.0%) | 0 (0.0%) |
| Bachelor's Degree or higher | 113 (85.6%) | 19 (14.4%) |
Occupancy by Age of Householder in Grapeview
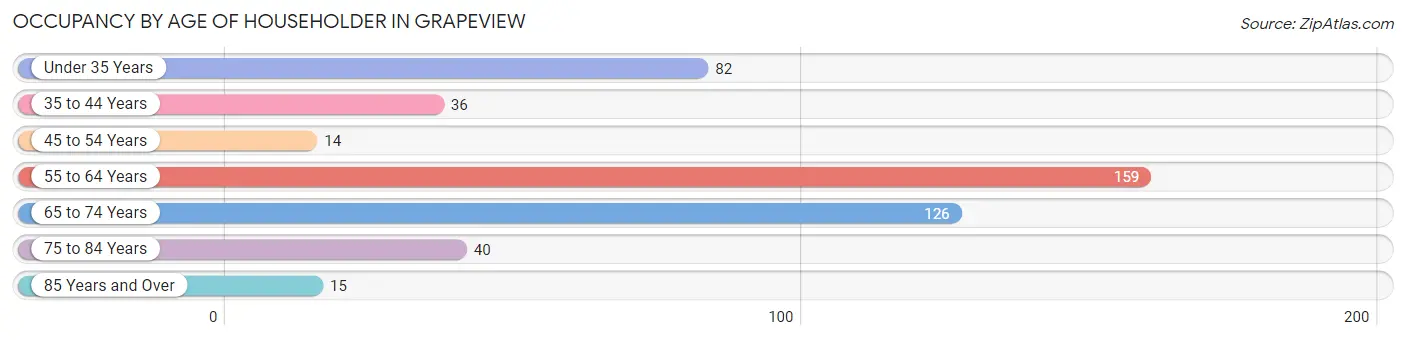
| Age Bracket | # Households | % Households |
| Under 35 Years | 82 | 17.4% |
| 35 to 44 Years | 36 | 7.6% |
| 45 to 54 Years | 14 | 3.0% |
| 55 to 64 Years | 159 | 33.7% |
| 65 to 74 Years | 126 | 26.7% |
| 75 to 84 Years | 40 | 8.5% |
| 85 Years and Over | 15 | 3.2% |
| Total | 472 | 100.0% |
Housing Finances in Grapeview
Median Income by Occupancy in Grapeview
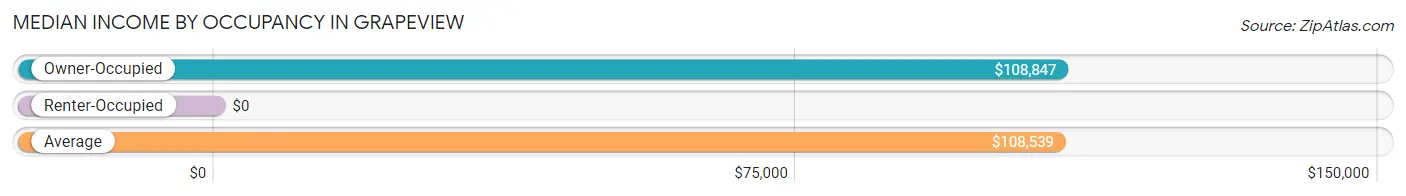
| Occupancy Type | # Households | Median Income |
| Owner-Occupied | 453 (96.0%) | $108,847 |
| Renter-Occupied | 19 (4.0%) | $0 |
| Average | 472 (100.0%) | $108,539 |
Occupancy by Householder Income Bracket in Grapeview
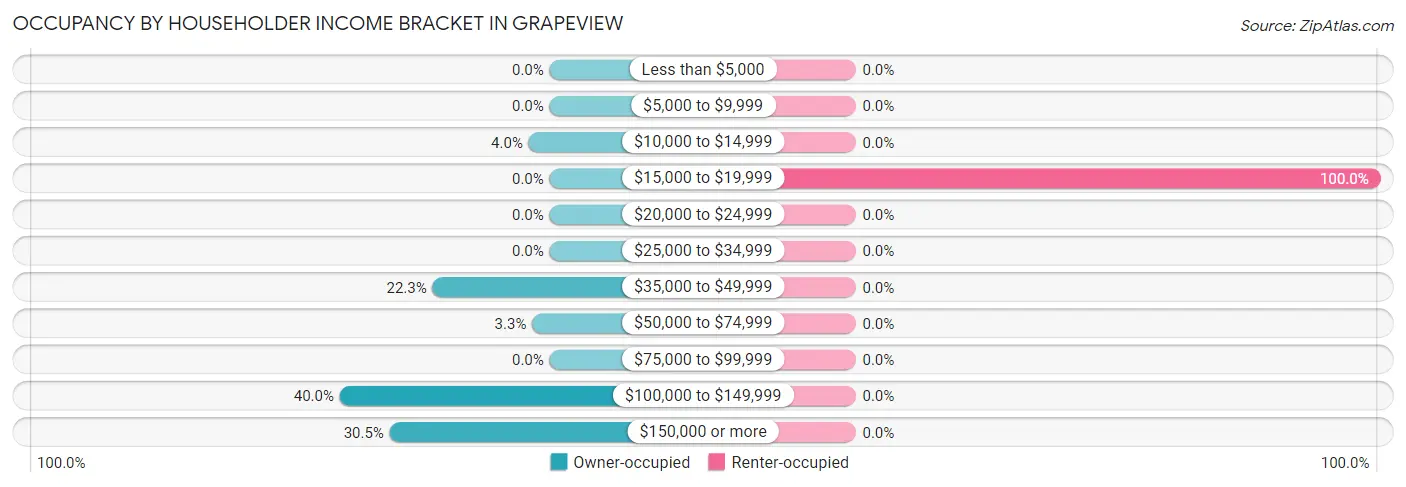
| Income Bracket | Owner-occupied | Renter-occupied |
| Less than $5,000 | 0 (0.0%) | 0 (0.0%) |
| $5,000 to $9,999 | 0 (0.0%) | 0 (0.0%) |
| $10,000 to $14,999 | 18 (4.0%) | 0 (0.0%) |
| $15,000 to $19,999 | 0 (0.0%) | 19 (100.0%) |
| $20,000 to $24,999 | 0 (0.0%) | 0 (0.0%) |
| $25,000 to $34,999 | 0 (0.0%) | 0 (0.0%) |
| $35,000 to $49,999 | 101 (22.3%) | 0 (0.0%) |
| $50,000 to $74,999 | 15 (3.3%) | 0 (0.0%) |
| $75,000 to $99,999 | 0 (0.0%) | 0 (0.0%) |
| $100,000 to $149,999 | 181 (40.0%) | 0 (0.0%) |
| $150,000 or more | 138 (30.5%) | 0 (0.0%) |
| Total | 453 (100.0%) | 19 (100.0%) |
Monthly Housing Cost Tiers in Grapeview
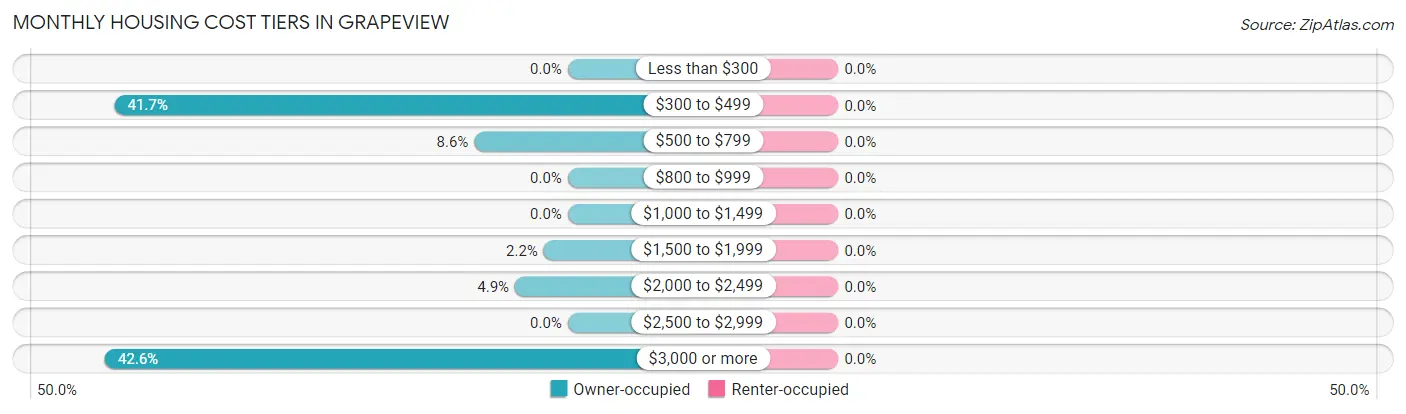
| Monthly Cost | Owner-occupied | Renter-occupied |
| Less than $300 | 0 (0.0%) | 0 (0.0%) |
| $300 to $499 | 189 (41.7%) | 0 (0.0%) |
| $500 to $799 | 39 (8.6%) | 0 (0.0%) |
| $800 to $999 | 0 (0.0%) | 0 (0.0%) |
| $1,000 to $1,499 | 0 (0.0%) | 0 (0.0%) |
| $1,500 to $1,999 | 10 (2.2%) | 0 (0.0%) |
| $2,000 to $2,499 | 22 (4.9%) | 0 (0.0%) |
| $2,500 to $2,999 | 0 (0.0%) | 0 (0.0%) |
| $3,000 or more | 193 (42.6%) | 0 (0.0%) |
| Total | 453 (100.0%) | 19 (100.0%) |
Physical Housing Characteristics in Grapeview
Housing Structures in Grapeview
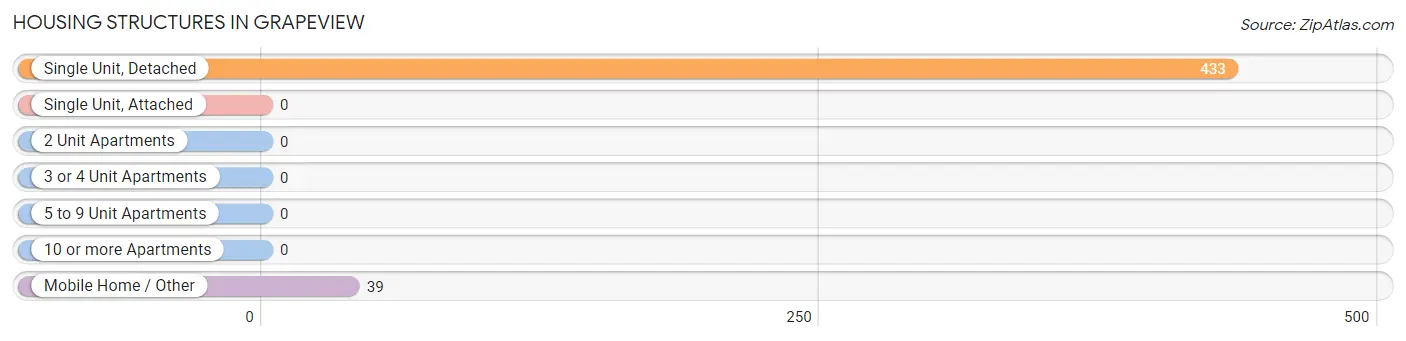
| Structure Type | # Housing Units | % Housing Units |
| Single Unit, Detached | 433 | 91.7% |
| Single Unit, Attached | 0 | 0.0% |
| 2 Unit Apartments | 0 | 0.0% |
| 3 or 4 Unit Apartments | 0 | 0.0% |
| 5 to 9 Unit Apartments | 0 | 0.0% |
| 10 or more Apartments | 0 | 0.0% |
| Mobile Home / Other | 39 | 8.3% |
| Total | 472 | 100.0% |
Housing Structures by Occupancy in Grapeview
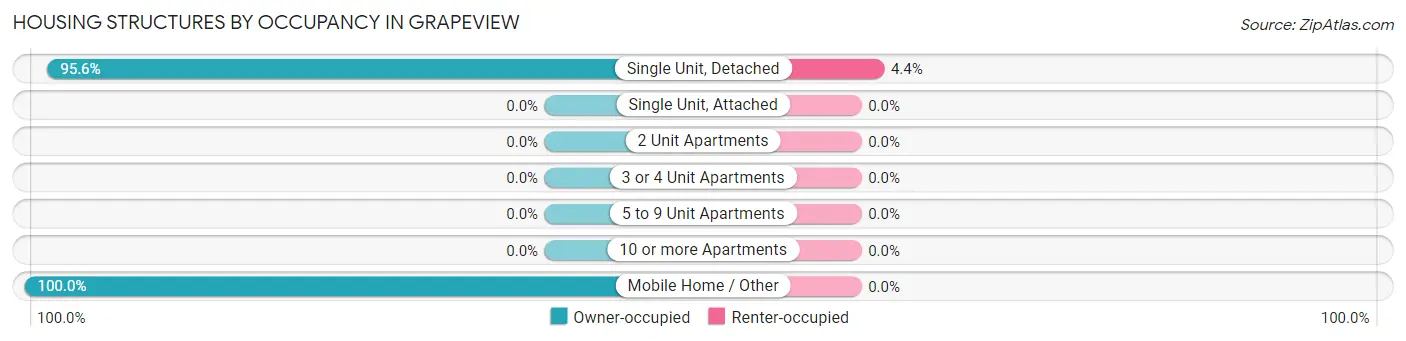
| Structure Type | Owner-occupied | Renter-occupied |
| Single Unit, Detached | 414 (95.6%) | 19 (4.4%) |
| Single Unit, Attached | 0 (0.0%) | 0 (0.0%) |
| 2 Unit Apartments | 0 (0.0%) | 0 (0.0%) |
| 3 or 4 Unit Apartments | 0 (0.0%) | 0 (0.0%) |
| 5 to 9 Unit Apartments | 0 (0.0%) | 0 (0.0%) |
| 10 or more Apartments | 0 (0.0%) | 0 (0.0%) |
| Mobile Home / Other | 39 (100.0%) | 0 (0.0%) |
| Total | 453 (96.0%) | 19 (4.0%) |
Housing Structures by Number of Rooms in Grapeview
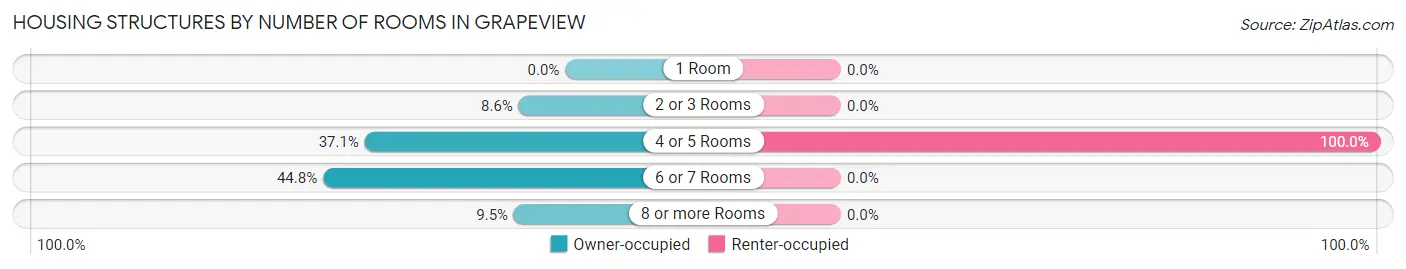
| Number of Rooms | Owner-occupied | Renter-occupied |
| 1 Room | 0 (0.0%) | 0 (0.0%) |
| 2 or 3 Rooms | 39 (8.6%) | 0 (0.0%) |
| 4 or 5 Rooms | 168 (37.1%) | 19 (100.0%) |
| 6 or 7 Rooms | 203 (44.8%) | 0 (0.0%) |
| 8 or more Rooms | 43 (9.5%) | 0 (0.0%) |
| Total | 453 (100.0%) | 19 (100.0%) |
Housing Structure by Heating Type in Grapeview
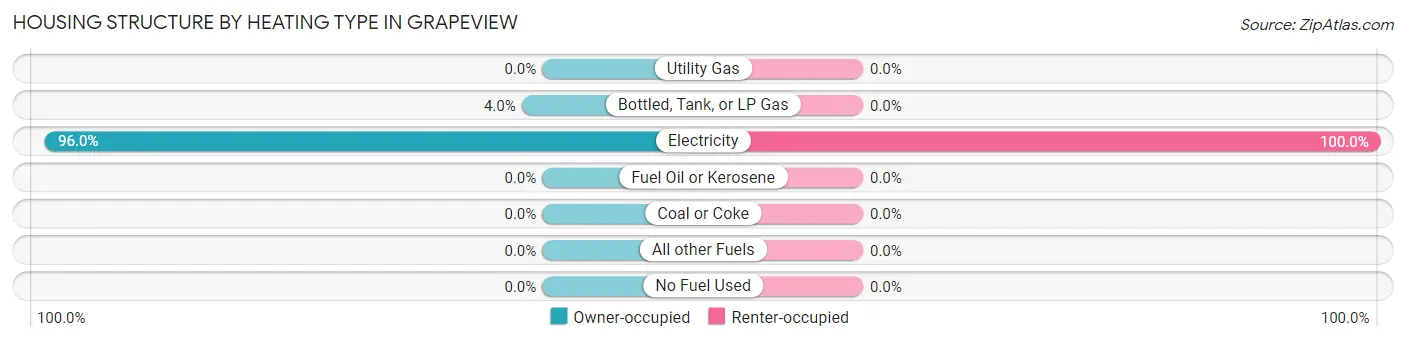
| Heating Type | Owner-occupied | Renter-occupied |
| Utility Gas | 0 (0.0%) | 0 (0.0%) |
| Bottled, Tank, or LP Gas | 18 (4.0%) | 0 (0.0%) |
| Electricity | 435 (96.0%) | 19 (100.0%) |
| Fuel Oil or Kerosene | 0 (0.0%) | 0 (0.0%) |
| Coal or Coke | 0 (0.0%) | 0 (0.0%) |
| All other Fuels | 0 (0.0%) | 0 (0.0%) |
| No Fuel Used | 0 (0.0%) | 0 (0.0%) |
| Total | 453 (100.0%) | 19 (100.0%) |
Household Vehicle Usage in Grapeview
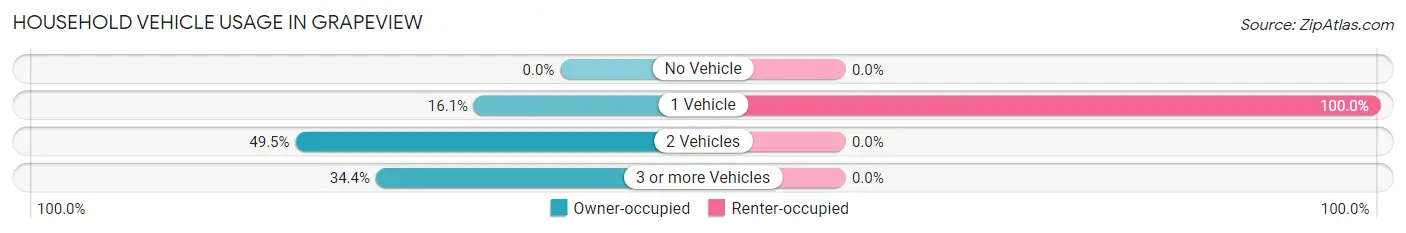
| Vehicles per Household | Owner-occupied | Renter-occupied |
| No Vehicle | 0 (0.0%) | 0 (0.0%) |
| 1 Vehicle | 73 (16.1%) | 19 (100.0%) |
| 2 Vehicles | 224 (49.4%) | 0 (0.0%) |
| 3 or more Vehicles | 156 (34.4%) | 0 (0.0%) |
| Total | 453 (100.0%) | 19 (100.0%) |
Real Estate & Mortgages in Grapeview
Real Estate and Mortgage Overview in Grapeview
| Characteristic | Without Mortgage | With Mortgage |
| Housing Units | 128 | 325 |
| Median Property Value | $454,500 | $445,300 |
| Median Household Income | - | - |
| Monthly Housing Costs | $427 | $193 |
| Real Estate Taxes | $2,923 | $39 |
Property Value by Mortgage Status in Grapeview
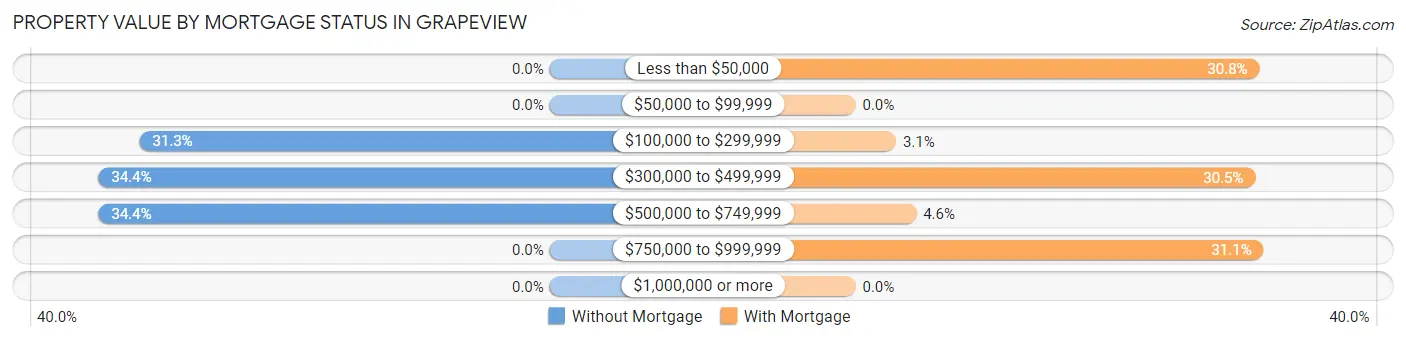
| Property Value | Without Mortgage | With Mortgage |
| Less than $50,000 | 0 (0.0%) | 100 (30.8%) |
| $50,000 to $99,999 | 0 (0.0%) | 0 (0.0%) |
| $100,000 to $299,999 | 40 (31.2%) | 10 (3.1%) |
| $300,000 to $499,999 | 44 (34.4%) | 99 (30.5%) |
| $500,000 to $749,999 | 44 (34.4%) | 15 (4.6%) |
| $750,000 to $999,999 | 0 (0.0%) | 101 (31.1%) |
| $1,000,000 or more | 0 (0.0%) | 0 (0.0%) |
| Total | 128 (100.0%) | 325 (100.0%) |
Household Income by Mortgage Status in Grapeview
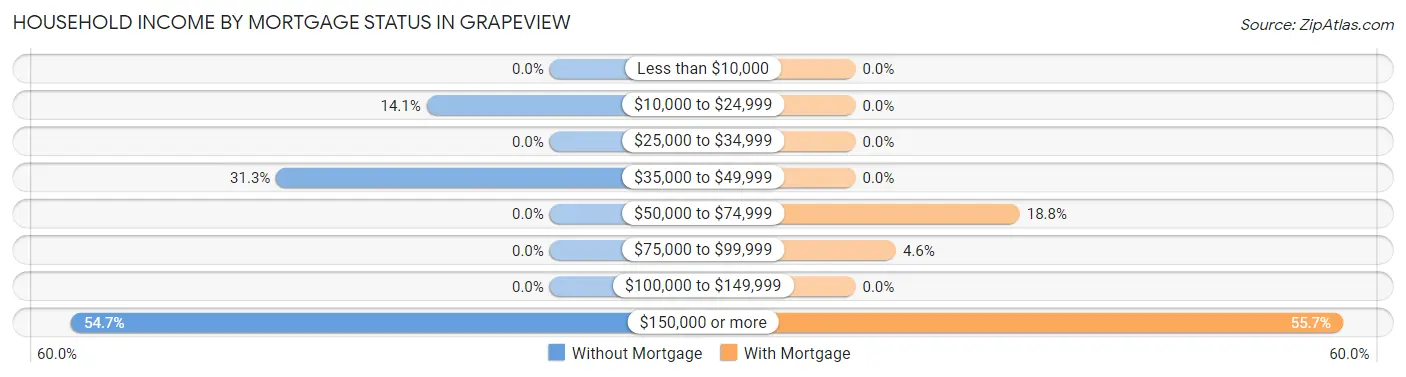
| Household Income | Without Mortgage | With Mortgage |
| Less than $10,000 | 0 (0.0%) | 0 (0.0%) |
| $10,000 to $24,999 | 18 (14.1%) | 0 (0.0%) |
| $25,000 to $34,999 | 0 (0.0%) | 0 (0.0%) |
| $35,000 to $49,999 | 40 (31.2%) | 0 (0.0%) |
| $50,000 to $74,999 | 0 (0.0%) | 61 (18.8%) |
| $75,000 to $99,999 | 0 (0.0%) | 15 (4.6%) |
| $100,000 to $149,999 | 0 (0.0%) | 0 (0.0%) |
| $150,000 or more | 70 (54.7%) | 181 (55.7%) |
| Total | 128 (100.0%) | 325 (100.0%) |
Property Value to Household Income Ratio in Grapeview
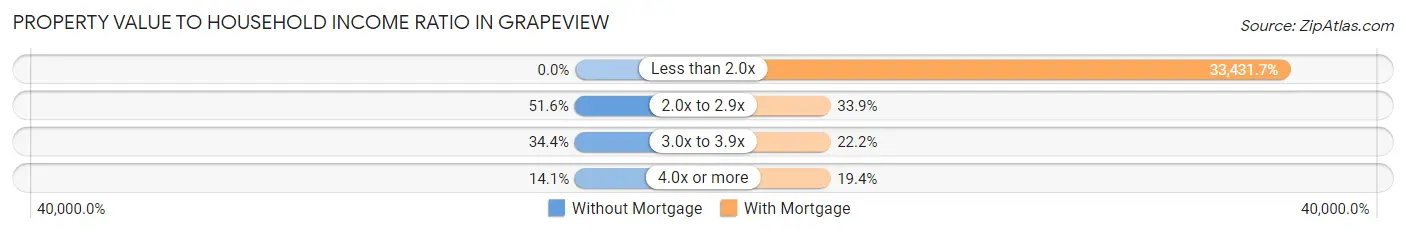
| Value-to-Income Ratio | Without Mortgage | With Mortgage |
| Less than 2.0x | 0 (0.0%) | 108,653 (33,431.7%) |
| 2.0x to 2.9x | 66 (51.6%) | 110 (33.9%) |
| 3.0x to 3.9x | 44 (34.4%) | 72 (22.2%) |
| 4.0x or more | 18 (14.1%) | 63 (19.4%) |
| Total | 128 (100.0%) | 325 (100.0%) |
Real Estate Taxes by Mortgage Status in Grapeview
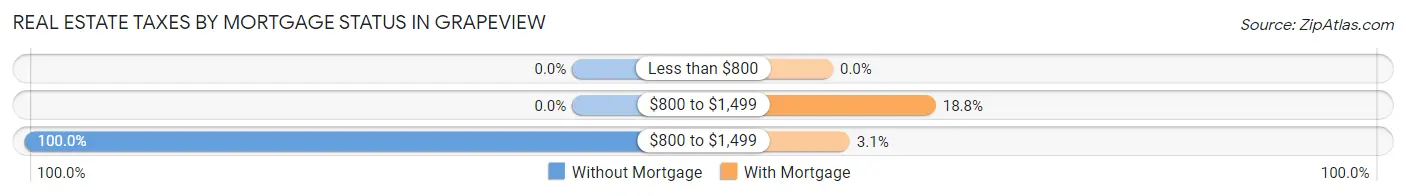
| Property Taxes | Without Mortgage | With Mortgage |
| Less than $800 | 0 (0.0%) | 0 (0.0%) |
| $800 to $1,499 | 0 (0.0%) | 61 (18.8%) |
| $800 to $1,499 | 128 (100.0%) | 10 (3.1%) |
| Total | 128 (100.0%) | 325 (100.0%) |
Health & Disability in Grapeview
Health Insurance Coverage by Age in Grapeview
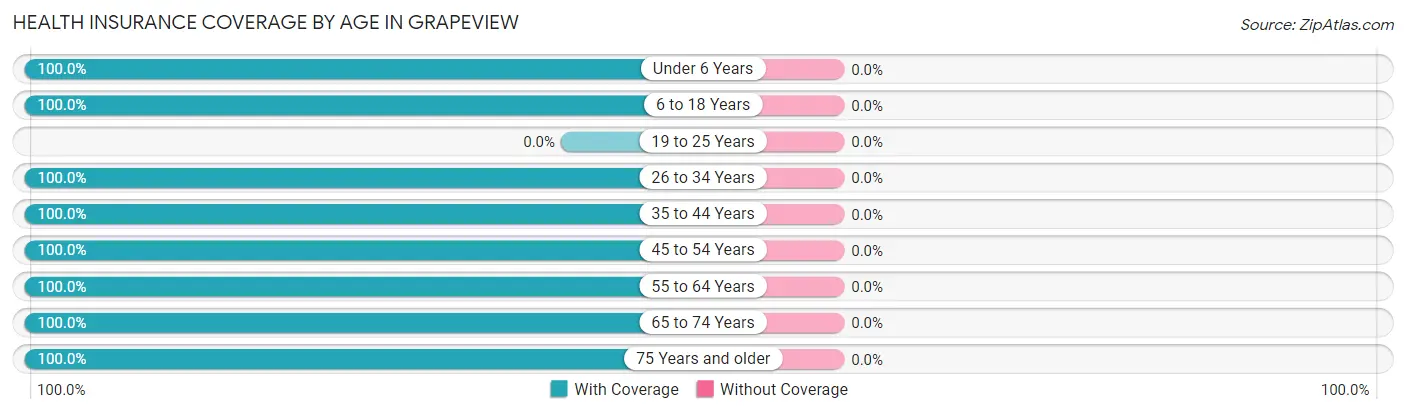
| Age Bracket | With Coverage | Without Coverage |
| Under 6 Years | 96 (100.0%) | 0 (0.0%) |
| 6 to 18 Years | 183 (100.0%) | 0 (0.0%) |
| 19 to 25 Years | 0 (0.0%) | 0 (0.0%) |
| 26 to 34 Years | 100 (100.0%) | 0 (0.0%) |
| 35 to 44 Years | 121 (100.0%) | 0 (0.0%) |
| 45 to 54 Years | 20 (100.0%) | 0 (0.0%) |
| 55 to 64 Years | 239 (100.0%) | 0 (0.0%) |
| 65 to 74 Years | 306 (100.0%) | 0 (0.0%) |
| 75 Years and older | 63 (100.0%) | 0 (0.0%) |
| Total | 1,128 (100.0%) | 0 (0.0%) |
Health Insurance Coverage by Citizenship Status in Grapeview
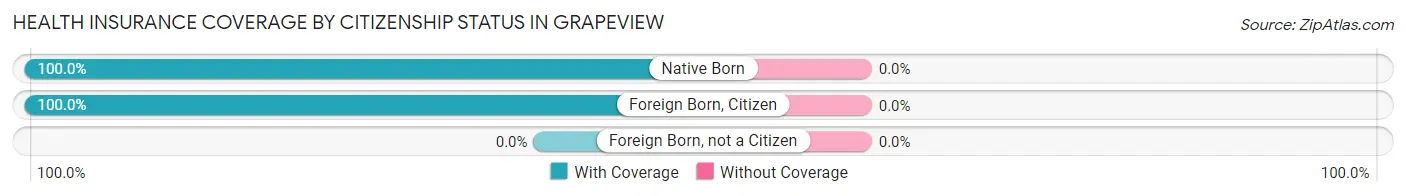
| Citizenship Status | With Coverage | Without Coverage |
| Native Born | 96 (100.0%) | 0 (0.0%) |
| Foreign Born, Citizen | 183 (100.0%) | 0 (0.0%) |
| Foreign Born, not a Citizen | 0 (0.0%) | 0 (0.0%) |
Health Insurance Coverage by Household Income in Grapeview
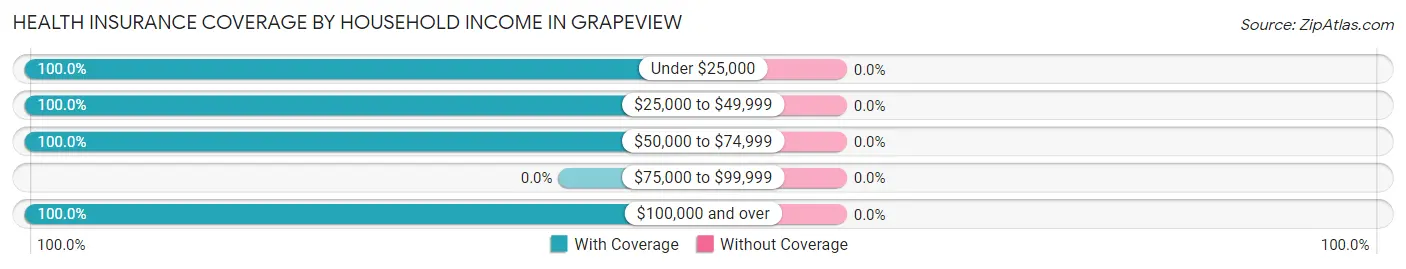
| Household Income | With Coverage | Without Coverage |
| Under $25,000 | 37 (100.0%) | 0 (0.0%) |
| $25,000 to $49,999 | 153 (100.0%) | 0 (0.0%) |
| $50,000 to $74,999 | 15 (100.0%) | 0 (0.0%) |
| $75,000 to $99,999 | 0 (0.0%) | 0 (0.0%) |
| $100,000 and over | 923 (100.0%) | 0 (0.0%) |
Public vs Private Health Insurance Coverage by Age in Grapeview
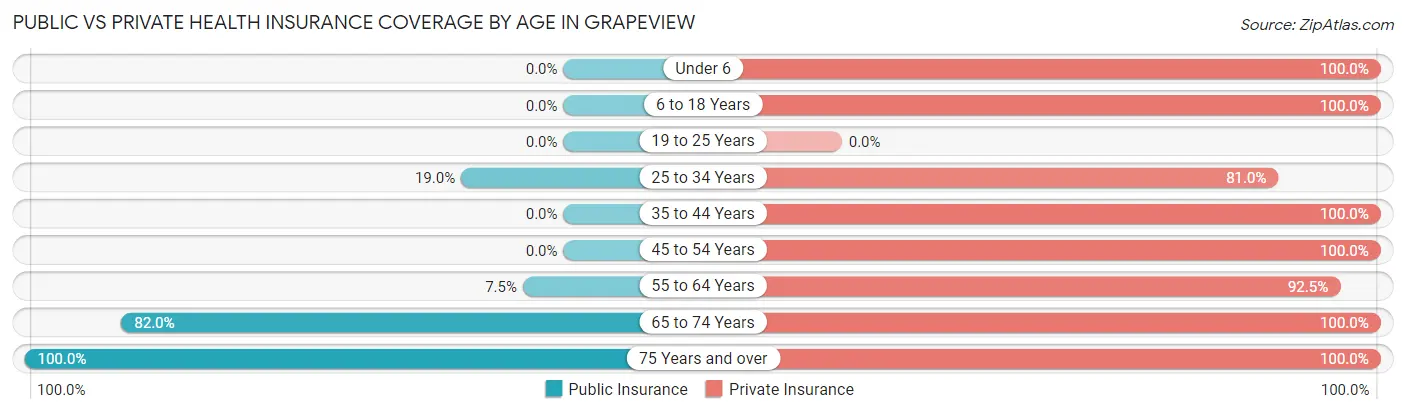
| Age Bracket | Public Insurance | Private Insurance |
| Under 6 | 0 (0.0%) | 96 (100.0%) |
| 6 to 18 Years | 0 (0.0%) | 183 (100.0%) |
| 19 to 25 Years | 0 (0.0%) | 0 (0.0%) |
| 25 to 34 Years | 19 (19.0%) | 81 (81.0%) |
| 35 to 44 Years | 0 (0.0%) | 121 (100.0%) |
| 45 to 54 Years | 0 (0.0%) | 20 (100.0%) |
| 55 to 64 Years | 18 (7.5%) | 221 (92.5%) |
| 65 to 74 Years | 251 (82.0%) | 306 (100.0%) |
| 75 Years and over | 63 (100.0%) | 63 (100.0%) |
| Total | 351 (31.1%) | 1,091 (96.7%) |
Disability Status by Sex by Age in Grapeview
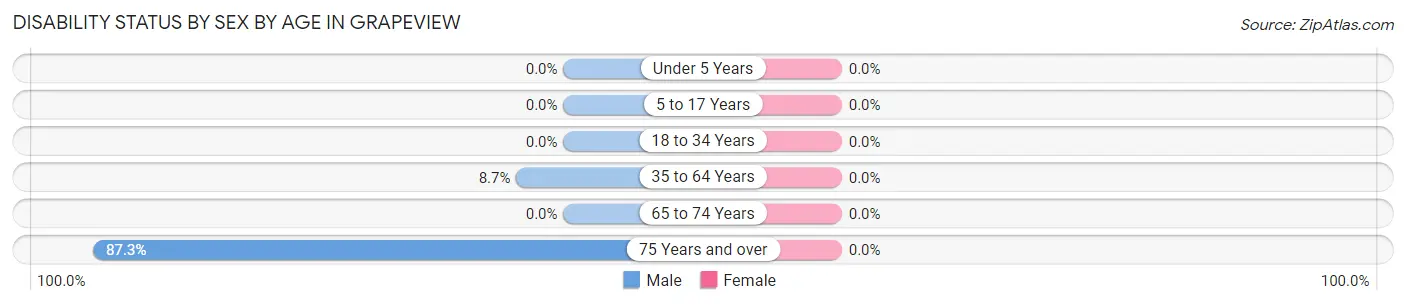
| Age Bracket | Male | Female |
| Under 5 Years | 0 (0.0%) | 0 (0.0%) |
| 5 to 17 Years | 0 (0.0%) | 0 (0.0%) |
| 18 to 34 Years | 0 (0.0%) | 0 (0.0%) |
| 35 to 64 Years | 18 (8.7%) | 0 (0.0%) |
| 65 to 74 Years | 0 (0.0%) | 0 (0.0%) |
| 75 Years and over | 55 (87.3%) | 0 (0.0%) |
Disability Class by Sex by Age in Grapeview
Disability Class: Hearing Difficulty
| Age Bracket | Male | Female |
| Under 5 Years | 0 (0.0%) | 0 (0.0%) |
| 5 to 17 Years | 0 (0.0%) | 0 (0.0%) |
| 18 to 34 Years | 0 (0.0%) | 0 (0.0%) |
| 35 to 64 Years | 0 (0.0%) | 0 (0.0%) |
| 65 to 74 Years | 0 (0.0%) | 0 (0.0%) |
| 75 Years and over | 0 (0.0%) | 0 (0.0%) |
Disability Class: Vision Difficulty
| Age Bracket | Male | Female |
| Under 5 Years | 0 (0.0%) | 0 (0.0%) |
| 5 to 17 Years | 0 (0.0%) | 0 (0.0%) |
| 18 to 34 Years | 0 (0.0%) | 0 (0.0%) |
| 35 to 64 Years | 0 (0.0%) | 0 (0.0%) |
| 65 to 74 Years | 0 (0.0%) | 0 (0.0%) |
| 75 Years and over | 0 (0.0%) | 0 (0.0%) |
Disability Class: Cognitive Difficulty
| Age Bracket | Male | Female |
| 5 to 17 Years | 0 (0.0%) | 0 (0.0%) |
| 18 to 34 Years | 0 (0.0%) | 0 (0.0%) |
| 35 to 64 Years | 0 (0.0%) | 0 (0.0%) |
| 65 to 74 Years | 0 (0.0%) | 0 (0.0%) |
| 75 Years and over | 0 (0.0%) | 0 (0.0%) |
Disability Class: Ambulatory Difficulty
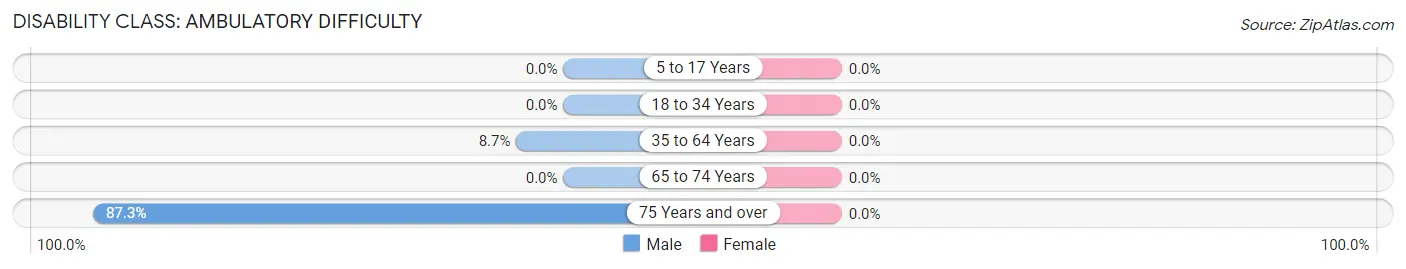
| Age Bracket | Male | Female |
| 5 to 17 Years | 0 (0.0%) | 0 (0.0%) |
| 18 to 34 Years | 0 (0.0%) | 0 (0.0%) |
| 35 to 64 Years | 18 (8.7%) | 0 (0.0%) |
| 65 to 74 Years | 0 (0.0%) | 0 (0.0%) |
| 75 Years and over | 55 (87.3%) | 0 (0.0%) |
Disability Class: Self-Care Difficulty
| Age Bracket | Male | Female |
| 5 to 17 Years | 0 (0.0%) | 0 (0.0%) |
| 18 to 34 Years | 0 (0.0%) | 0 (0.0%) |
| 35 to 64 Years | 0 (0.0%) | 0 (0.0%) |
| 65 to 74 Years | 0 (0.0%) | 0 (0.0%) |
| 75 Years and over | 0 (0.0%) | 0 (0.0%) |
Technology Access in Grapeview
Computing Device Access in Grapeview
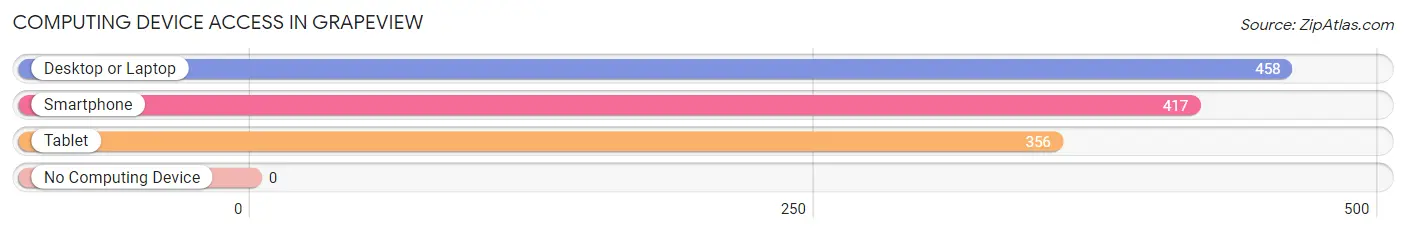
| Device Type | # Households | % Households |
| Desktop or Laptop | 458 | 97.0% |
| Smartphone | 417 | 88.3% |
| Tablet | 356 | 75.4% |
| No Computing Device | 0 | 0.0% |
| Total | 472 | 100.0% |
Internet Access in Grapeview
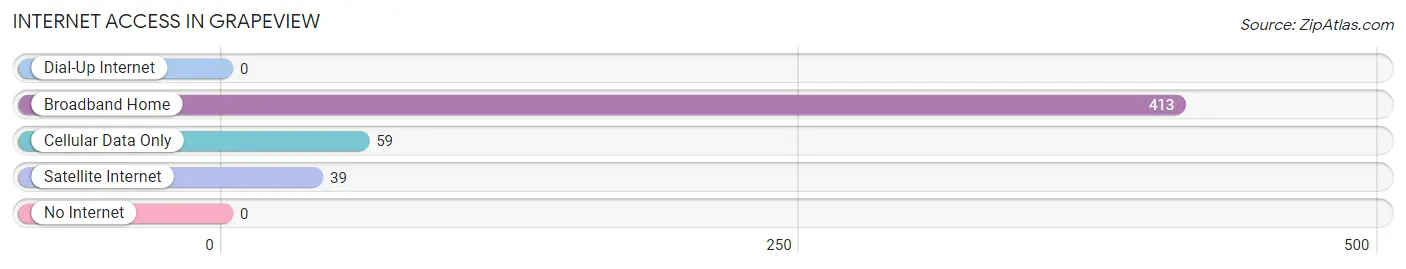
| Internet Type | # Households | % Households |
| Dial-Up Internet | 0 | 0.0% |
| Broadband Home | 413 | 87.5% |
| Cellular Data Only | 59 | 12.5% |
| Satellite Internet | 39 | 8.3% |
| No Internet | 0 | 0.0% |
| Total | 472 | 100.0% |
Grapeview Summary
Grapeview is a small unincorporated community located in Mason County, Washington, United States. It is situated on the shores of Case Inlet, a part of the Puget Sound. The community is located approximately 10 miles south of Shelton, the county seat, and is part of the Shelton Micropolitan Statistical Area.
History
Grapeview was first settled in the late 1800s by a group of homesteaders who were attracted to the area by its abundance of natural resources. The community was named after the wild grapes that grew in the area. The first post office was established in 1891 and the town was officially incorporated in 1909.
Grapeview was a thriving community in the early 1900s, with a population of over 500 people. The town had a general store, a hotel, a sawmill, a blacksmith shop, and a school. The town was also home to a number of churches, including the Methodist Episcopal Church, the Baptist Church, and the Catholic Church.
In the 1920s, the town began to decline as the timber industry moved away from the area. The population dropped to just over 200 people by the 1950s. The town continued to decline until the 1980s when it began to experience a resurgence.
Geography
Grapeview is located in Mason County, Washington, on the shores of Case Inlet, a part of the Puget Sound. The community is located approximately 10 miles south of Shelton, the county seat. The town is situated on a peninsula that is surrounded by the waters of Case Inlet, Pickering Passage, and Oakland Bay.
The town is located in a temperate rainforest climate, with mild temperatures and abundant rainfall. The average annual temperature is around 50°F (10°C), and the average annual precipitation is around 50 inches (127 cm).
Economy
Grapeview’s economy is largely based on tourism and recreation. The town is home to a number of marinas, boat launches, and other recreational facilities. The town is also home to a number of small businesses, including restaurants, gift shops, and art galleries.
The town is also home to a number of oyster farms, which provide a significant source of income for the local economy. The oyster farms are located in the waters of Case Inlet and Pickering Passage.
Demographics
As of the 2010 census, the population of Grapeview was 545. The racial makeup of the town was 94.3% White, 0.7% African American, 0.7% Native American, 0.7% Asian, 0.4% Pacific Islander, and 2.7% from other races. The median household income was $41,250, and the median family income was $45,625.
Conclusion
Grapeview is a small unincorporated community located in Mason County, Washington, United States. It is situated on the shores of Case Inlet, a part of the Puget Sound. The community was first settled in the late 1800s and was officially incorporated in 1909. The town has experienced a resurgence in recent years, with its economy largely based on tourism and recreation. The population of Grapeview was 545 as of the 2010 census, with a median household income of $41,250.
Common Questions
What is Per Capita Income in Grapeview?
Per Capita income in Grapeview is $51,323.
What is the Median Family Income in Grapeview?
Median Family Income in Grapeview is $109,870.
What is the Median Household income in Grapeview?
Median Household Income in Grapeview is $108,539.
What is Inequality or Gini Index in Grapeview?
Inequality or Gini Index in Grapeview is 0.37.
What is the Total Population of Grapeview?
Total Population of Grapeview is 1,128.
What is the Total Male Population of Grapeview?
Total Male Population of Grapeview is 667.
What is the Total Female Population of Grapeview?
Total Female Population of Grapeview is 461.
What is the Ratio of Males per 100 Females in Grapeview?
There are 144.69 Males per 100 Females in Grapeview.
What is the Ratio of Females per 100 Males in Grapeview?
There are 69.12 Females per 100 Males in Grapeview.
What is the Median Population Age in Grapeview?
Median Population Age in Grapeview is 59.2 Years.
What is the Average Family Size in Grapeview
Average Family Size in Grapeview is 2.8 People.
What is the Average Household Size in Grapeview
Average Household Size in Grapeview is 2.4 People.
How Large is the Labor Force in Grapeview?
There are 550 People in the Labor Forcein in Grapeview.
What is the Percentage of People in the Labor Force in Grapeview?
64.8% of People are in the Labor Force in Grapeview.