Castle Rock, WA Map & Demographics
Castle Rock Map
Castle Rock Overview
$26,167
PER CAPITA INCOME
$73,026
AVG FAMILY INCOME
$63,750
AVG HOUSEHOLD INCOME
53.3%
WAGE / INCOME GAP [ % ]
46.7¢/ $1
WAGE / INCOME GAP [ $ ]
0.40
INEQUALITY / GINI INDEX
2,624
TOTAL POPULATION
1,165
MALE POPULATION
1,459
FEMALE POPULATION
79.85
MALES / 100 FEMALES
125.24
FEMALES / 100 MALES
29.0
MEDIAN AGE
3.6
AVG FAMILY SIZE
2.8
AVG HOUSEHOLD SIZE
959
LABOR FORCE [ PEOPLE ]
51.5%
PERCENT IN LABOR FORCE
7.0%
UNEMPLOYMENT RATE
Castle Rock Zip Codes
Castle Rock Area Codes
Income in Castle Rock
Income Overview in Castle Rock
Per Capita Income in Castle Rock is $26,167, while median incomes of families and households are $73,026 and $63,750 respectively.
| Characteristic | Number | Measure |
| Per Capita Income | 2,624 | $26,167 |
| Median Family Income | 608 | $73,026 |
| Mean Family Income | 608 | $82,193 |
| Median Household Income | 941 | $63,750 |
| Mean Household Income | 941 | $71,447 |
| Income Deficit | 608 | $0 |
| Wage / Income Gap (%) | 2,624 | 53.34% |
| Wage / Income Gap ($) | 2,624 | 46.66¢ per $1 |
| Gini / Inequality Index | 2,624 | 0.40 |
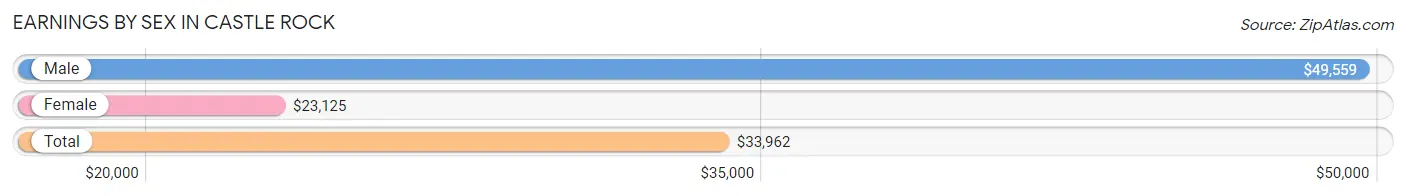
Earnings by Sex in Castle Rock
Average Earnings in Castle Rock are $33,962, $49,559 for men and $23,125 for women, a difference of 53.3%.
| Sex | Number | Average Earnings |
| Male | 448 (41.4%) | $49,559 |
| Female | 634 (58.6%) | $23,125 |
| Total | 1,082 (100.0%) | $33,962 |
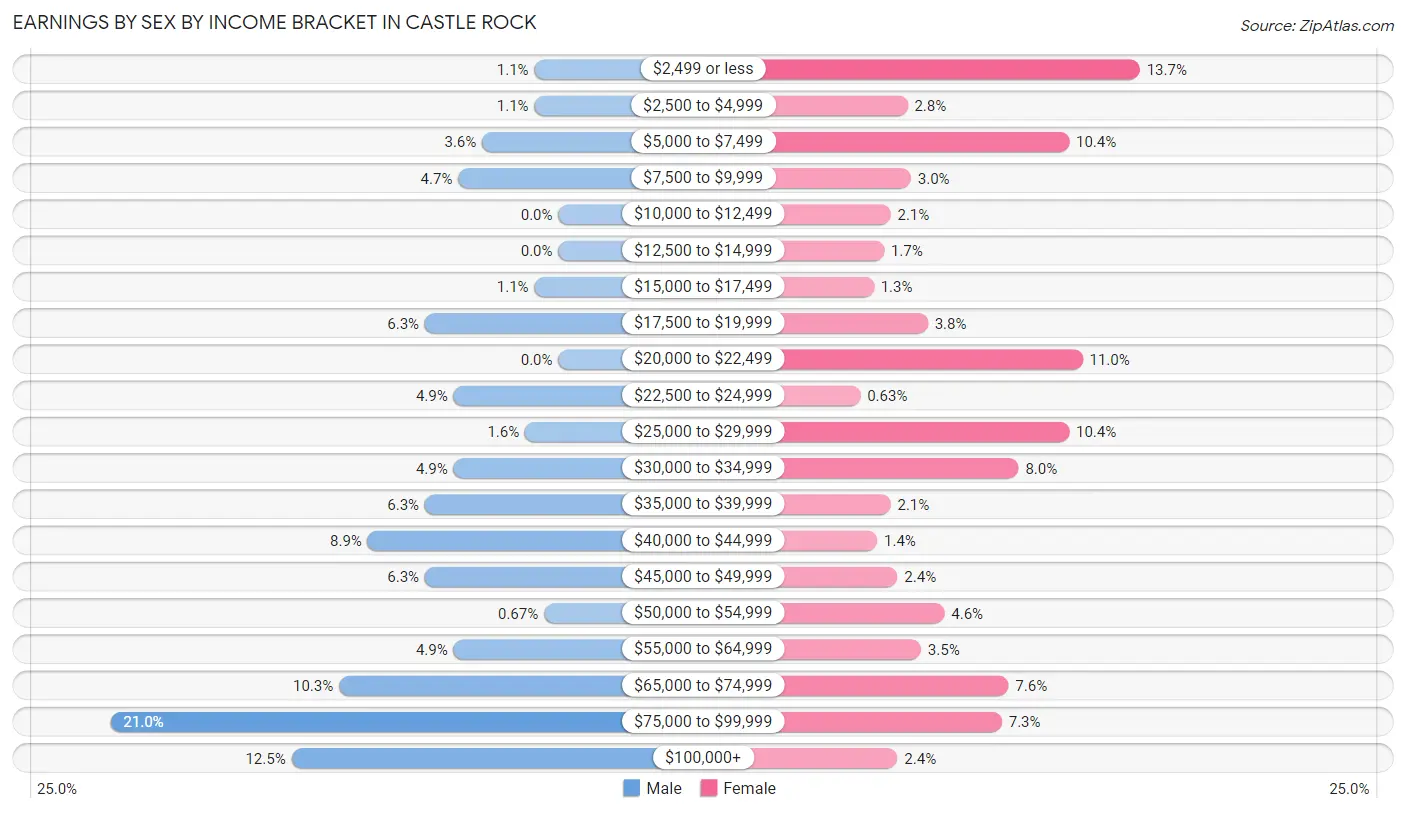
Earnings by Sex by Income Bracket in Castle Rock
The most common earnings brackets in Castle Rock are $75,000 to $99,999 for men (94 | 21.0%) and $2,499 or less for women (87 | 13.7%).
| Income | Male | Female |
| $2,499 or less | 5 (1.1%) | 87 (13.7%) |
| $2,500 to $4,999 | 5 (1.1%) | 18 (2.8%) |
| $5,000 to $7,499 | 16 (3.6%) | 66 (10.4%) |
| $7,500 to $9,999 | 21 (4.7%) | 19 (3.0%) |
| $10,000 to $12,499 | 0 (0.0%) | 13 (2.1%) |
| $12,500 to $14,999 | 0 (0.0%) | 11 (1.7%) |
| $15,000 to $17,499 | 5 (1.1%) | 8 (1.3%) |
| $17,500 to $19,999 | 28 (6.2%) | 24 (3.8%) |
| $20,000 to $22,499 | 0 (0.0%) | 70 (11.0%) |
| $22,500 to $24,999 | 22 (4.9%) | 4 (0.6%) |
| $25,000 to $29,999 | 7 (1.6%) | 66 (10.4%) |
| $30,000 to $34,999 | 22 (4.9%) | 51 (8.0%) |
| $35,000 to $39,999 | 28 (6.2%) | 13 (2.1%) |
| $40,000 to $44,999 | 40 (8.9%) | 9 (1.4%) |
| $45,000 to $49,999 | 28 (6.2%) | 15 (2.4%) |
| $50,000 to $54,999 | 3 (0.7%) | 29 (4.6%) |
| $55,000 to $64,999 | 22 (4.9%) | 22 (3.5%) |
| $65,000 to $74,999 | 46 (10.3%) | 48 (7.6%) |
| $75,000 to $99,999 | 94 (21.0%) | 46 (7.3%) |
| $100,000+ | 56 (12.5%) | 15 (2.4%) |
| Total | 448 (100.0%) | 634 (100.0%) |
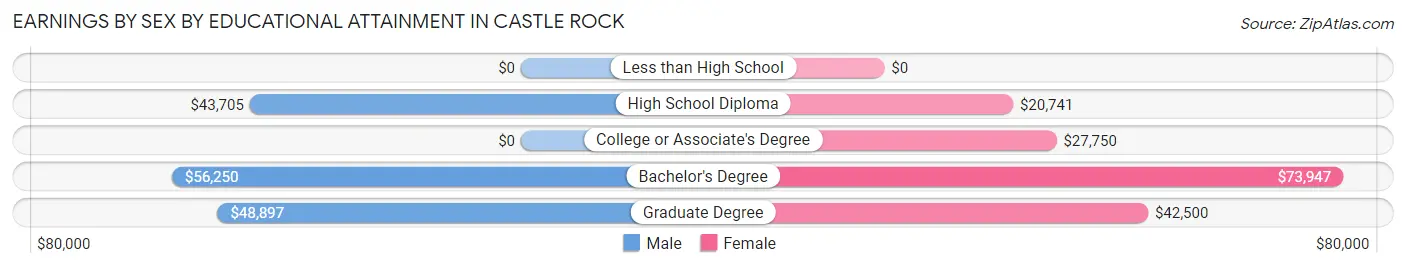
Earnings by Sex by Educational Attainment in Castle Rock
Average earnings in Castle Rock are $48,235 for men and $29,453 for women, a difference of 38.9%. Men with an educational attainment of bachelor's degree enjoy the highest average annual earnings of $56,250, while those with high school diploma education earn the least with $43,705. Women with an educational attainment of bachelor's degree earn the most with the average annual earnings of $73,947, while those with high school diploma education have the smallest earnings of $20,741.
| Educational Attainment | Male Income | Female Income |
| Less than High School | - | - |
| High School Diploma | $43,705 | $20,741 |
| College or Associate's Degree | - | - |
| Bachelor's Degree | $56,250 | $73,947 |
| Graduate Degree | $48,897 | $42,500 |
| Total | $48,235 | $29,453 |
Family Income in Castle Rock
Family Income Brackets in Castle Rock
According to the Castle Rock family income data, there are 137 families falling into the $100,000 to $149,999 income range, which is the most common income bracket and makes up 22.5% of all families.
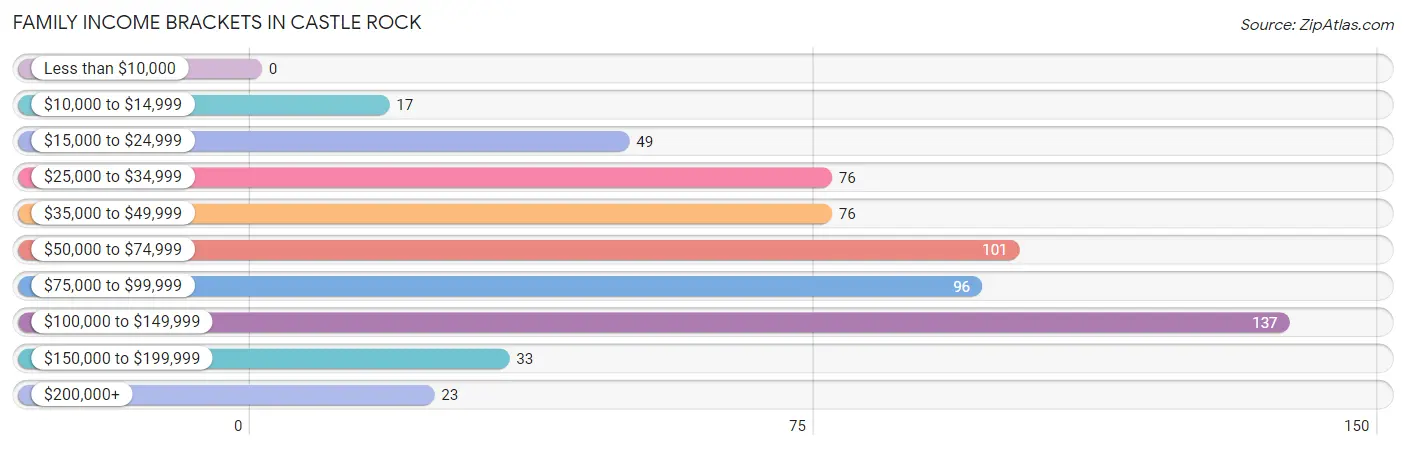
| Income Bracket | # Families | % Families |
| Less than $10,000 | 0 | 0.0% |
| $10,000 to $14,999 | 17 | 2.8% |
| $15,000 to $24,999 | 49 | 8.1% |
| $25,000 to $34,999 | 76 | 12.5% |
| $35,000 to $49,999 | 76 | 12.5% |
| $50,000 to $74,999 | 101 | 16.6% |
| $75,000 to $99,999 | 96 | 15.8% |
| $100,000 to $149,999 | 137 | 22.5% |
| $150,000 to $199,999 | 33 | 5.4% |
| $200,000+ | 23 | 3.8% |
Family Income by Famaliy Size in Castle Rock
4-person families (212 | 34.9%) account for the highest median family income in Castle Rock with $68,750 per family, while 2-person families (238 | 39.1%) have the highest median income of $33,264 per family member.
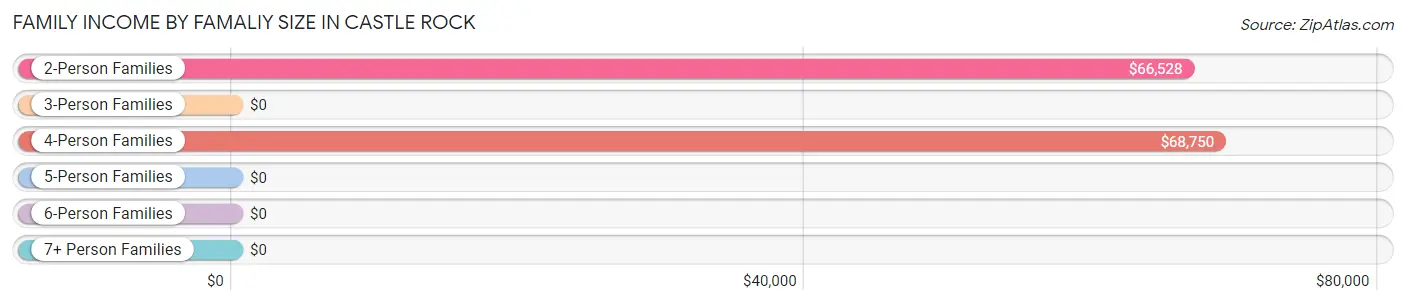
| Income Bracket | # Families | Median Income |
| 2-Person Families | 238 (39.1%) | $66,528 |
| 3-Person Families | 96 (15.8%) | $0 |
| 4-Person Families | 212 (34.9%) | $68,750 |
| 5-Person Families | 35 (5.8%) | $0 |
| 6-Person Families | 5 (0.8%) | $0 |
| 7+ Person Families | 22 (3.6%) | $0 |
| Total | 608 (100.0%) | $73,026 |
Family Income by Number of Earners in Castle Rock
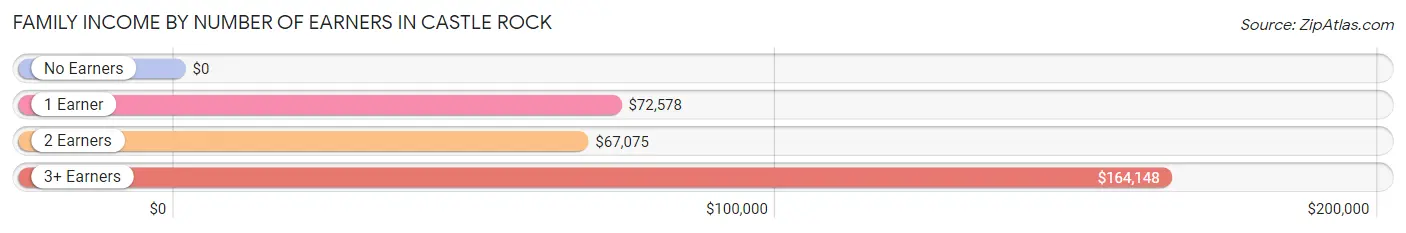
| Number of Earners | # Families | Median Income |
| No Earners | 131 (21.5%) | $0 |
| 1 Earner | 199 (32.7%) | $72,578 |
| 2 Earners | 233 (38.3%) | $67,075 |
| 3+ Earners | 45 (7.4%) | $164,148 |
| Total | 608 (100.0%) | $73,026 |
Household Income in Castle Rock
Household Income Brackets in Castle Rock
With 190 households falling in the category, the $50,000 to $74,999 income range is the most frequent in Castle Rock, accounting for 20.2% of all households. In contrast, only 23 households (2.4%) fall into the $200,000+ income bracket, making it the least populous group.
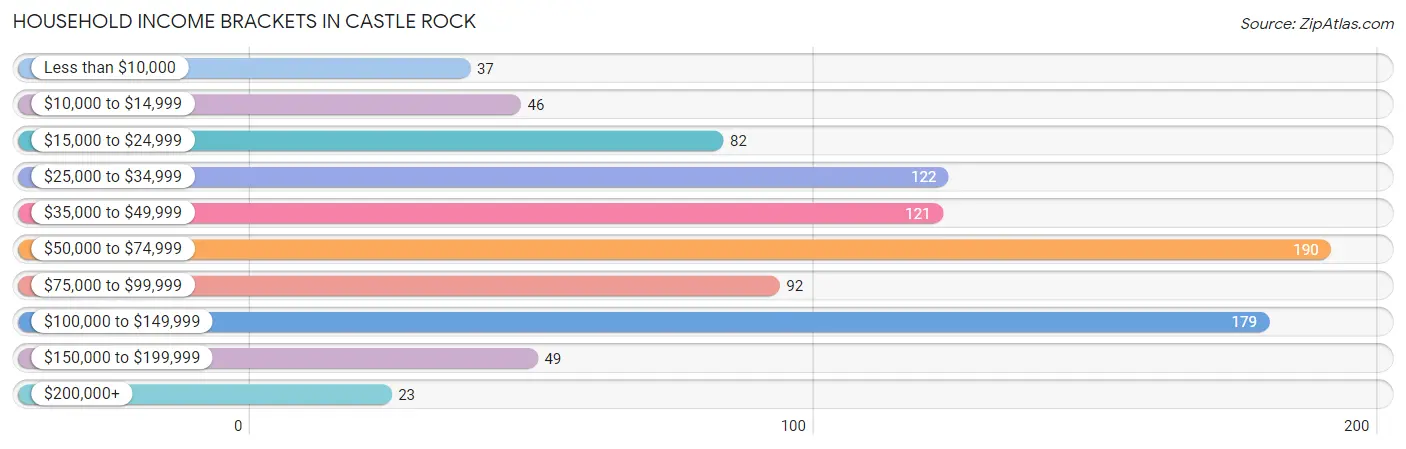
| Income Bracket | # Households | % Households |
| Less than $10,000 | 37 | 3.9% |
| $10,000 to $14,999 | 46 | 4.9% |
| $15,000 to $24,999 | 82 | 8.7% |
| $25,000 to $34,999 | 122 | 13.0% |
| $35,000 to $49,999 | 121 | 12.9% |
| $50,000 to $74,999 | 190 | 20.2% |
| $75,000 to $99,999 | 92 | 9.8% |
| $100,000 to $149,999 | 179 | 19.0% |
| $150,000 to $199,999 | 49 | 5.2% |
| $200,000+ | 23 | 2.4% |
Household Income by Householder Age in Castle Rock
The median household income in Castle Rock is $63,750, with the highest median household income of $66,450 found in the 25 to 44 years age bracket for the primary householder. A total of 382 households (40.6%) fall into this category. Meanwhile, the 15 to 24 years age bracket for the primary householder has the lowest median household income of $0, with 23 households (2.4%) in this group.
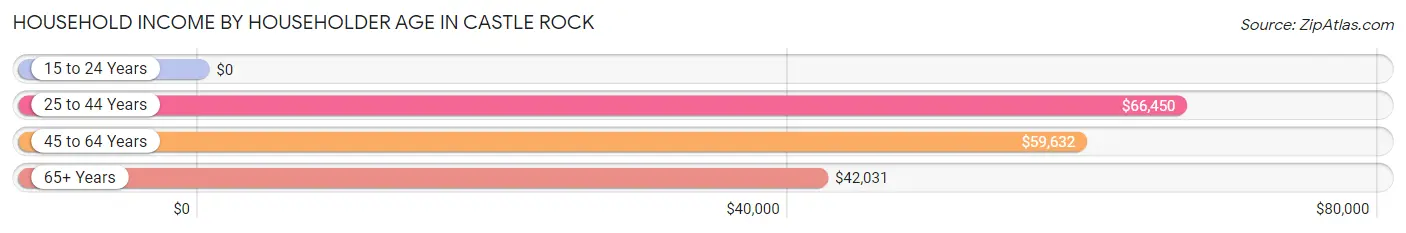
| Income Bracket | # Households | Median Income |
| 15 to 24 Years | 23 (2.4%) | $0 |
| 25 to 44 Years | 382 (40.6%) | $66,450 |
| 45 to 64 Years | 293 (31.1%) | $59,632 |
| 65+ Years | 243 (25.8%) | $42,031 |
| Total | 941 (100.0%) | $63,750 |
Poverty in Castle Rock
Income Below Poverty by Sex and Age in Castle Rock
With 4.3% poverty level for males and 10.6% for females among the residents of Castle Rock, 55 to 64 year old males and 55 to 64 year old females are the most vulnerable to poverty, with 26 males (24.5%) and 44 females (41.5%) in their respective age groups living below the poverty level.
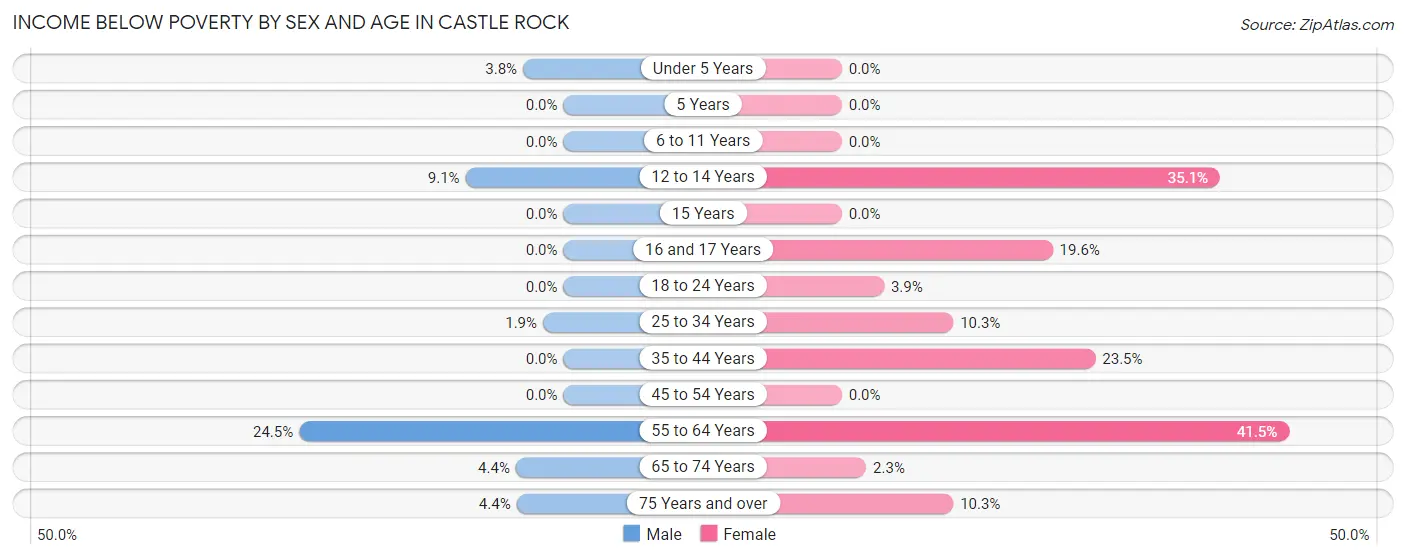
| Age Bracket | Male | Female |
| Under 5 Years | 6 (3.7%) | 0 (0.0%) |
| 5 Years | 0 (0.0%) | 0 (0.0%) |
| 6 to 11 Years | 0 (0.0%) | 0 (0.0%) |
| 12 to 14 Years | 5 (9.1%) | 20 (35.1%) |
| 15 Years | 0 (0.0%) | 0 (0.0%) |
| 16 and 17 Years | 0 (0.0%) | 9 (19.6%) |
| 18 to 24 Years | 0 (0.0%) | 5 (3.9%) |
| 25 to 34 Years | 4 (1.9%) | 33 (10.3%) |
| 35 to 44 Years | 0 (0.0%) | 32 (23.5%) |
| 45 to 54 Years | 0 (0.0%) | 0 (0.0%) |
| 55 to 64 Years | 26 (24.5%) | 44 (41.5%) |
| 65 to 74 Years | 5 (4.4%) | 3 (2.3%) |
| 75 Years and over | 4 (4.3%) | 6 (10.3%) |
| Total | 50 (4.3%) | 152 (10.6%) |
Income Above Poverty by Sex and Age in Castle Rock
According to the poverty statistics in Castle Rock, males aged 5 years and females aged under 5 years are the age groups that are most secure financially, with 100.0% of males and 100.0% of females in these age groups living above the poverty line.
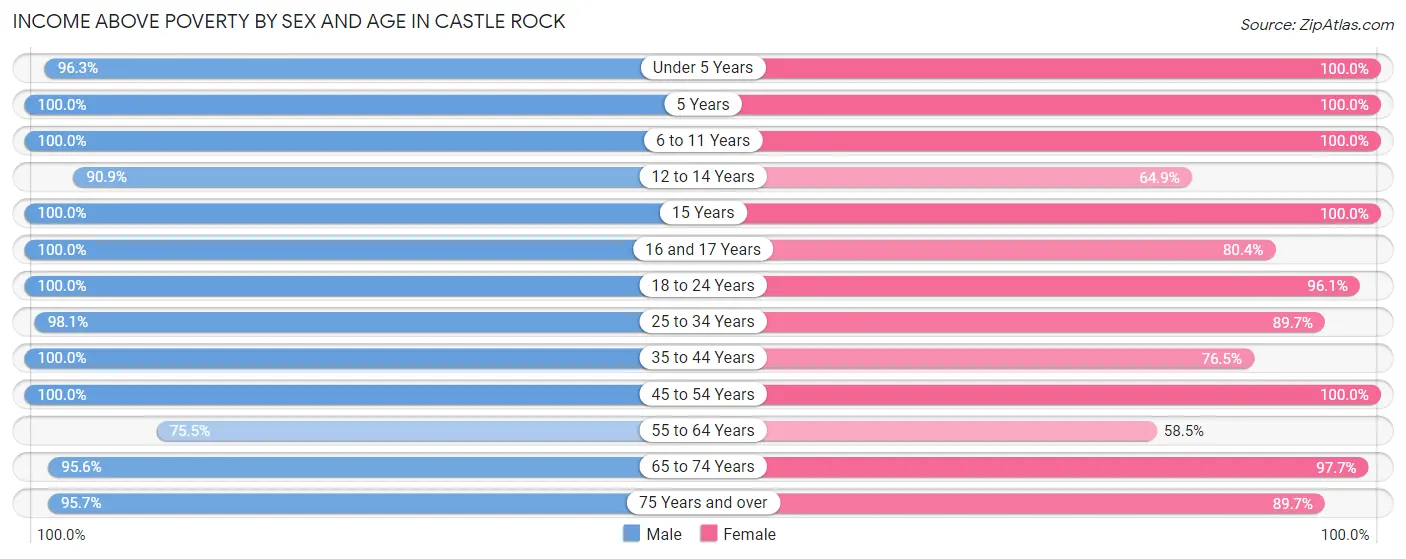
| Age Bracket | Male | Female |
| Under 5 Years | 154 (96.3%) | 147 (100.0%) |
| 5 Years | 32 (100.0%) | 10 (100.0%) |
| 6 to 11 Years | 109 (100.0%) | 121 (100.0%) |
| 12 to 14 Years | 50 (90.9%) | 37 (64.9%) |
| 15 Years | 8 (100.0%) | 41 (100.0%) |
| 16 and 17 Years | 29 (100.0%) | 37 (80.4%) |
| 18 to 24 Years | 56 (100.0%) | 123 (96.1%) |
| 25 to 34 Years | 207 (98.1%) | 286 (89.7%) |
| 35 to 44 Years | 88 (100.0%) | 104 (76.5%) |
| 45 to 54 Years | 106 (100.0%) | 136 (100.0%) |
| 55 to 64 Years | 80 (75.5%) | 62 (58.5%) |
| 65 to 74 Years | 108 (95.6%) | 130 (97.7%) |
| 75 Years and over | 88 (95.7%) | 52 (89.7%) |
| Total | 1,115 (95.7%) | 1,286 (89.4%) |
Income Below Poverty Among Married-Couple Families in Castle Rock
The poverty statistics for married-couple families in Castle Rock show that 0.9% or 4 of the total 449 families live below the poverty line. Families with no children have the highest poverty rate of 1.9%, comprising of 4 families. On the other hand, families with 1 or 2 children have the lowest poverty rate of 0.0%, which includes 0 families.
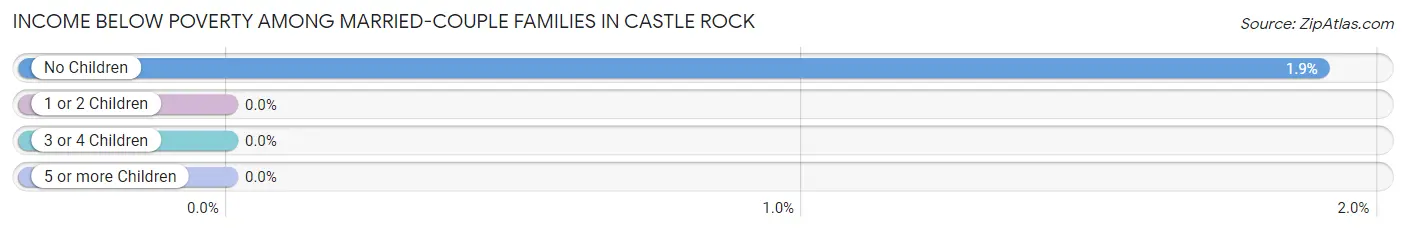
| Children | Above Poverty | Below Poverty |
| No Children | 206 (98.1%) | 4 (1.9%) |
| 1 or 2 Children | 182 (100.0%) | 0 (0.0%) |
| 3 or 4 Children | 35 (100.0%) | 0 (0.0%) |
| 5 or more Children | 22 (100.0%) | 0 (0.0%) |
| Total | 445 (99.1%) | 4 (0.9%) |
Income Below Poverty Among Single-Parent Households in Castle Rock
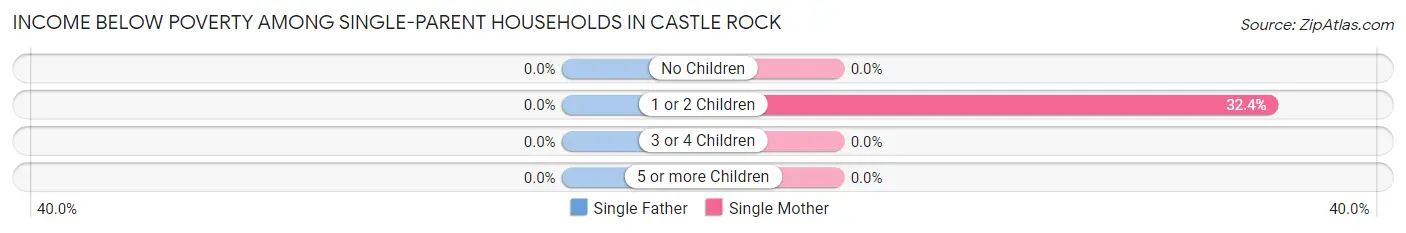
| Children | Single Father | Single Mother |
| No Children | 0 (0.0%) | 0 (0.0%) |
| 1 or 2 Children | 0 (0.0%) | 23 (32.4%) |
| 3 or 4 Children | 0 (0.0%) | 0 (0.0%) |
| 5 or more Children | 0 (0.0%) | 0 (0.0%) |
| Total | 0 (0.0%) | 23 (20.7%) |
Income Below Poverty Among Married-Couple vs Single-Parent Households in Castle Rock
The poverty data for Castle Rock shows that 4 of the married-couple family households (0.9%) and 23 of the single-parent households (14.5%) are living below the poverty level. Within the married-couple family households, those with no children have the highest poverty rate, with 4 households (1.9%) falling below the poverty line. Among the single-parent households, those with 1 or 2 children have the highest poverty rate, with 23 household (23.7%) living below poverty.
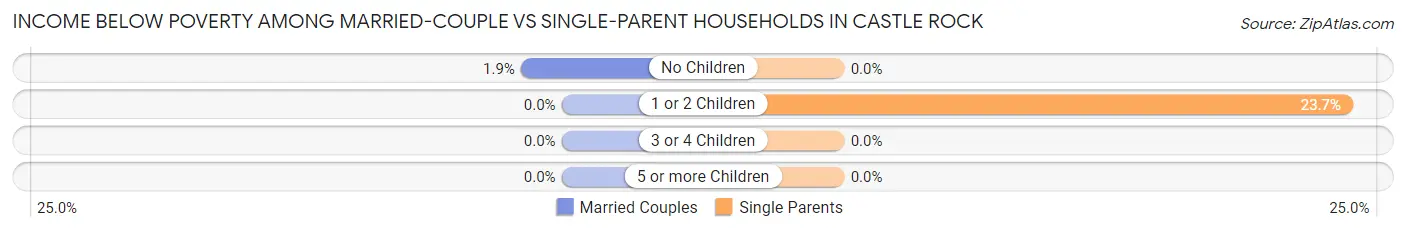
| Children | Married-Couple Families | Single-Parent Households |
| No Children | 4 (1.9%) | 0 (0.0%) |
| 1 or 2 Children | 0 (0.0%) | 23 (23.7%) |
| 3 or 4 Children | 0 (0.0%) | 0 (0.0%) |
| 5 or more Children | 0 (0.0%) | 0 (0.0%) |
| Total | 4 (0.9%) | 23 (14.5%) |
Race in Castle Rock
The most populous races in Castle Rock are White / Caucasian (2,349 | 89.5%), Hispanic or Latino (154 | 5.9%), and Hawaiian / Pacific (87 | 3.3%).
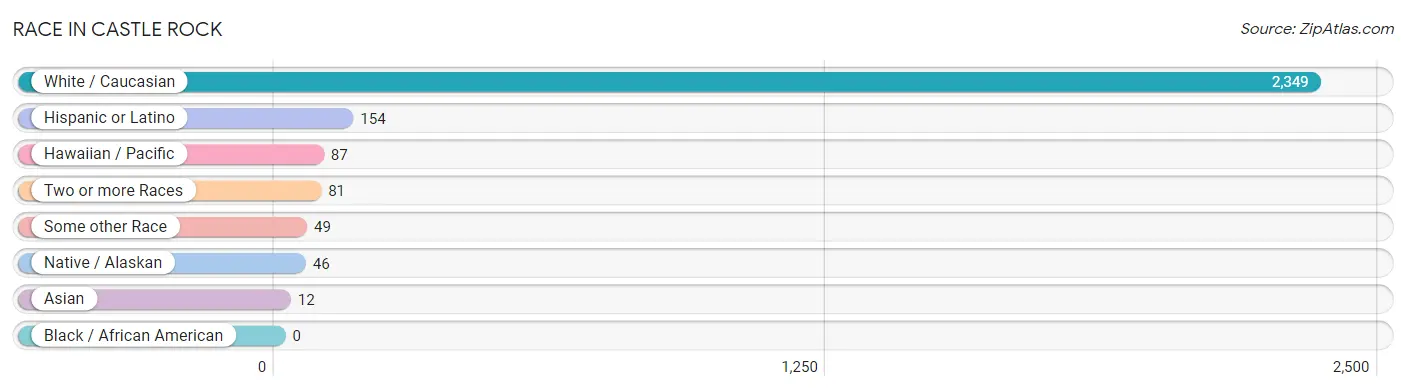
| Race | # Population | % Population |
| Asian | 12 | 0.5% |
| Black / African American | 0 | 0.0% |
| Hawaiian / Pacific | 87 | 3.3% |
| Hispanic or Latino | 154 | 5.9% |
| Native / Alaskan | 46 | 1.8% |
| White / Caucasian | 2,349 | 89.5% |
| Two or more Races | 81 | 3.1% |
| Some other Race | 49 | 1.9% |
| Total | 2,624 | 100.0% |
Ancestry in Castle Rock
The most populous ancestries reported in Castle Rock are Irish (644 | 24.5%), German (582 | 22.2%), English (351 | 13.4%), Italian (223 | 8.5%), and French (180 | 6.9%), together accounting for 75.5% of all Castle Rock residents.
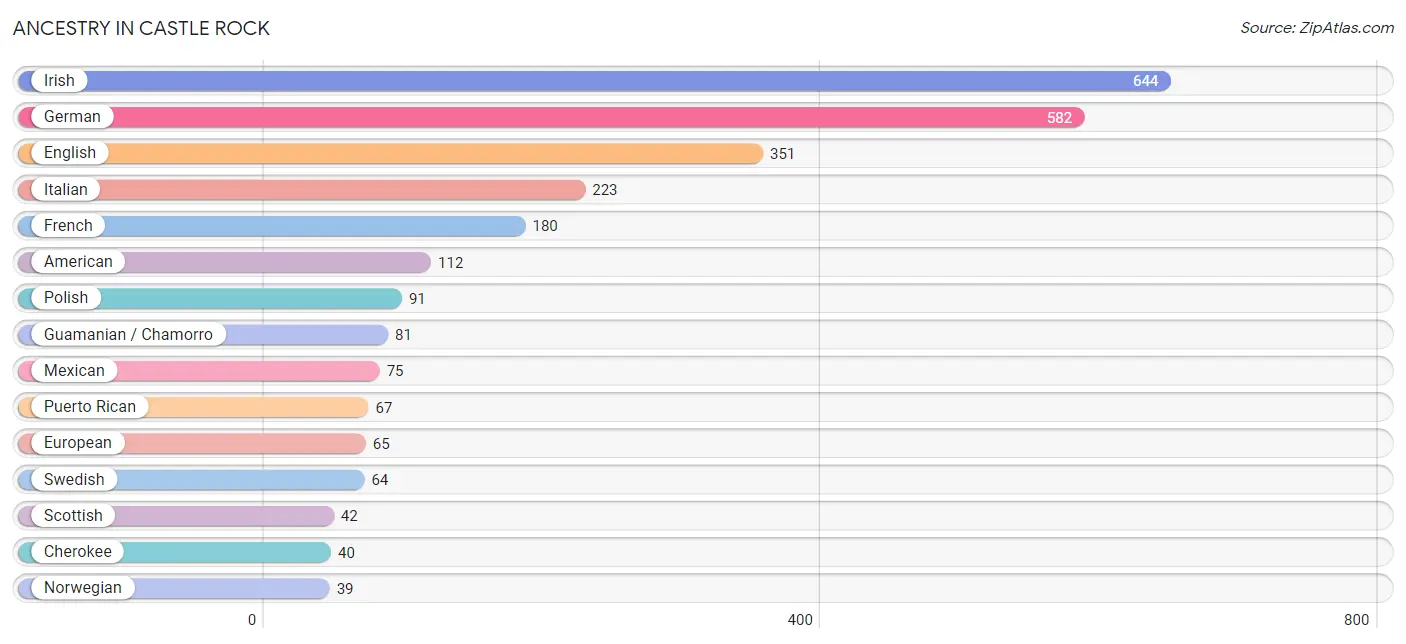
| Ancestry | # Population | % Population |
| American | 112 | 4.3% |
| British | 5 | 0.2% |
| Cherokee | 40 | 1.5% |
| Choctaw | 27 | 1.0% |
| Crow | 3 | 0.1% |
| Czech | 23 | 0.9% |
| Danish | 8 | 0.3% |
| Dutch | 30 | 1.1% |
| English | 351 | 13.4% |
| European | 65 | 2.5% |
| Finnish | 13 | 0.5% |
| French | 180 | 6.9% |
| French Canadian | 13 | 0.5% |
| German | 582 | 22.2% |
| Greek | 12 | 0.5% |
| Guamanian / Chamorro | 81 | 3.1% |
| Icelander | 21 | 0.8% |
| Indian (Asian) | 8 | 0.3% |
| Irish | 644 | 24.5% |
| Italian | 223 | 8.5% |
| Korean | 4 | 0.2% |
| Mexican | 75 | 2.9% |
| Mexican American Indian | 5 | 0.2% |
| Norwegian | 39 | 1.5% |
| Peruvian | 9 | 0.3% |
| Polish | 91 | 3.5% |
| Puerto Rican | 67 | 2.5% |
| Russian | 18 | 0.7% |
| Samoan | 6 | 0.2% |
| Scandinavian | 18 | 0.7% |
| Scotch-Irish | 14 | 0.5% |
| Scottish | 42 | 1.6% |
| South American | 9 | 0.3% |
| Swedish | 64 | 2.4% |
| Welsh | 32 | 1.2% | View All 35 Rows |
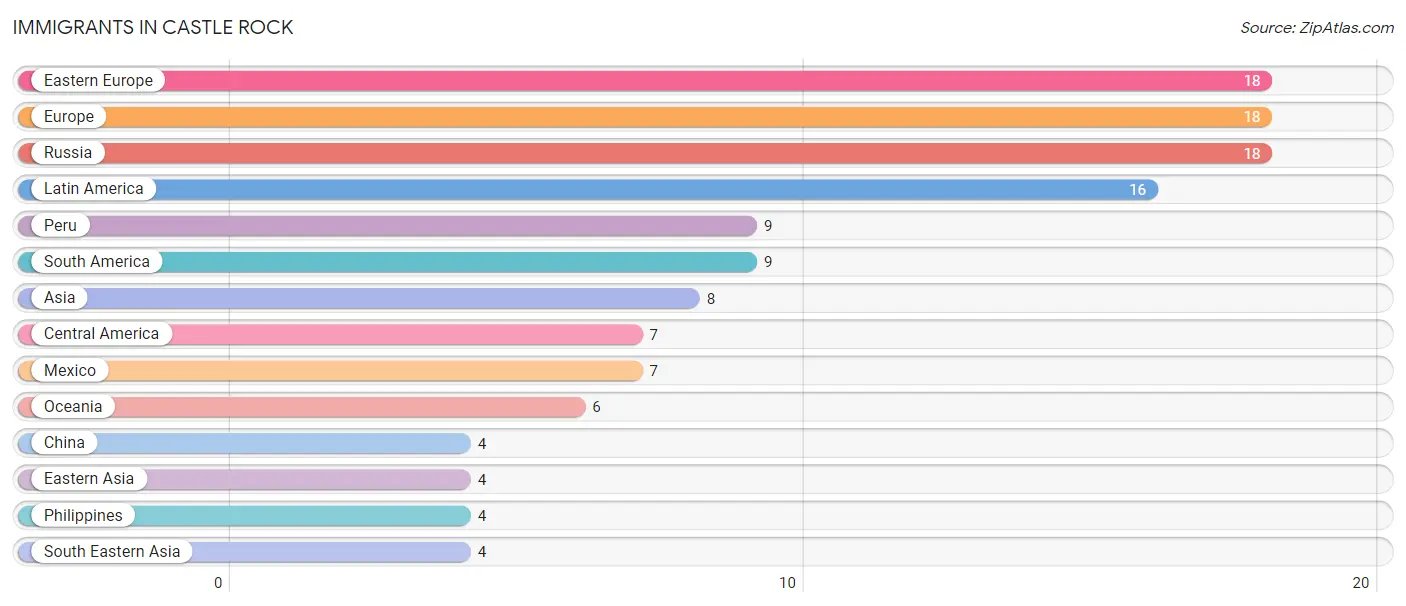
Immigrants in Castle Rock
The most numerous immigrant groups reported in Castle Rock came from Eastern Europe (18 | 0.7%), Europe (18 | 0.7%), Russia (18 | 0.7%), Latin America (16 | 0.6%), and Peru (9 | 0.3%), together accounting for 3.0% of all Castle Rock residents.
| Immigration Origin | # Population | % Population |
| Asia | 8 | 0.3% |
| Central America | 7 | 0.3% |
| China | 4 | 0.2% |
| Eastern Asia | 4 | 0.2% |
| Eastern Europe | 18 | 0.7% |
| Europe | 18 | 0.7% |
| Latin America | 16 | 0.6% |
| Mexico | 7 | 0.3% |
| Oceania | 6 | 0.2% |
| Peru | 9 | 0.3% |
| Philippines | 4 | 0.2% |
| Russia | 18 | 0.7% |
| South America | 9 | 0.3% |
| South Eastern Asia | 4 | 0.2% | View All 14 Rows |
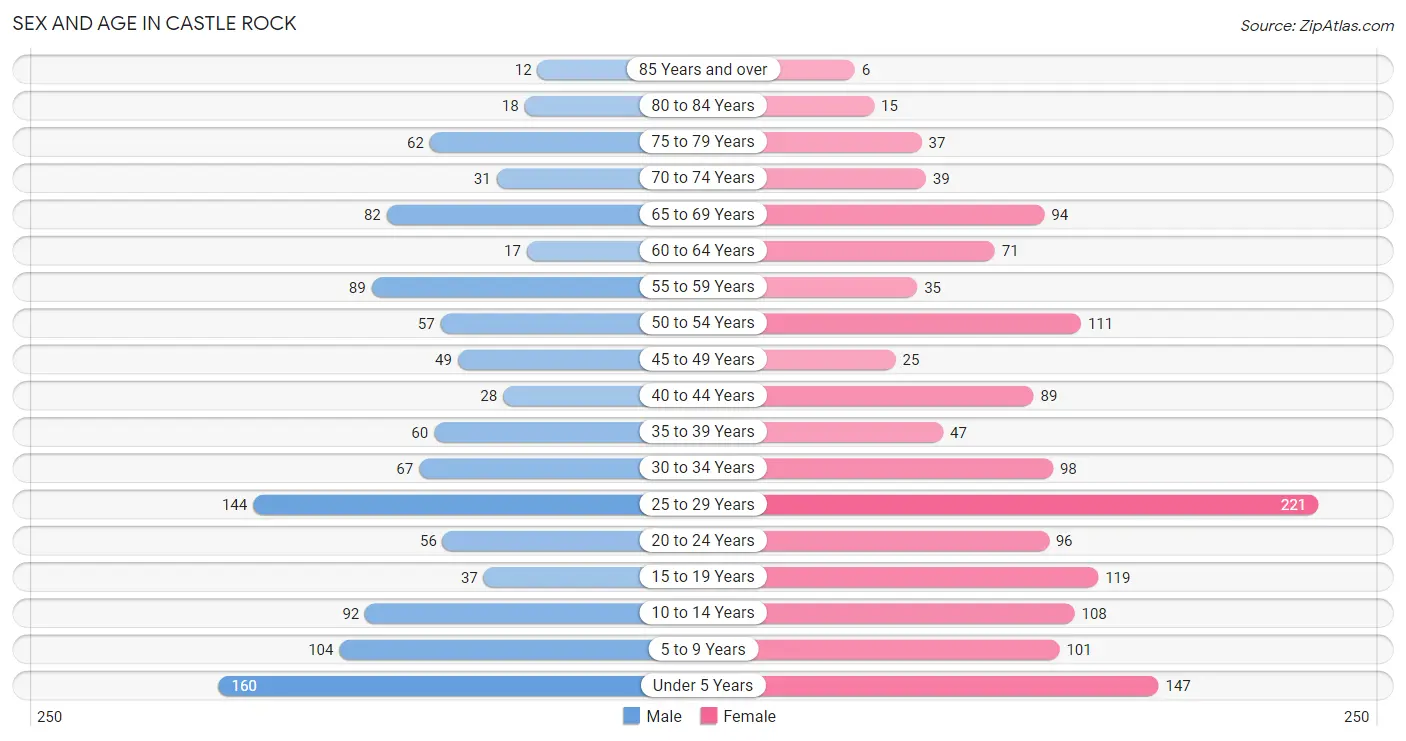
Sex and Age in Castle Rock
Sex and Age in Castle Rock
The most populous age groups in Castle Rock are Under 5 Years (160 | 13.7%) for men and 25 to 29 Years (221 | 15.1%) for women.
| Age Bracket | Male | Female |
| Under 5 Years | 160 (13.7%) | 147 (10.1%) |
| 5 to 9 Years | 104 (8.9%) | 101 (6.9%) |
| 10 to 14 Years | 92 (7.9%) | 108 (7.4%) |
| 15 to 19 Years | 37 (3.2%) | 119 (8.2%) |
| 20 to 24 Years | 56 (4.8%) | 96 (6.6%) |
| 25 to 29 Years | 144 (12.4%) | 221 (15.1%) |
| 30 to 34 Years | 67 (5.8%) | 98 (6.7%) |
| 35 to 39 Years | 60 (5.1%) | 47 (3.2%) |
| 40 to 44 Years | 28 (2.4%) | 89 (6.1%) |
| 45 to 49 Years | 49 (4.2%) | 25 (1.7%) |
| 50 to 54 Years | 57 (4.9%) | 111 (7.6%) |
| 55 to 59 Years | 89 (7.6%) | 35 (2.4%) |
| 60 to 64 Years | 17 (1.5%) | 71 (4.9%) |
| 65 to 69 Years | 82 (7.0%) | 94 (6.4%) |
| 70 to 74 Years | 31 (2.7%) | 39 (2.7%) |
| 75 to 79 Years | 62 (5.3%) | 37 (2.5%) |
| 80 to 84 Years | 18 (1.5%) | 15 (1.0%) |
| 85 Years and over | 12 (1.0%) | 6 (0.4%) |
| Total | 1,165 (100.0%) | 1,459 (100.0%) |
Families and Households in Castle Rock
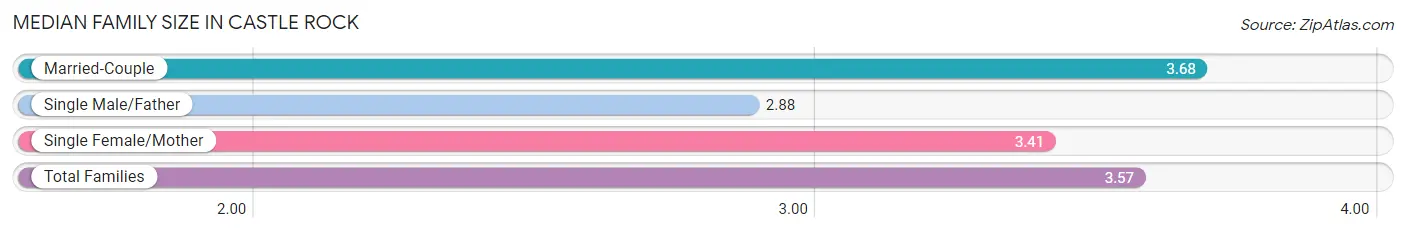
Median Family Size in Castle Rock
The median family size in Castle Rock is 3.57 persons per family, with married-couple families (449 | 73.9%) accounting for the largest median family size of 3.68 persons per family. On the other hand, single male/father families (48 | 7.9%) represent the smallest median family size with 2.88 persons per family.
| Family Type | # Families | Family Size |
| Married-Couple | 449 (73.9%) | 3.68 |
| Single Male/Father | 48 (7.9%) | 2.88 |
| Single Female/Mother | 111 (18.3%) | 3.41 |
| Total Families | 608 (100.0%) | 3.57 |
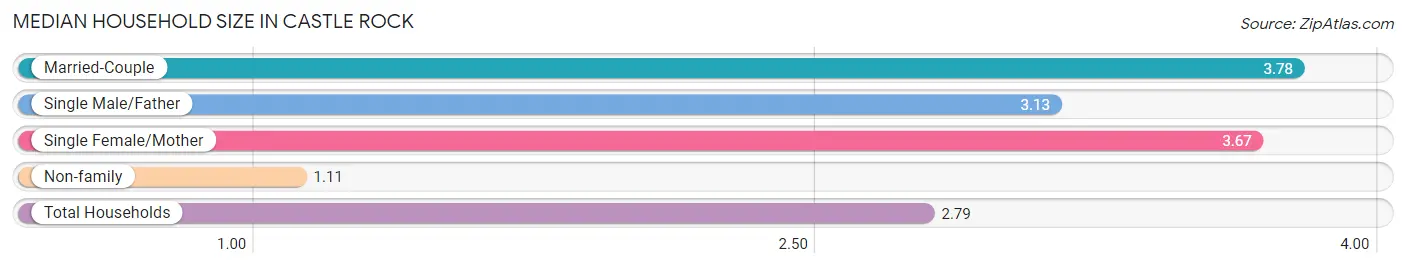
Median Household Size in Castle Rock
The median household size in Castle Rock is 2.79 persons per household, with married-couple households (449 | 47.7%) accounting for the largest median household size of 3.78 persons per household. non-family households (333 | 35.4%) represent the smallest median household size with 1.11 persons per household.
| Household Type | # Households | Household Size |
| Married-Couple | 449 (47.7%) | 3.78 |
| Single Male/Father | 48 (5.1%) | 3.13 |
| Single Female/Mother | 111 (11.8%) | 3.67 |
| Non-family | 333 (35.4%) | 1.11 |
| Total Households | 941 (100.0%) | 2.79 |
Household Size by Marriage Status in Castle Rock
Out of a total of 941 households in Castle Rock, 608 (64.6%) are family households, while 333 (35.4%) are nonfamily households. The most numerous type of family households are 4-person households, comprising 224, and the most common type of nonfamily households are 1-person households, comprising 295.
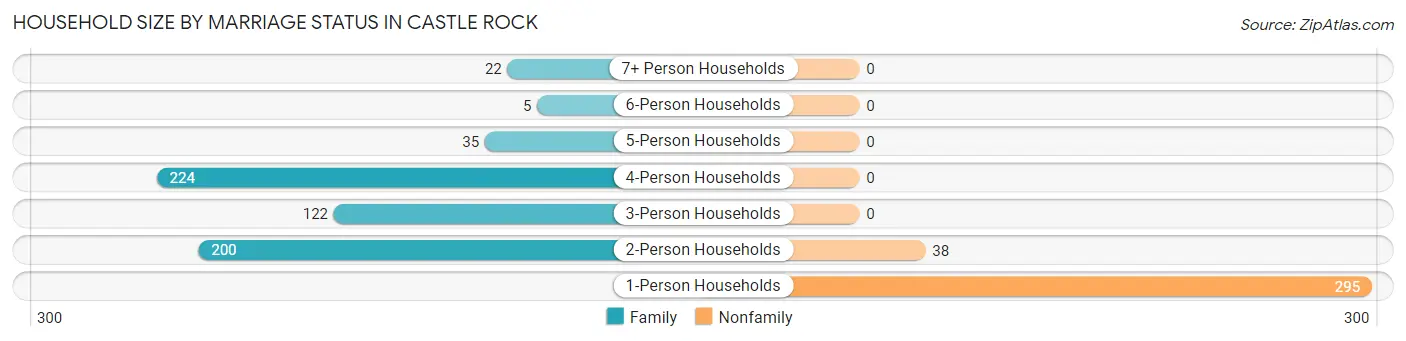
| Household Size | Family Households | Nonfamily Households |
| 1-Person Households | - | 295 (31.4%) |
| 2-Person Households | 200 (21.2%) | 38 (4.0%) |
| 3-Person Households | 122 (13.0%) | 0 (0.0%) |
| 4-Person Households | 224 (23.8%) | 0 (0.0%) |
| 5-Person Households | 35 (3.7%) | 0 (0.0%) |
| 6-Person Households | 5 (0.5%) | 0 (0.0%) |
| 7+ Person Households | 22 (2.3%) | 0 (0.0%) |
| Total | 608 (64.6%) | 333 (35.4%) |
Female Fertility in Castle Rock
Fertility by Age in Castle Rock
Average fertility rate in Castle Rock is 59.0 births per 1,000 women. Women in the age bracket of 20 to 34 years have the highest fertility rate with 99.0 births per 1,000 women. Women in the age bracket of 20 to 34 years acount for 100.0% of all women with births.
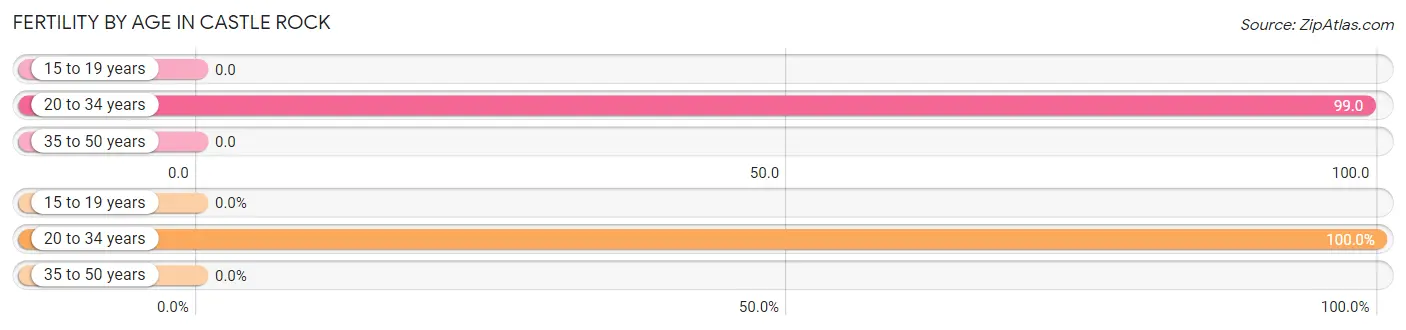
| Age Bracket | Women with Births | Births / 1,000 Women |
| 15 to 19 years | 0 (0.0%) | 0.0 |
| 20 to 34 years | 41 (100.0%) | 99.0 |
| 35 to 50 years | 0 (0.0%) | 0.0 |
| Total | 41 (100.0%) | 59.0 |
Fertility by Age by Marriage Status in Castle Rock
73.2% of women with births (41) in Castle Rock are married. The highest percentage of unmarried women with births falls into 20 to 34 years age bracket with 26.8% of them unmarried at the time of birth, while the lowest percentage of unmarried women with births belong to 20 to 34 years age bracket with 26.8% of them unmarried.
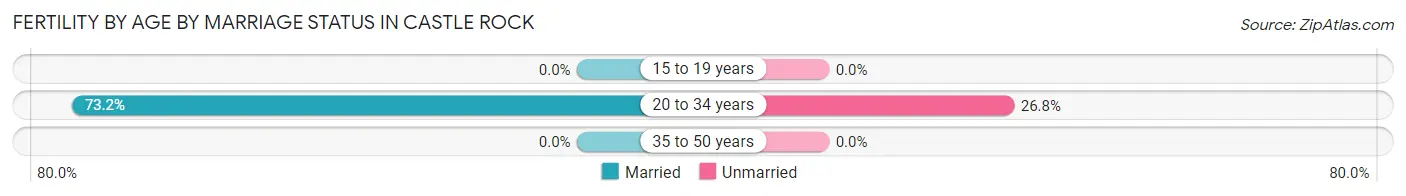
| Age Bracket | Married | Unmarried |
| 15 to 19 years | 0 (0.0%) | 0 (0.0%) |
| 20 to 34 years | 30 (73.2%) | 11 (26.8%) |
| 35 to 50 years | 0 (0.0%) | 0 (0.0%) |
| Total | 30 (73.2%) | 11 (26.8%) |
Fertility by Education in Castle Rock
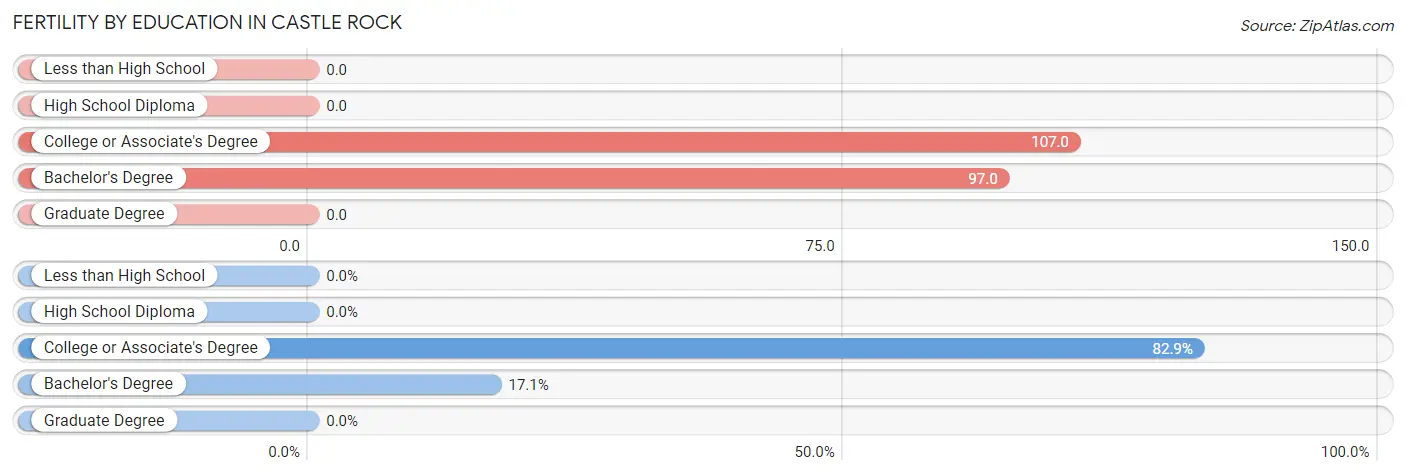
| Educational Attainment | Women with Births | Births / 1,000 Women |
| Less than High School | 0 (0.0%) | 0.0 |
| High School Diploma | 0 (0.0%) | 0.0 |
| College or Associate's Degree | 34 (82.9%) | 107.0 |
| Bachelor's Degree | 7 (17.1%) | 97.0 |
| Graduate Degree | 0 (0.0%) | 0.0 |
| Total | 41 (100.0%) | 59.0 |
Fertility by Education by Marriage Status in Castle Rock
26.8% of women with births in Castle Rock are unmarried. Women with the educational attainment of bachelor's degree are most likely to be married with 100.0% of them married at childbirth, while women with the educational attainment of college or associate's degree are least likely to be married with 32.4% of them unmarried at childbirth.
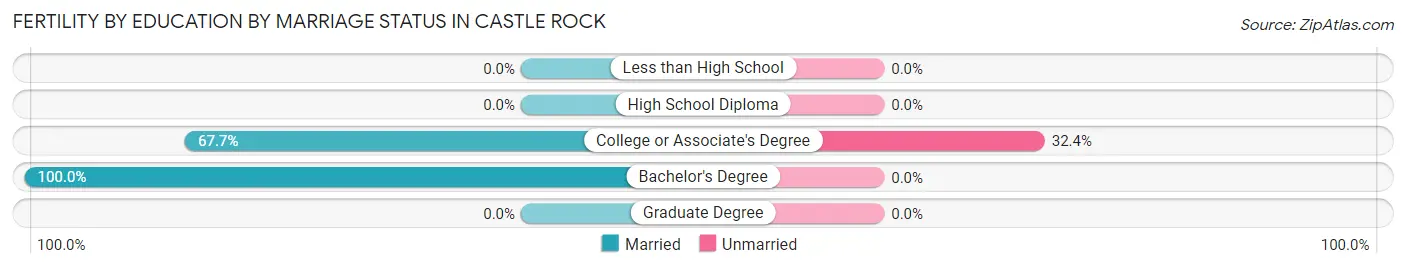
| Educational Attainment | Married | Unmarried |
| Less than High School | 0 (0.0%) | 0 (0.0%) |
| High School Diploma | 0 (0.0%) | 0 (0.0%) |
| College or Associate's Degree | 23 (67.6%) | 11 (32.4%) |
| Bachelor's Degree | 7 (100.0%) | 0 (0.0%) |
| Graduate Degree | 0 (0.0%) | 0 (0.0%) |
| Total | 30 (73.2%) | 11 (26.8%) |
Employment Characteristics in Castle Rock
Employment by Class of Employer in Castle Rock
Among the 864 employed individuals in Castle Rock, private company employees (667 | 77.2%), state government employees (61 | 7.1%), and not-for-profit organizations (57 | 6.6%) make up the most common classes of employment.
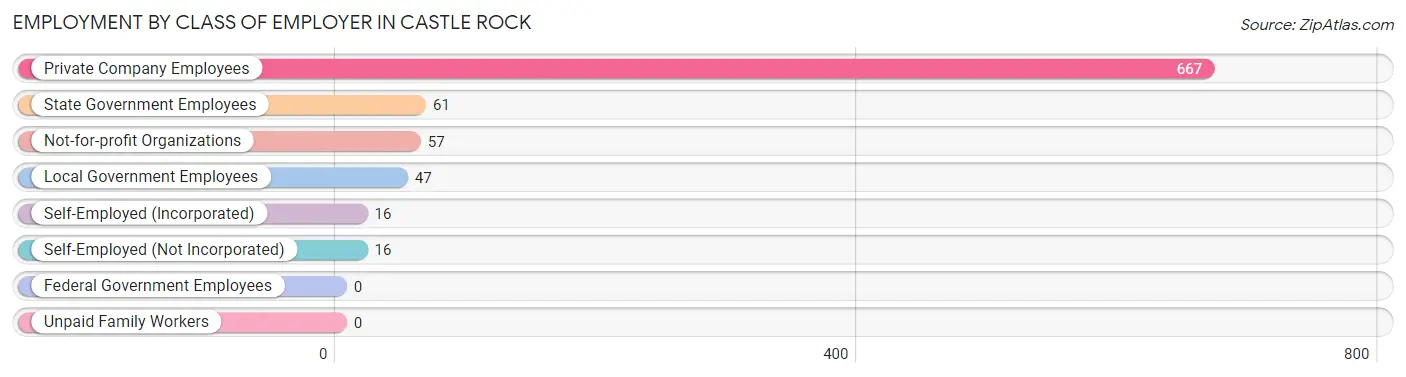
| Employer Class | # Employees | % Employees |
| Private Company Employees | 667 | 77.2% |
| Self-Employed (Incorporated) | 16 | 1.8% |
| Self-Employed (Not Incorporated) | 16 | 1.8% |
| Not-for-profit Organizations | 57 | 6.6% |
| Local Government Employees | 47 | 5.4% |
| State Government Employees | 61 | 7.1% |
| Federal Government Employees | 0 | 0.0% |
| Unpaid Family Workers | 0 | 0.0% |
| Total | 864 | 100.0% |
Employment Status by Age in Castle Rock
According to the labor force statistics for Castle Rock, out of the total population over 16 years of age (1,863), 51.5% or 959 individuals are in the labor force, with 7.0% or 67 of them unemployed. The age group with the highest labor force participation rate is 30 to 34 years, with 93.3% or 154 individuals in the labor force. Within the labor force, the 20 to 24 years age range has the highest percentage of unemployed individuals, with 44.4% or 44 of them being unemployed.
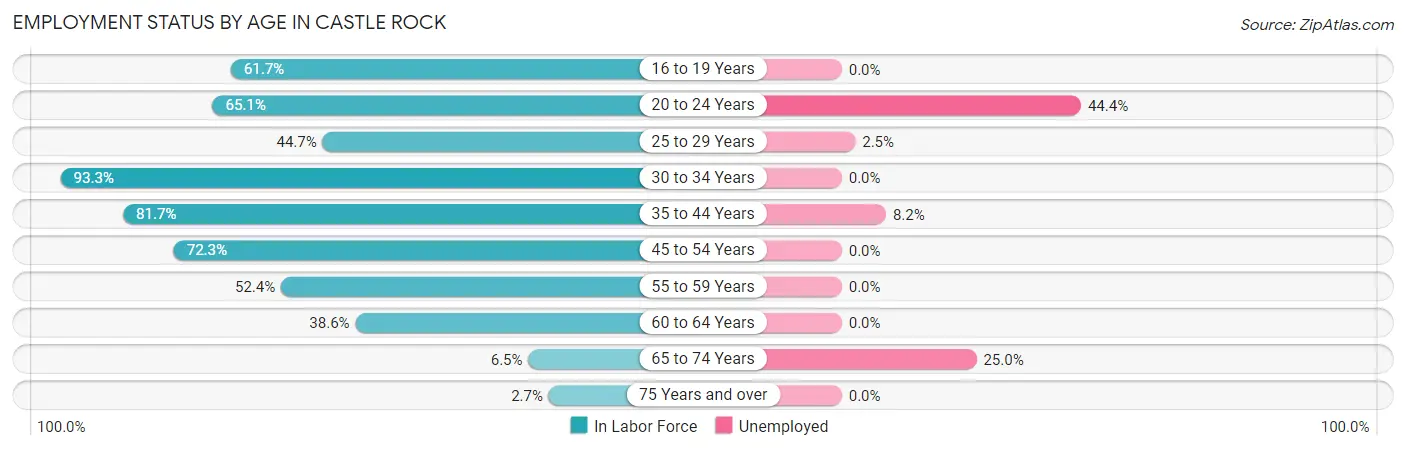
| Age Bracket | In Labor Force | Unemployed |
| 16 to 19 Years | 66 (61.7%) | 0 (0.0%) |
| 20 to 24 Years | 99 (65.1%) | 44 (44.4%) |
| 25 to 29 Years | 163 (44.7%) | 4 (2.5%) |
| 30 to 34 Years | 154 (93.3%) | 0 (0.0%) |
| 35 to 44 Years | 183 (81.7%) | 15 (8.2%) |
| 45 to 54 Years | 175 (72.3%) | 0 (0.0%) |
| 55 to 59 Years | 65 (52.4%) | 0 (0.0%) |
| 60 to 64 Years | 34 (38.6%) | 0 (0.0%) |
| 65 to 74 Years | 16 (6.5%) | 4 (25.0%) |
| 75 Years and over | 4 (2.7%) | 0 (0.0%) |
| Total | 959 (51.5%) | 67 (7.0%) |
Employment Status by Educational Attainment in Castle Rock
According to labor force statistics for Castle Rock, 64.1% of individuals (774) out of the total population between 25 and 64 years of age (1,208) are in the labor force, with 2.5% or 19 of them being unemployed. The group with the highest labor force participation rate are those with the educational attainment of bachelor's degree or higher, with 81.4% or 131 individuals in the labor force. Within the labor force, individuals with high school diploma education have the highest percentage of unemployment, with 4.8% or 15 of them being unemployed.
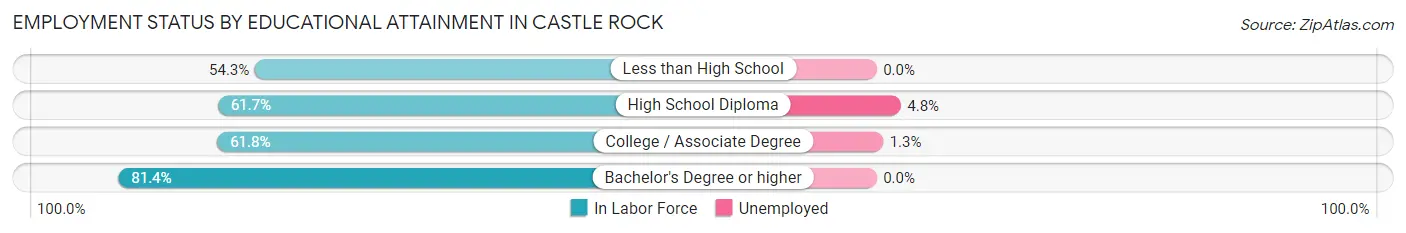
| Educational Attainment | In Labor Force | Unemployed |
| Less than High School | 25 (54.3%) | 0 (0.0%) |
| High School Diploma | 314 (61.7%) | 24 (4.8%) |
| College / Associate Degree | 304 (61.8%) | 6 (1.3%) |
| Bachelor's Degree or higher | 131 (81.4%) | 0 (0.0%) |
| Total | 774 (64.1%) | 30 (2.5%) |
Employment Occupations by Sex in Castle Rock
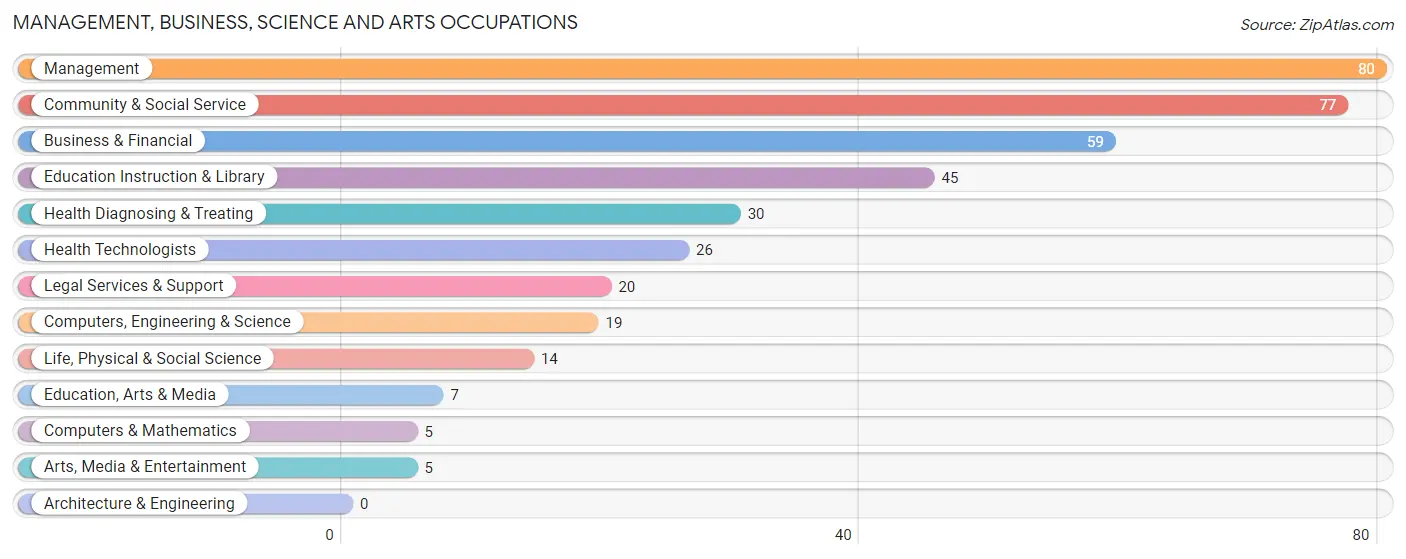
Management, Business, Science and Arts Occupations
The most common Management, Business, Science and Arts occupations in Castle Rock are Management (80 | 9.0%), Community & Social Service (77 | 8.6%), Business & Financial (59 | 6.6%), Education Instruction & Library (45 | 5.0%), and Health Diagnosing & Treating (30 | 3.4%).
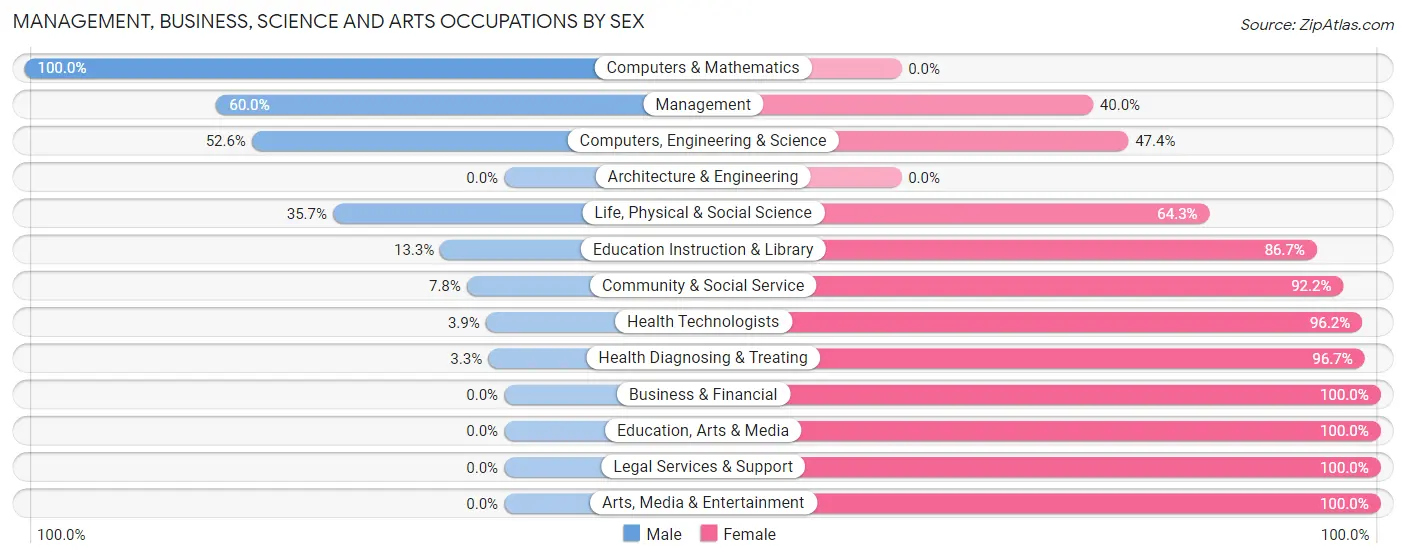
Management, Business, Science and Arts Occupations by Sex
Within the Management, Business, Science and Arts occupations in Castle Rock, the most male-oriented occupations are Computers & Mathematics (100.0%), Management (60.0%), and Computers, Engineering & Science (52.6%), while the most female-oriented occupations are Business & Financial (100.0%), Education, Arts & Media (100.0%), and Legal Services & Support (100.0%).
| Occupation | Male | Female |
| Management | 48 (60.0%) | 32 (40.0%) |
| Business & Financial | 0 (0.0%) | 59 (100.0%) |
| Computers, Engineering & Science | 10 (52.6%) | 9 (47.4%) |
| Computers & Mathematics | 5 (100.0%) | 0 (0.0%) |
| Architecture & Engineering | 0 (0.0%) | 0 (0.0%) |
| Life, Physical & Social Science | 5 (35.7%) | 9 (64.3%) |
| Community & Social Service | 6 (7.8%) | 71 (92.2%) |
| Education, Arts & Media | 0 (0.0%) | 7 (100.0%) |
| Legal Services & Support | 0 (0.0%) | 20 (100.0%) |
| Education Instruction & Library | 6 (13.3%) | 39 (86.7%) |
| Arts, Media & Entertainment | 0 (0.0%) | 5 (100.0%) |
| Health Diagnosing & Treating | 1 (3.3%) | 29 (96.7%) |
| Health Technologists | 1 (3.8%) | 25 (96.2%) |
| Total (Category) | 65 (24.5%) | 200 (75.5%) |
| Total (Overall) | 385 (43.2%) | 507 (56.8%) |
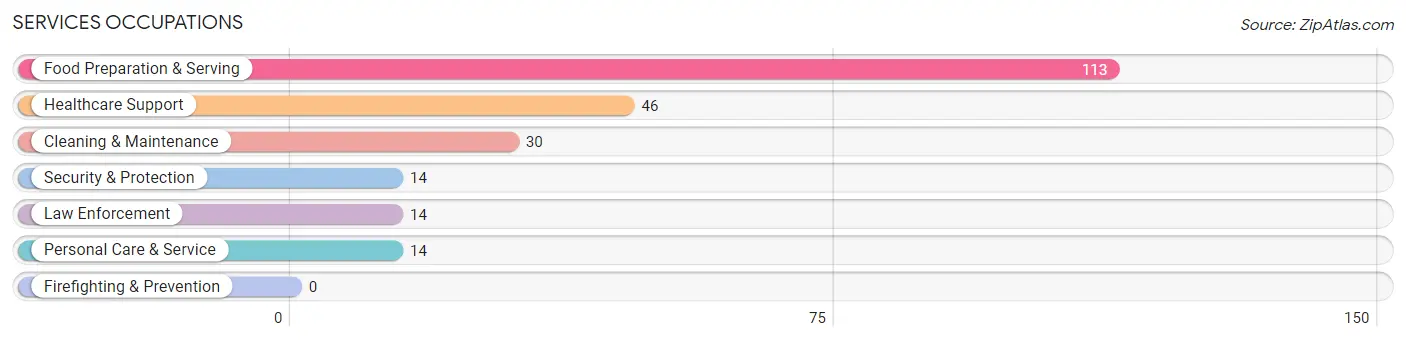
Services Occupations
The most common Services occupations in Castle Rock are Food Preparation & Serving (113 | 12.7%), Healthcare Support (46 | 5.2%), Cleaning & Maintenance (30 | 3.4%), Security & Protection (14 | 1.6%), and Law Enforcement (14 | 1.6%).
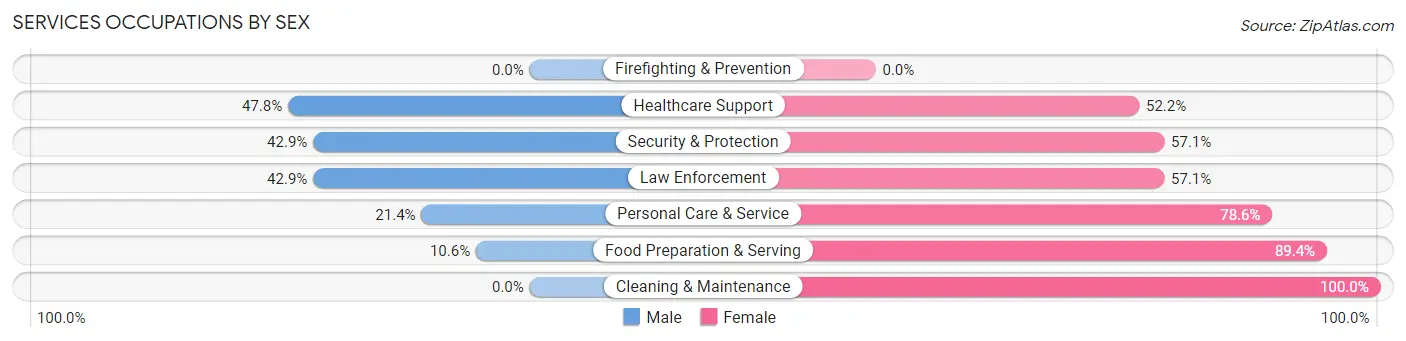
Services Occupations by Sex
Within the Services occupations in Castle Rock, the most male-oriented occupations are Healthcare Support (47.8%), Security & Protection (42.9%), and Law Enforcement (42.9%), while the most female-oriented occupations are Cleaning & Maintenance (100.0%), Food Preparation & Serving (89.4%), and Personal Care & Service (78.6%).
| Occupation | Male | Female |
| Healthcare Support | 22 (47.8%) | 24 (52.2%) |
| Security & Protection | 6 (42.9%) | 8 (57.1%) |
| Firefighting & Prevention | 0 (0.0%) | 0 (0.0%) |
| Law Enforcement | 6 (42.9%) | 8 (57.1%) |
| Food Preparation & Serving | 12 (10.6%) | 101 (89.4%) |
| Cleaning & Maintenance | 0 (0.0%) | 30 (100.0%) |
| Personal Care & Service | 3 (21.4%) | 11 (78.6%) |
| Total (Category) | 43 (19.8%) | 174 (80.2%) |
| Total (Overall) | 385 (43.2%) | 507 (56.8%) |
Sales and Office Occupations
The most common Sales and Office occupations in Castle Rock are Office & Administration (58 | 6.5%), and Sales & Related (40 | 4.5%).
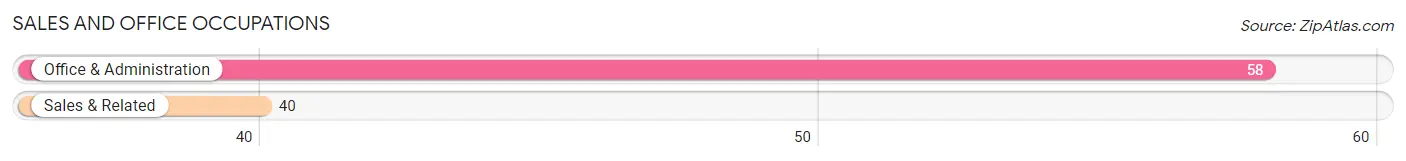
Sales and Office Occupations by Sex
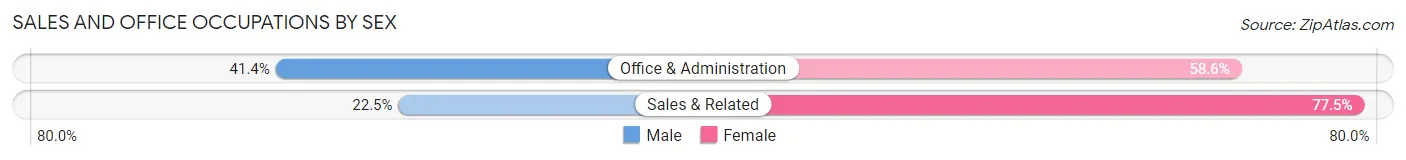
| Occupation | Male | Female |
| Sales & Related | 9 (22.5%) | 31 (77.5%) |
| Office & Administration | 24 (41.4%) | 34 (58.6%) |
| Total (Category) | 33 (33.7%) | 65 (66.3%) |
| Total (Overall) | 385 (43.2%) | 507 (56.8%) |
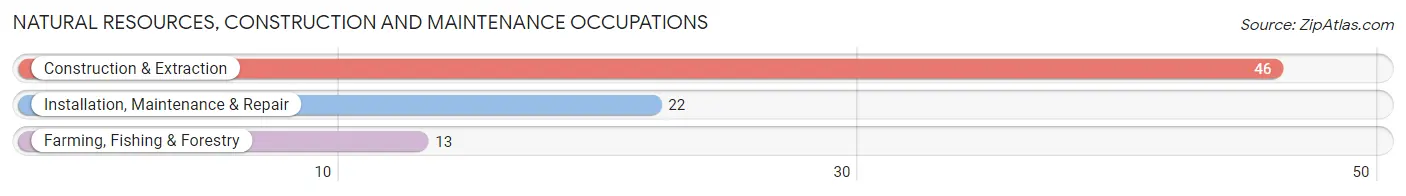
Natural Resources, Construction and Maintenance Occupations
The most common Natural Resources, Construction and Maintenance occupations in Castle Rock are Construction & Extraction (46 | 5.2%), Installation, Maintenance & Repair (22 | 2.5%), and Farming, Fishing & Forestry (13 | 1.5%).
Natural Resources, Construction and Maintenance Occupations by Sex
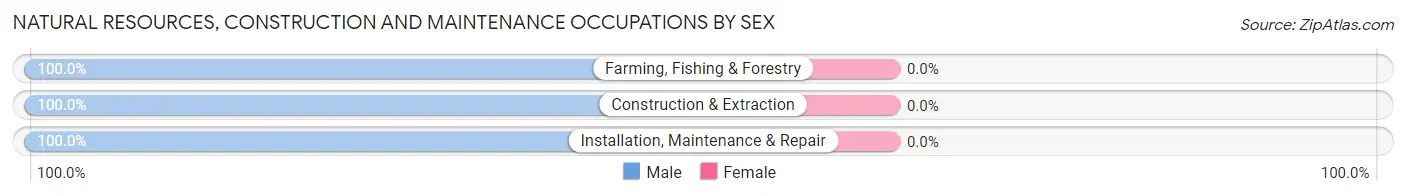
| Occupation | Male | Female |
| Farming, Fishing & Forestry | 13 (100.0%) | 0 (0.0%) |
| Construction & Extraction | 46 (100.0%) | 0 (0.0%) |
| Installation, Maintenance & Repair | 22 (100.0%) | 0 (0.0%) |
| Total (Category) | 81 (100.0%) | 0 (0.0%) |
| Total (Overall) | 385 (43.2%) | 507 (56.8%) |
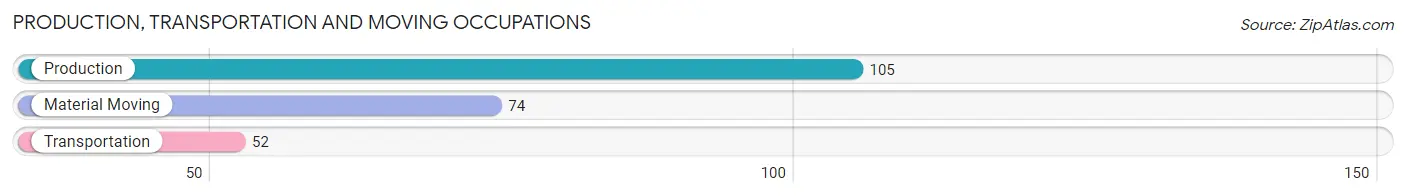
Production, Transportation and Moving Occupations
The most common Production, Transportation and Moving occupations in Castle Rock are Production (105 | 11.8%), Material Moving (74 | 8.3%), and Transportation (52 | 5.8%).
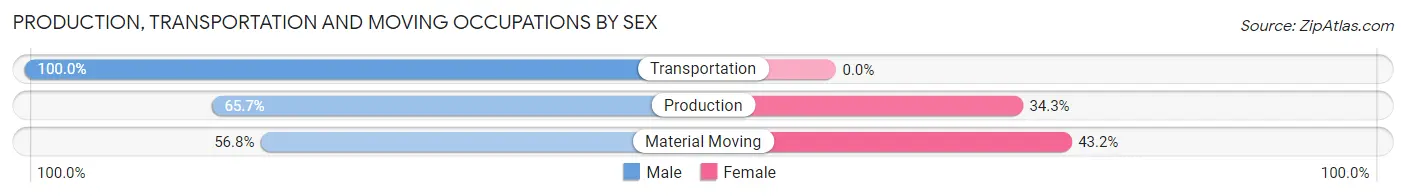
Production, Transportation and Moving Occupations by Sex
| Occupation | Male | Female |
| Production | 69 (65.7%) | 36 (34.3%) |
| Transportation | 52 (100.0%) | 0 (0.0%) |
| Material Moving | 42 (56.8%) | 32 (43.2%) |
| Total (Category) | 163 (70.6%) | 68 (29.4%) |
| Total (Overall) | 385 (43.2%) | 507 (56.8%) |
Employment Industries by Sex in Castle Rock
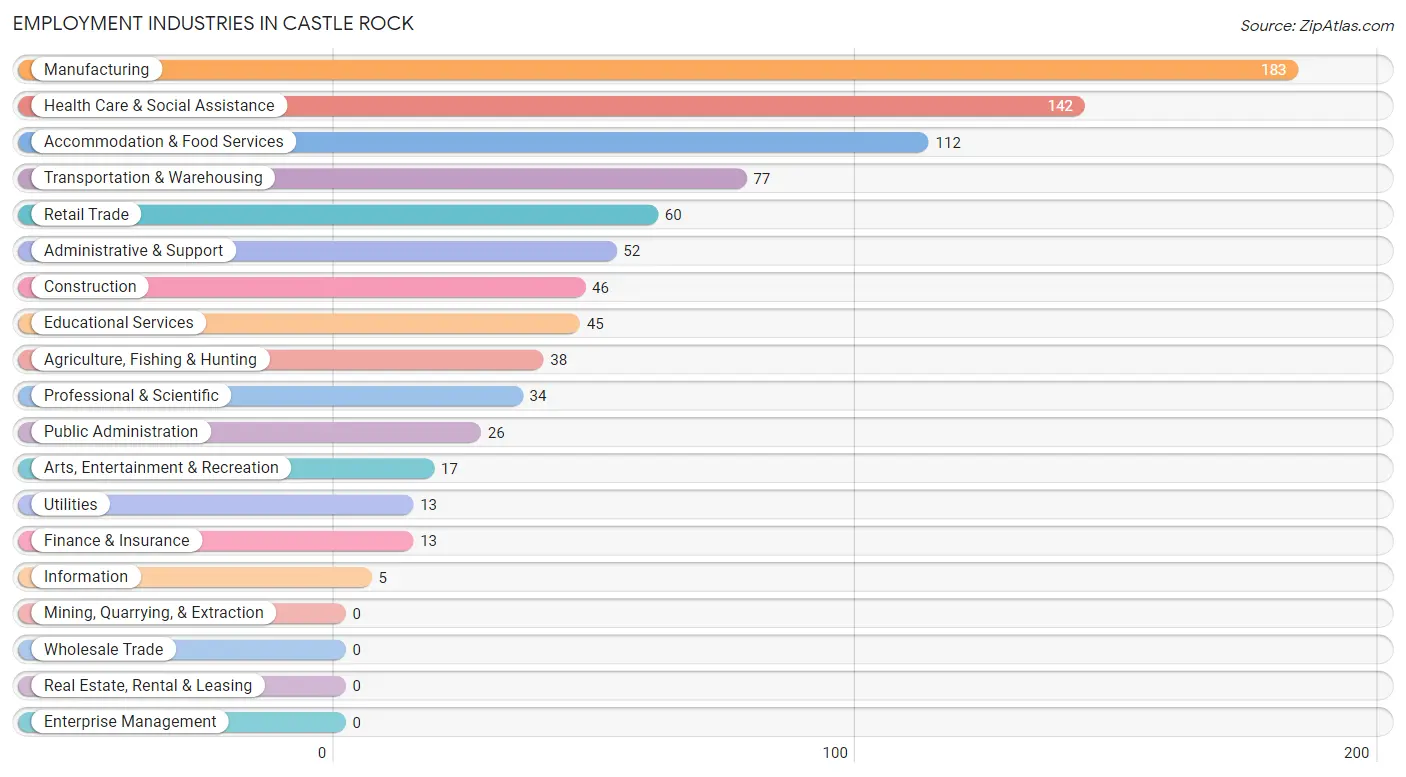
Employment Industries in Castle Rock
The major employment industries in Castle Rock include Manufacturing (183 | 20.5%), Health Care & Social Assistance (142 | 15.9%), Accommodation & Food Services (112 | 12.6%), Transportation & Warehousing (77 | 8.6%), and Retail Trade (60 | 6.7%).
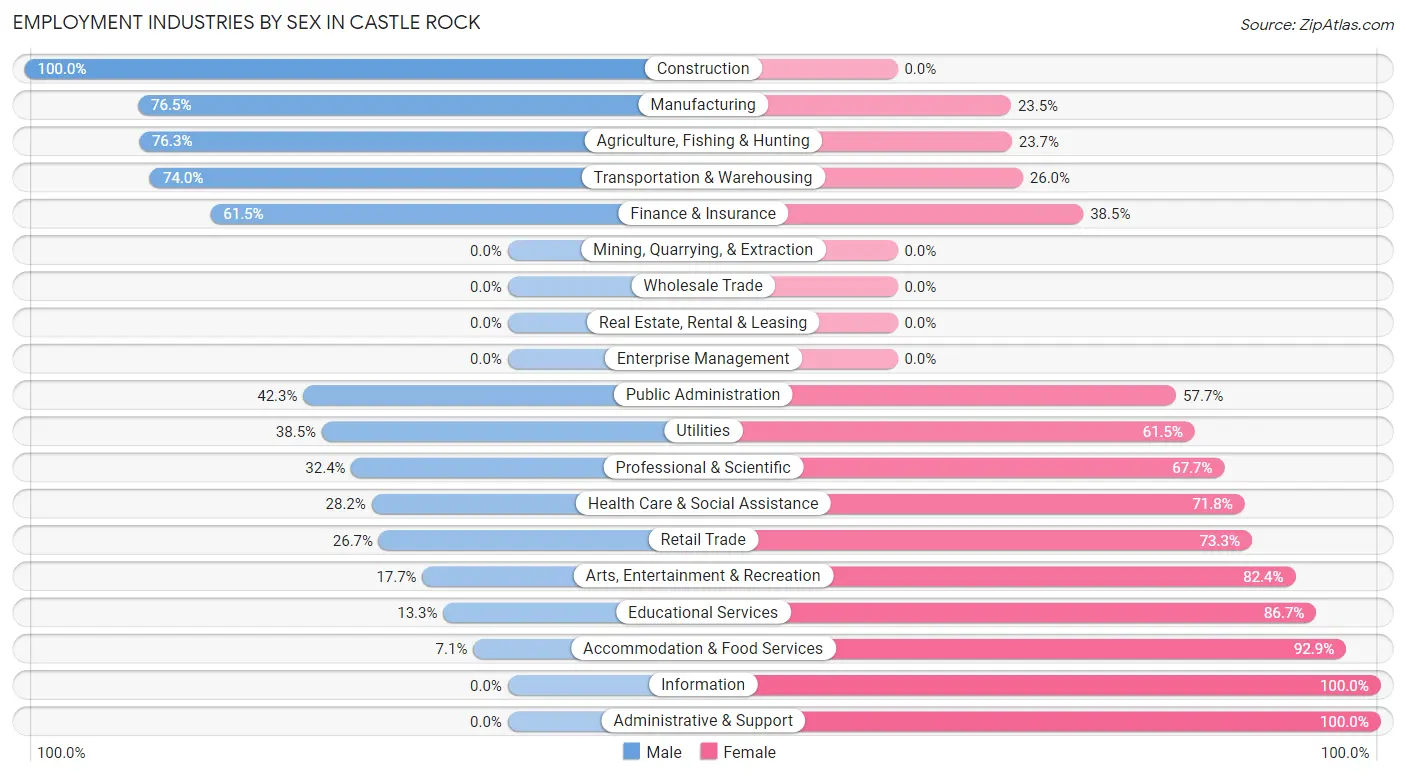
Employment Industries by Sex in Castle Rock
The Castle Rock industries that see more men than women are Construction (100.0%), Manufacturing (76.5%), and Agriculture, Fishing & Hunting (76.3%), whereas the industries that tend to have a higher number of women are Information (100.0%), Administrative & Support (100.0%), and Accommodation & Food Services (92.9%).
| Industry | Male | Female |
| Agriculture, Fishing & Hunting | 29 (76.3%) | 9 (23.7%) |
| Mining, Quarrying, & Extraction | 0 (0.0%) | 0 (0.0%) |
| Construction | 46 (100.0%) | 0 (0.0%) |
| Manufacturing | 140 (76.5%) | 43 (23.5%) |
| Wholesale Trade | 0 (0.0%) | 0 (0.0%) |
| Retail Trade | 16 (26.7%) | 44 (73.3%) |
| Transportation & Warehousing | 57 (74.0%) | 20 (26.0%) |
| Utilities | 5 (38.5%) | 8 (61.5%) |
| Information | 0 (0.0%) | 5 (100.0%) |
| Finance & Insurance | 8 (61.5%) | 5 (38.5%) |
| Real Estate, Rental & Leasing | 0 (0.0%) | 0 (0.0%) |
| Professional & Scientific | 11 (32.4%) | 23 (67.6%) |
| Enterprise Management | 0 (0.0%) | 0 (0.0%) |
| Administrative & Support | 0 (0.0%) | 52 (100.0%) |
| Educational Services | 6 (13.3%) | 39 (86.7%) |
| Health Care & Social Assistance | 40 (28.2%) | 102 (71.8%) |
| Arts, Entertainment & Recreation | 3 (17.6%) | 14 (82.4%) |
| Accommodation & Food Services | 8 (7.1%) | 104 (92.9%) |
| Public Administration | 11 (42.3%) | 15 (57.7%) |
| Total | 385 (43.2%) | 507 (56.8%) |
Education in Castle Rock
School Enrollment in Castle Rock
The most common levels of schooling among the 646 students in Castle Rock are middle school (174 | 26.9%), elementary school (166 | 25.7%), and high school (138 | 21.4%).
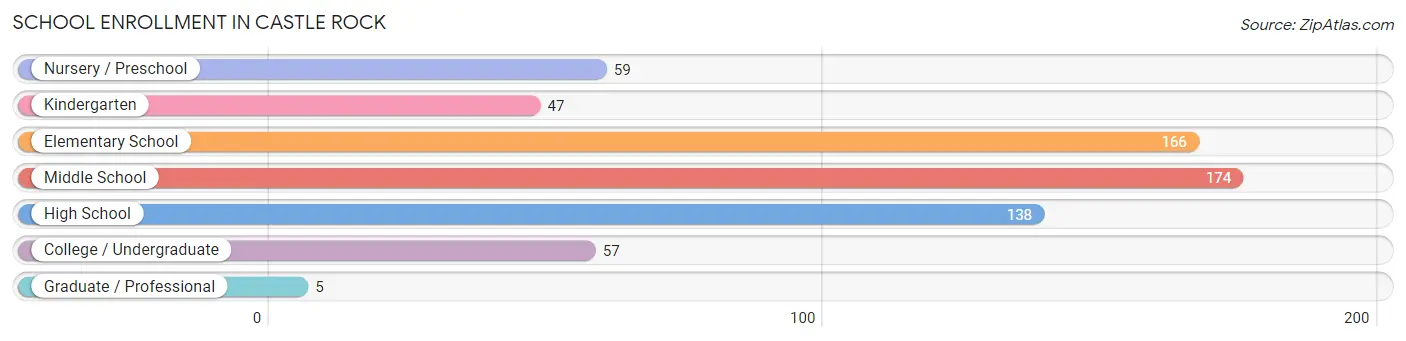
| School Level | # Students | % Students |
| Nursery / Preschool | 59 | 9.1% |
| Kindergarten | 47 | 7.3% |
| Elementary School | 166 | 25.7% |
| Middle School | 174 | 26.9% |
| High School | 138 | 21.4% |
| College / Undergraduate | 57 | 8.8% |
| Graduate / Professional | 5 | 0.8% |
| Total | 646 | 100.0% |
School Enrollment by Age by Funding Source in Castle Rock
Out of a total of 646 students who are enrolled in schools in Castle Rock, 55 (8.5%) attend a private institution, while the remaining 591 (91.5%) are enrolled in public schools. The age group of 3 to 4 year olds has the highest likelihood of being enrolled in private schools, with 33 (71.7% in the age bracket) enrolled. Conversely, the age group of 18 to 19 year olds has the lowest likelihood of being enrolled in a private school, with 9 (100.0% in the age bracket) attending a public institution.
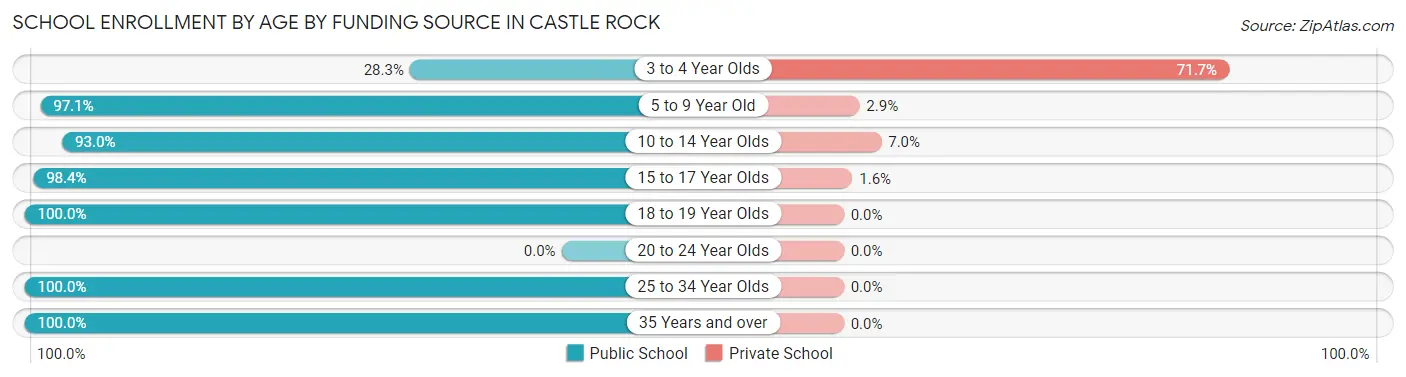
| Age Bracket | Public School | Private School |
| 3 to 4 Year Olds | 13 (28.3%) | 33 (71.7%) |
| 5 to 9 Year Old | 199 (97.1%) | 6 (2.9%) |
| 10 to 14 Year Olds | 186 (93.0%) | 14 (7.0%) |
| 15 to 17 Year Olds | 122 (98.4%) | 2 (1.6%) |
| 18 to 19 Year Olds | 9 (100.0%) | 0 (0.0%) |
| 20 to 24 Year Olds | 0 (0.0%) | 0 (0.0%) |
| 25 to 34 Year Olds | 41 (100.0%) | 0 (0.0%) |
| 35 Years and over | 21 (100.0%) | 0 (0.0%) |
| Total | 591 (91.5%) | 55 (8.5%) |
Educational Attainment by Field of Study in Castle Rock
Business (86 | 35.7%), education (42 | 17.4%), psychology (27 | 11.2%), arts & humanities (26 | 10.8%), and bio, nature & agricultural (25 | 10.4%) are the most common fields of study among 241 individuals in Castle Rock who have obtained a bachelor's degree or higher.
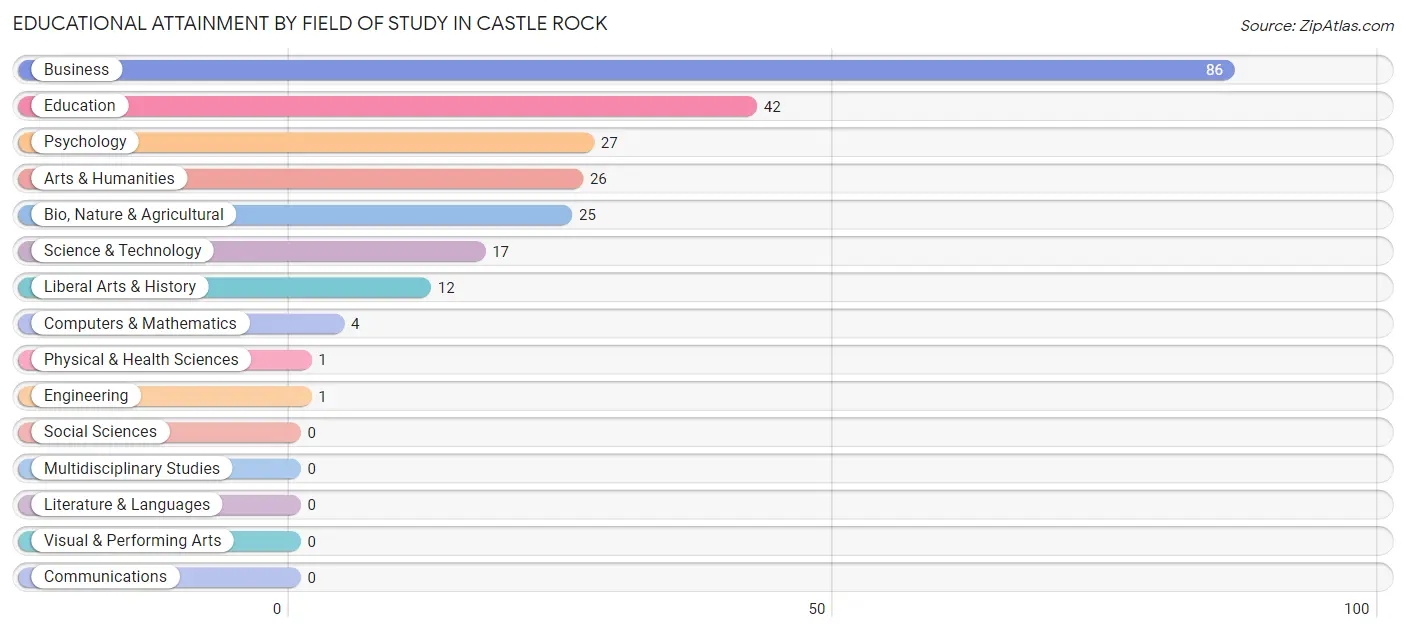
| Field of Study | # Graduates | % Graduates |
| Computers & Mathematics | 4 | 1.7% |
| Bio, Nature & Agricultural | 25 | 10.4% |
| Physical & Health Sciences | 1 | 0.4% |
| Psychology | 27 | 11.2% |
| Social Sciences | 0 | 0.0% |
| Engineering | 1 | 0.4% |
| Multidisciplinary Studies | 0 | 0.0% |
| Science & Technology | 17 | 7.0% |
| Business | 86 | 35.7% |
| Education | 42 | 17.4% |
| Literature & Languages | 0 | 0.0% |
| Liberal Arts & History | 12 | 5.0% |
| Visual & Performing Arts | 0 | 0.0% |
| Communications | 0 | 0.0% |
| Arts & Humanities | 26 | 10.8% |
| Total | 241 | 100.0% |
Transportation & Commute in Castle Rock
Vehicle Availability by Sex in Castle Rock
The most prevalent vehicle ownership categories in Castle Rock are males with 2 vehicles (184, accounting for 50.3%) and females with 2 vehicles (123, making up 36.9%).
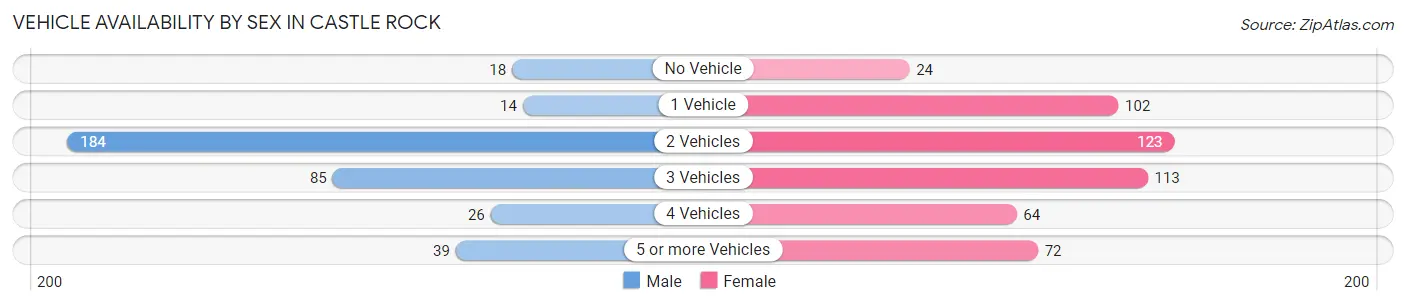
| Vehicles Available | Male | Female |
| No Vehicle | 18 (4.9%) | 24 (4.8%) |
| 1 Vehicle | 14 (3.8%) | 102 (20.5%) |
| 2 Vehicles | 184 (50.3%) | 123 (24.7%) |
| 3 Vehicles | 85 (23.2%) | 113 (22.7%) |
| 4 Vehicles | 26 (7.1%) | 64 (12.9%) |
| 5 or more Vehicles | 39 (10.7%) | 72 (14.5%) |
| Total | 366 (100.0%) | 498 (100.0%) |
Commute Time in Castle Rock
The most frequently occuring commute durations in Castle Rock are 20 to 24 minutes (260 commuters, 32.2%), 30 to 34 minutes (112 commuters, 13.9%), and 10 to 14 minutes (76 commuters, 9.4%).
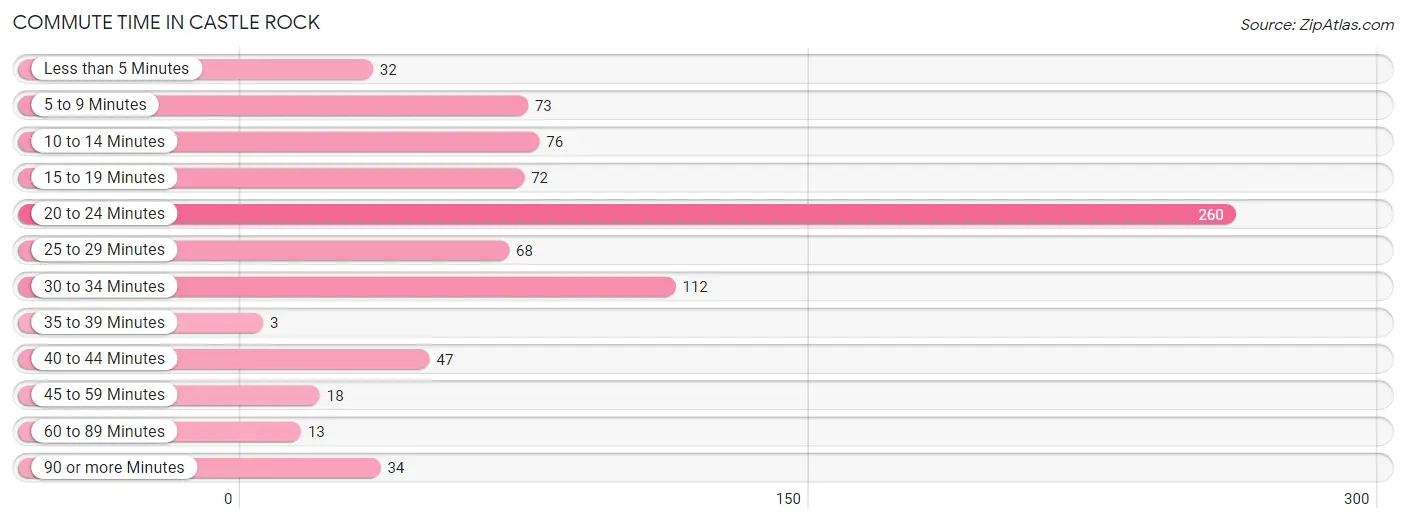
| Commute Time | # Commuters | % Commuters |
| Less than 5 Minutes | 32 | 4.0% |
| 5 to 9 Minutes | 73 | 9.0% |
| 10 to 14 Minutes | 76 | 9.4% |
| 15 to 19 Minutes | 72 | 8.9% |
| 20 to 24 Minutes | 260 | 32.2% |
| 25 to 29 Minutes | 68 | 8.4% |
| 30 to 34 Minutes | 112 | 13.9% |
| 35 to 39 Minutes | 3 | 0.4% |
| 40 to 44 Minutes | 47 | 5.8% |
| 45 to 59 Minutes | 18 | 2.2% |
| 60 to 89 Minutes | 13 | 1.6% |
| 90 or more Minutes | 34 | 4.2% |
Commute Time by Sex in Castle Rock
The most common commute times in Castle Rock are 20 to 24 minutes (152 commuters, 44.2%) for males and 20 to 24 minutes (108 commuters, 23.3%) for females.
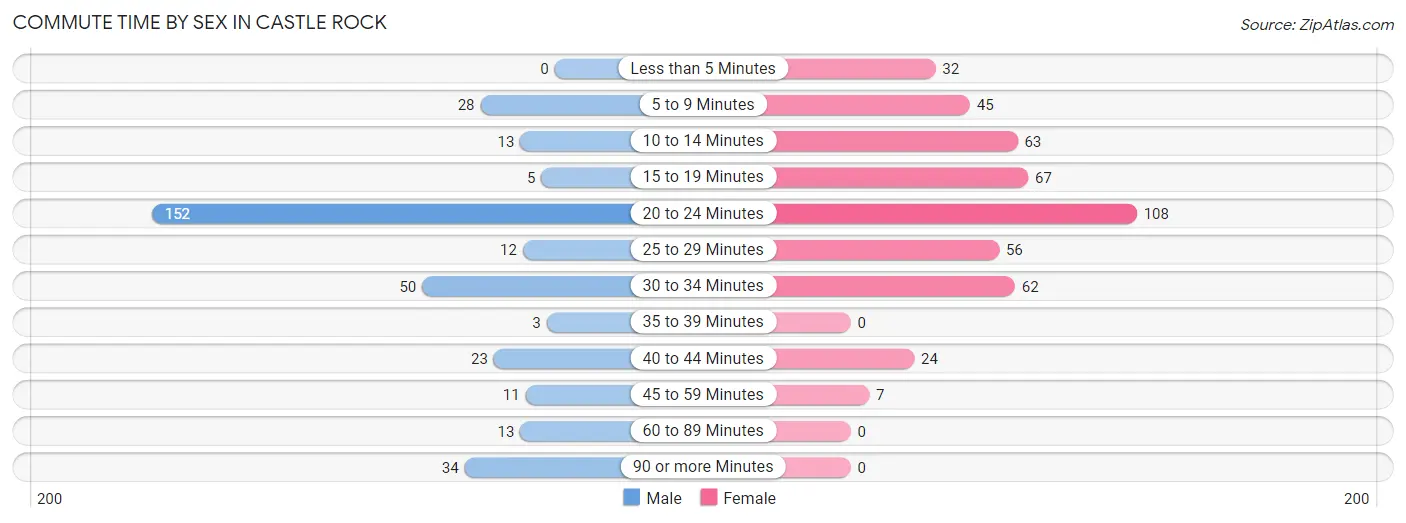
| Commute Time | Male | Female |
| Less than 5 Minutes | 0 (0.0%) | 32 (6.9%) |
| 5 to 9 Minutes | 28 (8.1%) | 45 (9.7%) |
| 10 to 14 Minutes | 13 (3.8%) | 63 (13.6%) |
| 15 to 19 Minutes | 5 (1.5%) | 67 (14.4%) |
| 20 to 24 Minutes | 152 (44.2%) | 108 (23.3%) |
| 25 to 29 Minutes | 12 (3.5%) | 56 (12.1%) |
| 30 to 34 Minutes | 50 (14.5%) | 62 (13.4%) |
| 35 to 39 Minutes | 3 (0.9%) | 0 (0.0%) |
| 40 to 44 Minutes | 23 (6.7%) | 24 (5.2%) |
| 45 to 59 Minutes | 11 (3.2%) | 7 (1.5%) |
| 60 to 89 Minutes | 13 (3.8%) | 0 (0.0%) |
| 90 or more Minutes | 34 (9.9%) | 0 (0.0%) |
Time of Departure to Work by Sex in Castle Rock
The most frequent times of departure to work in Castle Rock are 6:00 AM to 6:29 AM (56, 16.3%) for males and 7:30 AM to 7:59 AM (105, 22.6%) for females.
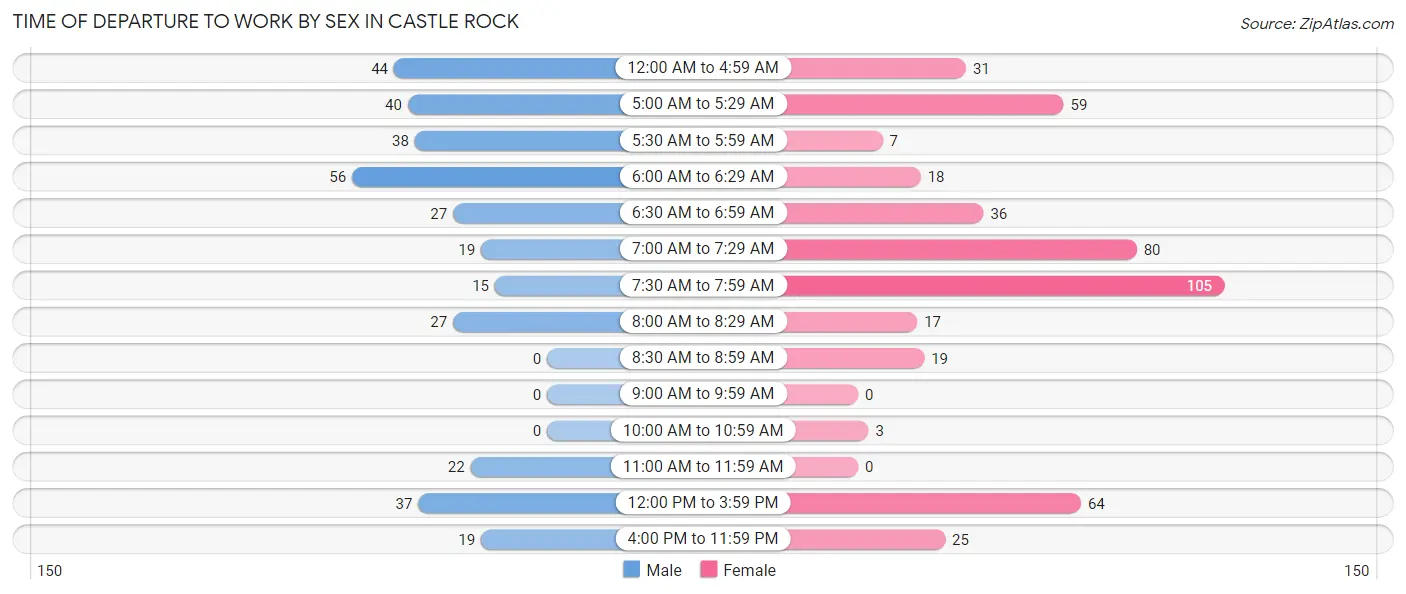
| Time of Departure | Male | Female |
| 12:00 AM to 4:59 AM | 44 (12.8%) | 31 (6.7%) |
| 5:00 AM to 5:29 AM | 40 (11.6%) | 59 (12.7%) |
| 5:30 AM to 5:59 AM | 38 (11.1%) | 7 (1.5%) |
| 6:00 AM to 6:29 AM | 56 (16.3%) | 18 (3.9%) |
| 6:30 AM to 6:59 AM | 27 (7.9%) | 36 (7.8%) |
| 7:00 AM to 7:29 AM | 19 (5.5%) | 80 (17.2%) |
| 7:30 AM to 7:59 AM | 15 (4.4%) | 105 (22.6%) |
| 8:00 AM to 8:29 AM | 27 (7.9%) | 17 (3.7%) |
| 8:30 AM to 8:59 AM | 0 (0.0%) | 19 (4.1%) |
| 9:00 AM to 9:59 AM | 0 (0.0%) | 0 (0.0%) |
| 10:00 AM to 10:59 AM | 0 (0.0%) | 3 (0.6%) |
| 11:00 AM to 11:59 AM | 22 (6.4%) | 0 (0.0%) |
| 12:00 PM to 3:59 PM | 37 (10.8%) | 64 (13.8%) |
| 4:00 PM to 11:59 PM | 19 (5.5%) | 25 (5.4%) |
| Total | 344 (100.0%) | 464 (100.0%) |
Housing Occupancy in Castle Rock
Occupancy by Ownership in Castle Rock
Of the total 941 dwellings in Castle Rock, owner-occupied units account for 627 (66.6%), while renter-occupied units make up 314 (33.4%).
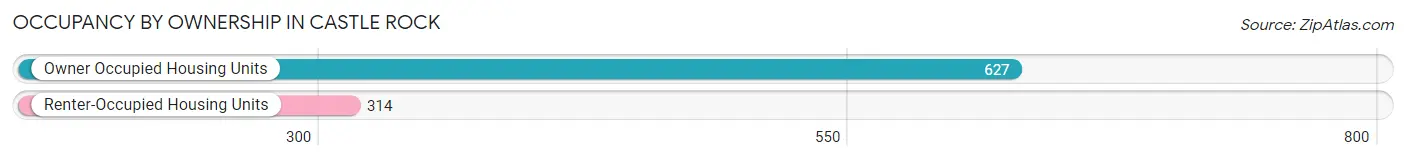
| Occupancy | # Housing Units | % Housing Units |
| Owner Occupied Housing Units | 627 | 66.6% |
| Renter-Occupied Housing Units | 314 | 33.4% |
| Total Occupied Housing Units | 941 | 100.0% |
Occupancy by Household Size in Castle Rock
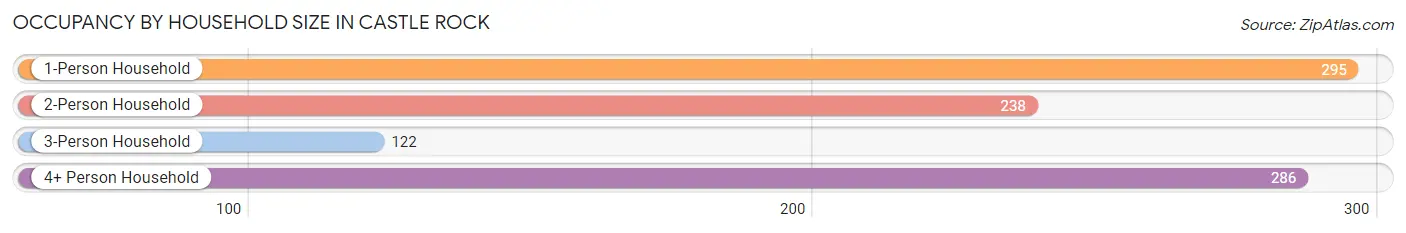
| Household Size | # Housing Units | % Housing Units |
| 1-Person Household | 295 | 31.4% |
| 2-Person Household | 238 | 25.3% |
| 3-Person Household | 122 | 13.0% |
| 4+ Person Household | 286 | 30.4% |
| Total Housing Units | 941 | 100.0% |
Occupancy by Ownership by Household Size in Castle Rock
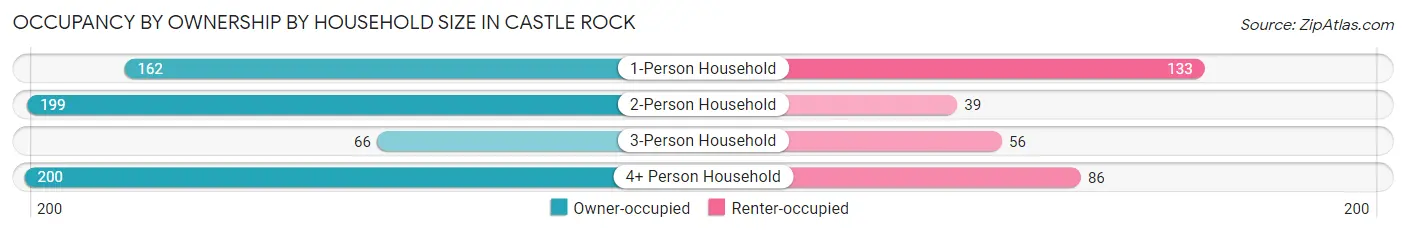
| Household Size | Owner-occupied | Renter-occupied |
| 1-Person Household | 162 (54.9%) | 133 (45.1%) |
| 2-Person Household | 199 (83.6%) | 39 (16.4%) |
| 3-Person Household | 66 (54.1%) | 56 (45.9%) |
| 4+ Person Household | 200 (69.9%) | 86 (30.1%) |
| Total Housing Units | 627 (66.6%) | 314 (33.4%) |
Occupancy by Educational Attainment in Castle Rock
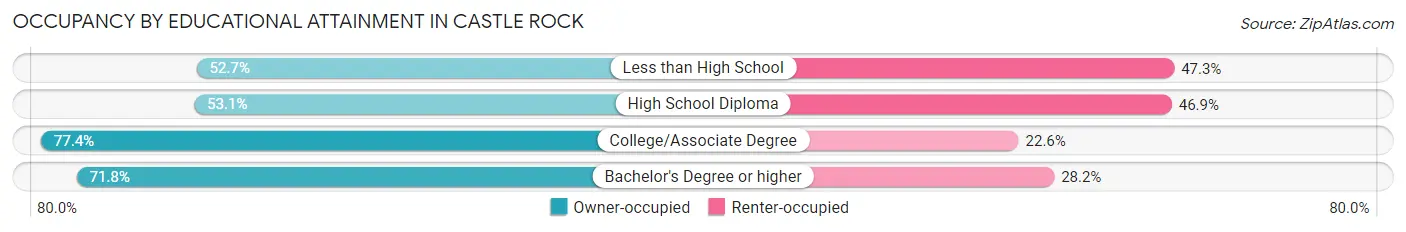
| Household Size | Owner-occupied | Renter-occupied |
| Less than High School | 29 (52.7%) | 26 (47.3%) |
| High School Diploma | 171 (53.1%) | 151 (46.9%) |
| College/Associate Degree | 305 (77.4%) | 89 (22.6%) |
| Bachelor's Degree or higher | 122 (71.8%) | 48 (28.2%) |
Occupancy by Age of Householder in Castle Rock
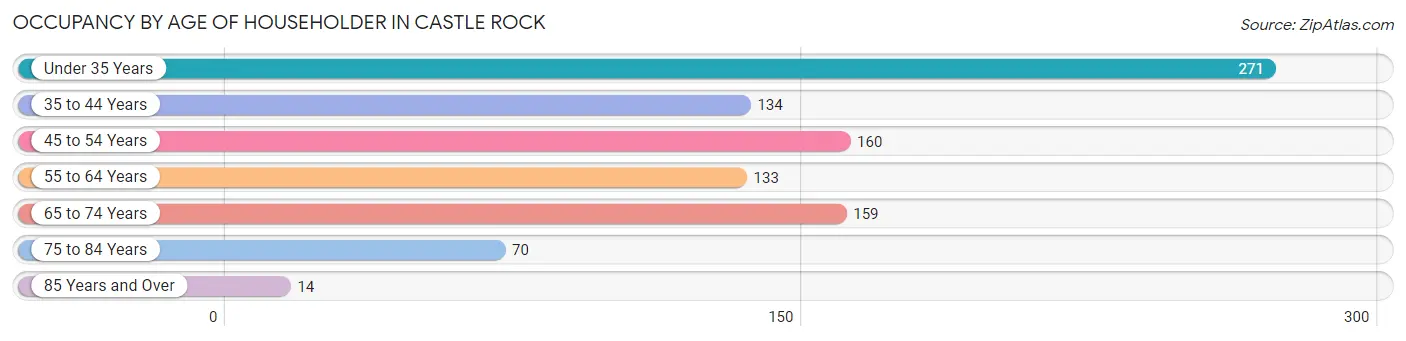
| Age Bracket | # Households | % Households |
| Under 35 Years | 271 | 28.8% |
| 35 to 44 Years | 134 | 14.2% |
| 45 to 54 Years | 160 | 17.0% |
| 55 to 64 Years | 133 | 14.1% |
| 65 to 74 Years | 159 | 16.9% |
| 75 to 84 Years | 70 | 7.4% |
| 85 Years and Over | 14 | 1.5% |
| Total | 941 | 100.0% |
Housing Finances in Castle Rock
Median Income by Occupancy in Castle Rock
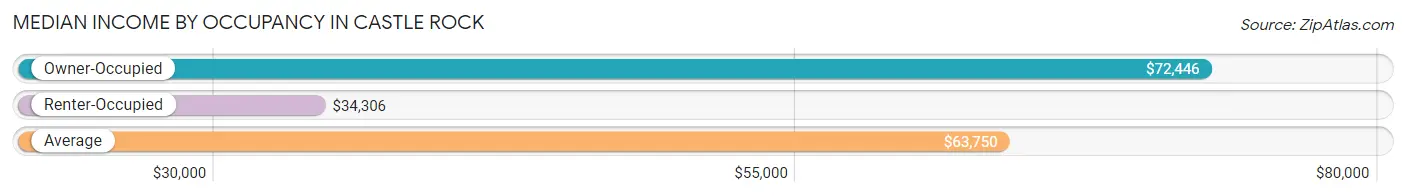
| Occupancy Type | # Households | Median Income |
| Owner-Occupied | 627 (66.6%) | $72,446 |
| Renter-Occupied | 314 (33.4%) | $34,306 |
| Average | 941 (100.0%) | $63,750 |
Occupancy by Householder Income Bracket in Castle Rock
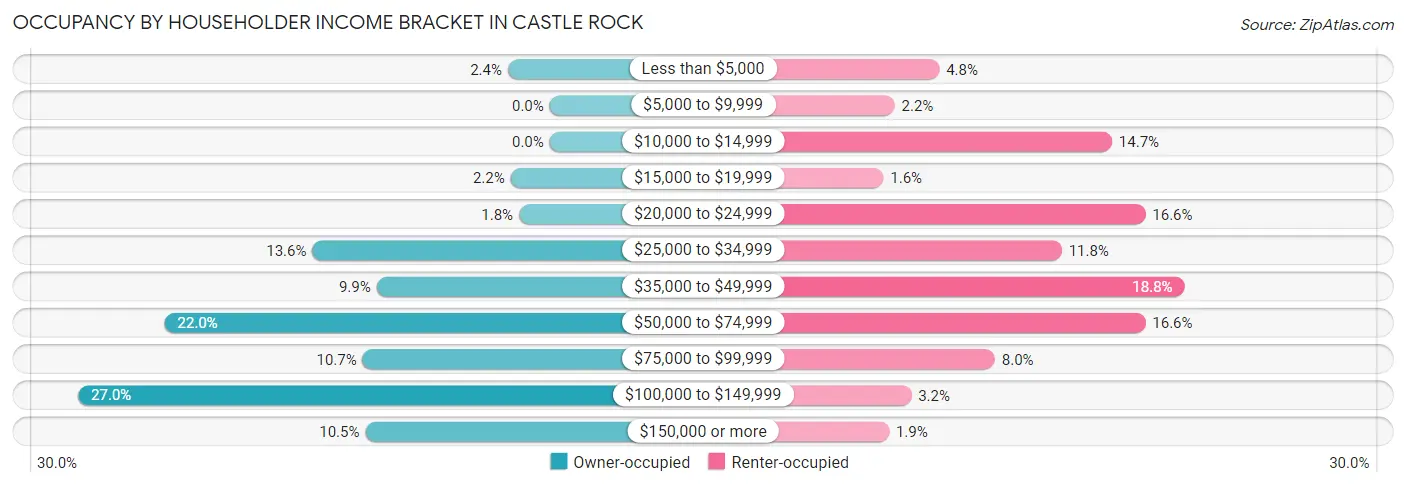
| Income Bracket | Owner-occupied | Renter-occupied |
| Less than $5,000 | 15 (2.4%) | 15 (4.8%) |
| $5,000 to $9,999 | 0 (0.0%) | 7 (2.2%) |
| $10,000 to $14,999 | 0 (0.0%) | 46 (14.6%) |
| $15,000 to $19,999 | 14 (2.2%) | 5 (1.6%) |
| $20,000 to $24,999 | 11 (1.8%) | 52 (16.6%) |
| $25,000 to $34,999 | 85 (13.6%) | 37 (11.8%) |
| $35,000 to $49,999 | 62 (9.9%) | 59 (18.8%) |
| $50,000 to $74,999 | 138 (22.0%) | 52 (16.6%) |
| $75,000 to $99,999 | 67 (10.7%) | 25 (8.0%) |
| $100,000 to $149,999 | 169 (27.0%) | 10 (3.2%) |
| $150,000 or more | 66 (10.5%) | 6 (1.9%) |
| Total | 627 (100.0%) | 314 (100.0%) |
Monthly Housing Cost Tiers in Castle Rock
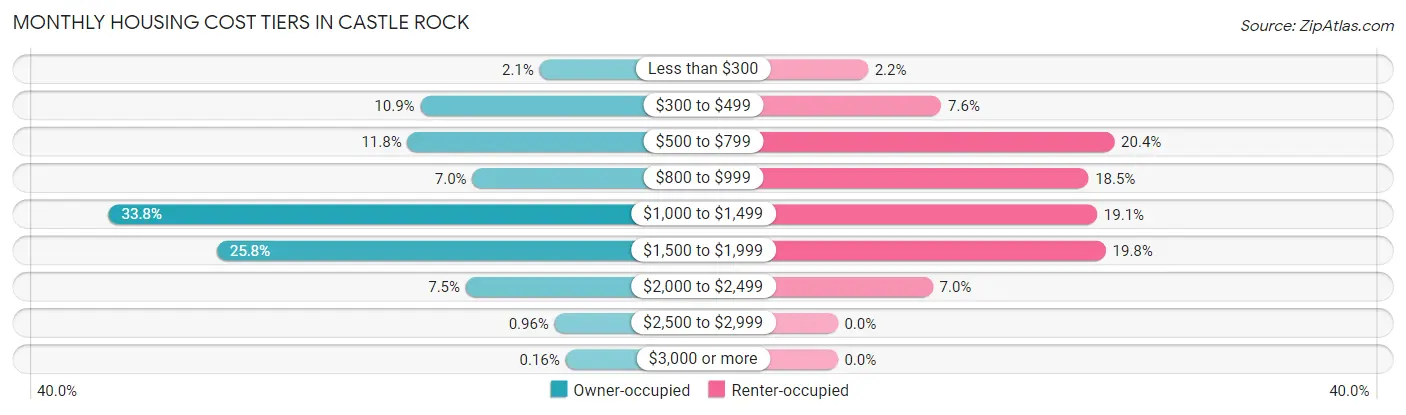
| Monthly Cost | Owner-occupied | Renter-occupied |
| Less than $300 | 13 (2.1%) | 7 (2.2%) |
| $300 to $499 | 68 (10.8%) | 24 (7.6%) |
| $500 to $799 | 74 (11.8%) | 64 (20.4%) |
| $800 to $999 | 44 (7.0%) | 58 (18.5%) |
| $1,000 to $1,499 | 212 (33.8%) | 60 (19.1%) |
| $1,500 to $1,999 | 162 (25.8%) | 62 (19.8%) |
| $2,000 to $2,499 | 47 (7.5%) | 22 (7.0%) |
| $2,500 to $2,999 | 6 (1.0%) | 0 (0.0%) |
| $3,000 or more | 1 (0.2%) | 0 (0.0%) |
| Total | 627 (100.0%) | 314 (100.0%) |
Physical Housing Characteristics in Castle Rock
Housing Structures in Castle Rock
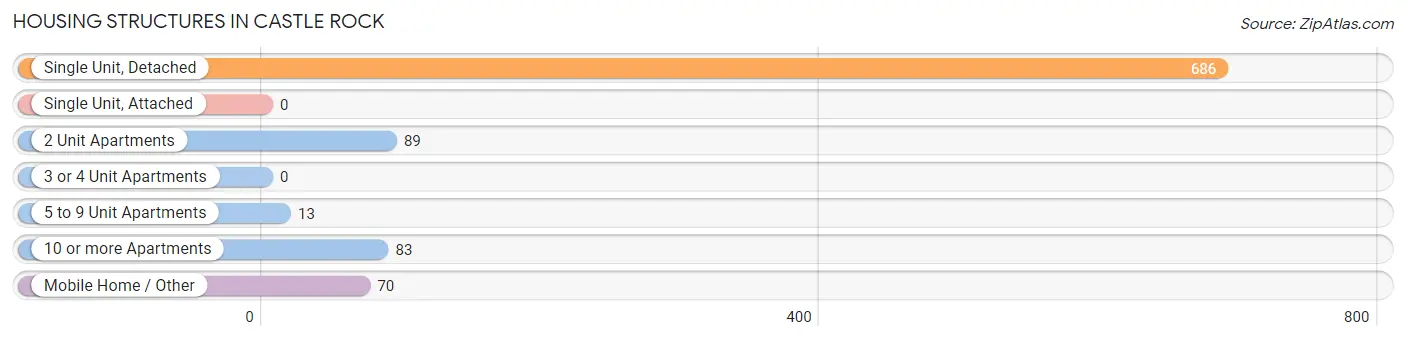
| Structure Type | # Housing Units | % Housing Units |
| Single Unit, Detached | 686 | 72.9% |
| Single Unit, Attached | 0 | 0.0% |
| 2 Unit Apartments | 89 | 9.5% |
| 3 or 4 Unit Apartments | 0 | 0.0% |
| 5 to 9 Unit Apartments | 13 | 1.4% |
| 10 or more Apartments | 83 | 8.8% |
| Mobile Home / Other | 70 | 7.4% |
| Total | 941 | 100.0% |
Housing Structures by Occupancy in Castle Rock
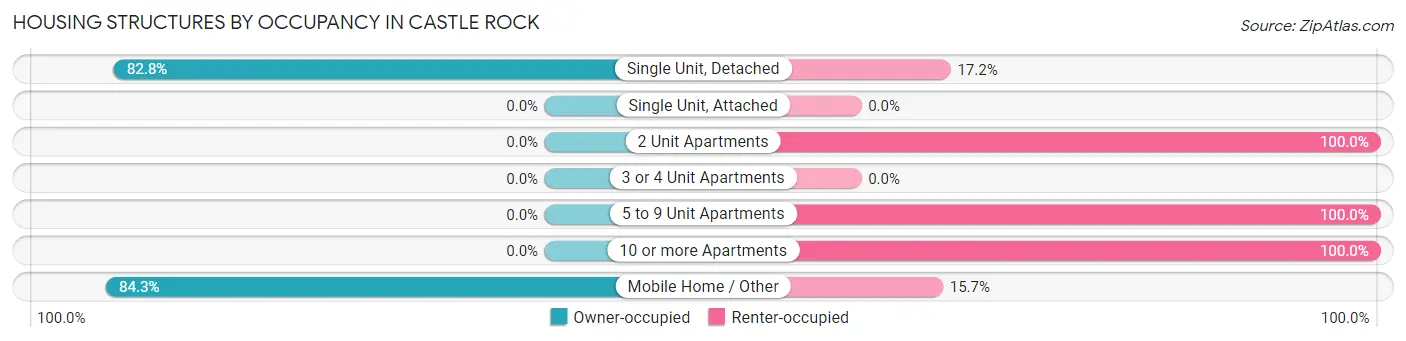
| Structure Type | Owner-occupied | Renter-occupied |
| Single Unit, Detached | 568 (82.8%) | 118 (17.2%) |
| Single Unit, Attached | 0 (0.0%) | 0 (0.0%) |
| 2 Unit Apartments | 0 (0.0%) | 89 (100.0%) |
| 3 or 4 Unit Apartments | 0 (0.0%) | 0 (0.0%) |
| 5 to 9 Unit Apartments | 0 (0.0%) | 13 (100.0%) |
| 10 or more Apartments | 0 (0.0%) | 83 (100.0%) |
| Mobile Home / Other | 59 (84.3%) | 11 (15.7%) |
| Total | 627 (66.6%) | 314 (33.4%) |
Housing Structures by Number of Rooms in Castle Rock
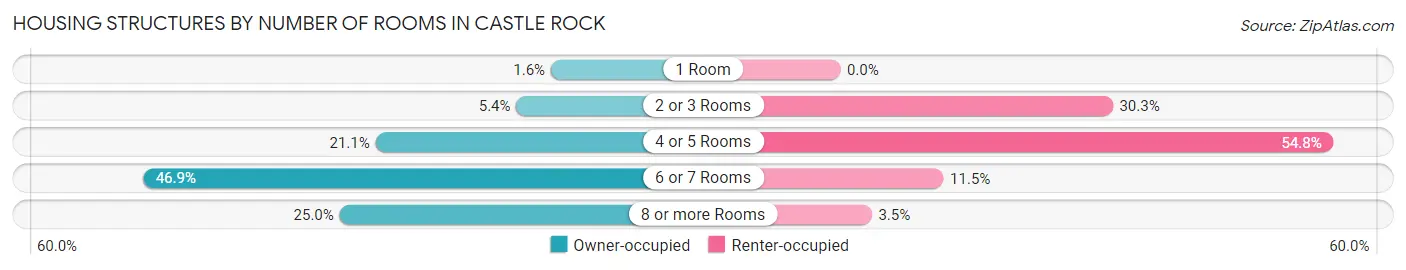
| Number of Rooms | Owner-occupied | Renter-occupied |
| 1 Room | 10 (1.6%) | 0 (0.0%) |
| 2 or 3 Rooms | 34 (5.4%) | 95 (30.2%) |
| 4 or 5 Rooms | 132 (21.0%) | 172 (54.8%) |
| 6 or 7 Rooms | 294 (46.9%) | 36 (11.5%) |
| 8 or more Rooms | 157 (25.0%) | 11 (3.5%) |
| Total | 627 (100.0%) | 314 (100.0%) |
Housing Structure by Heating Type in Castle Rock
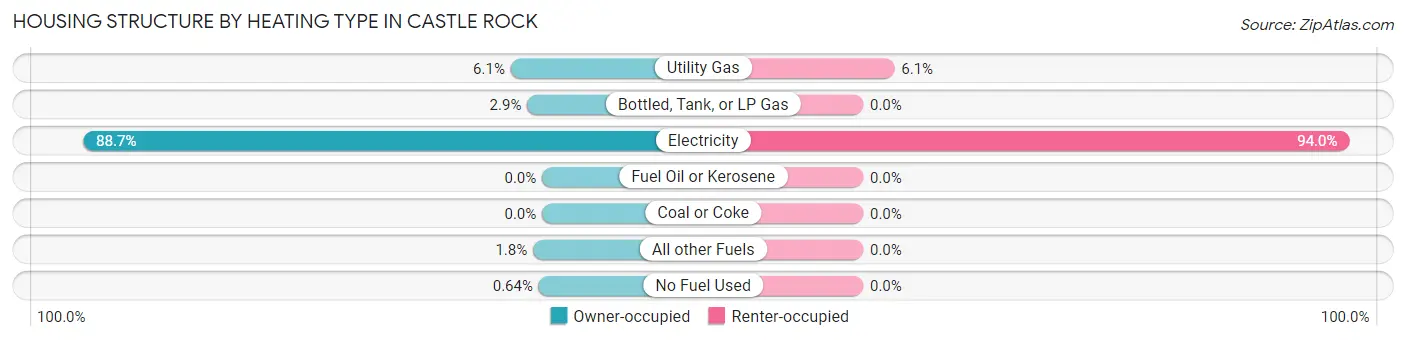
| Heating Type | Owner-occupied | Renter-occupied |
| Utility Gas | 38 (6.1%) | 19 (6.0%) |
| Bottled, Tank, or LP Gas | 18 (2.9%) | 0 (0.0%) |
| Electricity | 556 (88.7%) | 295 (94.0%) |
| Fuel Oil or Kerosene | 0 (0.0%) | 0 (0.0%) |
| Coal or Coke | 0 (0.0%) | 0 (0.0%) |
| All other Fuels | 11 (1.8%) | 0 (0.0%) |
| No Fuel Used | 4 (0.6%) | 0 (0.0%) |
| Total | 627 (100.0%) | 314 (100.0%) |
Household Vehicle Usage in Castle Rock
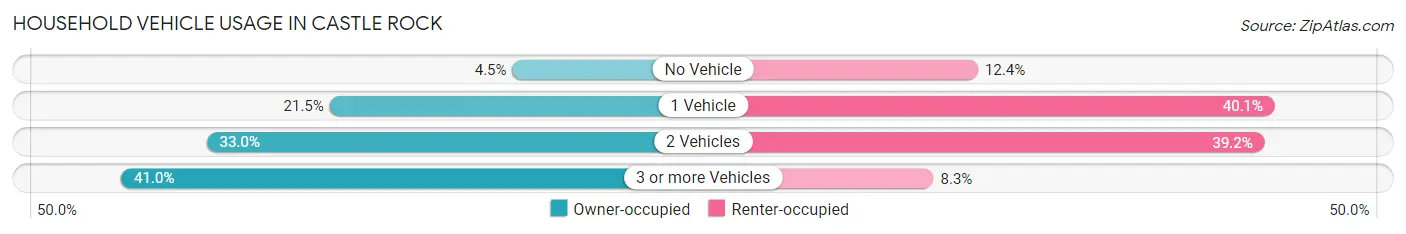
| Vehicles per Household | Owner-occupied | Renter-occupied |
| No Vehicle | 28 (4.5%) | 39 (12.4%) |
| 1 Vehicle | 135 (21.5%) | 126 (40.1%) |
| 2 Vehicles | 207 (33.0%) | 123 (39.2%) |
| 3 or more Vehicles | 257 (41.0%) | 26 (8.3%) |
| Total | 627 (100.0%) | 314 (100.0%) |
Real Estate & Mortgages in Castle Rock
Real Estate and Mortgage Overview in Castle Rock
| Characteristic | Without Mortgage | With Mortgage |
| Housing Units | 154 | 473 |
| Median Property Value | $271,800 | $282,300 |
| Median Household Income | $56,071 | $41 |
| Monthly Housing Costs | $486 | $1 |
| Real Estate Taxes | $2,185 | $0 |
Property Value by Mortgage Status in Castle Rock
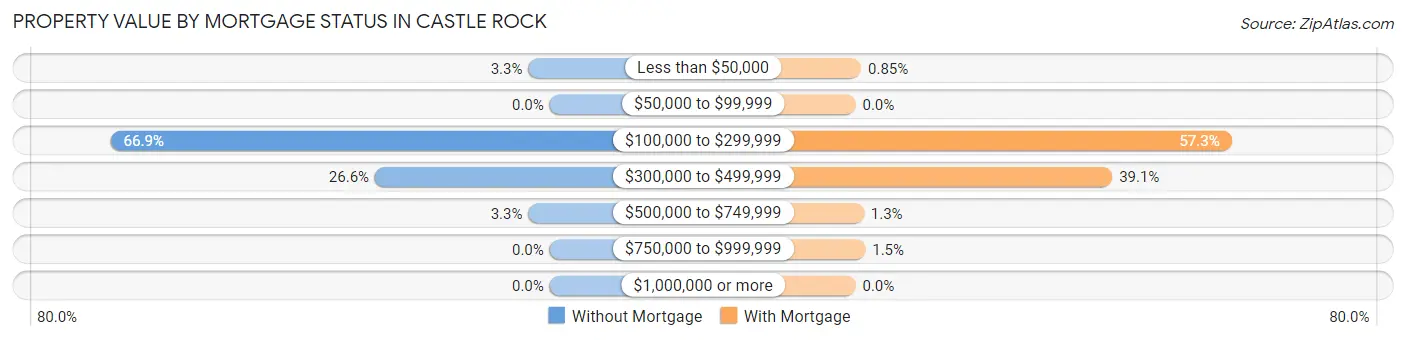
| Property Value | Without Mortgage | With Mortgage |
| Less than $50,000 | 5 (3.3%) | 4 (0.9%) |
| $50,000 to $99,999 | 0 (0.0%) | 0 (0.0%) |
| $100,000 to $299,999 | 103 (66.9%) | 271 (57.3%) |
| $300,000 to $499,999 | 41 (26.6%) | 185 (39.1%) |
| $500,000 to $749,999 | 5 (3.3%) | 6 (1.3%) |
| $750,000 to $999,999 | 0 (0.0%) | 7 (1.5%) |
| $1,000,000 or more | 0 (0.0%) | 0 (0.0%) |
| Total | 154 (100.0%) | 473 (100.0%) |
Household Income by Mortgage Status in Castle Rock
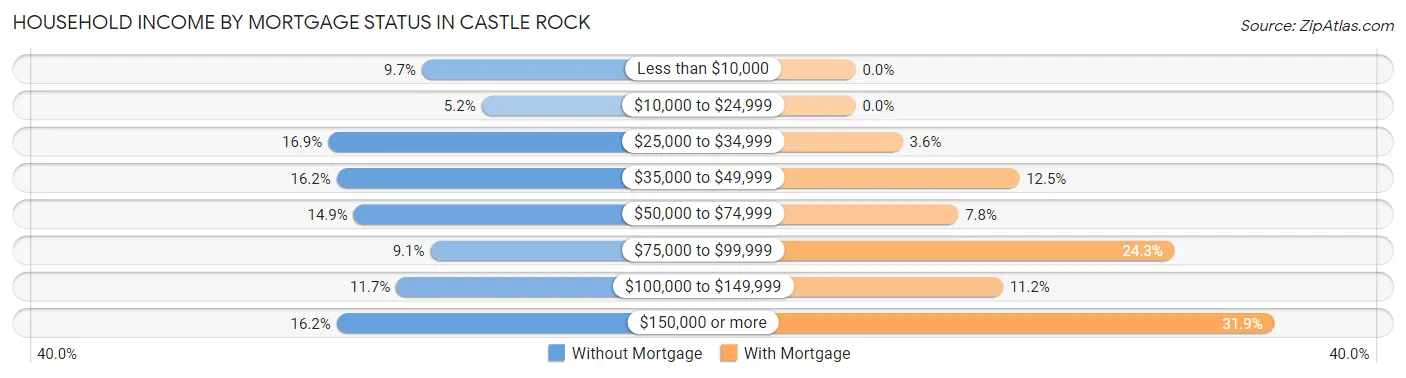
| Household Income | Without Mortgage | With Mortgage |
| Less than $10,000 | 15 (9.7%) | 0 (0.0%) |
| $10,000 to $24,999 | 8 (5.2%) | 0 (0.0%) |
| $25,000 to $34,999 | 26 (16.9%) | 17 (3.6%) |
| $35,000 to $49,999 | 25 (16.2%) | 59 (12.5%) |
| $50,000 to $74,999 | 23 (14.9%) | 37 (7.8%) |
| $75,000 to $99,999 | 14 (9.1%) | 115 (24.3%) |
| $100,000 to $149,999 | 18 (11.7%) | 53 (11.2%) |
| $150,000 or more | 25 (16.2%) | 151 (31.9%) |
| Total | 154 (100.0%) | 473 (100.0%) |
Property Value to Household Income Ratio in Castle Rock
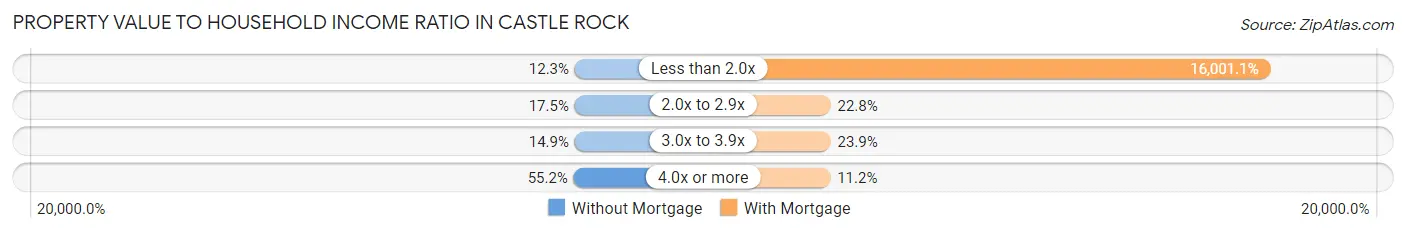
| Value-to-Income Ratio | Without Mortgage | With Mortgage |
| Less than 2.0x | 19 (12.3%) | 75,685 (16,001.1%) |
| 2.0x to 2.9x | 27 (17.5%) | 108 (22.8%) |
| 3.0x to 3.9x | 23 (14.9%) | 113 (23.9%) |
| 4.0x or more | 85 (55.2%) | 53 (11.2%) |
| Total | 154 (100.0%) | 473 (100.0%) |
Real Estate Taxes by Mortgage Status in Castle Rock
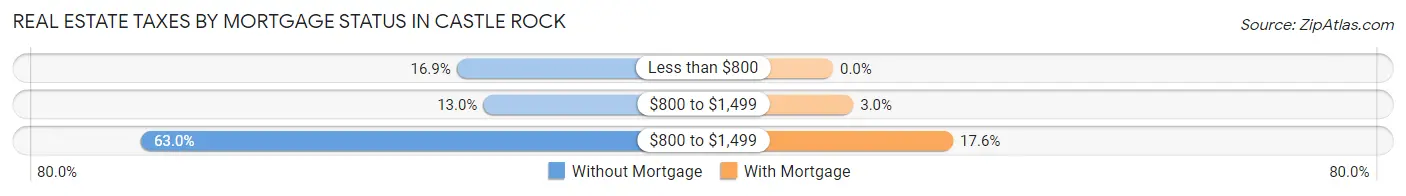
| Property Taxes | Without Mortgage | With Mortgage |
| Less than $800 | 26 (16.9%) | 0 (0.0%) |
| $800 to $1,499 | 20 (13.0%) | 14 (3.0%) |
| $800 to $1,499 | 97 (63.0%) | 83 (17.5%) |
| Total | 154 (100.0%) | 473 (100.0%) |
Health & Disability in Castle Rock
Health Insurance Coverage by Age in Castle Rock
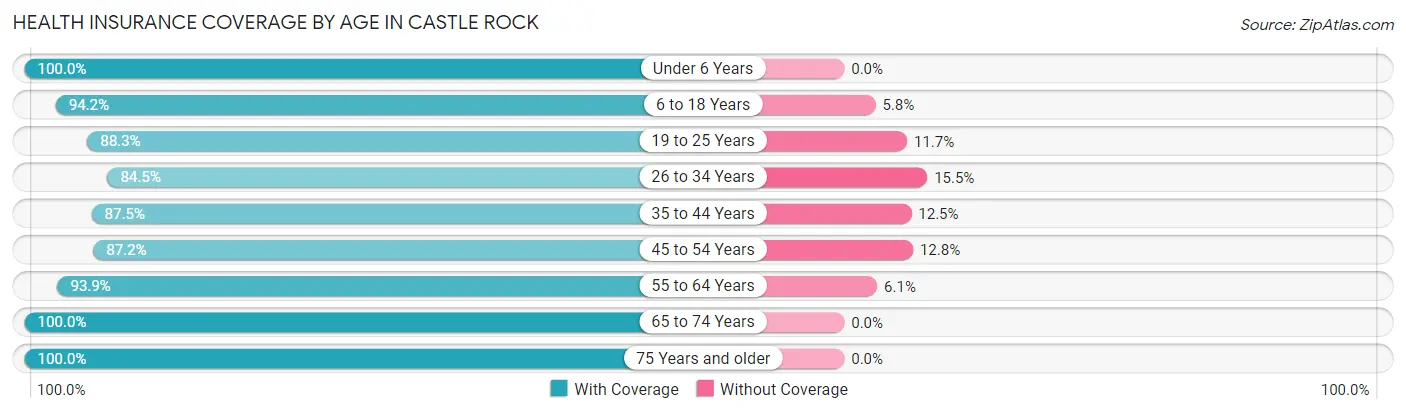
| Age Bracket | With Coverage | Without Coverage |
| Under 6 Years | 349 (100.0%) | 0 (0.0%) |
| 6 to 18 Years | 485 (94.2%) | 30 (5.8%) |
| 19 to 25 Years | 166 (88.3%) | 22 (11.7%) |
| 26 to 34 Years | 421 (84.5%) | 77 (15.5%) |
| 35 to 44 Years | 196 (87.5%) | 28 (12.5%) |
| 45 to 54 Years | 211 (87.2%) | 31 (12.8%) |
| 55 to 64 Years | 199 (93.9%) | 13 (6.1%) |
| 65 to 74 Years | 246 (100.0%) | 0 (0.0%) |
| 75 Years and older | 150 (100.0%) | 0 (0.0%) |
| Total | 2,423 (92.3%) | 201 (7.7%) |
Health Insurance Coverage by Citizenship Status in Castle Rock
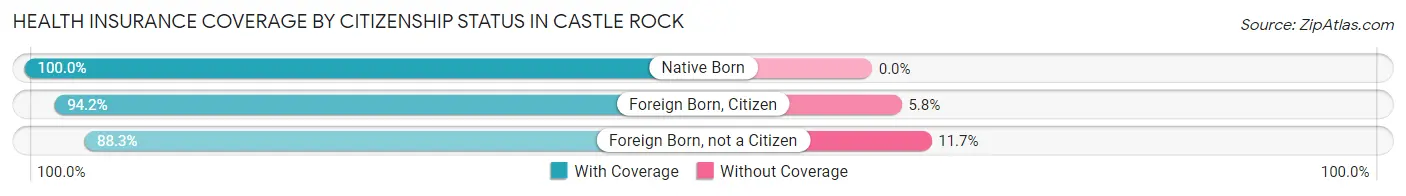
| Citizenship Status | With Coverage | Without Coverage |
| Native Born | 349 (100.0%) | 0 (0.0%) |
| Foreign Born, Citizen | 485 (94.2%) | 30 (5.8%) |
| Foreign Born, not a Citizen | 166 (88.3%) | 22 (11.7%) |
Health Insurance Coverage by Household Income in Castle Rock
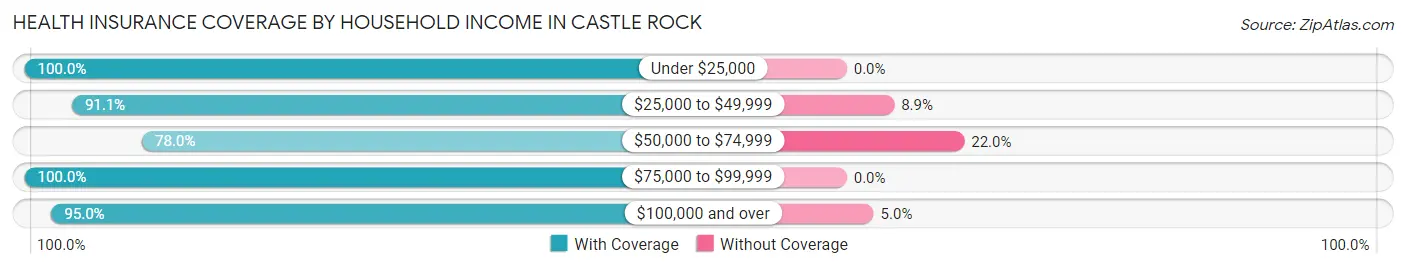
| Household Income | With Coverage | Without Coverage |
| Under $25,000 | 277 (100.0%) | 0 (0.0%) |
| $25,000 to $49,999 | 554 (91.1%) | 54 (8.9%) |
| $50,000 to $74,999 | 347 (78.0%) | 98 (22.0%) |
| $75,000 to $99,999 | 320 (100.0%) | 0 (0.0%) |
| $100,000 and over | 925 (95.0%) | 49 (5.0%) |
Public vs Private Health Insurance Coverage by Age in Castle Rock
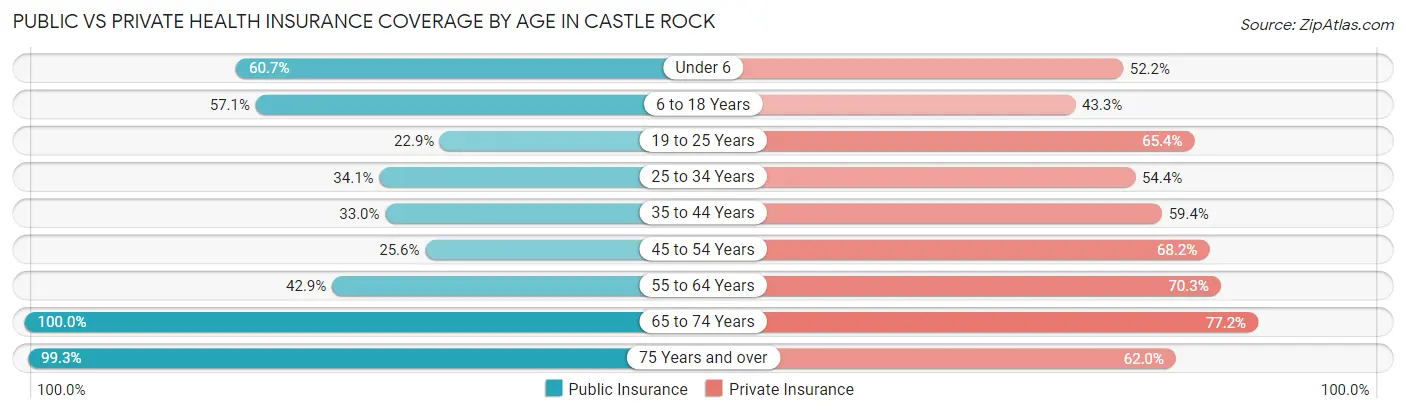
| Age Bracket | Public Insurance | Private Insurance |
| Under 6 | 212 (60.7%) | 182 (52.1%) |
| 6 to 18 Years | 294 (57.1%) | 223 (43.3%) |
| 19 to 25 Years | 43 (22.9%) | 123 (65.4%) |
| 25 to 34 Years | 170 (34.1%) | 271 (54.4%) |
| 35 to 44 Years | 74 (33.0%) | 133 (59.4%) |
| 45 to 54 Years | 62 (25.6%) | 165 (68.2%) |
| 55 to 64 Years | 91 (42.9%) | 149 (70.3%) |
| 65 to 74 Years | 246 (100.0%) | 190 (77.2%) |
| 75 Years and over | 149 (99.3%) | 93 (62.0%) |
| Total | 1,341 (51.1%) | 1,529 (58.3%) |
Disability Status by Sex by Age in Castle Rock
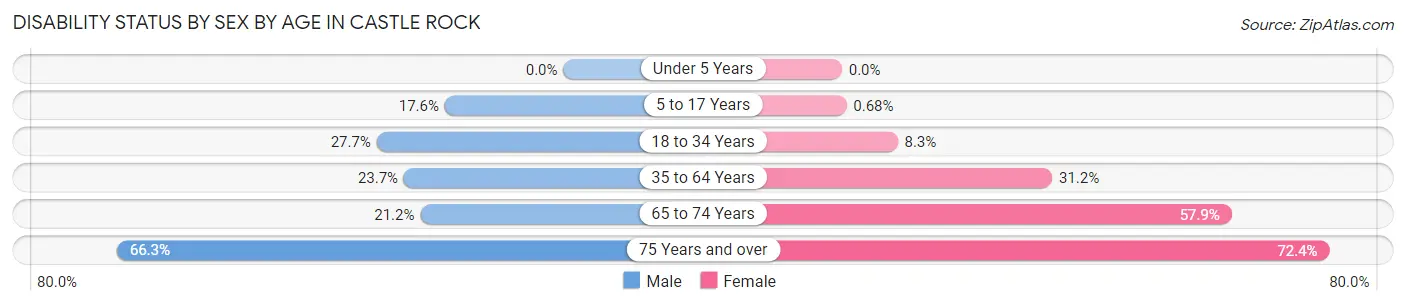
| Age Bracket | Male | Female |
| Under 5 Years | 0 (0.0%) | 0 (0.0%) |
| 5 to 17 Years | 41 (17.6%) | 2 (0.7%) |
| 18 to 34 Years | 74 (27.7%) | 37 (8.3%) |
| 35 to 64 Years | 71 (23.7%) | 118 (31.2%) |
| 65 to 74 Years | 24 (21.2%) | 77 (57.9%) |
| 75 Years and over | 61 (66.3%) | 42 (72.4%) |
Disability Class by Sex by Age in Castle Rock
Disability Class: Hearing Difficulty
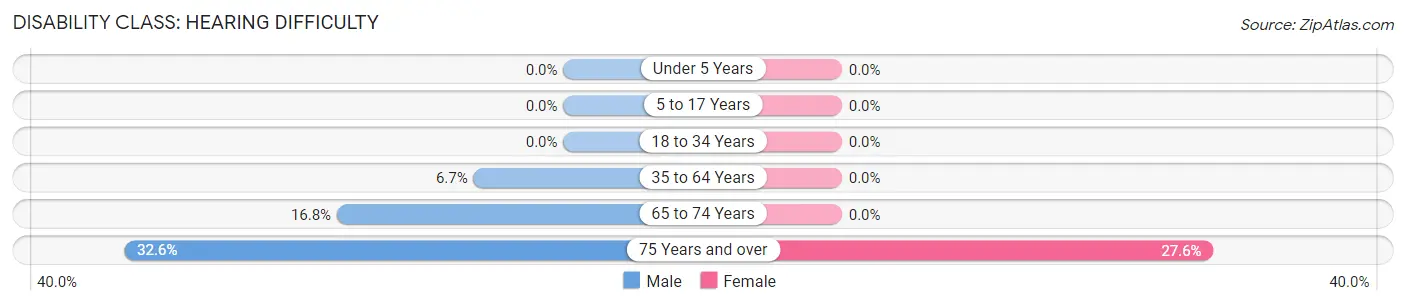
| Age Bracket | Male | Female |
| Under 5 Years | 0 (0.0%) | 0 (0.0%) |
| 5 to 17 Years | 0 (0.0%) | 0 (0.0%) |
| 18 to 34 Years | 0 (0.0%) | 0 (0.0%) |
| 35 to 64 Years | 20 (6.7%) | 0 (0.0%) |
| 65 to 74 Years | 19 (16.8%) | 0 (0.0%) |
| 75 Years and over | 30 (32.6%) | 16 (27.6%) |
Disability Class: Vision Difficulty
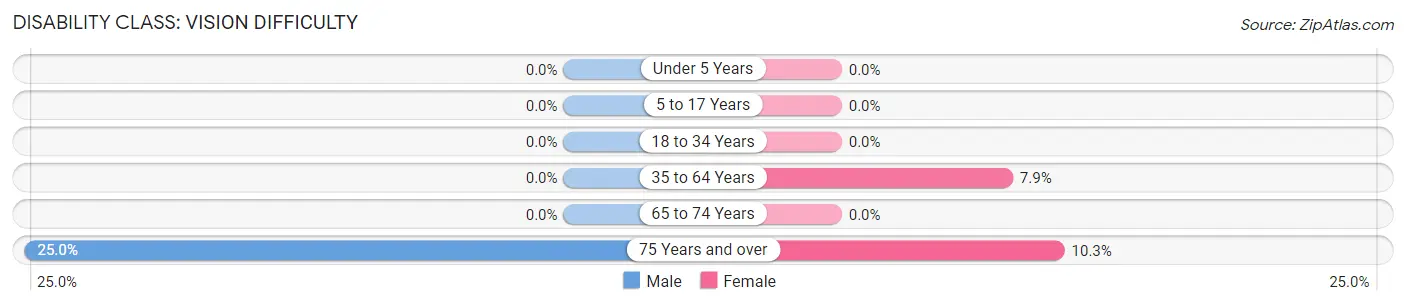
| Age Bracket | Male | Female |
| Under 5 Years | 0 (0.0%) | 0 (0.0%) |
| 5 to 17 Years | 0 (0.0%) | 0 (0.0%) |
| 18 to 34 Years | 0 (0.0%) | 0 (0.0%) |
| 35 to 64 Years | 0 (0.0%) | 30 (7.9%) |
| 65 to 74 Years | 0 (0.0%) | 0 (0.0%) |
| 75 Years and over | 23 (25.0%) | 6 (10.3%) |
Disability Class: Cognitive Difficulty
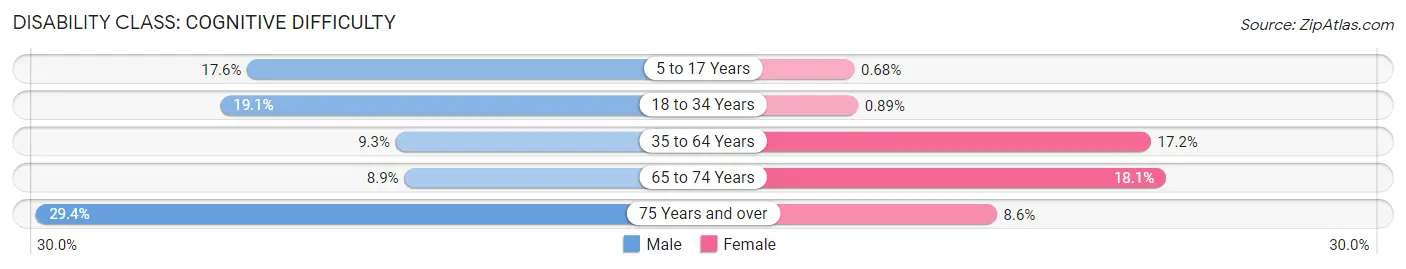
| Age Bracket | Male | Female |
| 5 to 17 Years | 41 (17.6%) | 2 (0.7%) |
| 18 to 34 Years | 51 (19.1%) | 4 (0.9%) |
| 35 to 64 Years | 28 (9.3%) | 65 (17.2%) |
| 65 to 74 Years | 10 (8.8%) | 24 (18.0%) |
| 75 Years and over | 27 (29.3%) | 5 (8.6%) |
Disability Class: Ambulatory Difficulty
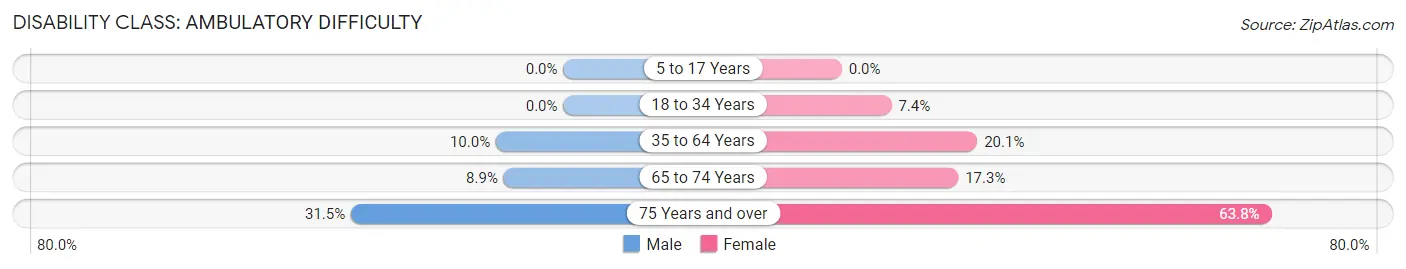
| Age Bracket | Male | Female |
| 5 to 17 Years | 0 (0.0%) | 0 (0.0%) |
| 18 to 34 Years | 0 (0.0%) | 33 (7.4%) |
| 35 to 64 Years | 30 (10.0%) | 76 (20.1%) |
| 65 to 74 Years | 10 (8.8%) | 23 (17.3%) |
| 75 Years and over | 29 (31.5%) | 37 (63.8%) |
Disability Class: Self-Care Difficulty
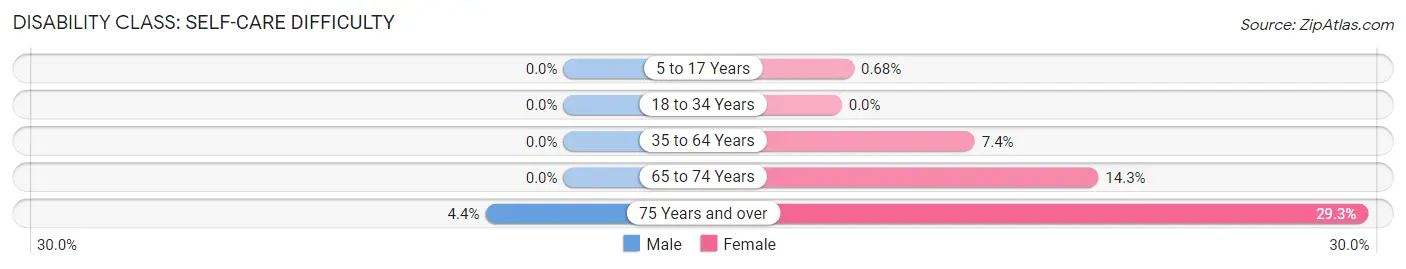
| Age Bracket | Male | Female |
| 5 to 17 Years | 0 (0.0%) | 2 (0.7%) |
| 18 to 34 Years | 0 (0.0%) | 0 (0.0%) |
| 35 to 64 Years | 0 (0.0%) | 28 (7.4%) |
| 65 to 74 Years | 0 (0.0%) | 19 (14.3%) |
| 75 Years and over | 4 (4.3%) | 17 (29.3%) |
Technology Access in Castle Rock
Computing Device Access in Castle Rock
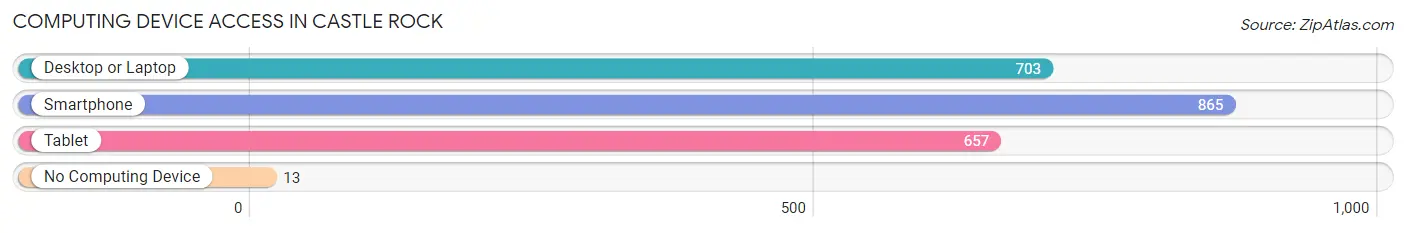
| Device Type | # Households | % Households |
| Desktop or Laptop | 703 | 74.7% |
| Smartphone | 865 | 91.9% |
| Tablet | 657 | 69.8% |
| No Computing Device | 13 | 1.4% |
| Total | 941 | 100.0% |
Internet Access in Castle Rock
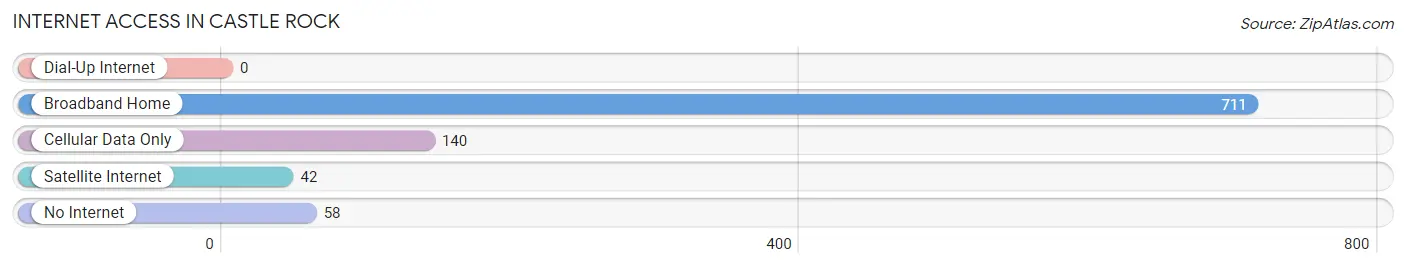
| Internet Type | # Households | % Households |
| Dial-Up Internet | 0 | 0.0% |
| Broadband Home | 711 | 75.6% |
| Cellular Data Only | 140 | 14.9% |
| Satellite Internet | 42 | 4.5% |
| No Internet | 58 | 6.2% |
| Total | 941 | 100.0% |
Castle Rock Summary
Castle Rock is a small town located in Cowlitz County, Washington, United States. It is situated on the banks of the Cowlitz River, approximately 25 miles north of the state capital, Olympia. The town was founded in 1852 and is named after the nearby Castle Rock, a prominent basalt formation. As of the 2010 census, the population of Castle Rock was 1,981.
History
The area around Castle Rock was first inhabited by the Cowlitz people, a Native American tribe that lived in the region for thousands of years before the arrival of European settlers. The first European settlers arrived in the area in the early 1850s, and the town of Castle Rock was officially founded in 1852. The town was named after the nearby Castle Rock, a prominent basalt formation.
In the late 19th century, Castle Rock was a bustling logging town, with several sawmills and logging camps in the area. The town was also home to a number of businesses, including a hotel, a general store, and a blacksmith shop.
In the early 20th century, the logging industry began to decline, and the town's economy shifted to agriculture. The town was also home to a number of dairy farms, which supplied milk to the local area.
Geography
Castle Rock is located in Cowlitz County, Washington, approximately 25 miles north of the state capital, Olympia. The town is situated on the banks of the Cowlitz River, and is surrounded by rolling hills and forests. The nearby Castle Rock is a prominent basalt formation, which is visible from the town.
The climate in Castle Rock is mild and temperate, with warm summers and cool winters. The average annual temperature is around 50°F, and the average annual precipitation is around 40 inches.
Economy
The economy of Castle Rock is largely based on agriculture and tourism. The town is home to several dairy farms, which supply milk to the local area. The town is also home to a number of tourist attractions, including the nearby Castle Rock, which is a popular destination for hikers and rock climbers.
The town is also home to a number of businesses, including restaurants, shops, and hotels. The town is served by a number of highways, including Interstate 5, which runs through the town.
Demographics
As of the 2010 census, the population of Castle Rock was 1,981. The racial makeup of the town was 94.3% White, 0.7% African American, 0.7% Native American, 0.7% Asian, 0.2% Pacific Islander, and 2.6% from other races. The median household income was $41,250, and the median family income was $48,750.
The town is served by the Castle Rock School District, which includes two elementary schools, one middle school, and one high school. The town is also home to a number of churches, including the First Baptist Church of Castle Rock.
Common Questions
What is Per Capita Income in Castle Rock?
Per Capita income in Castle Rock is $26,167.
What is the Median Family Income in Castle Rock?
Median Family Income in Castle Rock is $73,026.
What is the Median Household income in Castle Rock?
Median Household Income in Castle Rock is $63,750.
What is Income or Wage Gap in Castle Rock?
Income or Wage Gap in Castle Rock is 53.3%.
Women in Castle Rock earn 46.7 cents for every dollar earned by a man.
What is Inequality or Gini Index in Castle Rock?
Inequality or Gini Index in Castle Rock is 0.40.
What is the Total Population of Castle Rock?
Total Population of Castle Rock is 2,624.
What is the Total Male Population of Castle Rock?
Total Male Population of Castle Rock is 1,165.
What is the Total Female Population of Castle Rock?
Total Female Population of Castle Rock is 1,459.
What is the Ratio of Males per 100 Females in Castle Rock?
There are 79.85 Males per 100 Females in Castle Rock.
What is the Ratio of Females per 100 Males in Castle Rock?
There are 125.24 Females per 100 Males in Castle Rock.
What is the Median Population Age in Castle Rock?
Median Population Age in Castle Rock is 29.0 Years.
What is the Average Family Size in Castle Rock
Average Family Size in Castle Rock is 3.6 People.
What is the Average Household Size in Castle Rock
Average Household Size in Castle Rock is 2.8 People.
How Large is the Labor Force in Castle Rock?
There are 959 People in the Labor Forcein in Castle Rock.
What is the Percentage of People in the Labor Force in Castle Rock?
51.5% of People are in the Labor Force in Castle Rock.
What is the Unemployment Rate in Castle Rock?
Unemployment Rate in Castle Rock is 7.0%.