Shelton, WA Map & Demographics
Shelton Map
Shelton Overview
$24,852
PER CAPITA INCOME
$64,659
AVG FAMILY INCOME
$57,907
AVG HOUSEHOLD INCOME
14.4%
WAGE / INCOME GAP [ % ]
85.6¢/ $1
WAGE / INCOME GAP [ $ ]
0.44
INEQUALITY / GINI INDEX
10,484
TOTAL POPULATION
5,025
MALE POPULATION
5,459
FEMALE POPULATION
92.05
MALES / 100 FEMALES
108.64
FEMALES / 100 MALES
31.2
MEDIAN AGE
3.6
AVG FAMILY SIZE
2.9
AVG HOUSEHOLD SIZE
4,489
LABOR FORCE [ PEOPLE ]
57.5%
PERCENT IN LABOR FORCE
5.2%
UNEMPLOYMENT RATE
Shelton Zip Codes
Shelton Area Codes
Income in Shelton
Income Overview in Shelton
Per Capita Income in Shelton is $24,852, while median incomes of families and households are $64,659 and $57,907 respectively.
| Characteristic | Number | Measure |
| Per Capita Income | 10,484 | $24,852 |
| Median Family Income | 2,140 | $64,659 |
| Mean Family Income | 2,140 | $79,877 |
| Median Household Income | 3,461 | $57,907 |
| Mean Household Income | 3,461 | $71,274 |
| Income Deficit | 2,140 | $0 |
| Wage / Income Gap (%) | 10,484 | 14.35% |
| Wage / Income Gap ($) | 10,484 | 85.65¢ per $1 |
| Gini / Inequality Index | 10,484 | 0.44 |
Earnings by Sex in Shelton
Average Earnings in Shelton are $33,032, $34,858 for men and $29,855 for women, a difference of 14.3%.
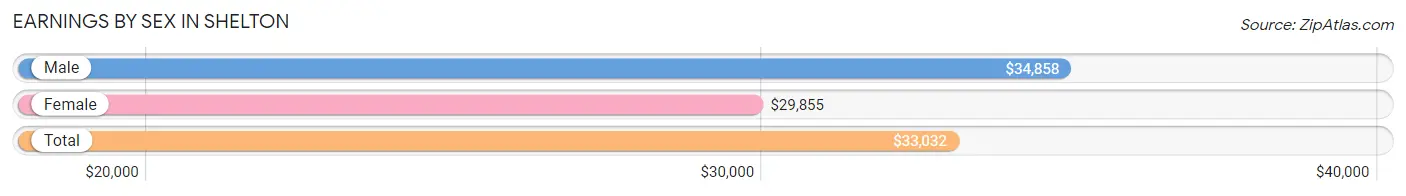
| Sex | Number | Average Earnings |
| Male | 2,406 (51.0%) | $34,858 |
| Female | 2,315 (49.0%) | $29,855 |
| Total | 4,721 (100.0%) | $33,032 |
Earnings by Sex by Income Bracket in Shelton
The most common earnings brackets in Shelton are $75,000 to $99,999 for men (224 | 9.3%) and $40,000 to $44,999 for women (236 | 10.2%).
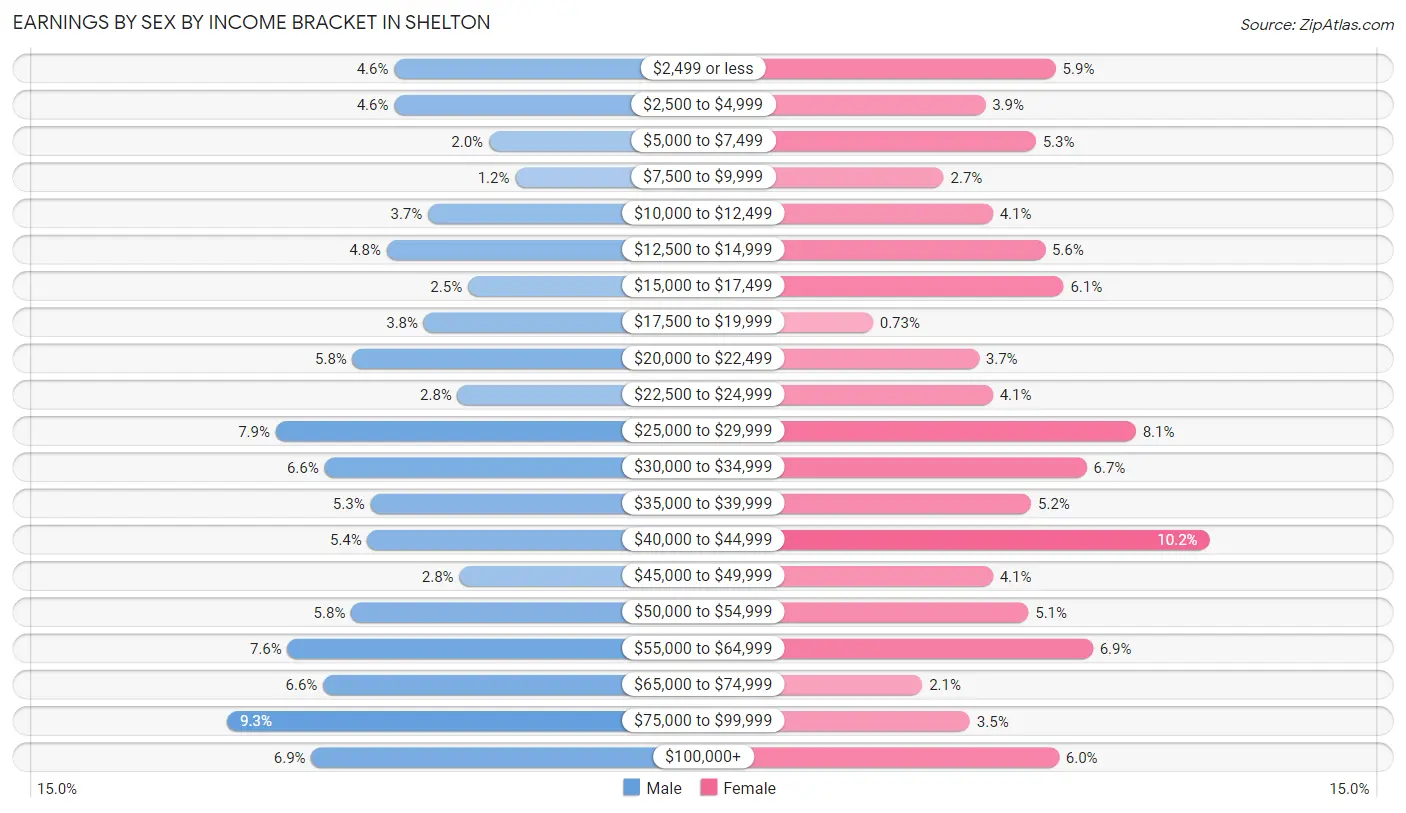
| Income | Male | Female |
| $2,499 or less | 111 (4.6%) | 136 (5.9%) |
| $2,500 to $4,999 | 111 (4.6%) | 90 (3.9%) |
| $5,000 to $7,499 | 47 (1.9%) | 123 (5.3%) |
| $7,500 to $9,999 | 29 (1.2%) | 63 (2.7%) |
| $10,000 to $12,499 | 88 (3.7%) | 95 (4.1%) |
| $12,500 to $14,999 | 116 (4.8%) | 129 (5.6%) |
| $15,000 to $17,499 | 61 (2.5%) | 141 (6.1%) |
| $17,500 to $19,999 | 91 (3.8%) | 17 (0.7%) |
| $20,000 to $22,499 | 139 (5.8%) | 86 (3.7%) |
| $22,500 to $24,999 | 68 (2.8%) | 95 (4.1%) |
| $25,000 to $29,999 | 191 (7.9%) | 188 (8.1%) |
| $30,000 to $34,999 | 158 (6.6%) | 156 (6.7%) |
| $35,000 to $39,999 | 127 (5.3%) | 120 (5.2%) |
| $40,000 to $44,999 | 129 (5.4%) | 236 (10.2%) |
| $45,000 to $49,999 | 67 (2.8%) | 95 (4.1%) |
| $50,000 to $54,999 | 140 (5.8%) | 118 (5.1%) |
| $55,000 to $64,999 | 183 (7.6%) | 160 (6.9%) |
| $65,000 to $74,999 | 159 (6.6%) | 49 (2.1%) |
| $75,000 to $99,999 | 224 (9.3%) | 80 (3.5%) |
| $100,000+ | 167 (6.9%) | 138 (6.0%) |
| Total | 2,406 (100.0%) | 2,315 (100.0%) |
Earnings by Sex by Educational Attainment in Shelton
Average earnings in Shelton are $41,493 for men and $33,796 for women, a difference of 18.5%. Men with an educational attainment of bachelor's degree enjoy the highest average annual earnings of $69,018, while those with less than high school education earn the least with $22,005. Women with an educational attainment of bachelor's degree earn the most with the average annual earnings of $51,645, while those with high school diploma education have the smallest earnings of $25,724.
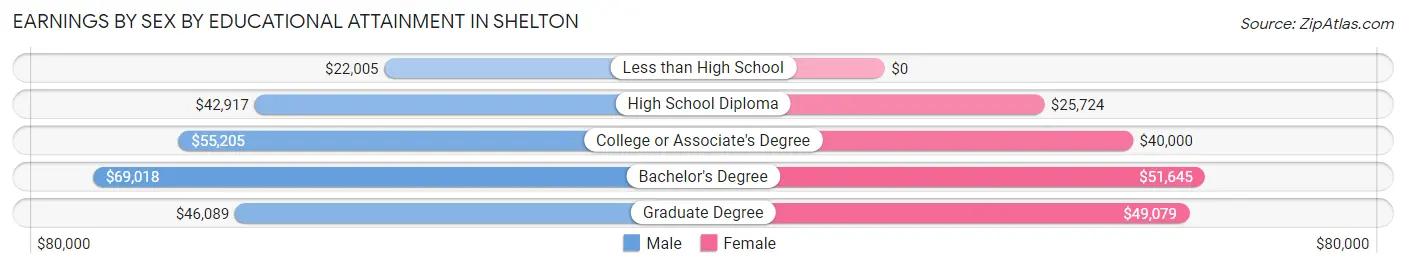
| Educational Attainment | Male Income | Female Income |
| Less than High School | $22,005 | $0 |
| High School Diploma | $42,917 | $25,724 |
| College or Associate's Degree | $55,205 | $40,000 |
| Bachelor's Degree | $69,018 | $51,645 |
| Graduate Degree | $46,089 | $49,079 |
| Total | $41,493 | $33,796 |
Family Income in Shelton
Family Income Brackets in Shelton
According to the Shelton family income data, there are 467 families falling into the $100,000 to $149,999 income range, which is the most common income bracket and makes up 21.8% of all families. Conversely, the $200,000+ income bracket is the least frequent group with only 51 families (2.4%) belonging to this category.
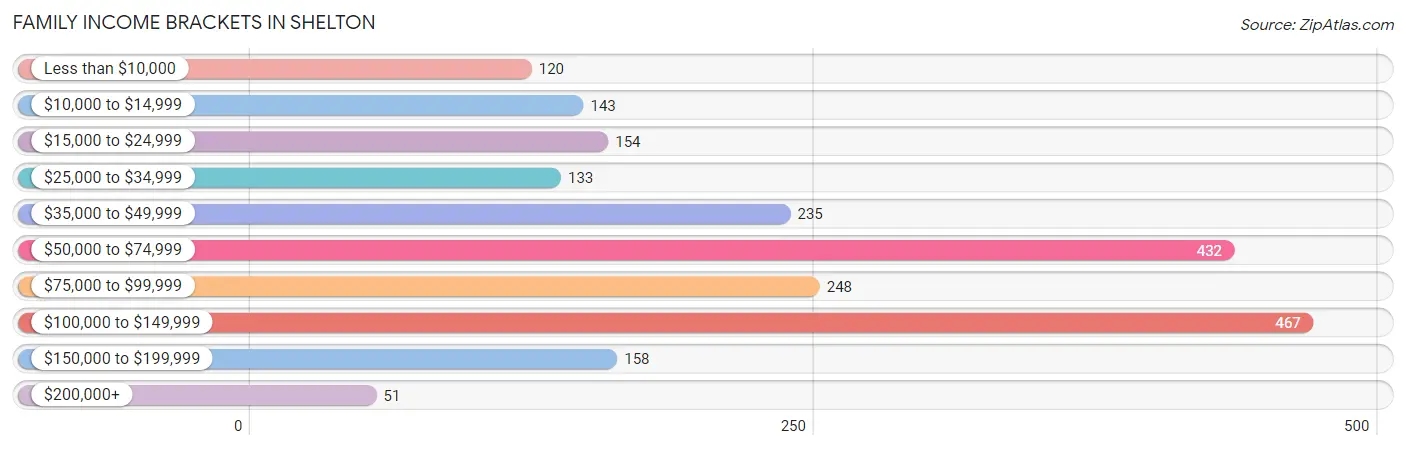
| Income Bracket | # Families | % Families |
| Less than $10,000 | 120 | 5.6% |
| $10,000 to $14,999 | 143 | 6.7% |
| $15,000 to $24,999 | 154 | 7.2% |
| $25,000 to $34,999 | 133 | 6.2% |
| $35,000 to $49,999 | 235 | 11.0% |
| $50,000 to $74,999 | 432 | 20.2% |
| $75,000 to $99,999 | 248 | 11.6% |
| $100,000 to $149,999 | 467 | 21.8% |
| $150,000 to $199,999 | 158 | 7.4% |
| $200,000+ | 51 | 2.4% |
Family Income by Famaliy Size in Shelton
6-person families (55 | 2.6%) account for the highest median family income in Shelton with $118,882 per family, while 2-person families (824 | 38.5%) have the highest median income of $30,208 per family member.
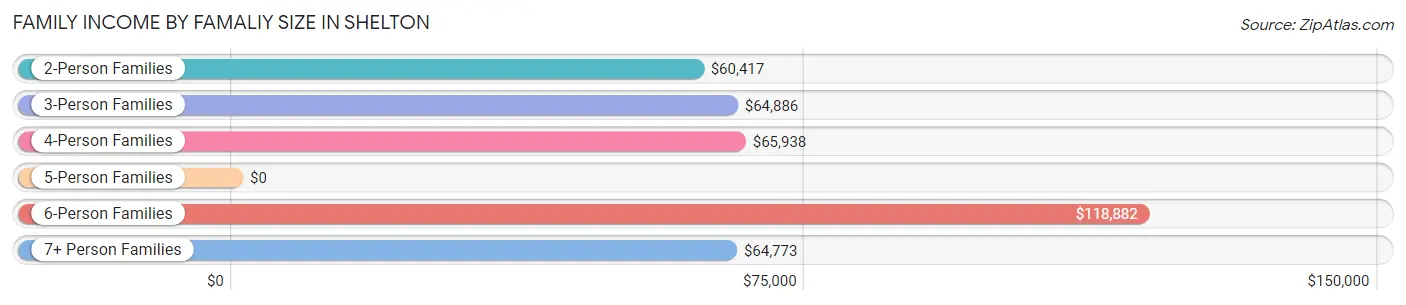
| Income Bracket | # Families | Median Income |
| 2-Person Families | 824 (38.5%) | $60,417 |
| 3-Person Families | 407 (19.0%) | $64,886 |
| 4-Person Families | 372 (17.4%) | $65,938 |
| 5-Person Families | 340 (15.9%) | $0 |
| 6-Person Families | 55 (2.6%) | $118,882 |
| 7+ Person Families | 142 (6.6%) | $64,773 |
| Total | 2,140 (100.0%) | $64,659 |
Family Income by Number of Earners in Shelton
The median family income in Shelton is $64,659, with families comprising 3+ earners (242) having the highest median family income of $121,806, while families with 1 earner (642) have the lowest median family income of $27,222, accounting for 11.3% and 30.0% of families, respectively.
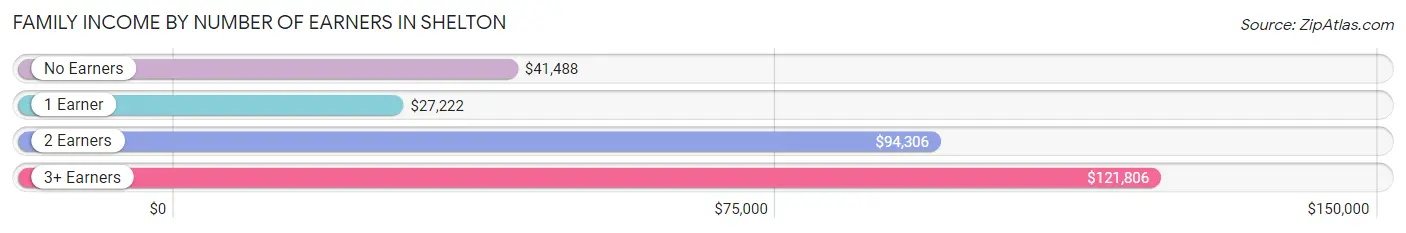
| Number of Earners | # Families | Median Income |
| No Earners | 281 (13.1%) | $41,488 |
| 1 Earner | 642 (30.0%) | $27,222 |
| 2 Earners | 975 (45.6%) | $94,306 |
| 3+ Earners | 242 (11.3%) | $121,806 |
| Total | 2,140 (100.0%) | $64,659 |
Household Income in Shelton
Household Income Brackets in Shelton
With 730 households falling in the category, the $100,000 to $149,999 income range is the most frequent in Shelton, accounting for 21.1% of all households. In contrast, only 55 households (1.6%) fall into the $200,000+ income bracket, making it the least populous group.
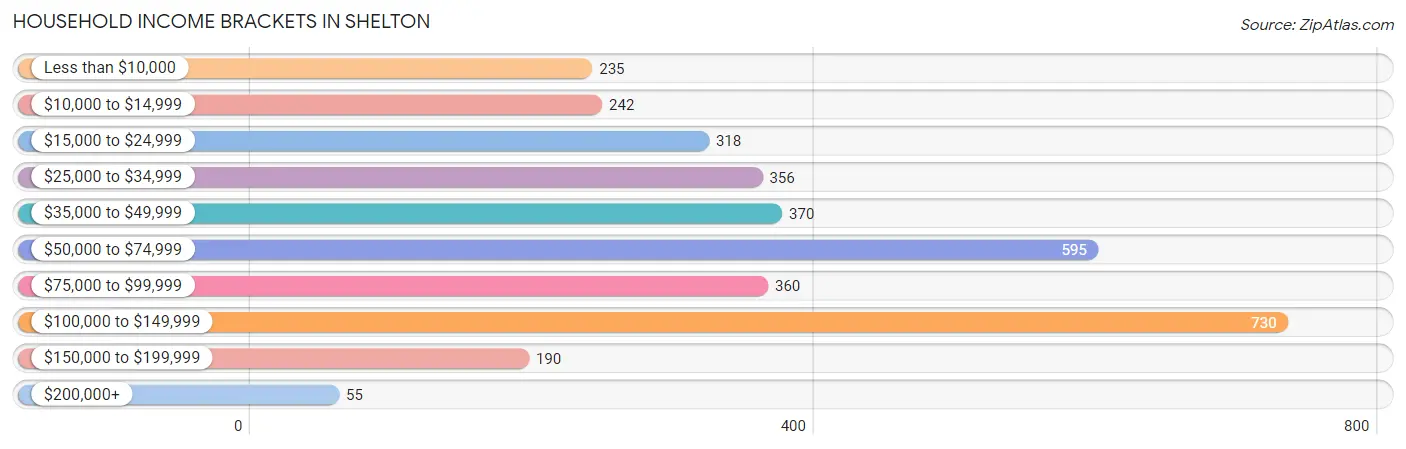
| Income Bracket | # Households | % Households |
| Less than $10,000 | 235 | 6.8% |
| $10,000 to $14,999 | 242 | 7.0% |
| $15,000 to $24,999 | 318 | 9.2% |
| $25,000 to $34,999 | 356 | 10.3% |
| $35,000 to $49,999 | 370 | 10.7% |
| $50,000 to $74,999 | 595 | 17.2% |
| $75,000 to $99,999 | 360 | 10.4% |
| $100,000 to $149,999 | 730 | 21.1% |
| $150,000 to $199,999 | 190 | 5.5% |
| $200,000+ | 55 | 1.6% |
Household Income by Householder Age in Shelton
The median household income in Shelton is $57,907, with the highest median household income of $64,048 found in the 25 to 44 years age bracket for the primary householder. A total of 1,212 households (35.0%) fall into this category. Meanwhile, the 15 to 24 years age bracket for the primary householder has the lowest median household income of $0, with 234 households (6.8%) in this group.
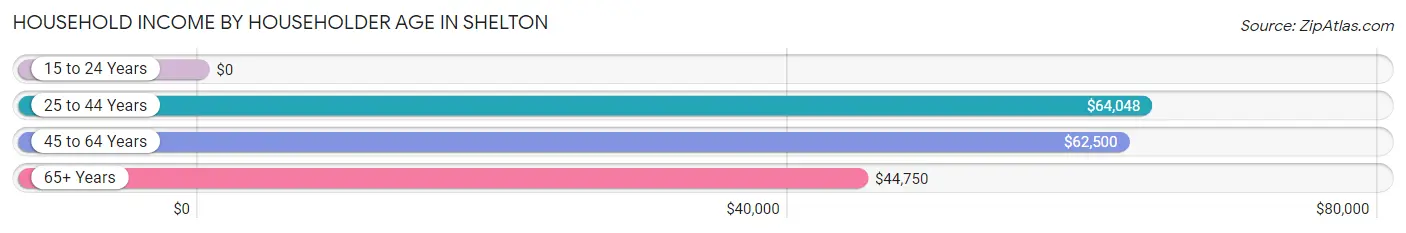
| Income Bracket | # Households | Median Income |
| 15 to 24 Years | 234 (6.8%) | $0 |
| 25 to 44 Years | 1,212 (35.0%) | $64,048 |
| 45 to 64 Years | 1,130 (32.7%) | $62,500 |
| 65+ Years | 885 (25.6%) | $44,750 |
| Total | 3,461 (100.0%) | $57,907 |
Poverty in Shelton
Income Below Poverty by Sex and Age in Shelton
With 25.0% poverty level for males and 27.9% for females among the residents of Shelton, 6 to 11 year old males and 5 year old females are the most vulnerable to poverty, with 238 males (43.5%) and 41 females (58.6%) in their respective age groups living below the poverty level.
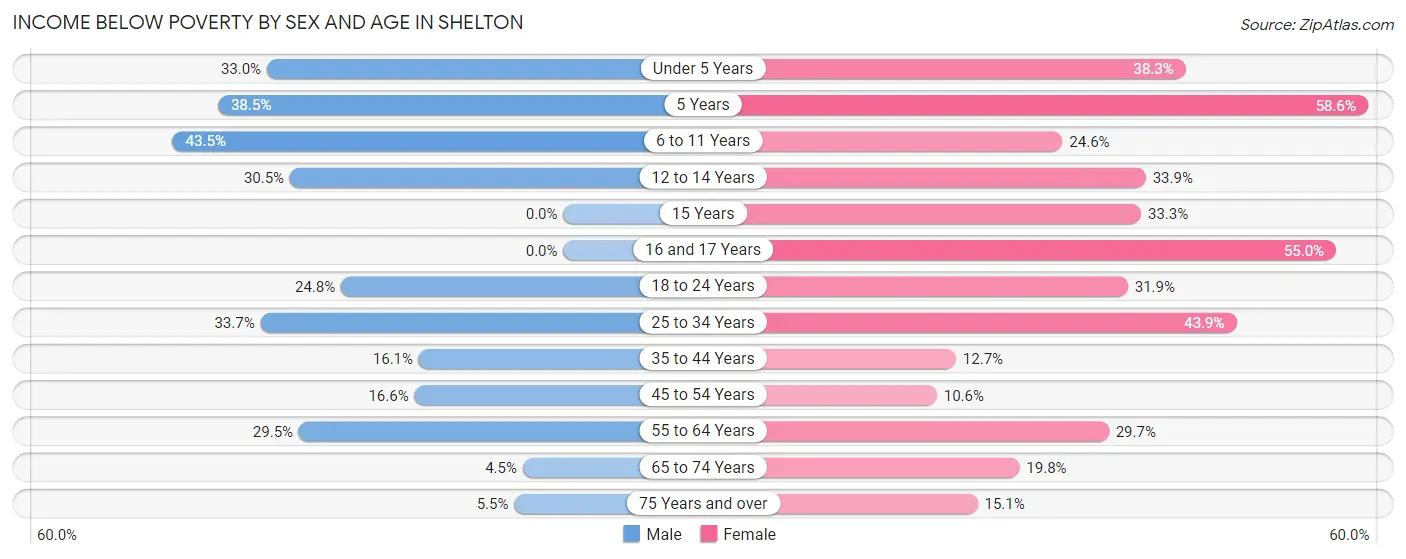
| Age Bracket | Male | Female |
| Under 5 Years | 171 (33.0%) | 152 (38.3%) |
| 5 Years | 25 (38.5%) | 41 (58.6%) |
| 6 to 11 Years | 238 (43.5%) | 156 (24.6%) |
| 12 to 14 Years | 67 (30.4%) | 65 (33.9%) |
| 15 Years | 0 (0.0%) | 7 (33.3%) |
| 16 and 17 Years | 0 (0.0%) | 82 (55.0%) |
| 18 to 24 Years | 152 (24.8%) | 165 (31.9%) |
| 25 to 34 Years | 224 (33.7%) | 366 (43.9%) |
| 35 to 44 Years | 102 (16.1%) | 82 (12.7%) |
| 45 to 54 Years | 101 (16.6%) | 40 (10.6%) |
| 55 to 64 Years | 129 (29.4%) | 165 (29.7%) |
| 65 to 74 Years | 10 (4.5%) | 91 (19.8%) |
| 75 Years and over | 10 (5.5%) | 67 (15.1%) |
| Total | 1,229 (25.0%) | 1,479 (27.9%) |
Income Above Poverty by Sex and Age in Shelton
According to the poverty statistics in Shelton, males aged 16 and 17 years and females aged 45 to 54 years are the age groups that are most secure financially, with 100.0% of males and 89.4% of females in these age groups living above the poverty line.
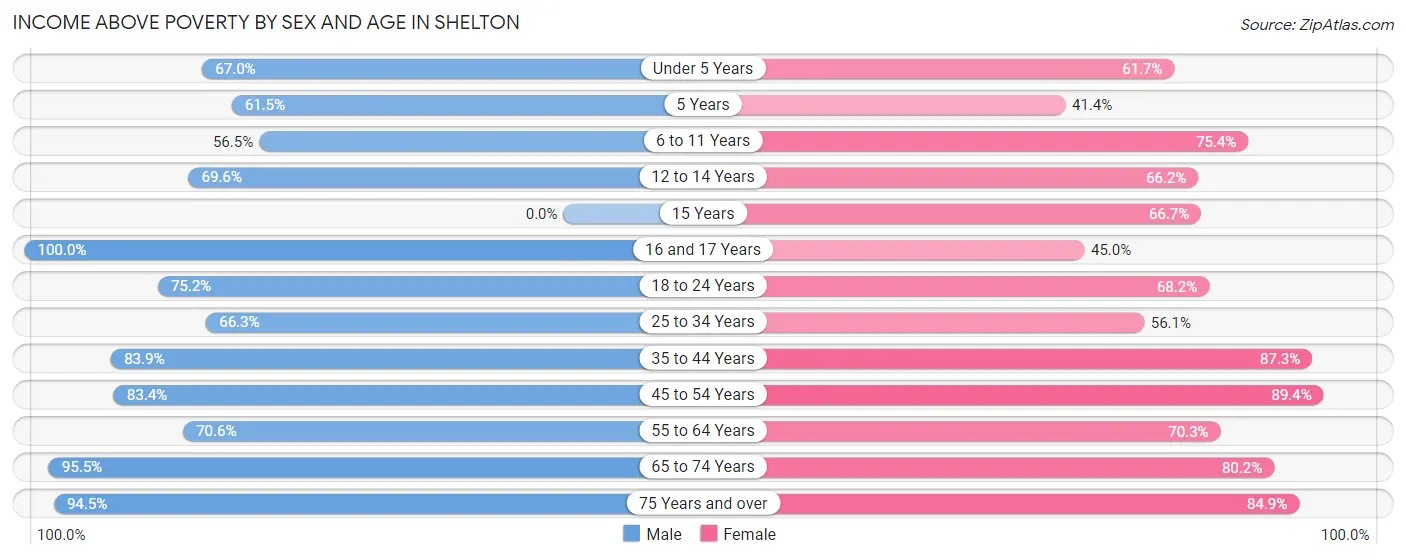
| Age Bracket | Male | Female |
| Under 5 Years | 347 (67.0%) | 245 (61.7%) |
| 5 Years | 40 (61.5%) | 29 (41.4%) |
| 6 to 11 Years | 309 (56.5%) | 479 (75.4%) |
| 12 to 14 Years | 153 (69.6%) | 127 (66.1%) |
| 15 Years | 0 (0.0%) | 14 (66.7%) |
| 16 and 17 Years | 203 (100.0%) | 67 (45.0%) |
| 18 to 24 Years | 462 (75.2%) | 353 (68.1%) |
| 25 to 34 Years | 440 (66.3%) | 467 (56.1%) |
| 35 to 44 Years | 532 (83.9%) | 563 (87.3%) |
| 45 to 54 Years | 508 (83.4%) | 338 (89.4%) |
| 55 to 64 Years | 309 (70.6%) | 390 (70.3%) |
| 65 to 74 Years | 211 (95.5%) | 369 (80.2%) |
| 75 Years and over | 173 (94.5%) | 376 (84.9%) |
| Total | 3,687 (75.0%) | 3,817 (72.1%) |
Income Below Poverty Among Married-Couple Families in Shelton
The poverty statistics for married-couple families in Shelton show that 13.2% or 167 of the total 1,263 families live below the poverty line. Families with 1 or 2 children have the highest poverty rate of 21.0%, comprising of 93 families. On the other hand, families with 5 or more children have the lowest poverty rate of 0.0%, which includes 0 families.
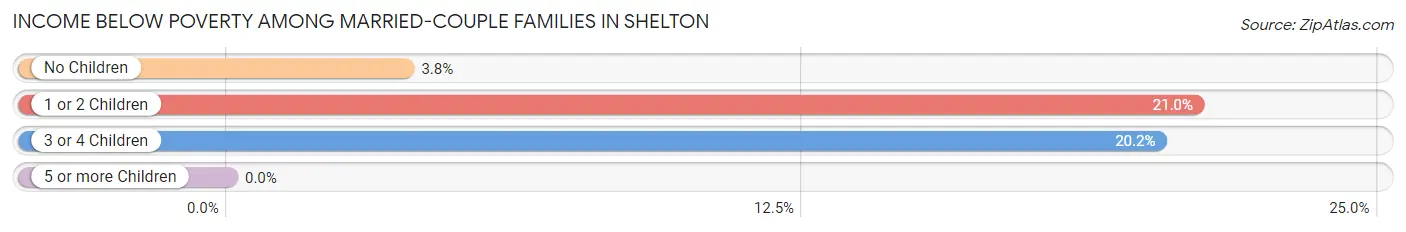
| Children | Above Poverty | Below Poverty |
| No Children | 501 (96.2%) | 20 (3.8%) |
| 1 or 2 Children | 349 (79.0%) | 93 (21.0%) |
| 3 or 4 Children | 213 (79.8%) | 54 (20.2%) |
| 5 or more Children | 33 (100.0%) | 0 (0.0%) |
| Total | 1,096 (86.8%) | 167 (13.2%) |
Income Below Poverty Among Single-Parent Households in Shelton
According to the poverty data in Shelton, 18.6% or 40 single-father households and 36.2% or 240 single-mother households are living below the poverty line. Among single-father households, those with 1 or 2 children have the highest poverty rate, with 40 households (37.0%) experiencing poverty. Likewise, among single-mother households, those with 5 or more children have the highest poverty rate, with 41 households (100.0%) falling below the poverty line.
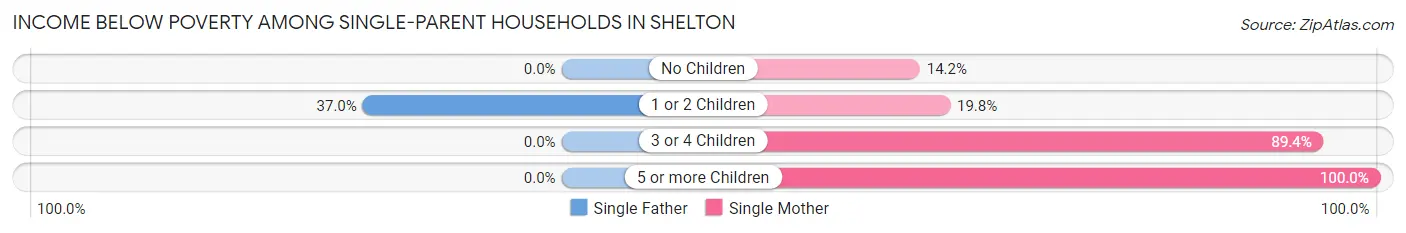
| Children | Single Father | Single Mother |
| No Children | 0 (0.0%) | 40 (14.2%) |
| 1 or 2 Children | 40 (37.0%) | 41 (19.8%) |
| 3 or 4 Children | 0 (0.0%) | 118 (89.4%) |
| 5 or more Children | 0 (0.0%) | 41 (100.0%) |
| Total | 40 (18.6%) | 240 (36.2%) |
Income Below Poverty Among Married-Couple vs Single-Parent Households in Shelton
The poverty data for Shelton shows that 167 of the married-couple family households (13.2%) and 280 of the single-parent households (31.9%) are living below the poverty level. Within the married-couple family households, those with 1 or 2 children have the highest poverty rate, with 93 households (21.0%) falling below the poverty line. Among the single-parent households, those with 5 or more children have the highest poverty rate, with 41 household (100.0%) living below poverty.
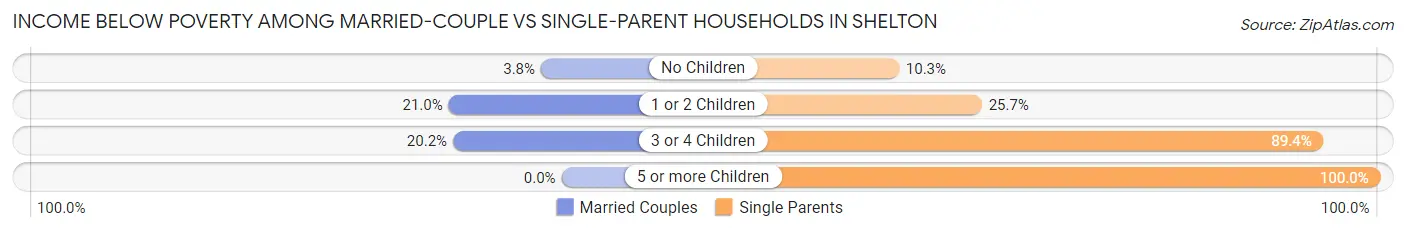
| Children | Married-Couple Families | Single-Parent Households |
| No Children | 20 (3.8%) | 40 (10.3%) |
| 1 or 2 Children | 93 (21.0%) | 81 (25.7%) |
| 3 or 4 Children | 54 (20.2%) | 118 (89.4%) |
| 5 or more Children | 0 (0.0%) | 41 (100.0%) |
| Total | 167 (13.2%) | 280 (31.9%) |
Race in Shelton
The most populous races in Shelton are White / Caucasian (7,225 | 68.9%), Hispanic or Latino (2,681 | 25.6%), and Some other Race (1,626 | 15.5%).
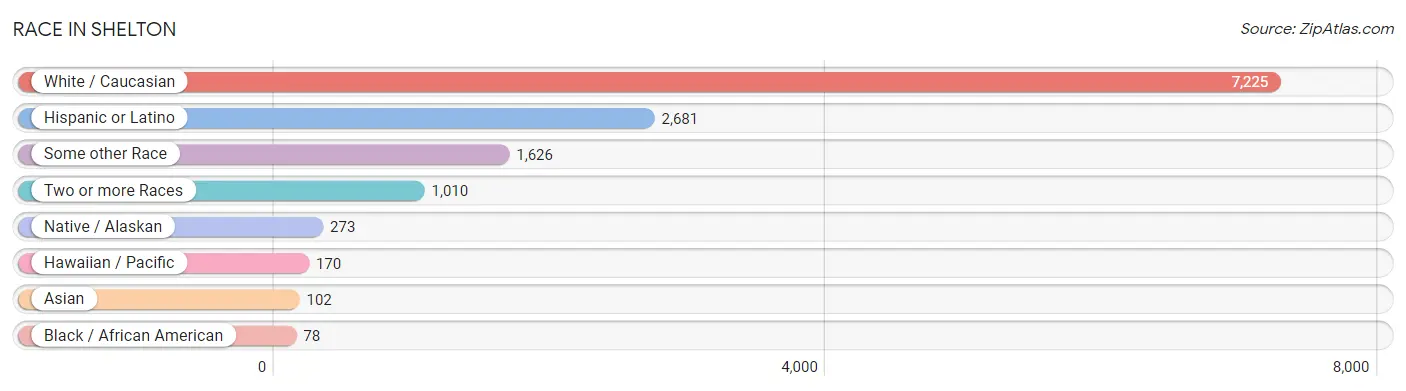
| Race | # Population | % Population |
| Asian | 102 | 1.0% |
| Black / African American | 78 | 0.7% |
| Hawaiian / Pacific | 170 | 1.6% |
| Hispanic or Latino | 2,681 | 25.6% |
| Native / Alaskan | 273 | 2.6% |
| White / Caucasian | 7,225 | 68.9% |
| Two or more Races | 1,010 | 9.6% |
| Some other Race | 1,626 | 15.5% |
| Total | 10,484 | 100.0% |
Ancestry in Shelton
The most populous ancestries reported in Shelton are Central American (1,683 | 16.1%), Guatemalan (1,614 | 15.4%), German (1,162 | 11.1%), English (1,029 | 9.8%), and Irish (889 | 8.5%), together accounting for 60.8% of all Shelton residents.
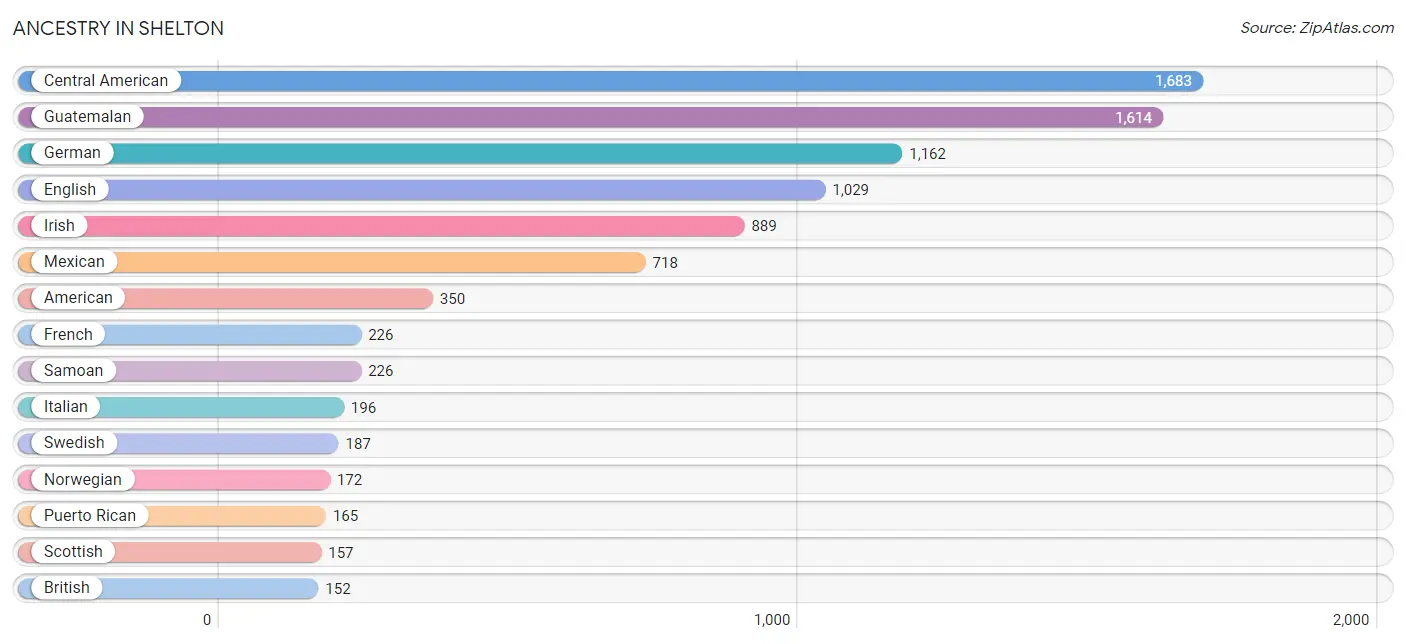
| Ancestry | # Population | % Population |
| Aleut | 56 | 0.5% |
| American | 350 | 3.3% |
| Apache | 15 | 0.1% |
| Bhutanese | 19 | 0.2% |
| Blackfeet | 136 | 1.3% |
| British | 152 | 1.5% |
| Burmese | 32 | 0.3% |
| Cambodian | 11 | 0.1% |
| Canadian | 4 | 0.0% |
| Central American | 1,683 | 16.1% |
| Cherokee | 8 | 0.1% |
| Chippewa | 26 | 0.3% |
| Choctaw | 13 | 0.1% |
| Colombian | 79 | 0.7% |
| Croatian | 26 | 0.3% |
| Czech | 56 | 0.5% |
| Danish | 90 | 0.9% |
| Dominican | 36 | 0.3% |
| Dutch | 134 | 1.3% |
| English | 1,029 | 9.8% |
| European | 129 | 1.2% |
| Finnish | 17 | 0.2% |
| French | 226 | 2.2% |
| French American Indian | 4 | 0.0% |
| French Canadian | 69 | 0.7% |
| German | 1,162 | 11.1% |
| Greek | 34 | 0.3% |
| Guatemalan | 1,614 | 15.4% |
| Indian (Asian) | 26 | 0.3% |
| Irish | 889 | 8.5% |
| Iroquois | 3 | 0.0% |
| Italian | 196 | 1.9% |
| Japanese | 6 | 0.1% |
| Korean | 63 | 0.6% |
| Mexican | 718 | 6.9% |
| Native Hawaiian | 25 | 0.2% |
| Norwegian | 172 | 1.6% |
| Panamanian | 69 | 0.7% |
| Pennsylvania German | 10 | 0.1% |
| Polish | 128 | 1.2% |
| Portuguese | 50 | 0.5% |
| Puerto Rican | 165 | 1.6% |
| Puget Sound Salish | 30 | 0.3% |
| Russian | 14 | 0.1% |
| Samoan | 226 | 2.2% |
| Scandinavian | 125 | 1.2% |
| Scotch-Irish | 150 | 1.4% |
| Scottish | 157 | 1.5% |
| Sioux | 5 | 0.1% |
| South American | 79 | 0.7% |
| Sri Lankan | 37 | 0.4% |
| Swedish | 187 | 1.8% |
| Swiss | 31 | 0.3% |
| Ukrainian | 8 | 0.1% |
| Welsh | 86 | 0.8% | View All 55 Rows |
Immigrants in Shelton
The most numerous immigrant groups reported in Shelton came from Latin America (1,502 | 14.3%), Central America (1,431 | 13.7%), Guatemala (988 | 9.4%), Mexico (433 | 4.1%), and Asia (91 | 0.9%), together accounting for 42.4% of all Shelton residents.
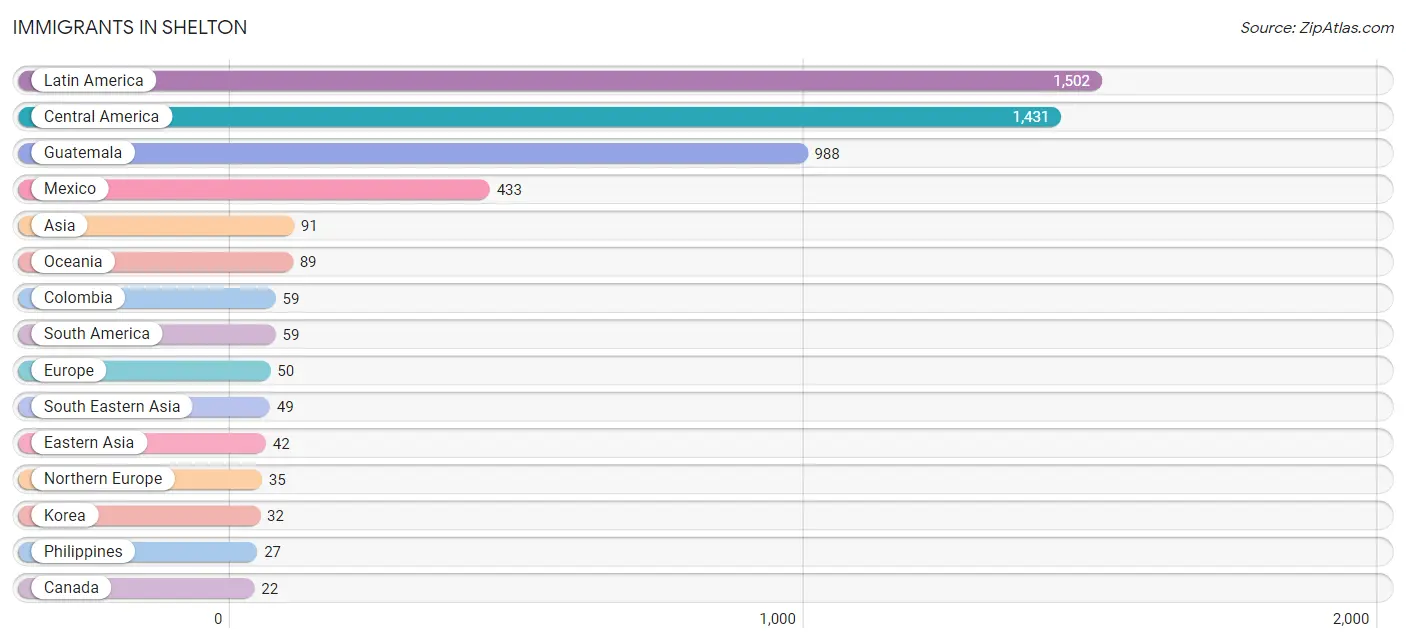
| Immigration Origin | # Population | % Population |
| Asia | 91 | 0.9% |
| Canada | 22 | 0.2% |
| Caribbean | 12 | 0.1% |
| Central America | 1,431 | 13.7% |
| Colombia | 59 | 0.6% |
| Dominican Republic | 12 | 0.1% |
| Eastern Asia | 42 | 0.4% |
| England | 20 | 0.2% |
| Europe | 50 | 0.5% |
| Germany | 15 | 0.1% |
| Guatemala | 988 | 9.4% |
| Japan | 10 | 0.1% |
| Korea | 32 | 0.3% |
| Latin America | 1,502 | 14.3% |
| Mexico | 433 | 4.1% |
| Northern Europe | 35 | 0.3% |
| Oceania | 89 | 0.9% |
| Panama | 10 | 0.1% |
| Philippines | 27 | 0.3% |
| South America | 59 | 0.6% |
| South Eastern Asia | 49 | 0.5% |
| Vietnam | 22 | 0.2% |
| Western Europe | 15 | 0.1% | View All 23 Rows |
Sex and Age in Shelton
Sex and Age in Shelton
The most populous age groups in Shelton are Under 5 Years (518 | 10.3%) for men and 5 to 9 Years (506 | 9.3%) for women.
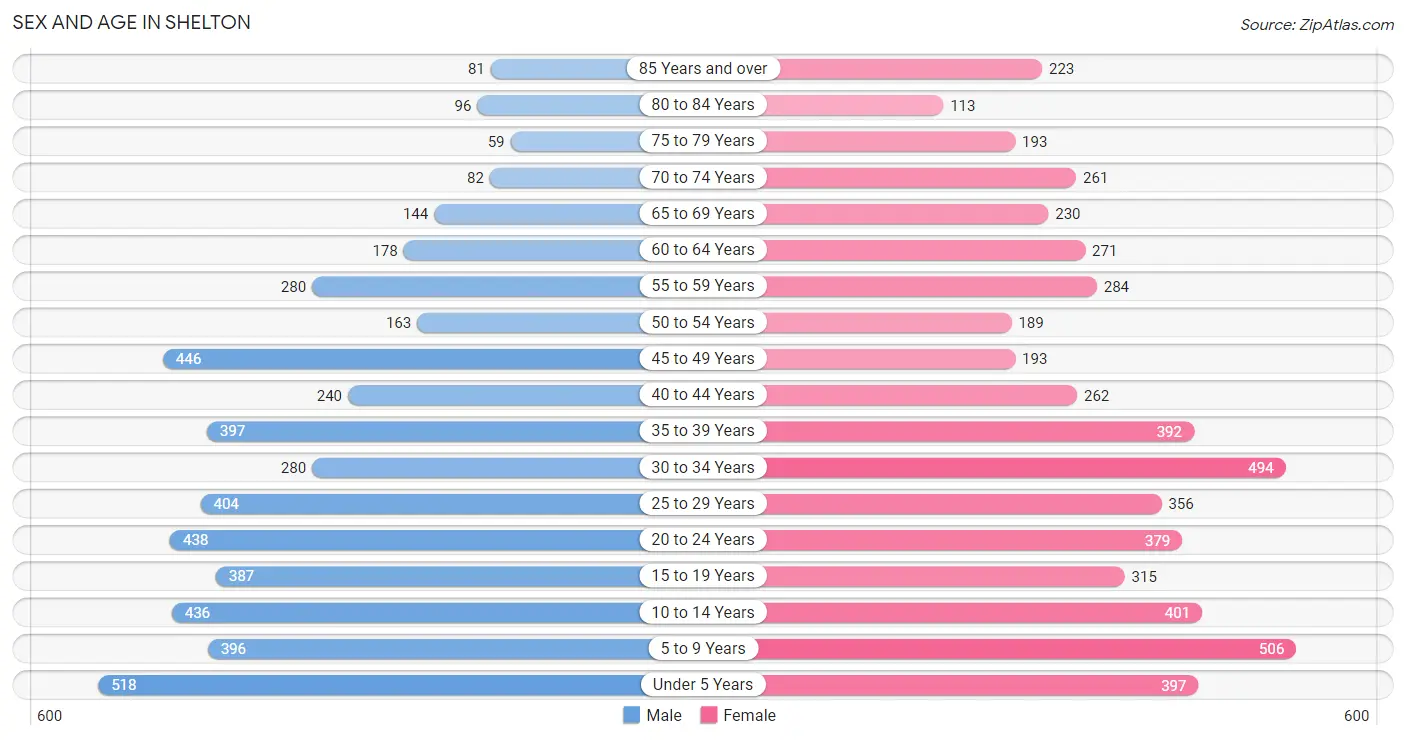
| Age Bracket | Male | Female |
| Under 5 Years | 518 (10.3%) | 397 (7.3%) |
| 5 to 9 Years | 396 (7.9%) | 506 (9.3%) |
| 10 to 14 Years | 436 (8.7%) | 401 (7.3%) |
| 15 to 19 Years | 387 (7.7%) | 315 (5.8%) |
| 20 to 24 Years | 438 (8.7%) | 379 (6.9%) |
| 25 to 29 Years | 404 (8.0%) | 356 (6.5%) |
| 30 to 34 Years | 280 (5.6%) | 494 (9.0%) |
| 35 to 39 Years | 397 (7.9%) | 392 (7.2%) |
| 40 to 44 Years | 240 (4.8%) | 262 (4.8%) |
| 45 to 49 Years | 446 (8.9%) | 193 (3.5%) |
| 50 to 54 Years | 163 (3.2%) | 189 (3.5%) |
| 55 to 59 Years | 280 (5.6%) | 284 (5.2%) |
| 60 to 64 Years | 178 (3.5%) | 271 (5.0%) |
| 65 to 69 Years | 144 (2.9%) | 230 (4.2%) |
| 70 to 74 Years | 82 (1.6%) | 261 (4.8%) |
| 75 to 79 Years | 59 (1.2%) | 193 (3.5%) |
| 80 to 84 Years | 96 (1.9%) | 113 (2.1%) |
| 85 Years and over | 81 (1.6%) | 223 (4.1%) |
| Total | 5,025 (100.0%) | 5,459 (100.0%) |
Families and Households in Shelton
Median Family Size in Shelton
The median family size in Shelton is 3.60 persons per family, with married-couple families (1,263 | 59.0%) accounting for the largest median family size of 3.84 persons per family. On the other hand, single male/father families (215 | 10.1%) represent the smallest median family size with 2.90 persons per family.
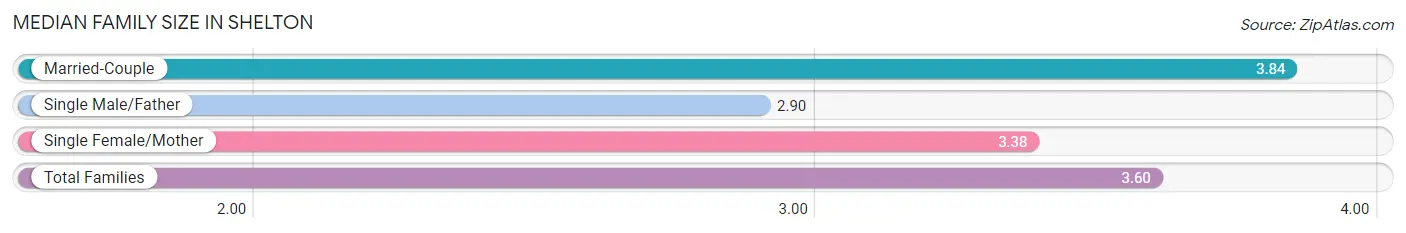
| Family Type | # Families | Family Size |
| Married-Couple | 1,263 (59.0%) | 3.84 |
| Single Male/Father | 215 (10.1%) | 2.90 |
| Single Female/Mother | 662 (30.9%) | 3.38 |
| Total Families | 2,140 (100.0%) | 3.60 |
Median Household Size in Shelton
The median household size in Shelton is 2.91 persons per household, with married-couple households (1,263 | 36.5%) accounting for the largest median household size of 3.98 persons per household. non-family households (1,321 | 38.2%) represent the smallest median household size with 1.38 persons per household.
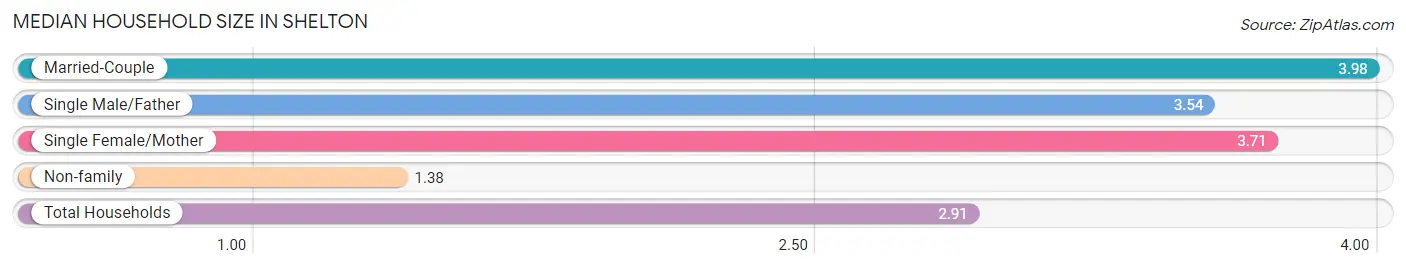
| Household Type | # Households | Household Size |
| Married-Couple | 1,263 (36.5%) | 3.98 |
| Single Male/Father | 215 (6.2%) | 3.54 |
| Single Female/Mother | 662 (19.1%) | 3.71 |
| Non-family | 1,321 (38.2%) | 1.38 |
| Total Households | 3,461 (100.0%) | 2.91 |
Household Size by Marriage Status in Shelton
Out of a total of 3,461 households in Shelton, 2,140 (61.8%) are family households, while 1,321 (38.2%) are nonfamily households. The most numerous type of family households are 2-person households, comprising 680, and the most common type of nonfamily households are 1-person households, comprising 965.

| Household Size | Family Households | Nonfamily Households |
| 1-Person Households | - | 965 (27.9%) |
| 2-Person Households | 680 (19.7%) | 290 (8.4%) |
| 3-Person Households | 438 (12.7%) | 41 (1.2%) |
| 4-Person Households | 388 (11.2%) | 0 (0.0%) |
| 5-Person Households | 386 (11.2%) | 7 (0.2%) |
| 6-Person Households | 101 (2.9%) | 18 (0.5%) |
| 7+ Person Households | 147 (4.3%) | 0 (0.0%) |
| Total | 2,140 (61.8%) | 1,321 (38.2%) |
Female Fertility in Shelton
Fertility by Age in Shelton
Average fertility rate in Shelton is 88.0 births per 1,000 women. Women in the age bracket of 20 to 34 years have the highest fertility rate with 170.0 births per 1,000 women. Women in the age bracket of 20 to 34 years acount for 98.1% of all women with births.
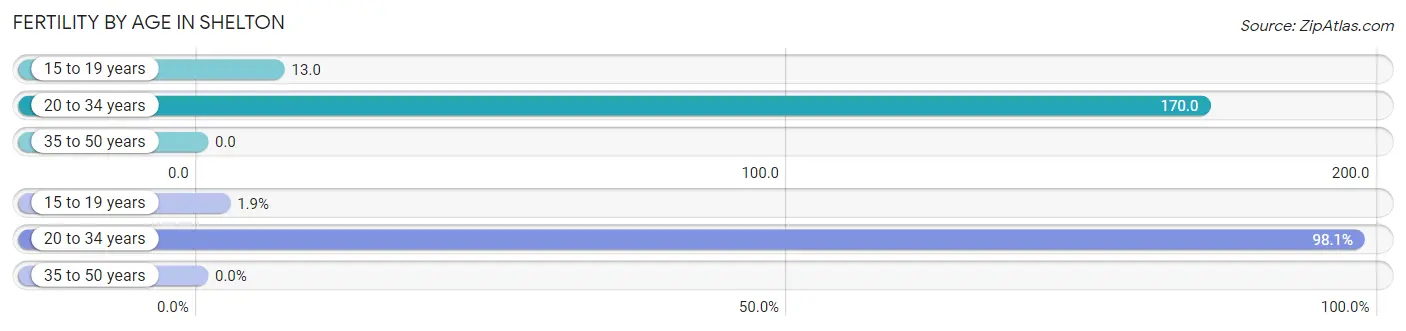
| Age Bracket | Women with Births | Births / 1,000 Women |
| 15 to 19 years | 4 (1.9%) | 13.0 |
| 20 to 34 years | 209 (98.1%) | 170.0 |
| 35 to 50 years | 0 (0.0%) | 0.0 |
| Total | 213 (100.0%) | 88.0 |
Fertility by Age by Marriage Status in Shelton
52.6% of women with births (213) in Shelton are married. The highest percentage of unmarried women with births falls into 15 to 19 years age bracket with 100.0% of them unmarried at the time of birth, while the lowest percentage of unmarried women with births belong to 20 to 34 years age bracket with 46.4% of them unmarried.
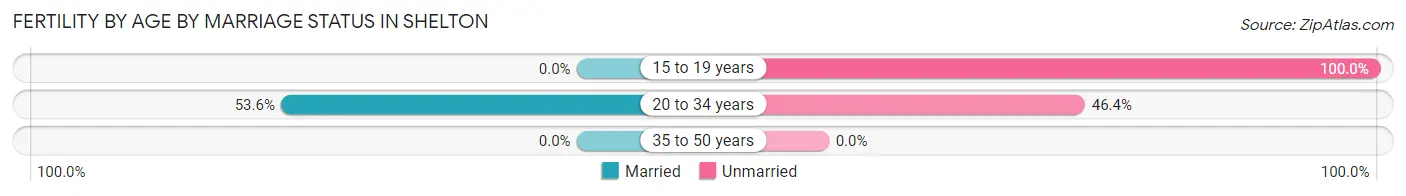
| Age Bracket | Married | Unmarried |
| 15 to 19 years | 0 (0.0%) | 4 (100.0%) |
| 20 to 34 years | 112 (53.6%) | 97 (46.4%) |
| 35 to 50 years | 0 (0.0%) | 0 (0.0%) |
| Total | 112 (52.6%) | 101 (47.4%) |
Fertility by Education in Shelton
Average fertility rate in Shelton is 88.0 births per 1,000 women. Women with the education attainment of graduate degree have the highest fertility rate of 192.0 births per 1,000 women, while women with the education attainment of high school diploma have the lowest fertility at 38.0 births per 1,000 women. Women with the education attainment of college or associate's degree represent 47.4% of all women with births.
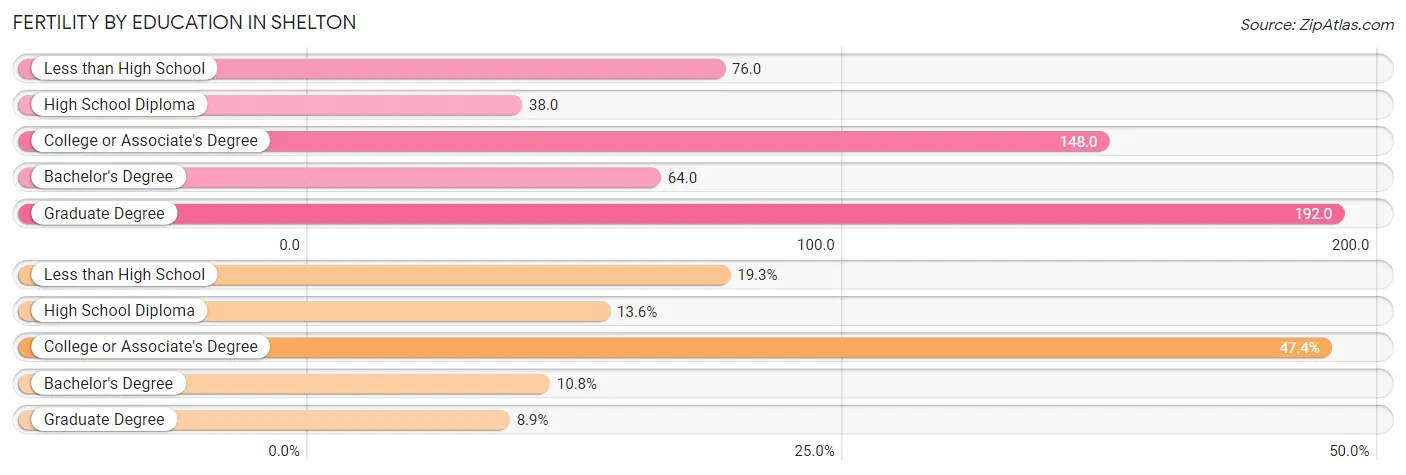
| Educational Attainment | Women with Births | Births / 1,000 Women |
| Less than High School | 41 (19.3%) | 76.0 |
| High School Diploma | 29 (13.6%) | 38.0 |
| College or Associate's Degree | 101 (47.4%) | 148.0 |
| Bachelor's Degree | 23 (10.8%) | 64.0 |
| Graduate Degree | 19 (8.9%) | 192.0 |
| Total | 213 (100.0%) | 88.0 |
Fertility by Education by Marriage Status in Shelton
47.4% of women with births in Shelton are unmarried. Women with the educational attainment of bachelor's degree are most likely to be married with 100.0% of them married at childbirth, while women with the educational attainment of graduate degree are least likely to be married with 100.0% of them unmarried at childbirth.
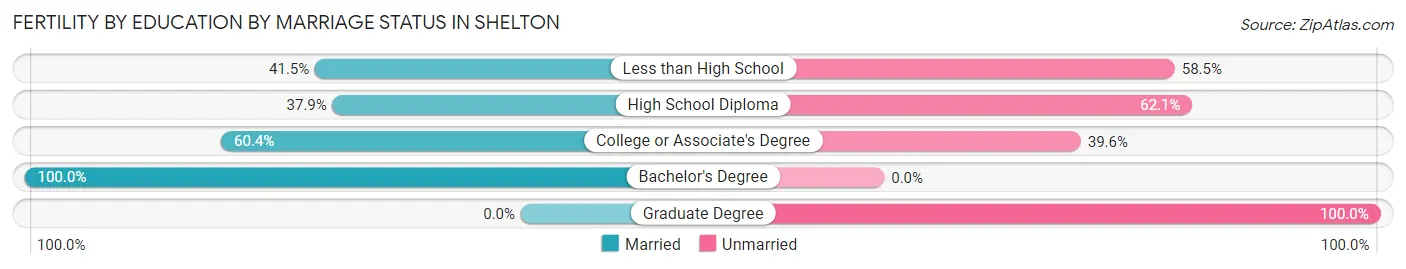
| Educational Attainment | Married | Unmarried |
| Less than High School | 17 (41.5%) | 24 (58.5%) |
| High School Diploma | 11 (37.9%) | 18 (62.1%) |
| College or Associate's Degree | 61 (60.4%) | 40 (39.6%) |
| Bachelor's Degree | 23 (100.0%) | 0 (0.0%) |
| Graduate Degree | 0 (0.0%) | 19 (100.0%) |
| Total | 112 (52.6%) | 101 (47.4%) |
Employment Characteristics in Shelton
Employment by Class of Employer in Shelton
Among the 4,121 employed individuals in Shelton, private company employees (2,283 | 55.4%), state government employees (478 | 11.6%), and local government employees (447 | 10.8%) make up the most common classes of employment.
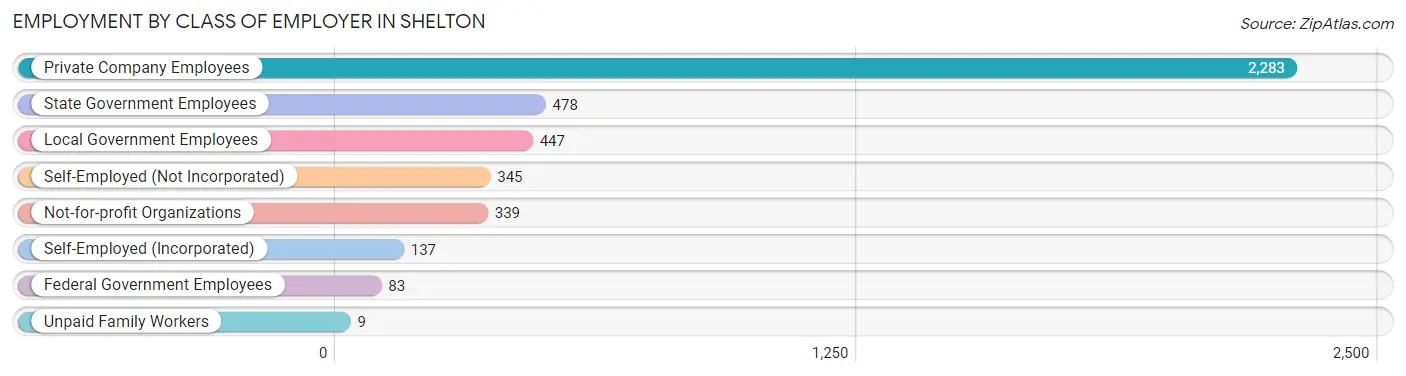
| Employer Class | # Employees | % Employees |
| Private Company Employees | 2,283 | 55.4% |
| Self-Employed (Incorporated) | 137 | 3.3% |
| Self-Employed (Not Incorporated) | 345 | 8.4% |
| Not-for-profit Organizations | 339 | 8.2% |
| Local Government Employees | 447 | 10.8% |
| State Government Employees | 478 | 11.6% |
| Federal Government Employees | 83 | 2.0% |
| Unpaid Family Workers | 9 | 0.2% |
| Total | 4,121 | 100.0% |
Employment Status by Age in Shelton
According to the labor force statistics for Shelton, out of the total population over 16 years of age (7,807), 57.5% or 4,489 individuals are in the labor force, with 5.2% or 233 of them unemployed. The age group with the highest labor force participation rate is 45 to 54 years, with 80.9% or 802 individuals in the labor force. Within the labor force, the 16 to 19 years age range has the highest percentage of unemployed individuals, with 13.8% or 39 of them being unemployed.
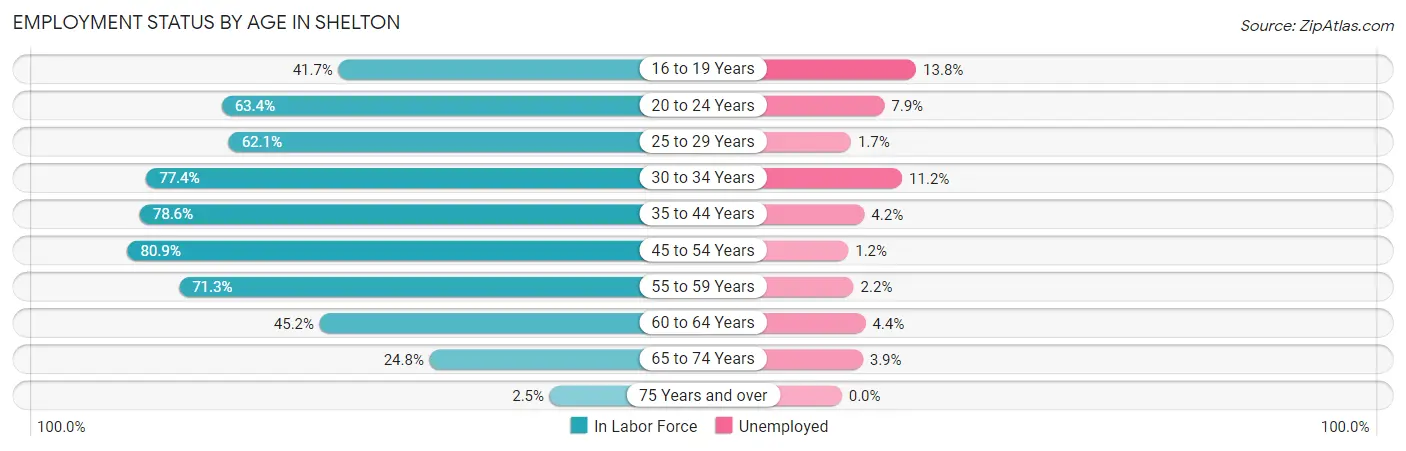
| Age Bracket | In Labor Force | Unemployed |
| 16 to 19 Years | 283 (41.7%) | 39 (13.8%) |
| 20 to 24 Years | 518 (63.4%) | 41 (7.9%) |
| 25 to 29 Years | 472 (62.1%) | 8 (1.7%) |
| 30 to 34 Years | 599 (77.4%) | 67 (11.2%) |
| 35 to 44 Years | 1,015 (78.6%) | 43 (4.2%) |
| 45 to 54 Years | 802 (80.9%) | 10 (1.2%) |
| 55 to 59 Years | 402 (71.3%) | 9 (2.2%) |
| 60 to 64 Years | 203 (45.2%) | 9 (4.4%) |
| 65 to 74 Years | 178 (24.8%) | 7 (3.9%) |
| 75 Years and over | 19 (2.5%) | 0 (0.0%) |
| Total | 4,489 (57.5%) | 233 (5.2%) |
Employment Status by Educational Attainment in Shelton
According to labor force statistics for Shelton, 72.3% of individuals (3,491) out of the total population between 25 and 64 years of age (4,829) are in the labor force, with 4.2% or 147 of them being unemployed. The group with the highest labor force participation rate are those with the educational attainment of bachelor's degree or higher, with 82.9% or 707 individuals in the labor force. Within the labor force, individuals with less than high school education have the highest percentage of unemployment, with 11.1% or 68 of them being unemployed.
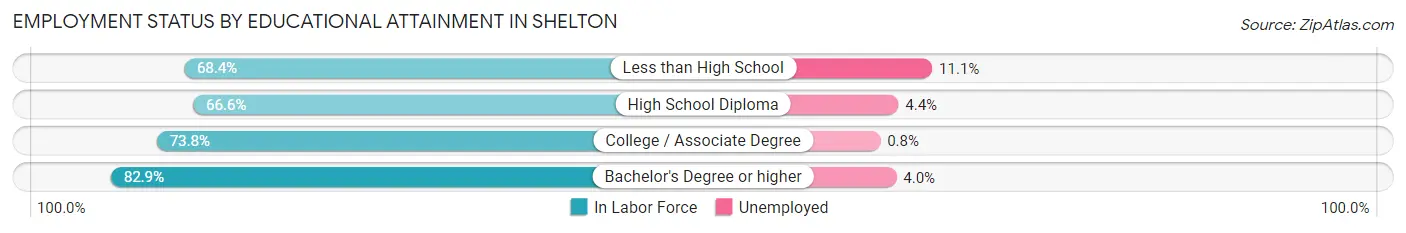
| Educational Attainment | In Labor Force | Unemployed |
| Less than High School | 614 (68.4%) | 100 (11.1%) |
| High School Diploma | 919 (66.6%) | 61 (4.4%) |
| College / Associate Degree | 1,253 (73.8%) | 14 (0.8%) |
| Bachelor's Degree or higher | 707 (82.9%) | 34 (4.0%) |
| Total | 3,491 (72.3%) | 203 (4.2%) |
Employment Occupations by Sex in Shelton
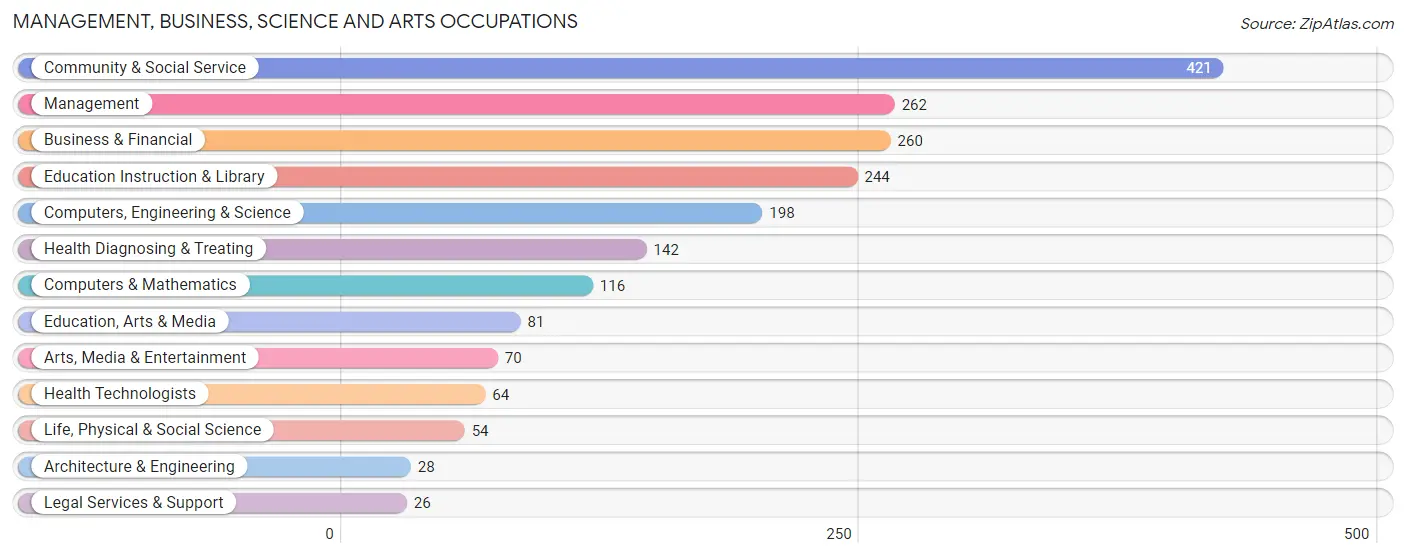
Management, Business, Science and Arts Occupations
The most common Management, Business, Science and Arts occupations in Shelton are Community & Social Service (421 | 9.9%), Management (262 | 6.2%), Business & Financial (260 | 6.1%), Education Instruction & Library (244 | 5.7%), and Computers, Engineering & Science (198 | 4.7%).
Management, Business, Science and Arts Occupations by Sex
Within the Management, Business, Science and Arts occupations in Shelton, the most male-oriented occupations are Architecture & Engineering (100.0%), Computers & Mathematics (87.1%), and Computers, Engineering & Science (68.7%), while the most female-oriented occupations are Legal Services & Support (100.0%), Education Instruction & Library (95.9%), and Life, Physical & Social Science (87.0%).
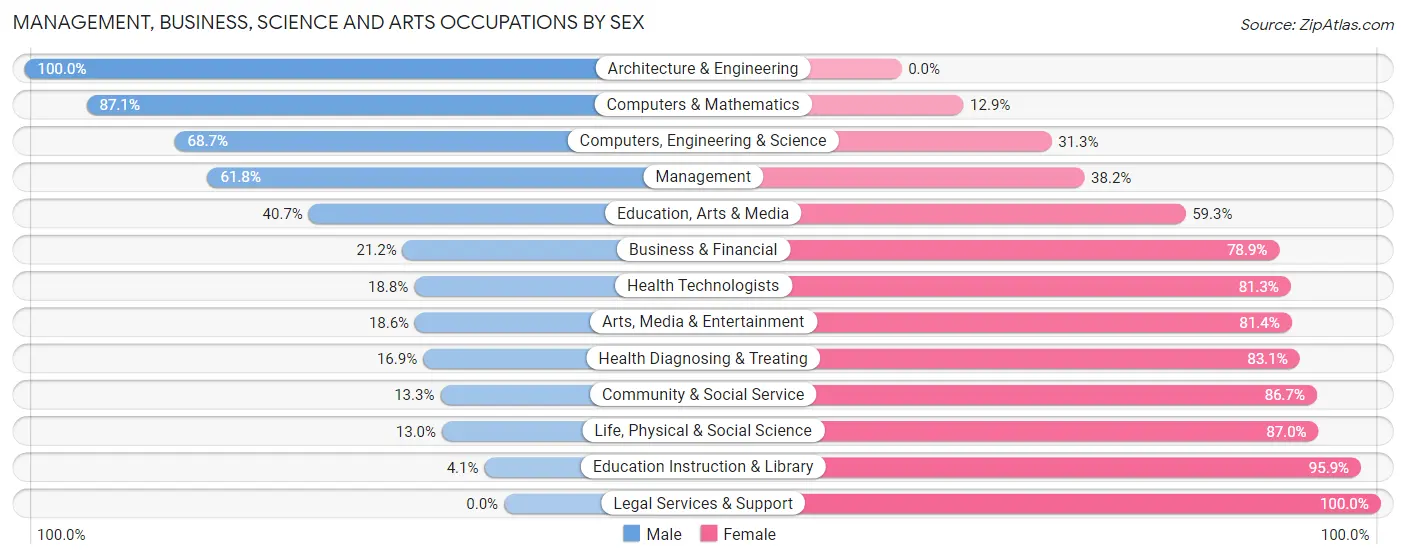
| Occupation | Male | Female |
| Management | 162 (61.8%) | 100 (38.2%) |
| Business & Financial | 55 (21.1%) | 205 (78.8%) |
| Computers, Engineering & Science | 136 (68.7%) | 62 (31.3%) |
| Computers & Mathematics | 101 (87.1%) | 15 (12.9%) |
| Architecture & Engineering | 28 (100.0%) | 0 (0.0%) |
| Life, Physical & Social Science | 7 (13.0%) | 47 (87.0%) |
| Community & Social Service | 56 (13.3%) | 365 (86.7%) |
| Education, Arts & Media | 33 (40.7%) | 48 (59.3%) |
| Legal Services & Support | 0 (0.0%) | 26 (100.0%) |
| Education Instruction & Library | 10 (4.1%) | 234 (95.9%) |
| Arts, Media & Entertainment | 13 (18.6%) | 57 (81.4%) |
| Health Diagnosing & Treating | 24 (16.9%) | 118 (83.1%) |
| Health Technologists | 12 (18.8%) | 52 (81.2%) |
| Total (Category) | 433 (33.8%) | 850 (66.2%) |
| Total (Overall) | 2,202 (51.8%) | 2,050 (48.2%) |
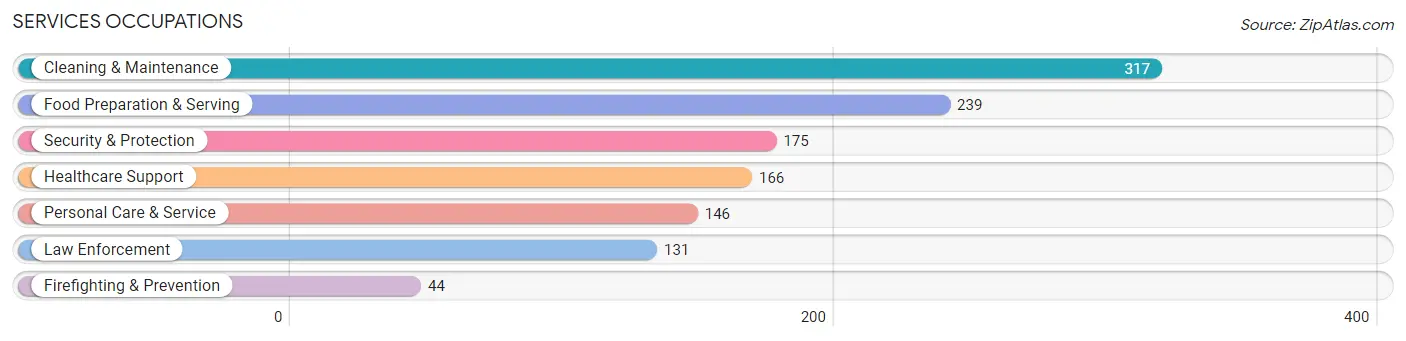
Services Occupations
The most common Services occupations in Shelton are Cleaning & Maintenance (317 | 7.5%), Food Preparation & Serving (239 | 5.6%), Security & Protection (175 | 4.1%), Healthcare Support (166 | 3.9%), and Personal Care & Service (146 | 3.4%).
Services Occupations by Sex
Within the Services occupations in Shelton, the most male-oriented occupations are Cleaning & Maintenance (67.2%), Food Preparation & Serving (42.7%), and Firefighting & Prevention (36.4%), while the most female-oriented occupations are Healthcare Support (84.9%), Personal Care & Service (77.4%), and Law Enforcement (73.3%).
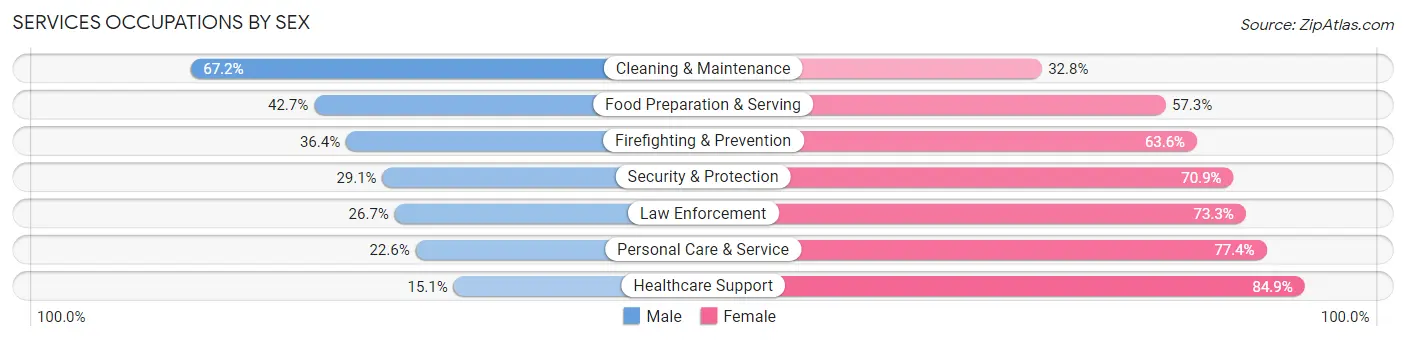
| Occupation | Male | Female |
| Healthcare Support | 25 (15.1%) | 141 (84.9%) |
| Security & Protection | 51 (29.1%) | 124 (70.9%) |
| Firefighting & Prevention | 16 (36.4%) | 28 (63.6%) |
| Law Enforcement | 35 (26.7%) | 96 (73.3%) |
| Food Preparation & Serving | 102 (42.7%) | 137 (57.3%) |
| Cleaning & Maintenance | 213 (67.2%) | 104 (32.8%) |
| Personal Care & Service | 33 (22.6%) | 113 (77.4%) |
| Total (Category) | 424 (40.6%) | 619 (59.4%) |
| Total (Overall) | 2,202 (51.8%) | 2,050 (48.2%) |
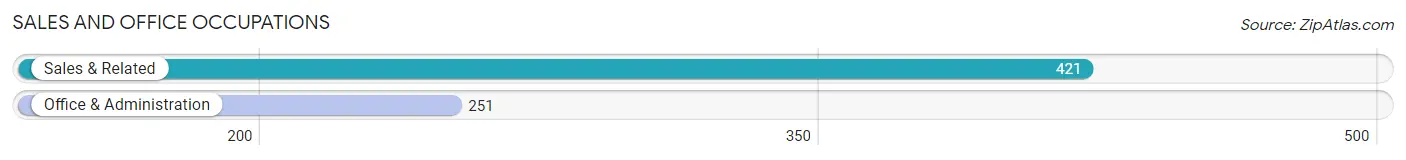
Sales and Office Occupations
The most common Sales and Office occupations in Shelton are Sales & Related (421 | 9.9%), and Office & Administration (251 | 5.9%).
Sales and Office Occupations by Sex
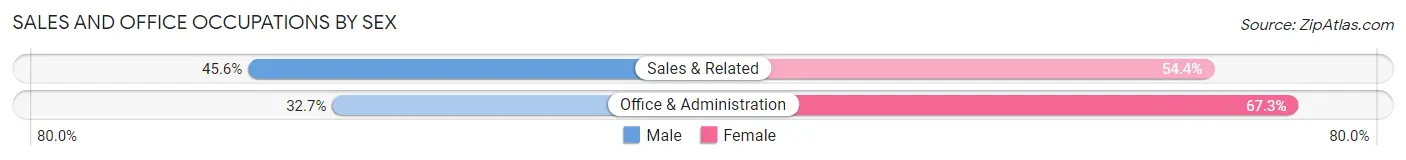
| Occupation | Male | Female |
| Sales & Related | 192 (45.6%) | 229 (54.4%) |
| Office & Administration | 82 (32.7%) | 169 (67.3%) |
| Total (Category) | 274 (40.8%) | 398 (59.2%) |
| Total (Overall) | 2,202 (51.8%) | 2,050 (48.2%) |
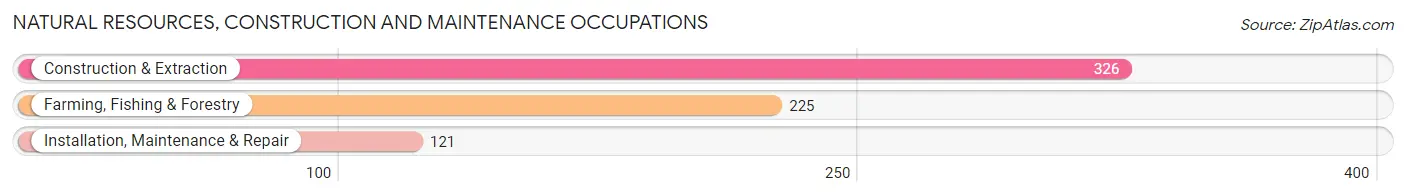
Natural Resources, Construction and Maintenance Occupations
The most common Natural Resources, Construction and Maintenance occupations in Shelton are Construction & Extraction (326 | 7.7%), Farming, Fishing & Forestry (225 | 5.3%), and Installation, Maintenance & Repair (121 | 2.9%).
Natural Resources, Construction and Maintenance Occupations by Sex
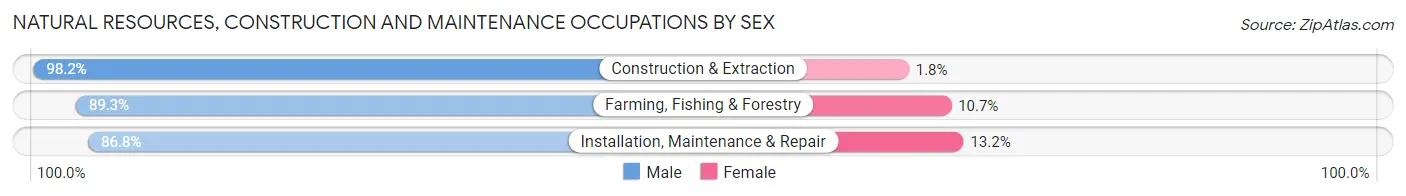
| Occupation | Male | Female |
| Farming, Fishing & Forestry | 201 (89.3%) | 24 (10.7%) |
| Construction & Extraction | 320 (98.2%) | 6 (1.8%) |
| Installation, Maintenance & Repair | 105 (86.8%) | 16 (13.2%) |
| Total (Category) | 626 (93.1%) | 46 (6.9%) |
| Total (Overall) | 2,202 (51.8%) | 2,050 (48.2%) |
Production, Transportation and Moving Occupations
The most common Production, Transportation and Moving occupations in Shelton are Material Moving (307 | 7.2%), Production (222 | 5.2%), and Transportation (53 | 1.3%).
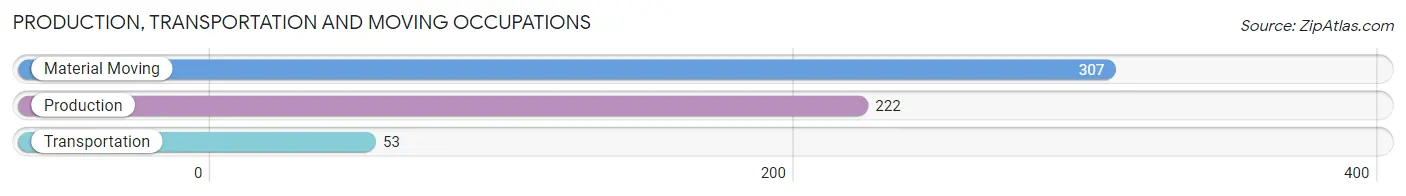
Production, Transportation and Moving Occupations by Sex
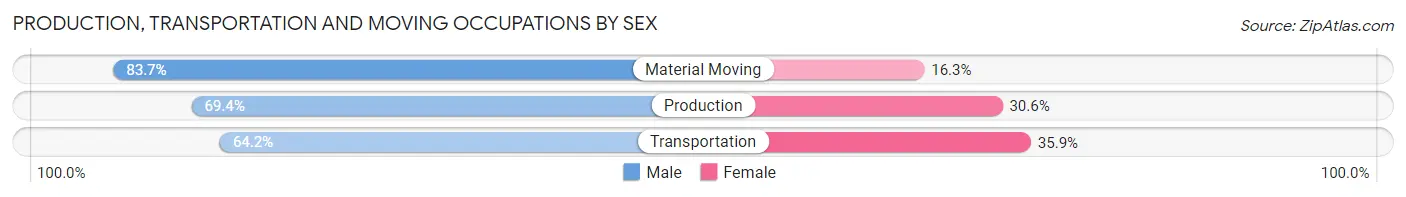
| Occupation | Male | Female |
| Production | 154 (69.4%) | 68 (30.6%) |
| Transportation | 34 (64.1%) | 19 (35.8%) |
| Material Moving | 257 (83.7%) | 50 (16.3%) |
| Total (Category) | 445 (76.5%) | 137 (23.5%) |
| Total (Overall) | 2,202 (51.8%) | 2,050 (48.2%) |
Employment Industries by Sex in Shelton
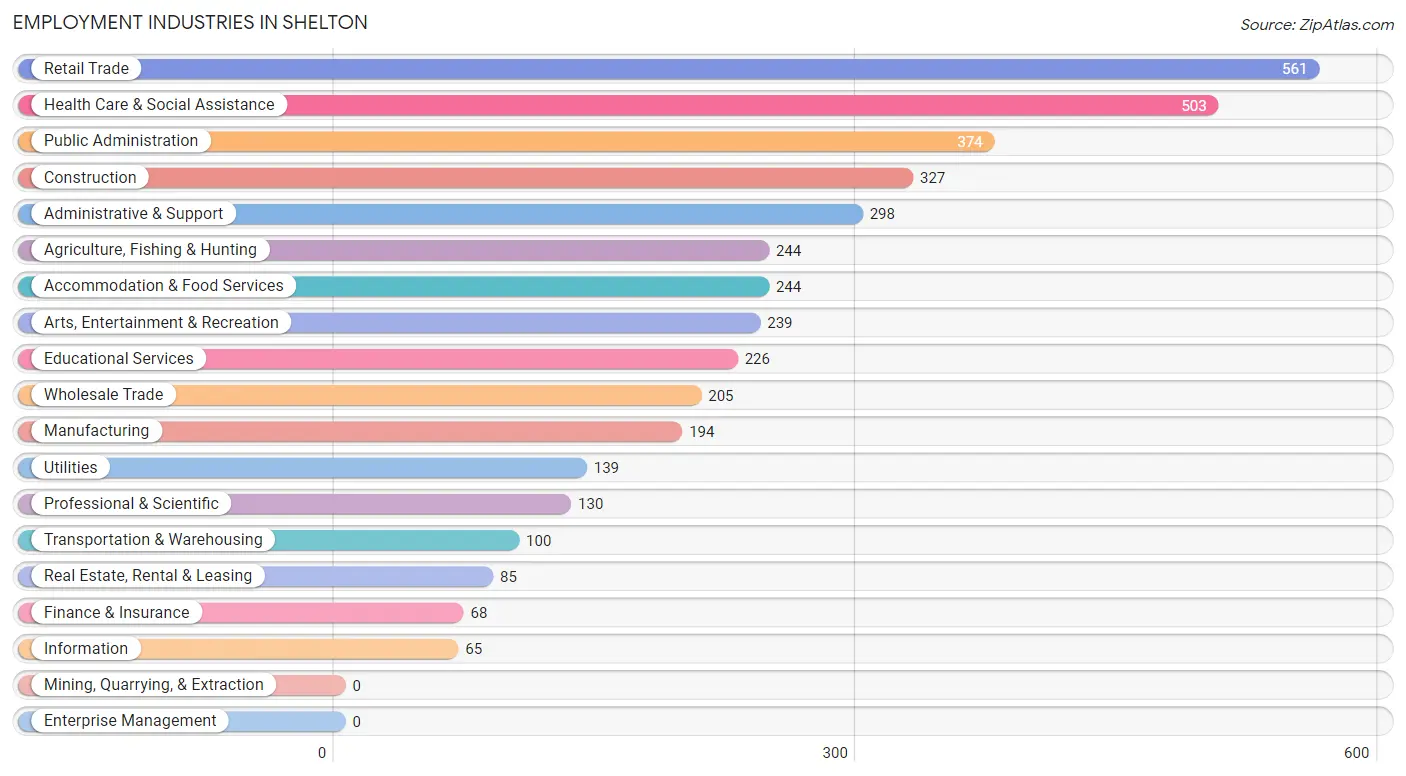
Employment Industries in Shelton
The major employment industries in Shelton include Retail Trade (561 | 13.2%), Health Care & Social Assistance (503 | 11.8%), Public Administration (374 | 8.8%), Construction (327 | 7.7%), and Administrative & Support (298 | 7.0%).
Employment Industries by Sex in Shelton
The Shelton industries that see more men than women are Construction (100.0%), Utilities (100.0%), and Agriculture, Fishing & Hunting (86.9%), whereas the industries that tend to have a higher number of women are Information (86.2%), Educational Services (84.1%), and Health Care & Social Assistance (80.1%).
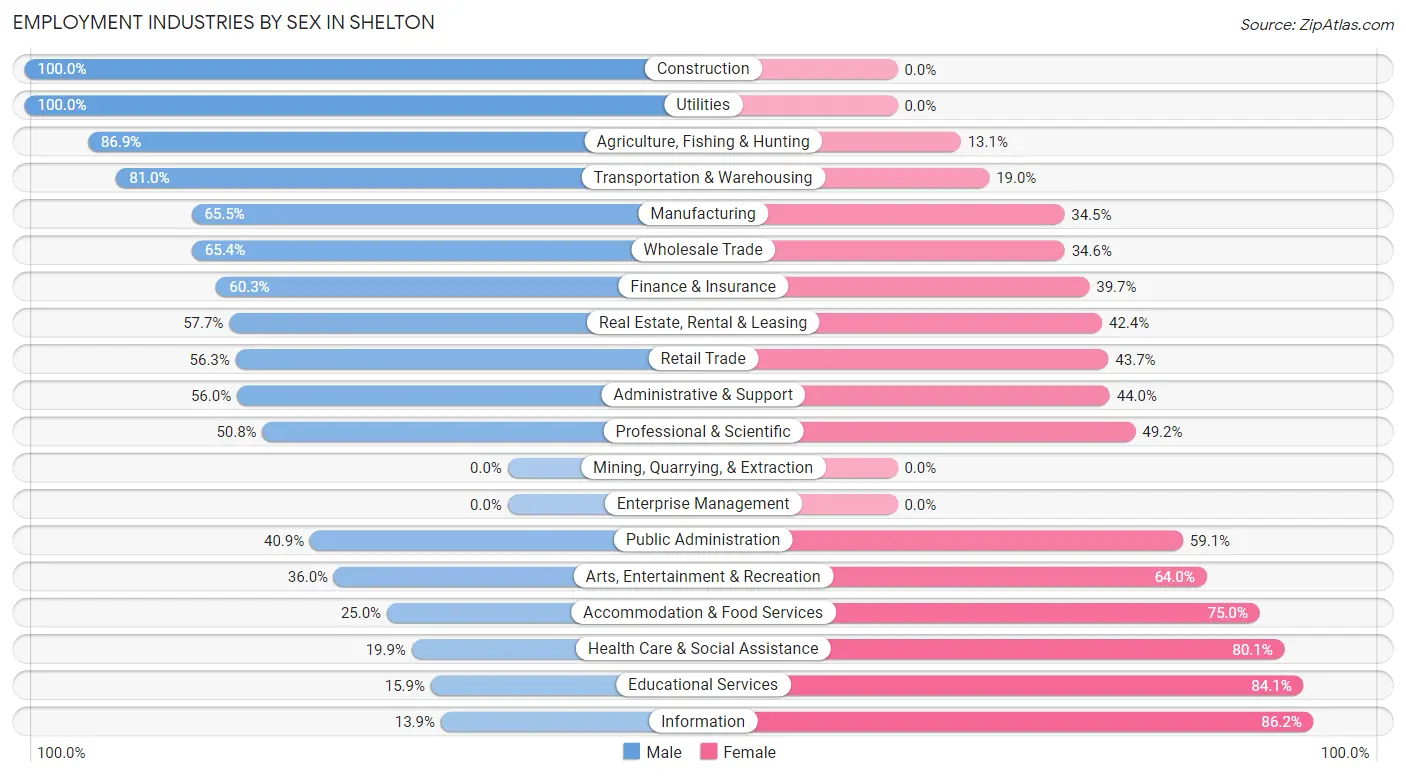
| Industry | Male | Female |
| Agriculture, Fishing & Hunting | 212 (86.9%) | 32 (13.1%) |
| Mining, Quarrying, & Extraction | 0 (0.0%) | 0 (0.0%) |
| Construction | 327 (100.0%) | 0 (0.0%) |
| Manufacturing | 127 (65.5%) | 67 (34.5%) |
| Wholesale Trade | 134 (65.4%) | 71 (34.6%) |
| Retail Trade | 316 (56.3%) | 245 (43.7%) |
| Transportation & Warehousing | 81 (81.0%) | 19 (19.0%) |
| Utilities | 139 (100.0%) | 0 (0.0%) |
| Information | 9 (13.9%) | 56 (86.2%) |
| Finance & Insurance | 41 (60.3%) | 27 (39.7%) |
| Real Estate, Rental & Leasing | 49 (57.7%) | 36 (42.3%) |
| Professional & Scientific | 66 (50.8%) | 64 (49.2%) |
| Enterprise Management | 0 (0.0%) | 0 (0.0%) |
| Administrative & Support | 167 (56.0%) | 131 (44.0%) |
| Educational Services | 36 (15.9%) | 190 (84.1%) |
| Health Care & Social Assistance | 100 (19.9%) | 403 (80.1%) |
| Arts, Entertainment & Recreation | 86 (36.0%) | 153 (64.0%) |
| Accommodation & Food Services | 61 (25.0%) | 183 (75.0%) |
| Public Administration | 153 (40.9%) | 221 (59.1%) |
| Total | 2,202 (51.8%) | 2,050 (48.2%) |
Education in Shelton
School Enrollment in Shelton
The most common levels of schooling among the 2,553 students in Shelton are elementary school (787 | 30.8%), middle school (579 | 22.7%), and high school (511 | 20.0%).
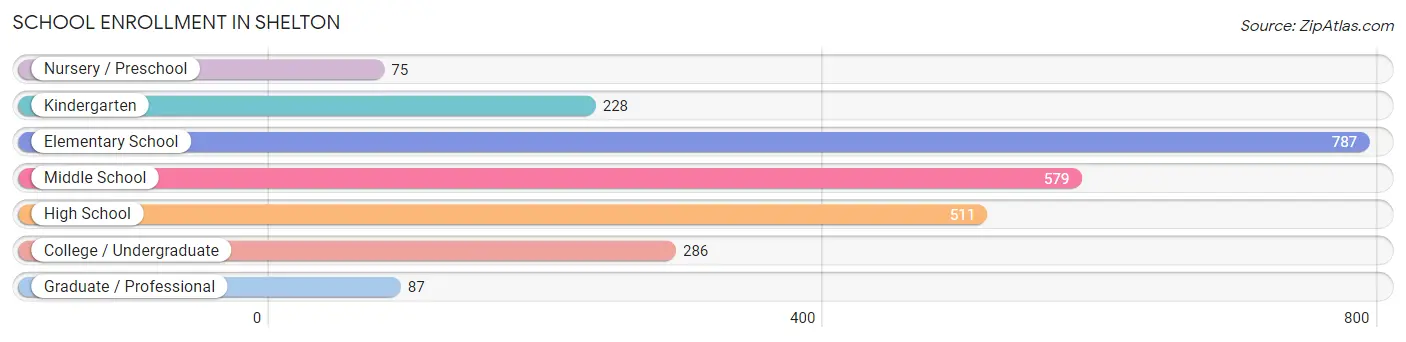
| School Level | # Students | % Students |
| Nursery / Preschool | 75 | 2.9% |
| Kindergarten | 228 | 8.9% |
| Elementary School | 787 | 30.8% |
| Middle School | 579 | 22.7% |
| High School | 511 | 20.0% |
| College / Undergraduate | 286 | 11.2% |
| Graduate / Professional | 87 | 3.4% |
| Total | 2,553 | 100.0% |
School Enrollment by Age by Funding Source in Shelton
Out of a total of 2,553 students who are enrolled in schools in Shelton, 207 (8.1%) attend a private institution, while the remaining 2,346 (91.9%) are enrolled in public schools. The age group of 3 to 4 year olds has the highest likelihood of being enrolled in private schools, with 44 (80.0% in the age bracket) enrolled. Conversely, the age group of 10 to 14 year olds has the lowest likelihood of being enrolled in a private school, with 804 (96.1% in the age bracket) attending a public institution.
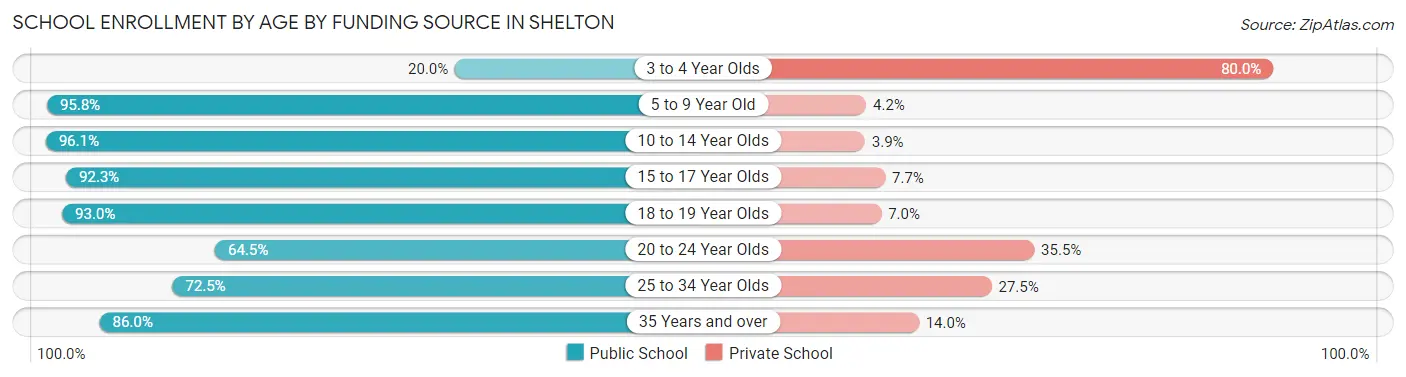
| Age Bracket | Public School | Private School |
| 3 to 4 Year Olds | 11 (20.0%) | 44 (80.0%) |
| 5 to 9 Year Old | 827 (95.8%) | 36 (4.2%) |
| 10 to 14 Year Olds | 804 (96.1%) | 33 (3.9%) |
| 15 to 17 Year Olds | 347 (92.3%) | 29 (7.7%) |
| 18 to 19 Year Olds | 133 (93.0%) | 10 (7.0%) |
| 20 to 24 Year Olds | 20 (64.5%) | 11 (35.5%) |
| 25 to 34 Year Olds | 50 (72.5%) | 19 (27.5%) |
| 35 Years and over | 154 (86.0%) | 25 (14.0%) |
| Total | 2,346 (91.9%) | 207 (8.1%) |
Educational Attainment by Field of Study in Shelton
Science & technology (224 | 16.7%), business (219 | 16.3%), education (193 | 14.4%), social sciences (129 | 9.6%), and psychology (128 | 9.6%) are the most common fields of study among 1,341 individuals in Shelton who have obtained a bachelor's degree or higher.
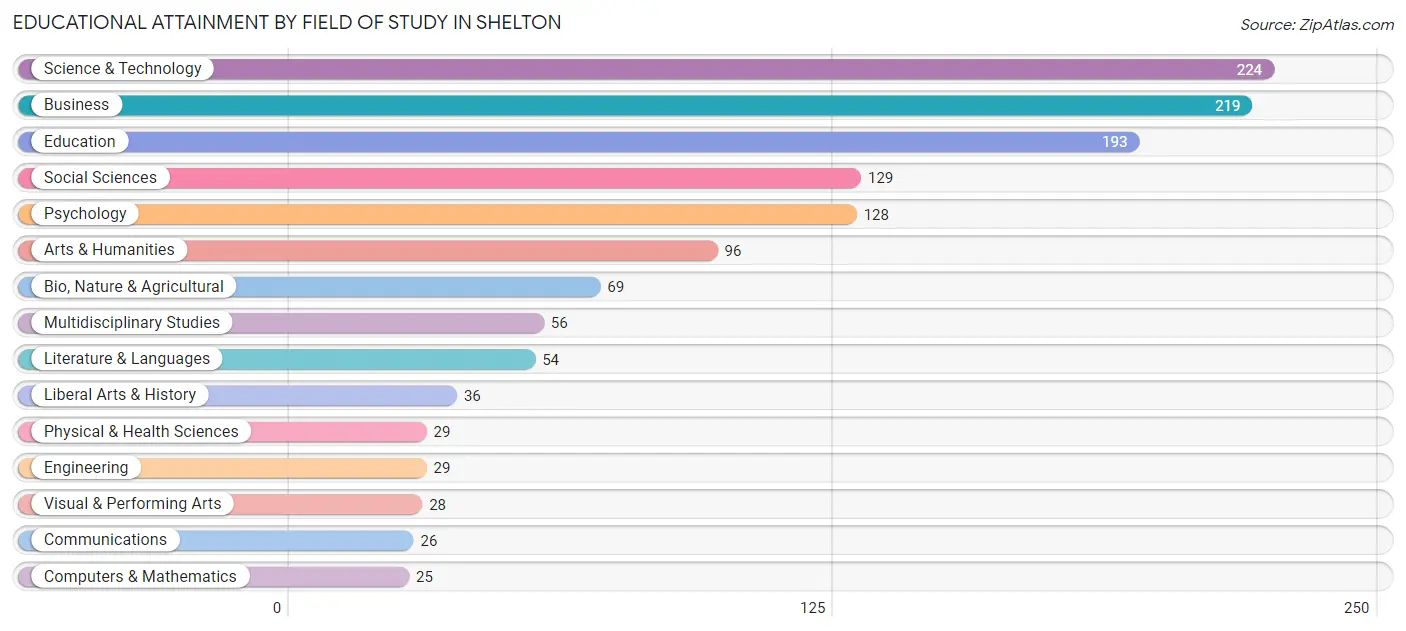
| Field of Study | # Graduates | % Graduates |
| Computers & Mathematics | 25 | 1.9% |
| Bio, Nature & Agricultural | 69 | 5.1% |
| Physical & Health Sciences | 29 | 2.2% |
| Psychology | 128 | 9.6% |
| Social Sciences | 129 | 9.6% |
| Engineering | 29 | 2.2% |
| Multidisciplinary Studies | 56 | 4.2% |
| Science & Technology | 224 | 16.7% |
| Business | 219 | 16.3% |
| Education | 193 | 14.4% |
| Literature & Languages | 54 | 4.0% |
| Liberal Arts & History | 36 | 2.7% |
| Visual & Performing Arts | 28 | 2.1% |
| Communications | 26 | 1.9% |
| Arts & Humanities | 96 | 7.2% |
| Total | 1,341 | 100.0% |
Transportation & Commute in Shelton
Vehicle Availability by Sex in Shelton
The most prevalent vehicle ownership categories in Shelton are males with 2 vehicles (883, accounting for 41.7%) and females with 2 vehicles (798, making up 44.1%).
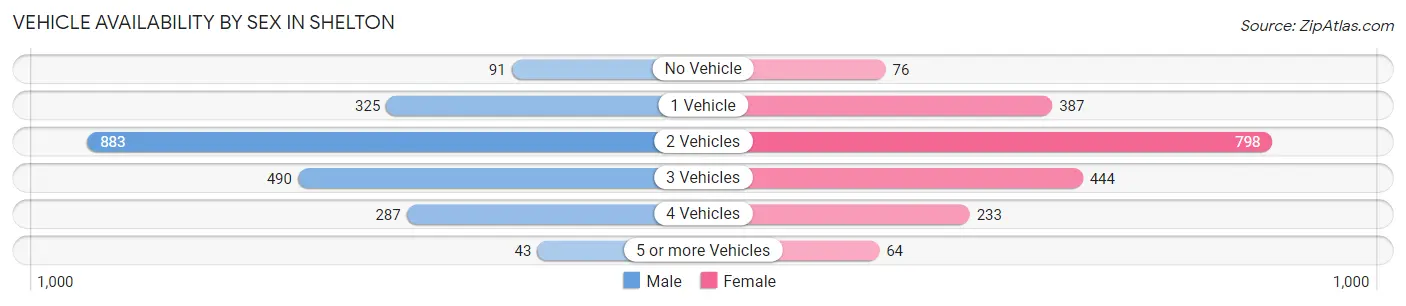
| Vehicles Available | Male | Female |
| No Vehicle | 91 (4.3%) | 76 (3.8%) |
| 1 Vehicle | 325 (15.3%) | 387 (19.3%) |
| 2 Vehicles | 883 (41.7%) | 798 (39.9%) |
| 3 Vehicles | 490 (23.1%) | 444 (22.2%) |
| 4 Vehicles | 287 (13.5%) | 233 (11.6%) |
| 5 or more Vehicles | 43 (2.0%) | 64 (3.2%) |
| Total | 2,119 (100.0%) | 2,002 (100.0%) |
Commute Time in Shelton
The most frequently occuring commute durations in Shelton are 5 to 9 minutes (783 commuters, 20.8%), 10 to 14 minutes (521 commuters, 13.9%), and 30 to 34 minutes (441 commuters, 11.7%).
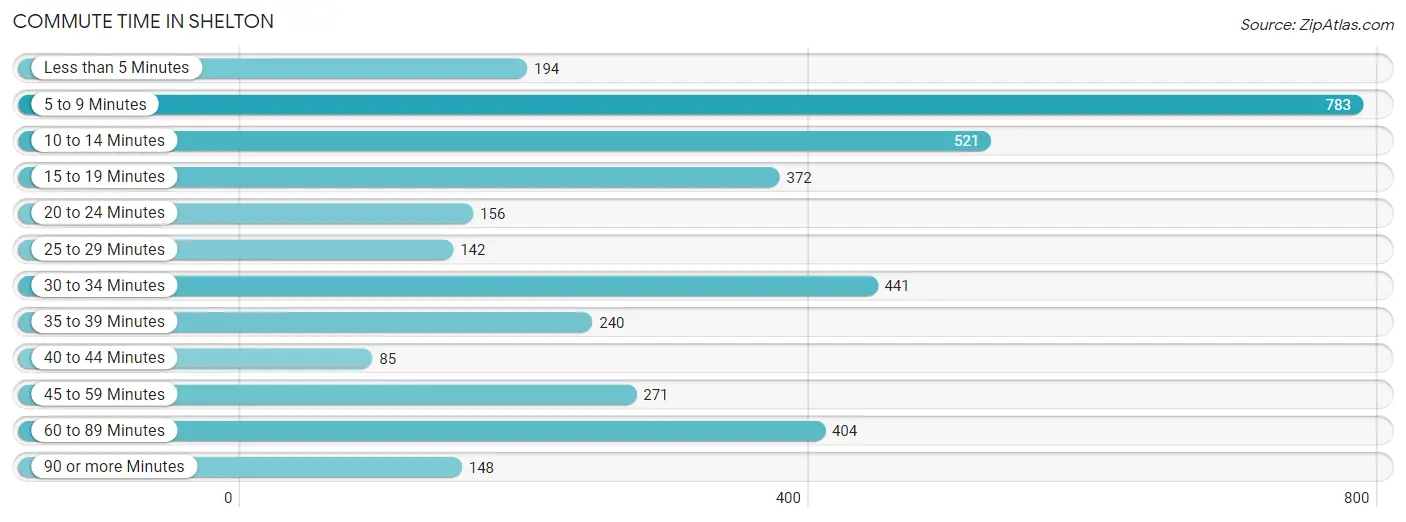
| Commute Time | # Commuters | % Commuters |
| Less than 5 Minutes | 194 | 5.2% |
| 5 to 9 Minutes | 783 | 20.8% |
| 10 to 14 Minutes | 521 | 13.9% |
| 15 to 19 Minutes | 372 | 9.9% |
| 20 to 24 Minutes | 156 | 4.2% |
| 25 to 29 Minutes | 142 | 3.8% |
| 30 to 34 Minutes | 441 | 11.7% |
| 35 to 39 Minutes | 240 | 6.4% |
| 40 to 44 Minutes | 85 | 2.3% |
| 45 to 59 Minutes | 271 | 7.2% |
| 60 to 89 Minutes | 404 | 10.7% |
| 90 or more Minutes | 148 | 3.9% |
Commute Time by Sex in Shelton
The most common commute times in Shelton are 10 to 14 minutes (348 commuters, 17.7%) for males and 5 to 9 minutes (540 commuters, 30.2%) for females.
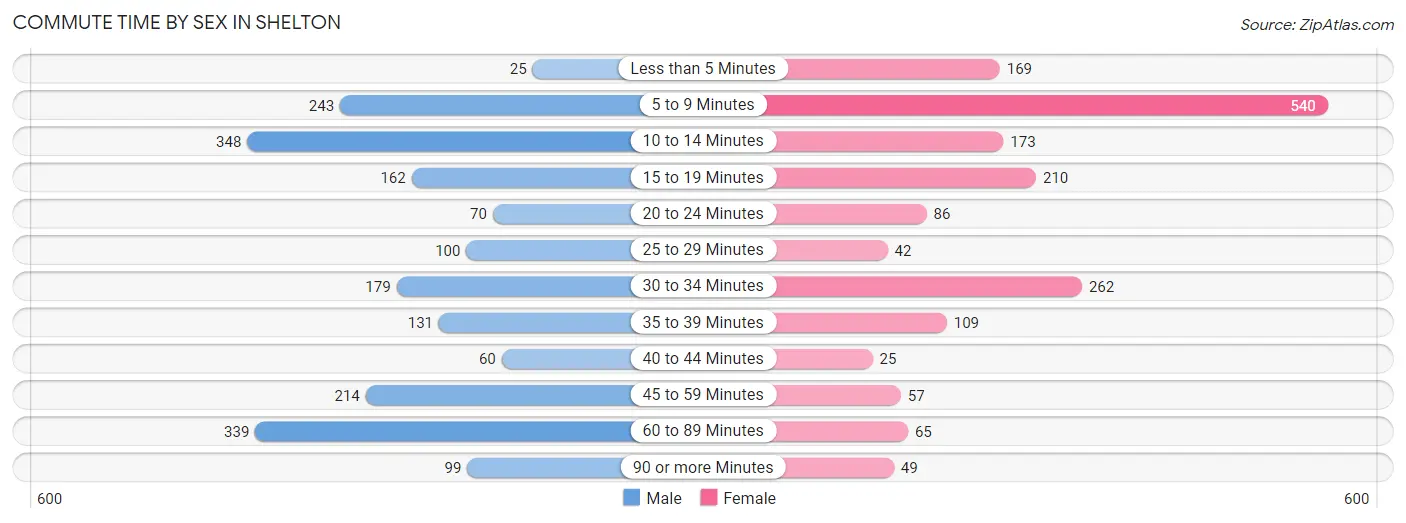
| Commute Time | Male | Female |
| Less than 5 Minutes | 25 (1.3%) | 169 (9.5%) |
| 5 to 9 Minutes | 243 (12.3%) | 540 (30.2%) |
| 10 to 14 Minutes | 348 (17.7%) | 173 (9.7%) |
| 15 to 19 Minutes | 162 (8.2%) | 210 (11.7%) |
| 20 to 24 Minutes | 70 (3.5%) | 86 (4.8%) |
| 25 to 29 Minutes | 100 (5.1%) | 42 (2.4%) |
| 30 to 34 Minutes | 179 (9.1%) | 262 (14.7%) |
| 35 to 39 Minutes | 131 (6.7%) | 109 (6.1%) |
| 40 to 44 Minutes | 60 (3.0%) | 25 (1.4%) |
| 45 to 59 Minutes | 214 (10.9%) | 57 (3.2%) |
| 60 to 89 Minutes | 339 (17.2%) | 65 (3.6%) |
| 90 or more Minutes | 99 (5.0%) | 49 (2.7%) |
Time of Departure to Work by Sex in Shelton
The most frequent times of departure to work in Shelton are 6:30 AM to 6:59 AM (268, 13.6%) for males and 6:30 AM to 6:59 AM (361, 20.2%) for females.
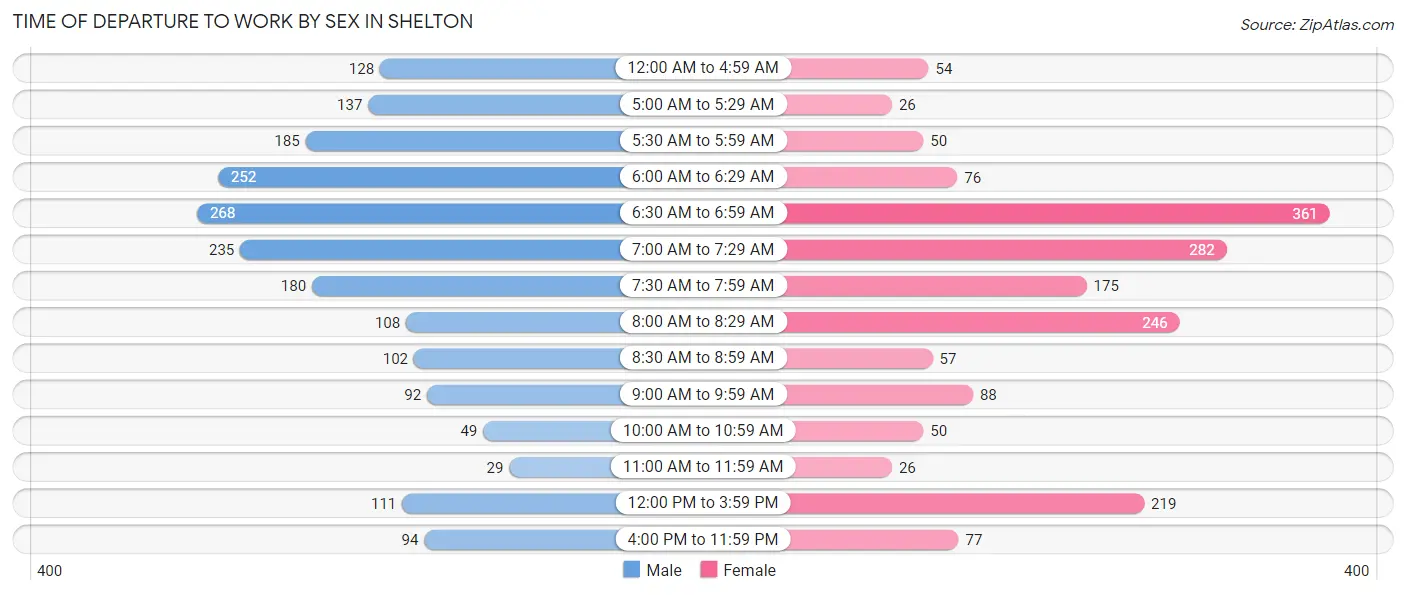
| Time of Departure | Male | Female |
| 12:00 AM to 4:59 AM | 128 (6.5%) | 54 (3.0%) |
| 5:00 AM to 5:29 AM | 137 (7.0%) | 26 (1.5%) |
| 5:30 AM to 5:59 AM | 185 (9.4%) | 50 (2.8%) |
| 6:00 AM to 6:29 AM | 252 (12.8%) | 76 (4.3%) |
| 6:30 AM to 6:59 AM | 268 (13.6%) | 361 (20.2%) |
| 7:00 AM to 7:29 AM | 235 (11.9%) | 282 (15.8%) |
| 7:30 AM to 7:59 AM | 180 (9.1%) | 175 (9.8%) |
| 8:00 AM to 8:29 AM | 108 (5.5%) | 246 (13.8%) |
| 8:30 AM to 8:59 AM | 102 (5.2%) | 57 (3.2%) |
| 9:00 AM to 9:59 AM | 92 (4.7%) | 88 (4.9%) |
| 10:00 AM to 10:59 AM | 49 (2.5%) | 50 (2.8%) |
| 11:00 AM to 11:59 AM | 29 (1.5%) | 26 (1.5%) |
| 12:00 PM to 3:59 PM | 111 (5.6%) | 219 (12.3%) |
| 4:00 PM to 11:59 PM | 94 (4.8%) | 77 (4.3%) |
| Total | 1,970 (100.0%) | 1,787 (100.0%) |
Housing Occupancy in Shelton
Occupancy by Ownership in Shelton
Of the total 3,461 dwellings in Shelton, owner-occupied units account for 1,803 (52.1%), while renter-occupied units make up 1,658 (47.9%).
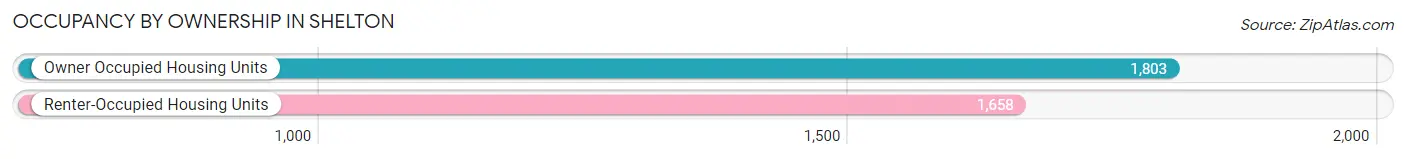
| Occupancy | # Housing Units | % Housing Units |
| Owner Occupied Housing Units | 1,803 | 52.1% |
| Renter-Occupied Housing Units | 1,658 | 47.9% |
| Total Occupied Housing Units | 3,461 | 100.0% |
Occupancy by Household Size in Shelton
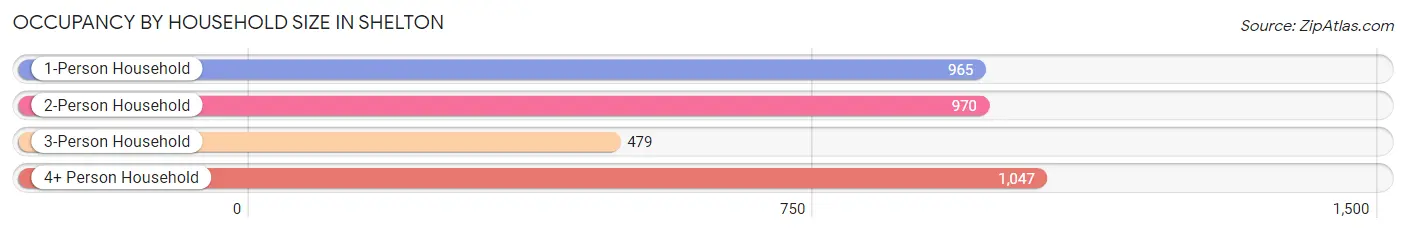
| Household Size | # Housing Units | % Housing Units |
| 1-Person Household | 965 | 27.9% |
| 2-Person Household | 970 | 28.0% |
| 3-Person Household | 479 | 13.8% |
| 4+ Person Household | 1,047 | 30.2% |
| Total Housing Units | 3,461 | 100.0% |
Occupancy by Ownership by Household Size in Shelton
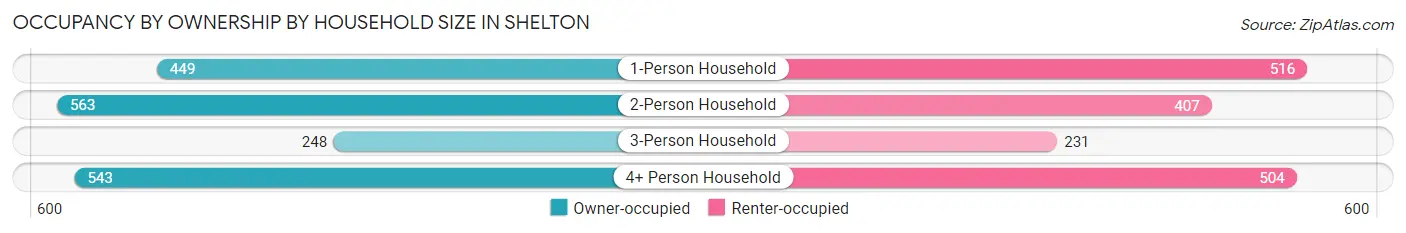
| Household Size | Owner-occupied | Renter-occupied |
| 1-Person Household | 449 (46.5%) | 516 (53.5%) |
| 2-Person Household | 563 (58.0%) | 407 (42.0%) |
| 3-Person Household | 248 (51.8%) | 231 (48.2%) |
| 4+ Person Household | 543 (51.9%) | 504 (48.1%) |
| Total Housing Units | 1,803 (52.1%) | 1,658 (47.9%) |
Occupancy by Educational Attainment in Shelton
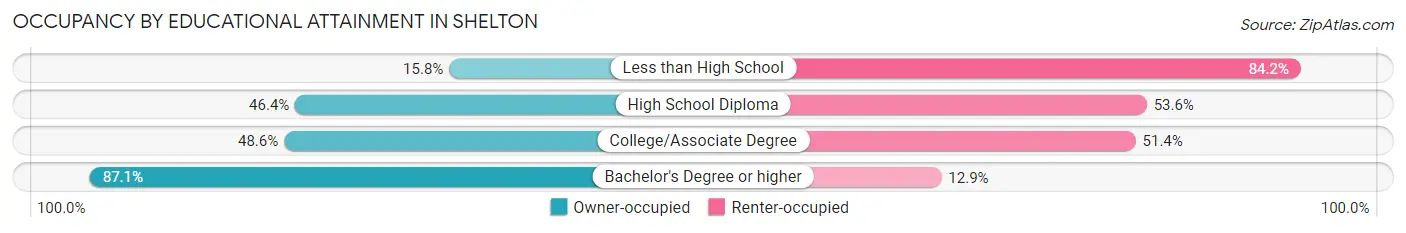
| Household Size | Owner-occupied | Renter-occupied |
| Less than High School | 66 (15.8%) | 351 (84.2%) |
| High School Diploma | 446 (46.4%) | 516 (53.6%) |
| College/Associate Degree | 658 (48.6%) | 697 (51.4%) |
| Bachelor's Degree or higher | 633 (87.1%) | 94 (12.9%) |
Occupancy by Age of Householder in Shelton
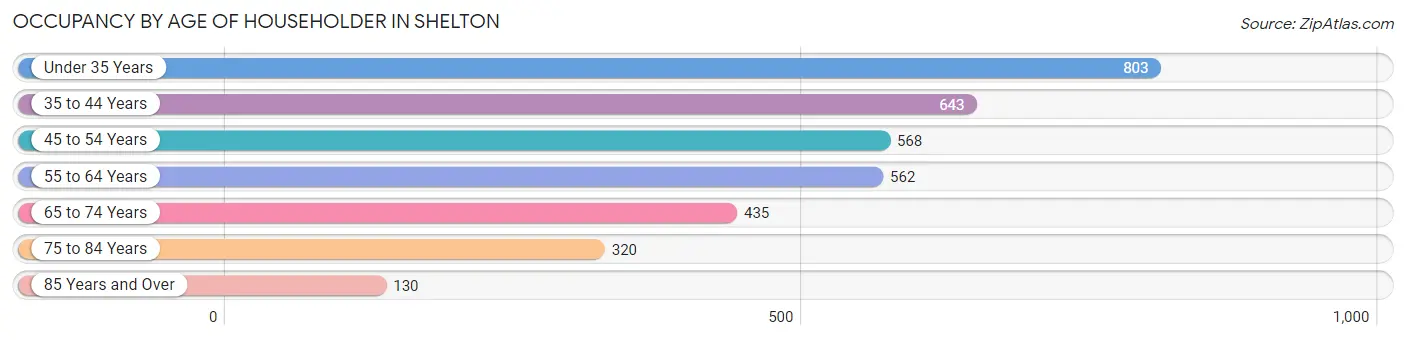
| Age Bracket | # Households | % Households |
| Under 35 Years | 803 | 23.2% |
| 35 to 44 Years | 643 | 18.6% |
| 45 to 54 Years | 568 | 16.4% |
| 55 to 64 Years | 562 | 16.2% |
| 65 to 74 Years | 435 | 12.6% |
| 75 to 84 Years | 320 | 9.2% |
| 85 Years and Over | 130 | 3.8% |
| Total | 3,461 | 100.0% |
Housing Finances in Shelton
Median Income by Occupancy in Shelton
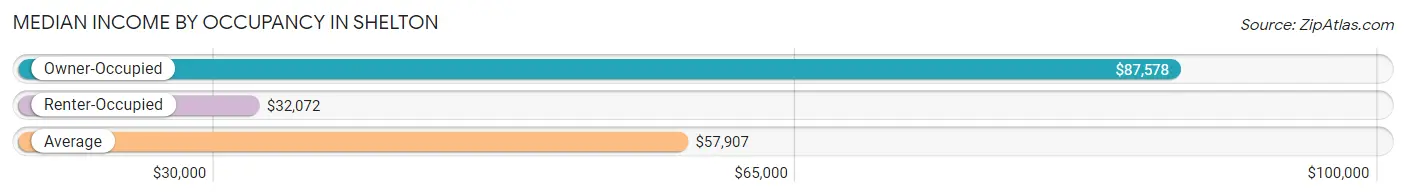
| Occupancy Type | # Households | Median Income |
| Owner-Occupied | 1,803 (52.1%) | $87,578 |
| Renter-Occupied | 1,658 (47.9%) | $32,072 |
| Average | 3,461 (100.0%) | $57,907 |
Occupancy by Householder Income Bracket in Shelton
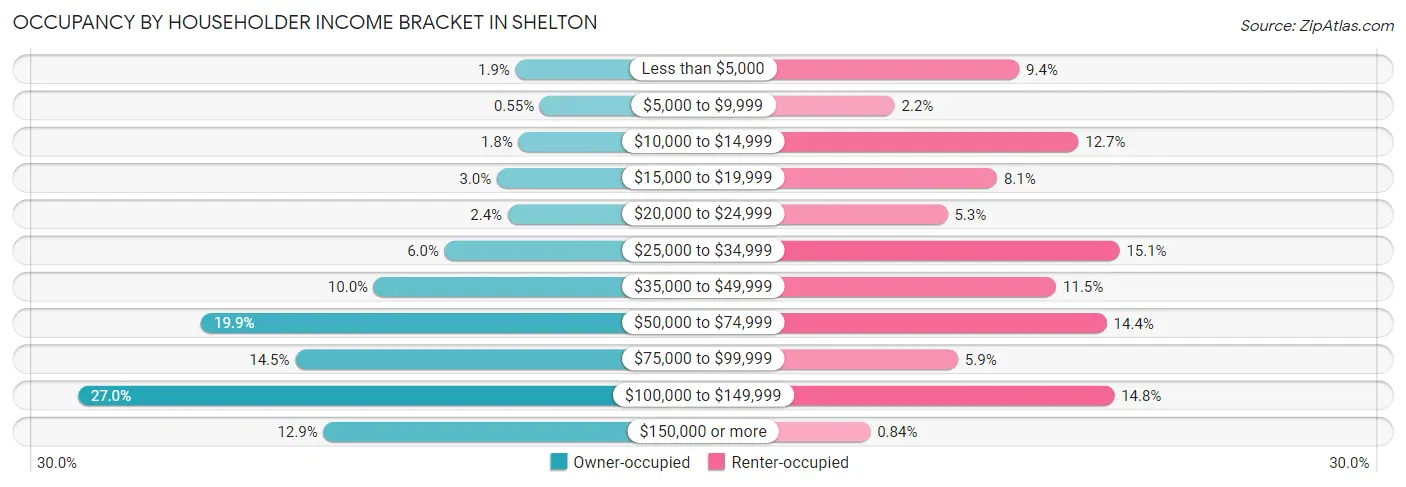
| Income Bracket | Owner-occupied | Renter-occupied |
| Less than $5,000 | 35 (1.9%) | 155 (9.3%) |
| $5,000 to $9,999 | 10 (0.5%) | 37 (2.2%) |
| $10,000 to $14,999 | 32 (1.8%) | 211 (12.7%) |
| $15,000 to $19,999 | 54 (3.0%) | 134 (8.1%) |
| $20,000 to $24,999 | 43 (2.4%) | 87 (5.2%) |
| $25,000 to $34,999 | 108 (6.0%) | 250 (15.1%) |
| $35,000 to $49,999 | 181 (10.0%) | 190 (11.5%) |
| $50,000 to $74,999 | 359 (19.9%) | 238 (14.3%) |
| $75,000 to $99,999 | 262 (14.5%) | 97 (5.9%) |
| $100,000 to $149,999 | 486 (27.0%) | 245 (14.8%) |
| $150,000 or more | 233 (12.9%) | 14 (0.8%) |
| Total | 1,803 (100.0%) | 1,658 (100.0%) |
Monthly Housing Cost Tiers in Shelton
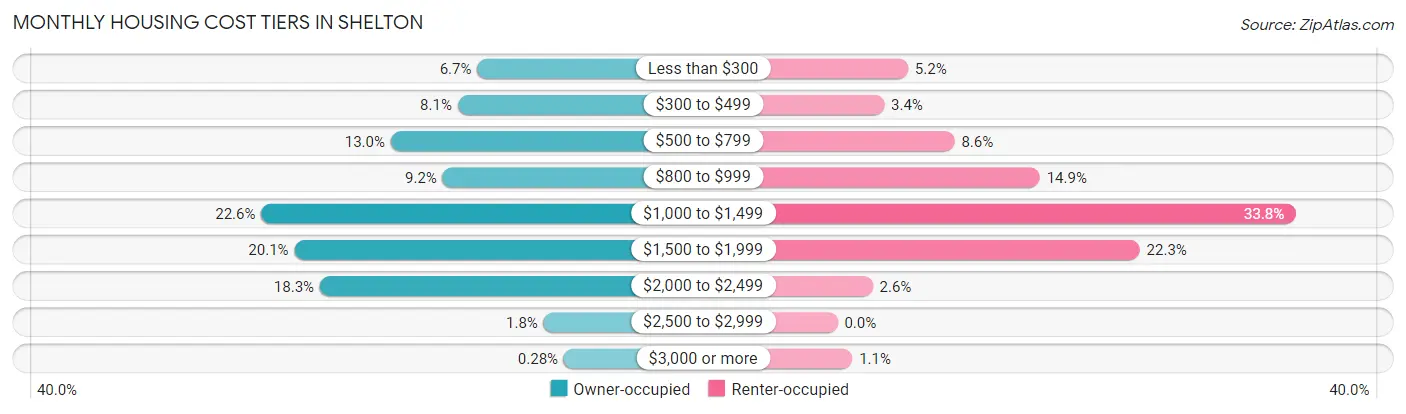
| Monthly Cost | Owner-occupied | Renter-occupied |
| Less than $300 | 120 (6.7%) | 86 (5.2%) |
| $300 to $499 | 146 (8.1%) | 57 (3.4%) |
| $500 to $799 | 235 (13.0%) | 143 (8.6%) |
| $800 to $999 | 166 (9.2%) | 247 (14.9%) |
| $1,000 to $1,499 | 407 (22.6%) | 560 (33.8%) |
| $1,500 to $1,999 | 363 (20.1%) | 369 (22.3%) |
| $2,000 to $2,499 | 329 (18.2%) | 43 (2.6%) |
| $2,500 to $2,999 | 32 (1.8%) | 0 (0.0%) |
| $3,000 or more | 5 (0.3%) | 18 (1.1%) |
| Total | 1,803 (100.0%) | 1,658 (100.0%) |
Physical Housing Characteristics in Shelton
Housing Structures in Shelton
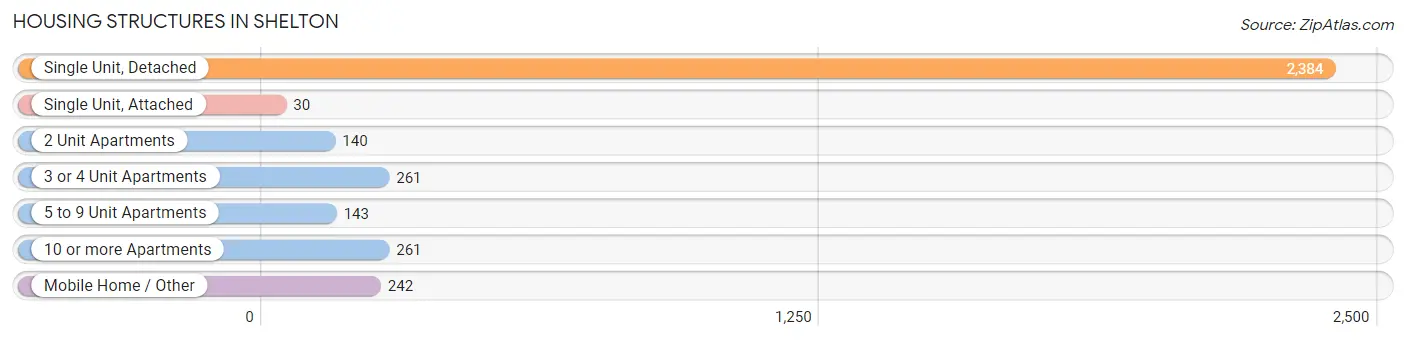
| Structure Type | # Housing Units | % Housing Units |
| Single Unit, Detached | 2,384 | 68.9% |
| Single Unit, Attached | 30 | 0.9% |
| 2 Unit Apartments | 140 | 4.1% |
| 3 or 4 Unit Apartments | 261 | 7.5% |
| 5 to 9 Unit Apartments | 143 | 4.1% |
| 10 or more Apartments | 261 | 7.5% |
| Mobile Home / Other | 242 | 7.0% |
| Total | 3,461 | 100.0% |
Housing Structures by Occupancy in Shelton
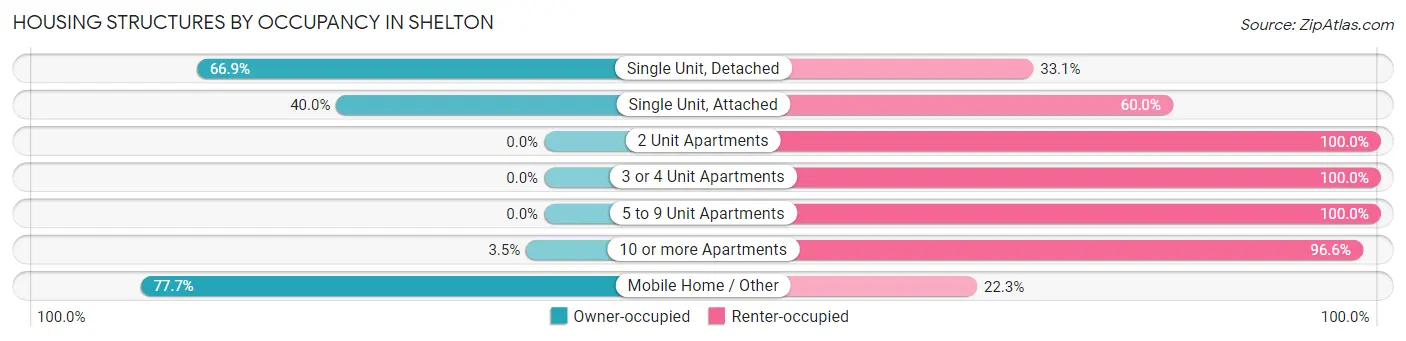
| Structure Type | Owner-occupied | Renter-occupied |
| Single Unit, Detached | 1,594 (66.9%) | 790 (33.1%) |
| Single Unit, Attached | 12 (40.0%) | 18 (60.0%) |
| 2 Unit Apartments | 0 (0.0%) | 140 (100.0%) |
| 3 or 4 Unit Apartments | 0 (0.0%) | 261 (100.0%) |
| 5 to 9 Unit Apartments | 0 (0.0%) | 143 (100.0%) |
| 10 or more Apartments | 9 (3.5%) | 252 (96.6%) |
| Mobile Home / Other | 188 (77.7%) | 54 (22.3%) |
| Total | 1,803 (52.1%) | 1,658 (47.9%) |
Housing Structures by Number of Rooms in Shelton
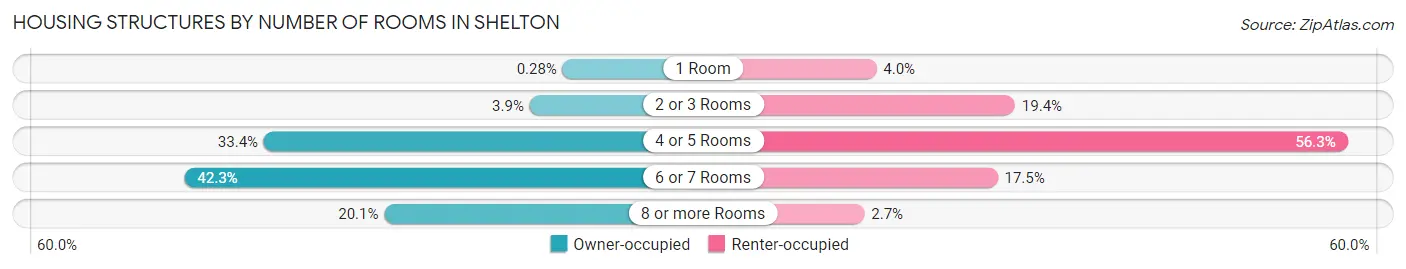
| Number of Rooms | Owner-occupied | Renter-occupied |
| 1 Room | 5 (0.3%) | 67 (4.0%) |
| 2 or 3 Rooms | 71 (3.9%) | 322 (19.4%) |
| 4 or 5 Rooms | 603 (33.4%) | 934 (56.3%) |
| 6 or 7 Rooms | 762 (42.3%) | 290 (17.5%) |
| 8 or more Rooms | 362 (20.1%) | 45 (2.7%) |
| Total | 1,803 (100.0%) | 1,658 (100.0%) |
Housing Structure by Heating Type in Shelton
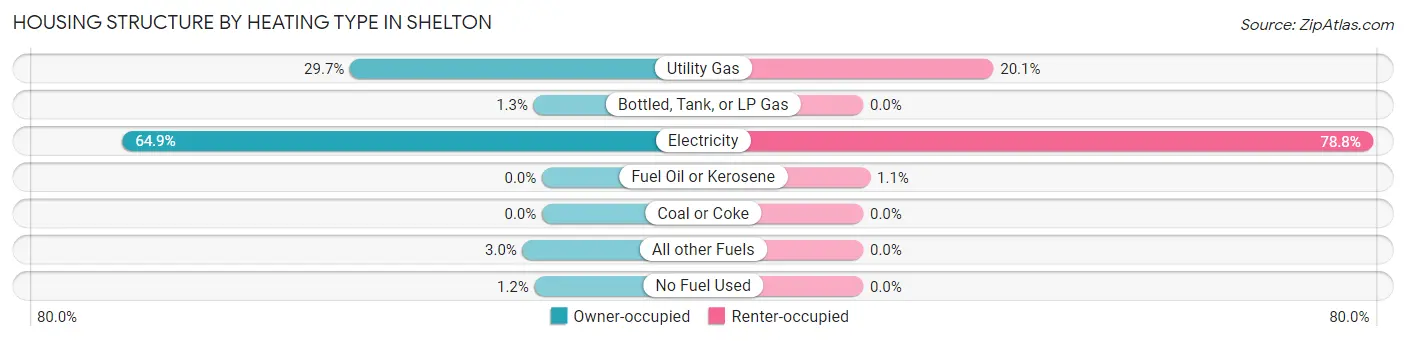
| Heating Type | Owner-occupied | Renter-occupied |
| Utility Gas | 535 (29.7%) | 334 (20.1%) |
| Bottled, Tank, or LP Gas | 23 (1.3%) | 0 (0.0%) |
| Electricity | 1,170 (64.9%) | 1,306 (78.8%) |
| Fuel Oil or Kerosene | 0 (0.0%) | 18 (1.1%) |
| Coal or Coke | 0 (0.0%) | 0 (0.0%) |
| All other Fuels | 54 (3.0%) | 0 (0.0%) |
| No Fuel Used | 21 (1.2%) | 0 (0.0%) |
| Total | 1,803 (100.0%) | 1,658 (100.0%) |
Household Vehicle Usage in Shelton
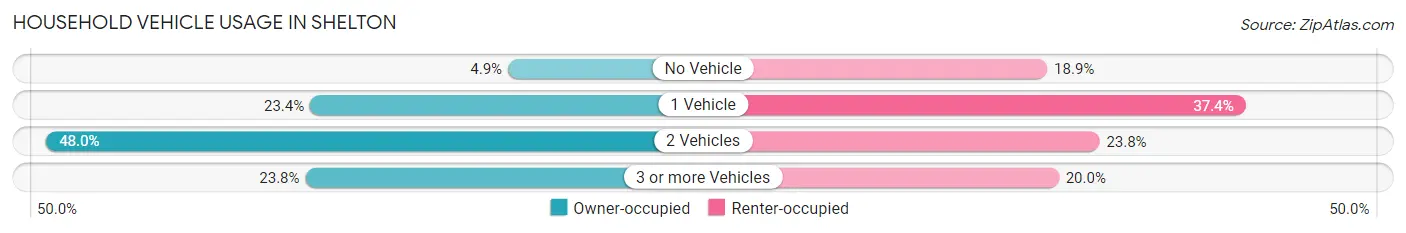
| Vehicles per Household | Owner-occupied | Renter-occupied |
| No Vehicle | 88 (4.9%) | 313 (18.9%) |
| 1 Vehicle | 421 (23.4%) | 620 (37.4%) |
| 2 Vehicles | 865 (48.0%) | 394 (23.8%) |
| 3 or more Vehicles | 429 (23.8%) | 331 (20.0%) |
| Total | 1,803 (100.0%) | 1,658 (100.0%) |
Real Estate & Mortgages in Shelton
Real Estate and Mortgage Overview in Shelton
| Characteristic | Without Mortgage | With Mortgage |
| Housing Units | 538 | 1,265 |
| Median Property Value | $184,800 | $292,400 |
| Median Household Income | $55,324 | $201 |
| Monthly Housing Costs | $576 | $5 |
| Real Estate Taxes | $1,994 | $32 |
Property Value by Mortgage Status in Shelton
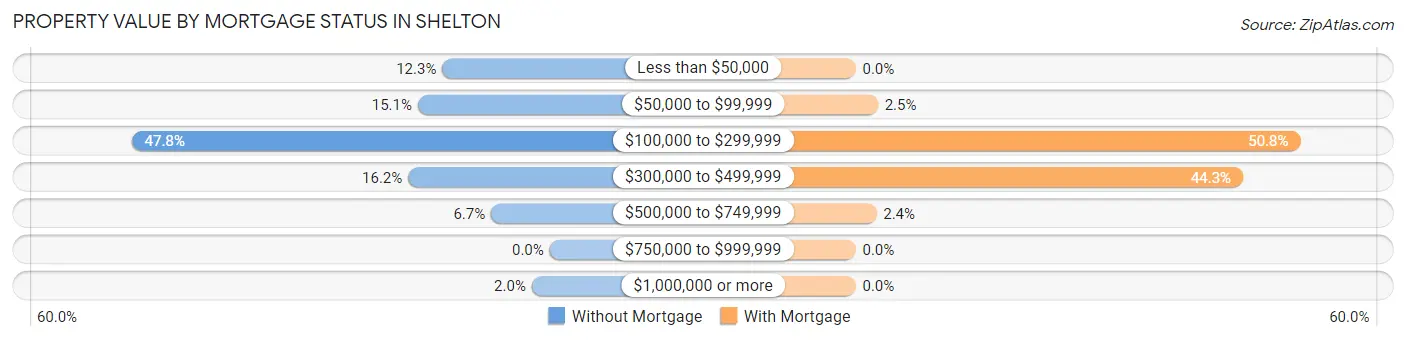
| Property Value | Without Mortgage | With Mortgage |
| Less than $50,000 | 66 (12.3%) | 0 (0.0%) |
| $50,000 to $99,999 | 81 (15.1%) | 32 (2.5%) |
| $100,000 to $299,999 | 257 (47.8%) | 643 (50.8%) |
| $300,000 to $499,999 | 87 (16.2%) | 560 (44.3%) |
| $500,000 to $749,999 | 36 (6.7%) | 30 (2.4%) |
| $750,000 to $999,999 | 0 (0.0%) | 0 (0.0%) |
| $1,000,000 or more | 11 (2.0%) | 0 (0.0%) |
| Total | 538 (100.0%) | 1,265 (100.0%) |
Household Income by Mortgage Status in Shelton
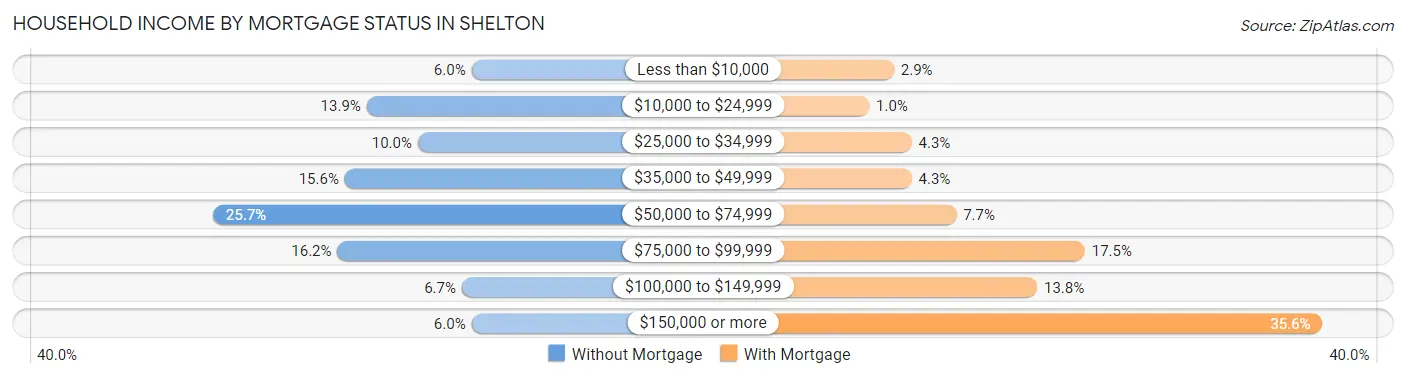
| Household Income | Without Mortgage | With Mortgage |
| Less than $10,000 | 32 (5.9%) | 37 (2.9%) |
| $10,000 to $24,999 | 75 (13.9%) | 13 (1.0%) |
| $25,000 to $34,999 | 54 (10.0%) | 54 (4.3%) |
| $35,000 to $49,999 | 84 (15.6%) | 54 (4.3%) |
| $50,000 to $74,999 | 138 (25.7%) | 97 (7.7%) |
| $75,000 to $99,999 | 87 (16.2%) | 221 (17.5%) |
| $100,000 to $149,999 | 36 (6.7%) | 175 (13.8%) |
| $150,000 or more | 32 (5.9%) | 450 (35.6%) |
| Total | 538 (100.0%) | 1,265 (100.0%) |
Property Value to Household Income Ratio in Shelton
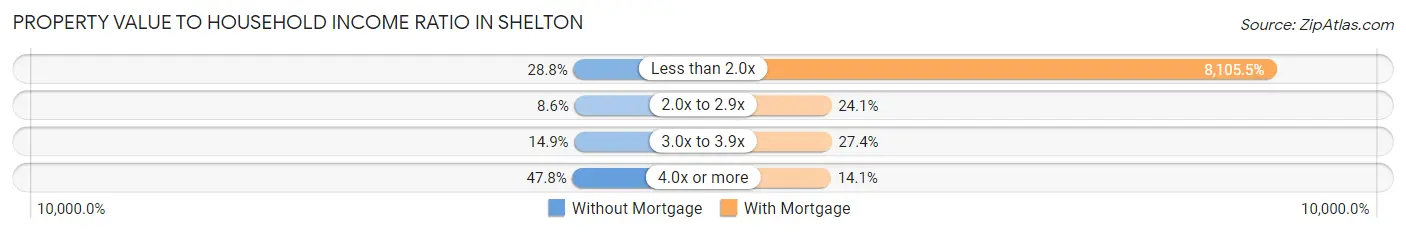
| Value-to-Income Ratio | Without Mortgage | With Mortgage |
| Less than 2.0x | 155 (28.8%) | 102,535 (8,105.5%) |
| 2.0x to 2.9x | 46 (8.6%) | 305 (24.1%) |
| 3.0x to 3.9x | 80 (14.9%) | 347 (27.4%) |
| 4.0x or more | 257 (47.8%) | 178 (14.1%) |
| Total | 538 (100.0%) | 1,265 (100.0%) |
Real Estate Taxes by Mortgage Status in Shelton
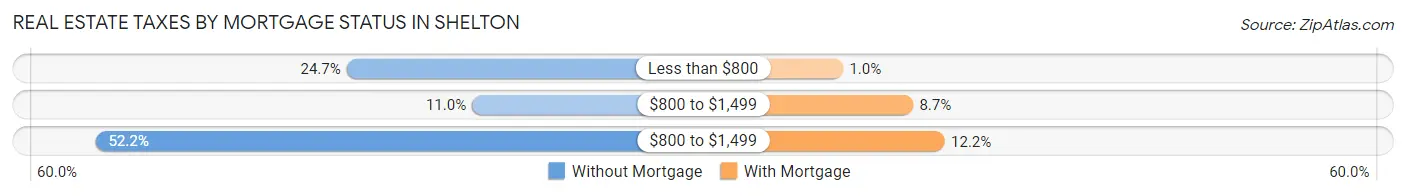
| Property Taxes | Without Mortgage | With Mortgage |
| Less than $800 | 133 (24.7%) | 13 (1.0%) |
| $800 to $1,499 | 59 (11.0%) | 110 (8.7%) |
| $800 to $1,499 | 281 (52.2%) | 154 (12.2%) |
| Total | 538 (100.0%) | 1,265 (100.0%) |
Health & Disability in Shelton
Health Insurance Coverage by Age in Shelton
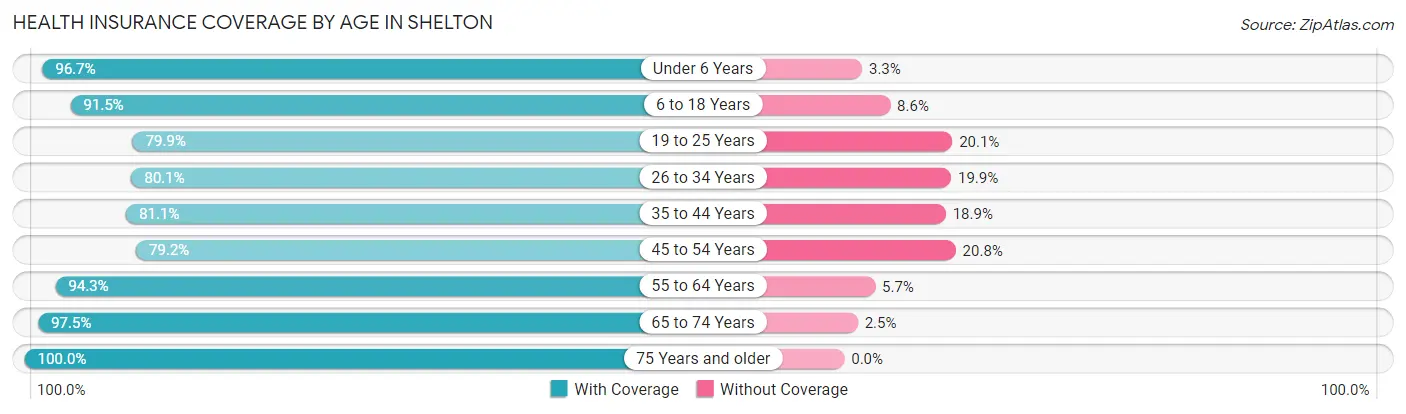
| Age Bracket | With Coverage | Without Coverage |
| Under 6 Years | 1,021 (96.7%) | 35 (3.3%) |
| 6 to 18 Years | 1,915 (91.4%) | 179 (8.6%) |
| 19 to 25 Years | 941 (79.9%) | 237 (20.1%) |
| 26 to 34 Years | 1,058 (80.1%) | 263 (19.9%) |
| 35 to 44 Years | 1,037 (81.1%) | 242 (18.9%) |
| 45 to 54 Years | 782 (79.2%) | 205 (20.8%) |
| 55 to 64 Years | 936 (94.3%) | 57 (5.7%) |
| 65 to 74 Years | 664 (97.5%) | 17 (2.5%) |
| 75 Years and older | 626 (100.0%) | 0 (0.0%) |
| Total | 8,980 (87.9%) | 1,235 (12.1%) |
Health Insurance Coverage by Citizenship Status in Shelton
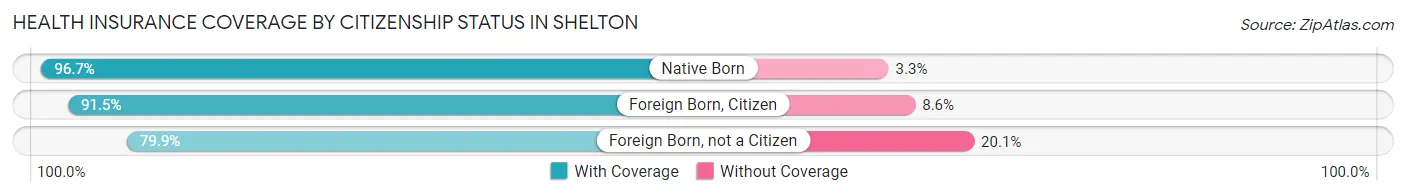
| Citizenship Status | With Coverage | Without Coverage |
| Native Born | 1,021 (96.7%) | 35 (3.3%) |
| Foreign Born, Citizen | 1,915 (91.4%) | 179 (8.6%) |
| Foreign Born, not a Citizen | 941 (79.9%) | 237 (20.1%) |
Health Insurance Coverage by Household Income in Shelton
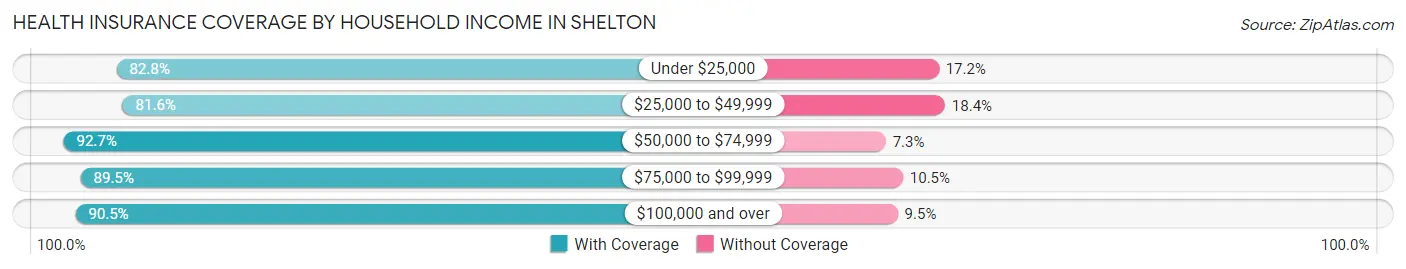
| Household Income | With Coverage | Without Coverage |
| Under $25,000 | 1,687 (82.8%) | 351 (17.2%) |
| $25,000 to $49,999 | 1,328 (81.6%) | 299 (18.4%) |
| $50,000 to $74,999 | 1,436 (92.7%) | 113 (7.3%) |
| $75,000 to $99,999 | 912 (89.5%) | 107 (10.5%) |
| $100,000 and over | 3,464 (90.5%) | 365 (9.5%) |
Public vs Private Health Insurance Coverage by Age in Shelton
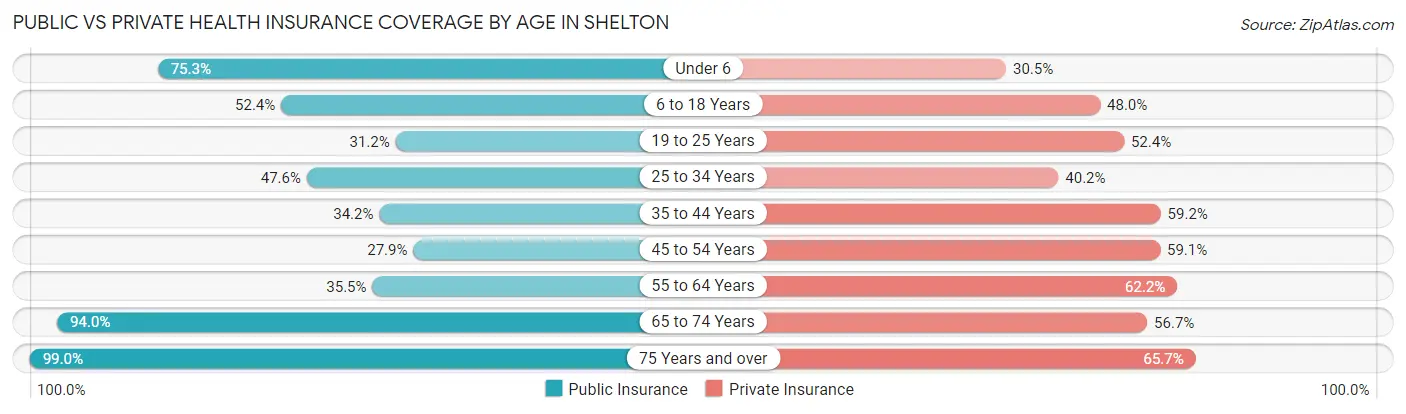
| Age Bracket | Public Insurance | Private Insurance |
| Under 6 | 795 (75.3%) | 322 (30.5%) |
| 6 to 18 Years | 1,097 (52.4%) | 1,004 (47.9%) |
| 19 to 25 Years | 367 (31.1%) | 617 (52.4%) |
| 25 to 34 Years | 629 (47.6%) | 531 (40.2%) |
| 35 to 44 Years | 437 (34.2%) | 757 (59.2%) |
| 45 to 54 Years | 275 (27.9%) | 583 (59.1%) |
| 55 to 64 Years | 352 (35.4%) | 618 (62.2%) |
| 65 to 74 Years | 640 (94.0%) | 386 (56.7%) |
| 75 Years and over | 620 (99.0%) | 411 (65.6%) |
| Total | 5,212 (51.0%) | 5,229 (51.2%) |
Disability Status by Sex by Age in Shelton
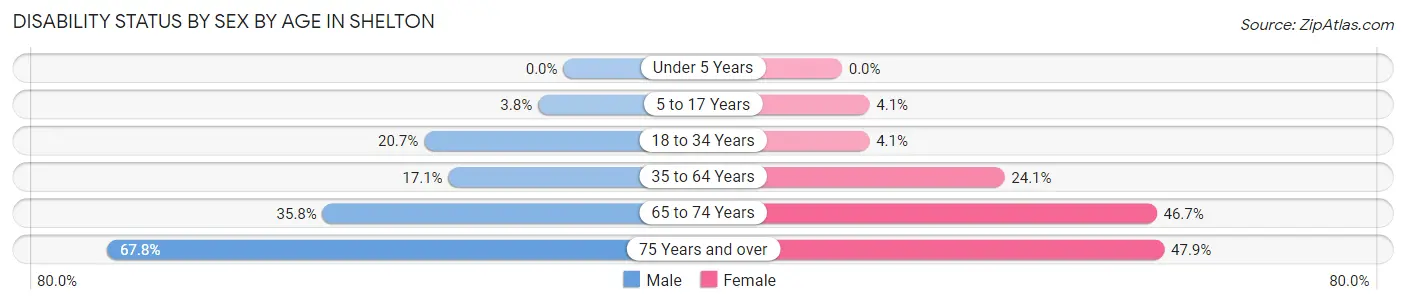
| Age Bracket | Male | Female |
| Under 5 Years | 0 (0.0%) | 0 (0.0%) |
| 5 to 17 Years | 39 (3.8%) | 44 (4.1%) |
| 18 to 34 Years | 263 (20.7%) | 55 (4.1%) |
| 35 to 64 Years | 287 (17.1%) | 381 (24.1%) |
| 65 to 74 Years | 79 (35.7%) | 215 (46.7%) |
| 75 Years and over | 124 (67.8%) | 212 (47.9%) |
Disability Class by Sex by Age in Shelton
Disability Class: Hearing Difficulty
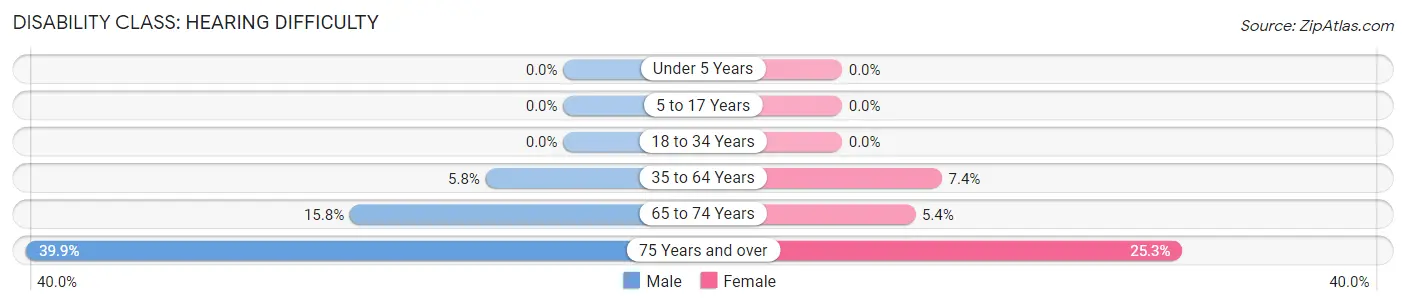
| Age Bracket | Male | Female |
| Under 5 Years | 0 (0.0%) | 0 (0.0%) |
| 5 to 17 Years | 0 (0.0%) | 0 (0.0%) |
| 18 to 34 Years | 0 (0.0%) | 0 (0.0%) |
| 35 to 64 Years | 97 (5.8%) | 117 (7.4%) |
| 65 to 74 Years | 35 (15.8%) | 25 (5.4%) |
| 75 Years and over | 73 (39.9%) | 112 (25.3%) |
Disability Class: Vision Difficulty
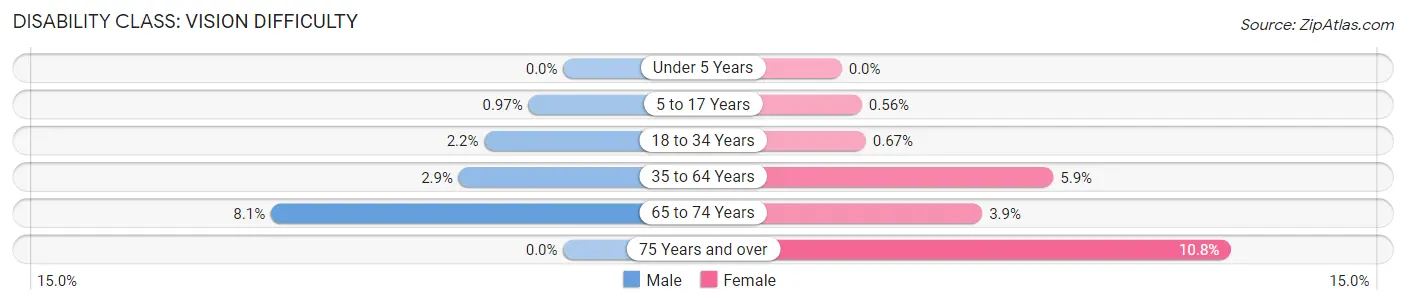
| Age Bracket | Male | Female |
| Under 5 Years | 0 (0.0%) | 0 (0.0%) |
| 5 to 17 Years | 10 (1.0%) | 6 (0.6%) |
| 18 to 34 Years | 28 (2.2%) | 9 (0.7%) |
| 35 to 64 Years | 49 (2.9%) | 93 (5.9%) |
| 65 to 74 Years | 18 (8.1%) | 18 (3.9%) |
| 75 Years and over | 0 (0.0%) | 48 (10.8%) |
Disability Class: Cognitive Difficulty
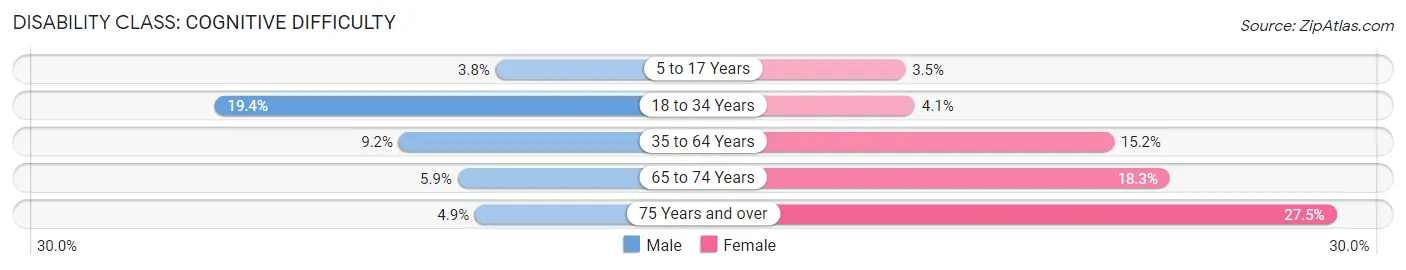
| Age Bracket | Male | Female |
| 5 to 17 Years | 39 (3.8%) | 38 (3.5%) |
| 18 to 34 Years | 247 (19.4%) | 55 (4.1%) |
| 35 to 64 Years | 154 (9.2%) | 239 (15.1%) |
| 65 to 74 Years | 13 (5.9%) | 84 (18.3%) |
| 75 Years and over | 9 (4.9%) | 122 (27.5%) |
Disability Class: Ambulatory Difficulty
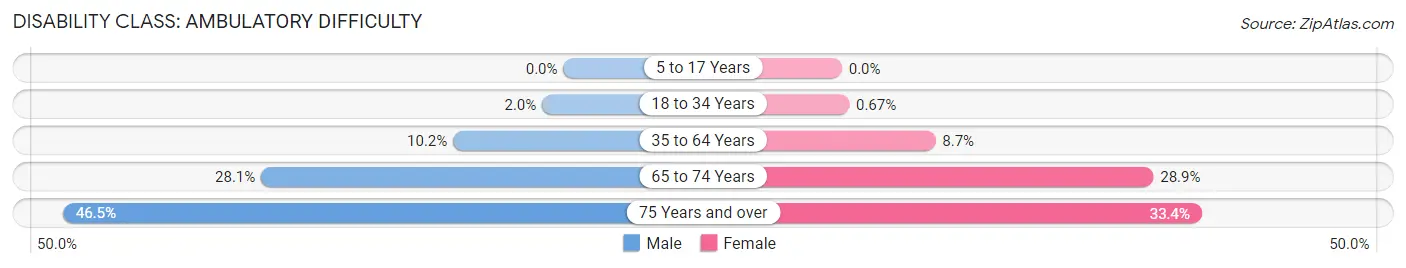
| Age Bracket | Male | Female |
| 5 to 17 Years | 0 (0.0%) | 0 (0.0%) |
| 18 to 34 Years | 25 (2.0%) | 9 (0.7%) |
| 35 to 64 Years | 172 (10.2%) | 137 (8.7%) |
| 65 to 74 Years | 62 (28.1%) | 133 (28.9%) |
| 75 Years and over | 85 (46.5%) | 148 (33.4%) |
Disability Class: Self-Care Difficulty
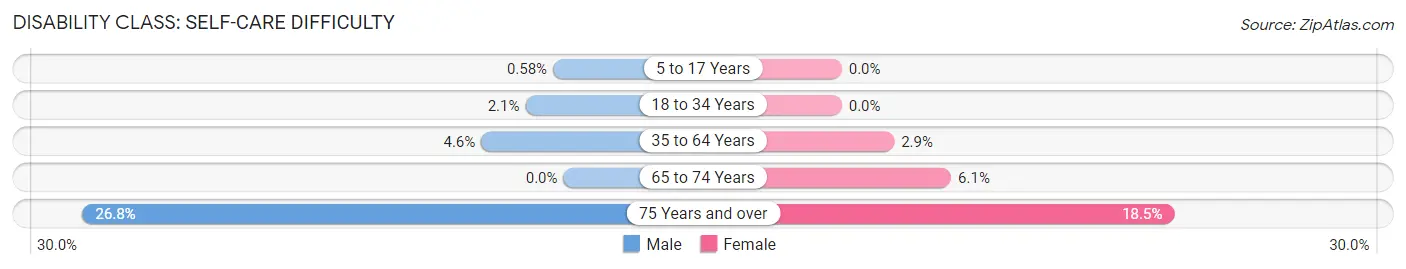
| Age Bracket | Male | Female |
| 5 to 17 Years | 6 (0.6%) | 0 (0.0%) |
| 18 to 34 Years | 27 (2.1%) | 0 (0.0%) |
| 35 to 64 Years | 77 (4.6%) | 46 (2.9%) |
| 65 to 74 Years | 0 (0.0%) | 28 (6.1%) |
| 75 Years and over | 49 (26.8%) | 82 (18.5%) |
Technology Access in Shelton
Computing Device Access in Shelton
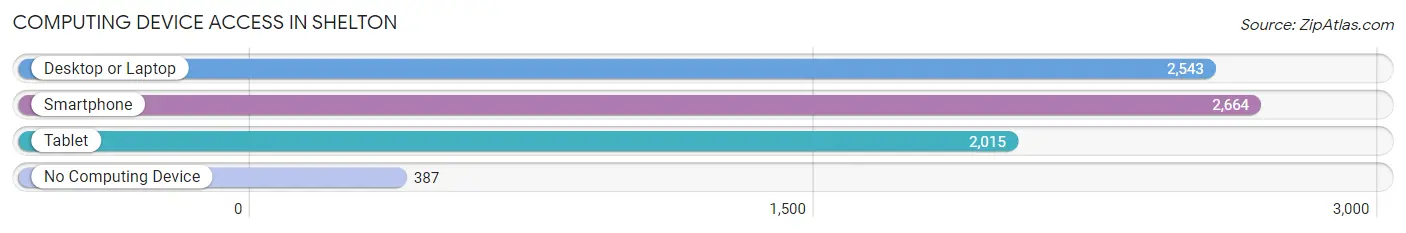
| Device Type | # Households | % Households |
| Desktop or Laptop | 2,543 | 73.5% |
| Smartphone | 2,664 | 77.0% |
| Tablet | 2,015 | 58.2% |
| No Computing Device | 387 | 11.2% |
| Total | 3,461 | 100.0% |
Internet Access in Shelton
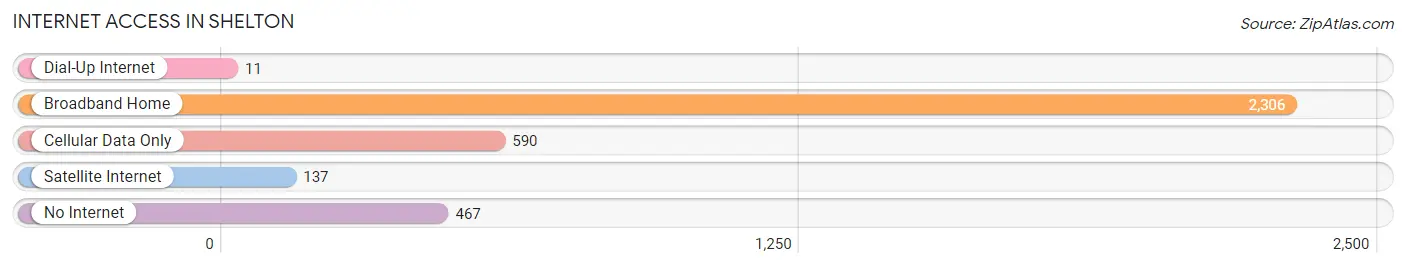
| Internet Type | # Households | % Households |
| Dial-Up Internet | 11 | 0.3% |
| Broadband Home | 2,306 | 66.6% |
| Cellular Data Only | 590 | 17.1% |
| Satellite Internet | 137 | 4.0% |
| No Internet | 467 | 13.5% |
| Total | 3,461 | 100.0% |
Shelton Summary
Shelton is a city located in Mason County, Washington, United States. It is the county seat of Mason County and is located in the Puget Sound region of the state. The population was 9,834 at the 2010 census. Shelton is the largest city in Mason County and is the home of the Squaxin Island Tribe.
History
The area that is now Shelton was first inhabited by the Squaxin Island Tribe, who lived in the area for thousands of years before the arrival of European settlers. The first European settlers arrived in the area in the late 1850s and established a small logging community. The town was officially incorporated in 1890 and was named after David Shelton, a local businessman and landowner.
In the early 1900s, the town began to grow rapidly as the timber industry flourished in the area. The town was home to several sawmills and logging camps, and the population grew to over 3,000 by the 1920s. The timber industry continued to be the main source of employment in the area until the 1970s, when the industry began to decline.
In the late 20th century, Shelton began to diversify its economy and focus on other industries such as tourism, manufacturing, and retail. The city has also become a popular destination for outdoor recreation, with several parks and trails located in the area.
Geography
Shelton is located in the Puget Sound region of Washington, approximately 60 miles south of Seattle. The city is situated on the western shore of the Olympic Peninsula, at the mouth of the Skokomish River. The city is surrounded by forests and mountains, and is located near several lakes and rivers.
The city has a total area of 8.3 square miles, of which 8.2 square miles is land and 0.1 square miles is water. The city is located at an elevation of approximately 200 feet above sea level.
Economy
Shelton’s economy is largely based on the timber industry, which has been the main source of employment in the area for over a century. The city is home to several sawmills and logging camps, and the timber industry continues to be a major employer in the area.
In addition to the timber industry, Shelton is also home to several manufacturing companies, including a paper mill and a boat building company. The city is also home to several retail stores, restaurants, and other businesses.
The city is also a popular destination for outdoor recreation, with several parks and trails located in the area. The city is home to several marinas, and is a popular destination for fishing, boating, and other water activities.
Demographics
As of the 2010 census, the population of Shelton was 9,834. The racial makeup of the city was 87.3% White, 0.7% African American, 2.2% Native American, 0.7% Asian, 0.1% Pacific Islander, 5.2% from other races, and 3.9% from two or more races. Hispanic or Latino of any race were 10.2% of the population.
The median household income in Shelton was $41,945, and the median family income was $50,945. The per capita income for the city was $20,945. About 14.3% of the population was below the poverty line.
Conclusion
Shelton is a city located in Mason County, Washington, United States. It is the county seat of Mason County and is located in the Puget Sound region of the state. The city has a long history of timber production, but has diversified its economy in recent years to include other industries such as tourism, manufacturing, and retail. The population of Shelton was 9,834 at the 2010 census, and the median household income was $41,945. The city is a popular destination for outdoor recreation, with several parks and trails located in the area.
Common Questions
What is Per Capita Income in Shelton?
Per Capita income in Shelton is $24,852.
What is the Median Family Income in Shelton?
Median Family Income in Shelton is $64,659.
What is the Median Household income in Shelton?
Median Household Income in Shelton is $57,907.
What is Income or Wage Gap in Shelton?
Income or Wage Gap in Shelton is 14.4%.
Women in Shelton earn 85.6 cents for every dollar earned by a man.
What is Inequality or Gini Index in Shelton?
Inequality or Gini Index in Shelton is 0.44.
What is the Total Population of Shelton?
Total Population of Shelton is 10,484.
What is the Total Male Population of Shelton?
Total Male Population of Shelton is 5,025.
What is the Total Female Population of Shelton?
Total Female Population of Shelton is 5,459.
What is the Ratio of Males per 100 Females in Shelton?
There are 92.05 Males per 100 Females in Shelton.
What is the Ratio of Females per 100 Males in Shelton?
There are 108.64 Females per 100 Males in Shelton.
What is the Median Population Age in Shelton?
Median Population Age in Shelton is 31.2 Years.
What is the Average Family Size in Shelton
Average Family Size in Shelton is 3.6 People.
What is the Average Household Size in Shelton
Average Household Size in Shelton is 2.9 People.
How Large is the Labor Force in Shelton?
There are 4,489 People in the Labor Forcein in Shelton.
What is the Percentage of People in the Labor Force in Shelton?
57.5% of People are in the Labor Force in Shelton.
What is the Unemployment Rate in Shelton?
Unemployment Rate in Shelton is 5.2%.