Kalama, WA Map & Demographics
Kalama Map
Kalama Overview
$45,813
PER CAPITA INCOME
$128,477
AVG FAMILY INCOME
$100,600
AVG HOUSEHOLD INCOME
60.3%
WAGE / INCOME GAP [ % ]
39.7¢/ $1
WAGE / INCOME GAP [ $ ]
$11,145
FAMILY INCOME DEFICIT
0.43
INEQUALITY / GINI INDEX
2,952
TOTAL POPULATION
1,440
MALE POPULATION
1,512
FEMALE POPULATION
95.24
MALES / 100 FEMALES
105.00
FEMALES / 100 MALES
52.5
MEDIAN AGE
2.6
AVG FAMILY SIZE
2.2
AVG HOUSEHOLD SIZE
1,304
LABOR FORCE [ PEOPLE ]
51.9%
PERCENT IN LABOR FORCE
1.6%
UNEMPLOYMENT RATE
Kalama Zip Codes
Kalama Area Codes
Income in Kalama
Income Overview in Kalama
Per Capita Income in Kalama is $45,813, while median incomes of families and households are $128,477 and $100,600 respectively.
| Characteristic | Number | Measure |
| Per Capita Income | 2,952 | $45,813 |
| Median Family Income | 941 | $128,477 |
| Mean Family Income | 941 | $140,528 |
| Median Household Income | 1,332 | $100,600 |
| Mean Household Income | 1,332 | $113,555 |
| Income Deficit | 941 | $11,145 |
| Wage / Income Gap (%) | 2,952 | 60.33% |
| Wage / Income Gap ($) | 2,952 | 39.67¢ per $1 |
| Gini / Inequality Index | 2,952 | 0.43 |
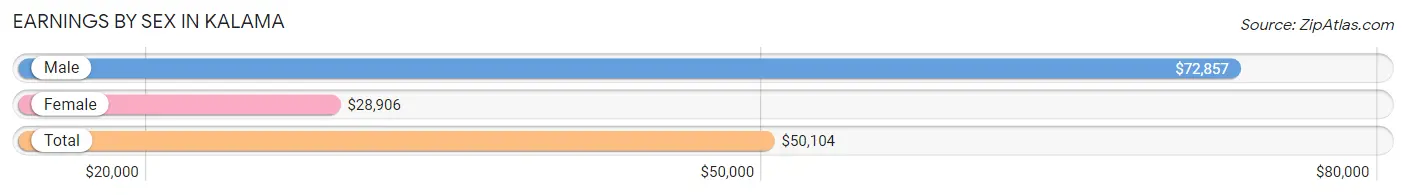
Earnings by Sex in Kalama
Average Earnings in Kalama are $50,104, $72,857 for men and $28,906 for women, a difference of 60.3%.
| Sex | Number | Average Earnings |
| Male | 786 (57.1%) | $72,857 |
| Female | 591 (42.9%) | $28,906 |
| Total | 1,377 (100.0%) | $50,104 |
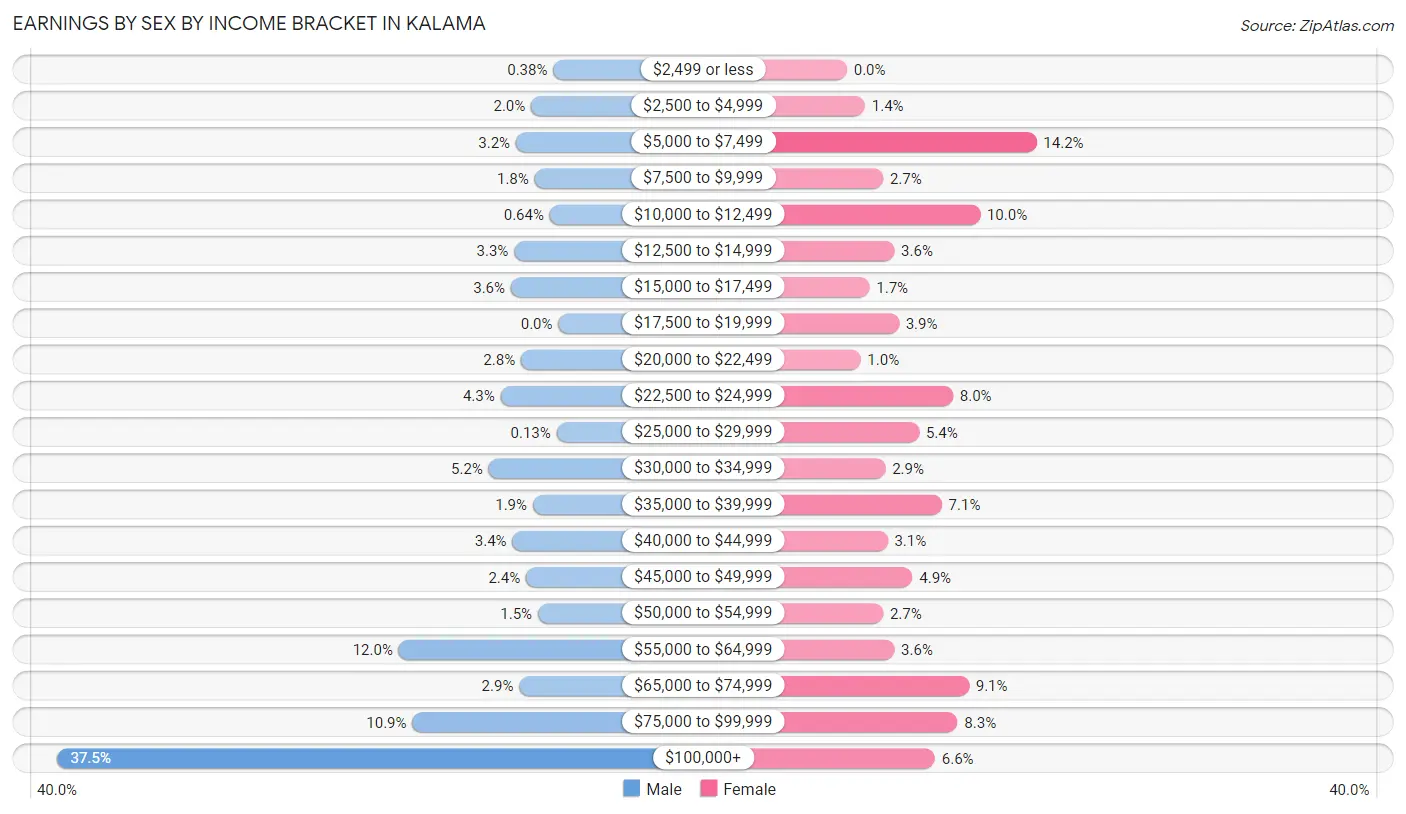
Earnings by Sex by Income Bracket in Kalama
The most common earnings brackets in Kalama are $100,000+ for men (295 | 37.5%) and $5,000 to $7,499 for women (84 | 14.2%).
| Income | Male | Female |
| $2,499 or less | 3 (0.4%) | 0 (0.0%) |
| $2,500 to $4,999 | 16 (2.0%) | 8 (1.3%) |
| $5,000 to $7,499 | 25 (3.2%) | 84 (14.2%) |
| $7,500 to $9,999 | 14 (1.8%) | 16 (2.7%) |
| $10,000 to $12,499 | 5 (0.6%) | 59 (10.0%) |
| $12,500 to $14,999 | 26 (3.3%) | 21 (3.5%) |
| $15,000 to $17,499 | 28 (3.6%) | 10 (1.7%) |
| $17,500 to $19,999 | 0 (0.0%) | 23 (3.9%) |
| $20,000 to $22,499 | 22 (2.8%) | 6 (1.0%) |
| $22,500 to $24,999 | 34 (4.3%) | 47 (8.0%) |
| $25,000 to $29,999 | 1 (0.1%) | 32 (5.4%) |
| $30,000 to $34,999 | 41 (5.2%) | 17 (2.9%) |
| $35,000 to $39,999 | 15 (1.9%) | 42 (7.1%) |
| $40,000 to $44,999 | 27 (3.4%) | 18 (3.0%) |
| $45,000 to $49,999 | 19 (2.4%) | 29 (4.9%) |
| $50,000 to $54,999 | 12 (1.5%) | 16 (2.7%) |
| $55,000 to $64,999 | 94 (12.0%) | 21 (3.5%) |
| $65,000 to $74,999 | 23 (2.9%) | 54 (9.1%) |
| $75,000 to $99,999 | 86 (10.9%) | 49 (8.3%) |
| $100,000+ | 295 (37.5%) | 39 (6.6%) |
| Total | 786 (100.0%) | 591 (100.0%) |
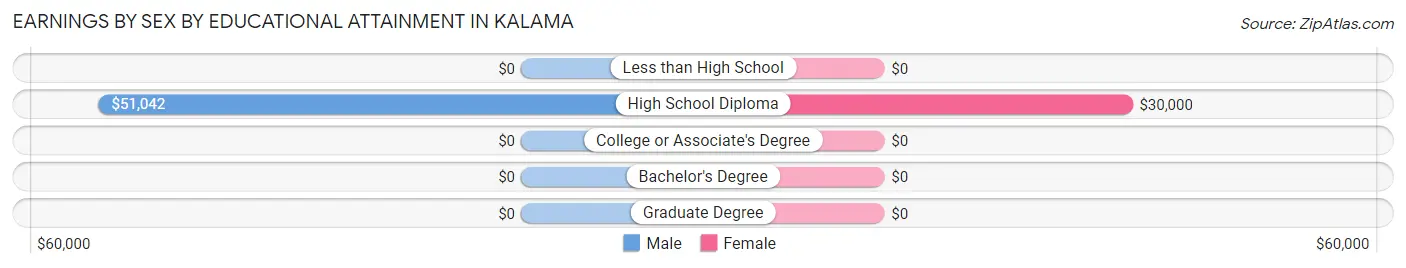
Earnings by Sex by Educational Attainment in Kalama
Average earnings in Kalama are $90,268 for men and $30,294 for women, a difference of 66.4%. Men with an educational attainment of high school diploma enjoy the highest average annual earnings of $51,042, while those with high school diploma education earn the least with $51,042. Women with an educational attainment of high school diploma earn the most with the average annual earnings of $30,000, while those with high school diploma education have the smallest earnings of $30,000.
| Educational Attainment | Male Income | Female Income |
| Less than High School | - | - |
| High School Diploma | $51,042 | $30,000 |
| College or Associate's Degree | - | - |
| Bachelor's Degree | - | - |
| Graduate Degree | - | - |
| Total | $90,268 | $30,294 |
Family Income in Kalama
Family Income Brackets in Kalama
According to the Kalama family income data, there are 326 families falling into the $150,000 to $199,999 income range, which is the most common income bracket and makes up 34.6% of all families. Conversely, the $10,000 to $14,999 income bracket is the least frequent group with only 11 families (1.2%) belonging to this category.
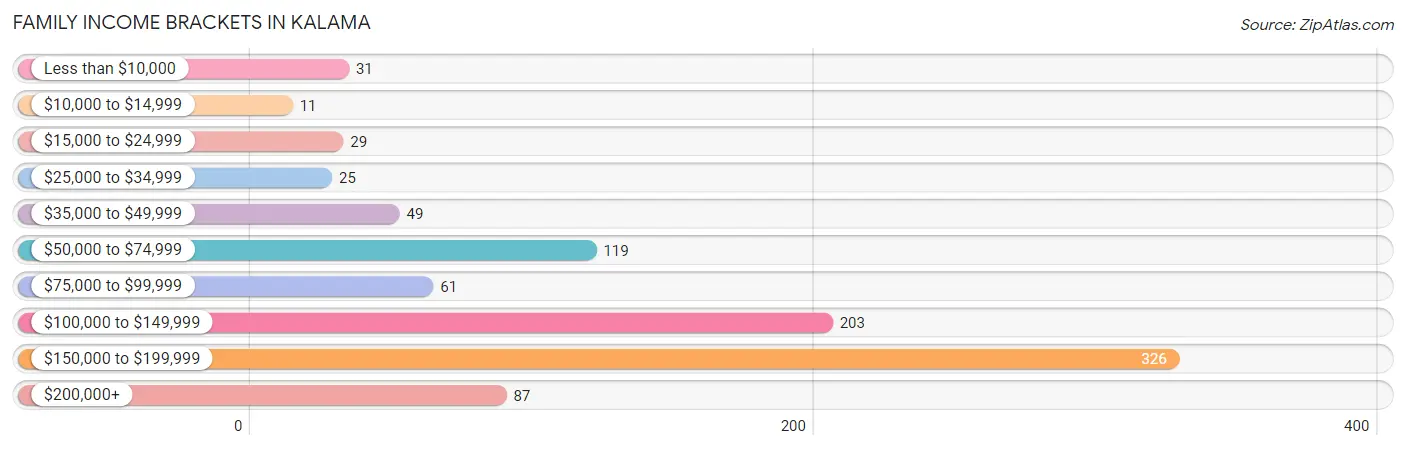
| Income Bracket | # Families | % Families |
| Less than $10,000 | 31 | 3.3% |
| $10,000 to $14,999 | 11 | 1.2% |
| $15,000 to $24,999 | 29 | 3.1% |
| $25,000 to $34,999 | 25 | 2.7% |
| $35,000 to $49,999 | 49 | 5.2% |
| $50,000 to $74,999 | 119 | 12.6% |
| $75,000 to $99,999 | 61 | 6.5% |
| $100,000 to $149,999 | 203 | 21.6% |
| $150,000 to $199,999 | 326 | 34.6% |
| $200,000+ | 87 | 9.2% |
Family Income by Famaliy Size in Kalama
2-person families (601 | 63.9%) account for the highest median family income in Kalama with $172,635 per family, while 2-person families (601 | 63.9%) have the highest median income of $86,318 per family member.
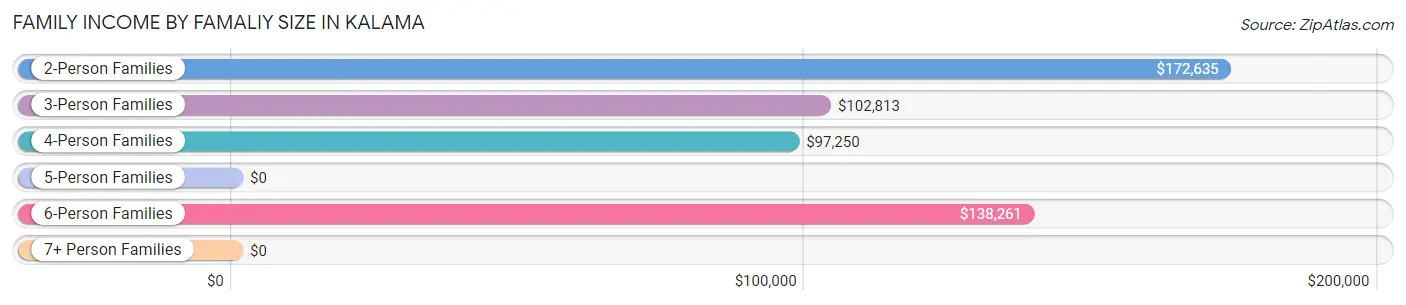
| Income Bracket | # Families | Median Income |
| 2-Person Families | 601 (63.9%) | $172,635 |
| 3-Person Families | 183 (19.5%) | $102,813 |
| 4-Person Families | 90 (9.6%) | $97,250 |
| 5-Person Families | 28 (3.0%) | $0 |
| 6-Person Families | 32 (3.4%) | $138,261 |
| 7+ Person Families | 7 (0.7%) | $0 |
| Total | 941 (100.0%) | $128,477 |
Family Income by Number of Earners in Kalama
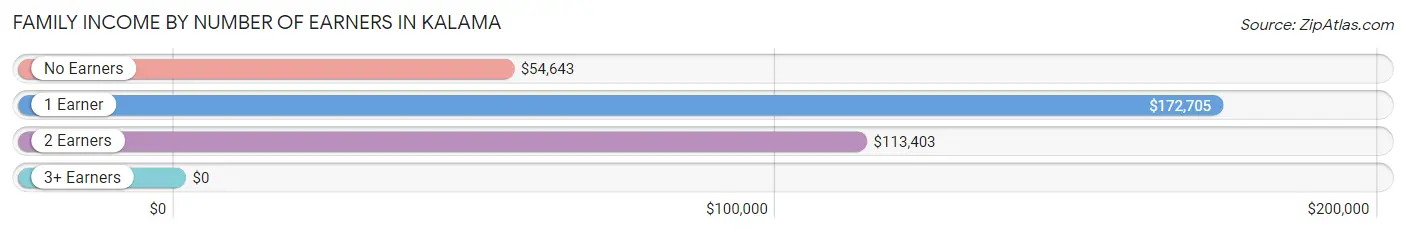
| Number of Earners | # Families | Median Income |
| No Earners | 142 (15.1%) | $54,643 |
| 1 Earner | 436 (46.3%) | $172,705 |
| 2 Earners | 347 (36.9%) | $113,403 |
| 3+ Earners | 16 (1.7%) | $0 |
| Total | 941 (100.0%) | $128,477 |
Household Income in Kalama
Household Income Brackets in Kalama
With 326 households falling in the category, the $150,000 to $199,999 income range is the most frequent in Kalama, accounting for 24.5% of all households. In contrast, only 21 households (1.6%) fall into the $10,000 to $14,999 income bracket, making it the least populous group.
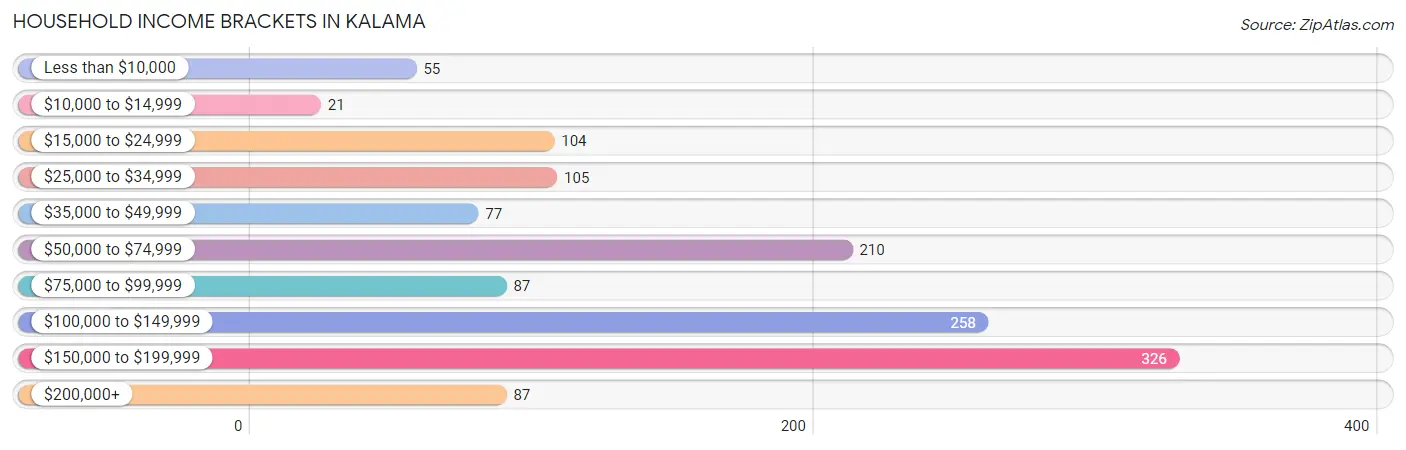
| Income Bracket | # Households | % Households |
| Less than $10,000 | 55 | 4.1% |
| $10,000 to $14,999 | 21 | 1.6% |
| $15,000 to $24,999 | 104 | 7.8% |
| $25,000 to $34,999 | 105 | 7.9% |
| $35,000 to $49,999 | 77 | 5.8% |
| $50,000 to $74,999 | 210 | 15.8% |
| $75,000 to $99,999 | 87 | 6.5% |
| $100,000 to $149,999 | 258 | 19.4% |
| $150,000 to $199,999 | 326 | 24.5% |
| $200,000+ | 87 | 6.5% |
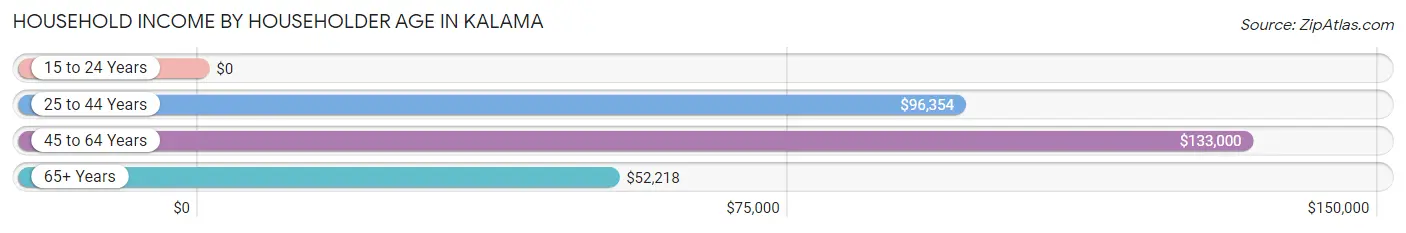
Household Income by Householder Age in Kalama
The median household income in Kalama is $100,600, with the highest median household income of $133,000 found in the 45 to 64 years age bracket for the primary householder. A total of 634 households (47.6%) fall into this category. Meanwhile, the 15 to 24 years age bracket for the primary householder has the lowest median household income of $0, with 37 households (2.8%) in this group.
| Income Bracket | # Households | Median Income |
| 15 to 24 Years | 37 (2.8%) | $0 |
| 25 to 44 Years | 266 (20.0%) | $96,354 |
| 45 to 64 Years | 634 (47.6%) | $133,000 |
| 65+ Years | 395 (29.6%) | $52,218 |
| Total | 1,332 (100.0%) | $100,600 |
Poverty in Kalama
Income Below Poverty by Sex and Age in Kalama
With 9.7% poverty level for males and 13.1% for females among the residents of Kalama, 18 to 24 year old males and 18 to 24 year old females are the most vulnerable to poverty, with 19 males (43.2%) and 12 females (32.4%) in their respective age groups living below the poverty level.
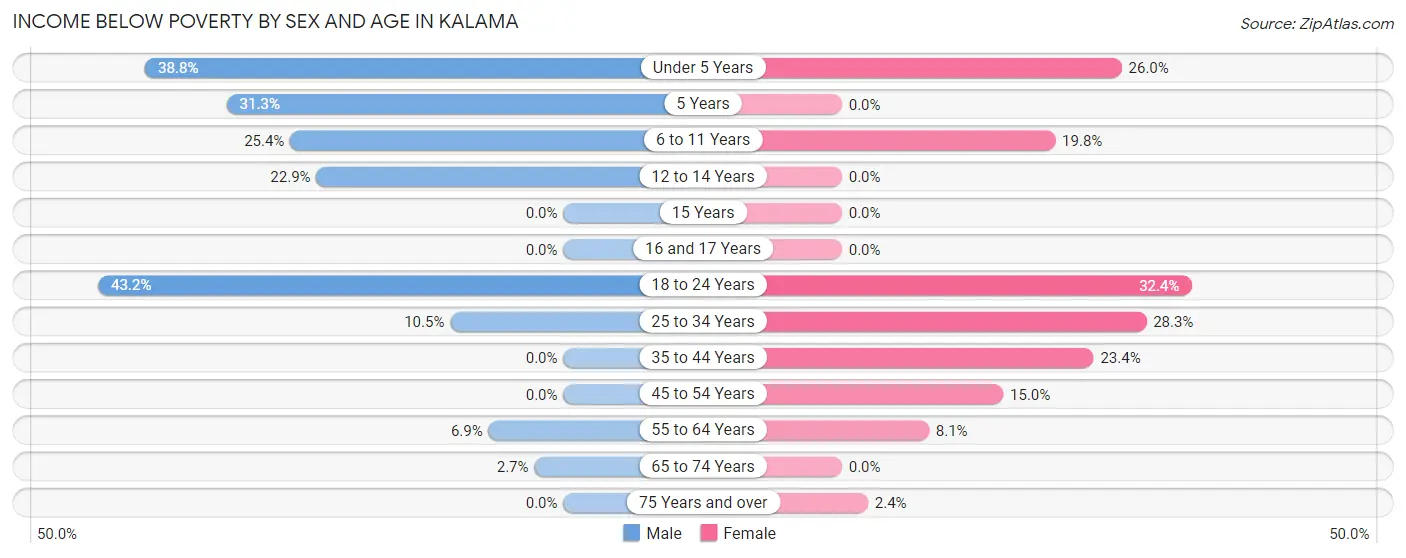
| Age Bracket | Male | Female |
| Under 5 Years | 33 (38.8%) | 20 (26.0%) |
| 5 Years | 10 (31.2%) | 0 (0.0%) |
| 6 to 11 Years | 18 (25.4%) | 20 (19.8%) |
| 12 to 14 Years | 11 (22.9%) | 0 (0.0%) |
| 15 Years | 0 (0.0%) | 0 (0.0%) |
| 16 and 17 Years | 0 (0.0%) | 0 (0.0%) |
| 18 to 24 Years | 19 (43.2%) | 12 (32.4%) |
| 25 to 34 Years | 19 (10.5%) | 50 (28.2%) |
| 35 to 44 Years | 0 (0.0%) | 32 (23.4%) |
| 45 to 54 Years | 0 (0.0%) | 28 (15.0%) |
| 55 to 64 Years | 24 (6.9%) | 32 (8.1%) |
| 65 to 74 Years | 5 (2.7%) | 0 (0.0%) |
| 75 Years and over | 0 (0.0%) | 4 (2.4%) |
| Total | 139 (9.7%) | 198 (13.1%) |
Income Above Poverty by Sex and Age in Kalama
According to the poverty statistics in Kalama, males aged 15 years and females aged 5 years are the age groups that are most secure financially, with 100.0% of males and 100.0% of females in these age groups living above the poverty line.
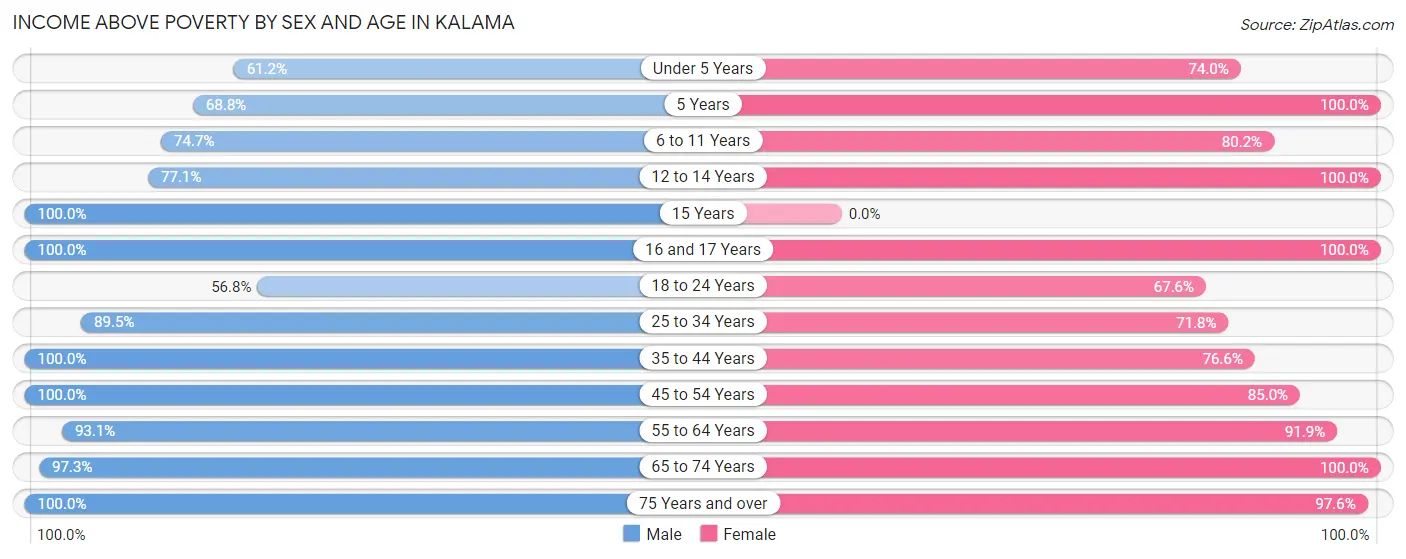
| Age Bracket | Male | Female |
| Under 5 Years | 52 (61.2%) | 57 (74.0%) |
| 5 Years | 22 (68.8%) | 3 (100.0%) |
| 6 to 11 Years | 53 (74.7%) | 81 (80.2%) |
| 12 to 14 Years | 37 (77.1%) | 9 (100.0%) |
| 15 Years | 9 (100.0%) | 0 (0.0%) |
| 16 and 17 Years | 70 (100.0%) | 42 (100.0%) |
| 18 to 24 Years | 25 (56.8%) | 25 (67.6%) |
| 25 to 34 Years | 162 (89.5%) | 127 (71.8%) |
| 35 to 44 Years | 114 (100.0%) | 105 (76.6%) |
| 45 to 54 Years | 127 (100.0%) | 159 (85.0%) |
| 55 to 64 Years | 322 (93.1%) | 364 (91.9%) |
| 65 to 74 Years | 181 (97.3%) | 181 (100.0%) |
| 75 Years and over | 122 (100.0%) | 161 (97.6%) |
| Total | 1,296 (90.3%) | 1,314 (86.9%) |
Income Below Poverty Among Married-Couple Families in Kalama
The poverty statistics for married-couple families in Kalama show that 3.1% or 25 of the total 818 families live below the poverty line. Families with 3 or 4 children have the highest poverty rate of 23.9%, comprising of 11 families. On the other hand, families with 5 or more children have the lowest poverty rate of 0.0%, which includes 0 families.
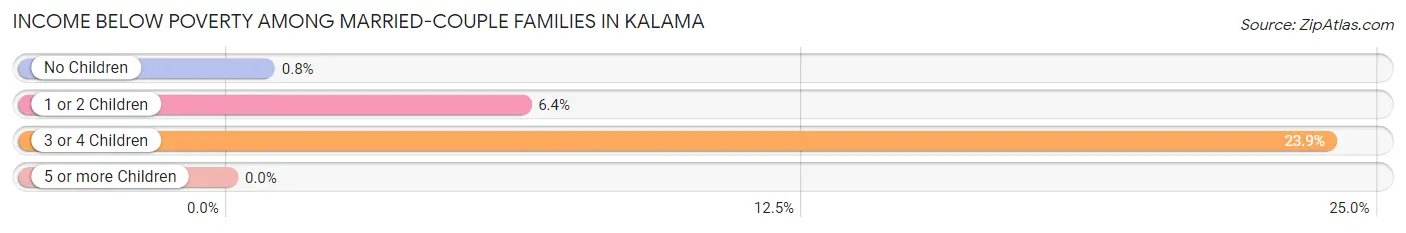
| Children | Above Poverty | Below Poverty |
| No Children | 619 (99.2%) | 5 (0.8%) |
| 1 or 2 Children | 132 (93.6%) | 9 (6.4%) |
| 3 or 4 Children | 35 (76.1%) | 11 (23.9%) |
| 5 or more Children | 7 (100.0%) | 0 (0.0%) |
| Total | 793 (96.9%) | 25 (3.1%) |
Income Below Poverty Among Single-Parent Households in Kalama
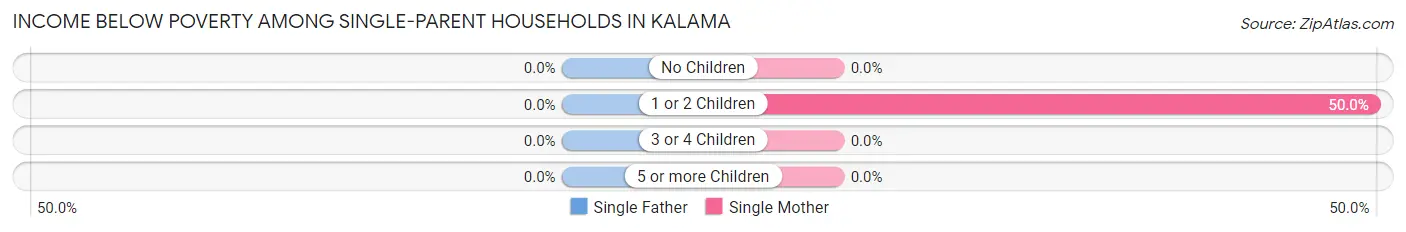
| Children | Single Father | Single Mother |
| No Children | 0 (0.0%) | 0 (0.0%) |
| 1 or 2 Children | 0 (0.0%) | 46 (50.0%) |
| 3 or 4 Children | 0 (0.0%) | 0 (0.0%) |
| 5 or more Children | 0 (0.0%) | 0 (0.0%) |
| Total | 0 (0.0%) | 46 (39.3%) |
Income Below Poverty Among Married-Couple vs Single-Parent Households in Kalama
The poverty data for Kalama shows that 25 of the married-couple family households (3.1%) and 46 of the single-parent households (37.4%) are living below the poverty level. Within the married-couple family households, those with 3 or 4 children have the highest poverty rate, with 11 households (23.9%) falling below the poverty line. Among the single-parent households, those with 1 or 2 children have the highest poverty rate, with 46 household (46.9%) living below poverty.
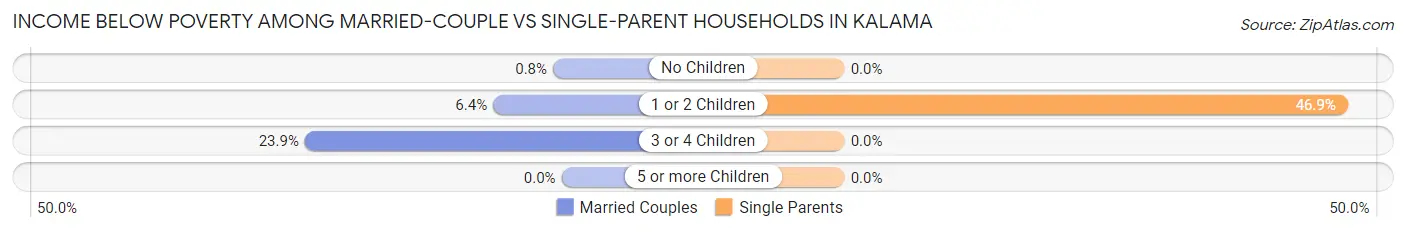
| Children | Married-Couple Families | Single-Parent Households |
| No Children | 5 (0.8%) | 0 (0.0%) |
| 1 or 2 Children | 9 (6.4%) | 46 (46.9%) |
| 3 or 4 Children | 11 (23.9%) | 0 (0.0%) |
| 5 or more Children | 0 (0.0%) | 0 (0.0%) |
| Total | 25 (3.1%) | 46 (37.4%) |
Race in Kalama
The most populous races in Kalama are White / Caucasian (2,365 | 80.1%), Two or more Races (426 | 14.4%), and Hispanic or Latino (326 | 11.0%).
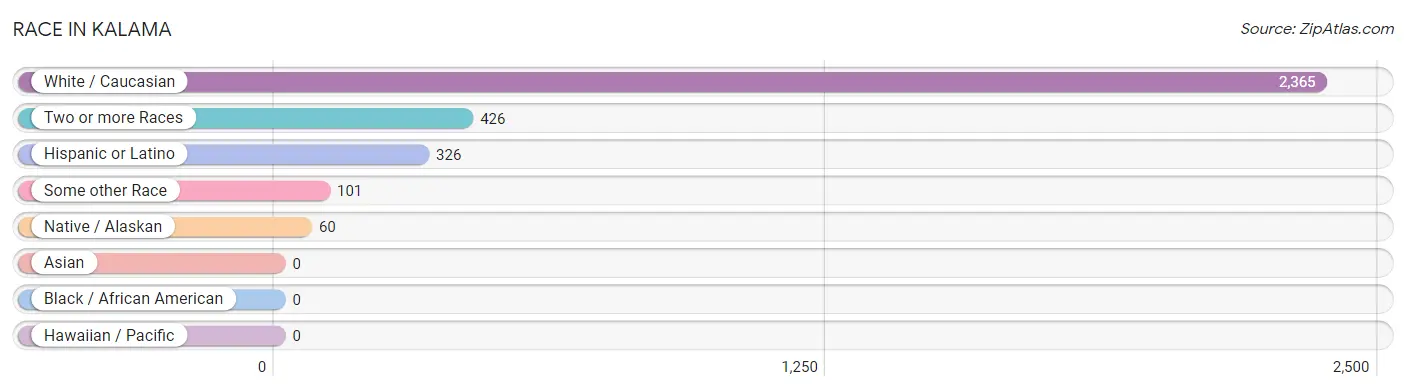
| Race | # Population | % Population |
| Asian | 0 | 0.0% |
| Black / African American | 0 | 0.0% |
| Hawaiian / Pacific | 0 | 0.0% |
| Hispanic or Latino | 326 | 11.0% |
| Native / Alaskan | 60 | 2.0% |
| White / Caucasian | 2,365 | 80.1% |
| Two or more Races | 426 | 14.4% |
| Some other Race | 101 | 3.4% |
| Total | 2,952 | 100.0% |
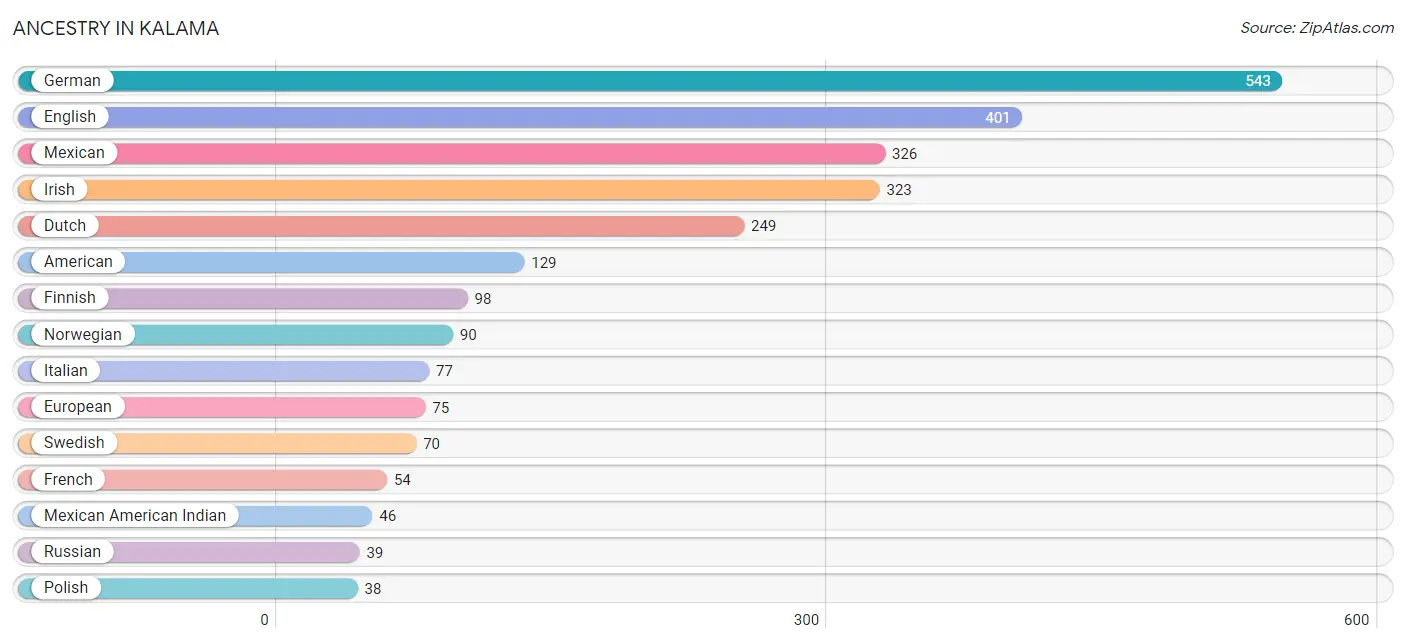
Ancestry in Kalama
The most populous ancestries reported in Kalama are German (543 | 18.4%), English (401 | 13.6%), Mexican (326 | 11.0%), Irish (323 | 10.9%), and Dutch (249 | 8.4%), together accounting for 62.4% of all Kalama residents.
| Ancestry | # Population | % Population |
| American | 129 | 4.4% |
| Austrian | 22 | 0.7% |
| Bhutanese | 4 | 0.1% |
| Blackfeet | 26 | 0.9% |
| British | 20 | 0.7% |
| Burmese | 6 | 0.2% |
| Cherokee | 18 | 0.6% |
| Croatian | 17 | 0.6% |
| Czech | 22 | 0.7% |
| Danish | 3 | 0.1% |
| Dutch | 249 | 8.4% |
| English | 401 | 13.6% |
| European | 75 | 2.5% |
| Finnish | 98 | 3.3% |
| French | 54 | 1.8% |
| French Canadian | 18 | 0.6% |
| German | 543 | 18.4% |
| Hungarian | 15 | 0.5% |
| Irish | 323 | 10.9% |
| Italian | 77 | 2.6% |
| Lithuanian | 16 | 0.5% |
| Mexican | 326 | 11.0% |
| Mexican American Indian | 46 | 1.6% |
| Norwegian | 90 | 3.0% |
| Polish | 38 | 1.3% |
| Portuguese | 15 | 0.5% |
| Russian | 39 | 1.3% |
| Scandinavian | 20 | 0.7% |
| Scotch-Irish | 21 | 0.7% |
| Scottish | 18 | 0.6% |
| Slovene | 16 | 0.5% |
| Swedish | 70 | 2.4% |
| Swiss | 24 | 0.8% |
| Yugoslavian | 3 | 0.1% | View All 34 Rows |
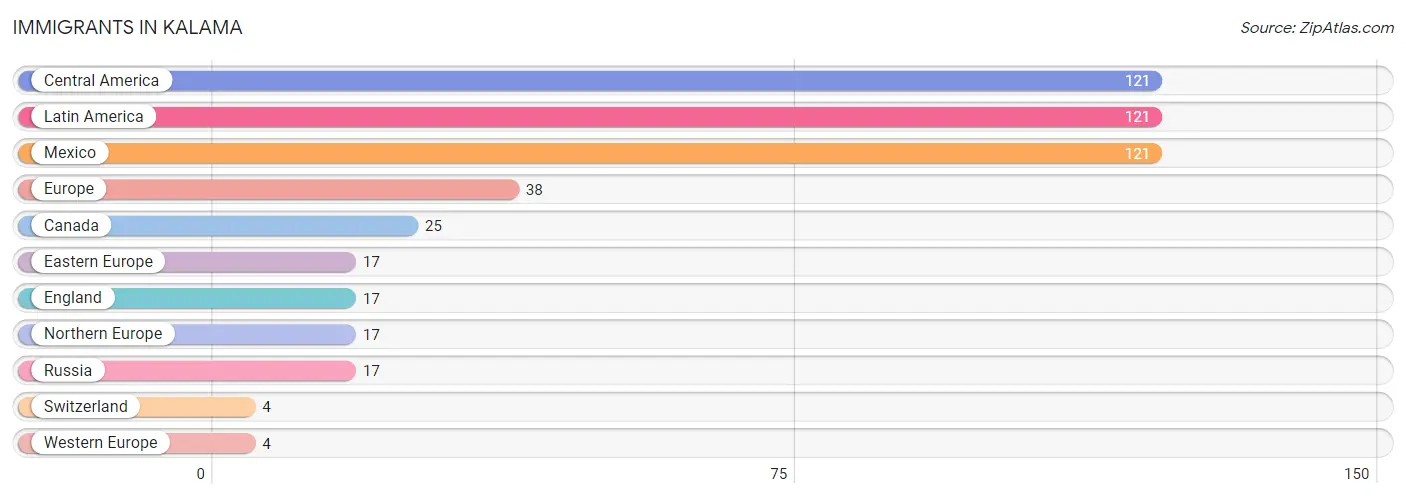
Immigrants in Kalama
The most numerous immigrant groups reported in Kalama came from Central America (121 | 4.1%), Latin America (121 | 4.1%), Mexico (121 | 4.1%), Europe (38 | 1.3%), and Canada (25 | 0.9%), together accounting for 14.4% of all Kalama residents.
| Immigration Origin | # Population | % Population |
| Canada | 25 | 0.9% |
| Central America | 121 | 4.1% |
| Eastern Europe | 17 | 0.6% |
| England | 17 | 0.6% |
| Europe | 38 | 1.3% |
| Latin America | 121 | 4.1% |
| Mexico | 121 | 4.1% |
| Northern Europe | 17 | 0.6% |
| Russia | 17 | 0.6% |
| Switzerland | 4 | 0.1% |
| Western Europe | 4 | 0.1% | View All 11 Rows |
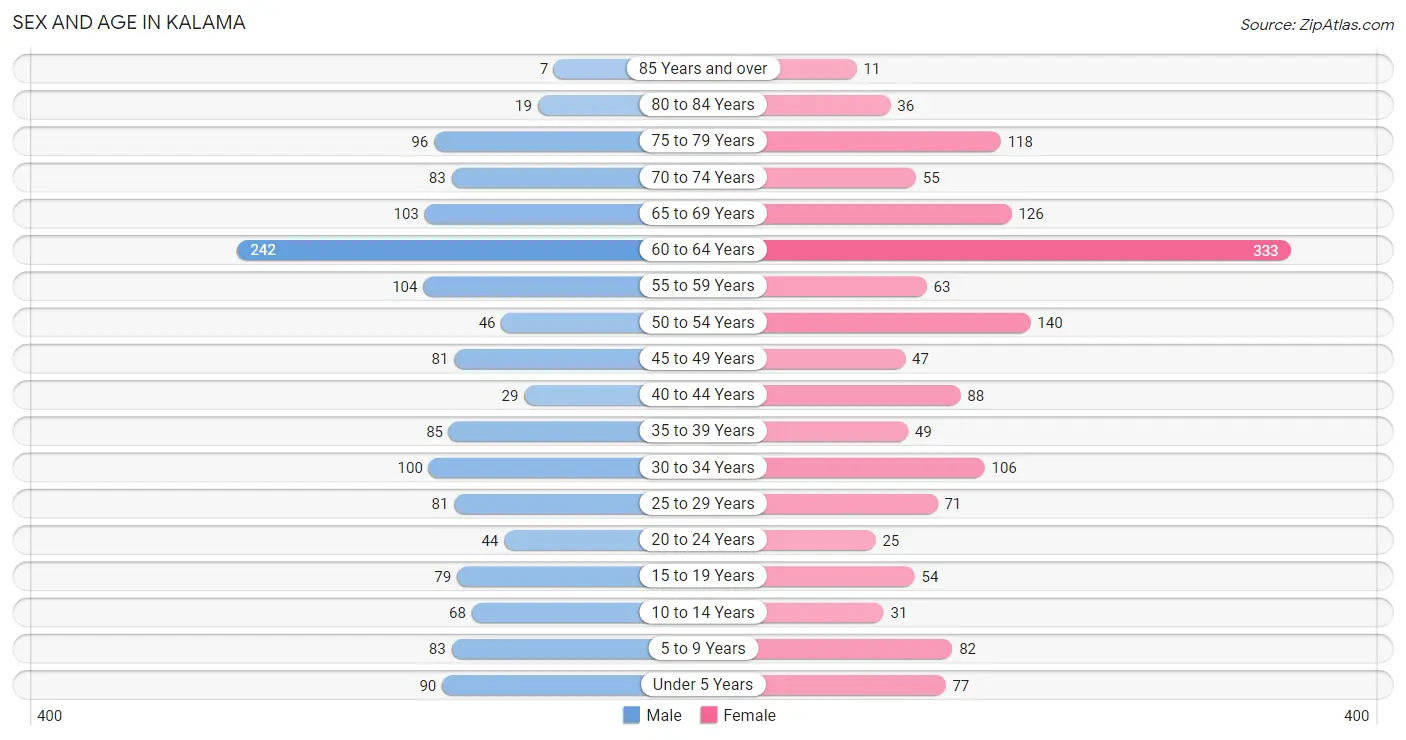
Sex and Age in Kalama
Sex and Age in Kalama
The most populous age groups in Kalama are 60 to 64 Years (242 | 16.8%) for men and 60 to 64 Years (333 | 22.0%) for women.
| Age Bracket | Male | Female |
| Under 5 Years | 90 (6.2%) | 77 (5.1%) |
| 5 to 9 Years | 83 (5.8%) | 82 (5.4%) |
| 10 to 14 Years | 68 (4.7%) | 31 (2.1%) |
| 15 to 19 Years | 79 (5.5%) | 54 (3.6%) |
| 20 to 24 Years | 44 (3.1%) | 25 (1.7%) |
| 25 to 29 Years | 81 (5.6%) | 71 (4.7%) |
| 30 to 34 Years | 100 (6.9%) | 106 (7.0%) |
| 35 to 39 Years | 85 (5.9%) | 49 (3.2%) |
| 40 to 44 Years | 29 (2.0%) | 88 (5.8%) |
| 45 to 49 Years | 81 (5.6%) | 47 (3.1%) |
| 50 to 54 Years | 46 (3.2%) | 140 (9.3%) |
| 55 to 59 Years | 104 (7.2%) | 63 (4.2%) |
| 60 to 64 Years | 242 (16.8%) | 333 (22.0%) |
| 65 to 69 Years | 103 (7.1%) | 126 (8.3%) |
| 70 to 74 Years | 83 (5.8%) | 55 (3.6%) |
| 75 to 79 Years | 96 (6.7%) | 118 (7.8%) |
| 80 to 84 Years | 19 (1.3%) | 36 (2.4%) |
| 85 Years and over | 7 (0.5%) | 11 (0.7%) |
| Total | 1,440 (100.0%) | 1,512 (100.0%) |
Families and Households in Kalama
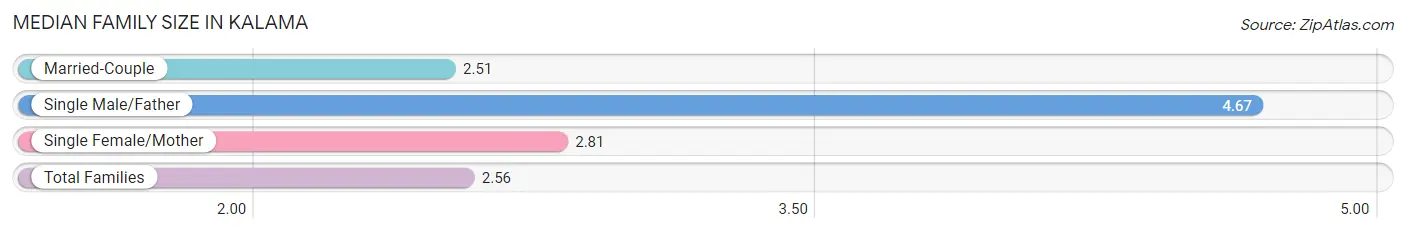
Median Family Size in Kalama
The median family size in Kalama is 2.56 persons per family, with single male/father families (6 | 0.6%) accounting for the largest median family size of 4.67 persons per family. On the other hand, married-couple families (818 | 86.9%) represent the smallest median family size with 2.51 persons per family.
| Family Type | # Families | Family Size |
| Married-Couple | 818 (86.9%) | 2.51 |
| Single Male/Father | 6 (0.6%) | 4.67 |
| Single Female/Mother | 117 (12.4%) | 2.81 |
| Total Families | 941 (100.0%) | 2.56 |
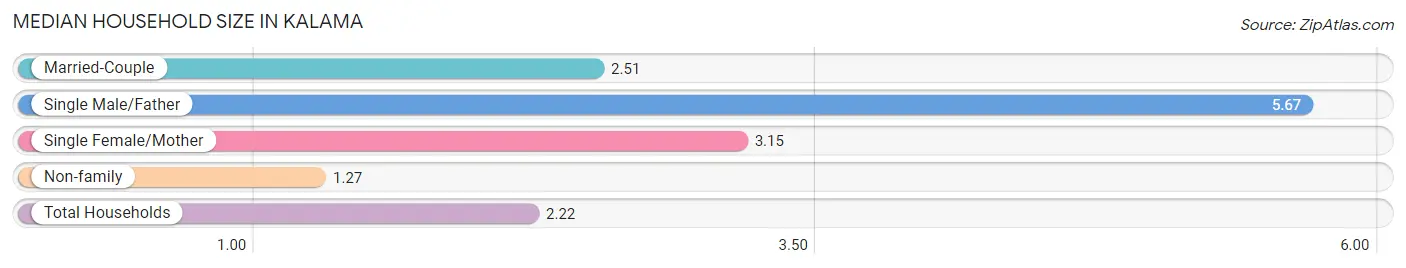
Median Household Size in Kalama
The median household size in Kalama is 2.22 persons per household, with single male/father households (6 | 0.4%) accounting for the largest median household size of 5.67 persons per household. non-family households (391 | 29.3%) represent the smallest median household size with 1.27 persons per household.
| Household Type | # Households | Household Size |
| Married-Couple | 818 (61.4%) | 2.51 |
| Single Male/Father | 6 (0.4%) | 5.67 |
| Single Female/Mother | 117 (8.8%) | 3.15 |
| Non-family | 391 (29.3%) | 1.27 |
| Total Households | 1,332 (100.0%) | 2.22 |
Household Size by Marriage Status in Kalama
Out of a total of 1,332 households in Kalama, 941 (70.7%) are family households, while 391 (29.3%) are nonfamily households. The most numerous type of family households are 2-person households, comprising 596, and the most common type of nonfamily households are 1-person households, comprising 298.
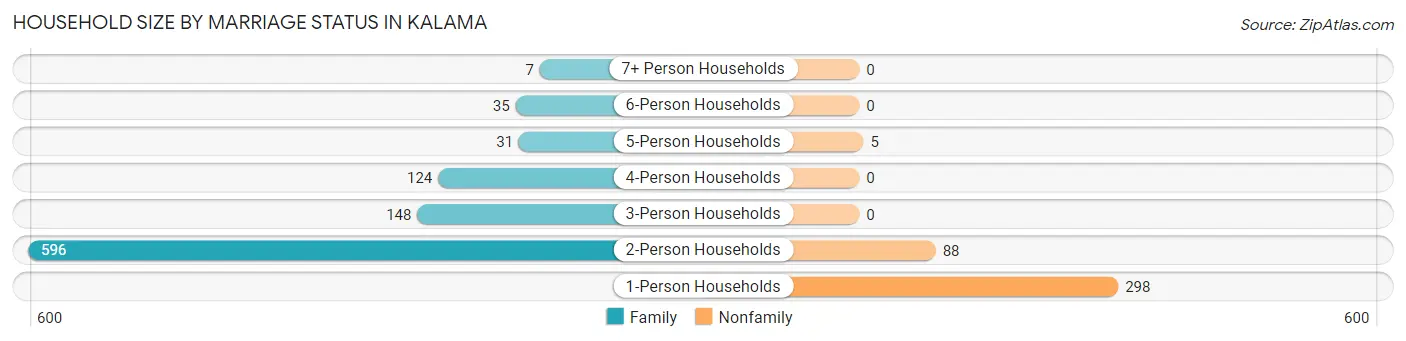
| Household Size | Family Households | Nonfamily Households |
| 1-Person Households | - | 298 (22.4%) |
| 2-Person Households | 596 (44.7%) | 88 (6.6%) |
| 3-Person Households | 148 (11.1%) | 0 (0.0%) |
| 4-Person Households | 124 (9.3%) | 0 (0.0%) |
| 5-Person Households | 31 (2.3%) | 5 (0.4%) |
| 6-Person Households | 35 (2.6%) | 0 (0.0%) |
| 7+ Person Households | 7 (0.5%) | 0 (0.0%) |
| Total | 941 (70.7%) | 391 (29.3%) |
Female Fertility in Kalama
Fertility by Age in Kalama
Average fertility rate in Kalama is 76.0 births per 1,000 women. Women in the age bracket of 20 to 34 years have the highest fertility rate with 173.0 births per 1,000 women. Women in the age bracket of 20 to 34 years acount for 89.7% of all women with births.
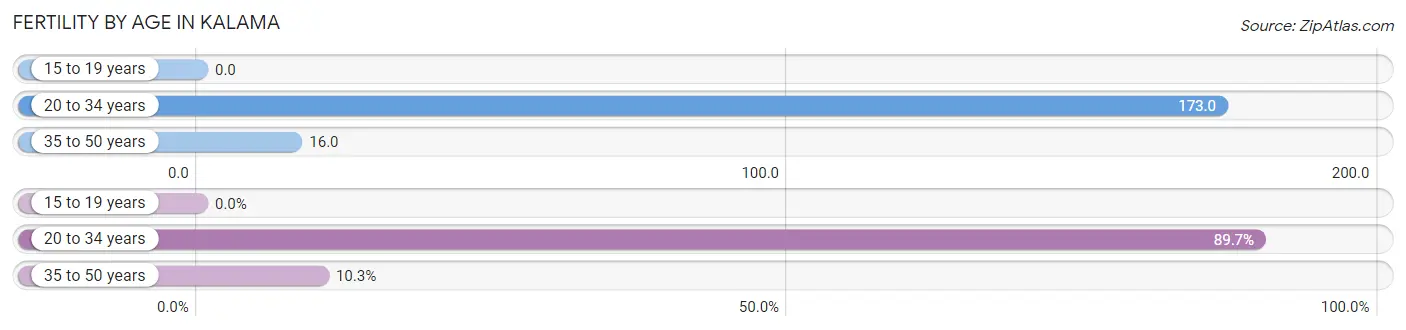
| Age Bracket | Women with Births | Births / 1,000 Women |
| 15 to 19 years | 0 (0.0%) | 0.0 |
| 20 to 34 years | 35 (89.7%) | 173.0 |
| 35 to 50 years | 4 (10.3%) | 16.0 |
| Total | 39 (100.0%) | 76.0 |
Fertility by Age by Marriage Status in Kalama
48.7% of women with births (39) in Kalama are married. The highest percentage of unmarried women with births falls into 20 to 34 years age bracket with 57.1% of them unmarried at the time of birth, while the lowest percentage of unmarried women with births belong to 35 to 50 years age bracket with 0.0% of them unmarried.
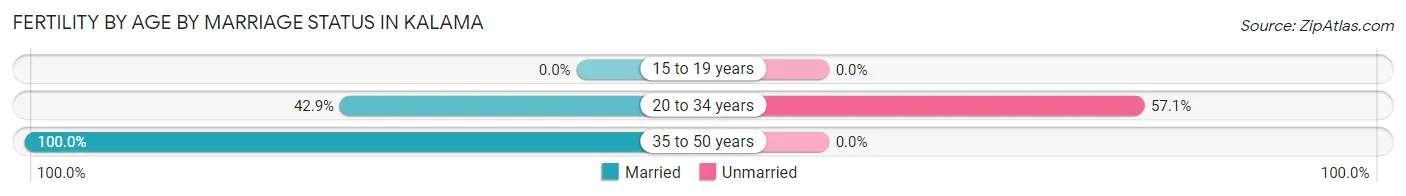
| Age Bracket | Married | Unmarried |
| 15 to 19 years | 0 (0.0%) | 0 (0.0%) |
| 20 to 34 years | 15 (42.9%) | 20 (57.1%) |
| 35 to 50 years | 4 (100.0%) | 0 (0.0%) |
| Total | 19 (48.7%) | 20 (51.3%) |
Fertility by Education in Kalama
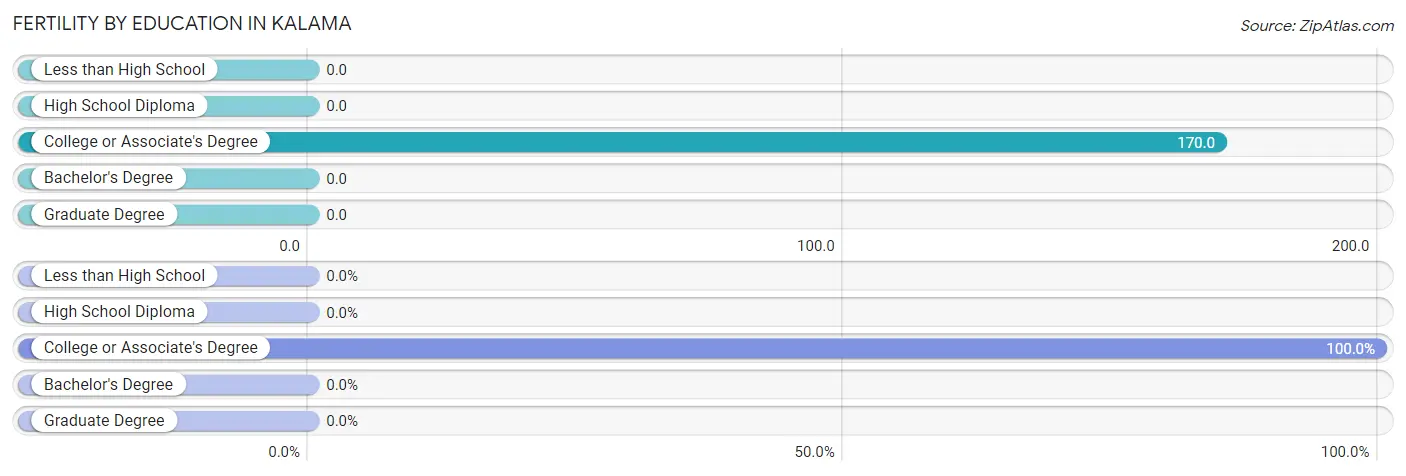
| Educational Attainment | Women with Births | Births / 1,000 Women |
| Less than High School | 0 (0.0%) | 0.0 |
| High School Diploma | 0 (0.0%) | 0.0 |
| College or Associate's Degree | 39 (100.0%) | 170.0 |
| Bachelor's Degree | 0 (0.0%) | 0.0 |
| Graduate Degree | 0 (0.0%) | 0.0 |
| Total | 39 (100.0%) | 76.0 |
Fertility by Education by Marriage Status in Kalama
51.3% of women with births in Kalama are unmarried. Women with the educational attainment of college or associate's degree are most likely to be married with 48.7% of them married at childbirth, while women with the educational attainment of college or associate's degree are least likely to be married with 51.3% of them unmarried at childbirth.
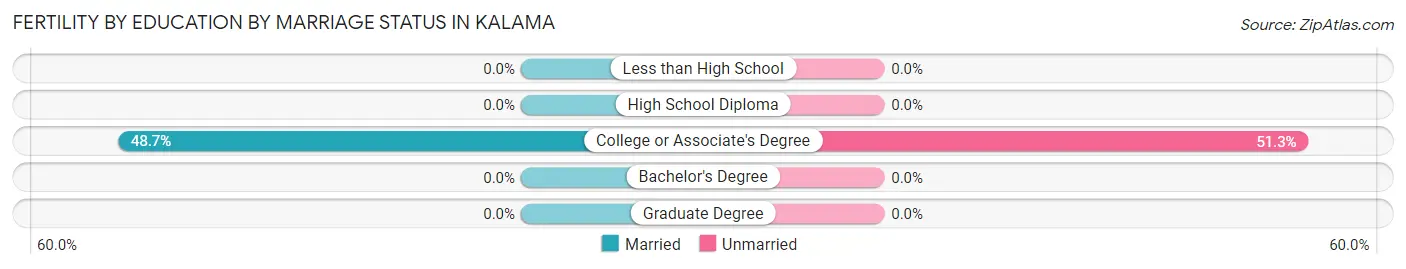
| Educational Attainment | Married | Unmarried |
| Less than High School | 0 (0.0%) | 0 (0.0%) |
| High School Diploma | 0 (0.0%) | 0 (0.0%) |
| College or Associate's Degree | 19 (48.7%) | 20 (51.3%) |
| Bachelor's Degree | 0 (0.0%) | 0 (0.0%) |
| Graduate Degree | 0 (0.0%) | 0 (0.0%) |
| Total | 19 (48.7%) | 20 (51.3%) |
Employment Characteristics in Kalama
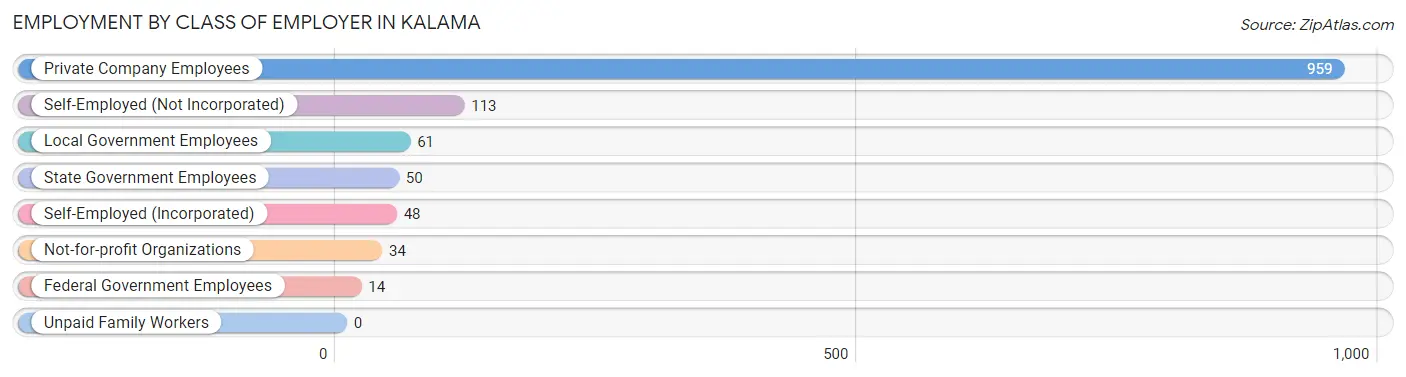
Employment by Class of Employer in Kalama
Among the 1,279 employed individuals in Kalama, private company employees (959 | 75.0%), self-employed (not incorporated) (113 | 8.8%), and local government employees (61 | 4.8%) make up the most common classes of employment.
| Employer Class | # Employees | % Employees |
| Private Company Employees | 959 | 75.0% |
| Self-Employed (Incorporated) | 48 | 3.7% |
| Self-Employed (Not Incorporated) | 113 | 8.8% |
| Not-for-profit Organizations | 34 | 2.7% |
| Local Government Employees | 61 | 4.8% |
| State Government Employees | 50 | 3.9% |
| Federal Government Employees | 14 | 1.1% |
| Unpaid Family Workers | 0 | 0.0% |
| Total | 1,279 | 100.0% |
Employment Status by Age in Kalama
According to the labor force statistics for Kalama, out of the total population over 16 years of age (2,512), 51.9% or 1,304 individuals are in the labor force, with 1.6% or 21 of them unemployed. The age group with the highest labor force participation rate is 35 to 44 years, with 91.2% or 229 individuals in the labor force. Within the labor force, the 55 to 59 years age range has the highest percentage of unemployed individuals, with 18.8% or 18 of them being unemployed.
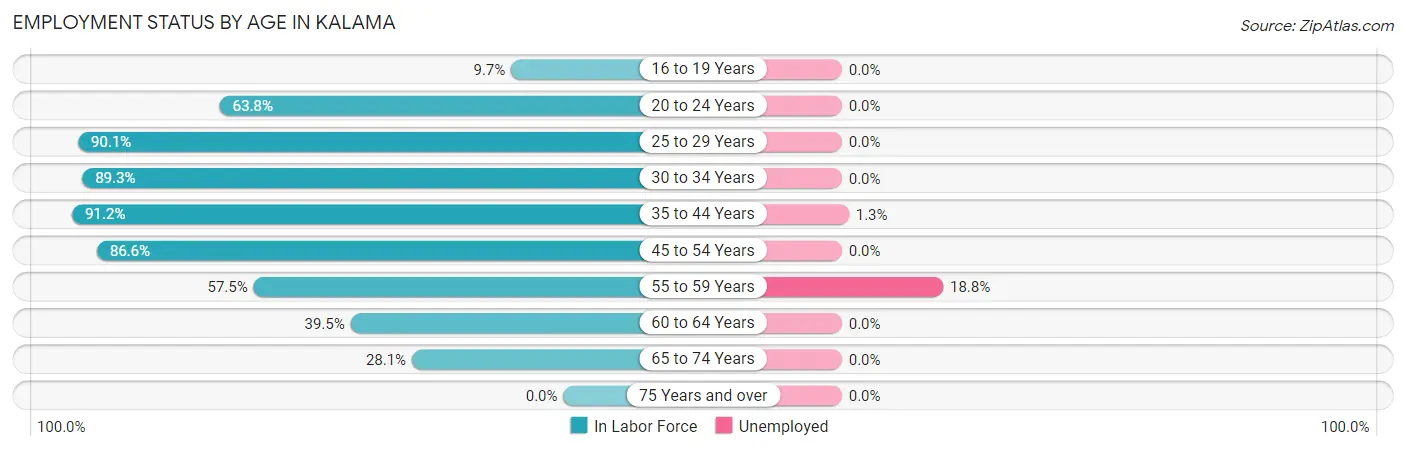
| Age Bracket | In Labor Force | Unemployed |
| 16 to 19 Years | 12 (9.7%) | 0 (0.0%) |
| 20 to 24 Years | 44 (63.8%) | 0 (0.0%) |
| 25 to 29 Years | 137 (90.1%) | 0 (0.0%) |
| 30 to 34 Years | 184 (89.3%) | 0 (0.0%) |
| 35 to 44 Years | 229 (91.2%) | 3 (1.3%) |
| 45 to 54 Years | 272 (86.6%) | 0 (0.0%) |
| 55 to 59 Years | 96 (57.5%) | 18 (18.8%) |
| 60 to 64 Years | 227 (39.5%) | 0 (0.0%) |
| 65 to 74 Years | 103 (28.1%) | 0 (0.0%) |
| 75 Years and over | 0 (0.0%) | 0 (0.0%) |
| Total | 1,304 (51.9%) | 21 (1.6%) |
Employment Status by Educational Attainment in Kalama
According to labor force statistics for Kalama, 68.8% of individuals (1,146) out of the total population between 25 and 64 years of age (1,665) are in the labor force, with 1.8% or 21 of them being unemployed. The group with the highest labor force participation rate are those with the educational attainment of bachelor's degree or higher, with 83.6% or 234 individuals in the labor force. Within the labor force, individuals with college / associate degree education have the highest percentage of unemployment, with 3.2% or 18 of them being unemployed.
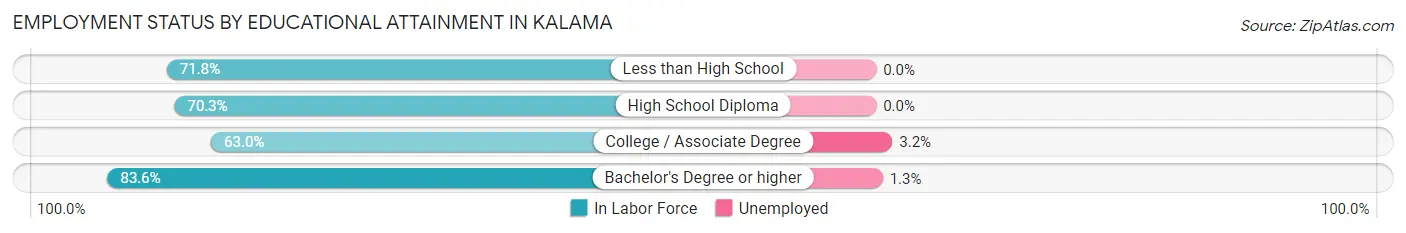
| Educational Attainment | In Labor Force | Unemployed |
| Less than High School | 102 (71.8%) | 0 (0.0%) |
| High School Diploma | 251 (70.3%) | 0 (0.0%) |
| College / Associate Degree | 558 (63.0%) | 28 (3.2%) |
| Bachelor's Degree or higher | 234 (83.6%) | 4 (1.3%) |
| Total | 1,146 (68.8%) | 30 (1.8%) |
Employment Occupations by Sex in Kalama
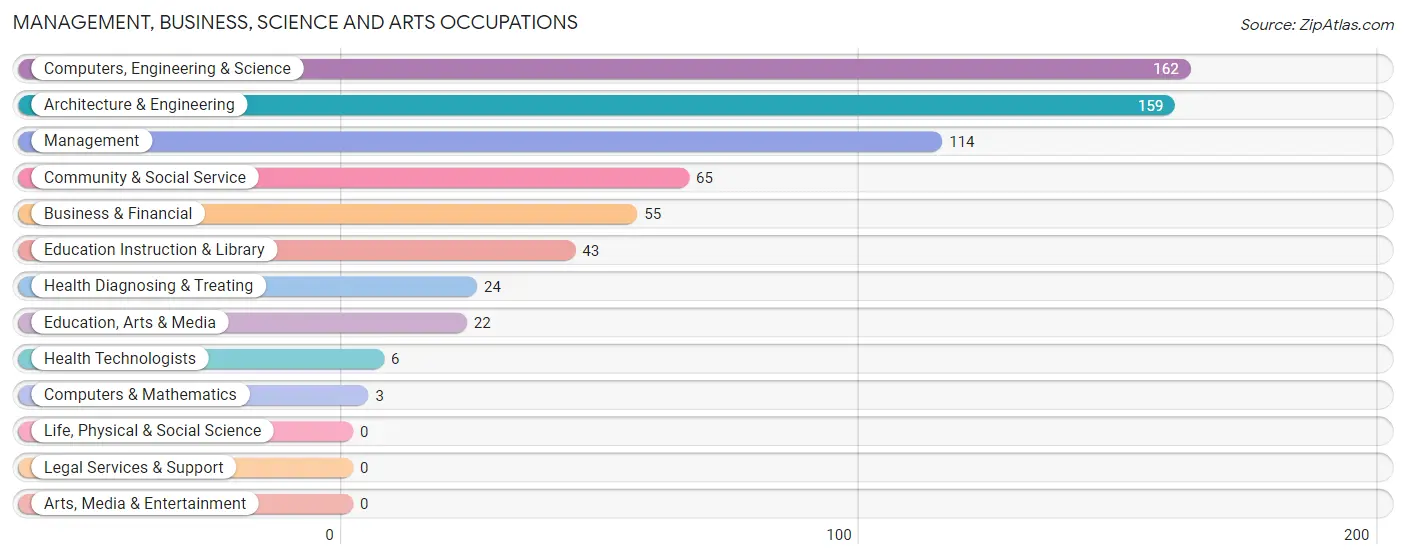
Management, Business, Science and Arts Occupations
The most common Management, Business, Science and Arts occupations in Kalama are Computers, Engineering & Science (162 | 12.6%), Architecture & Engineering (159 | 12.4%), Management (114 | 8.9%), Community & Social Service (65 | 5.1%), and Business & Financial (55 | 4.3%).
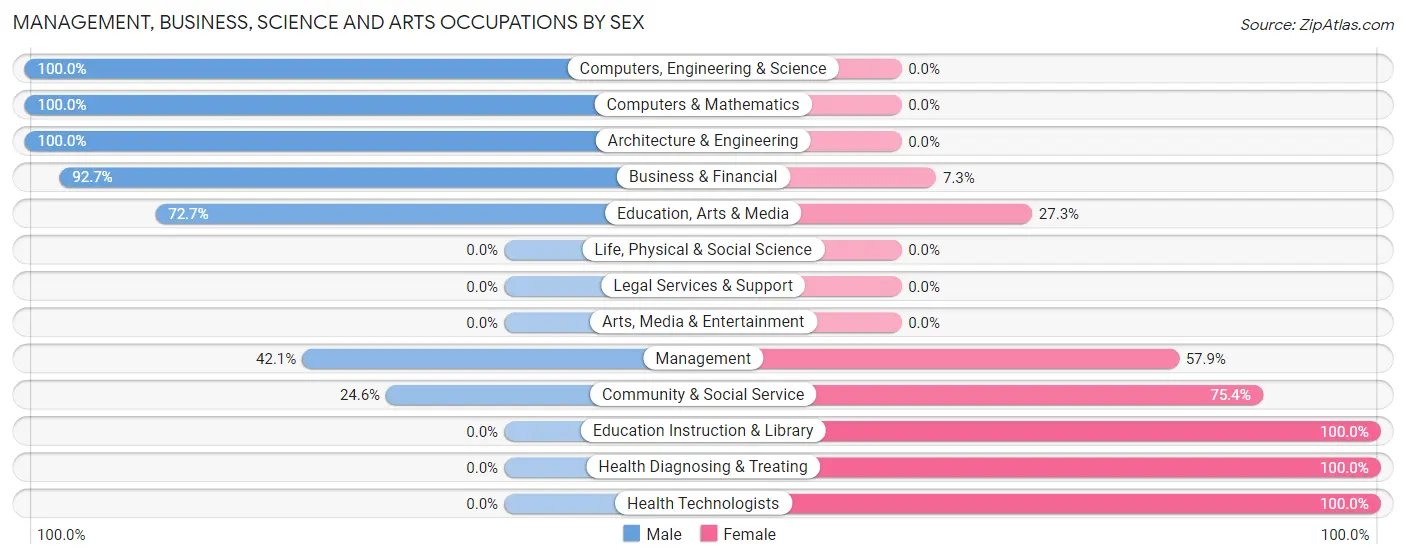
Management, Business, Science and Arts Occupations by Sex
Within the Management, Business, Science and Arts occupations in Kalama, the most male-oriented occupations are Computers, Engineering & Science (100.0%), Computers & Mathematics (100.0%), and Architecture & Engineering (100.0%), while the most female-oriented occupations are Education Instruction & Library (100.0%), Health Diagnosing & Treating (100.0%), and Health Technologists (100.0%).
| Occupation | Male | Female |
| Management | 48 (42.1%) | 66 (57.9%) |
| Business & Financial | 51 (92.7%) | 4 (7.3%) |
| Computers, Engineering & Science | 162 (100.0%) | 0 (0.0%) |
| Computers & Mathematics | 3 (100.0%) | 0 (0.0%) |
| Architecture & Engineering | 159 (100.0%) | 0 (0.0%) |
| Life, Physical & Social Science | 0 (0.0%) | 0 (0.0%) |
| Community & Social Service | 16 (24.6%) | 49 (75.4%) |
| Education, Arts & Media | 16 (72.7%) | 6 (27.3%) |
| Legal Services & Support | 0 (0.0%) | 0 (0.0%) |
| Education Instruction & Library | 0 (0.0%) | 43 (100.0%) |
| Arts, Media & Entertainment | 0 (0.0%) | 0 (0.0%) |
| Health Diagnosing & Treating | 0 (0.0%) | 24 (100.0%) |
| Health Technologists | 0 (0.0%) | 6 (100.0%) |
| Total (Category) | 277 (65.9%) | 143 (34.1%) |
| Total (Overall) | 730 (56.9%) | 553 (43.1%) |
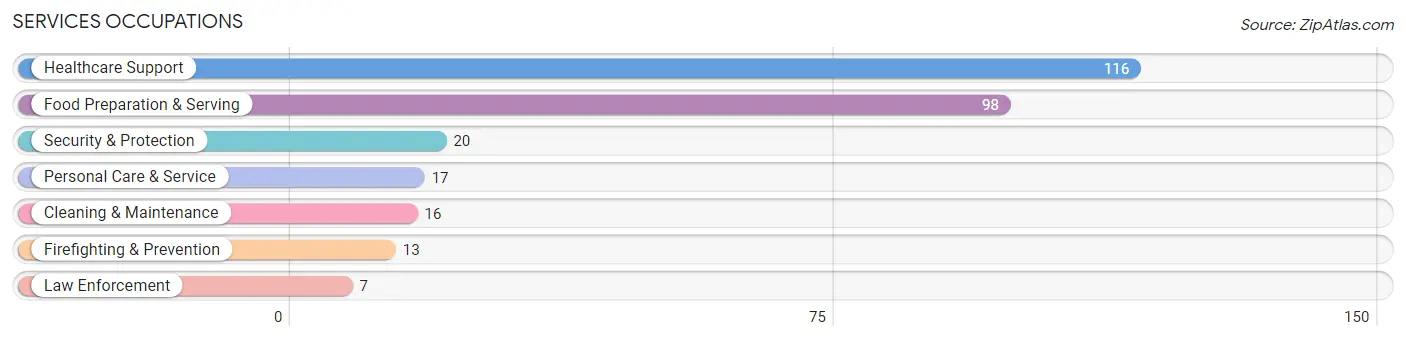
Services Occupations
The most common Services occupations in Kalama are Healthcare Support (116 | 9.0%), Food Preparation & Serving (98 | 7.6%), Security & Protection (20 | 1.6%), Personal Care & Service (17 | 1.3%), and Cleaning & Maintenance (16 | 1.3%).
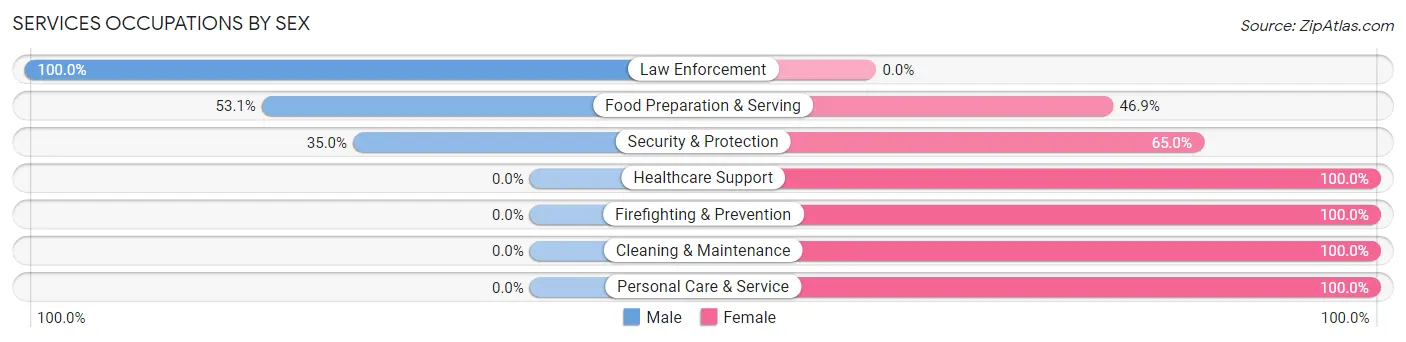
Services Occupations by Sex
Within the Services occupations in Kalama, the most male-oriented occupations are Law Enforcement (100.0%), Food Preparation & Serving (53.1%), and Security & Protection (35.0%), while the most female-oriented occupations are Healthcare Support (100.0%), Firefighting & Prevention (100.0%), and Cleaning & Maintenance (100.0%).
| Occupation | Male | Female |
| Healthcare Support | 0 (0.0%) | 116 (100.0%) |
| Security & Protection | 7 (35.0%) | 13 (65.0%) |
| Firefighting & Prevention | 0 (0.0%) | 13 (100.0%) |
| Law Enforcement | 7 (100.0%) | 0 (0.0%) |
| Food Preparation & Serving | 52 (53.1%) | 46 (46.9%) |
| Cleaning & Maintenance | 0 (0.0%) | 16 (100.0%) |
| Personal Care & Service | 0 (0.0%) | 17 (100.0%) |
| Total (Category) | 59 (22.1%) | 208 (77.9%) |
| Total (Overall) | 730 (56.9%) | 553 (43.1%) |
Sales and Office Occupations
The most common Sales and Office occupations in Kalama are Office & Administration (128 | 10.0%), and Sales & Related (115 | 9.0%).
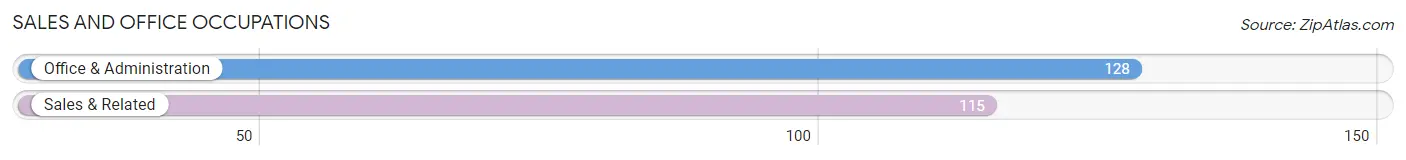
Sales and Office Occupations by Sex
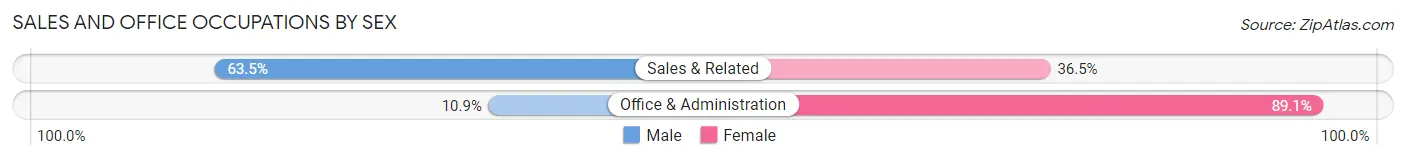
| Occupation | Male | Female |
| Sales & Related | 73 (63.5%) | 42 (36.5%) |
| Office & Administration | 14 (10.9%) | 114 (89.1%) |
| Total (Category) | 87 (35.8%) | 156 (64.2%) |
| Total (Overall) | 730 (56.9%) | 553 (43.1%) |
Natural Resources, Construction and Maintenance Occupations
The most common Natural Resources, Construction and Maintenance occupations in Kalama are Construction & Extraction (97 | 7.6%), and Installation, Maintenance & Repair (54 | 4.2%).
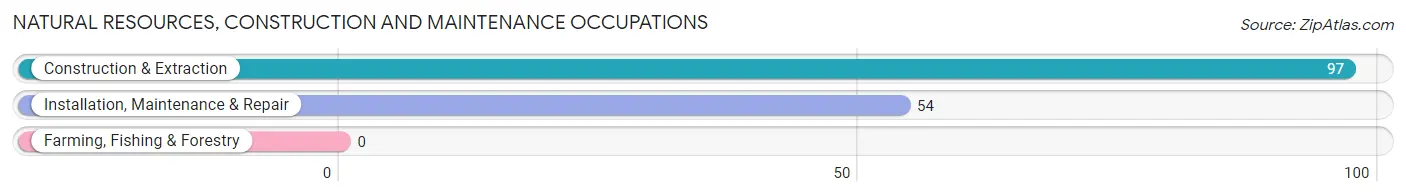
Natural Resources, Construction and Maintenance Occupations by Sex
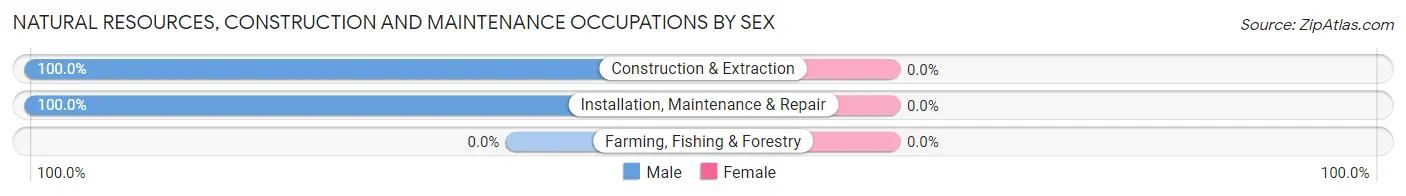
| Occupation | Male | Female |
| Farming, Fishing & Forestry | 0 (0.0%) | 0 (0.0%) |
| Construction & Extraction | 97 (100.0%) | 0 (0.0%) |
| Installation, Maintenance & Repair | 54 (100.0%) | 0 (0.0%) |
| Total (Category) | 151 (100.0%) | 0 (0.0%) |
| Total (Overall) | 730 (56.9%) | 553 (43.1%) |
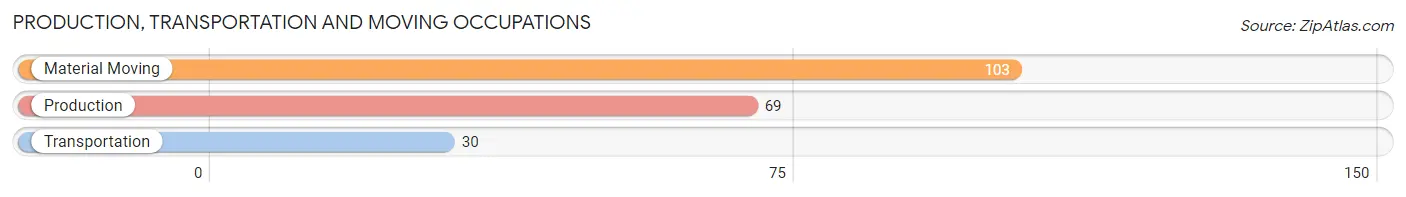
Production, Transportation and Moving Occupations
The most common Production, Transportation and Moving occupations in Kalama are Material Moving (103 | 8.0%), Production (69 | 5.4%), and Transportation (30 | 2.3%).
Production, Transportation and Moving Occupations by Sex
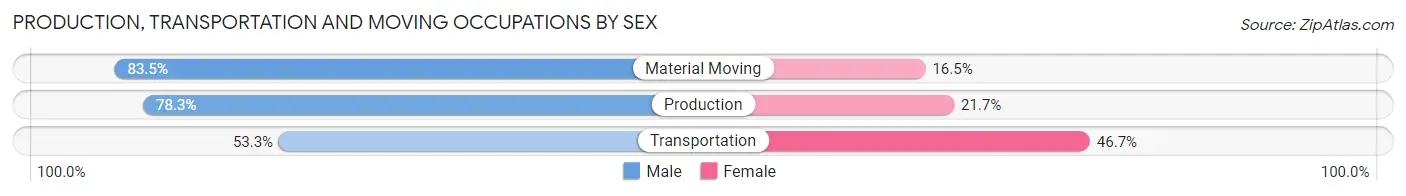
| Occupation | Male | Female |
| Production | 54 (78.3%) | 15 (21.7%) |
| Transportation | 16 (53.3%) | 14 (46.7%) |
| Material Moving | 86 (83.5%) | 17 (16.5%) |
| Total (Category) | 156 (77.2%) | 46 (22.8%) |
| Total (Overall) | 730 (56.9%) | 553 (43.1%) |
Employment Industries by Sex in Kalama
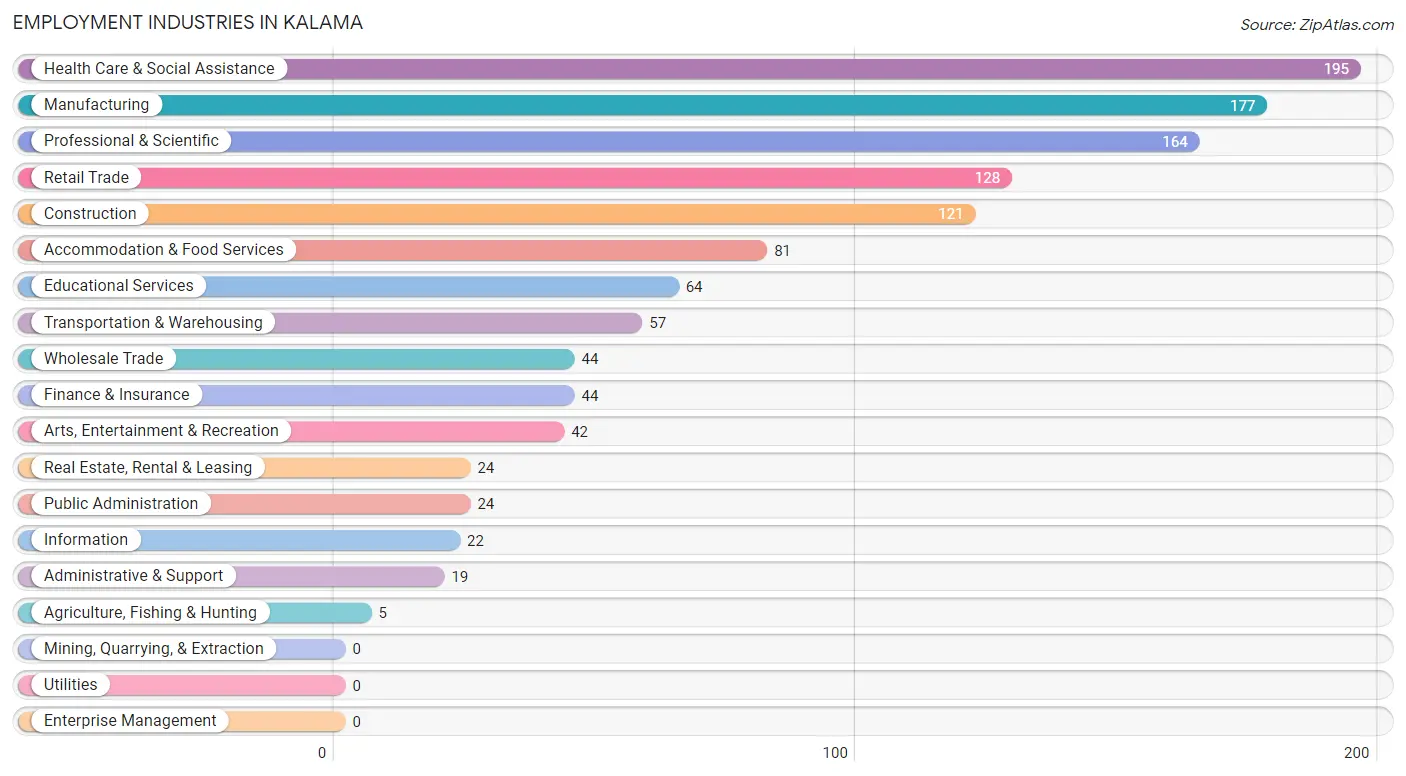
Employment Industries in Kalama
The major employment industries in Kalama include Health Care & Social Assistance (195 | 15.2%), Manufacturing (177 | 13.8%), Professional & Scientific (164 | 12.8%), Retail Trade (128 | 10.0%), and Construction (121 | 9.4%).
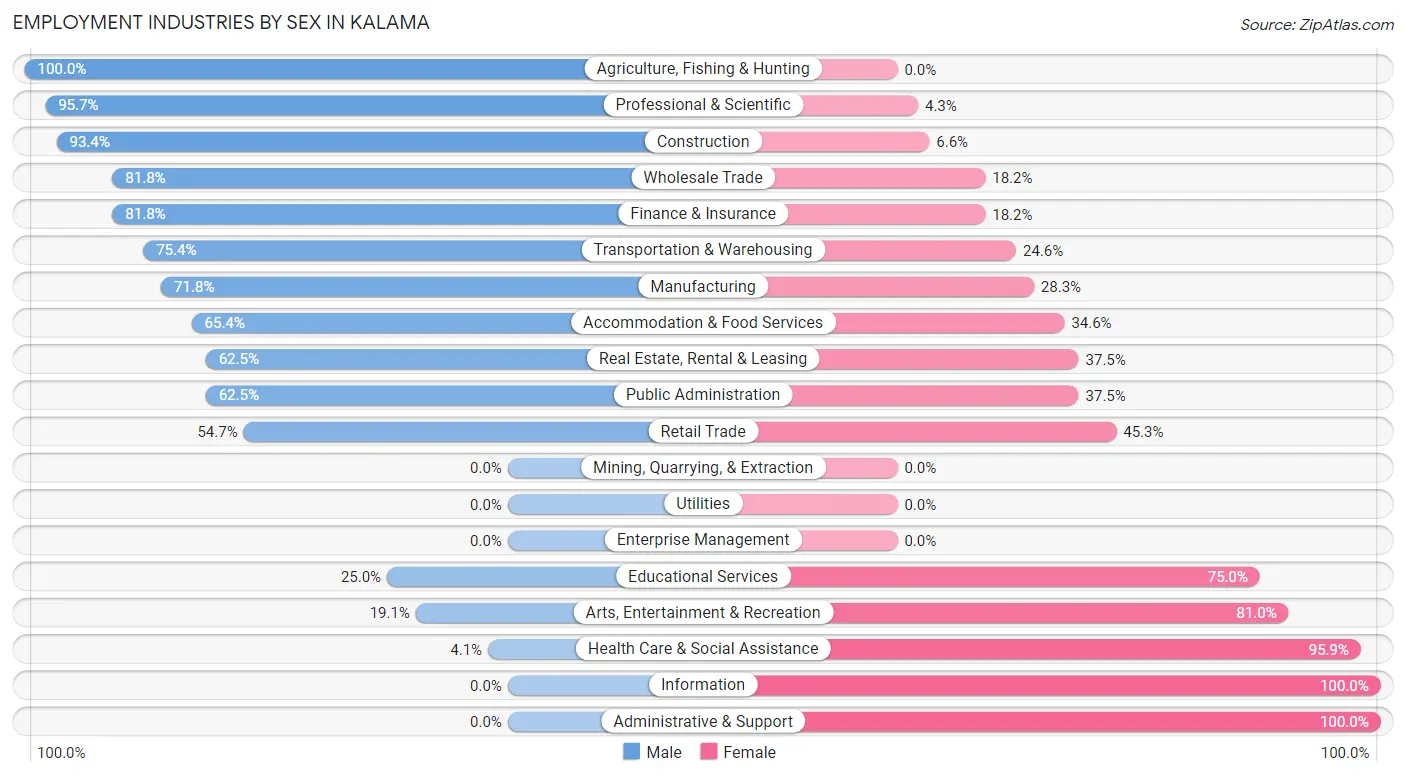
Employment Industries by Sex in Kalama
The Kalama industries that see more men than women are Agriculture, Fishing & Hunting (100.0%), Professional & Scientific (95.7%), and Construction (93.4%), whereas the industries that tend to have a higher number of women are Information (100.0%), Administrative & Support (100.0%), and Health Care & Social Assistance (95.9%).
| Industry | Male | Female |
| Agriculture, Fishing & Hunting | 5 (100.0%) | 0 (0.0%) |
| Mining, Quarrying, & Extraction | 0 (0.0%) | 0 (0.0%) |
| Construction | 113 (93.4%) | 8 (6.6%) |
| Manufacturing | 127 (71.8%) | 50 (28.2%) |
| Wholesale Trade | 36 (81.8%) | 8 (18.2%) |
| Retail Trade | 70 (54.7%) | 58 (45.3%) |
| Transportation & Warehousing | 43 (75.4%) | 14 (24.6%) |
| Utilities | 0 (0.0%) | 0 (0.0%) |
| Information | 0 (0.0%) | 22 (100.0%) |
| Finance & Insurance | 36 (81.8%) | 8 (18.2%) |
| Real Estate, Rental & Leasing | 15 (62.5%) | 9 (37.5%) |
| Professional & Scientific | 157 (95.7%) | 7 (4.3%) |
| Enterprise Management | 0 (0.0%) | 0 (0.0%) |
| Administrative & Support | 0 (0.0%) | 19 (100.0%) |
| Educational Services | 16 (25.0%) | 48 (75.0%) |
| Health Care & Social Assistance | 8 (4.1%) | 187 (95.9%) |
| Arts, Entertainment & Recreation | 8 (19.1%) | 34 (80.9%) |
| Accommodation & Food Services | 53 (65.4%) | 28 (34.6%) |
| Public Administration | 15 (62.5%) | 9 (37.5%) |
| Total | 730 (56.9%) | 553 (43.1%) |
Education in Kalama
School Enrollment in Kalama
The most common levels of schooling among the 465 students in Kalama are high school (126 | 27.1%), elementary school (119 | 25.6%), and middle school (74 | 15.9%).
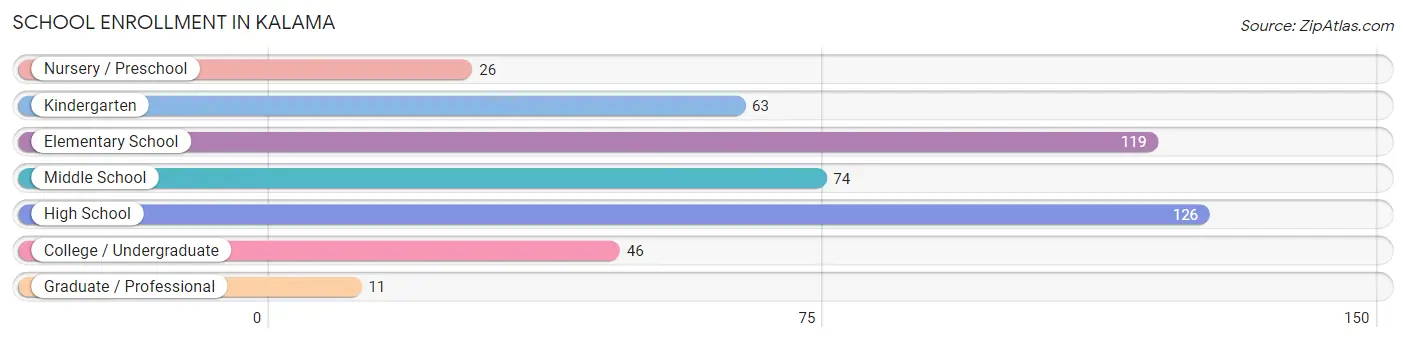
| School Level | # Students | % Students |
| Nursery / Preschool | 26 | 5.6% |
| Kindergarten | 63 | 13.6% |
| Elementary School | 119 | 25.6% |
| Middle School | 74 | 15.9% |
| High School | 126 | 27.1% |
| College / Undergraduate | 46 | 9.9% |
| Graduate / Professional | 11 | 2.4% |
| Total | 465 | 100.0% |
School Enrollment by Age by Funding Source in Kalama
Out of a total of 465 students who are enrolled in schools in Kalama, 18 (3.9%) attend a private institution, while the remaining 447 (96.1%) are enrolled in public schools. The age group of 5 to 9 year old has the highest likelihood of being enrolled in private schools, with 18 (11.1% in the age bracket) enrolled. Conversely, the age group of 3 to 4 year olds has the lowest likelihood of being enrolled in a private school, with 26 (100.0% in the age bracket) attending a public institution.
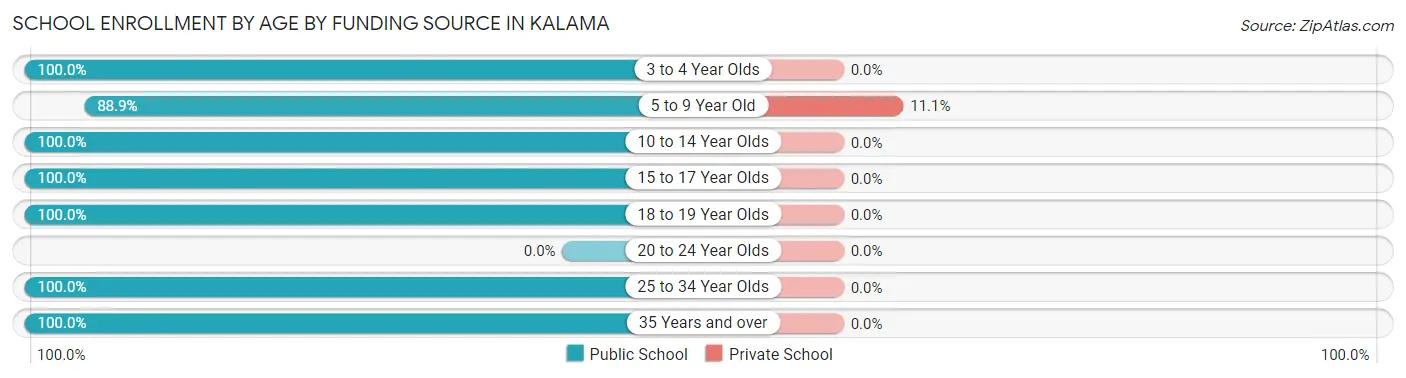
| Age Bracket | Public School | Private School |
| 3 to 4 Year Olds | 26 (100.0%) | 0 (0.0%) |
| 5 to 9 Year Old | 144 (88.9%) | 18 (11.1%) |
| 10 to 14 Year Olds | 99 (100.0%) | 0 (0.0%) |
| 15 to 17 Year Olds | 121 (100.0%) | 0 (0.0%) |
| 18 to 19 Year Olds | 12 (100.0%) | 0 (0.0%) |
| 20 to 24 Year Olds | 0 (0.0%) | 0 (0.0%) |
| 25 to 34 Year Olds | 41 (100.0%) | 0 (0.0%) |
| 35 Years and over | 4 (100.0%) | 0 (0.0%) |
| Total | 447 (96.1%) | 18 (3.9%) |
Educational Attainment by Field of Study in Kalama
Business (100 | 20.1%), liberal arts & history (90 | 18.1%), arts & humanities (86 | 17.3%), psychology (51 | 10.2%), and education (45 | 9.0%) are the most common fields of study among 498 individuals in Kalama who have obtained a bachelor's degree or higher.
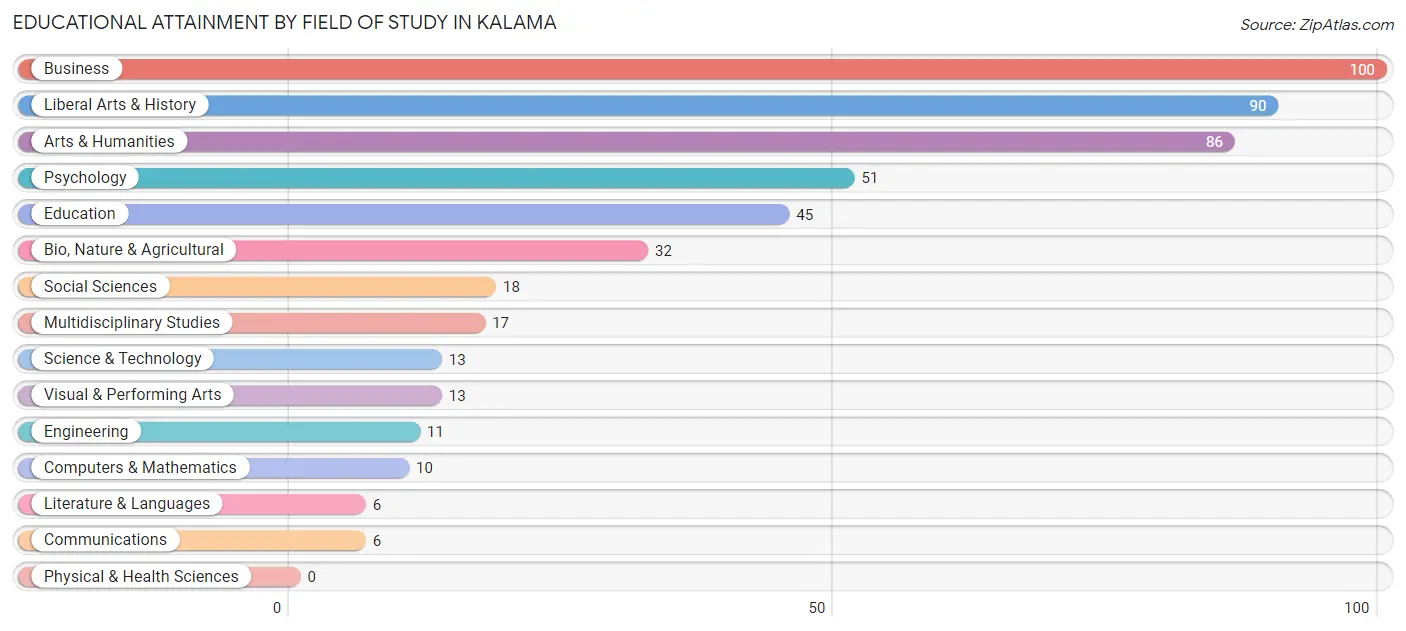
| Field of Study | # Graduates | % Graduates |
| Computers & Mathematics | 10 | 2.0% |
| Bio, Nature & Agricultural | 32 | 6.4% |
| Physical & Health Sciences | 0 | 0.0% |
| Psychology | 51 | 10.2% |
| Social Sciences | 18 | 3.6% |
| Engineering | 11 | 2.2% |
| Multidisciplinary Studies | 17 | 3.4% |
| Science & Technology | 13 | 2.6% |
| Business | 100 | 20.1% |
| Education | 45 | 9.0% |
| Literature & Languages | 6 | 1.2% |
| Liberal Arts & History | 90 | 18.1% |
| Visual & Performing Arts | 13 | 2.6% |
| Communications | 6 | 1.2% |
| Arts & Humanities | 86 | 17.3% |
| Total | 498 | 100.0% |
Transportation & Commute in Kalama
Vehicle Availability by Sex in Kalama
The most prevalent vehicle ownership categories in Kalama are males with 2 vehicles (246, accounting for 33.9%) and females with 2 vehicles (218, making up 44.5%).
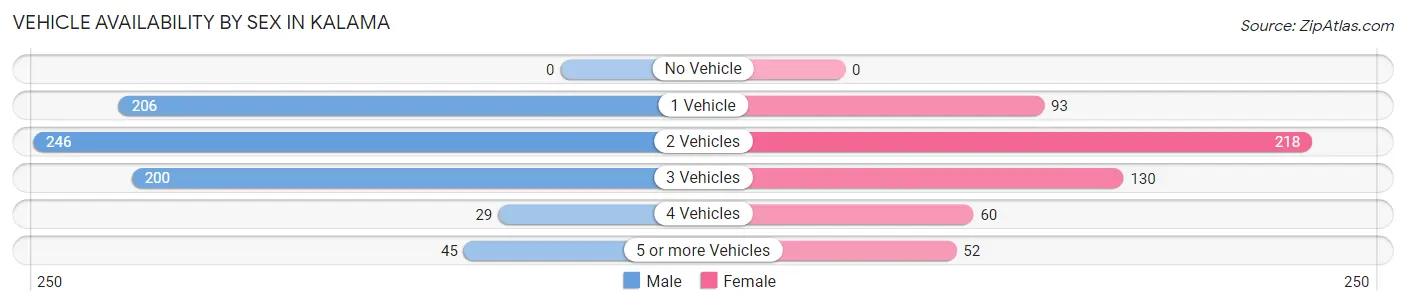
| Vehicles Available | Male | Female |
| No Vehicle | 0 (0.0%) | 0 (0.0%) |
| 1 Vehicle | 206 (28.4%) | 93 (16.8%) |
| 2 Vehicles | 246 (33.9%) | 218 (39.4%) |
| 3 Vehicles | 200 (27.6%) | 130 (23.5%) |
| 4 Vehicles | 29 (4.0%) | 60 (10.8%) |
| 5 or more Vehicles | 45 (6.2%) | 52 (9.4%) |
| Total | 726 (100.0%) | 553 (100.0%) |
Commute Time in Kalama
The most frequently occuring commute durations in Kalama are 10 to 14 minutes (231 commuters, 18.7%), 15 to 19 minutes (228 commuters, 18.5%), and 20 to 24 minutes (197 commuters, 16.0%).
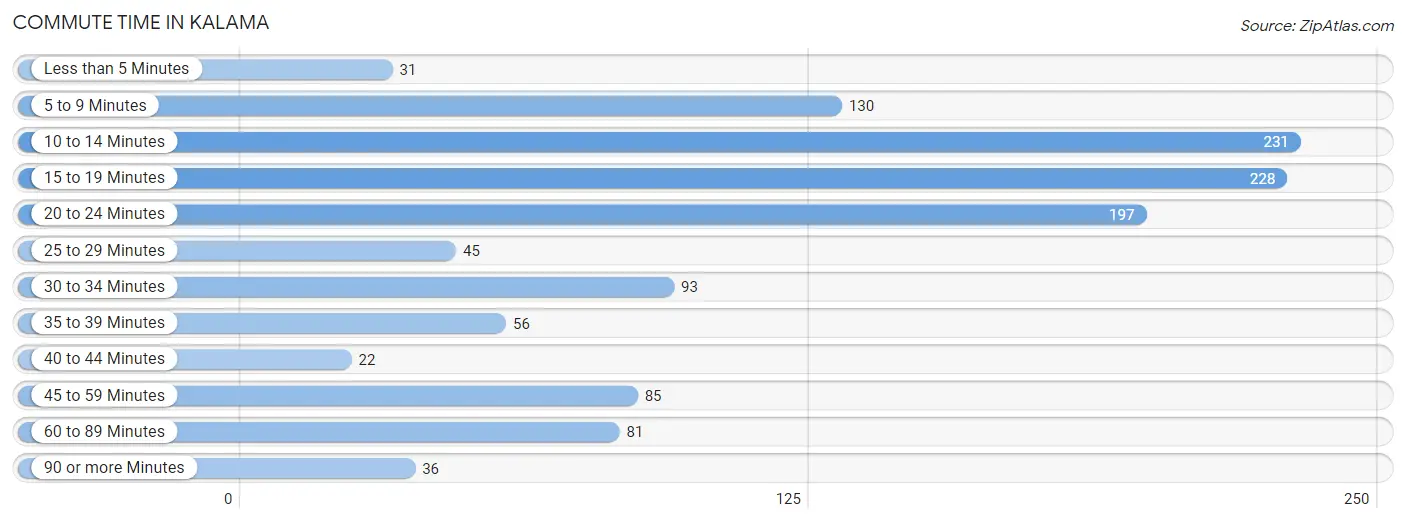
| Commute Time | # Commuters | % Commuters |
| Less than 5 Minutes | 31 | 2.5% |
| 5 to 9 Minutes | 130 | 10.5% |
| 10 to 14 Minutes | 231 | 18.7% |
| 15 to 19 Minutes | 228 | 18.5% |
| 20 to 24 Minutes | 197 | 16.0% |
| 25 to 29 Minutes | 45 | 3.6% |
| 30 to 34 Minutes | 93 | 7.5% |
| 35 to 39 Minutes | 56 | 4.5% |
| 40 to 44 Minutes | 22 | 1.8% |
| 45 to 59 Minutes | 85 | 6.9% |
| 60 to 89 Minutes | 81 | 6.6% |
| 90 or more Minutes | 36 | 2.9% |
Commute Time by Sex in Kalama
The most common commute times in Kalama are 10 to 14 minutes (205 commuters, 28.7%) for males and 15 to 19 minutes (112 commuters, 21.5%) for females.
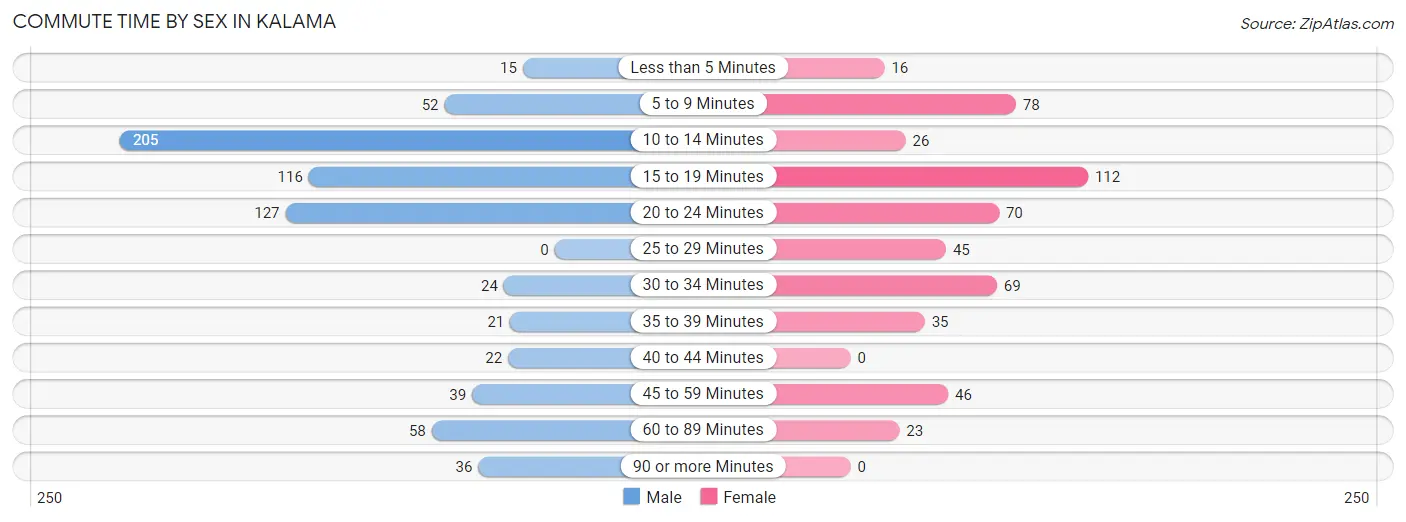
| Commute Time | Male | Female |
| Less than 5 Minutes | 15 (2.1%) | 16 (3.1%) |
| 5 to 9 Minutes | 52 (7.3%) | 78 (15.0%) |
| 10 to 14 Minutes | 205 (28.7%) | 26 (5.0%) |
| 15 to 19 Minutes | 116 (16.2%) | 112 (21.5%) |
| 20 to 24 Minutes | 127 (17.8%) | 70 (13.5%) |
| 25 to 29 Minutes | 0 (0.0%) | 45 (8.6%) |
| 30 to 34 Minutes | 24 (3.4%) | 69 (13.3%) |
| 35 to 39 Minutes | 21 (2.9%) | 35 (6.7%) |
| 40 to 44 Minutes | 22 (3.1%) | 0 (0.0%) |
| 45 to 59 Minutes | 39 (5.4%) | 46 (8.8%) |
| 60 to 89 Minutes | 58 (8.1%) | 23 (4.4%) |
| 90 or more Minutes | 36 (5.0%) | 0 (0.0%) |
Time of Departure to Work by Sex in Kalama
The most frequent times of departure to work in Kalama are 8:30 AM to 8:59 AM (203, 28.4%) for males and 8:00 AM to 8:29 AM (124, 23.8%) for females.
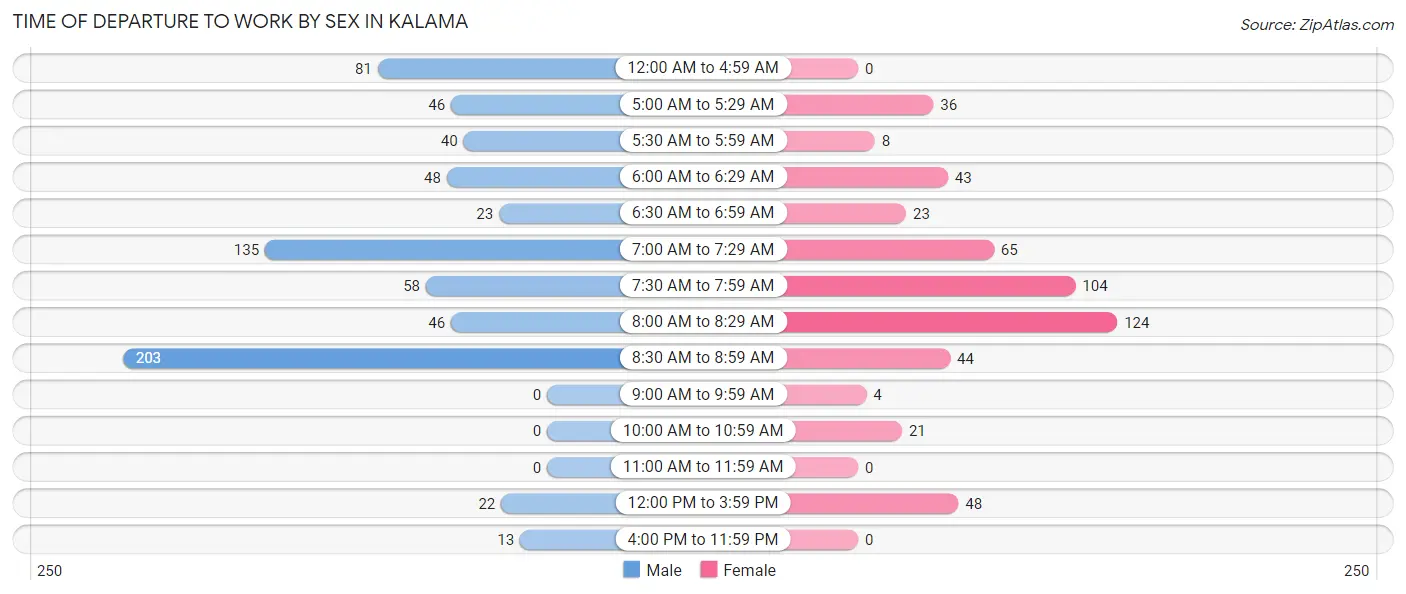
| Time of Departure | Male | Female |
| 12:00 AM to 4:59 AM | 81 (11.3%) | 0 (0.0%) |
| 5:00 AM to 5:29 AM | 46 (6.4%) | 36 (6.9%) |
| 5:30 AM to 5:59 AM | 40 (5.6%) | 8 (1.5%) |
| 6:00 AM to 6:29 AM | 48 (6.7%) | 43 (8.3%) |
| 6:30 AM to 6:59 AM | 23 (3.2%) | 23 (4.4%) |
| 7:00 AM to 7:29 AM | 135 (18.9%) | 65 (12.5%) |
| 7:30 AM to 7:59 AM | 58 (8.1%) | 104 (20.0%) |
| 8:00 AM to 8:29 AM | 46 (6.4%) | 124 (23.8%) |
| 8:30 AM to 8:59 AM | 203 (28.4%) | 44 (8.5%) |
| 9:00 AM to 9:59 AM | 0 (0.0%) | 4 (0.8%) |
| 10:00 AM to 10:59 AM | 0 (0.0%) | 21 (4.0%) |
| 11:00 AM to 11:59 AM | 0 (0.0%) | 0 (0.0%) |
| 12:00 PM to 3:59 PM | 22 (3.1%) | 48 (9.2%) |
| 4:00 PM to 11:59 PM | 13 (1.8%) | 0 (0.0%) |
| Total | 715 (100.0%) | 520 (100.0%) |
Housing Occupancy in Kalama
Occupancy by Ownership in Kalama
Of the total 1,332 dwellings in Kalama, owner-occupied units account for 823 (61.8%), while renter-occupied units make up 509 (38.2%).
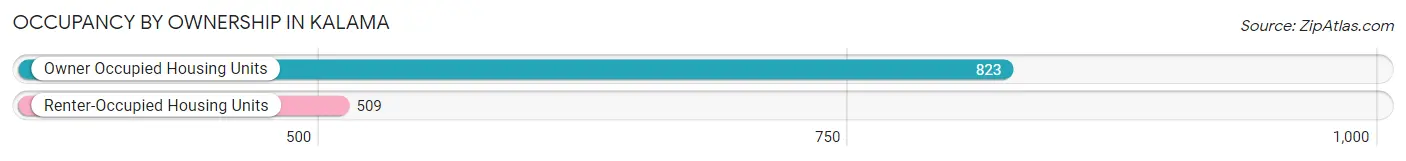
| Occupancy | # Housing Units | % Housing Units |
| Owner Occupied Housing Units | 823 | 61.8% |
| Renter-Occupied Housing Units | 509 | 38.2% |
| Total Occupied Housing Units | 1,332 | 100.0% |
Occupancy by Household Size in Kalama
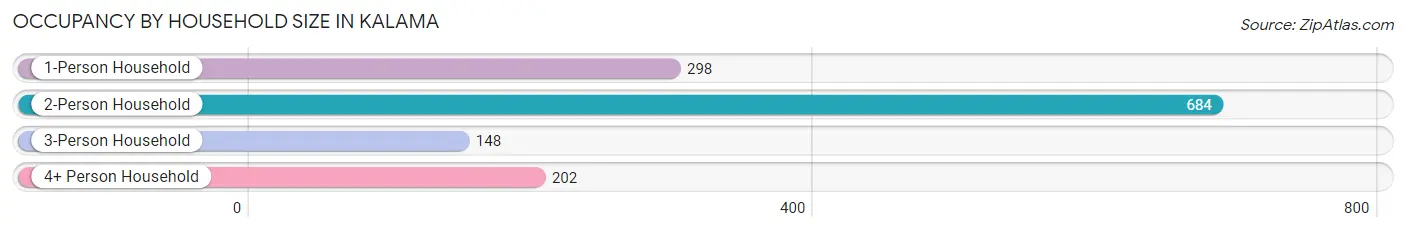
| Household Size | # Housing Units | % Housing Units |
| 1-Person Household | 298 | 22.4% |
| 2-Person Household | 684 | 51.3% |
| 3-Person Household | 148 | 11.1% |
| 4+ Person Household | 202 | 15.2% |
| Total Housing Units | 1,332 | 100.0% |
Occupancy by Ownership by Household Size in Kalama
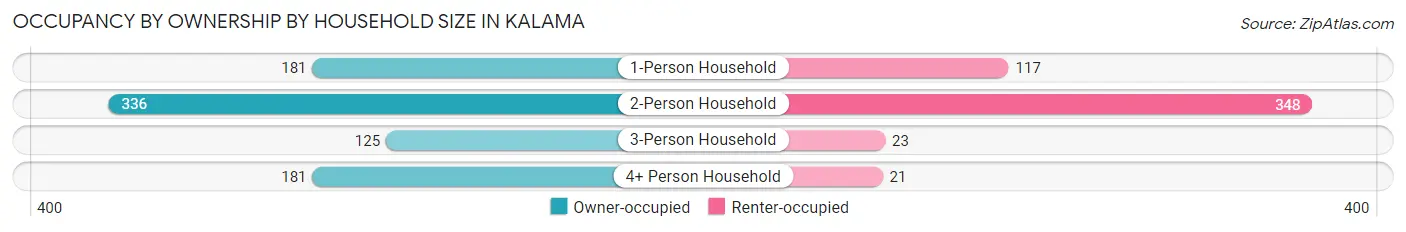
| Household Size | Owner-occupied | Renter-occupied |
| 1-Person Household | 181 (60.7%) | 117 (39.3%) |
| 2-Person Household | 336 (49.1%) | 348 (50.9%) |
| 3-Person Household | 125 (84.5%) | 23 (15.5%) |
| 4+ Person Household | 181 (89.6%) | 21 (10.4%) |
| Total Housing Units | 823 (61.8%) | 509 (38.2%) |
Occupancy by Educational Attainment in Kalama
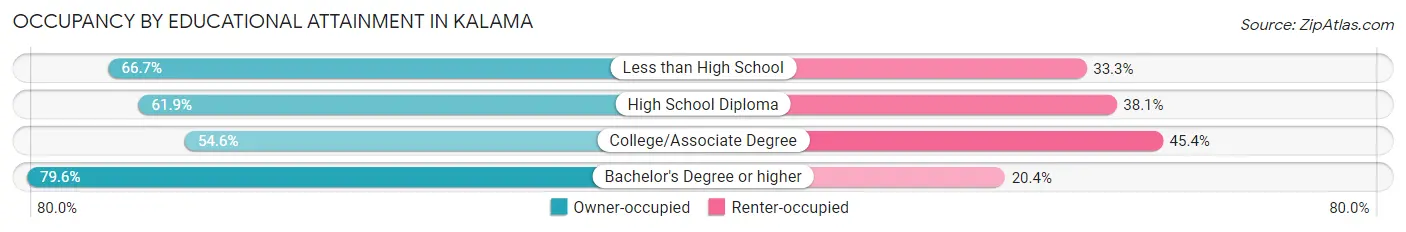
| Household Size | Owner-occupied | Renter-occupied |
| Less than High School | 34 (66.7%) | 17 (33.3%) |
| High School Diploma | 221 (61.9%) | 136 (38.1%) |
| College/Associate Degree | 365 (54.6%) | 304 (45.4%) |
| Bachelor's Degree or higher | 203 (79.6%) | 52 (20.4%) |
Occupancy by Age of Householder in Kalama
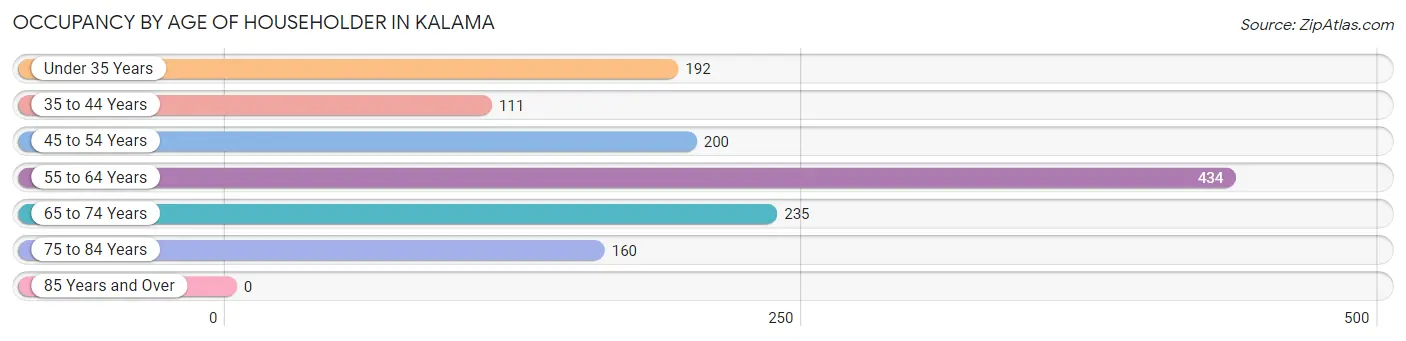
| Age Bracket | # Households | % Households |
| Under 35 Years | 192 | 14.4% |
| 35 to 44 Years | 111 | 8.3% |
| 45 to 54 Years | 200 | 15.0% |
| 55 to 64 Years | 434 | 32.6% |
| 65 to 74 Years | 235 | 17.6% |
| 75 to 84 Years | 160 | 12.0% |
| 85 Years and Over | 0 | 0.0% |
| Total | 1,332 | 100.0% |
Housing Finances in Kalama
Median Income by Occupancy in Kalama
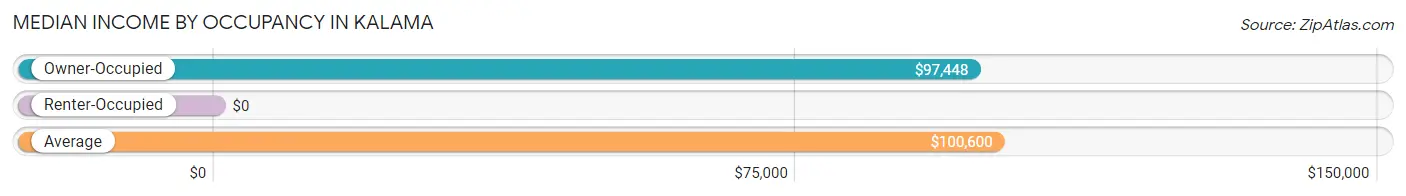
| Occupancy Type | # Households | Median Income |
| Owner-Occupied | 823 (61.8%) | $97,448 |
| Renter-Occupied | 509 (38.2%) | $0 |
| Average | 1,332 (100.0%) | $100,600 |
Occupancy by Householder Income Bracket in Kalama
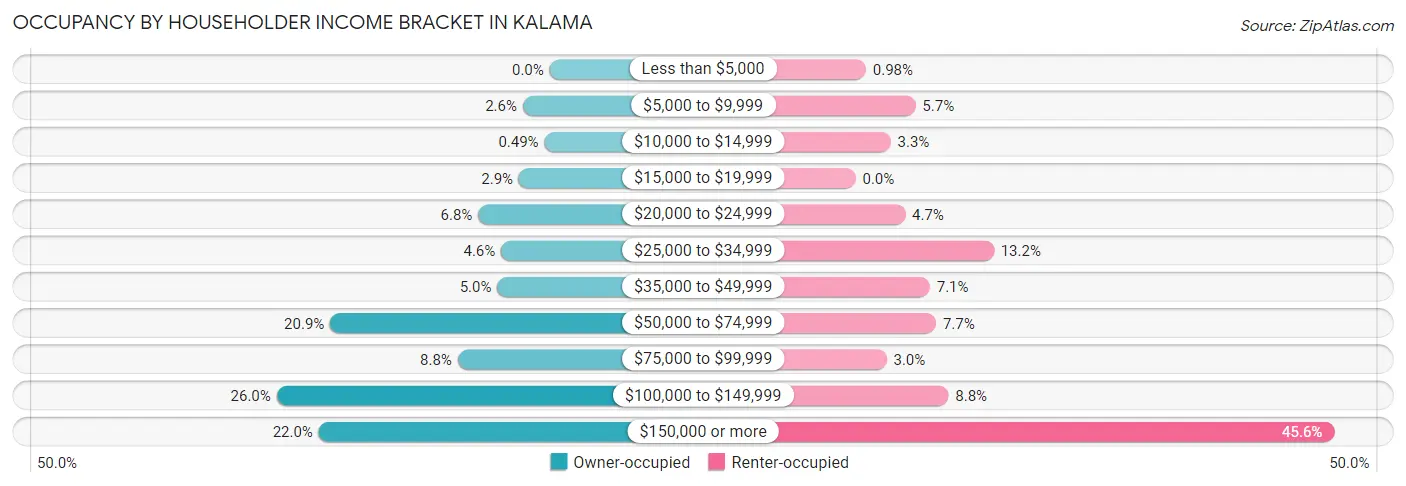
| Income Bracket | Owner-occupied | Renter-occupied |
| Less than $5,000 | 0 (0.0%) | 5 (1.0%) |
| $5,000 to $9,999 | 21 (2.5%) | 29 (5.7%) |
| $10,000 to $14,999 | 4 (0.5%) | 17 (3.3%) |
| $15,000 to $19,999 | 24 (2.9%) | 0 (0.0%) |
| $20,000 to $24,999 | 56 (6.8%) | 24 (4.7%) |
| $25,000 to $34,999 | 38 (4.6%) | 67 (13.2%) |
| $35,000 to $49,999 | 41 (5.0%) | 36 (7.1%) |
| $50,000 to $74,999 | 172 (20.9%) | 39 (7.7%) |
| $75,000 to $99,999 | 72 (8.7%) | 15 (2.9%) |
| $100,000 to $149,999 | 214 (26.0%) | 45 (8.8%) |
| $150,000 or more | 181 (22.0%) | 232 (45.6%) |
| Total | 823 (100.0%) | 509 (100.0%) |
Monthly Housing Cost Tiers in Kalama
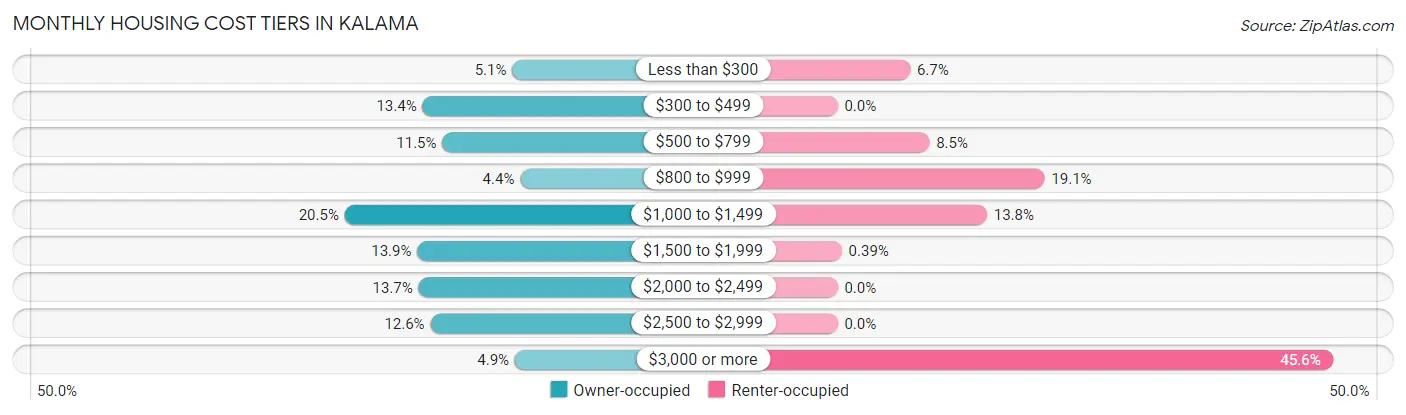
| Monthly Cost | Owner-occupied | Renter-occupied |
| Less than $300 | 42 (5.1%) | 34 (6.7%) |
| $300 to $499 | 110 (13.4%) | 0 (0.0%) |
| $500 to $799 | 95 (11.5%) | 43 (8.5%) |
| $800 to $999 | 36 (4.4%) | 97 (19.1%) |
| $1,000 to $1,499 | 169 (20.5%) | 70 (13.8%) |
| $1,500 to $1,999 | 114 (13.9%) | 2 (0.4%) |
| $2,000 to $2,499 | 113 (13.7%) | 0 (0.0%) |
| $2,500 to $2,999 | 104 (12.6%) | 0 (0.0%) |
| $3,000 or more | 40 (4.9%) | 232 (45.6%) |
| Total | 823 (100.0%) | 509 (100.0%) |
Physical Housing Characteristics in Kalama
Housing Structures in Kalama
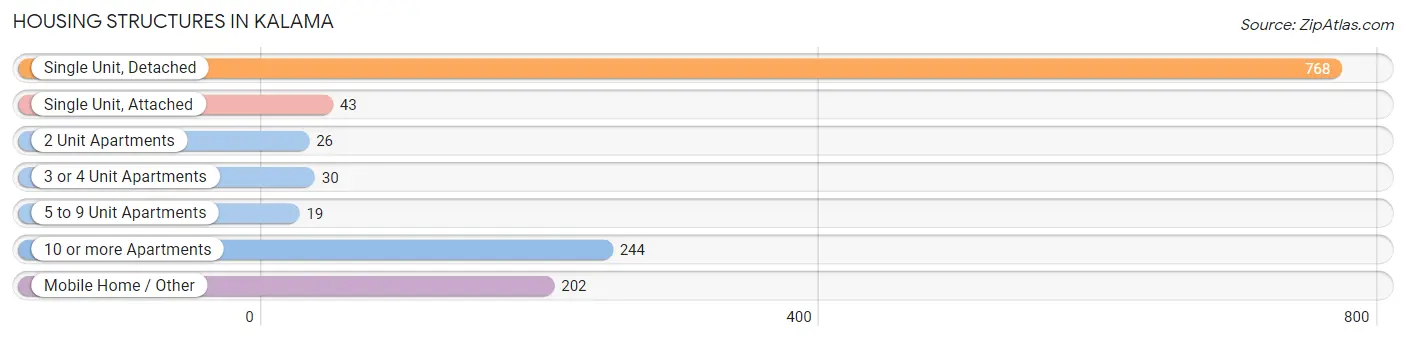
| Structure Type | # Housing Units | % Housing Units |
| Single Unit, Detached | 768 | 57.7% |
| Single Unit, Attached | 43 | 3.2% |
| 2 Unit Apartments | 26 | 1.9% |
| 3 or 4 Unit Apartments | 30 | 2.2% |
| 5 to 9 Unit Apartments | 19 | 1.4% |
| 10 or more Apartments | 244 | 18.3% |
| Mobile Home / Other | 202 | 15.2% |
| Total | 1,332 | 100.0% |
Housing Structures by Occupancy in Kalama
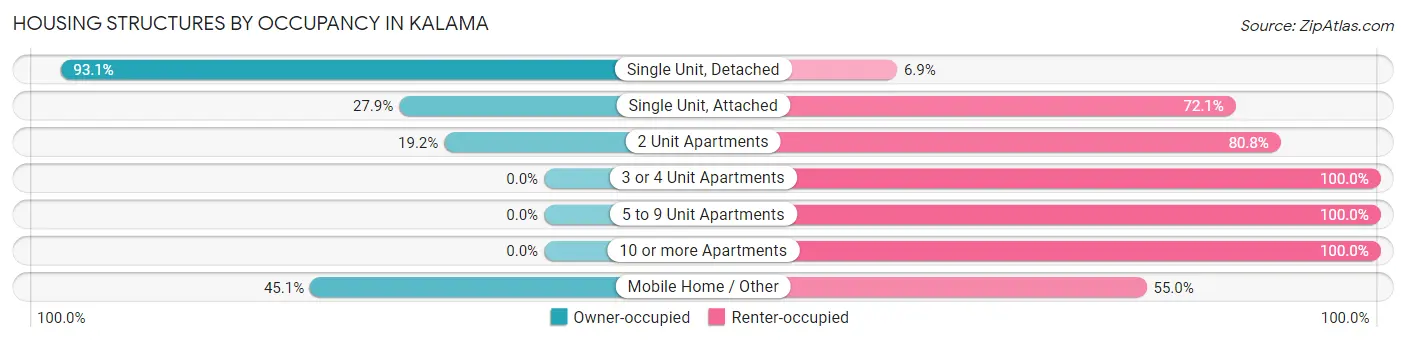
| Structure Type | Owner-occupied | Renter-occupied |
| Single Unit, Detached | 715 (93.1%) | 53 (6.9%) |
| Single Unit, Attached | 12 (27.9%) | 31 (72.1%) |
| 2 Unit Apartments | 5 (19.2%) | 21 (80.8%) |
| 3 or 4 Unit Apartments | 0 (0.0%) | 30 (100.0%) |
| 5 to 9 Unit Apartments | 0 (0.0%) | 19 (100.0%) |
| 10 or more Apartments | 0 (0.0%) | 244 (100.0%) |
| Mobile Home / Other | 91 (45.1%) | 111 (54.9%) |
| Total | 823 (61.8%) | 509 (38.2%) |
Housing Structures by Number of Rooms in Kalama
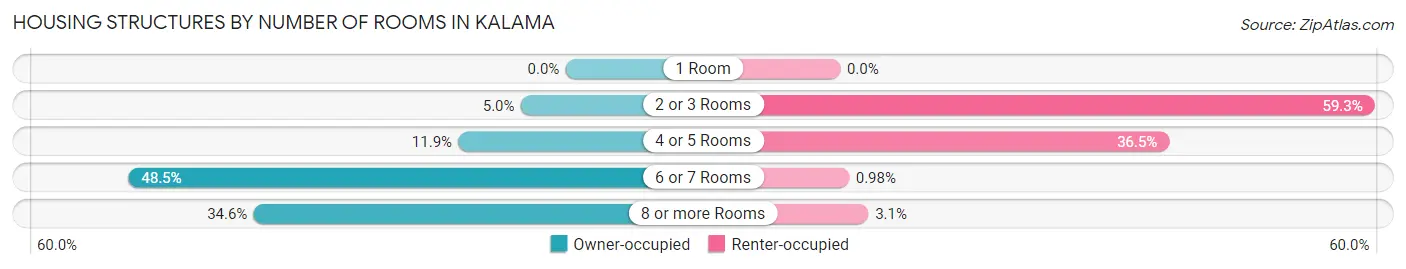
| Number of Rooms | Owner-occupied | Renter-occupied |
| 1 Room | 0 (0.0%) | 0 (0.0%) |
| 2 or 3 Rooms | 41 (5.0%) | 302 (59.3%) |
| 4 or 5 Rooms | 98 (11.9%) | 186 (36.5%) |
| 6 or 7 Rooms | 399 (48.5%) | 5 (1.0%) |
| 8 or more Rooms | 285 (34.6%) | 16 (3.1%) |
| Total | 823 (100.0%) | 509 (100.0%) |
Housing Structure by Heating Type in Kalama
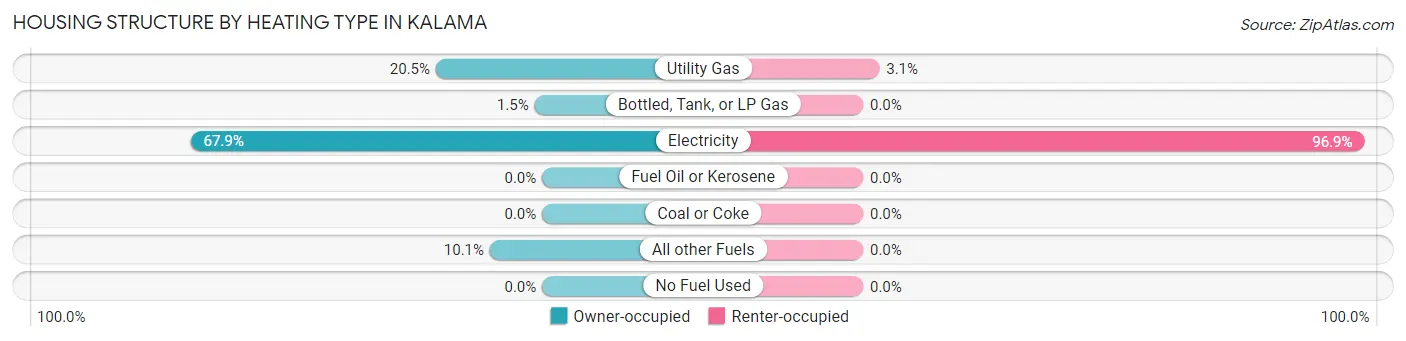
| Heating Type | Owner-occupied | Renter-occupied |
| Utility Gas | 169 (20.5%) | 16 (3.1%) |
| Bottled, Tank, or LP Gas | 12 (1.5%) | 0 (0.0%) |
| Electricity | 559 (67.9%) | 493 (96.9%) |
| Fuel Oil or Kerosene | 0 (0.0%) | 0 (0.0%) |
| Coal or Coke | 0 (0.0%) | 0 (0.0%) |
| All other Fuels | 83 (10.1%) | 0 (0.0%) |
| No Fuel Used | 0 (0.0%) | 0 (0.0%) |
| Total | 823 (100.0%) | 509 (100.0%) |
Household Vehicle Usage in Kalama
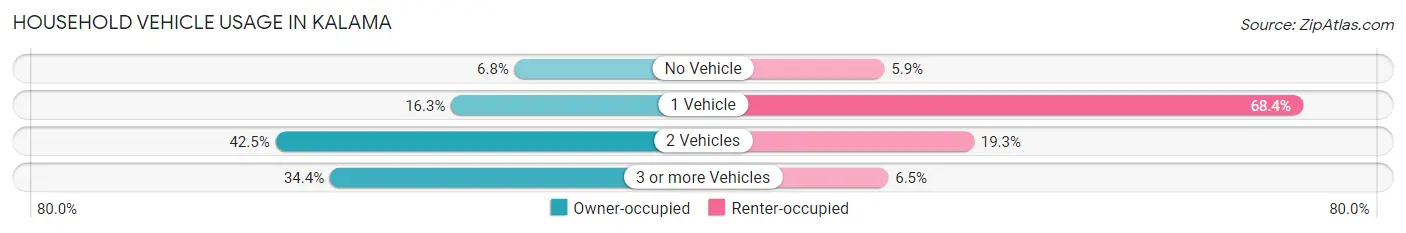
| Vehicles per Household | Owner-occupied | Renter-occupied |
| No Vehicle | 56 (6.8%) | 30 (5.9%) |
| 1 Vehicle | 134 (16.3%) | 348 (68.4%) |
| 2 Vehicles | 350 (42.5%) | 98 (19.3%) |
| 3 or more Vehicles | 283 (34.4%) | 33 (6.5%) |
| Total | 823 (100.0%) | 509 (100.0%) |
Real Estate & Mortgages in Kalama
Real Estate and Mortgage Overview in Kalama
| Characteristic | Without Mortgage | With Mortgage |
| Housing Units | 286 | 537 |
| Median Property Value | $292,200 | $430,400 |
| Median Household Income | $50,870 | $181 |
| Monthly Housing Costs | $465 | $40 |
| Real Estate Taxes | $2,310 | $9 |
Property Value by Mortgage Status in Kalama
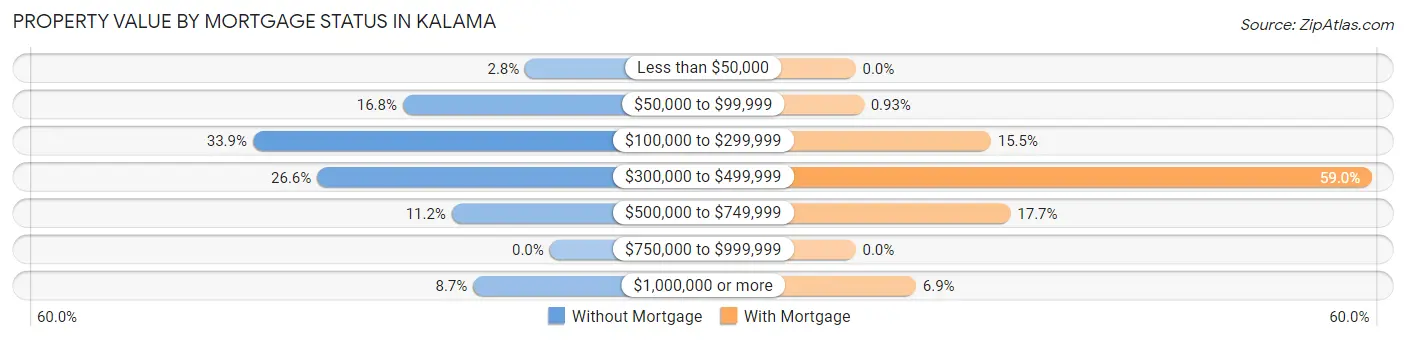
| Property Value | Without Mortgage | With Mortgage |
| Less than $50,000 | 8 (2.8%) | 0 (0.0%) |
| $50,000 to $99,999 | 48 (16.8%) | 5 (0.9%) |
| $100,000 to $299,999 | 97 (33.9%) | 83 (15.5%) |
| $300,000 to $499,999 | 76 (26.6%) | 317 (59.0%) |
| $500,000 to $749,999 | 32 (11.2%) | 95 (17.7%) |
| $750,000 to $999,999 | 0 (0.0%) | 0 (0.0%) |
| $1,000,000 or more | 25 (8.7%) | 37 (6.9%) |
| Total | 286 (100.0%) | 537 (100.0%) |
Household Income by Mortgage Status in Kalama
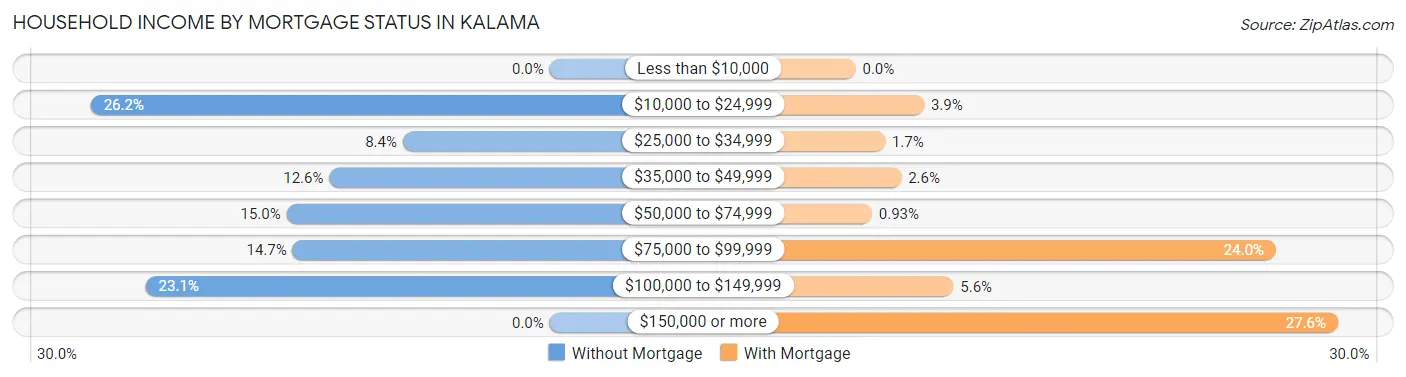
| Household Income | Without Mortgage | With Mortgage |
| Less than $10,000 | 0 (0.0%) | 0 (0.0%) |
| $10,000 to $24,999 | 75 (26.2%) | 21 (3.9%) |
| $25,000 to $34,999 | 24 (8.4%) | 9 (1.7%) |
| $35,000 to $49,999 | 36 (12.6%) | 14 (2.6%) |
| $50,000 to $74,999 | 43 (15.0%) | 5 (0.9%) |
| $75,000 to $99,999 | 42 (14.7%) | 129 (24.0%) |
| $100,000 to $149,999 | 66 (23.1%) | 30 (5.6%) |
| $150,000 or more | 0 (0.0%) | 148 (27.6%) |
| Total | 286 (100.0%) | 537 (100.0%) |
Property Value to Household Income Ratio in Kalama
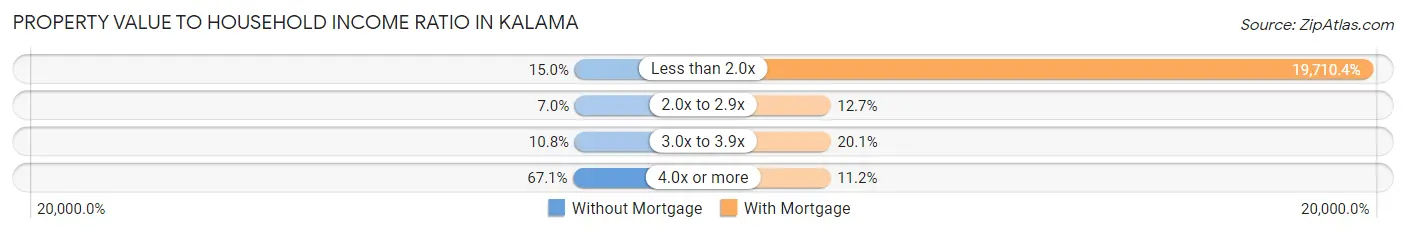
| Value-to-Income Ratio | Without Mortgage | With Mortgage |
| Less than 2.0x | 43 (15.0%) | 105,845 (19,710.4%) |
| 2.0x to 2.9x | 20 (7.0%) | 68 (12.7%) |
| 3.0x to 3.9x | 31 (10.8%) | 108 (20.1%) |
| 4.0x or more | 192 (67.1%) | 60 (11.2%) |
| Total | 286 (100.0%) | 537 (100.0%) |
Real Estate Taxes by Mortgage Status in Kalama
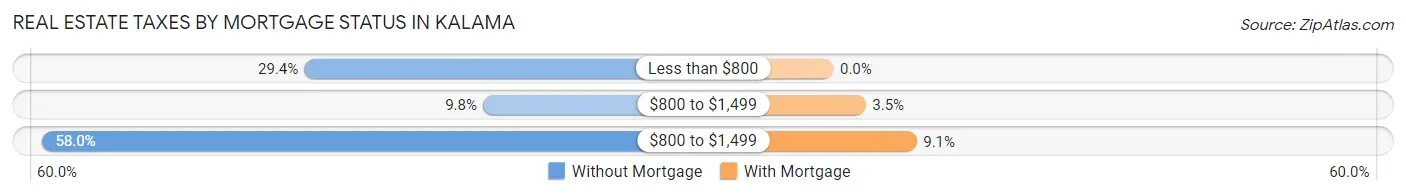
| Property Taxes | Without Mortgage | With Mortgage |
| Less than $800 | 84 (29.4%) | 0 (0.0%) |
| $800 to $1,499 | 28 (9.8%) | 19 (3.5%) |
| $800 to $1,499 | 166 (58.0%) | 49 (9.1%) |
| Total | 286 (100.0%) | 537 (100.0%) |
Health & Disability in Kalama
Health Insurance Coverage by Age in Kalama
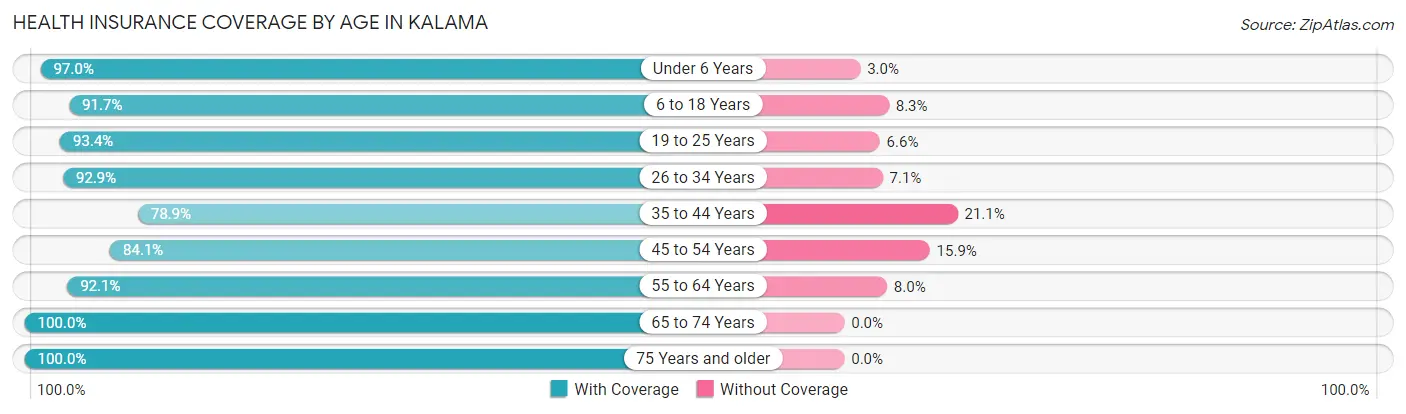
| Age Bracket | With Coverage | Without Coverage |
| Under 6 Years | 196 (97.0%) | 6 (3.0%) |
| 6 to 18 Years | 332 (91.7%) | 30 (8.3%) |
| 19 to 25 Years | 85 (93.4%) | 6 (6.6%) |
| 26 to 34 Years | 312 (92.9%) | 24 (7.1%) |
| 35 to 44 Years | 198 (78.9%) | 53 (21.1%) |
| 45 to 54 Years | 264 (84.1%) | 50 (15.9%) |
| 55 to 64 Years | 683 (92.0%) | 59 (8.0%) |
| 65 to 74 Years | 367 (100.0%) | 0 (0.0%) |
| 75 Years and older | 287 (100.0%) | 0 (0.0%) |
| Total | 2,724 (92.3%) | 228 (7.7%) |
Health Insurance Coverage by Citizenship Status in Kalama
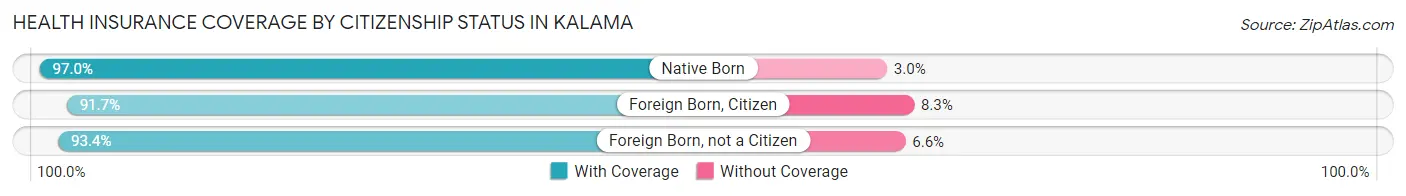
| Citizenship Status | With Coverage | Without Coverage |
| Native Born | 196 (97.0%) | 6 (3.0%) |
| Foreign Born, Citizen | 332 (91.7%) | 30 (8.3%) |
| Foreign Born, not a Citizen | 85 (93.4%) | 6 (6.6%) |
Health Insurance Coverage by Household Income in Kalama
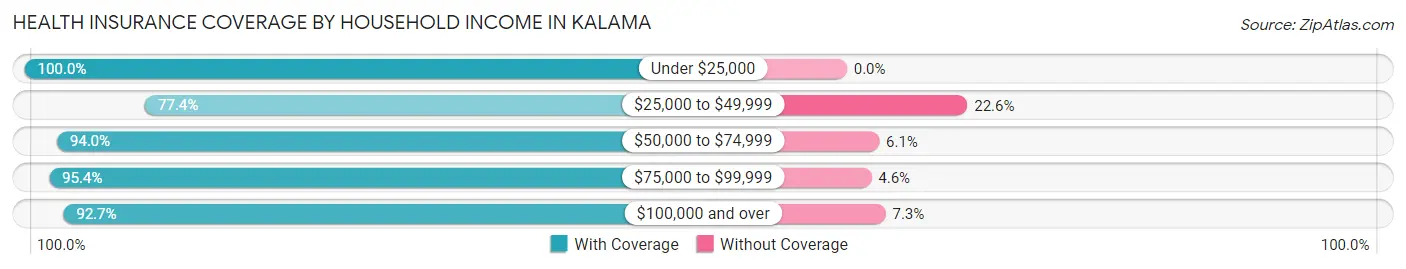
| Household Income | With Coverage | Without Coverage |
| Under $25,000 | 290 (100.0%) | 0 (0.0%) |
| $25,000 to $49,999 | 240 (77.4%) | 70 (22.6%) |
| $50,000 to $74,999 | 497 (94.0%) | 32 (6.0%) |
| $75,000 to $99,999 | 228 (95.4%) | 11 (4.6%) |
| $100,000 and over | 1,469 (92.7%) | 115 (7.3%) |
Public vs Private Health Insurance Coverage by Age in Kalama
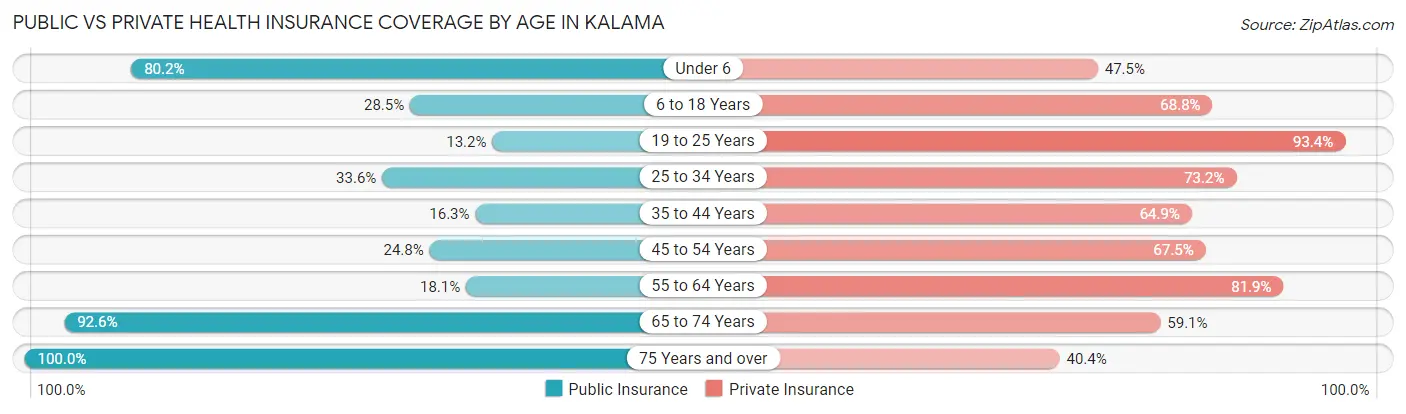
| Age Bracket | Public Insurance | Private Insurance |
| Under 6 | 162 (80.2%) | 96 (47.5%) |
| 6 to 18 Years | 103 (28.4%) | 249 (68.8%) |
| 19 to 25 Years | 12 (13.2%) | 85 (93.4%) |
| 25 to 34 Years | 113 (33.6%) | 246 (73.2%) |
| 35 to 44 Years | 41 (16.3%) | 163 (64.9%) |
| 45 to 54 Years | 78 (24.8%) | 212 (67.5%) |
| 55 to 64 Years | 134 (18.1%) | 608 (81.9%) |
| 65 to 74 Years | 340 (92.6%) | 217 (59.1%) |
| 75 Years and over | 287 (100.0%) | 116 (40.4%) |
| Total | 1,270 (43.0%) | 1,992 (67.5%) |
Disability Status by Sex by Age in Kalama
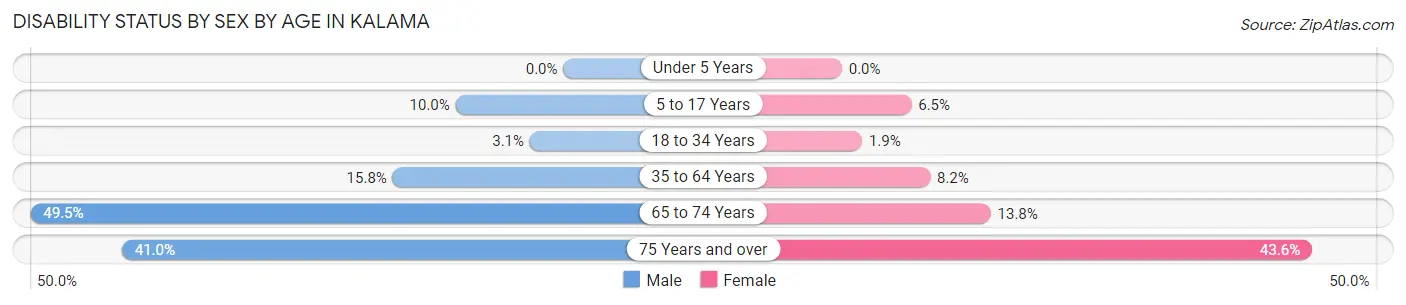
| Age Bracket | Male | Female |
| Under 5 Years | 0 (0.0%) | 0 (0.0%) |
| 5 to 17 Years | 23 (10.0%) | 10 (6.5%) |
| 18 to 34 Years | 7 (3.1%) | 4 (1.9%) |
| 35 to 64 Years | 93 (15.8%) | 59 (8.2%) |
| 65 to 74 Years | 92 (49.5%) | 25 (13.8%) |
| 75 Years and over | 50 (41.0%) | 72 (43.6%) |
Disability Class by Sex by Age in Kalama
Disability Class: Hearing Difficulty
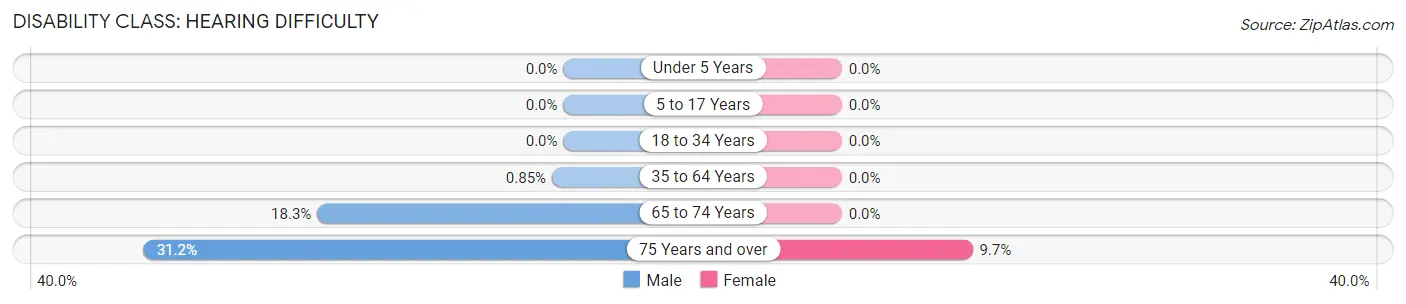
| Age Bracket | Male | Female |
| Under 5 Years | 0 (0.0%) | 0 (0.0%) |
| 5 to 17 Years | 0 (0.0%) | 0 (0.0%) |
| 18 to 34 Years | 0 (0.0%) | 0 (0.0%) |
| 35 to 64 Years | 5 (0.9%) | 0 (0.0%) |
| 65 to 74 Years | 34 (18.3%) | 0 (0.0%) |
| 75 Years and over | 38 (31.1%) | 16 (9.7%) |
Disability Class: Vision Difficulty
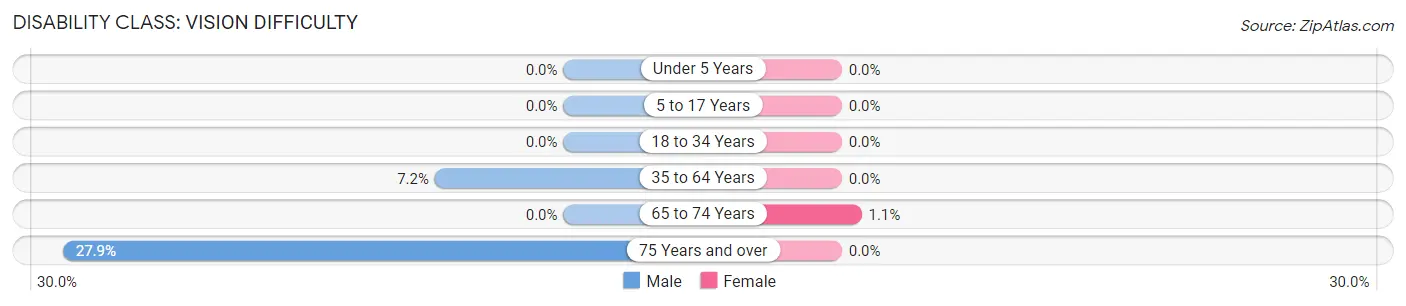
| Age Bracket | Male | Female |
| Under 5 Years | 0 (0.0%) | 0 (0.0%) |
| 5 to 17 Years | 0 (0.0%) | 0 (0.0%) |
| 18 to 34 Years | 0 (0.0%) | 0 (0.0%) |
| 35 to 64 Years | 42 (7.2%) | 0 (0.0%) |
| 65 to 74 Years | 0 (0.0%) | 2 (1.1%) |
| 75 Years and over | 34 (27.9%) | 0 (0.0%) |
Disability Class: Cognitive Difficulty
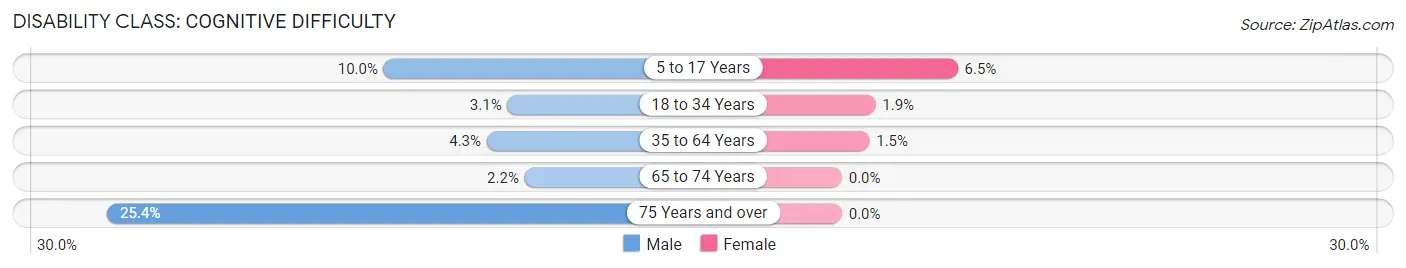
| Age Bracket | Male | Female |
| 5 to 17 Years | 23 (10.0%) | 10 (6.5%) |
| 18 to 34 Years | 7 (3.1%) | 4 (1.9%) |
| 35 to 64 Years | 25 (4.3%) | 11 (1.5%) |
| 65 to 74 Years | 4 (2.1%) | 0 (0.0%) |
| 75 Years and over | 31 (25.4%) | 0 (0.0%) |
Disability Class: Ambulatory Difficulty
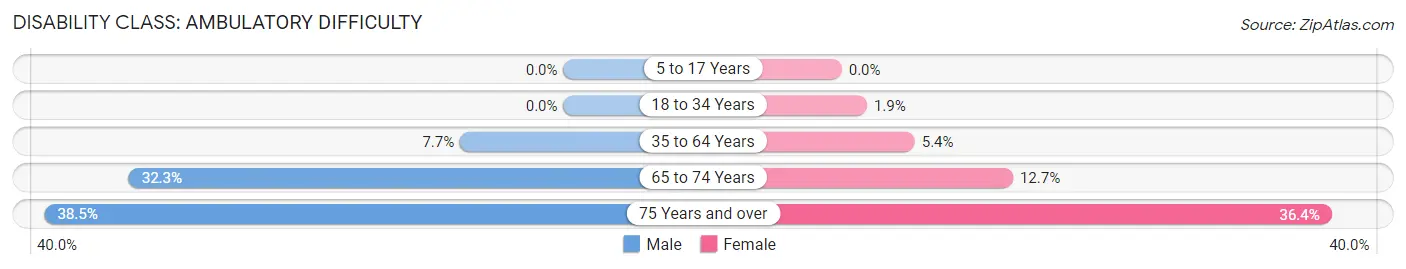
| Age Bracket | Male | Female |
| 5 to 17 Years | 0 (0.0%) | 0 (0.0%) |
| 18 to 34 Years | 0 (0.0%) | 4 (1.9%) |
| 35 to 64 Years | 45 (7.7%) | 39 (5.4%) |
| 65 to 74 Years | 60 (32.3%) | 23 (12.7%) |
| 75 Years and over | 47 (38.5%) | 60 (36.4%) |
Disability Class: Self-Care Difficulty
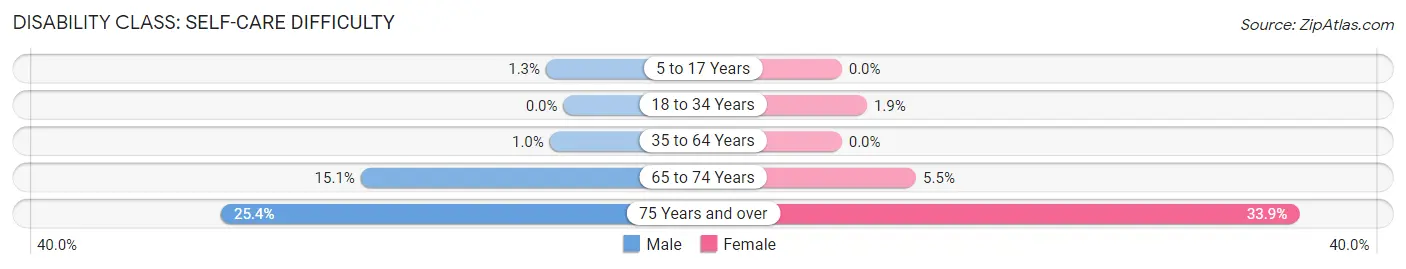
| Age Bracket | Male | Female |
| 5 to 17 Years | 3 (1.3%) | 0 (0.0%) |
| 18 to 34 Years | 0 (0.0%) | 4 (1.9%) |
| 35 to 64 Years | 6 (1.0%) | 0 (0.0%) |
| 65 to 74 Years | 28 (15.0%) | 10 (5.5%) |
| 75 Years and over | 31 (25.4%) | 56 (33.9%) |
Technology Access in Kalama
Computing Device Access in Kalama
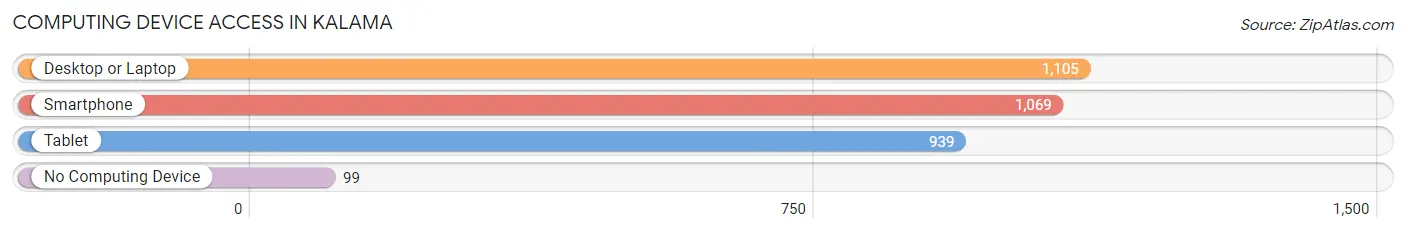
| Device Type | # Households | % Households |
| Desktop or Laptop | 1,105 | 83.0% |
| Smartphone | 1,069 | 80.3% |
| Tablet | 939 | 70.5% |
| No Computing Device | 99 | 7.4% |
| Total | 1,332 | 100.0% |
Internet Access in Kalama
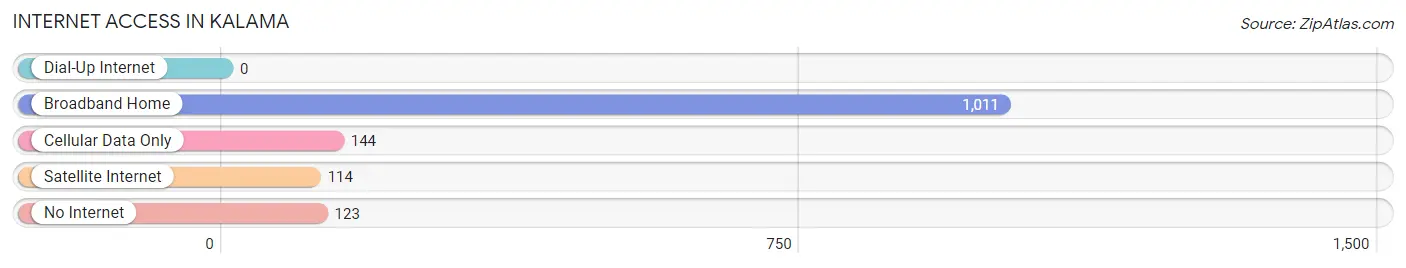
| Internet Type | # Households | % Households |
| Dial-Up Internet | 0 | 0.0% |
| Broadband Home | 1,011 | 75.9% |
| Cellular Data Only | 144 | 10.8% |
| Satellite Internet | 114 | 8.6% |
| No Internet | 123 | 9.2% |
| Total | 1,332 | 100.0% |
Kalama Summary
Kalama, Washington is a small city located in Cowlitz County, Washington, United States. It is situated along the Columbia River, approximately 40 miles north of Portland, Oregon. The city has a population of 2,500 people and is part of the Longview, Washington Metropolitan Statistical Area.
History
The area that is now Kalama was first inhabited by the Cowlitz people, who lived in the area for thousands of years before the arrival of European settlers. The first European settlers arrived in the area in the early 1800s, and the town was officially founded in 1853. The town was named after the Cowlitz word for “swift water”, and was initially a trading post for the Hudson’s Bay Company.
In the late 1800s, the town began to grow as a port for the lumber industry. The town was incorporated in 1871, and the first railroad arrived in 1872. The railroad connected the town to Portland, Oregon, and allowed for the export of lumber and other goods.
In the early 1900s, the town began to grow as a tourist destination. The town was home to several resorts, and the nearby Mount St. Helens National Volcanic Monument was established in 1908. The town also became a popular destination for fishing and hunting.
Geography
Kalama is located in Cowlitz County, Washington, United States. It is situated along the Columbia River, approximately 40 miles north of Portland, Oregon. The city has a total area of 2.3 square miles, all of which is land. The city is located in a temperate rainforest climate, with mild temperatures and abundant rainfall.
Economy
Kalama’s economy is largely based on the lumber industry. The town is home to several lumber mills, and the nearby Mount St. Helens National Volcanic Monument is a popular tourist destination. The town is also home to several small businesses, including restaurants, retail stores, and other services.
Demographics
As of the 2010 census, the population of Kalama was 2,500 people. The racial makeup of the city was 92.2% White, 0.8% African American, 0.4% Native American, 0.8% Asian, 0.1% Pacific Islander, 0.8% from other races, and 4.9% from two or more races. The median household income was $41,250, and the median family income was $50,000.
Conclusion
Kalama, Washington is a small city located in Cowlitz County, Washington, United States. It is situated along the Columbia River, approximately 40 miles north of Portland, Oregon. The city has a population of 2,500 people and is part of the Longview, Washington Metropolitan Statistical Area. The economy of Kalama is largely based on the lumber industry, and the town is also home to several small businesses. The racial makeup of the city is predominantly White, with a small percentage of African American, Native American, Asian, and Pacific Islander residents.
Common Questions
What is Per Capita Income in Kalama?
Per Capita income in Kalama is $45,813.
What is the Median Family Income in Kalama?
Median Family Income in Kalama is $128,477.
What is the Median Household income in Kalama?
Median Household Income in Kalama is $100,600.
What is Income or Wage Gap in Kalama?
Income or Wage Gap in Kalama is 60.3%.
Women in Kalama earn 39.7 cents for every dollar earned by a man.
What is Family Income Deficit in Kalama?
Family Income Deficit in Kalama is $11,145.
Families that are below poverty line in Kalama earn $11,145 less on average than the poverty threshold level.
What is Inequality or Gini Index in Kalama?
Inequality or Gini Index in Kalama is 0.43.
What is the Total Population of Kalama?
Total Population of Kalama is 2,952.
What is the Total Male Population of Kalama?
Total Male Population of Kalama is 1,440.
What is the Total Female Population of Kalama?
Total Female Population of Kalama is 1,512.
What is the Ratio of Males per 100 Females in Kalama?
There are 95.24 Males per 100 Females in Kalama.
What is the Ratio of Females per 100 Males in Kalama?
There are 105.00 Females per 100 Males in Kalama.
What is the Median Population Age in Kalama?
Median Population Age in Kalama is 52.5 Years.
What is the Average Family Size in Kalama
Average Family Size in Kalama is 2.6 People.
What is the Average Household Size in Kalama
Average Household Size in Kalama is 2.2 People.
How Large is the Labor Force in Kalama?
There are 1,304 People in the Labor Forcein in Kalama.
What is the Percentage of People in the Labor Force in Kalama?
51.9% of People are in the Labor Force in Kalama.
What is the Unemployment Rate in Kalama?
Unemployment Rate in Kalama is 1.6%.