Wishram, WA Map & Demographics
Wishram Map
Wishram Overview
$20,448
PER CAPITA INCOME
$43,750
AVG FAMILY INCOME
$41,750
AVG HOUSEHOLD INCOME
7.1%
WAGE / INCOME GAP [ % ]
92.9¢/ $1
WAGE / INCOME GAP [ $ ]
0.42
INEQUALITY / GINI INDEX
502
TOTAL POPULATION
224
MALE POPULATION
278
FEMALE POPULATION
80.58
MALES / 100 FEMALES
124.11
FEMALES / 100 MALES
48.2
MEDIAN AGE
3.5
AVG FAMILY SIZE
2.6
AVG HOUSEHOLD SIZE
155
LABOR FORCE [ PEOPLE ]
35.3%
PERCENT IN LABOR FORCE
17.4%
UNEMPLOYMENT RATE
Wishram Zip Codes
Wishram Area Codes
Income in Wishram
Income Overview in Wishram
Per Capita Income in Wishram is $20,448, while median incomes of families and households are $43,750 and $41,750 respectively.
| Characteristic | Number | Measure |
| Per Capita Income | 502 | $20,448 |
| Median Family Income | 97 | $43,750 |
| Mean Family Income | 97 | $58,985 |
| Median Household Income | 190 | $41,750 |
| Mean Household Income | 190 | $51,418 |
| Income Deficit | 97 | $0 |
| Wage / Income Gap (%) | 502 | 7.11% |
| Wage / Income Gap ($) | 502 | 92.89¢ per $1 |
| Gini / Inequality Index | 502 | 0.42 |
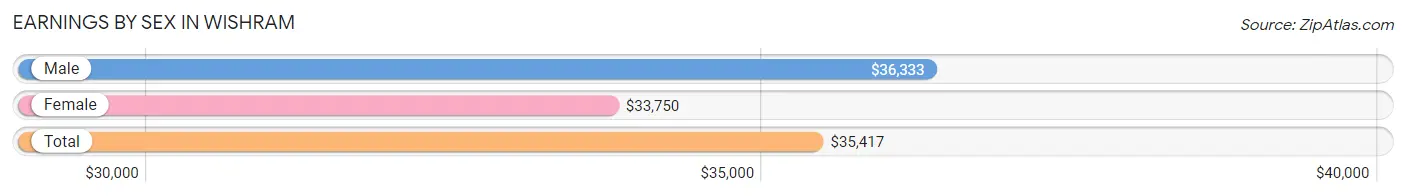
Earnings by Sex in Wishram
Average Earnings in Wishram are $35,417, $36,333 for men and $33,750 for women, a difference of 7.1%.
| Sex | Number | Average Earnings |
| Male | 74 (50.3%) | $36,333 |
| Female | 73 (49.7%) | $33,750 |
| Total | 147 (100.0%) | $35,417 |
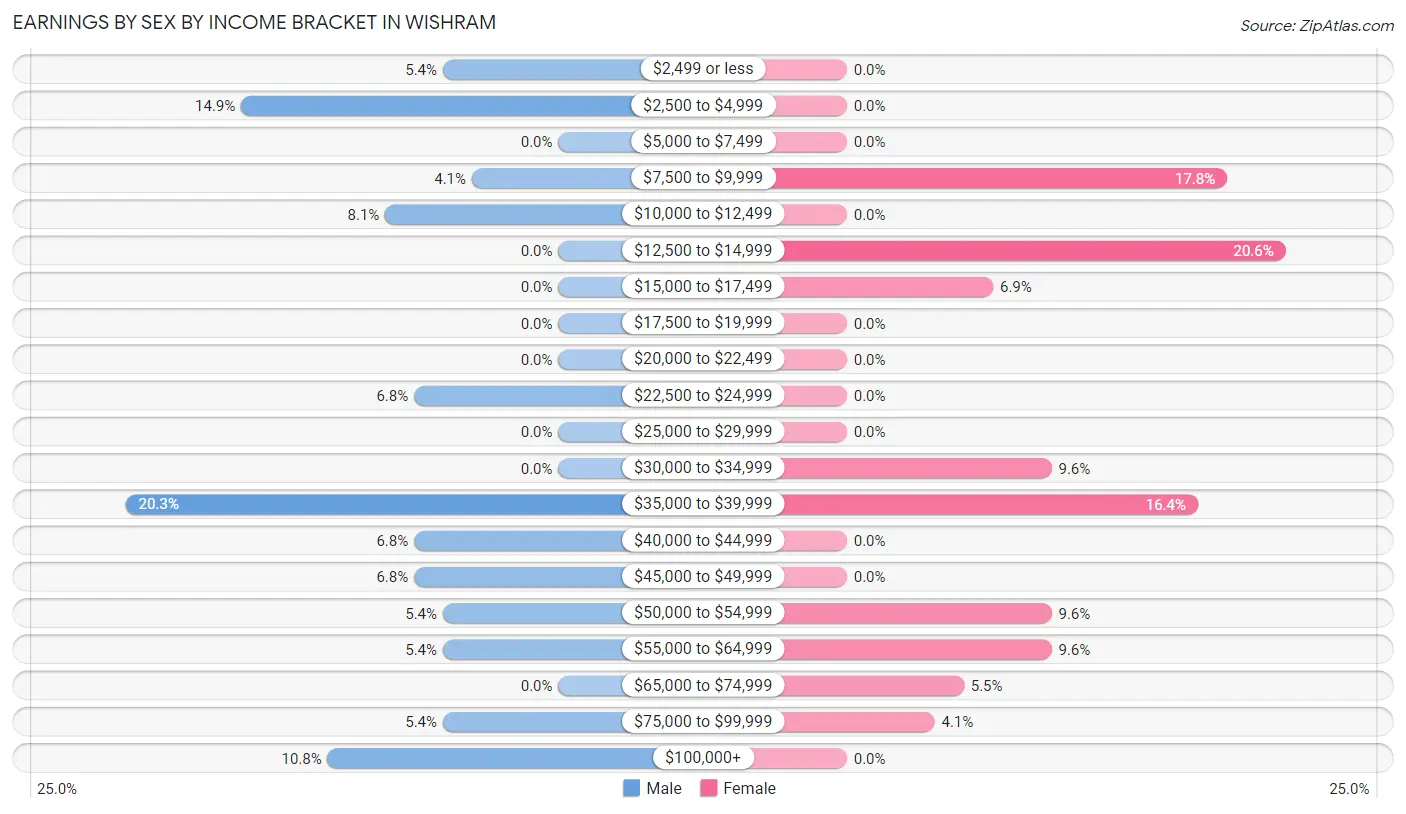
Earnings by Sex by Income Bracket in Wishram
The most common earnings brackets in Wishram are $35,000 to $39,999 for men (15 | 20.3%) and $12,500 to $14,999 for women (15 | 20.5%).
| Income | Male | Female |
| $2,499 or less | 4 (5.4%) | 0 (0.0%) |
| $2,500 to $4,999 | 11 (14.9%) | 0 (0.0%) |
| $5,000 to $7,499 | 0 (0.0%) | 0 (0.0%) |
| $7,500 to $9,999 | 3 (4.1%) | 13 (17.8%) |
| $10,000 to $12,499 | 6 (8.1%) | 0 (0.0%) |
| $12,500 to $14,999 | 0 (0.0%) | 15 (20.5%) |
| $15,000 to $17,499 | 0 (0.0%) | 5 (6.9%) |
| $17,500 to $19,999 | 0 (0.0%) | 0 (0.0%) |
| $20,000 to $22,499 | 0 (0.0%) | 0 (0.0%) |
| $22,500 to $24,999 | 5 (6.8%) | 0 (0.0%) |
| $25,000 to $29,999 | 0 (0.0%) | 0 (0.0%) |
| $30,000 to $34,999 | 0 (0.0%) | 7 (9.6%) |
| $35,000 to $39,999 | 15 (20.3%) | 12 (16.4%) |
| $40,000 to $44,999 | 5 (6.8%) | 0 (0.0%) |
| $45,000 to $49,999 | 5 (6.8%) | 0 (0.0%) |
| $50,000 to $54,999 | 4 (5.4%) | 7 (9.6%) |
| $55,000 to $64,999 | 4 (5.4%) | 7 (9.6%) |
| $65,000 to $74,999 | 0 (0.0%) | 4 (5.5%) |
| $75,000 to $99,999 | 4 (5.4%) | 3 (4.1%) |
| $100,000+ | 8 (10.8%) | 0 (0.0%) |
| Total | 74 (100.0%) | 73 (100.0%) |
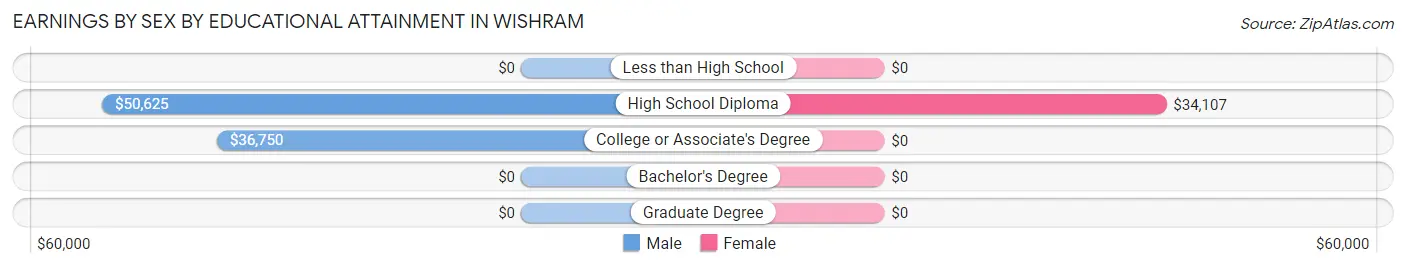
Earnings by Sex by Educational Attainment in Wishram
Average earnings in Wishram are $36,833 for men and $35,104 for women, a difference of 4.7%. Men with an educational attainment of high school diploma enjoy the highest average annual earnings of $50,625, while those with college or associate's degree education earn the least with $36,750. Women with an educational attainment of high school diploma earn the most with the average annual earnings of $34,107, while those with high school diploma education have the smallest earnings of $34,107.
| Educational Attainment | Male Income | Female Income |
| Less than High School | - | - |
| High School Diploma | $50,625 | $34,107 |
| College or Associate's Degree | $36,750 | $0 |
| Bachelor's Degree | - | - |
| Graduate Degree | - | - |
| Total | $36,833 | $35,104 |
Family Income in Wishram
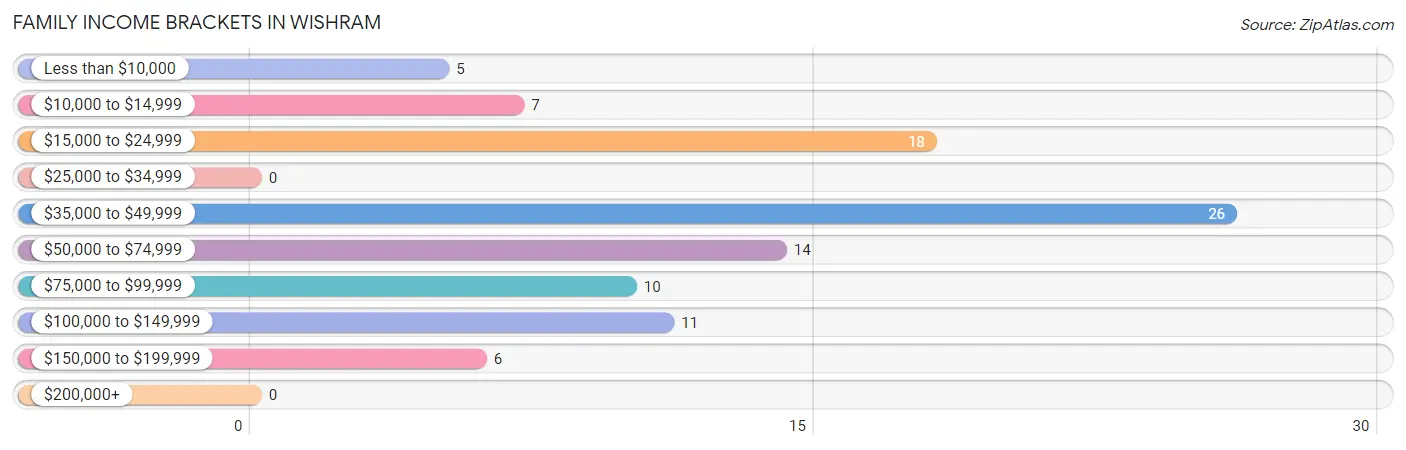
Family Income Brackets in Wishram
According to the Wishram family income data, there are 26 families falling into the $35,000 to $49,999 income range, which is the most common income bracket and makes up 26.8% of all families.
| Income Bracket | # Families | % Families |
| Less than $10,000 | 5 | 5.2% |
| $10,000 to $14,999 | 7 | 7.2% |
| $15,000 to $24,999 | 18 | 18.6% |
| $25,000 to $34,999 | 0 | 0.0% |
| $35,000 to $49,999 | 26 | 26.8% |
| $50,000 to $74,999 | 14 | 14.4% |
| $75,000 to $99,999 | 10 | 10.3% |
| $100,000 to $149,999 | 11 | 11.3% |
| $150,000 to $199,999 | 6 | 6.2% |
| $200,000+ | 0 | 0.0% |
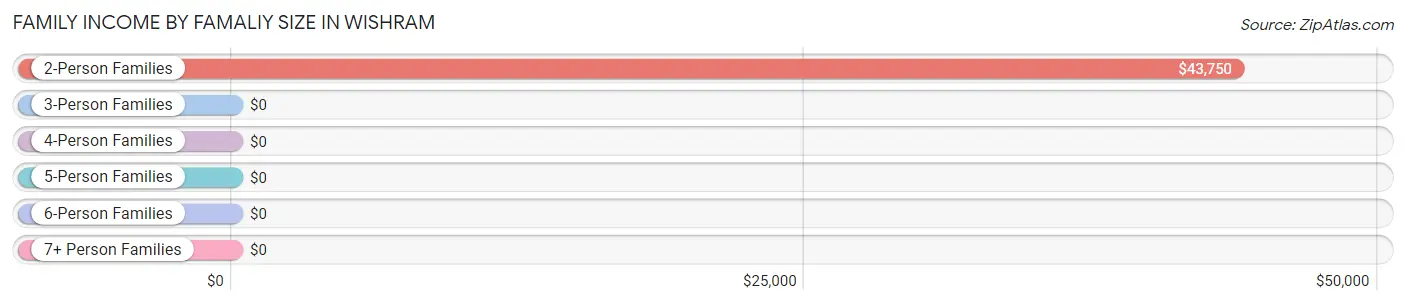
Family Income by Famaliy Size in Wishram
2-person families (61 | 62.9%) account for the highest median family income in Wishram with $43,750 per family, while 2-person families (61 | 62.9%) have the highest median income of $21,875 per family member.
| Income Bracket | # Families | Median Income |
| 2-Person Families | 61 (62.9%) | $43,750 |
| 3-Person Families | 10 (10.3%) | $0 |
| 4-Person Families | 12 (12.4%) | $0 |
| 5-Person Families | 3 (3.1%) | $0 |
| 6-Person Families | 7 (7.2%) | $0 |
| 7+ Person Families | 4 (4.1%) | $0 |
| Total | 97 (100.0%) | $43,750 |
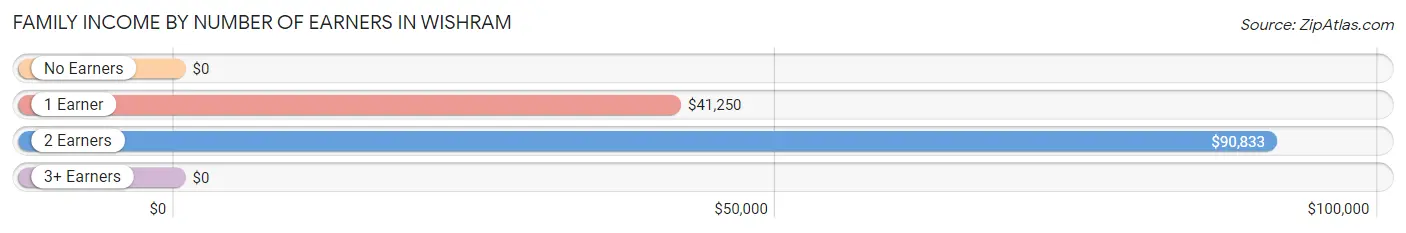
Family Income by Number of Earners in Wishram
| Number of Earners | # Families | Median Income |
| No Earners | 40 (41.2%) | $0 |
| 1 Earner | 40 (41.2%) | $41,250 |
| 2 Earners | 8 (8.3%) | $90,833 |
| 3+ Earners | 9 (9.3%) | $0 |
| Total | 97 (100.0%) | $43,750 |
Household Income in Wishram
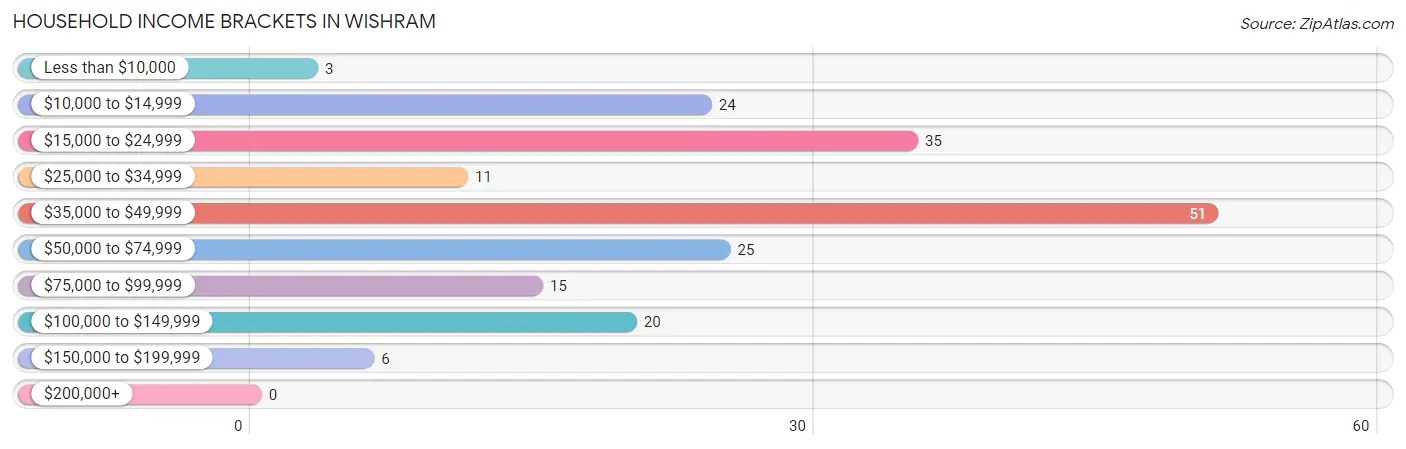
Household Income Brackets in Wishram
With 51 households falling in the category, the $35,000 to $49,999 income range is the most frequent in Wishram, accounting for 26.8% of all households.
| Income Bracket | # Households | % Households |
| Less than $10,000 | 3 | 1.6% |
| $10,000 to $14,999 | 24 | 12.6% |
| $15,000 to $24,999 | 35 | 18.4% |
| $25,000 to $34,999 | 11 | 5.8% |
| $35,000 to $49,999 | 51 | 26.8% |
| $50,000 to $74,999 | 25 | 13.2% |
| $75,000 to $99,999 | 15 | 7.9% |
| $100,000 to $149,999 | 20 | 10.5% |
| $150,000 to $199,999 | 6 | 3.2% |
| $200,000+ | 0 | 0.0% |
Household Income by Householder Age in Wishram
The median household income in Wishram is $41,750, with the highest median household income of $45,938 found in the 25 to 44 years age bracket for the primary householder. A total of 31 households (16.3%) fall into this category. Meanwhile, the 15 to 24 years age bracket for the primary householder has the lowest median household income of $0, with 5 households (2.6%) in this group.
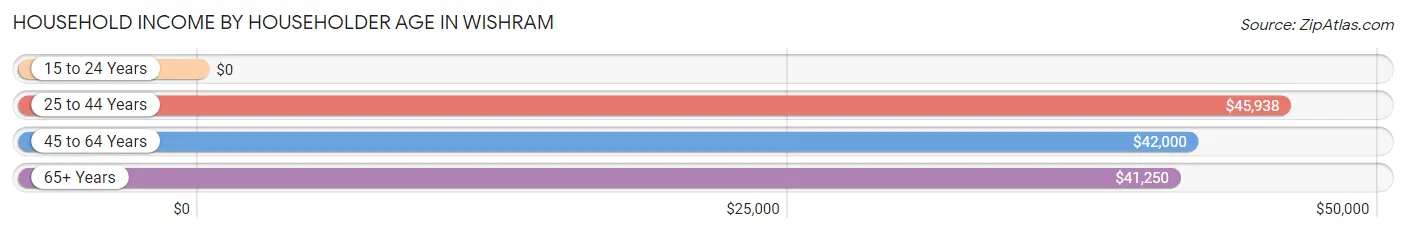
| Income Bracket | # Households | Median Income |
| 15 to 24 Years | 5 (2.6%) | $0 |
| 25 to 44 Years | 31 (16.3%) | $45,938 |
| 45 to 64 Years | 78 (41.0%) | $42,000 |
| 65+ Years | 76 (40.0%) | $41,250 |
| Total | 190 (100.0%) | $41,750 |
Poverty in Wishram
Income Below Poverty by Sex and Age in Wishram
With 22.3% poverty level for males and 27.7% for females among the residents of Wishram, 35 to 44 year old males and under 5 year old females are the most vulnerable to poverty, with 5 males (50.0%) and 6 females (100.0%) in their respective age groups living below the poverty level.
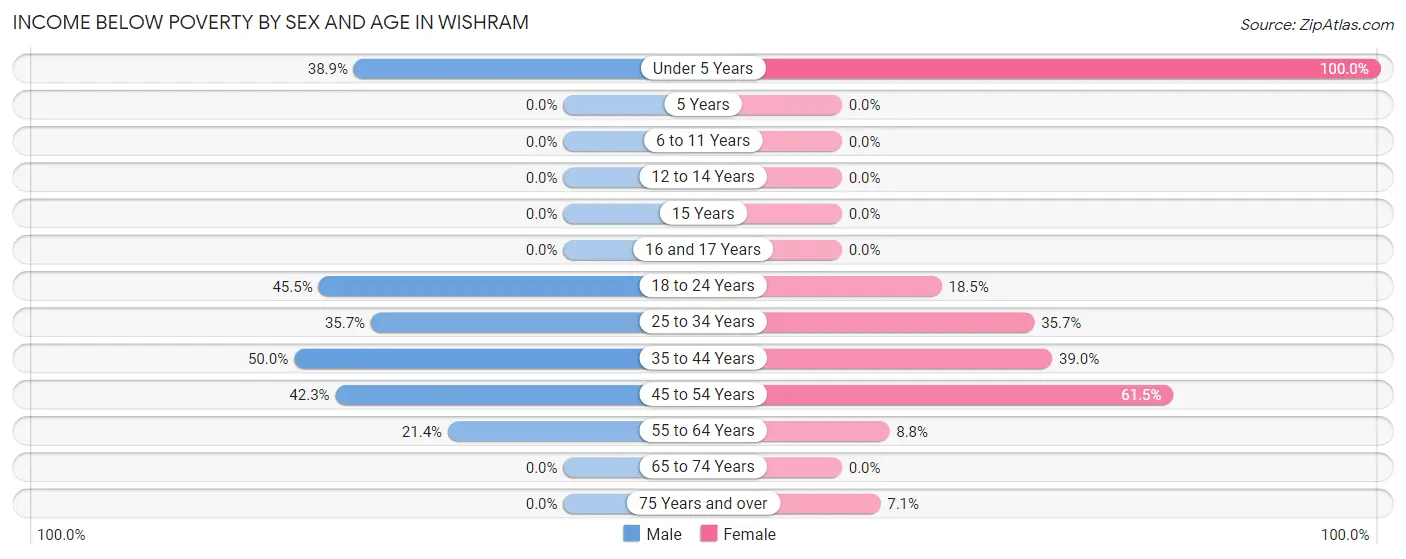
| Age Bracket | Male | Female |
| Under 5 Years | 7 (38.9%) | 6 (100.0%) |
| 5 Years | 0 (0.0%) | 0 (0.0%) |
| 6 to 11 Years | 0 (0.0%) | 0 (0.0%) |
| 12 to 14 Years | 0 (0.0%) | 0 (0.0%) |
| 15 Years | 0 (0.0%) | 0 (0.0%) |
| 16 and 17 Years | 0 (0.0%) | 0 (0.0%) |
| 18 to 24 Years | 5 (45.5%) | 5 (18.5%) |
| 25 to 34 Years | 5 (35.7%) | 5 (35.7%) |
| 35 to 44 Years | 5 (50.0%) | 16 (39.0%) |
| 45 to 54 Years | 22 (42.3%) | 40 (61.5%) |
| 55 to 64 Years | 6 (21.4%) | 3 (8.8%) |
| 65 to 74 Years | 0 (0.0%) | 0 (0.0%) |
| 75 Years and over | 0 (0.0%) | 2 (7.1%) |
| Total | 50 (22.3%) | 77 (27.7%) |
Income Above Poverty by Sex and Age in Wishram
According to the poverty statistics in Wishram, males aged 6 to 11 years and females aged 6 to 11 years are the age groups that are most secure financially, with 100.0% of males and 100.0% of females in these age groups living above the poverty line.
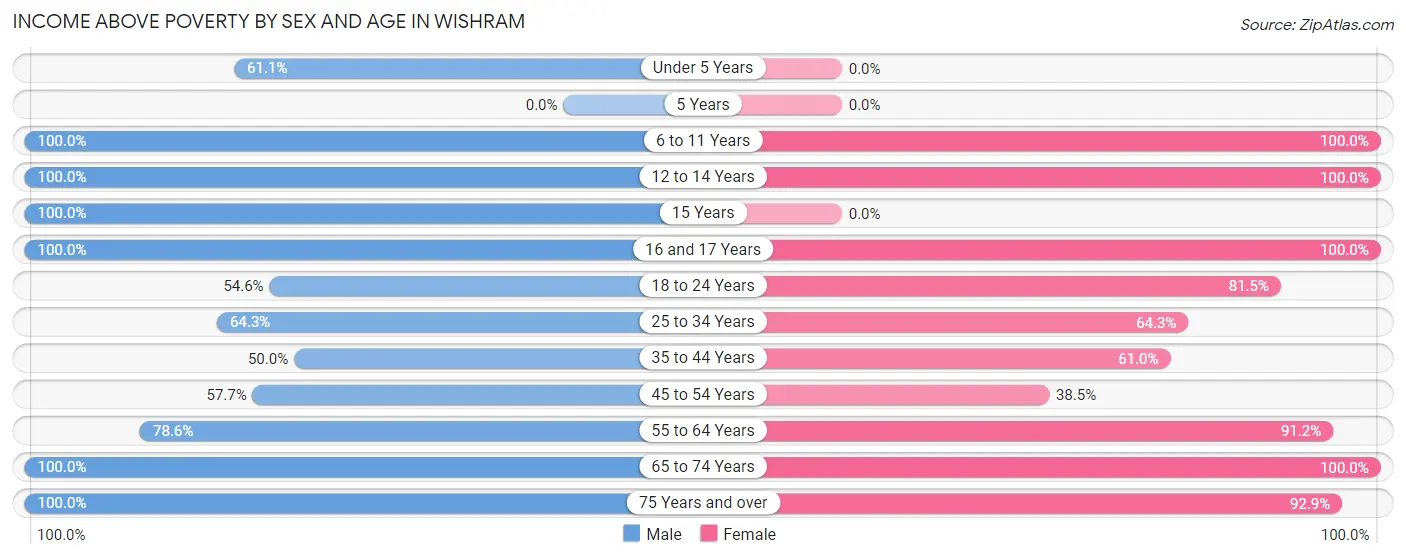
| Age Bracket | Male | Female |
| Under 5 Years | 11 (61.1%) | 0 (0.0%) |
| 5 Years | 0 (0.0%) | 0 (0.0%) |
| 6 to 11 Years | 12 (100.0%) | 4 (100.0%) |
| 12 to 14 Years | 4 (100.0%) | 11 (100.0%) |
| 15 Years | 8 (100.0%) | 0 (0.0%) |
| 16 and 17 Years | 11 (100.0%) | 35 (100.0%) |
| 18 to 24 Years | 6 (54.5%) | 22 (81.5%) |
| 25 to 34 Years | 9 (64.3%) | 9 (64.3%) |
| 35 to 44 Years | 5 (50.0%) | 25 (61.0%) |
| 45 to 54 Years | 30 (57.7%) | 25 (38.5%) |
| 55 to 64 Years | 22 (78.6%) | 31 (91.2%) |
| 65 to 74 Years | 40 (100.0%) | 13 (100.0%) |
| 75 Years and over | 16 (100.0%) | 26 (92.9%) |
| Total | 174 (77.7%) | 201 (72.3%) |
Income Below Poverty Among Married-Couple Families in Wishram
The poverty statistics for married-couple families in Wishram show that 13.3% or 8 of the total 60 families live below the poverty line. Families with no children have the highest poverty rate of 15.1%, comprising of 8 families. On the other hand, families with 3 or 4 children have the lowest poverty rate of 0.0%, which includes 0 families.
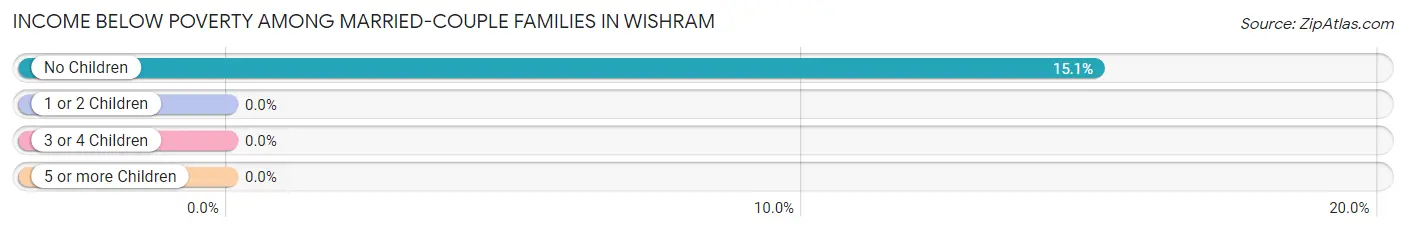
| Children | Above Poverty | Below Poverty |
| No Children | 45 (84.9%) | 8 (15.1%) |
| 1 or 2 Children | 0 (0.0%) | 0 (0.0%) |
| 3 or 4 Children | 3 (100.0%) | 0 (0.0%) |
| 5 or more Children | 4 (100.0%) | 0 (0.0%) |
| Total | 52 (86.7%) | 8 (13.3%) |
Income Below Poverty Among Single-Parent Households in Wishram
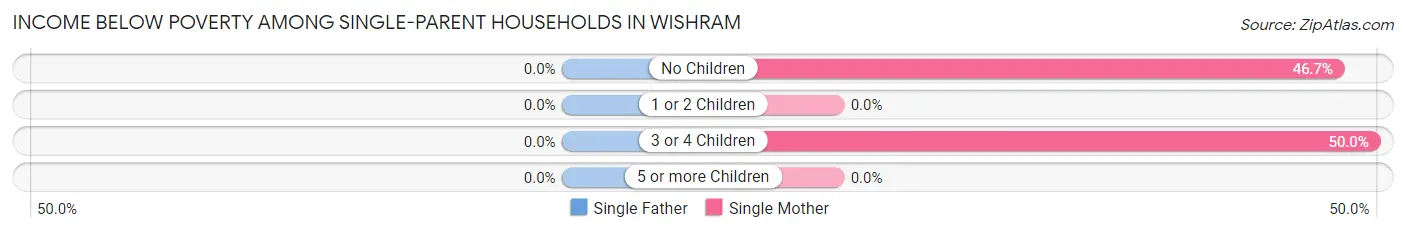
| Children | Single Father | Single Mother |
| No Children | 0 (0.0%) | 7 (46.7%) |
| 1 or 2 Children | 0 (0.0%) | 0 (0.0%) |
| 3 or 4 Children | 0 (0.0%) | 5 (50.0%) |
| 5 or more Children | 0 (0.0%) | 0 (0.0%) |
| Total | 0 (0.0%) | 12 (35.3%) |
Income Below Poverty Among Married-Couple vs Single-Parent Households in Wishram
The poverty data for Wishram shows that 8 of the married-couple family households (13.3%) and 12 of the single-parent households (32.4%) are living below the poverty level. Within the married-couple family households, those with no children have the highest poverty rate, with 8 households (15.1%) falling below the poverty line. Among the single-parent households, those with 3 or 4 children have the highest poverty rate, with 5 household (50.0%) living below poverty.
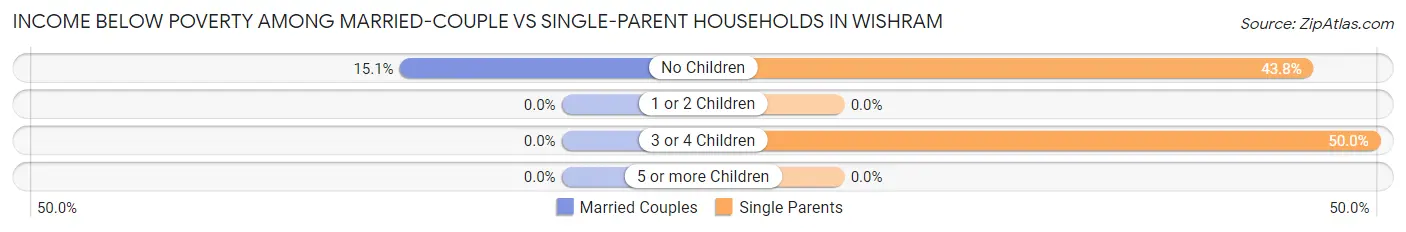
| Children | Married-Couple Families | Single-Parent Households |
| No Children | 8 (15.1%) | 7 (43.8%) |
| 1 or 2 Children | 0 (0.0%) | 0 (0.0%) |
| 3 or 4 Children | 0 (0.0%) | 5 (50.0%) |
| 5 or more Children | 0 (0.0%) | 0 (0.0%) |
| Total | 8 (13.3%) | 12 (32.4%) |
Race in Wishram
The most populous races in Wishram are White / Caucasian (469 | 93.4%), Some other Race (15 | 3.0%), and Native / Alaskan (10 | 2.0%).
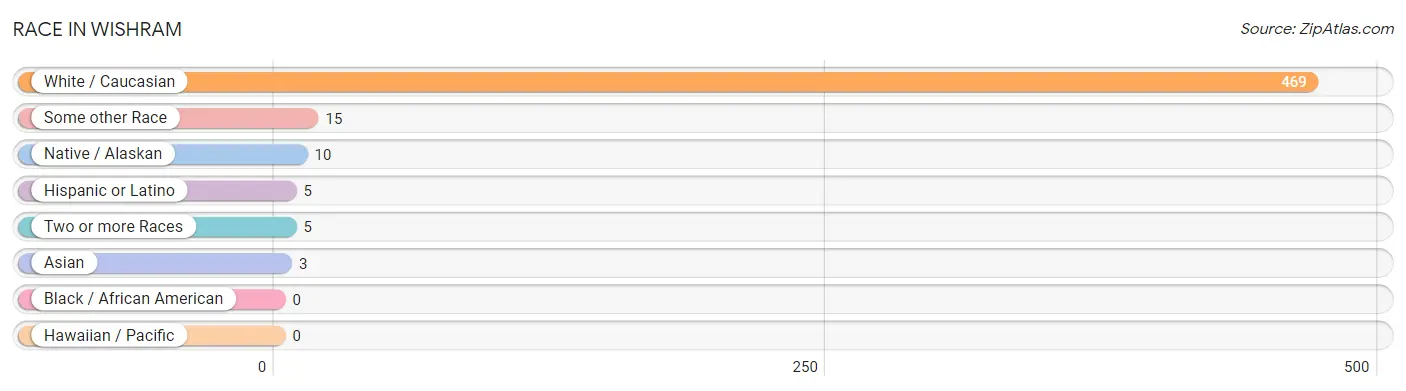
| Race | # Population | % Population |
| Asian | 3 | 0.6% |
| Black / African American | 0 | 0.0% |
| Hawaiian / Pacific | 0 | 0.0% |
| Hispanic or Latino | 5 | 1.0% |
| Native / Alaskan | 10 | 2.0% |
| White / Caucasian | 469 | 93.4% |
| Two or more Races | 5 | 1.0% |
| Some other Race | 15 | 3.0% |
| Total | 502 | 100.0% |
Ancestry in Wishram
The most populous ancestries reported in Wishram are German (119 | 23.7%), European (102 | 20.3%), American (84 | 16.7%), Irish (74 | 14.7%), and French (46 | 9.2%), together accounting for 84.7% of all Wishram residents.
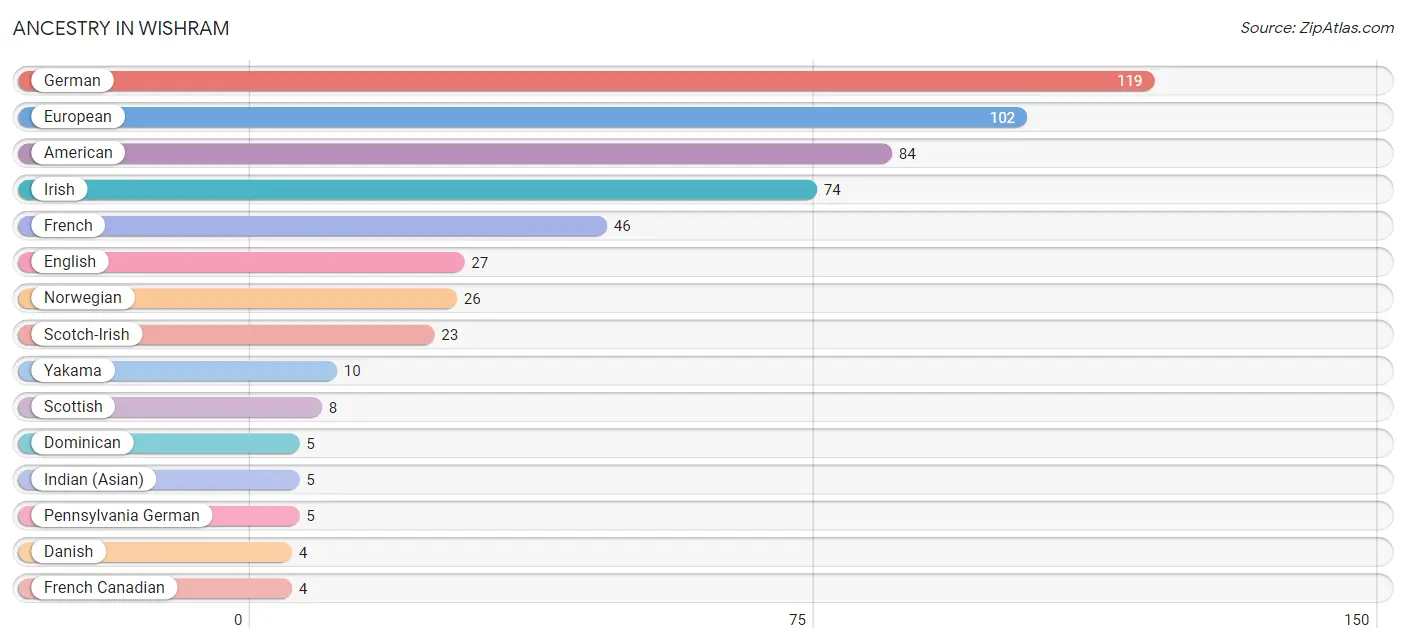
| Ancestry | # Population | % Population |
| American | 84 | 16.7% |
| Canadian | 2 | 0.4% |
| Danish | 4 | 0.8% |
| Dominican | 5 | 1.0% |
| English | 27 | 5.4% |
| European | 102 | 20.3% |
| French | 46 | 9.2% |
| French Canadian | 4 | 0.8% |
| German | 119 | 23.7% |
| Indian (Asian) | 5 | 1.0% |
| Irish | 74 | 14.7% |
| Italian | 3 | 0.6% |
| Norwegian | 26 | 5.2% |
| Pennsylvania German | 5 | 1.0% |
| Scotch-Irish | 23 | 4.6% |
| Scottish | 8 | 1.6% |
| Yakama | 10 | 2.0% | View All 17 Rows |
Immigrants in Wishram
The most numerous immigrant groups reported in Wishram came from Caribbean (5 | 1.0%), Dominican Republic (5 | 1.0%), Latin America (5 | 1.0%), Asia (3 | 0.6%), and Indonesia (3 | 0.6%), together accounting for 4.2% of all Wishram residents.
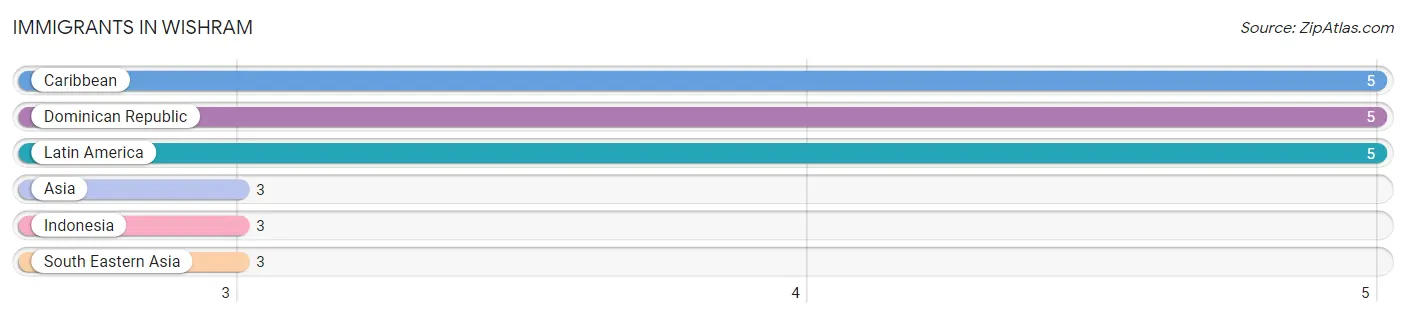
| Immigration Origin | # Population | % Population |
| Asia | 3 | 0.6% |
| Caribbean | 5 | 1.0% |
| Dominican Republic | 5 | 1.0% |
| Indonesia | 3 | 0.6% |
| Latin America | 5 | 1.0% |
| South Eastern Asia | 3 | 0.6% | View All 6 Rows |
Sex and Age in Wishram
Sex and Age in Wishram
The most populous age groups in Wishram are 50 to 54 Years (42 | 18.8%) for men and 15 to 19 Years (50 | 18.0%) for women.
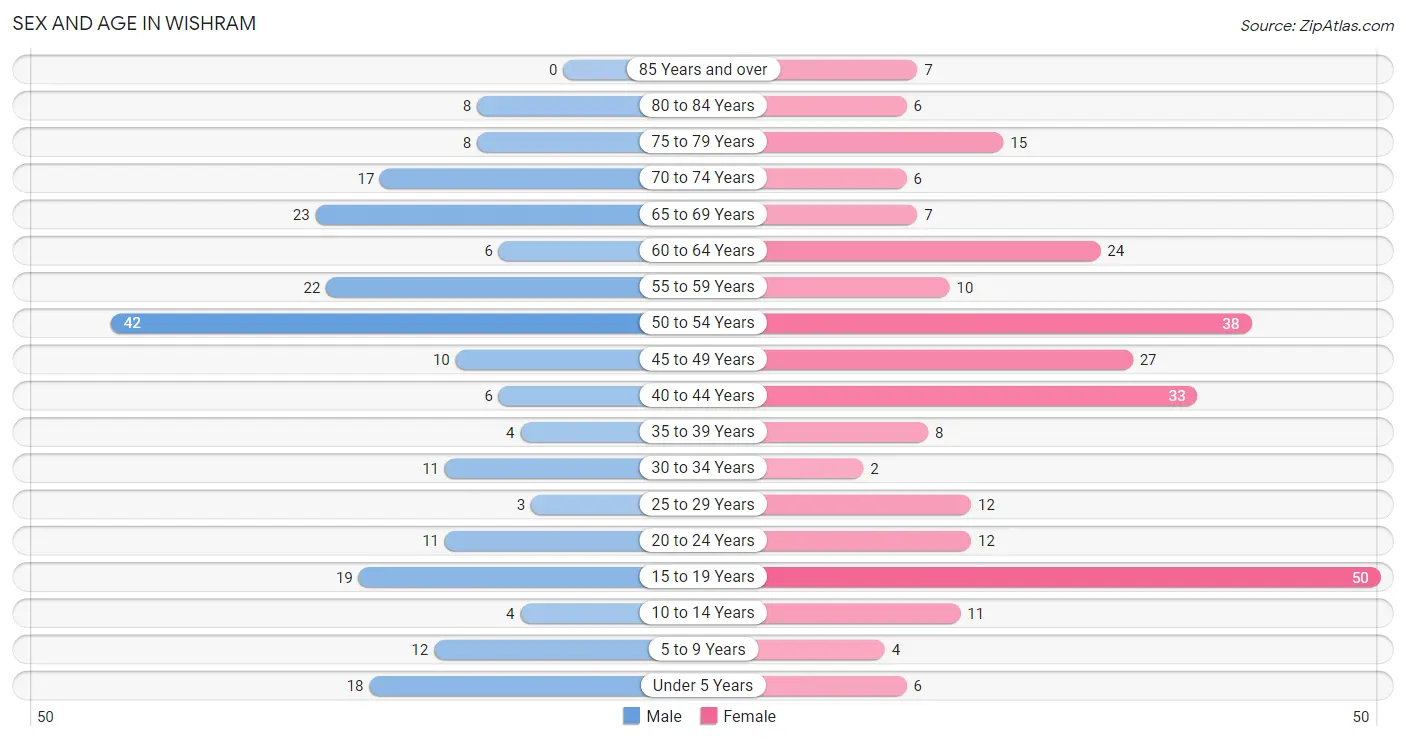
| Age Bracket | Male | Female |
| Under 5 Years | 18 (8.0%) | 6 (2.2%) |
| 5 to 9 Years | 12 (5.4%) | 4 (1.4%) |
| 10 to 14 Years | 4 (1.8%) | 11 (4.0%) |
| 15 to 19 Years | 19 (8.5%) | 50 (18.0%) |
| 20 to 24 Years | 11 (4.9%) | 12 (4.3%) |
| 25 to 29 Years | 3 (1.3%) | 12 (4.3%) |
| 30 to 34 Years | 11 (4.9%) | 2 (0.7%) |
| 35 to 39 Years | 4 (1.8%) | 8 (2.9%) |
| 40 to 44 Years | 6 (2.7%) | 33 (11.9%) |
| 45 to 49 Years | 10 (4.5%) | 27 (9.7%) |
| 50 to 54 Years | 42 (18.8%) | 38 (13.7%) |
| 55 to 59 Years | 22 (9.8%) | 10 (3.6%) |
| 60 to 64 Years | 6 (2.7%) | 24 (8.6%) |
| 65 to 69 Years | 23 (10.3%) | 7 (2.5%) |
| 70 to 74 Years | 17 (7.6%) | 6 (2.2%) |
| 75 to 79 Years | 8 (3.6%) | 15 (5.4%) |
| 80 to 84 Years | 8 (3.6%) | 6 (2.2%) |
| 85 Years and over | 0 (0.0%) | 7 (2.5%) |
| Total | 224 (100.0%) | 278 (100.0%) |
Families and Households in Wishram
Median Family Size in Wishram
The median family size in Wishram is 3.55 persons per family, with single male/father families (3 | 3.1%) accounting for the largest median family size of 9.33 persons per family. On the other hand, married-couple families (60 | 61.9%) represent the smallest median family size with 2.57 persons per family.
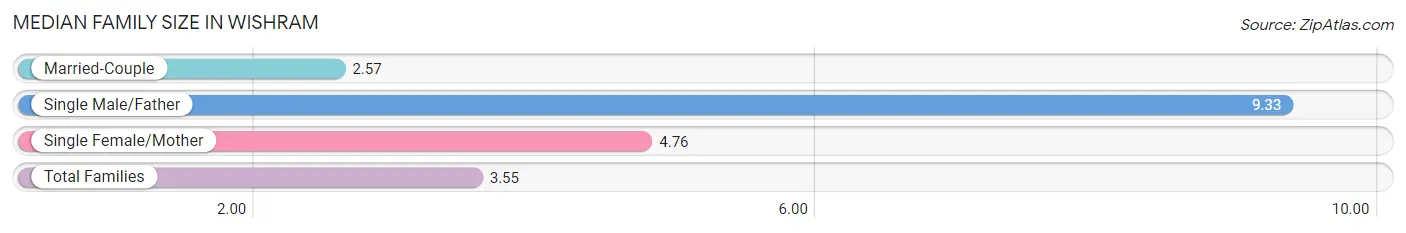
| Family Type | # Families | Family Size |
| Married-Couple | 60 (61.9%) | 2.57 |
| Single Male/Father | 3 (3.1%) | 9.33 |
| Single Female/Mother | 34 (35.0%) | 4.76 |
| Total Families | 97 (100.0%) | 3.55 |
Median Household Size in Wishram
The median household size in Wishram is 2.64 persons per household, with single male/father households (3 | 1.6%) accounting for the largest median household size of 13.33 persons per household. non-family households (93 | 48.9%) represent the smallest median household size with 1.32 persons per household.
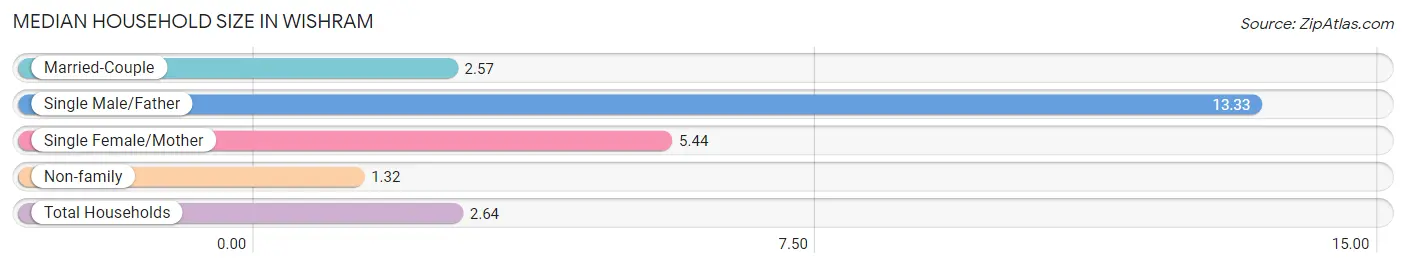
| Household Type | # Households | Household Size |
| Married-Couple | 60 (31.6%) | 2.57 |
| Single Male/Father | 3 (1.6%) | 13.33 |
| Single Female/Mother | 34 (17.9%) | 5.44 |
| Non-family | 93 (48.9%) | 1.32 |
| Total Households | 190 (100.0%) | 2.64 |
Household Size by Marriage Status in Wishram
Out of a total of 190 households in Wishram, 97 (51.0%) are family households, while 93 (48.9%) are nonfamily households. The most numerous type of family households are 2-person households, comprising 59, and the most common type of nonfamily households are 1-person households, comprising 66.
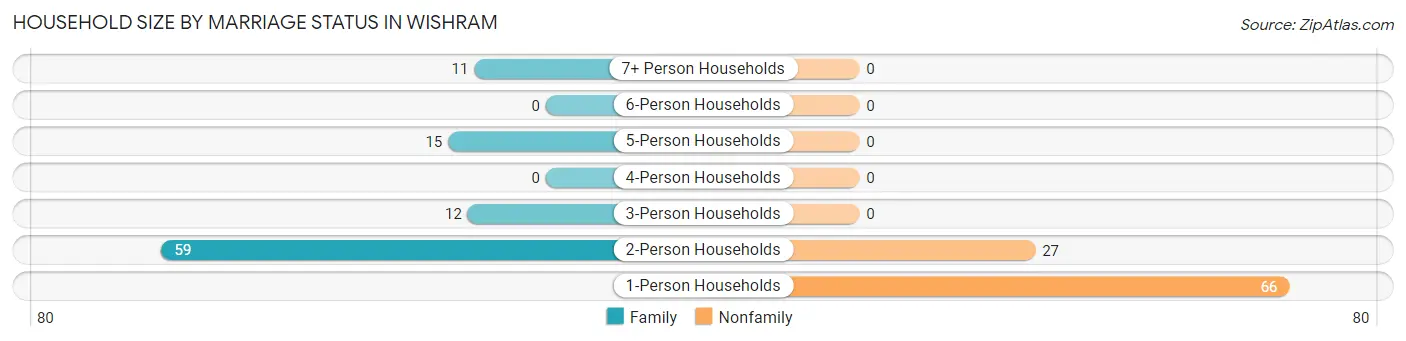
| Household Size | Family Households | Nonfamily Households |
| 1-Person Households | - | 66 (34.7%) |
| 2-Person Households | 59 (31.0%) | 27 (14.2%) |
| 3-Person Households | 12 (6.3%) | 0 (0.0%) |
| 4-Person Households | 0 (0.0%) | 0 (0.0%) |
| 5-Person Households | 15 (7.9%) | 0 (0.0%) |
| 6-Person Households | 0 (0.0%) | 0 (0.0%) |
| 7+ Person Households | 11 (5.8%) | 0 (0.0%) |
| Total | 97 (51.0%) | 93 (48.9%) |
Female Fertility in Wishram
Fertility by Age in Wishram
Average fertility rate in Wishram is 32.0 births per 1,000 women. Women in the age bracket of 20 to 34 years have the highest fertility rate with 192.0 births per 1,000 women. Women in the age bracket of 20 to 34 years acount for 100.0% of all women with births.
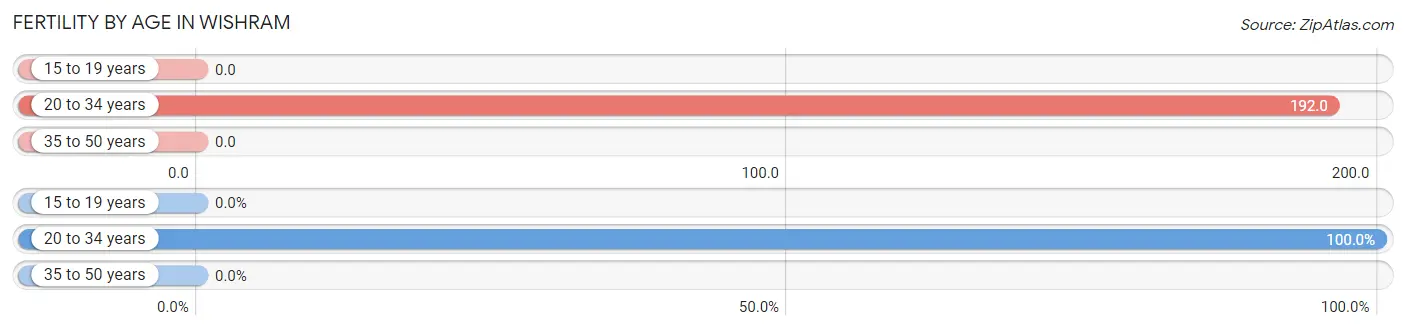
| Age Bracket | Women with Births | Births / 1,000 Women |
| 15 to 19 years | 0 (0.0%) | 0.0 |
| 20 to 34 years | 5 (100.0%) | 192.0 |
| 35 to 50 years | 0 (0.0%) | 0.0 |
| Total | 5 (100.0%) | 32.0 |
Fertility by Age by Marriage Status in Wishram
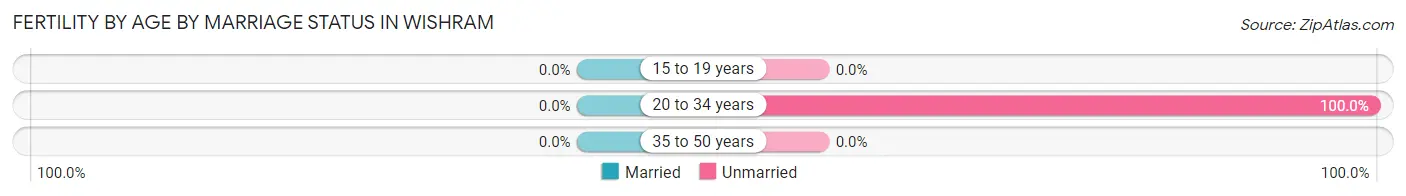
| Age Bracket | Married | Unmarried |
| 15 to 19 years | 0 (0.0%) | 0 (0.0%) |
| 20 to 34 years | 0 (0.0%) | 5 (100.0%) |
| 35 to 50 years | 0 (0.0%) | 0 (0.0%) |
| Total | 0 (0.0%) | 5 (100.0%) |
Fertility by Education in Wishram
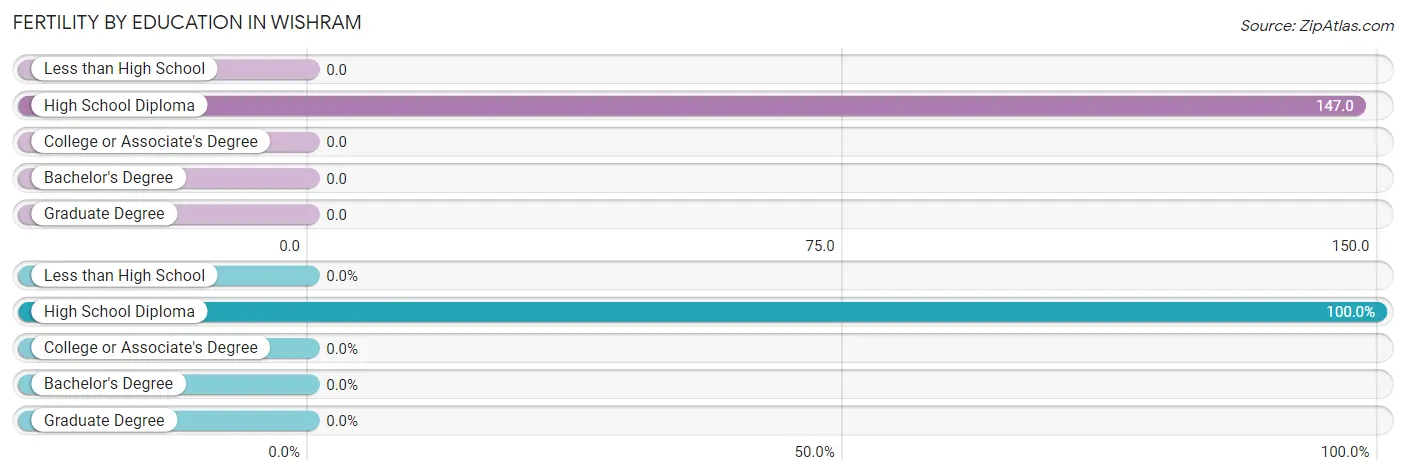
| Educational Attainment | Women with Births | Births / 1,000 Women |
| Less than High School | 0 (0.0%) | 0.0 |
| High School Diploma | 5 (100.0%) | 147.0 |
| College or Associate's Degree | 0 (0.0%) | 0.0 |
| Bachelor's Degree | 0 (0.0%) | 0.0 |
| Graduate Degree | 0 (0.0%) | 0.0 |
| Total | 5 (100.0%) | 32.0 |
Fertility by Education by Marriage Status in Wishram
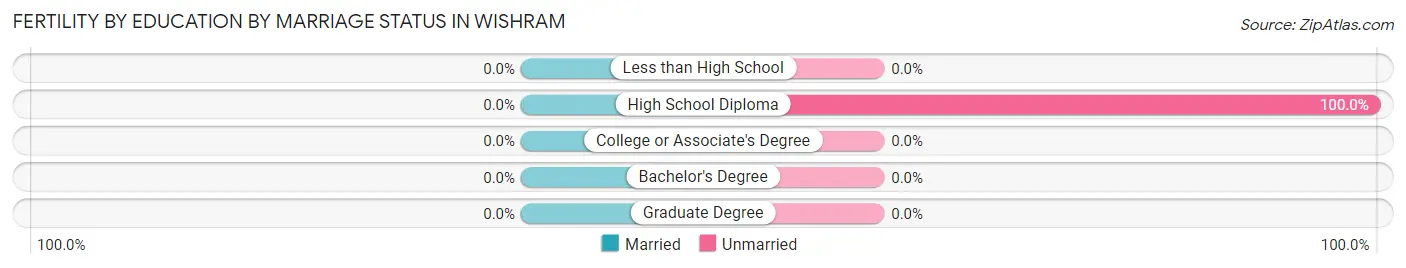
| Educational Attainment | Married | Unmarried |
| Less than High School | 0 (0.0%) | 0 (0.0%) |
| High School Diploma | 0 (0.0%) | 5 (100.0%) |
| College or Associate's Degree | 0 (0.0%) | 0 (0.0%) |
| Bachelor's Degree | 0 (0.0%) | 0 (0.0%) |
| Graduate Degree | 0 (0.0%) | 0 (0.0%) |
| Total | 0 (0.0%) | 5 (100.0%) |
Employment Characteristics in Wishram
Employment by Class of Employer in Wishram
Among the 125 employed individuals in Wishram, private company employees (106 | 84.8%), state government employees (7 | 5.6%), and federal government employees (6 | 4.8%) make up the most common classes of employment.
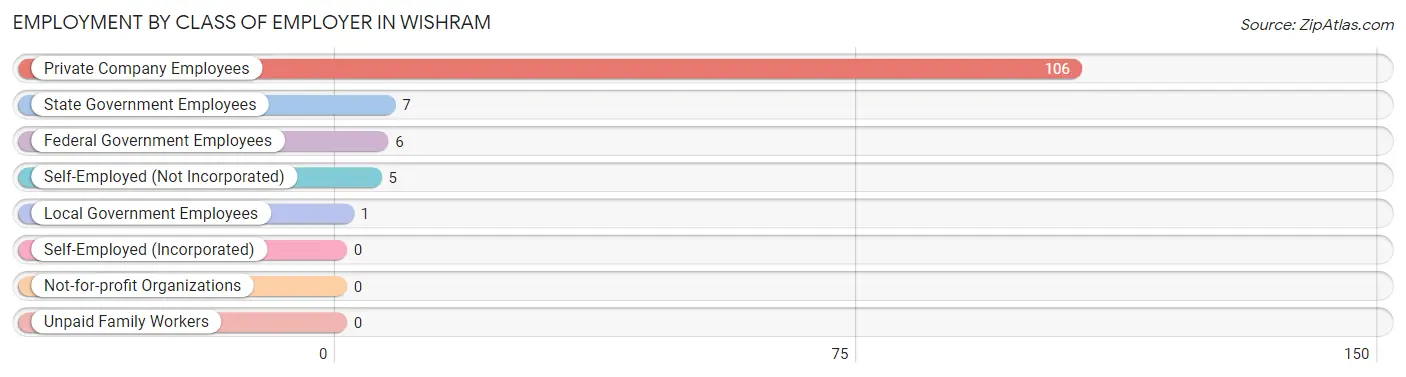
| Employer Class | # Employees | % Employees |
| Private Company Employees | 106 | 84.8% |
| Self-Employed (Incorporated) | 0 | 0.0% |
| Self-Employed (Not Incorporated) | 5 | 4.0% |
| Not-for-profit Organizations | 0 | 0.0% |
| Local Government Employees | 1 | 0.8% |
| State Government Employees | 7 | 5.6% |
| Federal Government Employees | 6 | 4.8% |
| Unpaid Family Workers | 0 | 0.0% |
| Total | 125 | 100.0% |
Employment Status by Age in Wishram
According to the labor force statistics for Wishram, out of the total population over 16 years of age (439), 35.3% or 155 individuals are in the labor force, with 17.4% or 27 of them unemployed. The age group with the highest labor force participation rate is 30 to 34 years, with 100.0% or 13 individuals in the labor force. Within the labor force, the 45 to 54 years age range has the highest percentage of unemployed individuals, with 30.8% or 16 of them being unemployed.
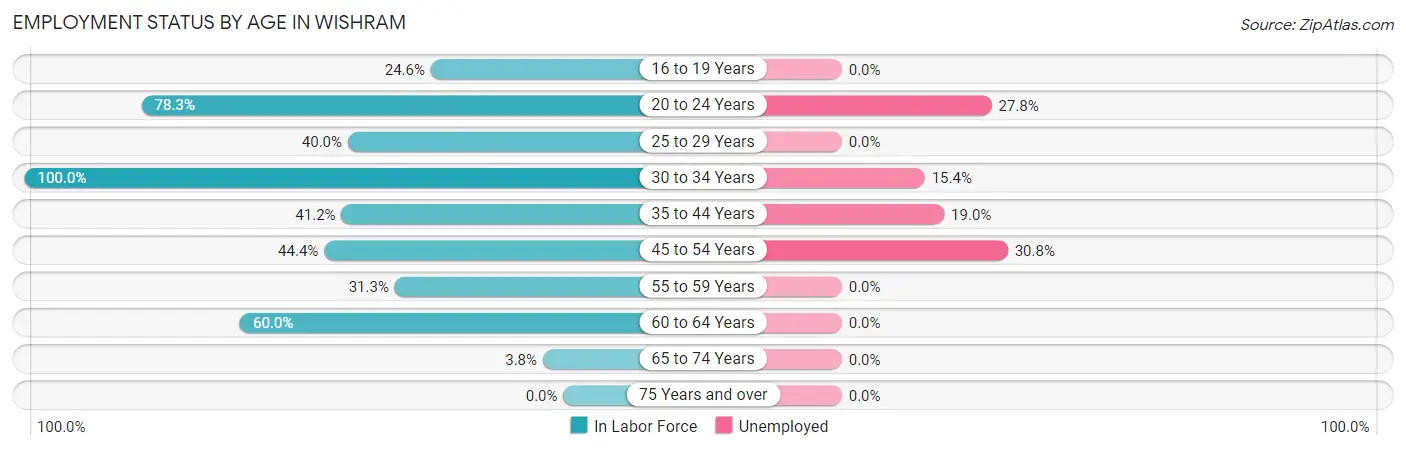
| Age Bracket | In Labor Force | Unemployed |
| 16 to 19 Years | 15 (24.6%) | 0 (0.0%) |
| 20 to 24 Years | 18 (78.3%) | 5 (27.8%) |
| 25 to 29 Years | 6 (40.0%) | 0 (0.0%) |
| 30 to 34 Years | 13 (100.0%) | 2 (15.4%) |
| 35 to 44 Years | 21 (41.2%) | 4 (19.0%) |
| 45 to 54 Years | 52 (44.4%) | 16 (30.8%) |
| 55 to 59 Years | 10 (31.3%) | 0 (0.0%) |
| 60 to 64 Years | 18 (60.0%) | 0 (0.0%) |
| 65 to 74 Years | 2 (3.8%) | 0 (0.0%) |
| 75 Years and over | 0 (0.0%) | 0 (0.0%) |
| Total | 155 (35.3%) | 27 (17.4%) |
Employment Status by Educational Attainment in Wishram
According to labor force statistics for Wishram, 46.5% of individuals (120) out of the total population between 25 and 64 years of age (258) are in the labor force, with 18.3% or 22 of them being unemployed. The group with the highest labor force participation rate are those with the educational attainment of high school diploma, with 63.2% or 43 individuals in the labor force. Within the labor force, individuals with high school diploma education have the highest percentage of unemployment, with 23.3% or 10 of them being unemployed.
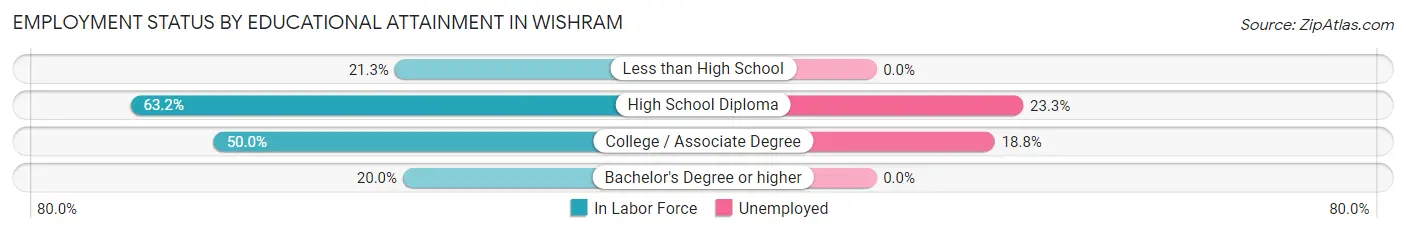
| Educational Attainment | In Labor Force | Unemployed |
| Less than High School | 10 (21.3%) | 0 (0.0%) |
| High School Diploma | 43 (63.2%) | 16 (23.3%) |
| College / Associate Degree | 64 (50.0%) | 24 (18.8%) |
| Bachelor's Degree or higher | 3 (20.0%) | 0 (0.0%) |
| Total | 120 (46.5%) | 47 (18.3%) |
Employment Occupations by Sex in Wishram
Management, Business, Science and Arts Occupations
The most common Management, Business, Science and Arts occupations in Wishram are Health Diagnosing & Treating (7 | 5.5%), and Management (6 | 4.7%).
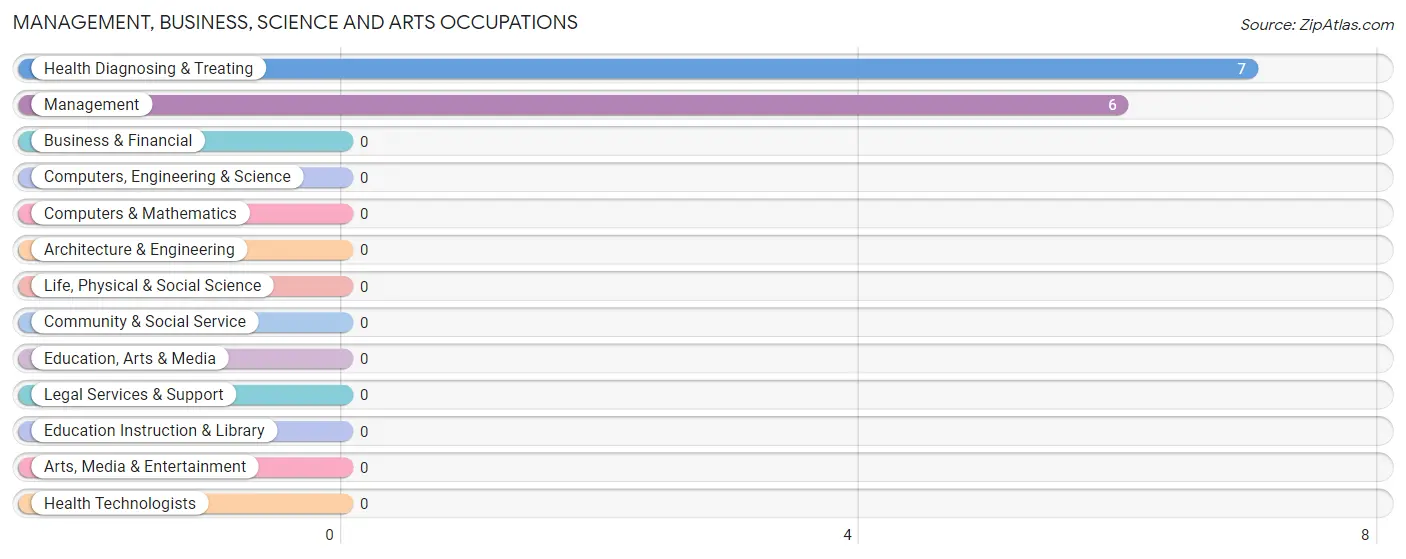
Management, Business, Science and Arts Occupations by Sex
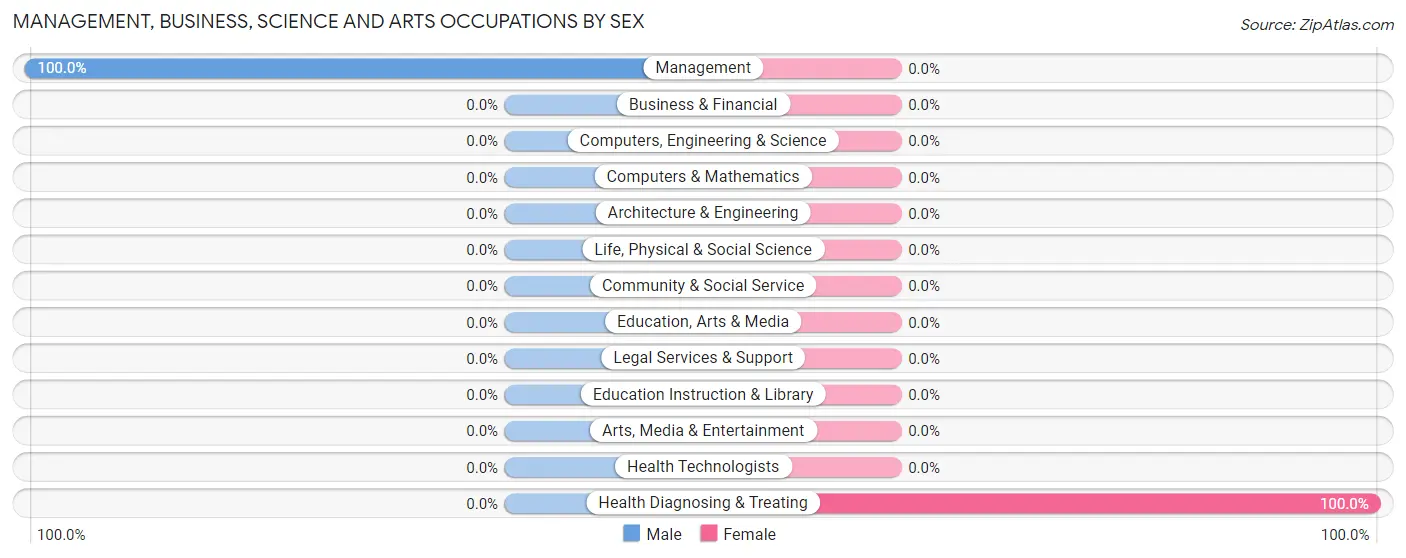
| Occupation | Male | Female |
| Management | 6 (100.0%) | 0 (0.0%) |
| Business & Financial | 0 (0.0%) | 0 (0.0%) |
| Computers, Engineering & Science | 0 (0.0%) | 0 (0.0%) |
| Computers & Mathematics | 0 (0.0%) | 0 (0.0%) |
| Architecture & Engineering | 0 (0.0%) | 0 (0.0%) |
| Life, Physical & Social Science | 0 (0.0%) | 0 (0.0%) |
| Community & Social Service | 0 (0.0%) | 0 (0.0%) |
| Education, Arts & Media | 0 (0.0%) | 0 (0.0%) |
| Legal Services & Support | 0 (0.0%) | 0 (0.0%) |
| Education Instruction & Library | 0 (0.0%) | 0 (0.0%) |
| Arts, Media & Entertainment | 0 (0.0%) | 0 (0.0%) |
| Health Diagnosing & Treating | 0 (0.0%) | 7 (100.0%) |
| Health Technologists | 0 (0.0%) | 0 (0.0%) |
| Total (Category) | 6 (46.2%) | 7 (53.8%) |
| Total (Overall) | 68 (53.1%) | 60 (46.9%) |
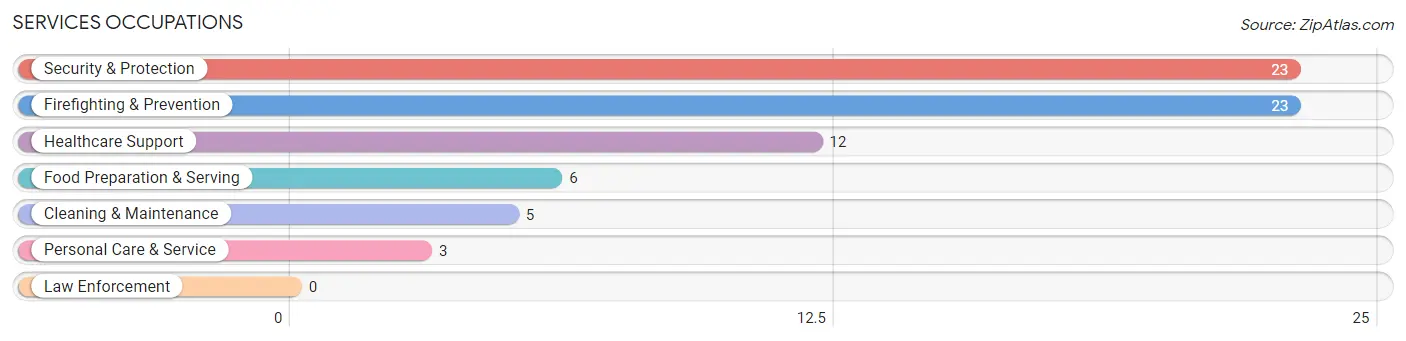
Services Occupations
The most common Services occupations in Wishram are Security & Protection (23 | 18.0%), Firefighting & Prevention (23 | 18.0%), Healthcare Support (12 | 9.4%), Food Preparation & Serving (6 | 4.7%), and Cleaning & Maintenance (5 | 3.9%).
Services Occupations by Sex
Within the Services occupations in Wishram, the most male-oriented occupations are Security & Protection (100.0%), Firefighting & Prevention (100.0%), and Cleaning & Maintenance (100.0%), while the most female-oriented occupations are Healthcare Support (100.0%), Personal Care & Service (100.0%), and Food Preparation & Serving (66.7%).
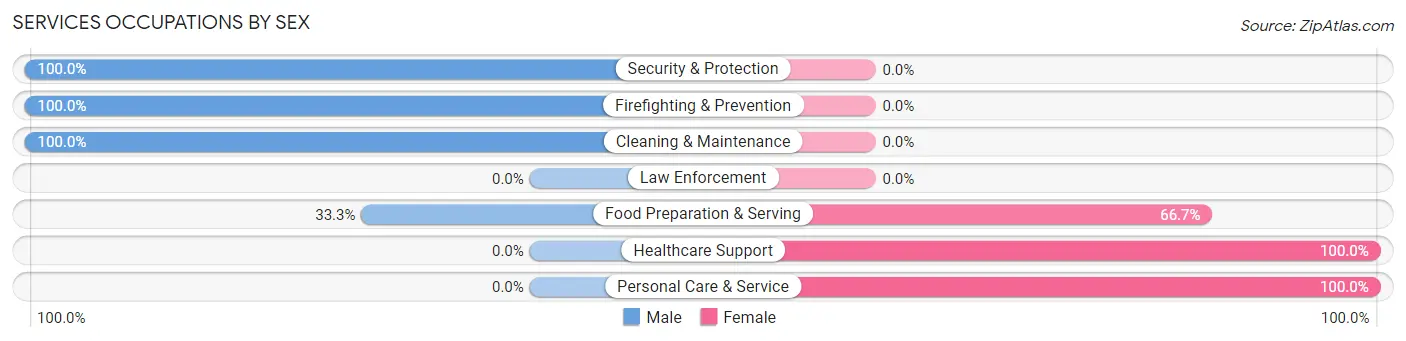
| Occupation | Male | Female |
| Healthcare Support | 0 (0.0%) | 12 (100.0%) |
| Security & Protection | 23 (100.0%) | 0 (0.0%) |
| Firefighting & Prevention | 23 (100.0%) | 0 (0.0%) |
| Law Enforcement | 0 (0.0%) | 0 (0.0%) |
| Food Preparation & Serving | 2 (33.3%) | 4 (66.7%) |
| Cleaning & Maintenance | 5 (100.0%) | 0 (0.0%) |
| Personal Care & Service | 0 (0.0%) | 3 (100.0%) |
| Total (Category) | 30 (61.2%) | 19 (38.8%) |
| Total (Overall) | 68 (53.1%) | 60 (46.9%) |
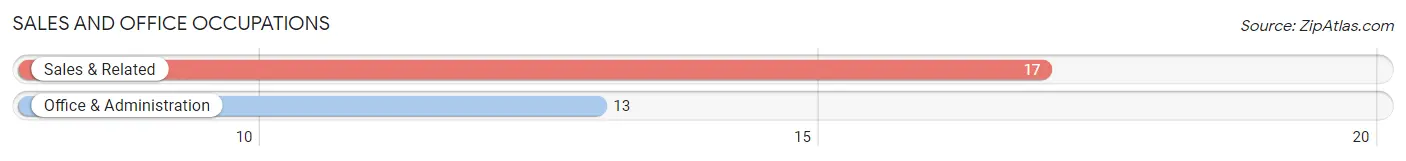
Sales and Office Occupations
The most common Sales and Office occupations in Wishram are Sales & Related (17 | 13.3%), and Office & Administration (13 | 10.2%).
Sales and Office Occupations by Sex
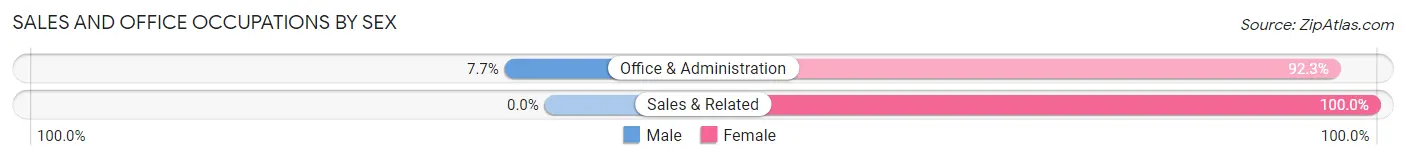
| Occupation | Male | Female |
| Sales & Related | 0 (0.0%) | 17 (100.0%) |
| Office & Administration | 1 (7.7%) | 12 (92.3%) |
| Total (Category) | 1 (3.3%) | 29 (96.7%) |
| Total (Overall) | 68 (53.1%) | 60 (46.9%) |
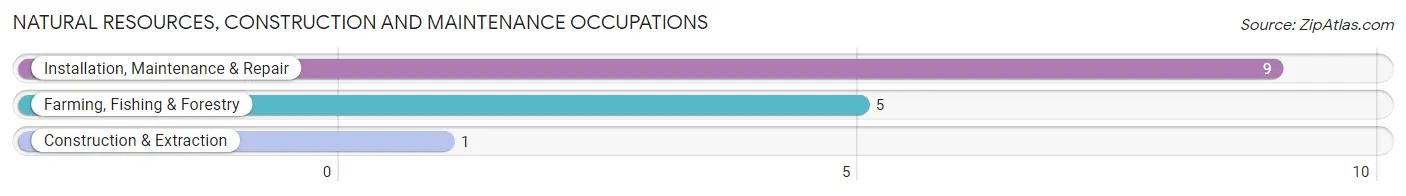
Natural Resources, Construction and Maintenance Occupations
The most common Natural Resources, Construction and Maintenance occupations in Wishram are Installation, Maintenance & Repair (9 | 7.0%), Farming, Fishing & Forestry (5 | 3.9%), and Construction & Extraction (1 | 0.8%).
Natural Resources, Construction and Maintenance Occupations by Sex
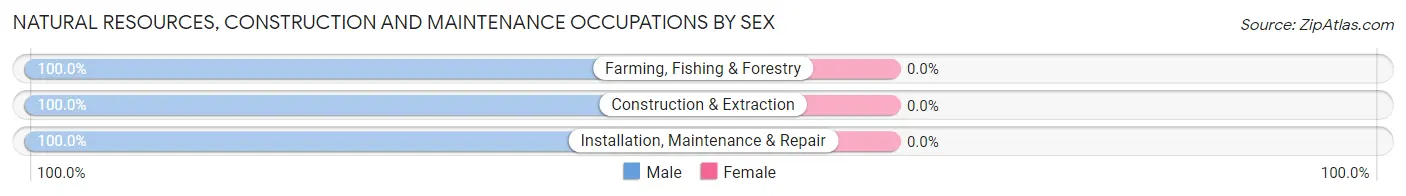
| Occupation | Male | Female |
| Farming, Fishing & Forestry | 5 (100.0%) | 0 (0.0%) |
| Construction & Extraction | 1 (100.0%) | 0 (0.0%) |
| Installation, Maintenance & Repair | 9 (100.0%) | 0 (0.0%) |
| Total (Category) | 15 (100.0%) | 0 (0.0%) |
| Total (Overall) | 68 (53.1%) | 60 (46.9%) |
Production, Transportation and Moving Occupations
The most common Production, Transportation and Moving occupations in Wishram are Material Moving (14 | 10.9%), and Transportation (7 | 5.5%).
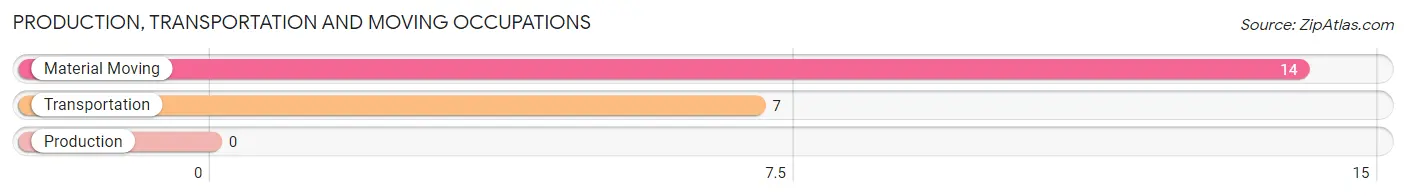
Production, Transportation and Moving Occupations by Sex
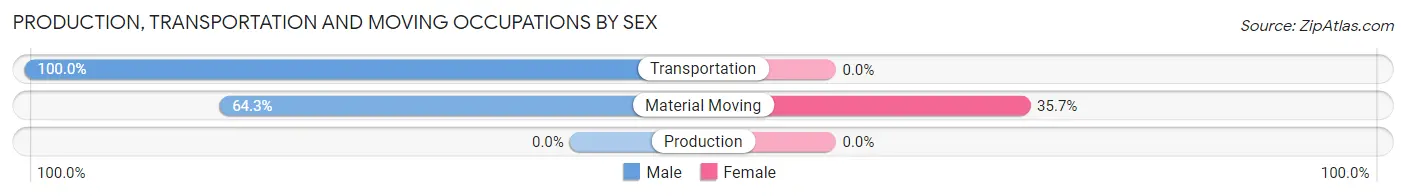
| Occupation | Male | Female |
| Production | 0 (0.0%) | 0 (0.0%) |
| Transportation | 7 (100.0%) | 0 (0.0%) |
| Material Moving | 9 (64.3%) | 5 (35.7%) |
| Total (Category) | 16 (76.2%) | 5 (23.8%) |
| Total (Overall) | 68 (53.1%) | 60 (46.9%) |
Employment Industries by Sex in Wishram
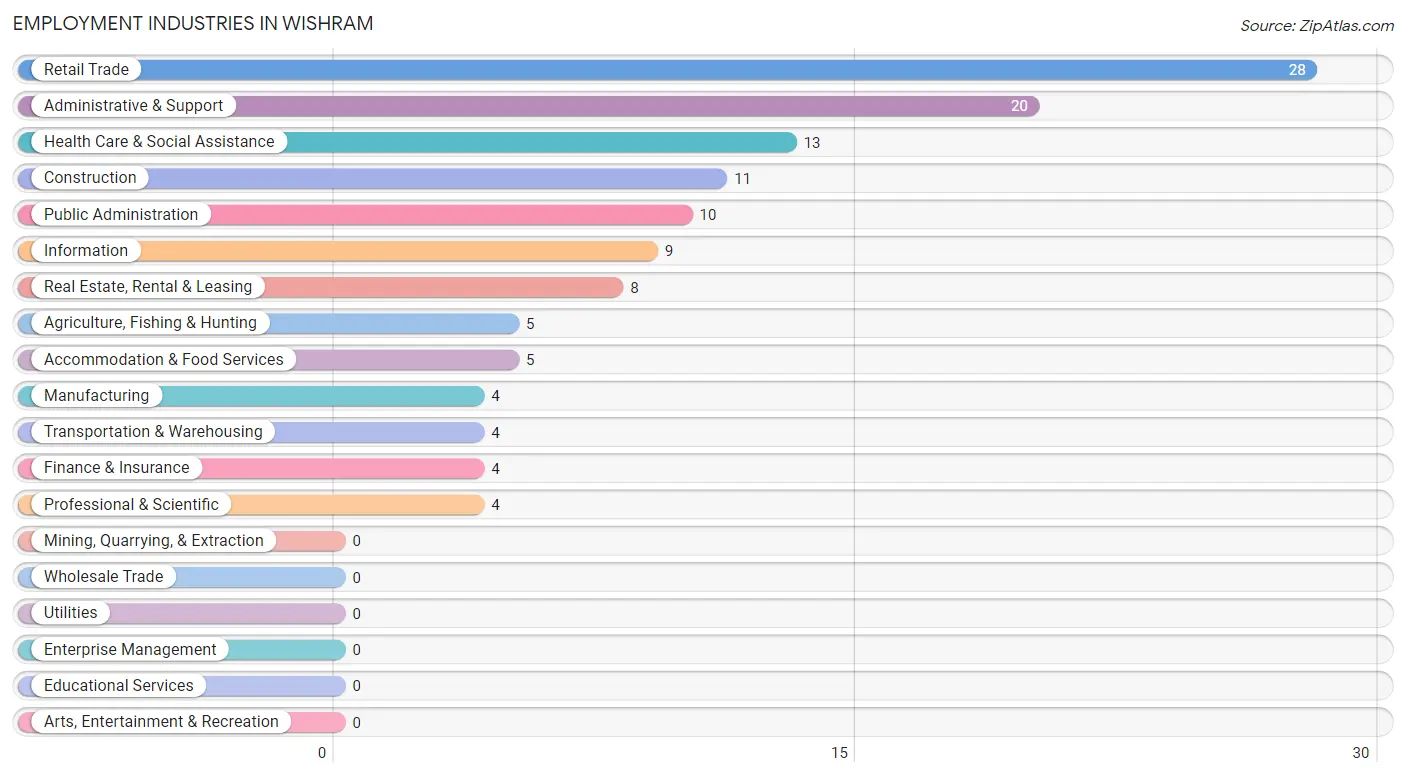
Employment Industries in Wishram
The major employment industries in Wishram include Retail Trade (28 | 21.9%), Administrative & Support (20 | 15.6%), Health Care & Social Assistance (13 | 10.2%), Construction (11 | 8.6%), and Public Administration (10 | 7.8%).
Employment Industries by Sex in Wishram
The Wishram industries that see more men than women are Agriculture, Fishing & Hunting (100.0%), Manufacturing (100.0%), and Information (100.0%), whereas the industries that tend to have a higher number of women are Finance & Insurance (100.0%), Public Administration (100.0%), and Health Care & Social Assistance (92.3%).
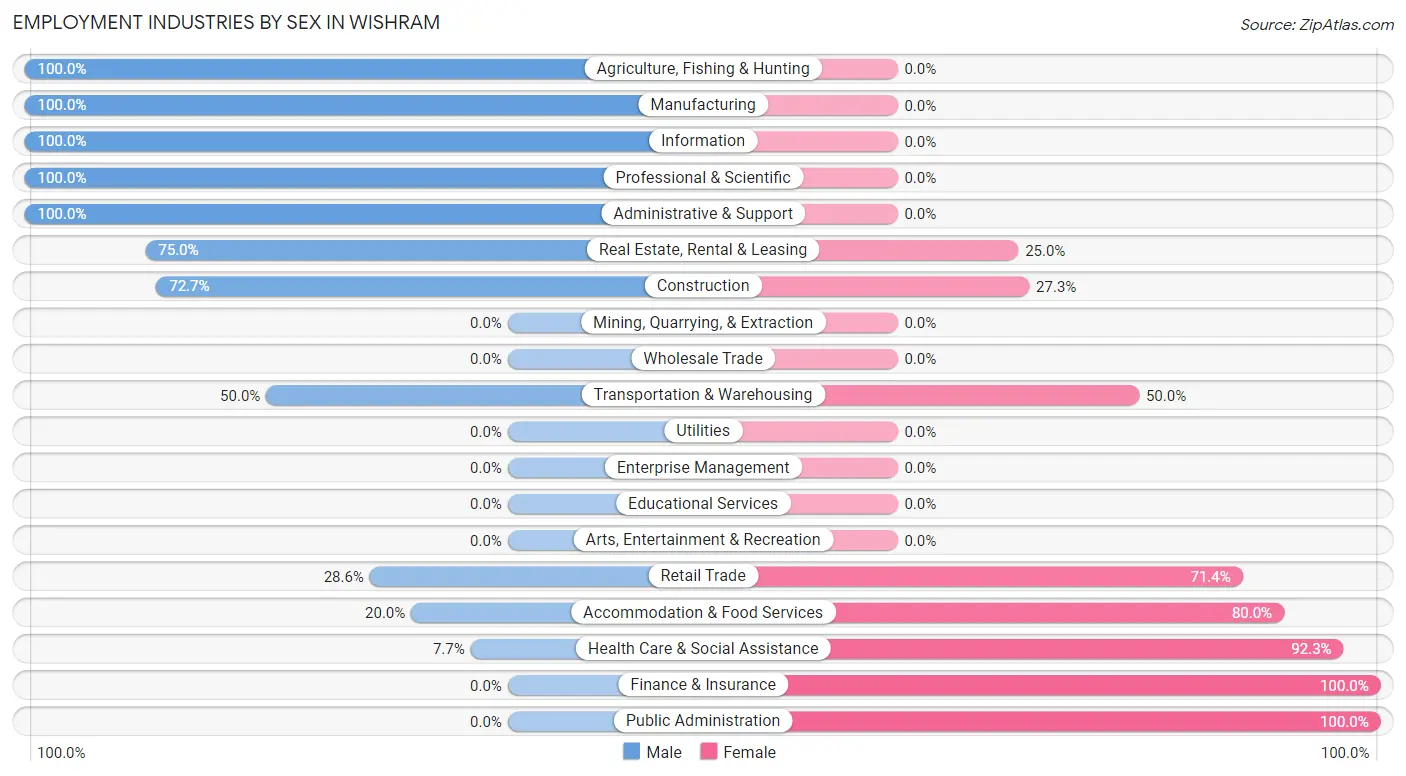
| Industry | Male | Female |
| Agriculture, Fishing & Hunting | 5 (100.0%) | 0 (0.0%) |
| Mining, Quarrying, & Extraction | 0 (0.0%) | 0 (0.0%) |
| Construction | 8 (72.7%) | 3 (27.3%) |
| Manufacturing | 4 (100.0%) | 0 (0.0%) |
| Wholesale Trade | 0 (0.0%) | 0 (0.0%) |
| Retail Trade | 8 (28.6%) | 20 (71.4%) |
| Transportation & Warehousing | 2 (50.0%) | 2 (50.0%) |
| Utilities | 0 (0.0%) | 0 (0.0%) |
| Information | 9 (100.0%) | 0 (0.0%) |
| Finance & Insurance | 0 (0.0%) | 4 (100.0%) |
| Real Estate, Rental & Leasing | 6 (75.0%) | 2 (25.0%) |
| Professional & Scientific | 4 (100.0%) | 0 (0.0%) |
| Enterprise Management | 0 (0.0%) | 0 (0.0%) |
| Administrative & Support | 20 (100.0%) | 0 (0.0%) |
| Educational Services | 0 (0.0%) | 0 (0.0%) |
| Health Care & Social Assistance | 1 (7.7%) | 12 (92.3%) |
| Arts, Entertainment & Recreation | 0 (0.0%) | 0 (0.0%) |
| Accommodation & Food Services | 1 (20.0%) | 4 (80.0%) |
| Public Administration | 0 (0.0%) | 10 (100.0%) |
| Total | 68 (53.1%) | 60 (46.9%) |
Education in Wishram
School Enrollment in Wishram
The most common levels of schooling among the 86 students in Wishram are high school (57 | 66.3%), elementary school (12 | 14.0%), and middle school (12 | 14.0%).
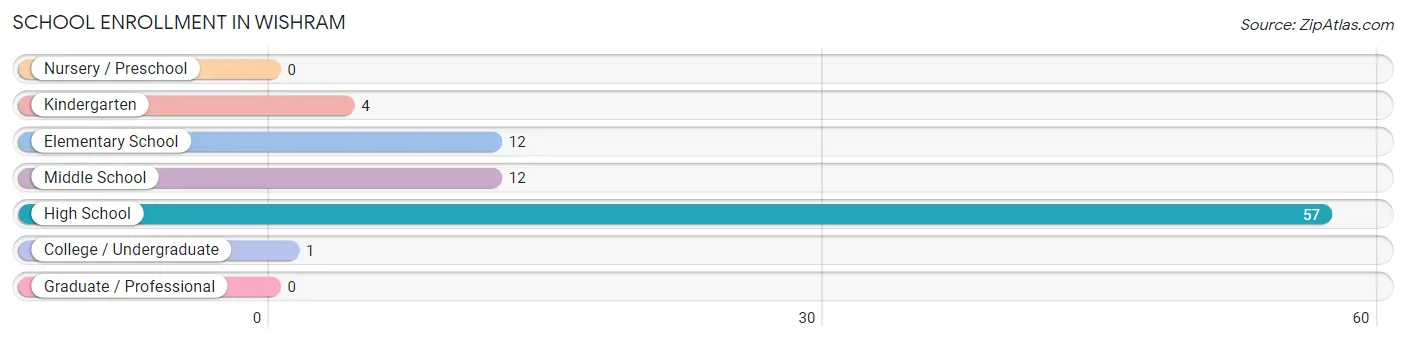
| School Level | # Students | % Students |
| Nursery / Preschool | 0 | 0.0% |
| Kindergarten | 4 | 4.6% |
| Elementary School | 12 | 14.0% |
| Middle School | 12 | 14.0% |
| High School | 57 | 66.3% |
| College / Undergraduate | 1 | 1.2% |
| Graduate / Professional | 0 | 0.0% |
| Total | 86 | 100.0% |
School Enrollment by Age by Funding Source in Wishram
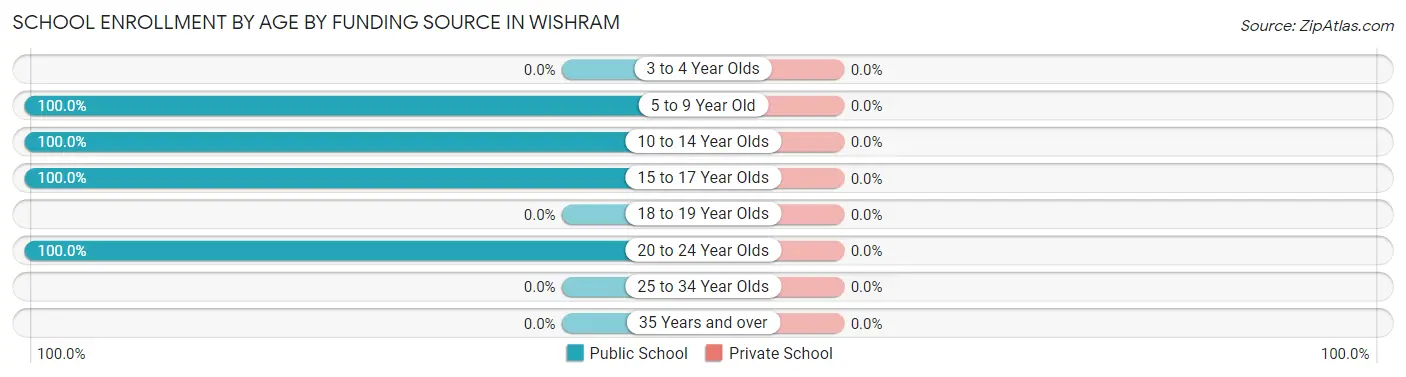
| Age Bracket | Public School | Private School |
| 3 to 4 Year Olds | 0 (0.0%) | 0 (0.0%) |
| 5 to 9 Year Old | 16 (100.0%) | 0 (0.0%) |
| 10 to 14 Year Olds | 15 (100.0%) | 0 (0.0%) |
| 15 to 17 Year Olds | 54 (100.0%) | 0 (0.0%) |
| 18 to 19 Year Olds | 0 (0.0%) | 0 (0.0%) |
| 20 to 24 Year Olds | 1 (100.0%) | 0 (0.0%) |
| 25 to 34 Year Olds | 0 (0.0%) | 0 (0.0%) |
| 35 Years and over | 0 (0.0%) | 0 (0.0%) |
| Total | 86 (100.0%) | 0 (0.0%) |
Educational Attainment by Field of Study in Wishram
Psychology (10 | 47.6%), education (5 | 23.8%), business (3 | 14.3%), liberal arts & history (2 | 9.5%), and literature & languages (1 | 4.8%) are the most common fields of study among 21 individuals in Wishram who have obtained a bachelor's degree or higher.
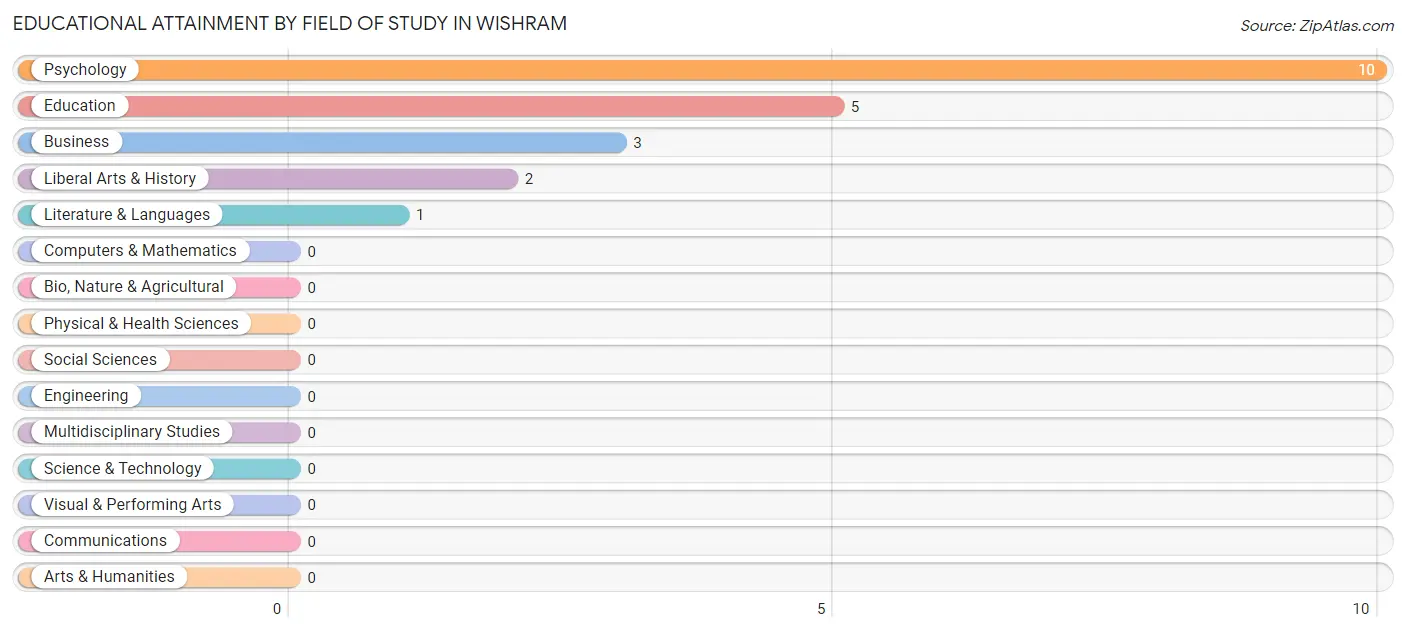
| Field of Study | # Graduates | % Graduates |
| Computers & Mathematics | 0 | 0.0% |
| Bio, Nature & Agricultural | 0 | 0.0% |
| Physical & Health Sciences | 0 | 0.0% |
| Psychology | 10 | 47.6% |
| Social Sciences | 0 | 0.0% |
| Engineering | 0 | 0.0% |
| Multidisciplinary Studies | 0 | 0.0% |
| Science & Technology | 0 | 0.0% |
| Business | 3 | 14.3% |
| Education | 5 | 23.8% |
| Literature & Languages | 1 | 4.8% |
| Liberal Arts & History | 2 | 9.5% |
| Visual & Performing Arts | 0 | 0.0% |
| Communications | 0 | 0.0% |
| Arts & Humanities | 0 | 0.0% |
| Total | 21 | 100.0% |
Transportation & Commute in Wishram
Vehicle Availability by Sex in Wishram
The most prevalent vehicle ownership categories in Wishram are males with 2 vehicles (34, accounting for 50.0%) and females with 2 vehicles (25, making up 59.7%).
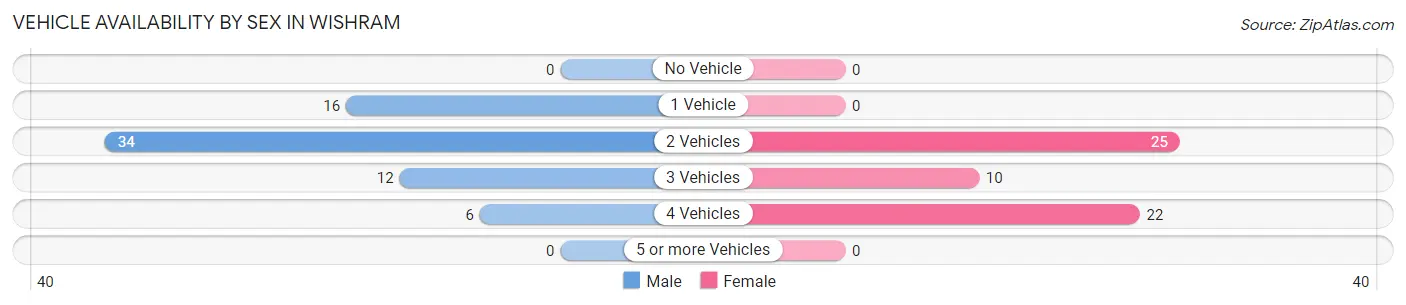
| Vehicles Available | Male | Female |
| No Vehicle | 0 (0.0%) | 0 (0.0%) |
| 1 Vehicle | 16 (23.5%) | 0 (0.0%) |
| 2 Vehicles | 34 (50.0%) | 25 (43.9%) |
| 3 Vehicles | 12 (17.6%) | 10 (17.5%) |
| 4 Vehicles | 6 (8.8%) | 22 (38.6%) |
| 5 or more Vehicles | 0 (0.0%) | 0 (0.0%) |
| Total | 68 (100.0%) | 57 (100.0%) |
Commute Time in Wishram
The most frequently occuring commute durations in Wishram are 25 to 29 minutes (23 commuters, 20.7%), 30 to 34 minutes (22 commuters, 19.8%), and 20 to 24 minutes (17 commuters, 15.3%).
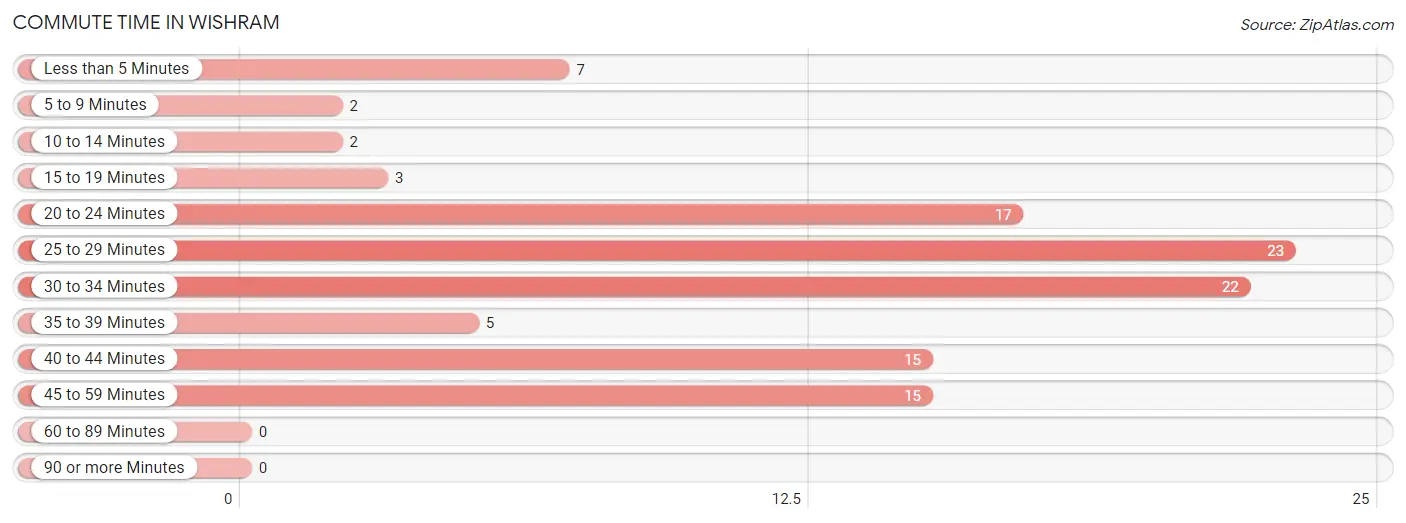
| Commute Time | # Commuters | % Commuters |
| Less than 5 Minutes | 7 | 6.3% |
| 5 to 9 Minutes | 2 | 1.8% |
| 10 to 14 Minutes | 2 | 1.8% |
| 15 to 19 Minutes | 3 | 2.7% |
| 20 to 24 Minutes | 17 | 15.3% |
| 25 to 29 Minutes | 23 | 20.7% |
| 30 to 34 Minutes | 22 | 19.8% |
| 35 to 39 Minutes | 5 | 4.5% |
| 40 to 44 Minutes | 15 | 13.5% |
| 45 to 59 Minutes | 15 | 13.5% |
| 60 to 89 Minutes | 0 | 0.0% |
| 90 or more Minutes | 0 | 0.0% |
Commute Time by Sex in Wishram
The most common commute times in Wishram are 25 to 29 minutes (23 commuters, 37.7%) for males and 30 to 34 minutes (17 commuters, 34.0%) for females.
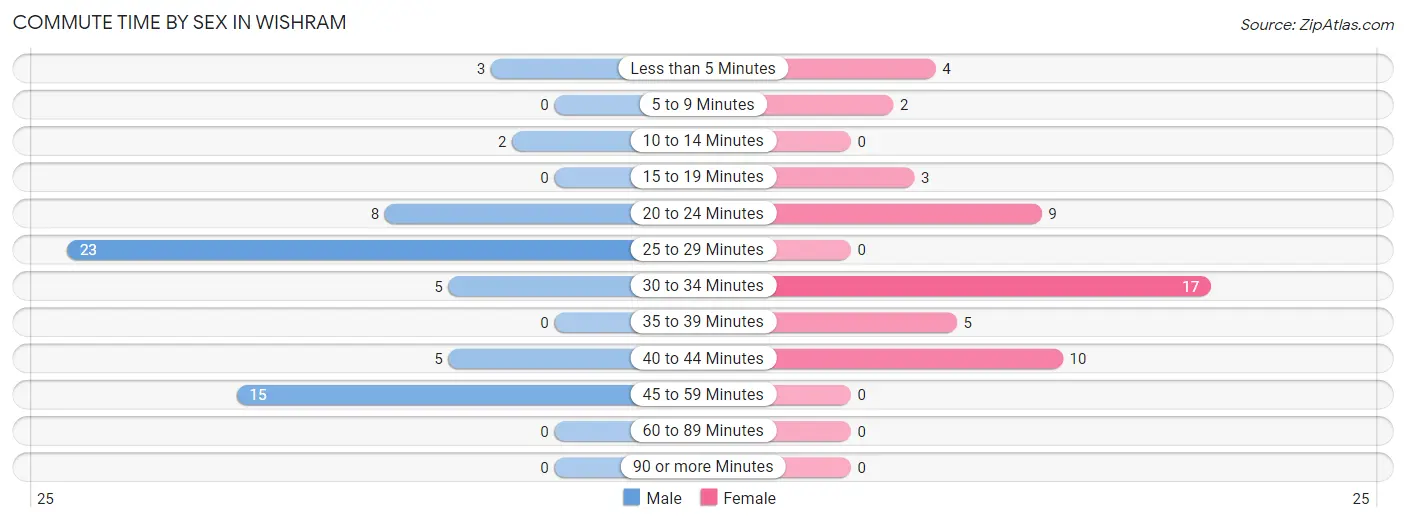
| Commute Time | Male | Female |
| Less than 5 Minutes | 3 (4.9%) | 4 (8.0%) |
| 5 to 9 Minutes | 0 (0.0%) | 2 (4.0%) |
| 10 to 14 Minutes | 2 (3.3%) | 0 (0.0%) |
| 15 to 19 Minutes | 0 (0.0%) | 3 (6.0%) |
| 20 to 24 Minutes | 8 (13.1%) | 9 (18.0%) |
| 25 to 29 Minutes | 23 (37.7%) | 0 (0.0%) |
| 30 to 34 Minutes | 5 (8.2%) | 17 (34.0%) |
| 35 to 39 Minutes | 0 (0.0%) | 5 (10.0%) |
| 40 to 44 Minutes | 5 (8.2%) | 10 (20.0%) |
| 45 to 59 Minutes | 15 (24.6%) | 0 (0.0%) |
| 60 to 89 Minutes | 0 (0.0%) | 0 (0.0%) |
| 90 or more Minutes | 0 (0.0%) | 0 (0.0%) |
Time of Departure to Work by Sex in Wishram
The most frequent times of departure to work in Wishram are 12:00 PM to 3:59 PM (19, 31.1%) for males and 12:00 PM to 3:59 PM (15, 30.0%) for females.
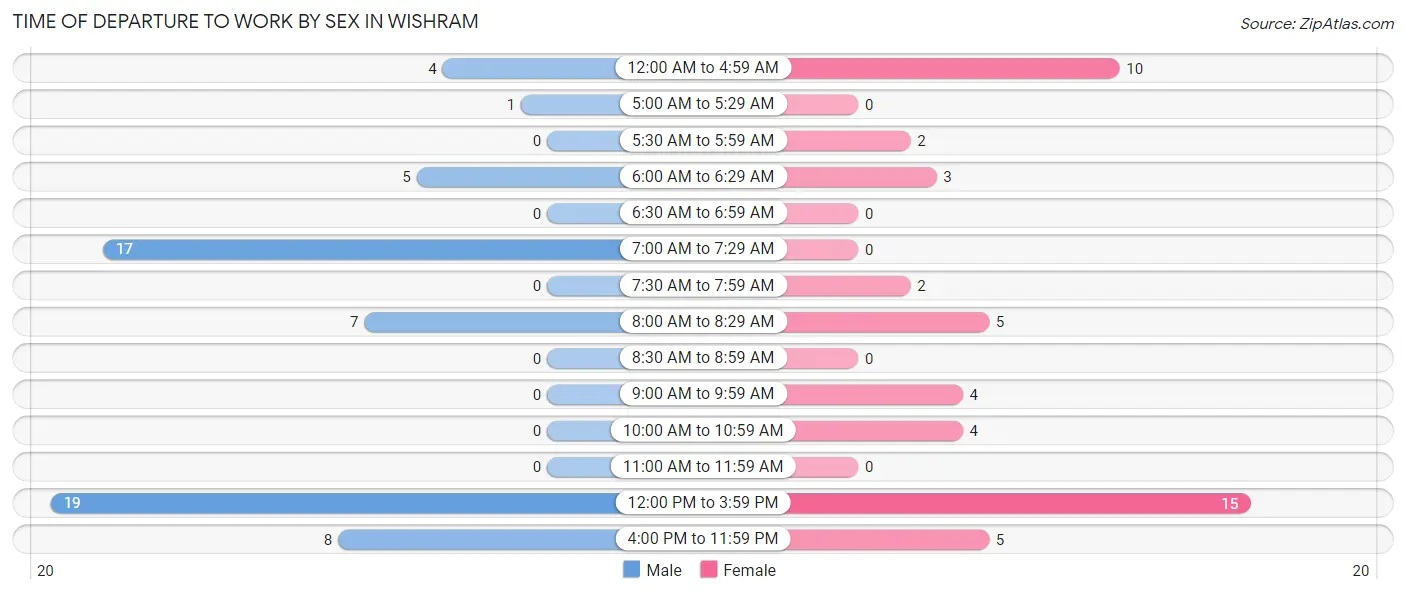
| Time of Departure | Male | Female |
| 12:00 AM to 4:59 AM | 4 (6.6%) | 10 (20.0%) |
| 5:00 AM to 5:29 AM | 1 (1.6%) | 0 (0.0%) |
| 5:30 AM to 5:59 AM | 0 (0.0%) | 2 (4.0%) |
| 6:00 AM to 6:29 AM | 5 (8.2%) | 3 (6.0%) |
| 6:30 AM to 6:59 AM | 0 (0.0%) | 0 (0.0%) |
| 7:00 AM to 7:29 AM | 17 (27.9%) | 0 (0.0%) |
| 7:30 AM to 7:59 AM | 0 (0.0%) | 2 (4.0%) |
| 8:00 AM to 8:29 AM | 7 (11.5%) | 5 (10.0%) |
| 8:30 AM to 8:59 AM | 0 (0.0%) | 0 (0.0%) |
| 9:00 AM to 9:59 AM | 0 (0.0%) | 4 (8.0%) |
| 10:00 AM to 10:59 AM | 0 (0.0%) | 4 (8.0%) |
| 11:00 AM to 11:59 AM | 0 (0.0%) | 0 (0.0%) |
| 12:00 PM to 3:59 PM | 19 (31.1%) | 15 (30.0%) |
| 4:00 PM to 11:59 PM | 8 (13.1%) | 5 (10.0%) |
| Total | 61 (100.0%) | 50 (100.0%) |
Housing Occupancy in Wishram
Occupancy by Ownership in Wishram
Of the total 190 dwellings in Wishram, owner-occupied units account for 128 (67.4%), while renter-occupied units make up 62 (32.6%).
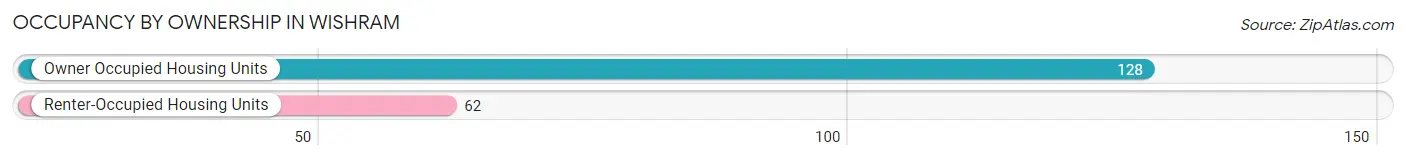
| Occupancy | # Housing Units | % Housing Units |
| Owner Occupied Housing Units | 128 | 67.4% |
| Renter-Occupied Housing Units | 62 | 32.6% |
| Total Occupied Housing Units | 190 | 100.0% |
Occupancy by Household Size in Wishram
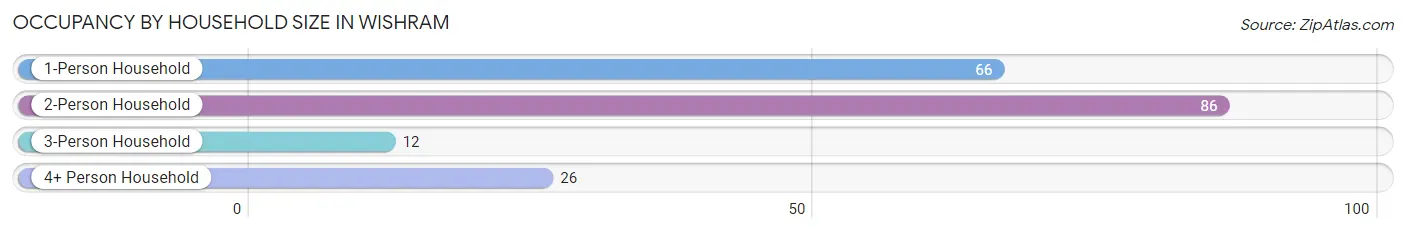
| Household Size | # Housing Units | % Housing Units |
| 1-Person Household | 66 | 34.7% |
| 2-Person Household | 86 | 45.3% |
| 3-Person Household | 12 | 6.3% |
| 4+ Person Household | 26 | 13.7% |
| Total Housing Units | 190 | 100.0% |
Occupancy by Ownership by Household Size in Wishram
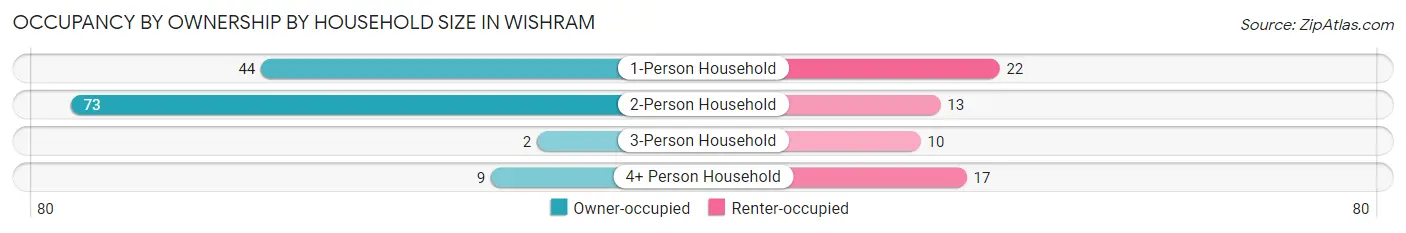
| Household Size | Owner-occupied | Renter-occupied |
| 1-Person Household | 44 (66.7%) | 22 (33.3%) |
| 2-Person Household | 73 (84.9%) | 13 (15.1%) |
| 3-Person Household | 2 (16.7%) | 10 (83.3%) |
| 4+ Person Household | 9 (34.6%) | 17 (65.4%) |
| Total Housing Units | 128 (67.4%) | 62 (32.6%) |
Occupancy by Educational Attainment in Wishram
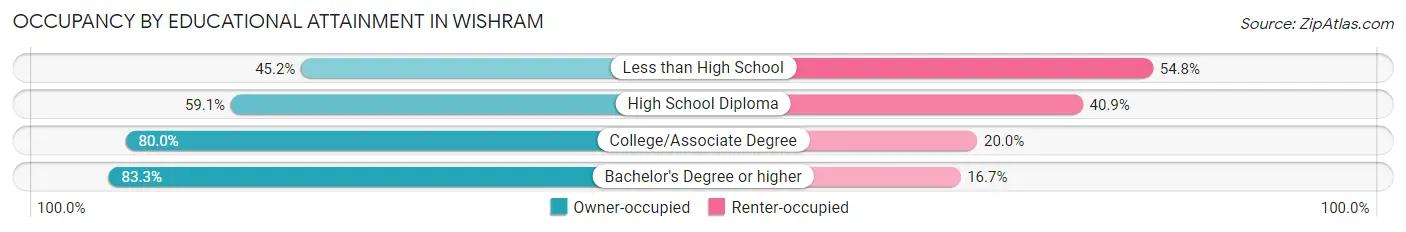
| Household Size | Owner-occupied | Renter-occupied |
| Less than High School | 14 (45.2%) | 17 (54.8%) |
| High School Diploma | 39 (59.1%) | 27 (40.9%) |
| College/Associate Degree | 60 (80.0%) | 15 (20.0%) |
| Bachelor's Degree or higher | 15 (83.3%) | 3 (16.7%) |
Occupancy by Age of Householder in Wishram
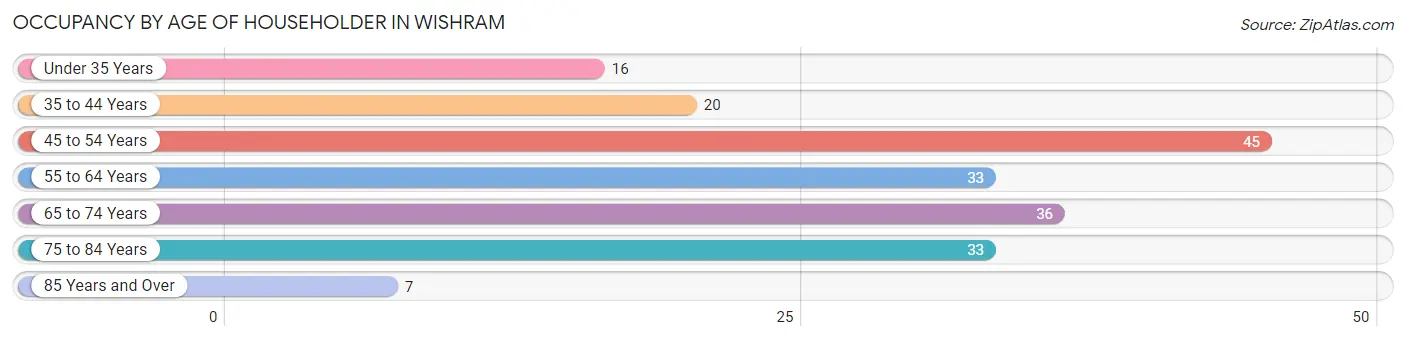
| Age Bracket | # Households | % Households |
| Under 35 Years | 16 | 8.4% |
| 35 to 44 Years | 20 | 10.5% |
| 45 to 54 Years | 45 | 23.7% |
| 55 to 64 Years | 33 | 17.4% |
| 65 to 74 Years | 36 | 19.0% |
| 75 to 84 Years | 33 | 17.4% |
| 85 Years and Over | 7 | 3.7% |
| Total | 190 | 100.0% |
Housing Finances in Wishram
Median Income by Occupancy in Wishram
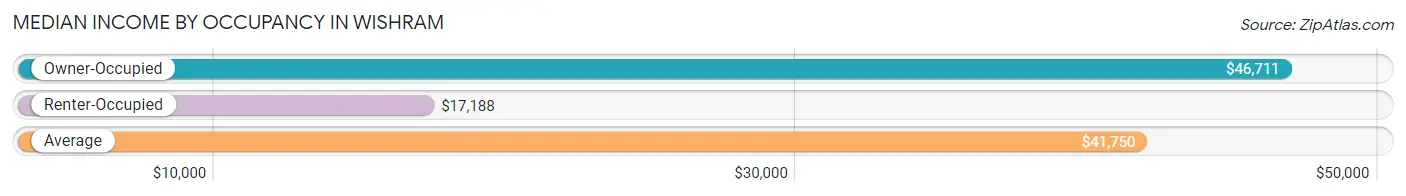
| Occupancy Type | # Households | Median Income |
| Owner-Occupied | 128 (67.4%) | $46,711 |
| Renter-Occupied | 62 (32.6%) | $17,188 |
| Average | 190 (100.0%) | $41,750 |
Occupancy by Householder Income Bracket in Wishram
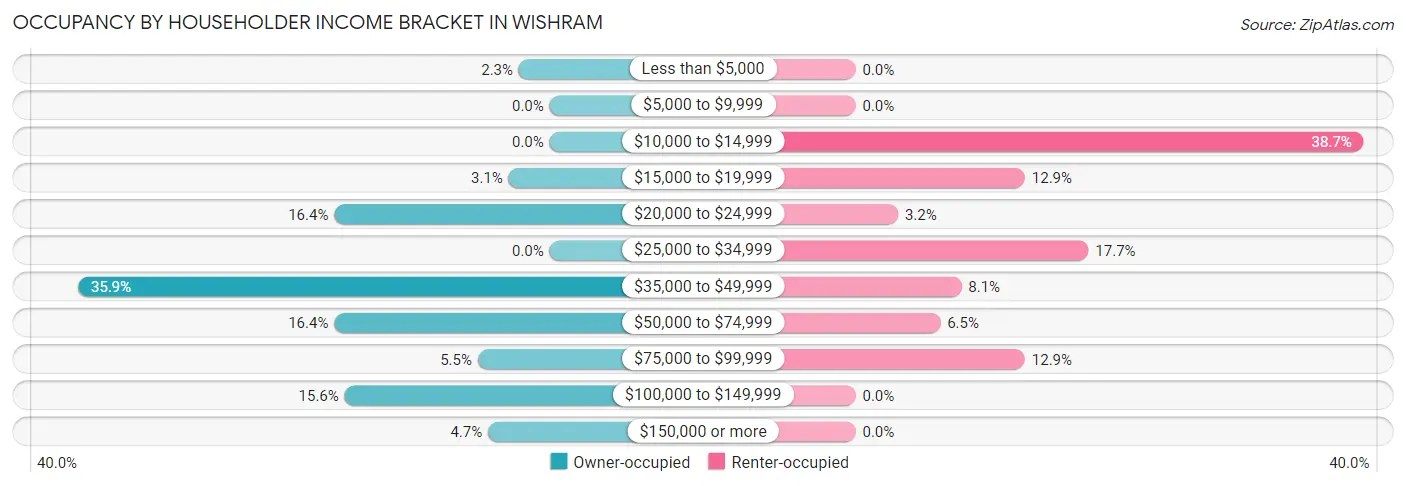
| Income Bracket | Owner-occupied | Renter-occupied |
| Less than $5,000 | 3 (2.3%) | 0 (0.0%) |
| $5,000 to $9,999 | 0 (0.0%) | 0 (0.0%) |
| $10,000 to $14,999 | 0 (0.0%) | 24 (38.7%) |
| $15,000 to $19,999 | 4 (3.1%) | 8 (12.9%) |
| $20,000 to $24,999 | 21 (16.4%) | 2 (3.2%) |
| $25,000 to $34,999 | 0 (0.0%) | 11 (17.7%) |
| $35,000 to $49,999 | 46 (35.9%) | 5 (8.1%) |
| $50,000 to $74,999 | 21 (16.4%) | 4 (6.5%) |
| $75,000 to $99,999 | 7 (5.5%) | 8 (12.9%) |
| $100,000 to $149,999 | 20 (15.6%) | 0 (0.0%) |
| $150,000 or more | 6 (4.7%) | 0 (0.0%) |
| Total | 128 (100.0%) | 62 (100.0%) |
Monthly Housing Cost Tiers in Wishram
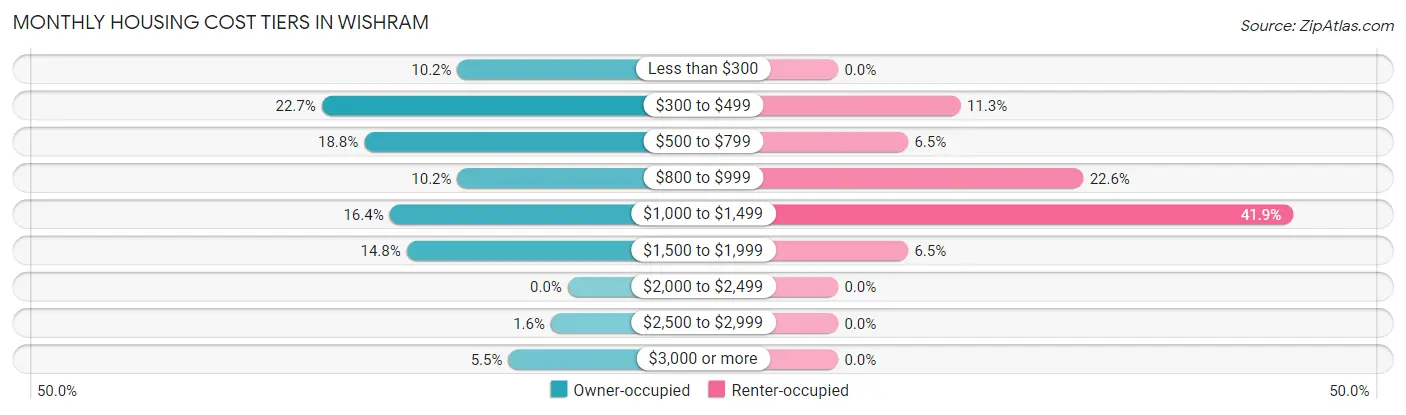
| Monthly Cost | Owner-occupied | Renter-occupied |
| Less than $300 | 13 (10.2%) | 0 (0.0%) |
| $300 to $499 | 29 (22.7%) | 7 (11.3%) |
| $500 to $799 | 24 (18.8%) | 4 (6.5%) |
| $800 to $999 | 13 (10.2%) | 14 (22.6%) |
| $1,000 to $1,499 | 21 (16.4%) | 26 (41.9%) |
| $1,500 to $1,999 | 19 (14.8%) | 4 (6.5%) |
| $2,000 to $2,499 | 0 (0.0%) | 0 (0.0%) |
| $2,500 to $2,999 | 2 (1.6%) | 0 (0.0%) |
| $3,000 or more | 7 (5.5%) | 0 (0.0%) |
| Total | 128 (100.0%) | 62 (100.0%) |
Physical Housing Characteristics in Wishram
Housing Structures in Wishram
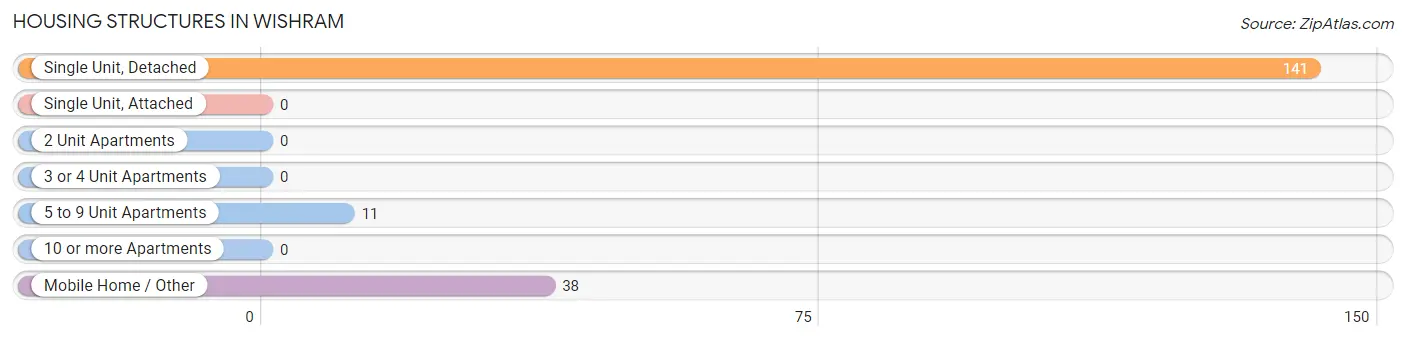
| Structure Type | # Housing Units | % Housing Units |
| Single Unit, Detached | 141 | 74.2% |
| Single Unit, Attached | 0 | 0.0% |
| 2 Unit Apartments | 0 | 0.0% |
| 3 or 4 Unit Apartments | 0 | 0.0% |
| 5 to 9 Unit Apartments | 11 | 5.8% |
| 10 or more Apartments | 0 | 0.0% |
| Mobile Home / Other | 38 | 20.0% |
| Total | 190 | 100.0% |
Housing Structures by Occupancy in Wishram
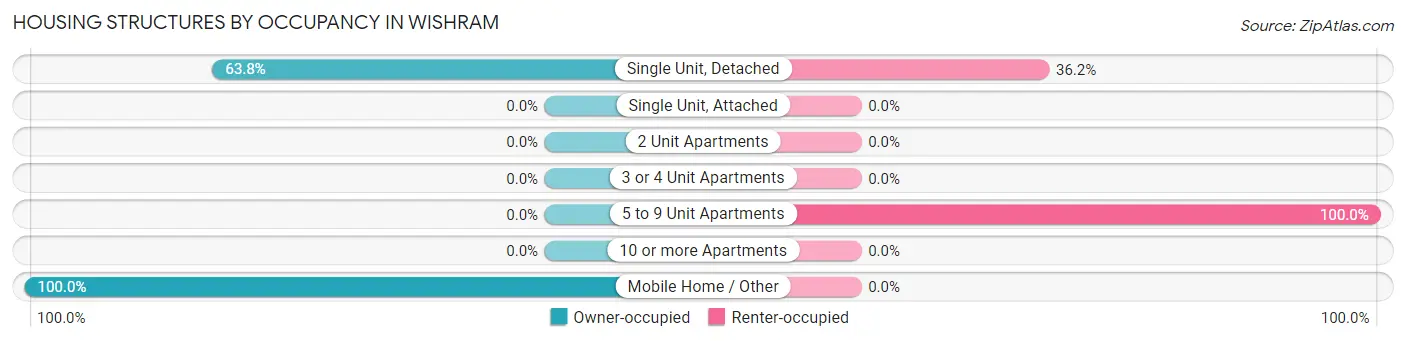
| Structure Type | Owner-occupied | Renter-occupied |
| Single Unit, Detached | 90 (63.8%) | 51 (36.2%) |
| Single Unit, Attached | 0 (0.0%) | 0 (0.0%) |
| 2 Unit Apartments | 0 (0.0%) | 0 (0.0%) |
| 3 or 4 Unit Apartments | 0 (0.0%) | 0 (0.0%) |
| 5 to 9 Unit Apartments | 0 (0.0%) | 11 (100.0%) |
| 10 or more Apartments | 0 (0.0%) | 0 (0.0%) |
| Mobile Home / Other | 38 (100.0%) | 0 (0.0%) |
| Total | 128 (67.4%) | 62 (32.6%) |
Housing Structures by Number of Rooms in Wishram
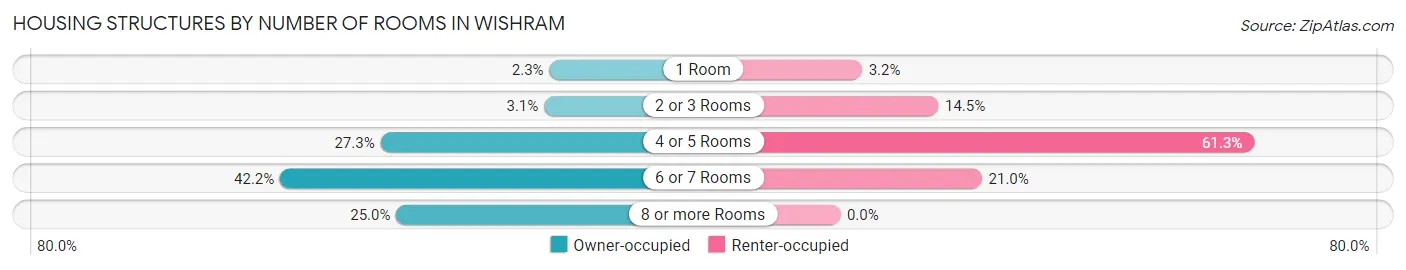
| Number of Rooms | Owner-occupied | Renter-occupied |
| 1 Room | 3 (2.3%) | 2 (3.2%) |
| 2 or 3 Rooms | 4 (3.1%) | 9 (14.5%) |
| 4 or 5 Rooms | 35 (27.3%) | 38 (61.3%) |
| 6 or 7 Rooms | 54 (42.2%) | 13 (21.0%) |
| 8 or more Rooms | 32 (25.0%) | 0 (0.0%) |
| Total | 128 (100.0%) | 62 (100.0%) |
Housing Structure by Heating Type in Wishram
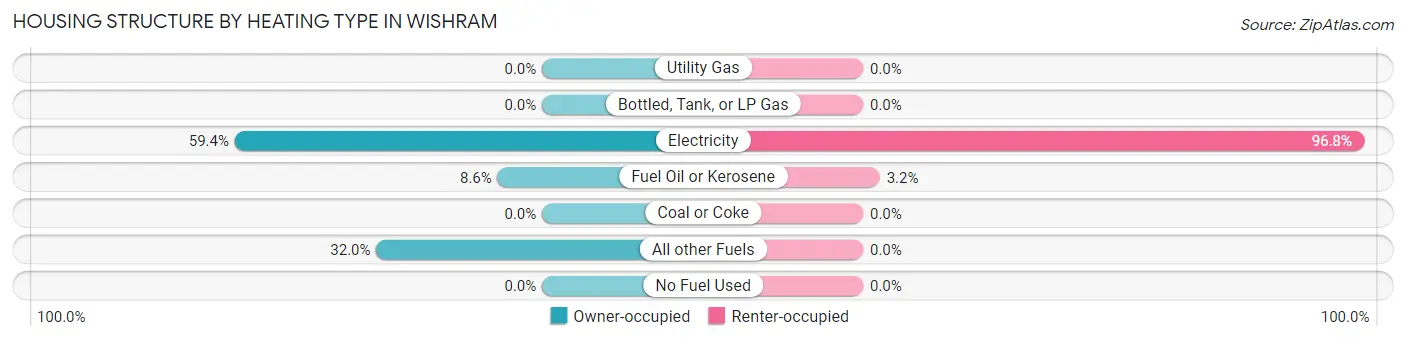
| Heating Type | Owner-occupied | Renter-occupied |
| Utility Gas | 0 (0.0%) | 0 (0.0%) |
| Bottled, Tank, or LP Gas | 0 (0.0%) | 0 (0.0%) |
| Electricity | 76 (59.4%) | 60 (96.8%) |
| Fuel Oil or Kerosene | 11 (8.6%) | 2 (3.2%) |
| Coal or Coke | 0 (0.0%) | 0 (0.0%) |
| All other Fuels | 41 (32.0%) | 0 (0.0%) |
| No Fuel Used | 0 (0.0%) | 0 (0.0%) |
| Total | 128 (100.0%) | 62 (100.0%) |
Household Vehicle Usage in Wishram
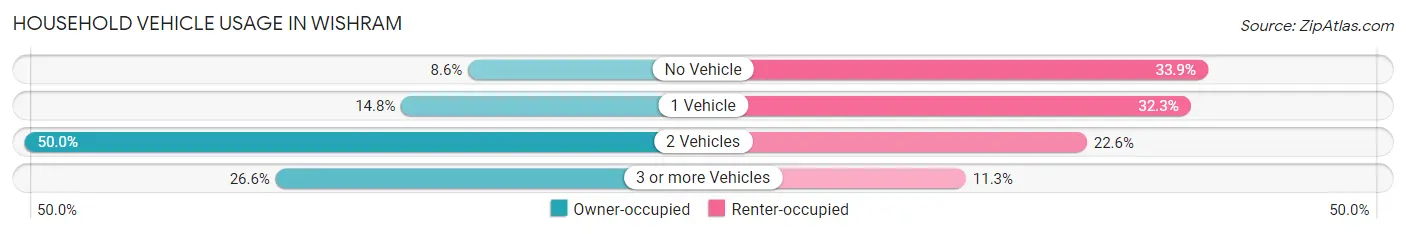
| Vehicles per Household | Owner-occupied | Renter-occupied |
| No Vehicle | 11 (8.6%) | 21 (33.9%) |
| 1 Vehicle | 19 (14.8%) | 20 (32.3%) |
| 2 Vehicles | 64 (50.0%) | 14 (22.6%) |
| 3 or more Vehicles | 34 (26.6%) | 7 (11.3%) |
| Total | 128 (100.0%) | 62 (100.0%) |
Real Estate & Mortgages in Wishram
Real Estate and Mortgage Overview in Wishram
| Characteristic | Without Mortgage | With Mortgage |
| Housing Units | 65 | 63 |
| Median Property Value | $155,500 | $162,500 |
| Median Household Income | $44,583 | $0 |
| Monthly Housing Costs | $435 | $7 |
| Real Estate Taxes | $660 | $0 |
Property Value by Mortgage Status in Wishram
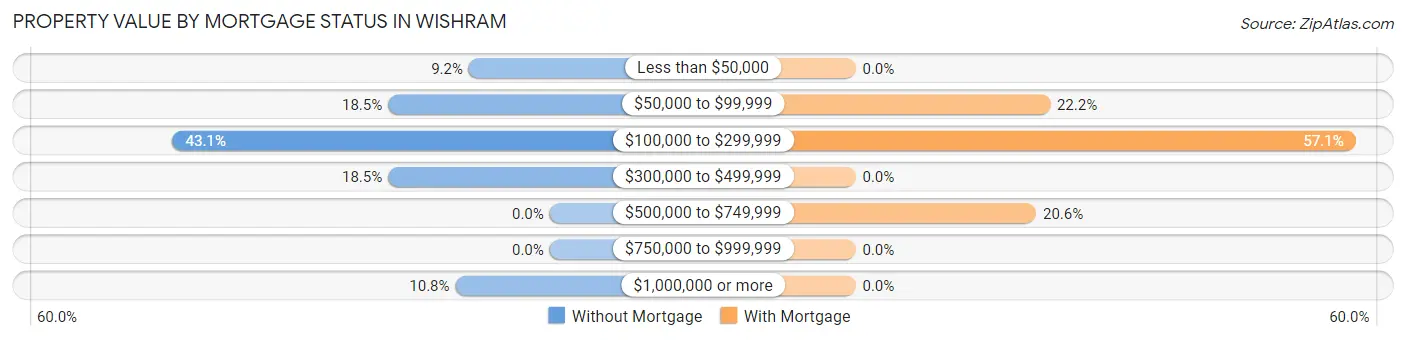
| Property Value | Without Mortgage | With Mortgage |
| Less than $50,000 | 6 (9.2%) | 0 (0.0%) |
| $50,000 to $99,999 | 12 (18.5%) | 14 (22.2%) |
| $100,000 to $299,999 | 28 (43.1%) | 36 (57.1%) |
| $300,000 to $499,999 | 12 (18.5%) | 0 (0.0%) |
| $500,000 to $749,999 | 0 (0.0%) | 13 (20.6%) |
| $750,000 to $999,999 | 0 (0.0%) | 0 (0.0%) |
| $1,000,000 or more | 7 (10.8%) | 0 (0.0%) |
| Total | 65 (100.0%) | 63 (100.0%) |
Household Income by Mortgage Status in Wishram
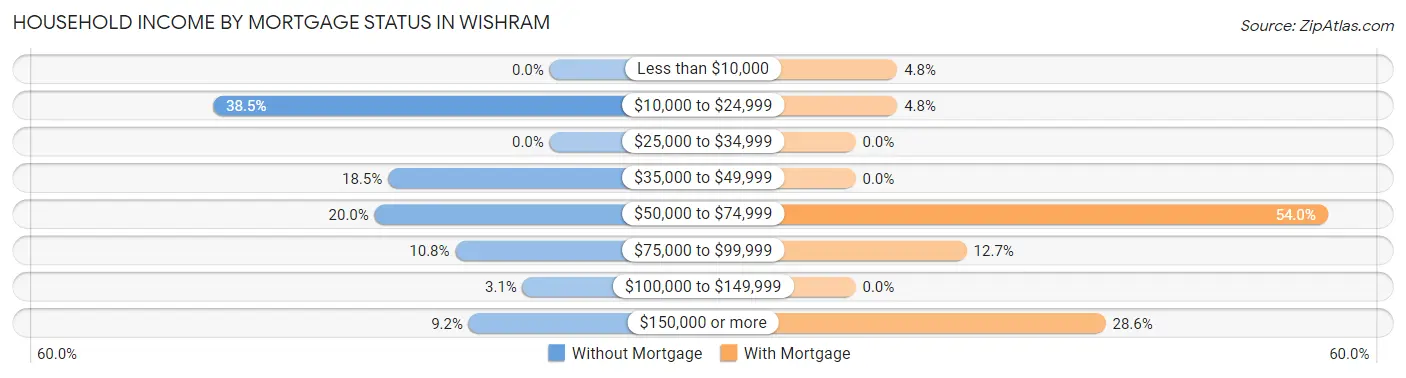
| Household Income | Without Mortgage | With Mortgage |
| Less than $10,000 | 0 (0.0%) | 3 (4.8%) |
| $10,000 to $24,999 | 25 (38.5%) | 3 (4.8%) |
| $25,000 to $34,999 | 0 (0.0%) | 0 (0.0%) |
| $35,000 to $49,999 | 12 (18.5%) | 0 (0.0%) |
| $50,000 to $74,999 | 13 (20.0%) | 34 (54.0%) |
| $75,000 to $99,999 | 7 (10.8%) | 8 (12.7%) |
| $100,000 to $149,999 | 2 (3.1%) | 0 (0.0%) |
| $150,000 or more | 6 (9.2%) | 18 (28.6%) |
| Total | 65 (100.0%) | 63 (100.0%) |
Property Value to Household Income Ratio in Wishram
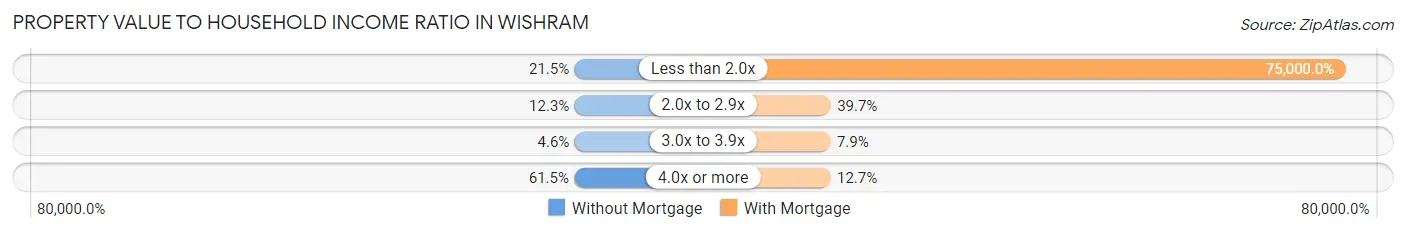
| Value-to-Income Ratio | Without Mortgage | With Mortgage |
| Less than 2.0x | 14 (21.5%) | 47,250 (75,000.0%) |
| 2.0x to 2.9x | 8 (12.3%) | 25 (39.7%) |
| 3.0x to 3.9x | 3 (4.6%) | 5 (7.9%) |
| 4.0x or more | 40 (61.5%) | 8 (12.7%) |
| Total | 65 (100.0%) | 63 (100.0%) |
Real Estate Taxes by Mortgage Status in Wishram
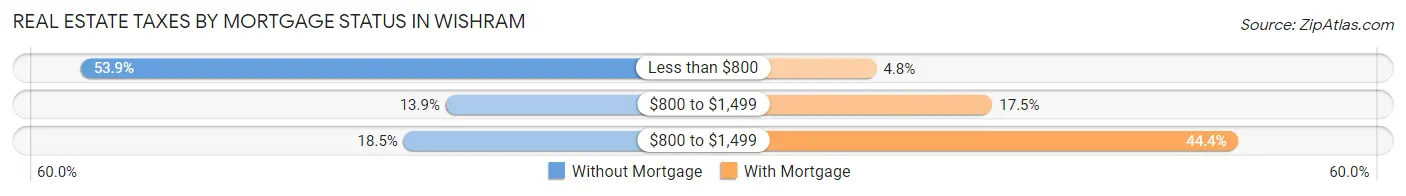
| Property Taxes | Without Mortgage | With Mortgage |
| Less than $800 | 35 (53.8%) | 3 (4.8%) |
| $800 to $1,499 | 9 (13.9%) | 11 (17.5%) |
| $800 to $1,499 | 12 (18.5%) | 28 (44.4%) |
| Total | 65 (100.0%) | 63 (100.0%) |
Health & Disability in Wishram
Health Insurance Coverage by Age in Wishram
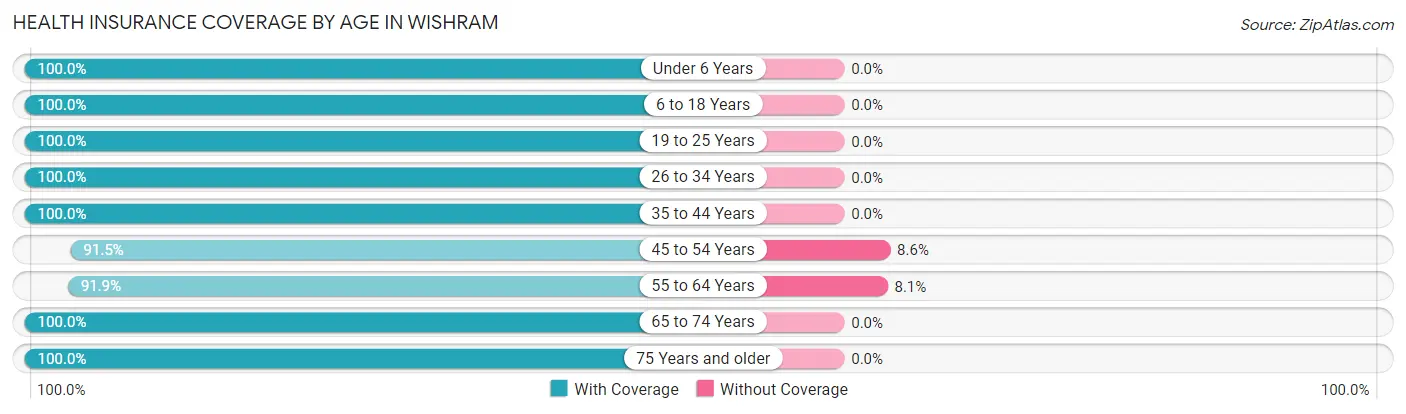
| Age Bracket | With Coverage | Without Coverage |
| Under 6 Years | 24 (100.0%) | 0 (0.0%) |
| 6 to 18 Years | 100 (100.0%) | 0 (0.0%) |
| 19 to 25 Years | 23 (100.0%) | 0 (0.0%) |
| 26 to 34 Years | 28 (100.0%) | 0 (0.0%) |
| 35 to 44 Years | 51 (100.0%) | 0 (0.0%) |
| 45 to 54 Years | 107 (91.4%) | 10 (8.6%) |
| 55 to 64 Years | 57 (91.9%) | 5 (8.1%) |
| 65 to 74 Years | 53 (100.0%) | 0 (0.0%) |
| 75 Years and older | 44 (100.0%) | 0 (0.0%) |
| Total | 487 (97.0%) | 15 (3.0%) |
Health Insurance Coverage by Citizenship Status in Wishram
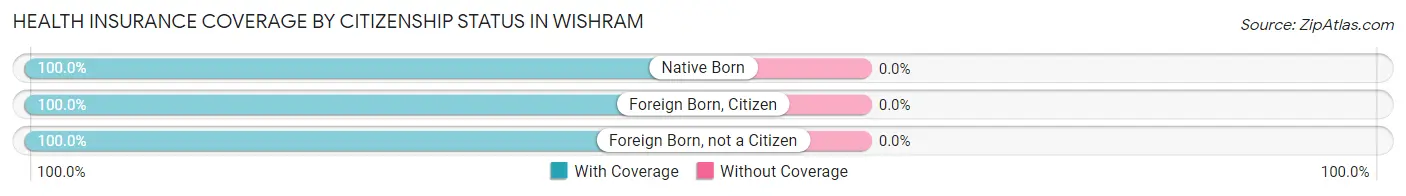
| Citizenship Status | With Coverage | Without Coverage |
| Native Born | 24 (100.0%) | 0 (0.0%) |
| Foreign Born, Citizen | 100 (100.0%) | 0 (0.0%) |
| Foreign Born, not a Citizen | 23 (100.0%) | 0 (0.0%) |
Health Insurance Coverage by Household Income in Wishram
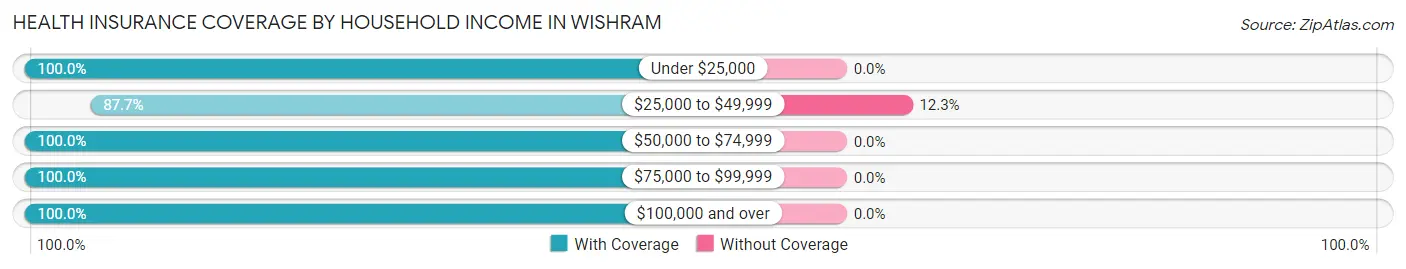
| Household Income | With Coverage | Without Coverage |
| Under $25,000 | 103 (100.0%) | 0 (0.0%) |
| $25,000 to $49,999 | 107 (87.7%) | 15 (12.3%) |
| $50,000 to $74,999 | 69 (100.0%) | 0 (0.0%) |
| $75,000 to $99,999 | 127 (100.0%) | 0 (0.0%) |
| $100,000 and over | 81 (100.0%) | 0 (0.0%) |
Public vs Private Health Insurance Coverage by Age in Wishram
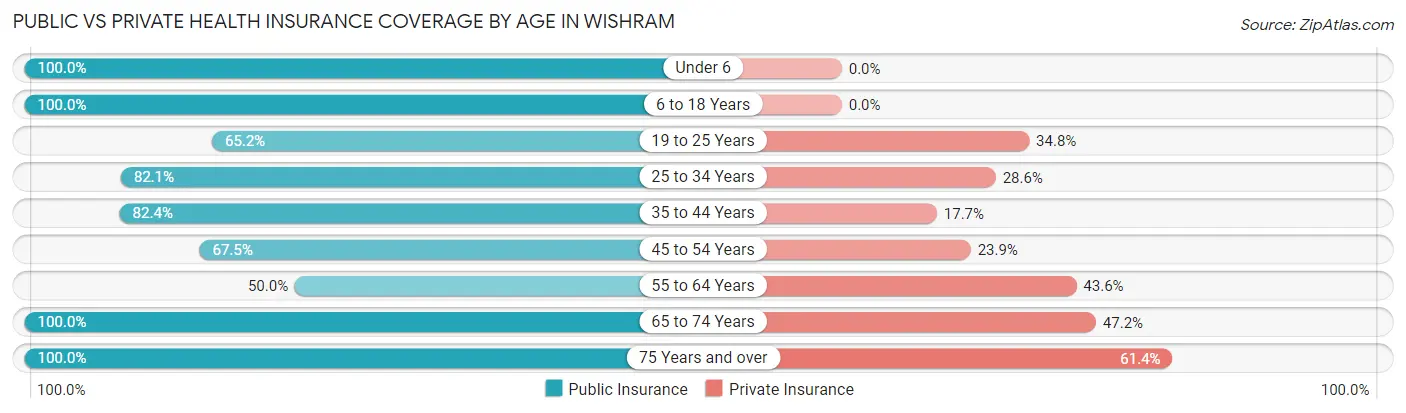
| Age Bracket | Public Insurance | Private Insurance |
| Under 6 | 24 (100.0%) | 0 (0.0%) |
| 6 to 18 Years | 100 (100.0%) | 0 (0.0%) |
| 19 to 25 Years | 15 (65.2%) | 8 (34.8%) |
| 25 to 34 Years | 23 (82.1%) | 8 (28.6%) |
| 35 to 44 Years | 42 (82.4%) | 9 (17.6%) |
| 45 to 54 Years | 79 (67.5%) | 28 (23.9%) |
| 55 to 64 Years | 31 (50.0%) | 27 (43.5%) |
| 65 to 74 Years | 53 (100.0%) | 25 (47.2%) |
| 75 Years and over | 44 (100.0%) | 27 (61.4%) |
| Total | 411 (81.9%) | 132 (26.3%) |
Disability Status by Sex by Age in Wishram
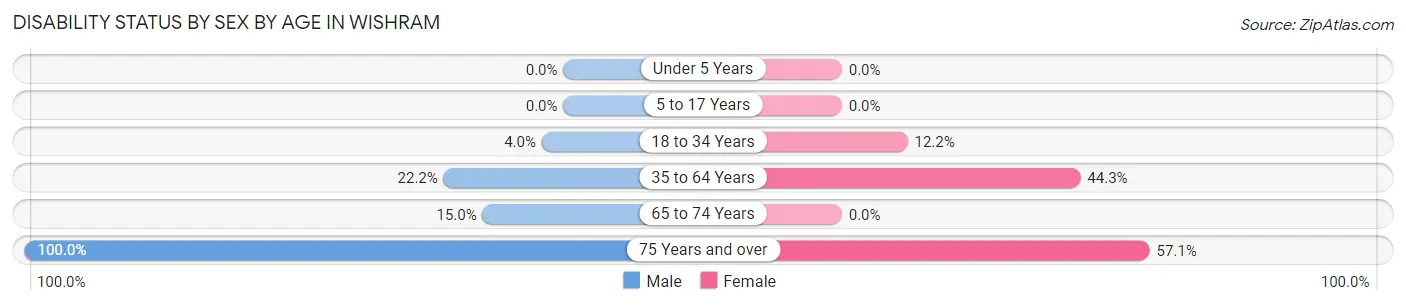
| Age Bracket | Male | Female |
| Under 5 Years | 0 (0.0%) | 0 (0.0%) |
| 5 to 17 Years | 0 (0.0%) | 0 (0.0%) |
| 18 to 34 Years | 1 (4.0%) | 5 (12.2%) |
| 35 to 64 Years | 20 (22.2%) | 62 (44.3%) |
| 65 to 74 Years | 6 (15.0%) | 0 (0.0%) |
| 75 Years and over | 16 (100.0%) | 16 (57.1%) |
Disability Class by Sex by Age in Wishram
Disability Class: Hearing Difficulty
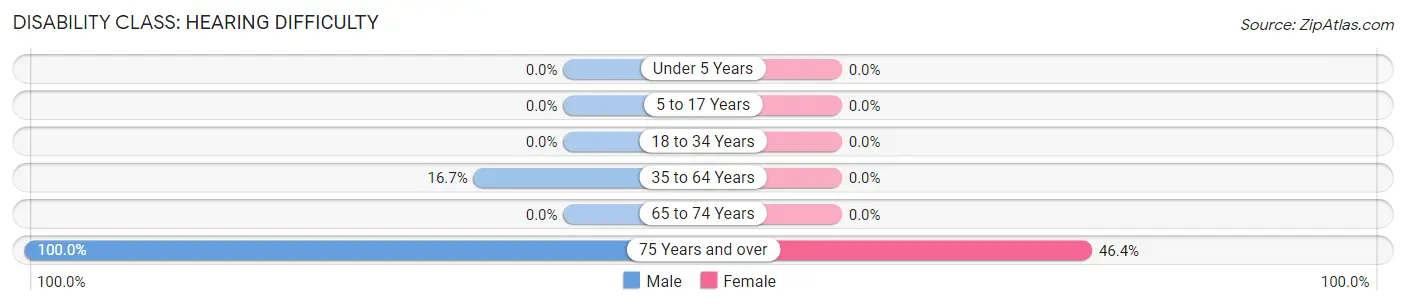
| Age Bracket | Male | Female |
| Under 5 Years | 0 (0.0%) | 0 (0.0%) |
| 5 to 17 Years | 0 (0.0%) | 0 (0.0%) |
| 18 to 34 Years | 0 (0.0%) | 0 (0.0%) |
| 35 to 64 Years | 15 (16.7%) | 0 (0.0%) |
| 65 to 74 Years | 0 (0.0%) | 0 (0.0%) |
| 75 Years and over | 16 (100.0%) | 13 (46.4%) |
Disability Class: Vision Difficulty
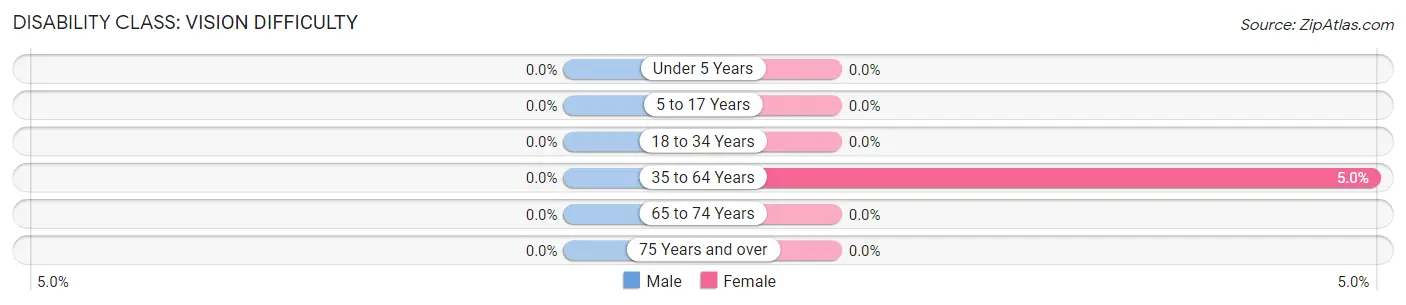
| Age Bracket | Male | Female |
| Under 5 Years | 0 (0.0%) | 0 (0.0%) |
| 5 to 17 Years | 0 (0.0%) | 0 (0.0%) |
| 18 to 34 Years | 0 (0.0%) | 0 (0.0%) |
| 35 to 64 Years | 0 (0.0%) | 7 (5.0%) |
| 65 to 74 Years | 0 (0.0%) | 0 (0.0%) |
| 75 Years and over | 0 (0.0%) | 0 (0.0%) |
Disability Class: Cognitive Difficulty
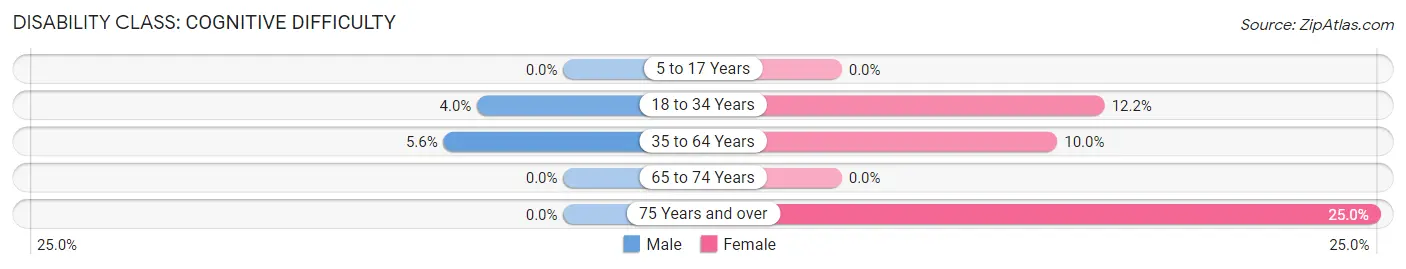
| Age Bracket | Male | Female |
| 5 to 17 Years | 0 (0.0%) | 0 (0.0%) |
| 18 to 34 Years | 1 (4.0%) | 5 (12.2%) |
| 35 to 64 Years | 5 (5.6%) | 14 (10.0%) |
| 65 to 74 Years | 0 (0.0%) | 0 (0.0%) |
| 75 Years and over | 0 (0.0%) | 7 (25.0%) |
Disability Class: Ambulatory Difficulty
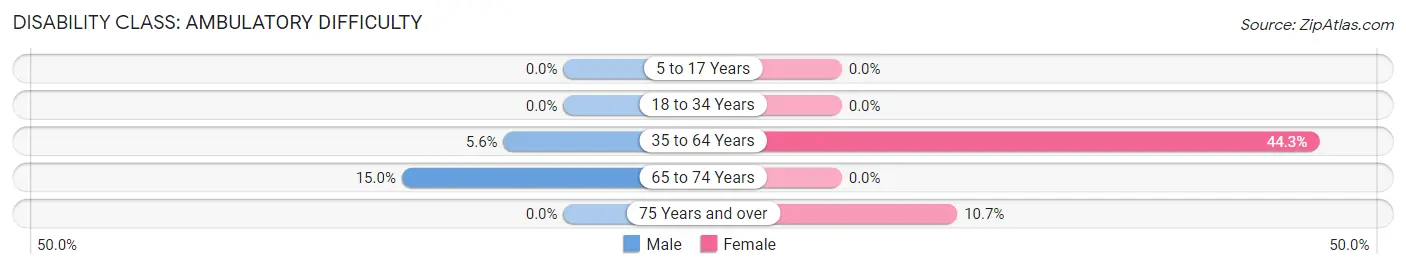
| Age Bracket | Male | Female |
| 5 to 17 Years | 0 (0.0%) | 0 (0.0%) |
| 18 to 34 Years | 0 (0.0%) | 0 (0.0%) |
| 35 to 64 Years | 5 (5.6%) | 62 (44.3%) |
| 65 to 74 Years | 6 (15.0%) | 0 (0.0%) |
| 75 Years and over | 0 (0.0%) | 3 (10.7%) |
Disability Class: Self-Care Difficulty
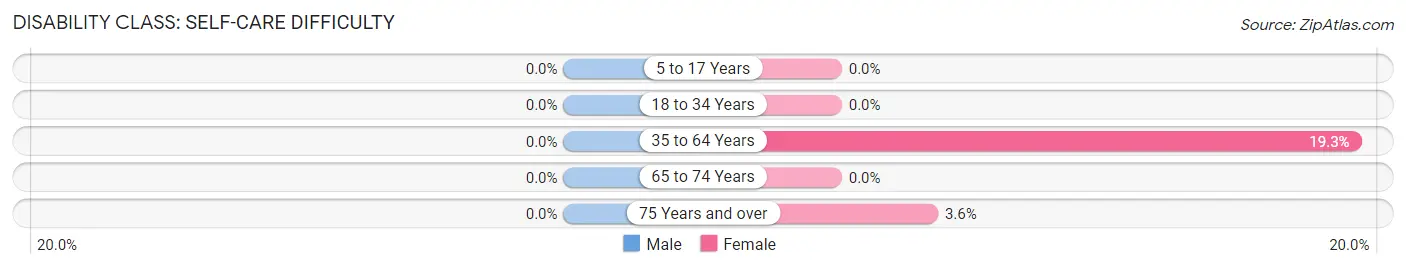
| Age Bracket | Male | Female |
| 5 to 17 Years | 0 (0.0%) | 0 (0.0%) |
| 18 to 34 Years | 0 (0.0%) | 0 (0.0%) |
| 35 to 64 Years | 0 (0.0%) | 27 (19.3%) |
| 65 to 74 Years | 0 (0.0%) | 0 (0.0%) |
| 75 Years and over | 0 (0.0%) | 1 (3.6%) |
Technology Access in Wishram
Computing Device Access in Wishram
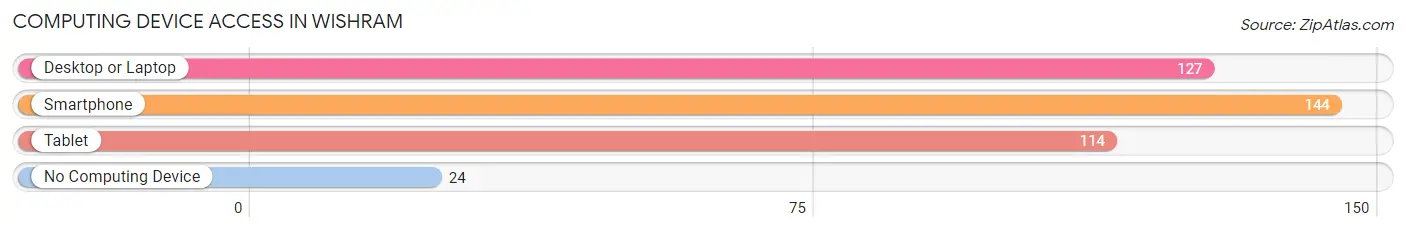
| Device Type | # Households | % Households |
| Desktop or Laptop | 127 | 66.8% |
| Smartphone | 144 | 75.8% |
| Tablet | 114 | 60.0% |
| No Computing Device | 24 | 12.6% |
| Total | 190 | 100.0% |
Internet Access in Wishram
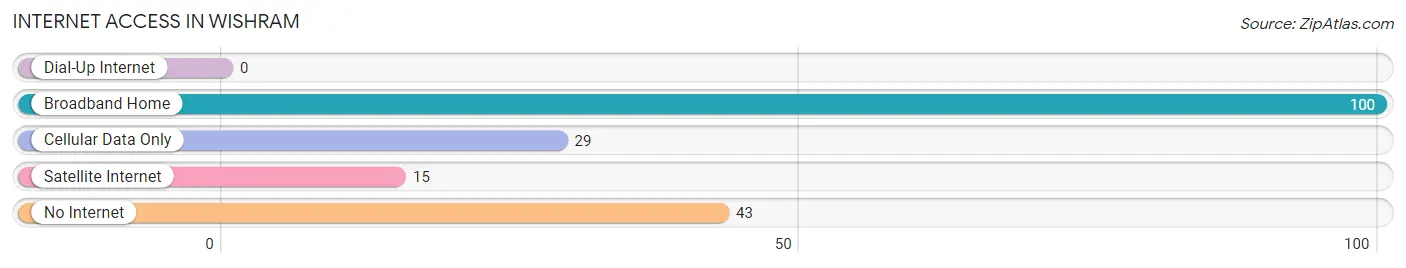
| Internet Type | # Households | % Households |
| Dial-Up Internet | 0 | 0.0% |
| Broadband Home | 100 | 52.6% |
| Cellular Data Only | 29 | 15.3% |
| Satellite Internet | 15 | 7.9% |
| No Internet | 43 | 22.6% |
| Total | 190 | 100.0% |
Wishram Summary
Wishram is a small unincorporated community located in Klickitat County, Washington, United States. It is situated along the Columbia River, approximately 20 miles east of The Dalles, Oregon. The population of Wishram was estimated to be around 200 in 2020.
History
The area around Wishram has been inhabited by Native Americans for thousands of years. The Wishram people, a Chinookan-speaking tribe, were the original inhabitants of the area. The Wishram people were a fishing and trading people who lived along the Columbia River. They were known for their skill in making canoes and for their salmon fishing.
The first European settlers arrived in the area in the early 1800s. The first permanent settlement was established in 1845 by a group of Methodist missionaries. The settlement was named Wishram after the local Native American tribe.
In 1855, the U.S. Army established a military post at Wishram. The post was used to protect settlers from Native American attacks. The post was abandoned in 1858.
In 1871, the Northern Pacific Railroad built a line through Wishram. This allowed the town to become a major shipping center for the region. The railroad also brought new settlers to the area.
In the early 1900s, Wishram became a popular tourist destination. The town was known for its scenic beauty and its fishing and hunting opportunities.
Geography
Wishram is located in Klickitat County, Washington, United States. It is situated along the Columbia River, approximately 20 miles east of The Dalles, Oregon. The town is located at an elevation of 1,000 feet.
The climate in Wishram is semi-arid, with hot summers and cold winters. The average annual temperature is around 50°F. The average annual precipitation is around 12 inches.
Economy
The economy of Wishram is largely based on tourism and agriculture. The town is a popular destination for fishing, hunting, and camping. The nearby Columbia River provides excellent opportunities for fishing and boating.
Agriculture is also an important part of the local economy. The area is known for its production of apples, pears, cherries, and other fruits.
Demographics
The population of Wishram was estimated to be around 200 in 2020. The racial makeup of the town is predominantly white (90.5%), with small percentages of Native American (3.5%), African American (2.5%), and Asian (2.5%).
The median household income in Wishram is around $45,000. The median home value is around $150,000. The unemployment rate is around 5%.
Conclusion
Wishram is a small unincorporated community located in Klickitat County, Washington, United States. It is situated along the Columbia River, approximately 20 miles east of The Dalles, Oregon. The area has been inhabited by Native Americans for thousands of years, and was first settled by European settlers in the early 1800s. The economy of Wishram is largely based on tourism and agriculture. The population of Wishram was estimated to be around 200 in 2020. The town is a popular destination for fishing, hunting, and camping, and is known for its production of apples, pears, cherries, and other fruits.
Common Questions
What is Per Capita Income in Wishram?
Per Capita income in Wishram is $20,448.
What is the Median Family Income in Wishram?
Median Family Income in Wishram is $43,750.
What is the Median Household income in Wishram?
Median Household Income in Wishram is $41,750.
What is Income or Wage Gap in Wishram?
Income or Wage Gap in Wishram is 7.1%.
Women in Wishram earn 92.9 cents for every dollar earned by a man.
What is Inequality or Gini Index in Wishram?
Inequality or Gini Index in Wishram is 0.42.
What is the Total Population of Wishram?
Total Population of Wishram is 502.
What is the Total Male Population of Wishram?
Total Male Population of Wishram is 224.
What is the Total Female Population of Wishram?
Total Female Population of Wishram is 278.
What is the Ratio of Males per 100 Females in Wishram?
There are 80.58 Males per 100 Females in Wishram.
What is the Ratio of Females per 100 Males in Wishram?
There are 124.11 Females per 100 Males in Wishram.
What is the Median Population Age in Wishram?
Median Population Age in Wishram is 48.2 Years.
What is the Average Family Size in Wishram
Average Family Size in Wishram is 3.5 People.
What is the Average Household Size in Wishram
Average Household Size in Wishram is 2.6 People.
How Large is the Labor Force in Wishram?
There are 155 People in the Labor Forcein in Wishram.
What is the Percentage of People in the Labor Force in Wishram?
35.3% of People are in the Labor Force in Wishram.
What is the Unemployment Rate in Wishram?
Unemployment Rate in Wishram is 17.4%.