Northport, WA Map & Demographics
Northport Map
Northport Overview
$28,903
PER CAPITA INCOME
$67,813
AVG FAMILY INCOME
$40,197
AVG HOUSEHOLD INCOME
34.3%
WAGE / INCOME GAP [ % ]
65.7¢/ $1
WAGE / INCOME GAP [ $ ]
0.42
INEQUALITY / GINI INDEX
236
TOTAL POPULATION
99
MALE POPULATION
137
FEMALE POPULATION
72.26
MALES / 100 FEMALES
138.38
FEMALES / 100 MALES
56.7
MEDIAN AGE
2.3
AVG FAMILY SIZE
1.6
AVG HOUSEHOLD SIZE
108
LABOR FORCE [ PEOPLE ]
50.5%
PERCENT IN LABOR FORCE
Northport Zip Codes
Northport Area Codes
Income in Northport
Income Overview in Northport
Per Capita Income in Northport is $28,903, while median incomes of families and households are $67,813 and $40,197 respectively.
| Characteristic | Number | Measure |
| Per Capita Income | 236 | $28,903 |
| Median Family Income | 51 | $67,813 |
| Mean Family Income | 51 | $70,606 |
| Median Household Income | 143 | $40,197 |
| Mean Household Income | 143 | $49,371 |
| Income Deficit | 51 | $0 |
| Wage / Income Gap (%) | 236 | 34.31% |
| Wage / Income Gap ($) | 236 | 65.69¢ per $1 |
| Gini / Inequality Index | 236 | 0.42 |
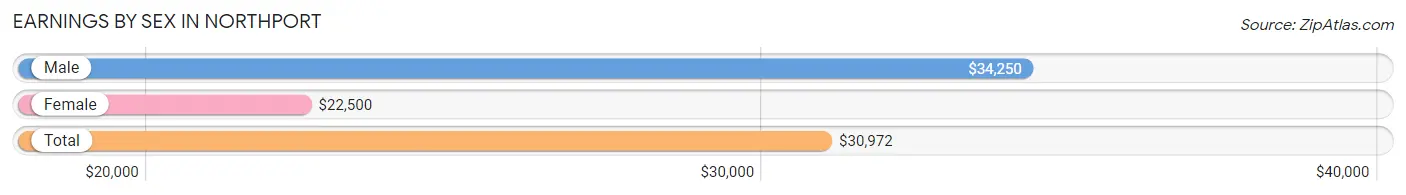
Earnings by Sex in Northport
Average Earnings in Northport are $30,972, $34,250 for men and $22,500 for women, a difference of 34.3%.
| Sex | Number | Average Earnings |
| Male | 55 (46.2%) | $34,250 |
| Female | 64 (53.8%) | $22,500 |
| Total | 119 (100.0%) | $30,972 |
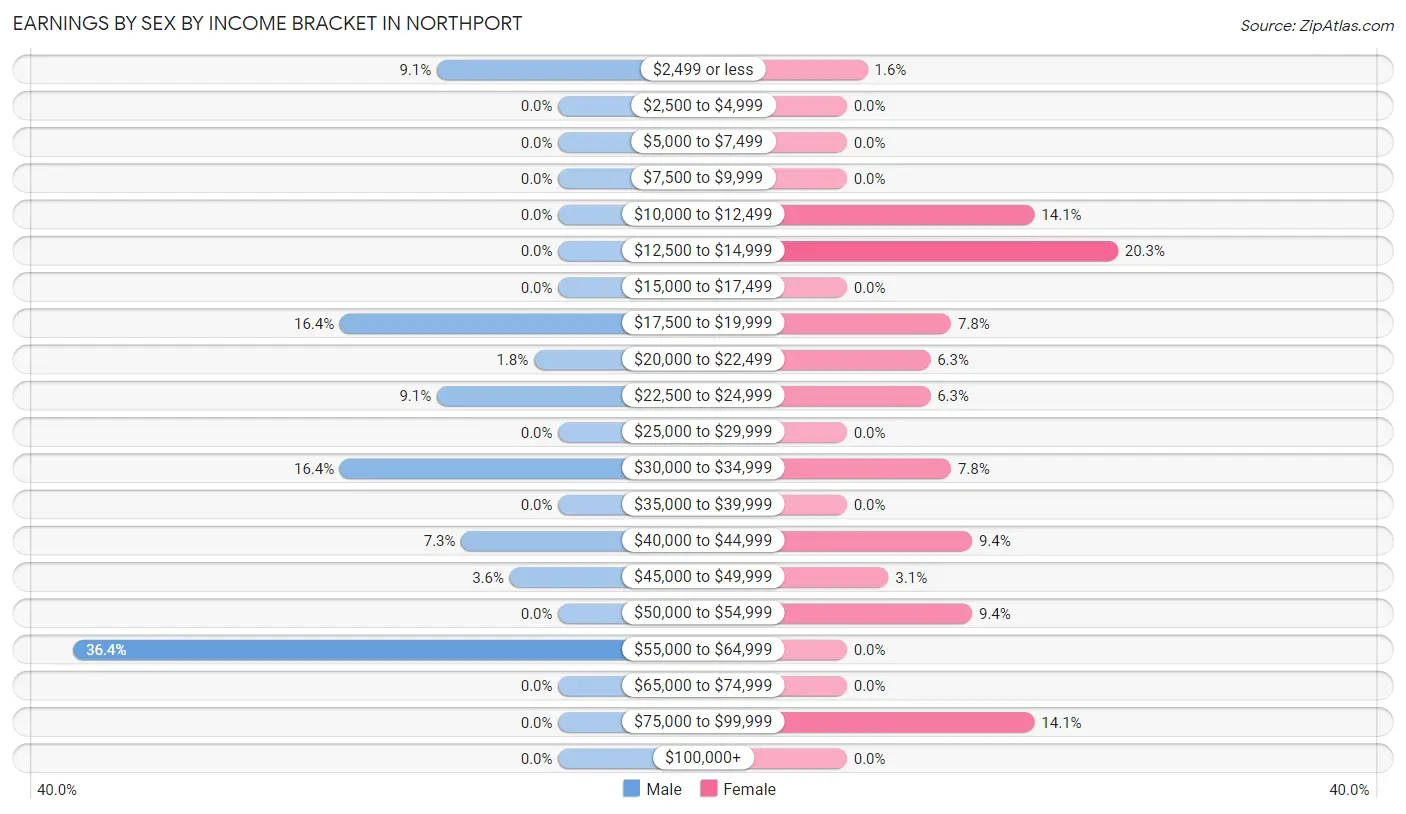
Earnings by Sex by Income Bracket in Northport
The most common earnings brackets in Northport are $55,000 to $64,999 for men (20 | 36.4%) and $12,500 to $14,999 for women (13 | 20.3%).
| Income | Male | Female |
| $2,499 or less | 5 (9.1%) | 1 (1.6%) |
| $2,500 to $4,999 | 0 (0.0%) | 0 (0.0%) |
| $5,000 to $7,499 | 0 (0.0%) | 0 (0.0%) |
| $7,500 to $9,999 | 0 (0.0%) | 0 (0.0%) |
| $10,000 to $12,499 | 0 (0.0%) | 9 (14.1%) |
| $12,500 to $14,999 | 0 (0.0%) | 13 (20.3%) |
| $15,000 to $17,499 | 0 (0.0%) | 0 (0.0%) |
| $17,500 to $19,999 | 9 (16.4%) | 5 (7.8%) |
| $20,000 to $22,499 | 1 (1.8%) | 4 (6.2%) |
| $22,500 to $24,999 | 5 (9.1%) | 4 (6.2%) |
| $25,000 to $29,999 | 0 (0.0%) | 0 (0.0%) |
| $30,000 to $34,999 | 9 (16.4%) | 5 (7.8%) |
| $35,000 to $39,999 | 0 (0.0%) | 0 (0.0%) |
| $40,000 to $44,999 | 4 (7.3%) | 6 (9.4%) |
| $45,000 to $49,999 | 2 (3.6%) | 2 (3.1%) |
| $50,000 to $54,999 | 0 (0.0%) | 6 (9.4%) |
| $55,000 to $64,999 | 20 (36.4%) | 0 (0.0%) |
| $65,000 to $74,999 | 0 (0.0%) | 0 (0.0%) |
| $75,000 to $99,999 | 0 (0.0%) | 9 (14.1%) |
| $100,000+ | 0 (0.0%) | 0 (0.0%) |
| Total | 55 (100.0%) | 64 (100.0%) |
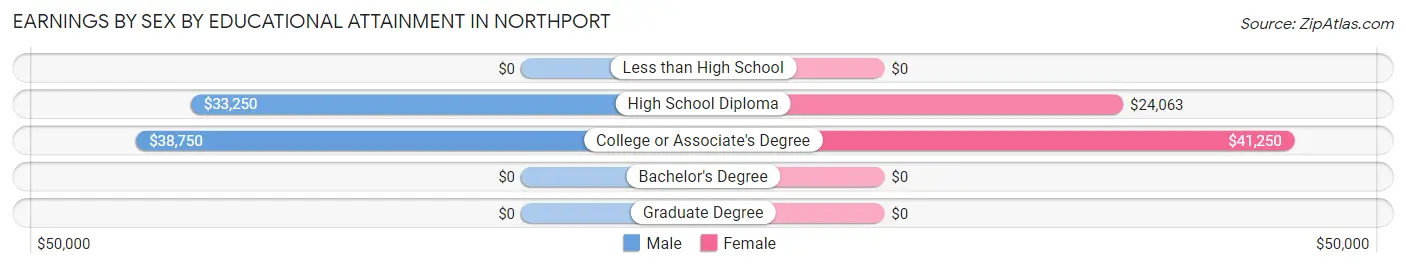
Earnings by Sex by Educational Attainment in Northport
Average earnings in Northport are $32,750 for men and $22,500 for women, a difference of 31.3%. Men with an educational attainment of college or associate's degree enjoy the highest average annual earnings of $38,750, while those with high school diploma education earn the least with $33,250. Women with an educational attainment of college or associate's degree earn the most with the average annual earnings of $41,250, while those with high school diploma education have the smallest earnings of $24,063.
| Educational Attainment | Male Income | Female Income |
| Less than High School | - | - |
| High School Diploma | $33,250 | $24,063 |
| College or Associate's Degree | $38,750 | $41,250 |
| Bachelor's Degree | - | - |
| Graduate Degree | - | - |
| Total | $32,750 | $22,500 |
Family Income in Northport
Family Income Brackets in Northport
According to the Northport family income data, there are 15 families falling into the $100,000 to $149,999 income range, which is the most common income bracket and makes up 29.4% of all families.
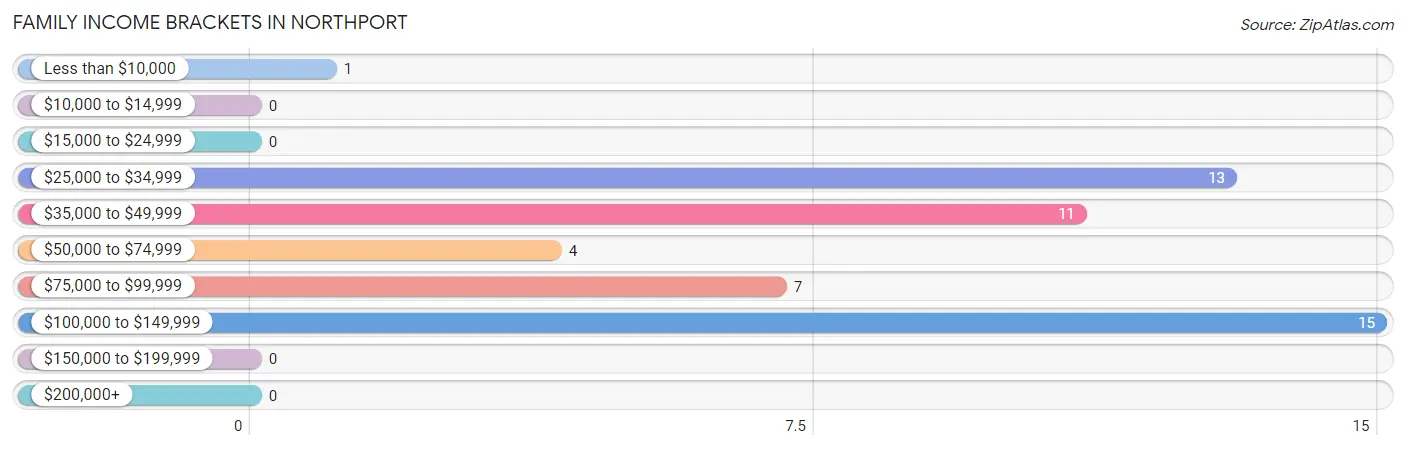
| Income Bracket | # Families | % Families |
| Less than $10,000 | 1 | 2.0% |
| $10,000 to $14,999 | 0 | 0.0% |
| $15,000 to $24,999 | 0 | 0.0% |
| $25,000 to $34,999 | 13 | 25.5% |
| $35,000 to $49,999 | 11 | 21.6% |
| $50,000 to $74,999 | 4 | 7.8% |
| $75,000 to $99,999 | 7 | 13.7% |
| $100,000 to $149,999 | 15 | 29.4% |
| $150,000 to $199,999 | 0 | 0.0% |
| $200,000+ | 0 | 0.0% |
Family Income by Famaliy Size in Northport
2-person families (32 | 62.7%) account for the highest median family income in Northport with $77,500 per family, while 2-person families (32 | 62.7%) have the highest median income of $38,750 per family member.
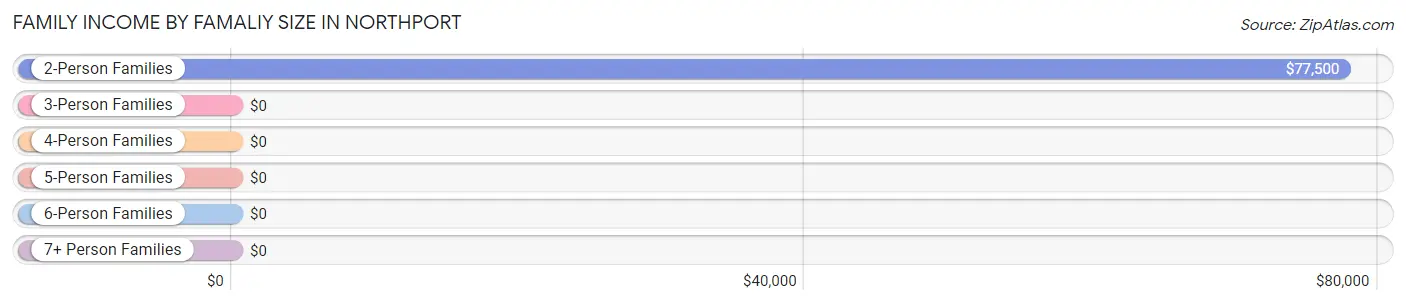
| Income Bracket | # Families | Median Income |
| 2-Person Families | 32 (62.7%) | $77,500 |
| 3-Person Families | 6 (11.8%) | $0 |
| 4-Person Families | 13 (25.5%) | $0 |
| 5-Person Families | 0 (0.0%) | $0 |
| 6-Person Families | 0 (0.0%) | $0 |
| 7+ Person Families | 0 (0.0%) | $0 |
| Total | 51 (100.0%) | $67,813 |
Family Income by Number of Earners in Northport
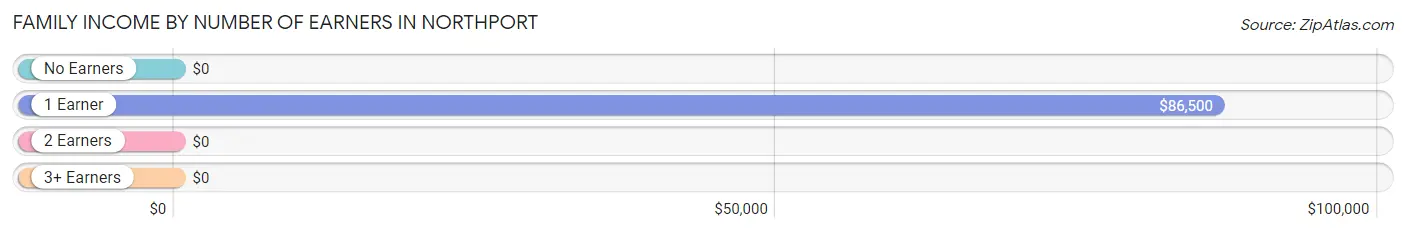
| Number of Earners | # Families | Median Income |
| No Earners | 4 (7.8%) | $0 |
| 1 Earner | 14 (27.5%) | $86,500 |
| 2 Earners | 33 (64.7%) | $0 |
| 3+ Earners | 0 (0.0%) | $0 |
| Total | 51 (100.0%) | $67,813 |
Household Income in Northport
Household Income Brackets in Northport
With 27 households falling in the category, the $35,000 to $49,999 income range is the most frequent in Northport, accounting for 18.9% of all households.
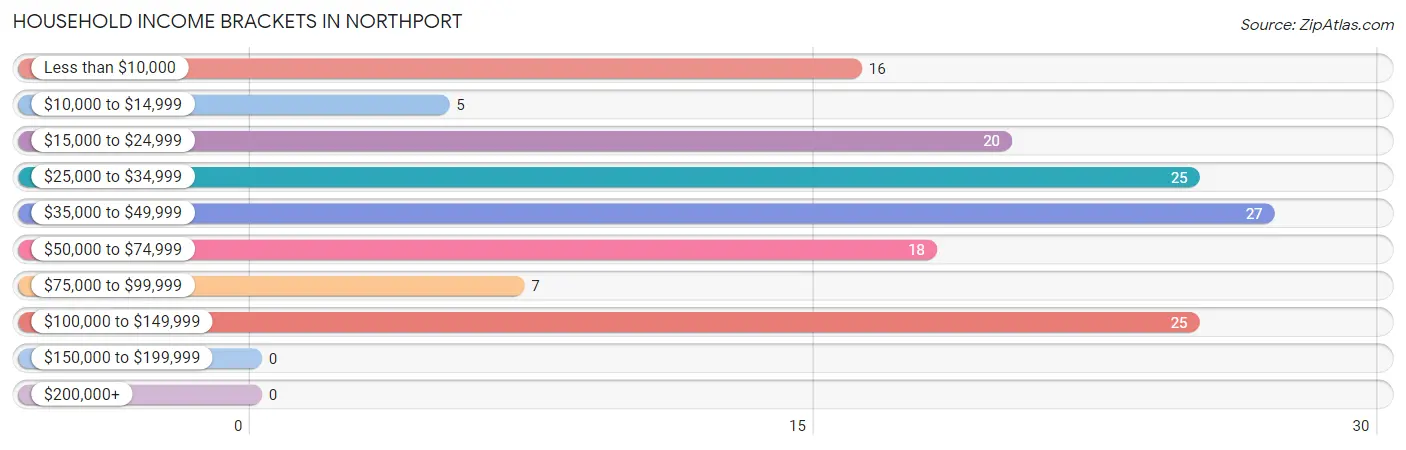
| Income Bracket | # Households | % Households |
| Less than $10,000 | 16 | 11.2% |
| $10,000 to $14,999 | 5 | 3.5% |
| $15,000 to $24,999 | 20 | 14.0% |
| $25,000 to $34,999 | 25 | 17.5% |
| $35,000 to $49,999 | 27 | 18.9% |
| $50,000 to $74,999 | 18 | 12.6% |
| $75,000 to $99,999 | 7 | 4.9% |
| $100,000 to $149,999 | 25 | 17.5% |
| $150,000 to $199,999 | 0 | 0.0% |
| $200,000+ | 0 | 0.0% |
Household Income by Householder Age in Northport
The median household income in Northport is $40,197, with the highest median household income of $40,208 found in the 65+ years age bracket for the primary householder. A total of 54 households (37.8%) fall into this category. Meanwhile, the 15 to 24 years age bracket for the primary householder has the lowest median household income of $0, with 6 households (4.2%) in this group.
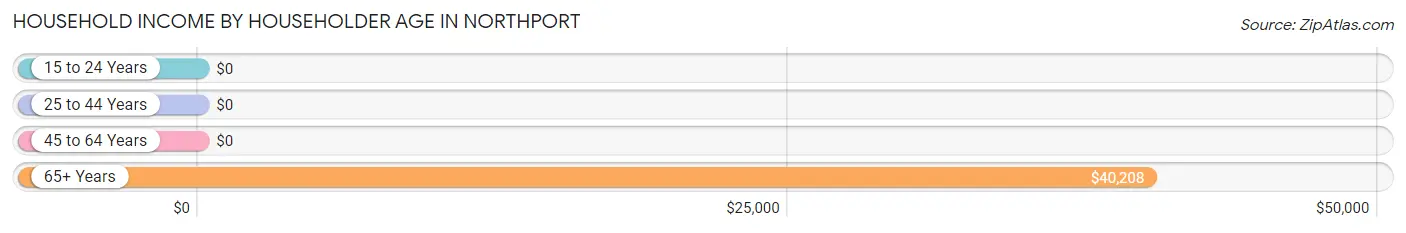
| Income Bracket | # Households | Median Income |
| 15 to 24 Years | 6 (4.2%) | $0 |
| 25 to 44 Years | 35 (24.5%) | $0 |
| 45 to 64 Years | 48 (33.6%) | $0 |
| 65+ Years | 54 (37.8%) | $40,208 |
| Total | 143 (100.0%) | $40,197 |
Poverty in Northport
Income Below Poverty by Sex and Age in Northport
With 14.1% poverty level for males and 18.2% for females among the residents of Northport, 45 to 54 year old males and 12 to 14 year old females are the most vulnerable to poverty, with 1 males (100.0%) and 1 females (100.0%) in their respective age groups living below the poverty level.
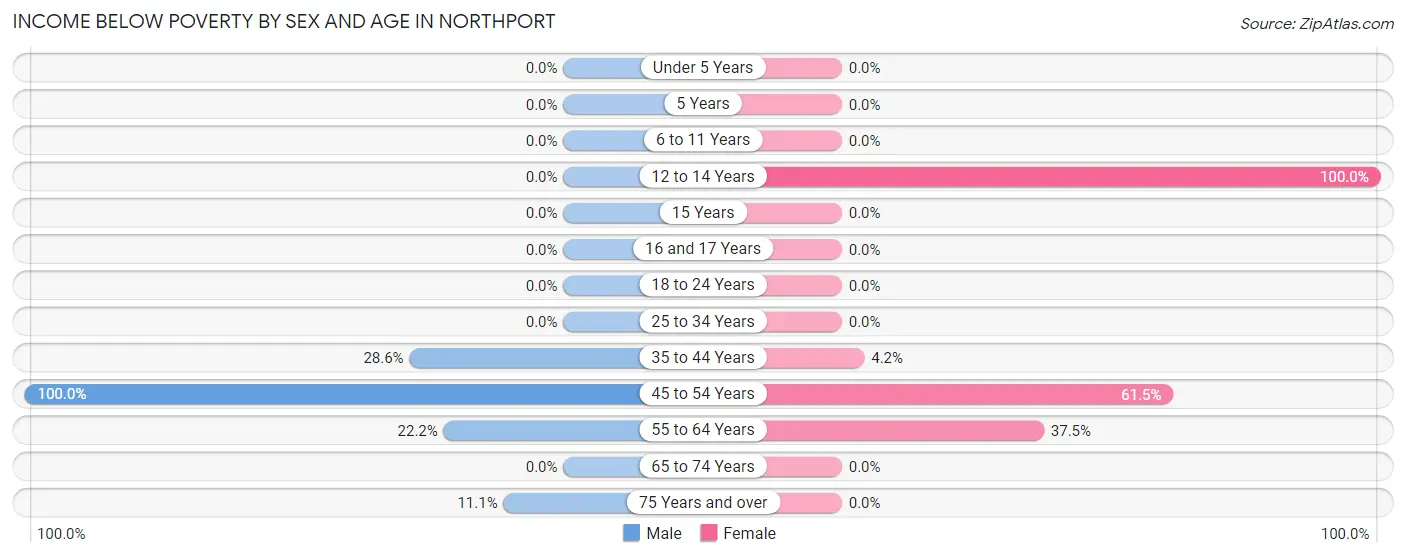
| Age Bracket | Male | Female |
| Under 5 Years | 0 (0.0%) | 0 (0.0%) |
| 5 Years | 0 (0.0%) | 0 (0.0%) |
| 6 to 11 Years | 0 (0.0%) | 0 (0.0%) |
| 12 to 14 Years | 0 (0.0%) | 1 (100.0%) |
| 15 Years | 0 (0.0%) | 0 (0.0%) |
| 16 and 17 Years | 0 (0.0%) | 0 (0.0%) |
| 18 to 24 Years | 0 (0.0%) | 0 (0.0%) |
| 25 to 34 Years | 0 (0.0%) | 0 (0.0%) |
| 35 to 44 Years | 6 (28.6%) | 1 (4.2%) |
| 45 to 54 Years | 1 (100.0%) | 8 (61.5%) |
| 55 to 64 Years | 6 (22.2%) | 15 (37.5%) |
| 65 to 74 Years | 0 (0.0%) | 0 (0.0%) |
| 75 Years and over | 1 (11.1%) | 0 (0.0%) |
| Total | 14 (14.1%) | 25 (18.2%) |
Income Above Poverty by Sex and Age in Northport
According to the poverty statistics in Northport, males aged 6 to 11 years and females aged 6 to 11 years are the age groups that are most secure financially, with 100.0% of males and 100.0% of females in these age groups living above the poverty line.
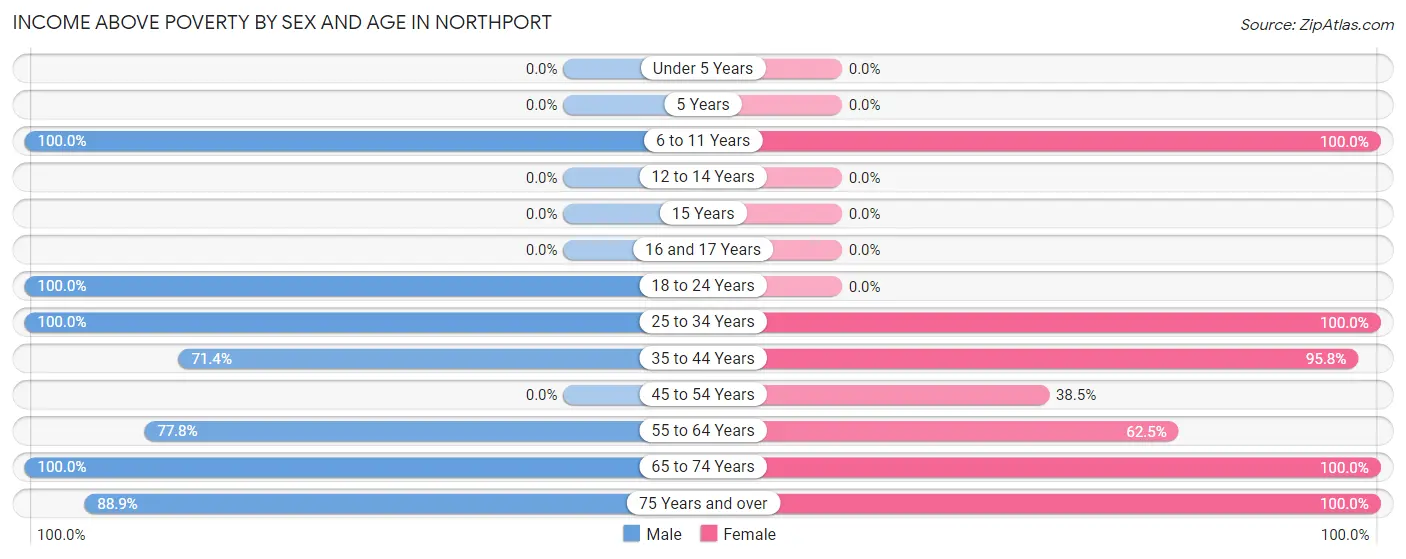
| Age Bracket | Male | Female |
| Under 5 Years | 0 (0.0%) | 0 (0.0%) |
| 5 Years | 0 (0.0%) | 0 (0.0%) |
| 6 to 11 Years | 15 (100.0%) | 6 (100.0%) |
| 12 to 14 Years | 0 (0.0%) | 0 (0.0%) |
| 15 Years | 0 (0.0%) | 0 (0.0%) |
| 16 and 17 Years | 0 (0.0%) | 0 (0.0%) |
| 18 to 24 Years | 6 (100.0%) | 0 (0.0%) |
| 25 to 34 Years | 10 (100.0%) | 12 (100.0%) |
| 35 to 44 Years | 15 (71.4%) | 23 (95.8%) |
| 45 to 54 Years | 0 (0.0%) | 5 (38.5%) |
| 55 to 64 Years | 21 (77.8%) | 25 (62.5%) |
| 65 to 74 Years | 10 (100.0%) | 18 (100.0%) |
| 75 Years and over | 8 (88.9%) | 23 (100.0%) |
| Total | 85 (85.9%) | 112 (81.8%) |
Income Below Poverty Among Married-Couple Families in Northport
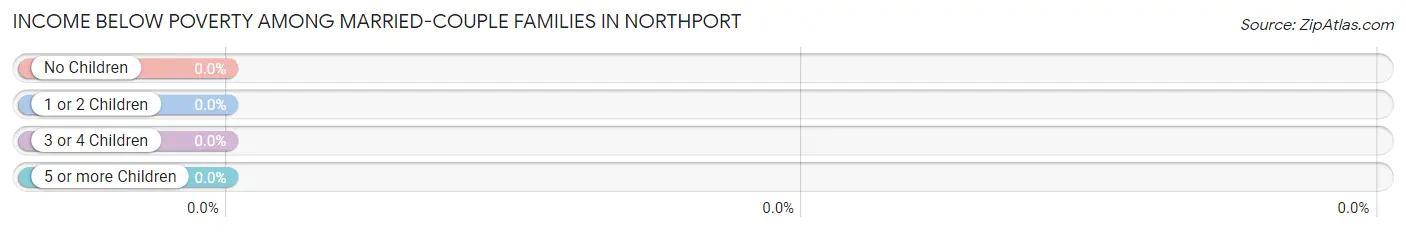
| Children | Above Poverty | Below Poverty |
| No Children | 22 (100.0%) | 0 (0.0%) |
| 1 or 2 Children | 19 (100.0%) | 0 (0.0%) |
| 3 or 4 Children | 0 (0.0%) | 0 (0.0%) |
| 5 or more Children | 0 (0.0%) | 0 (0.0%) |
| Total | 41 (100.0%) | 0 (0.0%) |
Income Below Poverty Among Single-Parent Households in Northport
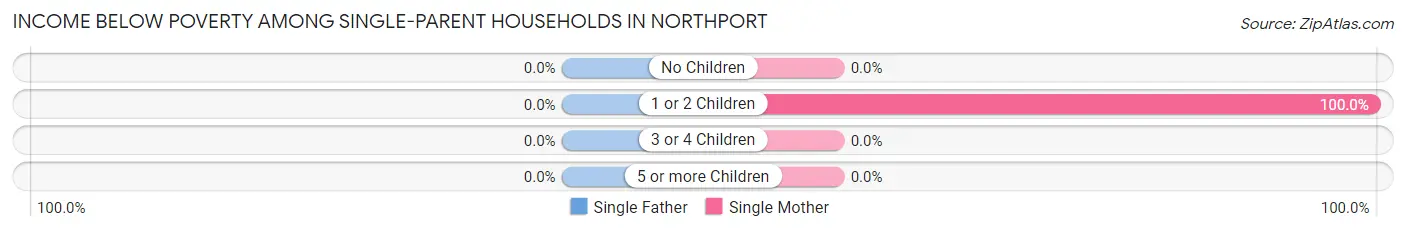
| Children | Single Father | Single Mother |
| No Children | 0 (0.0%) | 0 (0.0%) |
| 1 or 2 Children | 0 (0.0%) | 1 (100.0%) |
| 3 or 4 Children | 0 (0.0%) | 0 (0.0%) |
| 5 or more Children | 0 (0.0%) | 0 (0.0%) |
| Total | 0 (0.0%) | 1 (10.0%) |
Income Below Poverty Among Married-Couple vs Single-Parent Households in Northport
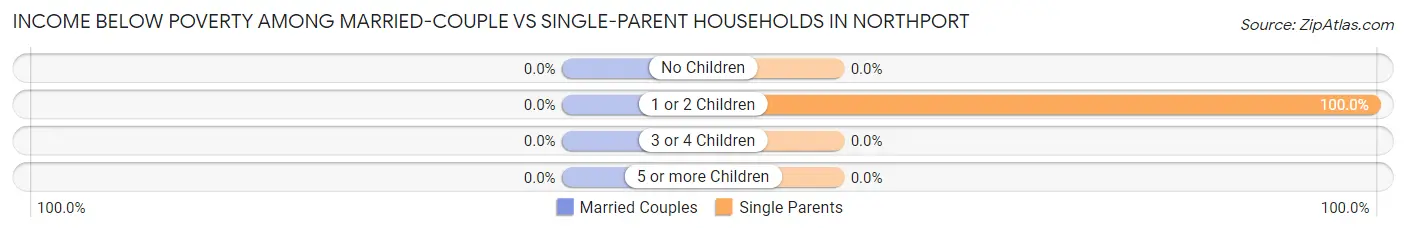
| Children | Married-Couple Families | Single-Parent Households |
| No Children | 0 (0.0%) | 0 (0.0%) |
| 1 or 2 Children | 0 (0.0%) | 1 (100.0%) |
| 3 or 4 Children | 0 (0.0%) | 0 (0.0%) |
| 5 or more Children | 0 (0.0%) | 0 (0.0%) |
| Total | 0 (0.0%) | 1 (10.0%) |
Race in Northport
The most populous races in Northport are White / Caucasian (204 | 86.4%), Two or more Races (21 | 8.9%), and Hispanic or Latino (18 | 7.6%).
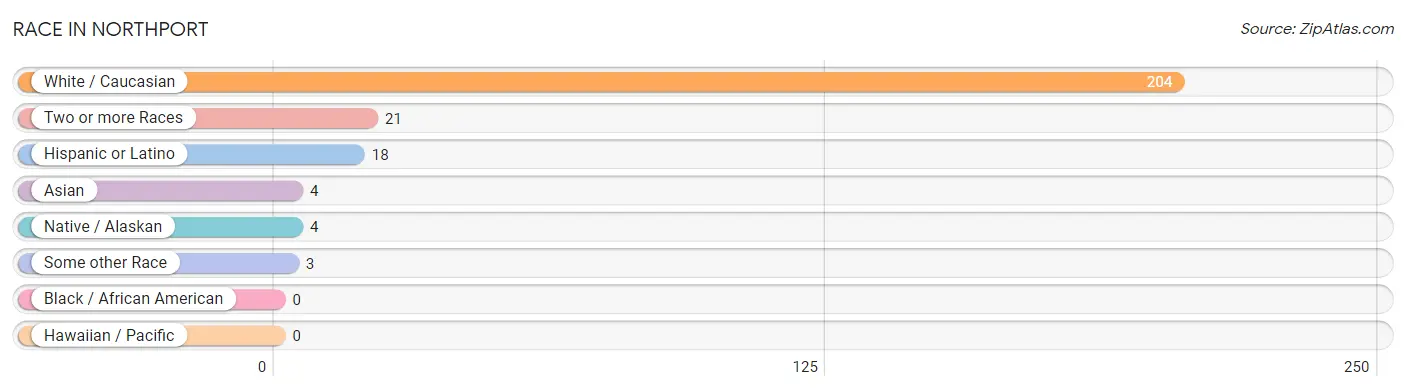
| Race | # Population | % Population |
| Asian | 4 | 1.7% |
| Black / African American | 0 | 0.0% |
| Hawaiian / Pacific | 0 | 0.0% |
| Hispanic or Latino | 18 | 7.6% |
| Native / Alaskan | 4 | 1.7% |
| White / Caucasian | 204 | 86.4% |
| Two or more Races | 21 | 8.9% |
| Some other Race | 3 | 1.3% |
| Total | 236 | 100.0% |
Ancestry in Northport
The most populous ancestries reported in Northport are Irish (63 | 26.7%), German (58 | 24.6%), Scottish (20 | 8.5%), Mexican (18 | 7.6%), and English (17 | 7.2%), together accounting for 74.6% of all Northport residents.
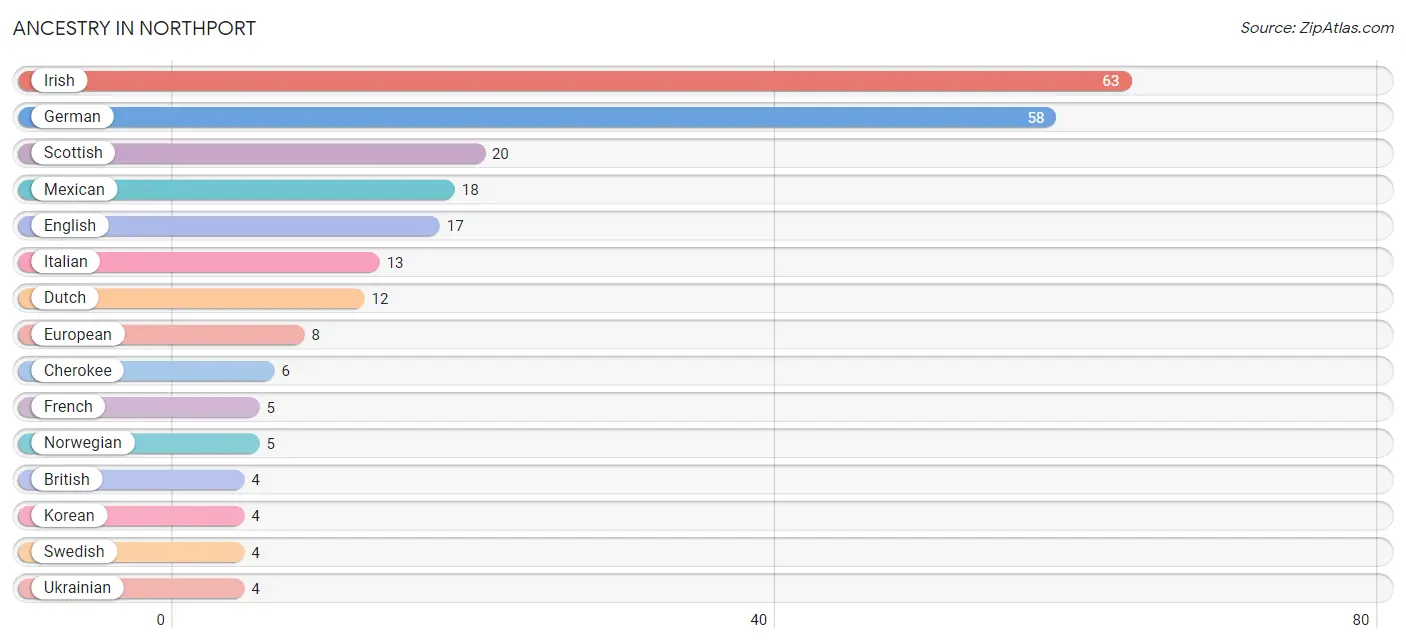
| Ancestry | # Population | % Population |
| American | 2 | 0.9% |
| British | 4 | 1.7% |
| Cherokee | 6 | 2.5% |
| Dutch | 12 | 5.1% |
| English | 17 | 7.2% |
| European | 8 | 3.4% |
| French | 5 | 2.1% |
| German | 58 | 24.6% |
| Irish | 63 | 26.7% |
| Italian | 13 | 5.5% |
| Korean | 4 | 1.7% |
| Mexican | 18 | 7.6% |
| Norwegian | 5 | 2.1% |
| Scottish | 20 | 8.5% |
| Swedish | 4 | 1.7% |
| Ukrainian | 4 | 1.7% |
| Welsh | 1 | 0.4% | View All 17 Rows |
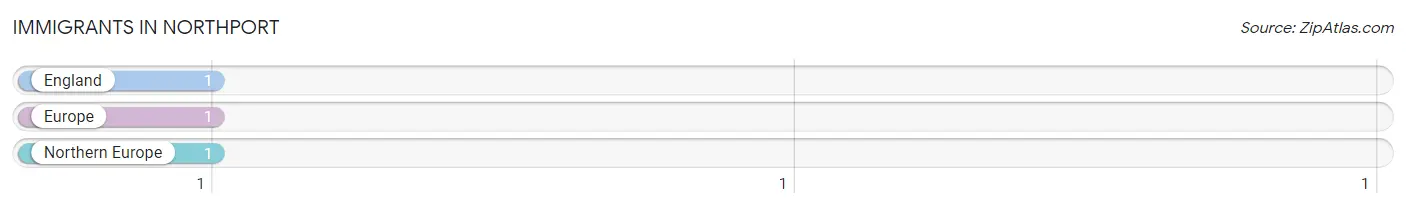
Immigrants in Northport
The most numerous immigrant groups reported in Northport came from England (1 | 0.4%), Europe (1 | 0.4%), and Northern Europe (1 | 0.4%), together accounting for 1.3% of all Northport residents.
| Immigration Origin | # Population | % Population |
| England | 1 | 0.4% |
| Europe | 1 | 0.4% |
| Northern Europe | 1 | 0.4% | View All 3 Rows |
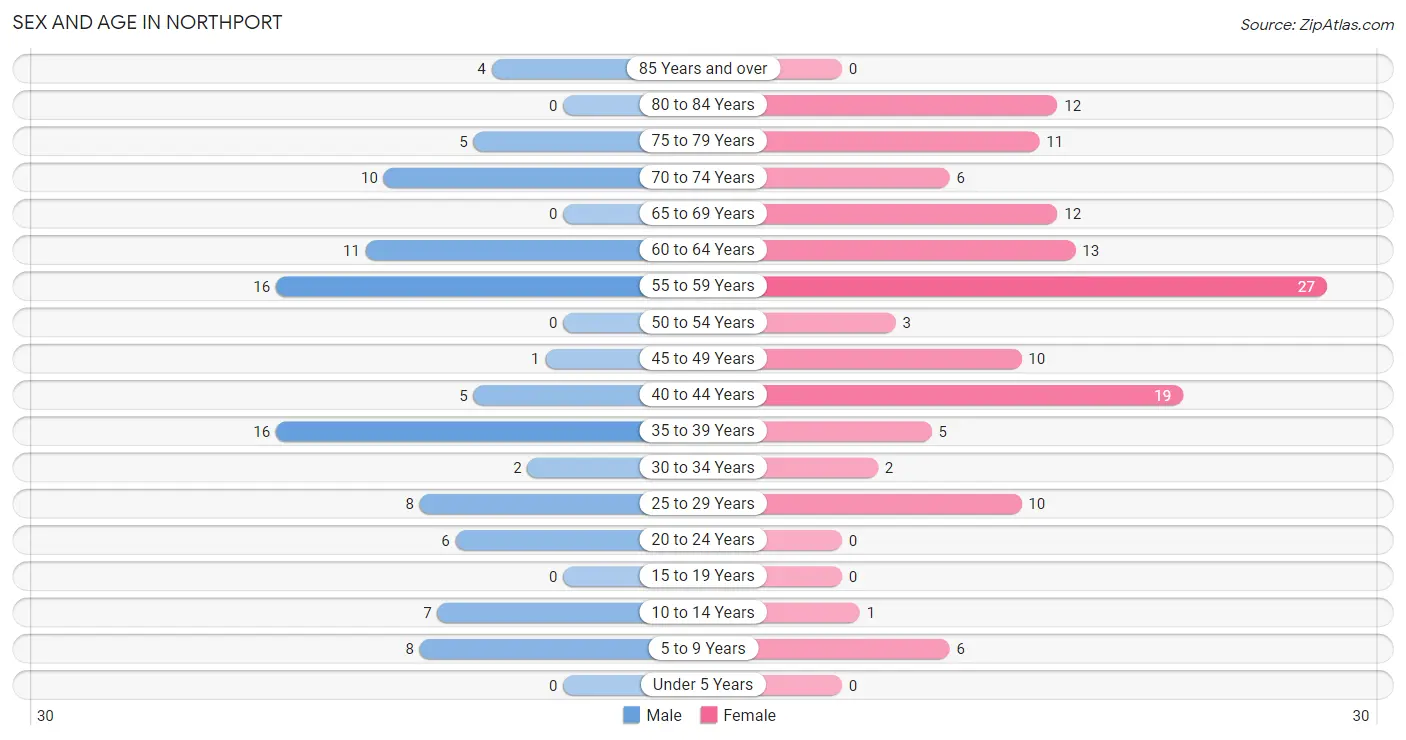
Sex and Age in Northport
Sex and Age in Northport
The most populous age groups in Northport are 35 to 39 Years (16 | 16.2%) for men and 55 to 59 Years (27 | 19.7%) for women.
| Age Bracket | Male | Female |
| Under 5 Years | 0 (0.0%) | 0 (0.0%) |
| 5 to 9 Years | 8 (8.1%) | 6 (4.4%) |
| 10 to 14 Years | 7 (7.1%) | 1 (0.7%) |
| 15 to 19 Years | 0 (0.0%) | 0 (0.0%) |
| 20 to 24 Years | 6 (6.1%) | 0 (0.0%) |
| 25 to 29 Years | 8 (8.1%) | 10 (7.3%) |
| 30 to 34 Years | 2 (2.0%) | 2 (1.5%) |
| 35 to 39 Years | 16 (16.2%) | 5 (3.6%) |
| 40 to 44 Years | 5 (5.1%) | 19 (13.9%) |
| 45 to 49 Years | 1 (1.0%) | 10 (7.3%) |
| 50 to 54 Years | 0 (0.0%) | 3 (2.2%) |
| 55 to 59 Years | 16 (16.2%) | 27 (19.7%) |
| 60 to 64 Years | 11 (11.1%) | 13 (9.5%) |
| 65 to 69 Years | 0 (0.0%) | 12 (8.8%) |
| 70 to 74 Years | 10 (10.1%) | 6 (4.4%) |
| 75 to 79 Years | 5 (5.1%) | 11 (8.0%) |
| 80 to 84 Years | 0 (0.0%) | 12 (8.8%) |
| 85 Years and over | 4 (4.0%) | 0 (0.0%) |
| Total | 99 (100.0%) | 137 (100.0%) |
Families and Households in Northport
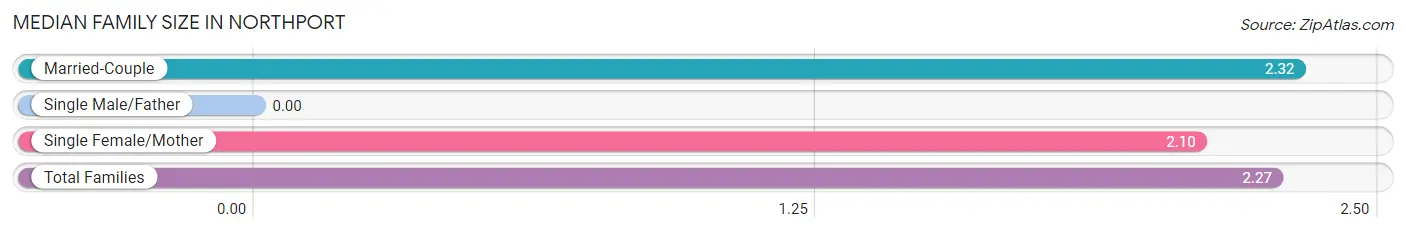
Median Family Size in Northport
| Family Type | # Families | Family Size |
| Married-Couple | 41 (80.4%) | 2.32 |
| Single Male/Father | 0 (0.0%) | - |
| Single Female/Mother | 10 (19.6%) | 2.10 |
| Total Families | 51 (100.0%) | 2.27 |
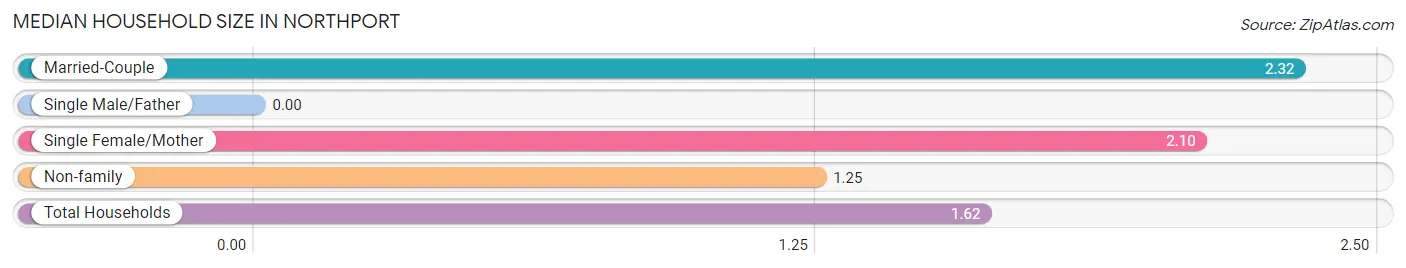
Median Household Size in Northport
| Household Type | # Households | Household Size |
| Married-Couple | 41 (28.7%) | 2.32 |
| Single Male/Father | 0 (0.0%) | - |
| Single Female/Mother | 10 (7.0%) | 2.10 |
| Non-family | 92 (64.3%) | 1.25 |
| Total Households | 143 (100.0%) | 1.62 |
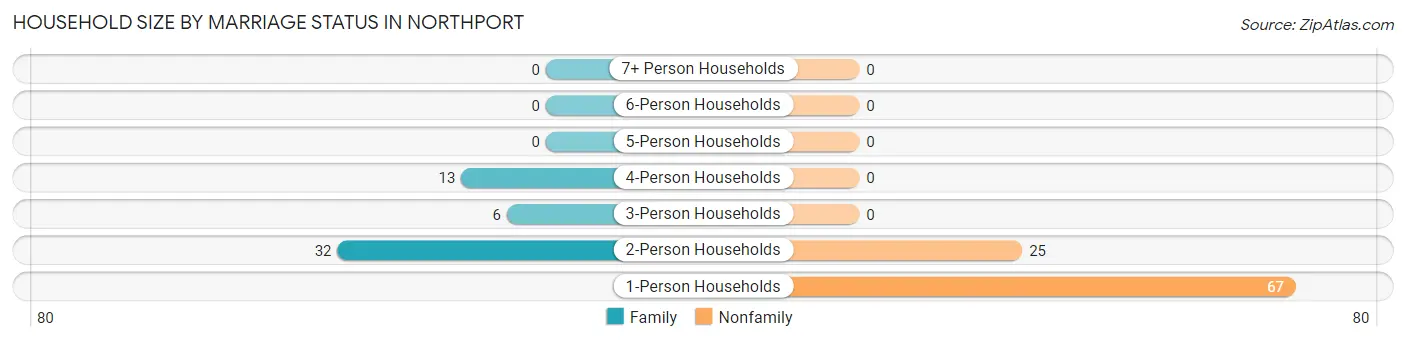
Household Size by Marriage Status in Northport
Out of a total of 143 households in Northport, 51 (35.7%) are family households, while 92 (64.3%) are nonfamily households. The most numerous type of family households are 2-person households, comprising 32, and the most common type of nonfamily households are 1-person households, comprising 67.
| Household Size | Family Households | Nonfamily Households |
| 1-Person Households | - | 67 (46.9%) |
| 2-Person Households | 32 (22.4%) | 25 (17.5%) |
| 3-Person Households | 6 (4.2%) | 0 (0.0%) |
| 4-Person Households | 13 (9.1%) | 0 (0.0%) |
| 5-Person Households | 0 (0.0%) | 0 (0.0%) |
| 6-Person Households | 0 (0.0%) | 0 (0.0%) |
| 7+ Person Households | 0 (0.0%) | 0 (0.0%) |
| Total | 51 (35.7%) | 92 (64.3%) |
Female Fertility in Northport
Fertility by Age in Northport
| Age Bracket | Women with Births | Births / 1,000 Women |
| 15 to 19 years | 0 (0.0%) | 0.0 |
| 20 to 34 years | 0 (0.0%) | 0.0 |
| 35 to 50 years | 0 (0.0%) | 0.0 |
| Total | 0 (0.0%) | 0.0 |
Fertility by Age by Marriage Status in Northport
| Age Bracket | Married | Unmarried |
| 15 to 19 years | 0 (0.0%) | 0 (0.0%) |
| 20 to 34 years | 0 (0.0%) | 0 (0.0%) |
| 35 to 50 years | 0 (0.0%) | 0 (0.0%) |
| Total | 0 (0.0%) | 0 (0.0%) |
Fertility by Education in Northport
| Educational Attainment | Women with Births | Births / 1,000 Women |
| Less than High School | 0 (0.0%) | 0.0 |
| High School Diploma | 0 (0.0%) | 0.0 |
| College or Associate's Degree | 0 (0.0%) | 0.0 |
| Bachelor's Degree | 0 (0.0%) | 0.0 |
| Graduate Degree | 0 (0.0%) | 0.0 |
| Total | 0 (0.0%) | 0.0 |
Fertility by Education by Marriage Status in Northport
| Educational Attainment | Married | Unmarried |
| Less than High School | 0 (0.0%) | 0 (0.0%) |
| High School Diploma | 0 (0.0%) | 0 (0.0%) |
| College or Associate's Degree | 0 (0.0%) | 0 (0.0%) |
| Bachelor's Degree | 0 (0.0%) | 0 (0.0%) |
| Graduate Degree | 0 (0.0%) | 0 (0.0%) |
| Total | 0 (0.0%) | 0 (0.0%) |
Employment Characteristics in Northport
Employment by Class of Employer in Northport
Among the 108 employed individuals in Northport, private company employees (65 | 60.2%), state government employees (20 | 18.5%), and self-employed (not incorporated) (17 | 15.7%) make up the most common classes of employment.
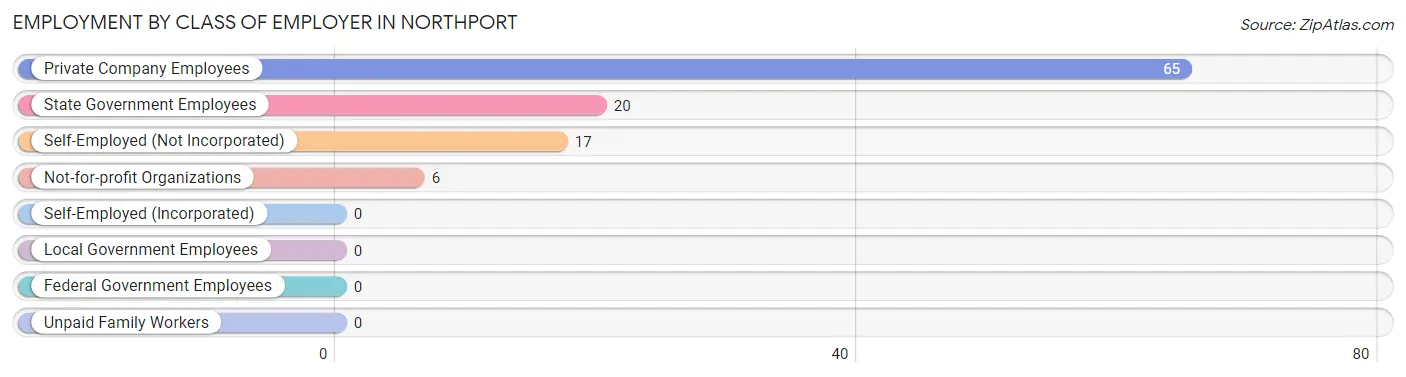
| Employer Class | # Employees | % Employees |
| Private Company Employees | 65 | 60.2% |
| Self-Employed (Incorporated) | 0 | 0.0% |
| Self-Employed (Not Incorporated) | 17 | 15.7% |
| Not-for-profit Organizations | 6 | 5.6% |
| Local Government Employees | 0 | 0.0% |
| State Government Employees | 20 | 18.5% |
| Federal Government Employees | 0 | 0.0% |
| Unpaid Family Workers | 0 | 0.0% |
| Total | 108 | 100.0% |
Employment Status by Age in Northport
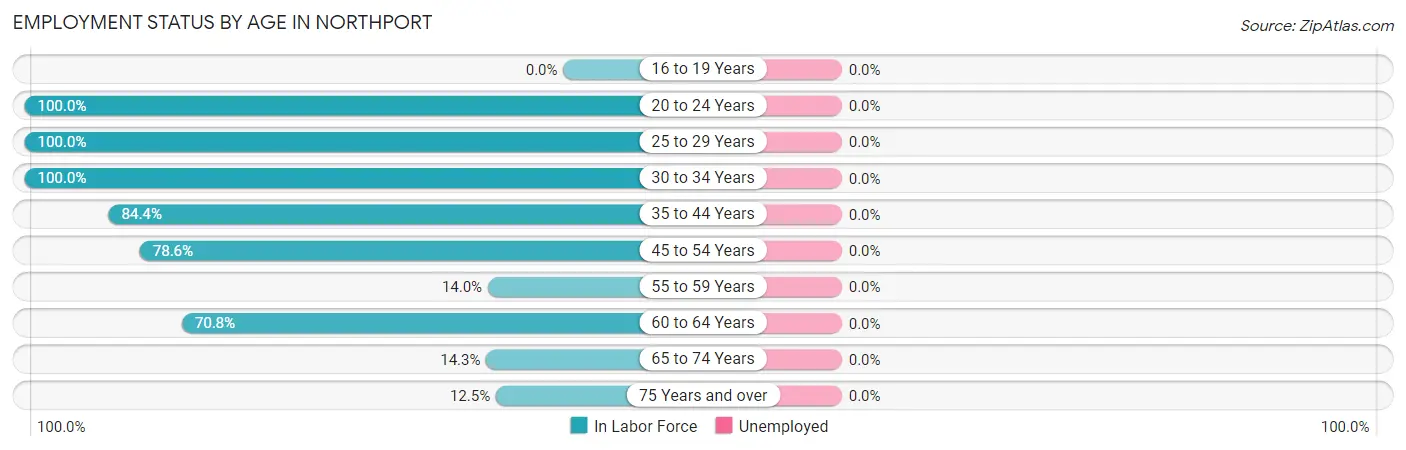
| Age Bracket | In Labor Force | Unemployed |
| 16 to 19 Years | 0 (0.0%) | 0 (0.0%) |
| 20 to 24 Years | 6 (100.0%) | 0 (0.0%) |
| 25 to 29 Years | 18 (100.0%) | 0 (0.0%) |
| 30 to 34 Years | 4 (100.0%) | 0 (0.0%) |
| 35 to 44 Years | 38 (84.4%) | 0 (0.0%) |
| 45 to 54 Years | 11 (78.6%) | 0 (0.0%) |
| 55 to 59 Years | 6 (14.0%) | 0 (0.0%) |
| 60 to 64 Years | 17 (70.8%) | 0 (0.0%) |
| 65 to 74 Years | 4 (14.3%) | 0 (0.0%) |
| 75 Years and over | 4 (12.5%) | 0 (0.0%) |
| Total | 108 (50.5%) | 0 (0.0%) |
Employment Status by Educational Attainment in Northport
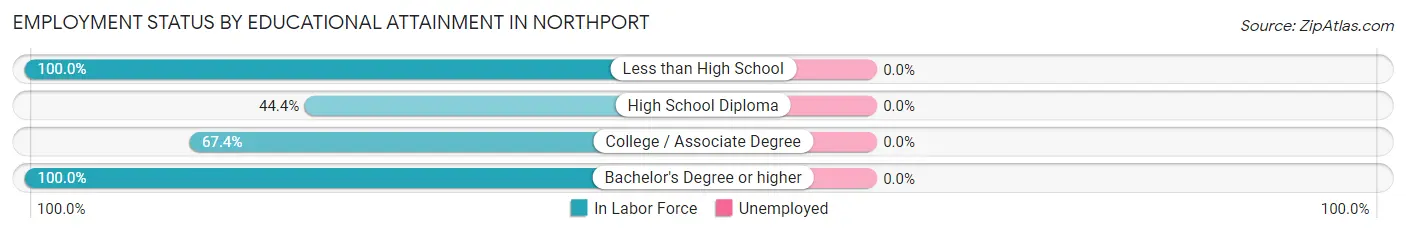
| Educational Attainment | In Labor Force | Unemployed |
| Less than High School | 9 (100.0%) | 0 (0.0%) |
| High School Diploma | 32 (44.4%) | 0 (0.0%) |
| College / Associate Degree | 29 (67.4%) | 0 (0.0%) |
| Bachelor's Degree or higher | 24 (100.0%) | 0 (0.0%) |
| Total | 94 (63.5%) | 0 (0.0%) |
Employment Occupations by Sex in Northport
Management, Business, Science and Arts Occupations
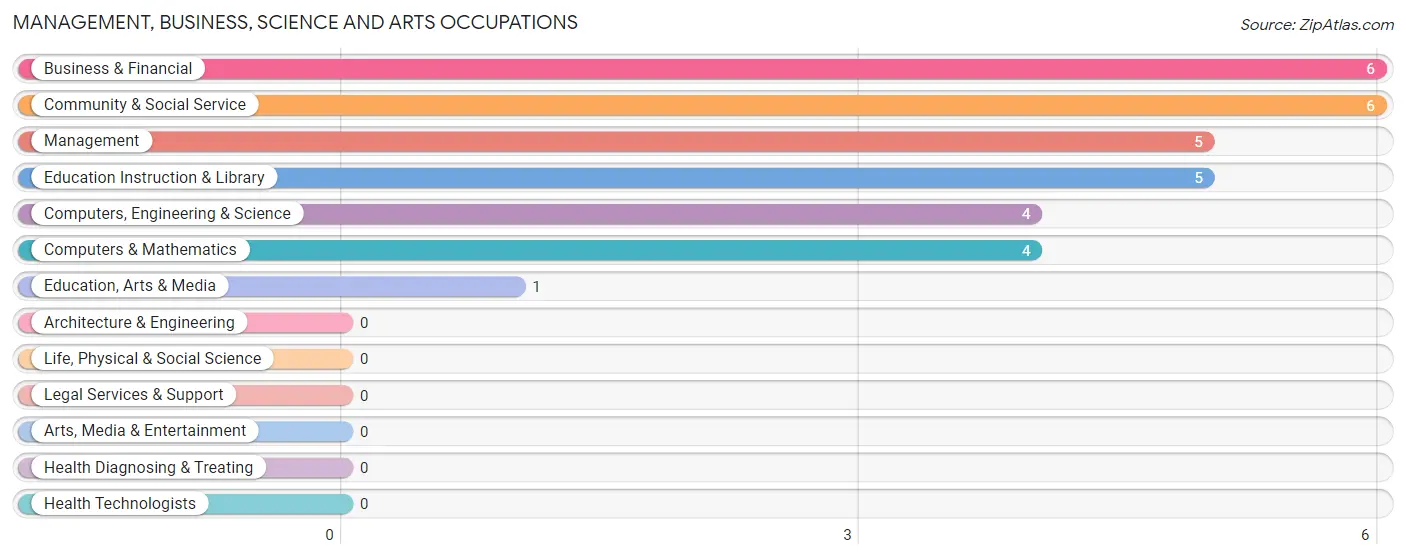
The most common Management, Business, Science and Arts occupations in Northport are Business & Financial (6 | 5.6%), Community & Social Service (6 | 5.6%), Management (5 | 4.6%), Education Instruction & Library (5 | 4.6%), and Computers, Engineering & Science (4 | 3.7%).
Management, Business, Science and Arts Occupations by Sex
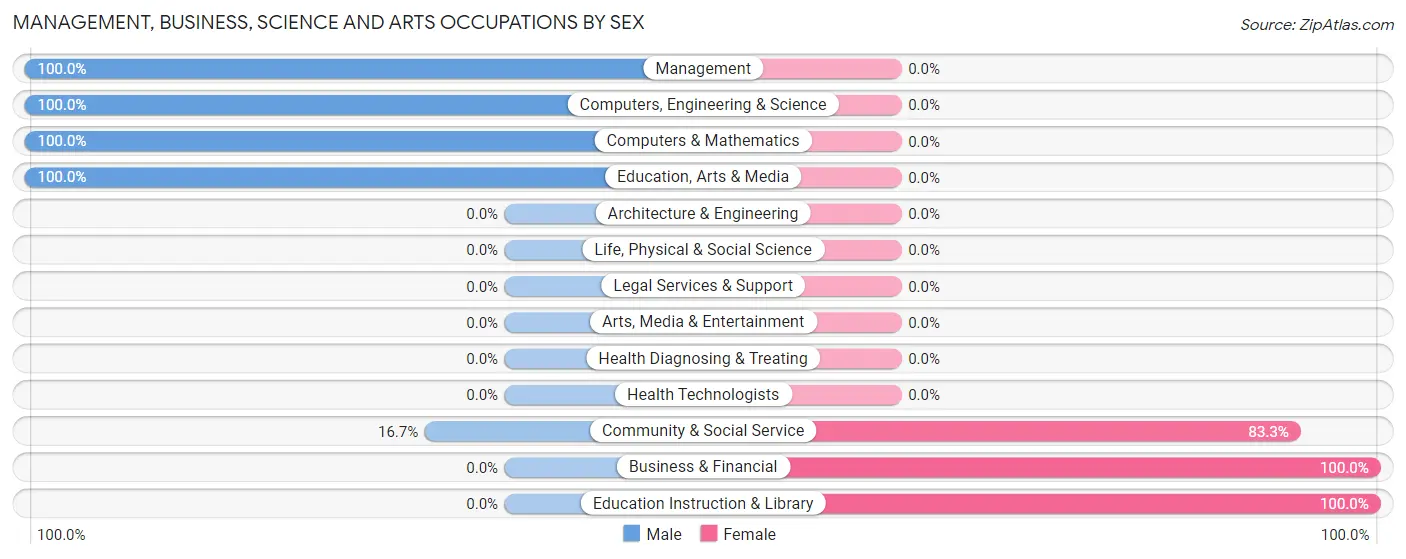
Within the Management, Business, Science and Arts occupations in Northport, the most male-oriented occupations are Management (100.0%), Computers, Engineering & Science (100.0%), and Computers & Mathematics (100.0%), while the most female-oriented occupations are Business & Financial (100.0%), Education Instruction & Library (100.0%), and Community & Social Service (83.3%).
| Occupation | Male | Female |
| Management | 5 (100.0%) | 0 (0.0%) |
| Business & Financial | 0 (0.0%) | 6 (100.0%) |
| Computers, Engineering & Science | 4 (100.0%) | 0 (0.0%) |
| Computers & Mathematics | 4 (100.0%) | 0 (0.0%) |
| Architecture & Engineering | 0 (0.0%) | 0 (0.0%) |
| Life, Physical & Social Science | 0 (0.0%) | 0 (0.0%) |
| Community & Social Service | 1 (16.7%) | 5 (83.3%) |
| Education, Arts & Media | 1 (100.0%) | 0 (0.0%) |
| Legal Services & Support | 0 (0.0%) | 0 (0.0%) |
| Education Instruction & Library | 0 (0.0%) | 5 (100.0%) |
| Arts, Media & Entertainment | 0 (0.0%) | 0 (0.0%) |
| Health Diagnosing & Treating | 0 (0.0%) | 0 (0.0%) |
| Health Technologists | 0 (0.0%) | 0 (0.0%) |
| Total (Category) | 10 (47.6%) | 11 (52.4%) |
| Total (Overall) | 50 (46.3%) | 58 (53.7%) |
Services Occupations
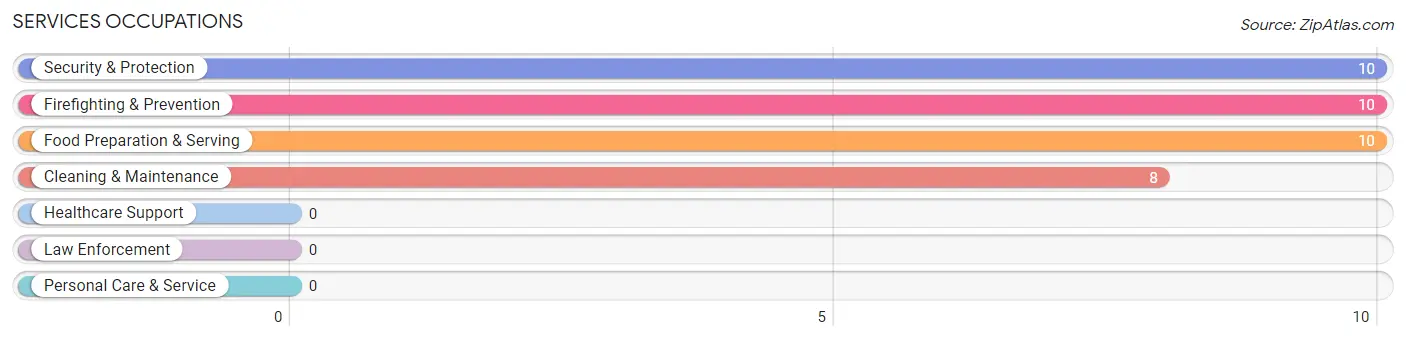
The most common Services occupations in Northport are Security & Protection (10 | 9.3%), Firefighting & Prevention (10 | 9.3%), Food Preparation & Serving (10 | 9.3%), and Cleaning & Maintenance (8 | 7.4%).
Services Occupations by Sex
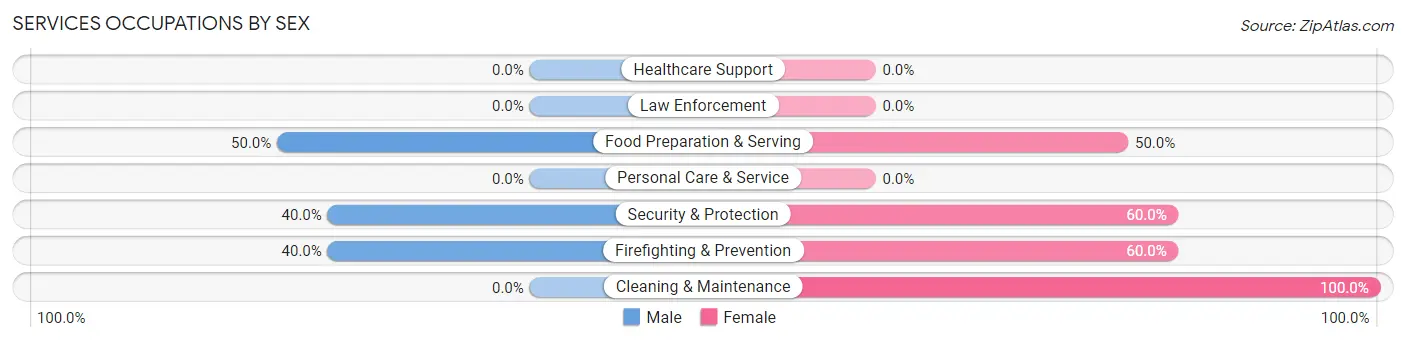
Within the Services occupations in Northport, the most male-oriented occupations are Food Preparation & Serving (50.0%), Security & Protection (40.0%), and Firefighting & Prevention (40.0%), while the most female-oriented occupations are Cleaning & Maintenance (100.0%), Security & Protection (60.0%), and Firefighting & Prevention (60.0%).
| Occupation | Male | Female |
| Healthcare Support | 0 (0.0%) | 0 (0.0%) |
| Security & Protection | 4 (40.0%) | 6 (60.0%) |
| Firefighting & Prevention | 4 (40.0%) | 6 (60.0%) |
| Law Enforcement | 0 (0.0%) | 0 (0.0%) |
| Food Preparation & Serving | 5 (50.0%) | 5 (50.0%) |
| Cleaning & Maintenance | 0 (0.0%) | 8 (100.0%) |
| Personal Care & Service | 0 (0.0%) | 0 (0.0%) |
| Total (Category) | 9 (32.1%) | 19 (67.9%) |
| Total (Overall) | 50 (46.3%) | 58 (53.7%) |
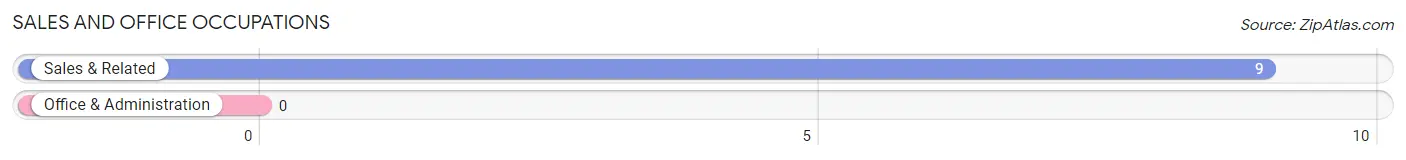
Sales and Office Occupations
The most common Sales and Office occupations in Northport are , and Sales & Related (9 | 8.3%).
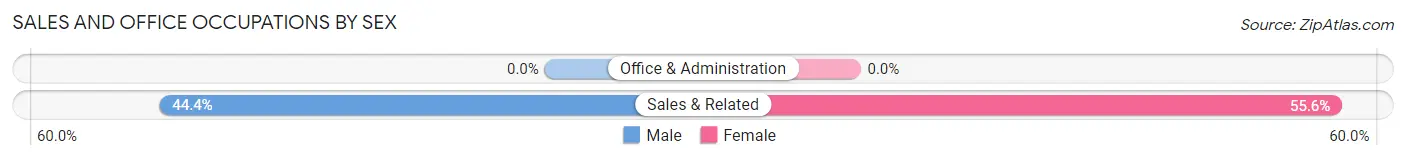
Sales and Office Occupations by Sex
| Occupation | Male | Female |
| Sales & Related | 4 (44.4%) | 5 (55.6%) |
| Office & Administration | 0 (0.0%) | 0 (0.0%) |
| Total (Category) | 4 (44.4%) | 5 (55.6%) |
| Total (Overall) | 50 (46.3%) | 58 (53.7%) |
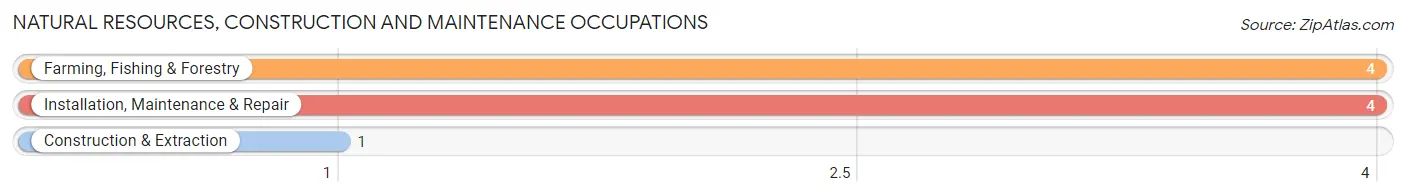
Natural Resources, Construction and Maintenance Occupations
The most common Natural Resources, Construction and Maintenance occupations in Northport are Farming, Fishing & Forestry (4 | 3.7%), Installation, Maintenance & Repair (4 | 3.7%), and Construction & Extraction (1 | 0.9%).
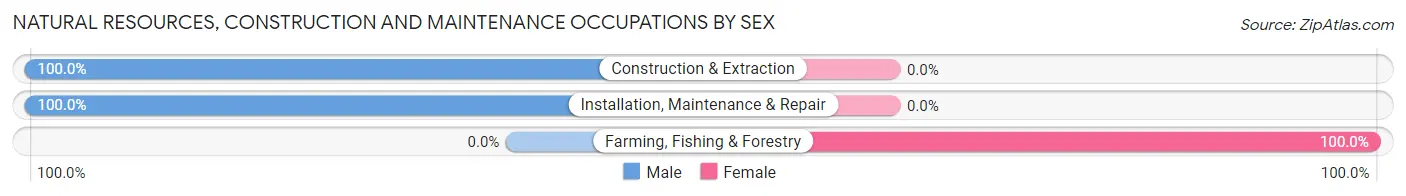
Natural Resources, Construction and Maintenance Occupations by Sex
| Occupation | Male | Female |
| Farming, Fishing & Forestry | 0 (0.0%) | 4 (100.0%) |
| Construction & Extraction | 1 (100.0%) | 0 (0.0%) |
| Installation, Maintenance & Repair | 4 (100.0%) | 0 (0.0%) |
| Total (Category) | 5 (55.6%) | 4 (44.4%) |
| Total (Overall) | 50 (46.3%) | 58 (53.7%) |
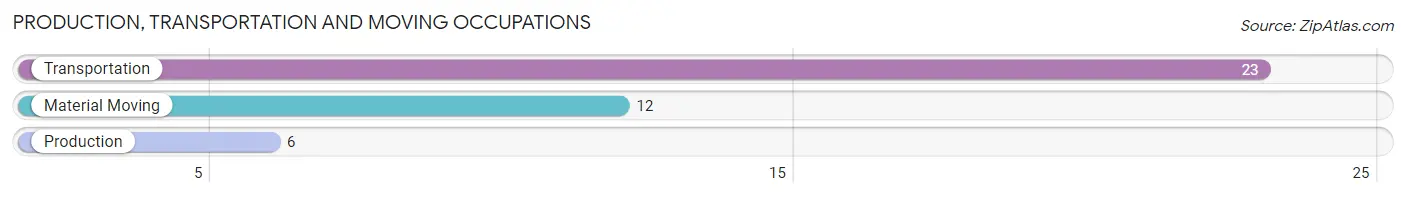
Production, Transportation and Moving Occupations
The most common Production, Transportation and Moving occupations in Northport are Transportation (23 | 21.3%), Material Moving (12 | 11.1%), and Production (6 | 5.6%).
Production, Transportation and Moving Occupations by Sex
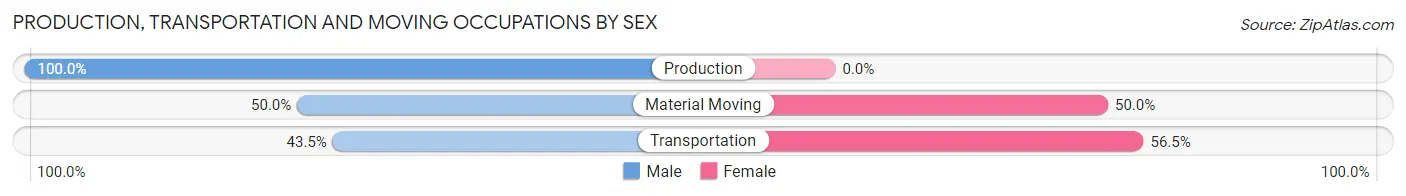
| Occupation | Male | Female |
| Production | 6 (100.0%) | 0 (0.0%) |
| Transportation | 10 (43.5%) | 13 (56.5%) |
| Material Moving | 6 (50.0%) | 6 (50.0%) |
| Total (Category) | 22 (53.7%) | 19 (46.3%) |
| Total (Overall) | 50 (46.3%) | 58 (53.7%) |
Employment Industries by Sex in Northport
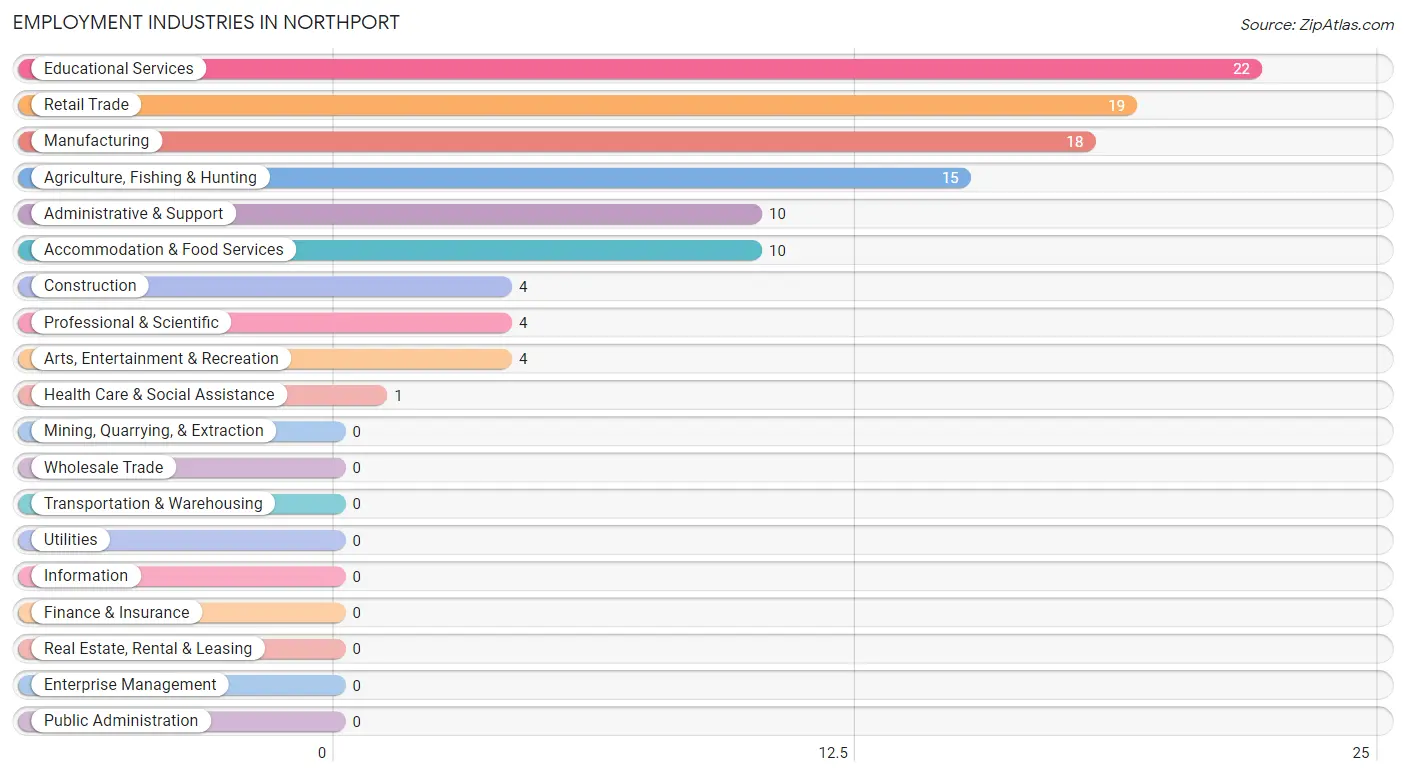
Employment Industries in Northport
The major employment industries in Northport include Educational Services (22 | 20.4%), Retail Trade (19 | 17.6%), Manufacturing (18 | 16.7%), Agriculture, Fishing & Hunting (15 | 13.9%), and Administrative & Support (10 | 9.3%).
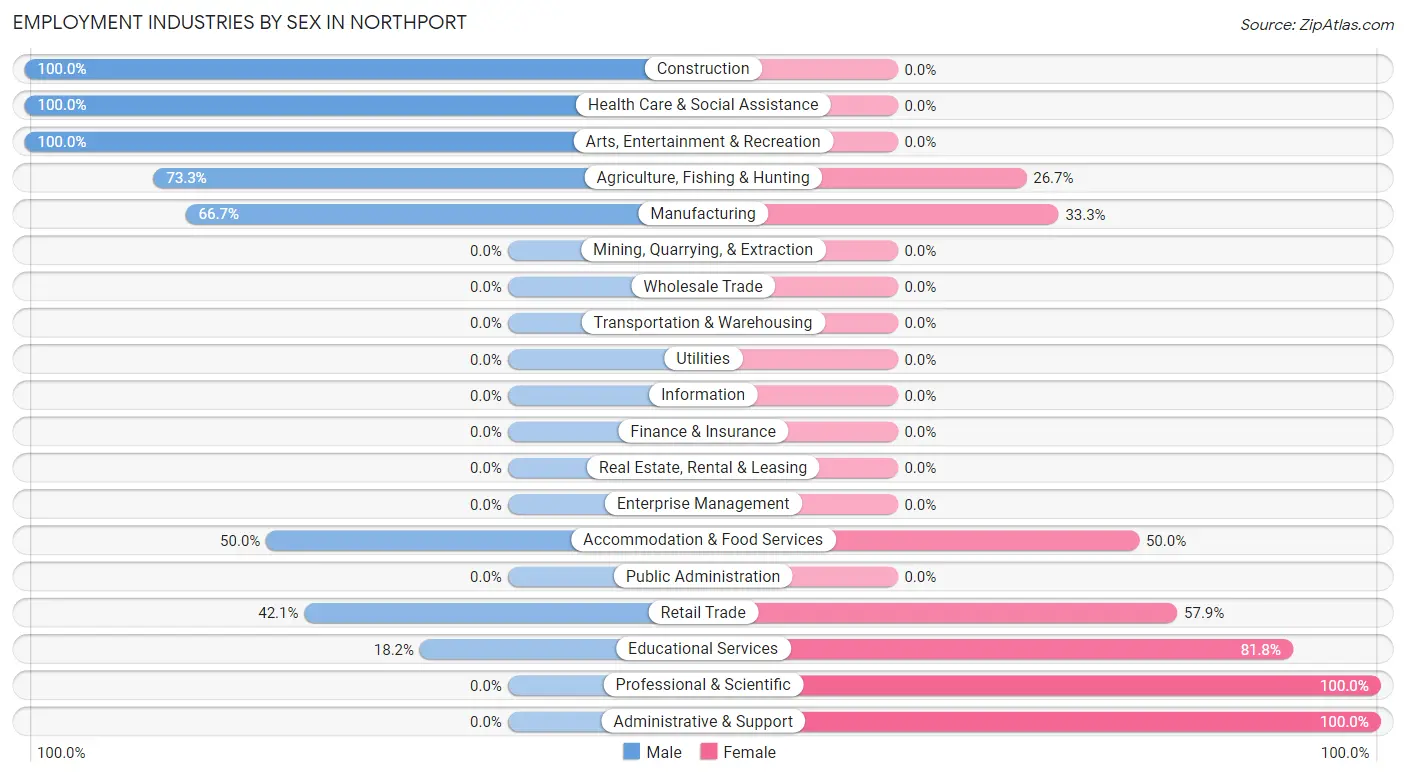
Employment Industries by Sex in Northport
The Northport industries that see more men than women are Construction (100.0%), Health Care & Social Assistance (100.0%), and Arts, Entertainment & Recreation (100.0%), whereas the industries that tend to have a higher number of women are Professional & Scientific (100.0%), Administrative & Support (100.0%), and Educational Services (81.8%).
| Industry | Male | Female |
| Agriculture, Fishing & Hunting | 11 (73.3%) | 4 (26.7%) |
| Mining, Quarrying, & Extraction | 0 (0.0%) | 0 (0.0%) |
| Construction | 4 (100.0%) | 0 (0.0%) |
| Manufacturing | 12 (66.7%) | 6 (33.3%) |
| Wholesale Trade | 0 (0.0%) | 0 (0.0%) |
| Retail Trade | 8 (42.1%) | 11 (57.9%) |
| Transportation & Warehousing | 0 (0.0%) | 0 (0.0%) |
| Utilities | 0 (0.0%) | 0 (0.0%) |
| Information | 0 (0.0%) | 0 (0.0%) |
| Finance & Insurance | 0 (0.0%) | 0 (0.0%) |
| Real Estate, Rental & Leasing | 0 (0.0%) | 0 (0.0%) |
| Professional & Scientific | 0 (0.0%) | 4 (100.0%) |
| Enterprise Management | 0 (0.0%) | 0 (0.0%) |
| Administrative & Support | 0 (0.0%) | 10 (100.0%) |
| Educational Services | 4 (18.2%) | 18 (81.8%) |
| Health Care & Social Assistance | 1 (100.0%) | 0 (0.0%) |
| Arts, Entertainment & Recreation | 4 (100.0%) | 0 (0.0%) |
| Accommodation & Food Services | 5 (50.0%) | 5 (50.0%) |
| Public Administration | 0 (0.0%) | 0 (0.0%) |
| Total | 50 (46.3%) | 58 (53.7%) |
Education in Northport
School Enrollment in Northport
The most common levels of schooling among the 30 students in Northport are elementary school (8 | 26.7%), middle school (8 | 26.7%), and kindergarten (6 | 20.0%).
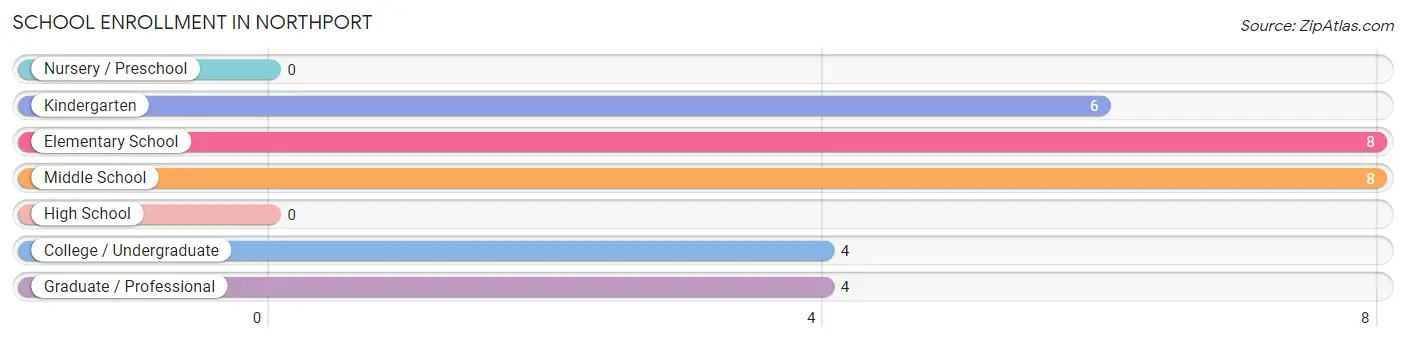
| School Level | # Students | % Students |
| Nursery / Preschool | 0 | 0.0% |
| Kindergarten | 6 | 20.0% |
| Elementary School | 8 | 26.7% |
| Middle School | 8 | 26.7% |
| High School | 0 | 0.0% |
| College / Undergraduate | 4 | 13.3% |
| Graduate / Professional | 4 | 13.3% |
| Total | 30 | 100.0% |
School Enrollment by Age by Funding Source in Northport
Out of a total of 30 students who are enrolled in schools in Northport, 7 (23.3%) attend a private institution, while the remaining 23 (76.7%) are enrolled in public schools. The age group of 25 to 34 year olds has the highest likelihood of being enrolled in private schools, with 6 (75.0% in the age bracket) enrolled. Conversely, the age group of 5 to 9 year old has the lowest likelihood of being enrolled in a private school, with 14 (100.0% in the age bracket) attending a public institution.
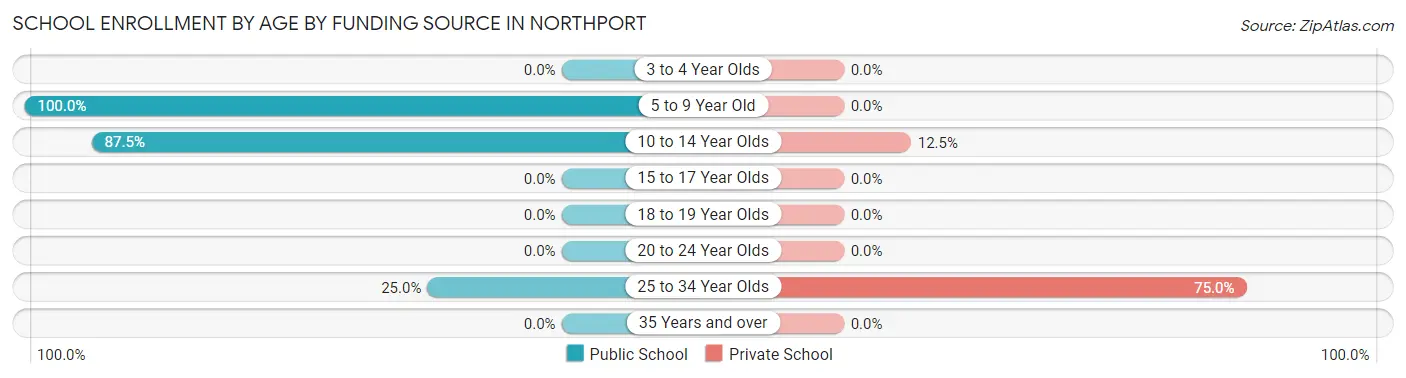
| Age Bracket | Public School | Private School |
| 3 to 4 Year Olds | 0 (0.0%) | 0 (0.0%) |
| 5 to 9 Year Old | 14 (100.0%) | 0 (0.0%) |
| 10 to 14 Year Olds | 7 (87.5%) | 1 (12.5%) |
| 15 to 17 Year Olds | 0 (0.0%) | 0 (0.0%) |
| 18 to 19 Year Olds | 0 (0.0%) | 0 (0.0%) |
| 20 to 24 Year Olds | 0 (0.0%) | 0 (0.0%) |
| 25 to 34 Year Olds | 2 (25.0%) | 6 (75.0%) |
| 35 Years and over | 0 (0.0%) | 0 (0.0%) |
| Total | 23 (76.7%) | 7 (23.3%) |
Educational Attainment by Field of Study in Northport
Business (17 | 32.1%), computers & mathematics (13 | 24.5%), liberal arts & history (6 | 11.3%), social sciences (5 | 9.4%), and education (5 | 9.4%) are the most common fields of study among 53 individuals in Northport who have obtained a bachelor's degree or higher.
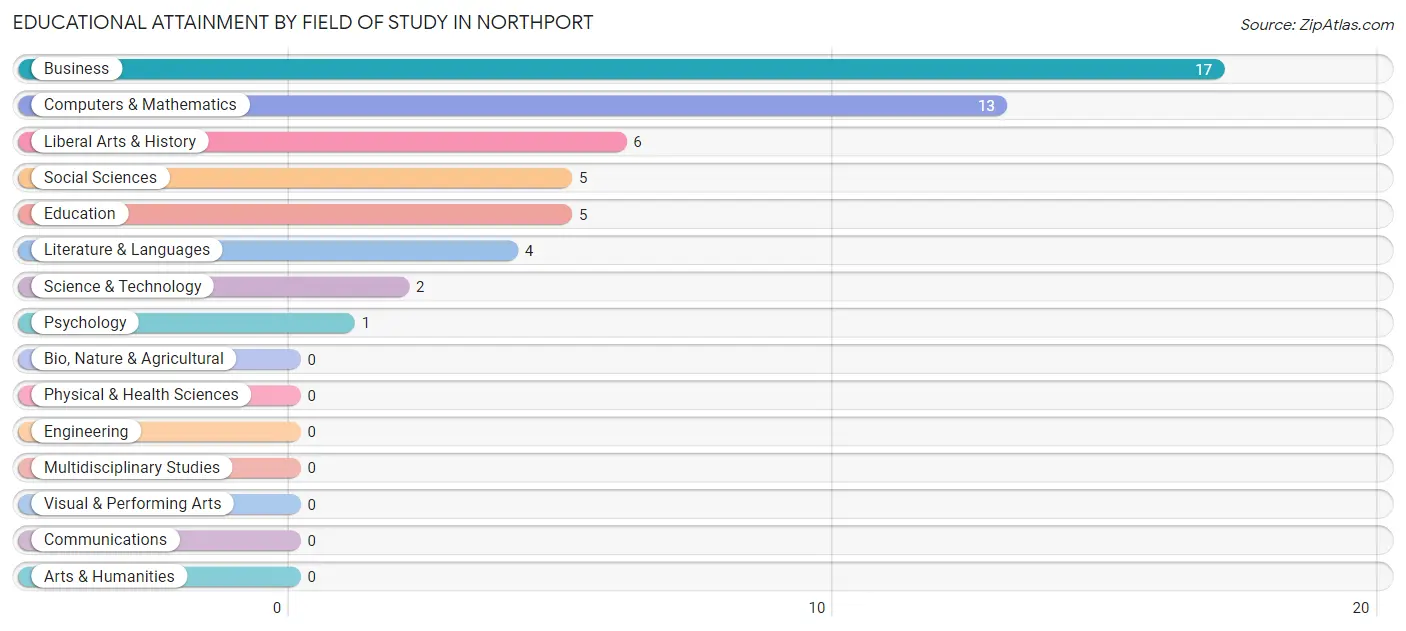
| Field of Study | # Graduates | % Graduates |
| Computers & Mathematics | 13 | 24.5% |
| Bio, Nature & Agricultural | 0 | 0.0% |
| Physical & Health Sciences | 0 | 0.0% |
| Psychology | 1 | 1.9% |
| Social Sciences | 5 | 9.4% |
| Engineering | 0 | 0.0% |
| Multidisciplinary Studies | 0 | 0.0% |
| Science & Technology | 2 | 3.8% |
| Business | 17 | 32.1% |
| Education | 5 | 9.4% |
| Literature & Languages | 4 | 7.5% |
| Liberal Arts & History | 6 | 11.3% |
| Visual & Performing Arts | 0 | 0.0% |
| Communications | 0 | 0.0% |
| Arts & Humanities | 0 | 0.0% |
| Total | 53 | 100.0% |
Transportation & Commute in Northport
Vehicle Availability by Sex in Northport
The most prevalent vehicle ownership categories in Northport are males with 2 vehicles (20, accounting for 41.7%) and females with 2 vehicles (32, making up 34.5%).
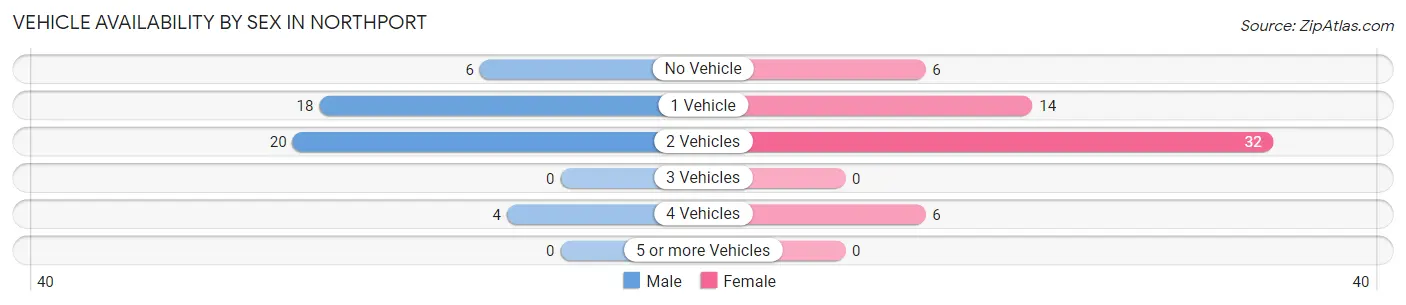
| Vehicles Available | Male | Female |
| No Vehicle | 6 (12.5%) | 6 (10.3%) |
| 1 Vehicle | 18 (37.5%) | 14 (24.1%) |
| 2 Vehicles | 20 (41.7%) | 32 (55.2%) |
| 3 Vehicles | 0 (0.0%) | 0 (0.0%) |
| 4 Vehicles | 4 (8.3%) | 6 (10.3%) |
| 5 or more Vehicles | 0 (0.0%) | 0 (0.0%) |
| Total | 48 (100.0%) | 58 (100.0%) |
Commute Time in Northport
The most frequently occuring commute durations in Northport are 45 to 59 minutes (25 commuters, 23.2%), 10 to 14 minutes (14 commuters, 13.0%), and 30 to 34 minutes (14 commuters, 13.0%).
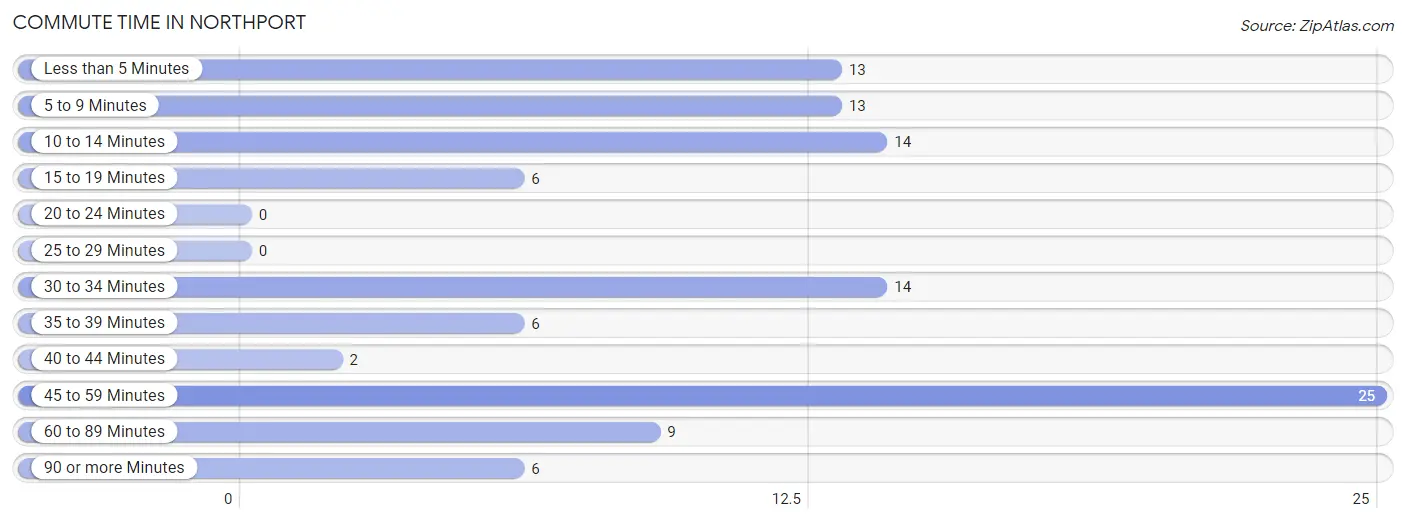
| Commute Time | # Commuters | % Commuters |
| Less than 5 Minutes | 13 | 12.0% |
| 5 to 9 Minutes | 13 | 12.0% |
| 10 to 14 Minutes | 14 | 13.0% |
| 15 to 19 Minutes | 6 | 5.6% |
| 20 to 24 Minutes | 0 | 0.0% |
| 25 to 29 Minutes | 0 | 0.0% |
| 30 to 34 Minutes | 14 | 13.0% |
| 35 to 39 Minutes | 6 | 5.6% |
| 40 to 44 Minutes | 2 | 1.8% |
| 45 to 59 Minutes | 25 | 23.2% |
| 60 to 89 Minutes | 9 | 8.3% |
| 90 or more Minutes | 6 | 5.6% |
Commute Time by Sex in Northport
The most common commute times in Northport are 45 to 59 minutes (19 commuters, 38.0%) for males and less than 5 minutes (13 commuters, 22.4%) for females.
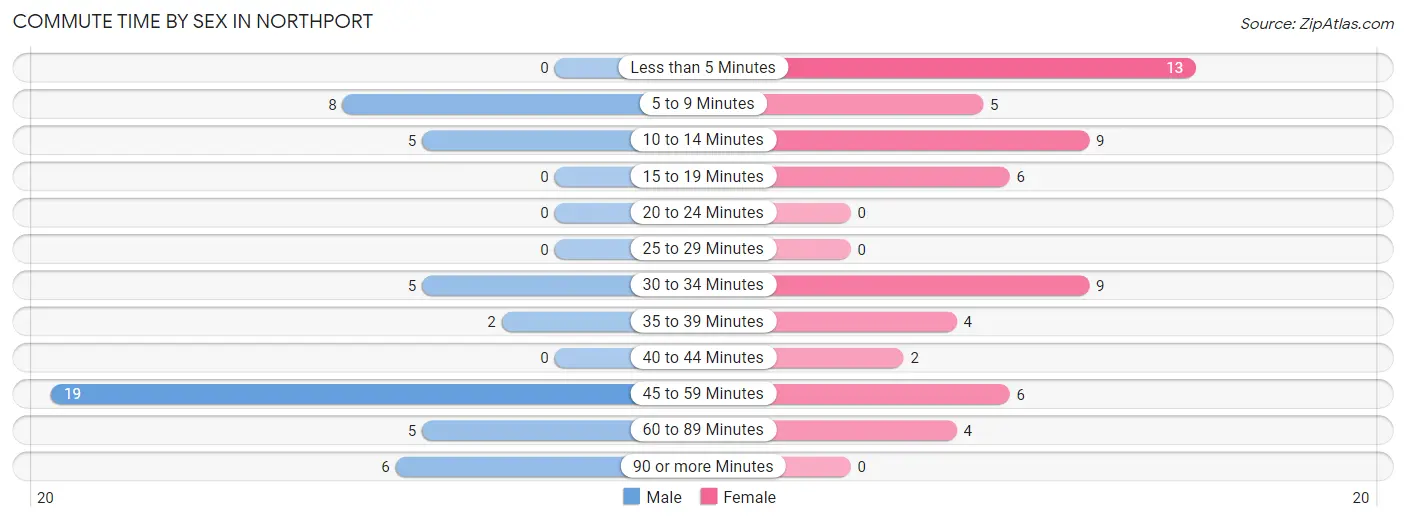
| Commute Time | Male | Female |
| Less than 5 Minutes | 0 (0.0%) | 13 (22.4%) |
| 5 to 9 Minutes | 8 (16.0%) | 5 (8.6%) |
| 10 to 14 Minutes | 5 (10.0%) | 9 (15.5%) |
| 15 to 19 Minutes | 0 (0.0%) | 6 (10.3%) |
| 20 to 24 Minutes | 0 (0.0%) | 0 (0.0%) |
| 25 to 29 Minutes | 0 (0.0%) | 0 (0.0%) |
| 30 to 34 Minutes | 5 (10.0%) | 9 (15.5%) |
| 35 to 39 Minutes | 2 (4.0%) | 4 (6.9%) |
| 40 to 44 Minutes | 0 (0.0%) | 2 (3.5%) |
| 45 to 59 Minutes | 19 (38.0%) | 6 (10.3%) |
| 60 to 89 Minutes | 5 (10.0%) | 4 (6.9%) |
| 90 or more Minutes | 6 (12.0%) | 0 (0.0%) |
Time of Departure to Work by Sex in Northport
The most frequent times of departure to work in Northport are 12:00 AM to 4:59 AM (12, 24.0%) for males and 6:00 AM to 6:29 AM (17, 29.3%) for females.
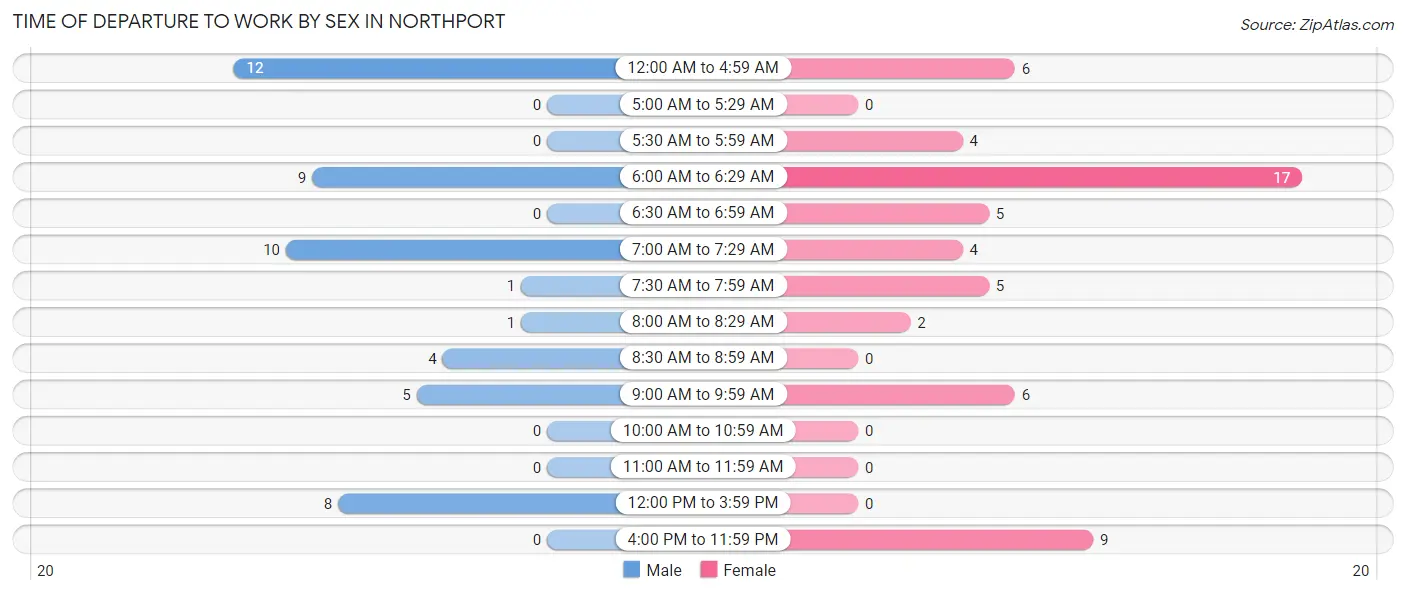
| Time of Departure | Male | Female |
| 12:00 AM to 4:59 AM | 12 (24.0%) | 6 (10.3%) |
| 5:00 AM to 5:29 AM | 0 (0.0%) | 0 (0.0%) |
| 5:30 AM to 5:59 AM | 0 (0.0%) | 4 (6.9%) |
| 6:00 AM to 6:29 AM | 9 (18.0%) | 17 (29.3%) |
| 6:30 AM to 6:59 AM | 0 (0.0%) | 5 (8.6%) |
| 7:00 AM to 7:29 AM | 10 (20.0%) | 4 (6.9%) |
| 7:30 AM to 7:59 AM | 1 (2.0%) | 5 (8.6%) |
| 8:00 AM to 8:29 AM | 1 (2.0%) | 2 (3.5%) |
| 8:30 AM to 8:59 AM | 4 (8.0%) | 0 (0.0%) |
| 9:00 AM to 9:59 AM | 5 (10.0%) | 6 (10.3%) |
| 10:00 AM to 10:59 AM | 0 (0.0%) | 0 (0.0%) |
| 11:00 AM to 11:59 AM | 0 (0.0%) | 0 (0.0%) |
| 12:00 PM to 3:59 PM | 8 (16.0%) | 0 (0.0%) |
| 4:00 PM to 11:59 PM | 0 (0.0%) | 9 (15.5%) |
| Total | 50 (100.0%) | 58 (100.0%) |
Housing Occupancy in Northport
Occupancy by Ownership in Northport
Of the total 143 dwellings in Northport, owner-occupied units account for 78 (54.5%), while renter-occupied units make up 65 (45.5%).
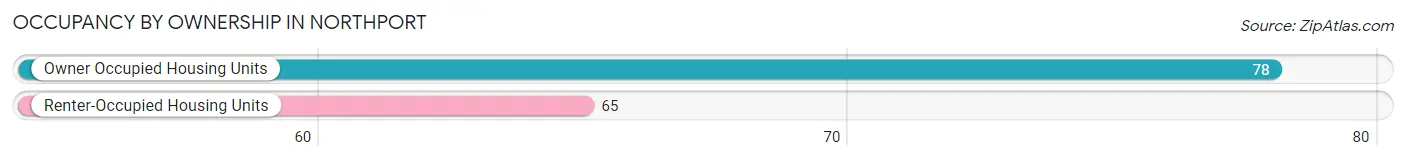
| Occupancy | # Housing Units | % Housing Units |
| Owner Occupied Housing Units | 78 | 54.5% |
| Renter-Occupied Housing Units | 65 | 45.5% |
| Total Occupied Housing Units | 143 | 100.0% |
Occupancy by Household Size in Northport
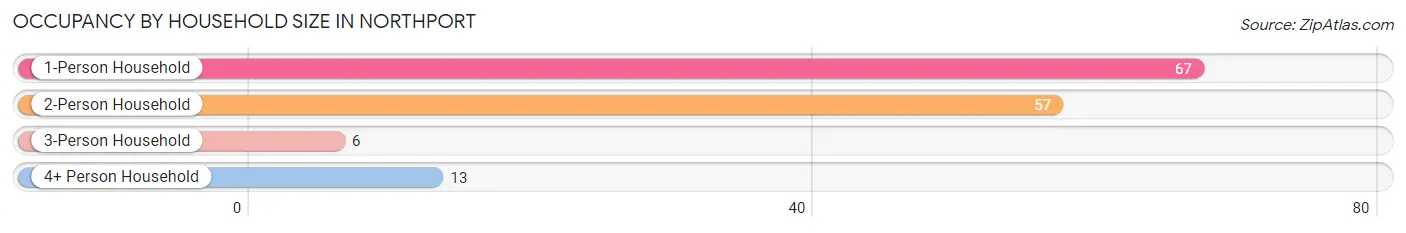
| Household Size | # Housing Units | % Housing Units |
| 1-Person Household | 67 | 46.9% |
| 2-Person Household | 57 | 39.9% |
| 3-Person Household | 6 | 4.2% |
| 4+ Person Household | 13 | 9.1% |
| Total Housing Units | 143 | 100.0% |
Occupancy by Ownership by Household Size in Northport
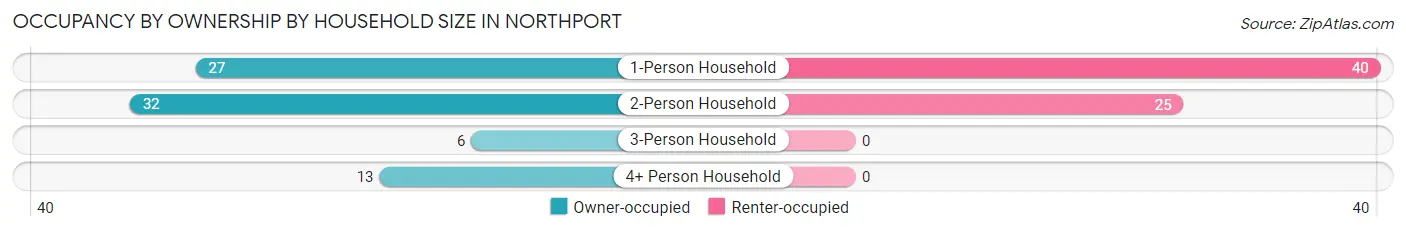
| Household Size | Owner-occupied | Renter-occupied |
| 1-Person Household | 27 (40.3%) | 40 (59.7%) |
| 2-Person Household | 32 (56.1%) | 25 (43.9%) |
| 3-Person Household | 6 (100.0%) | 0 (0.0%) |
| 4+ Person Household | 13 (100.0%) | 0 (0.0%) |
| Total Housing Units | 78 (54.5%) | 65 (45.5%) |
Occupancy by Educational Attainment in Northport
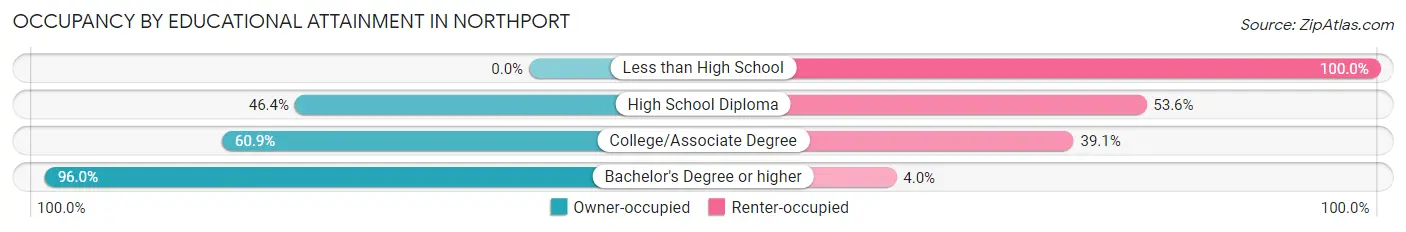
| Household Size | Owner-occupied | Renter-occupied |
| Less than High School | 0 (0.0%) | 16 (100.0%) |
| High School Diploma | 26 (46.4%) | 30 (53.6%) |
| College/Associate Degree | 28 (60.9%) | 18 (39.1%) |
| Bachelor's Degree or higher | 24 (96.0%) | 1 (4.0%) |
Occupancy by Age of Householder in Northport
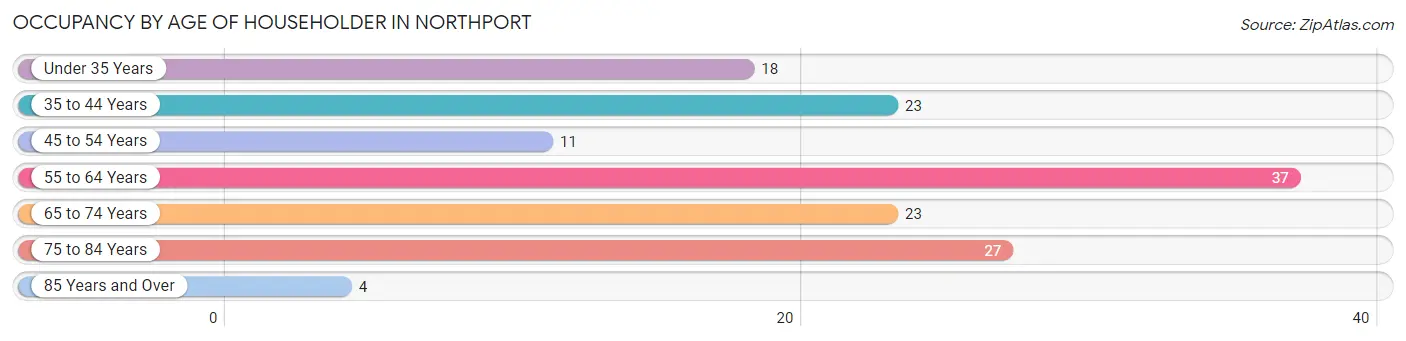
| Age Bracket | # Households | % Households |
| Under 35 Years | 18 | 12.6% |
| 35 to 44 Years | 23 | 16.1% |
| 45 to 54 Years | 11 | 7.7% |
| 55 to 64 Years | 37 | 25.9% |
| 65 to 74 Years | 23 | 16.1% |
| 75 to 84 Years | 27 | 18.9% |
| 85 Years and Over | 4 | 2.8% |
| Total | 143 | 100.0% |
Housing Finances in Northport
Median Income by Occupancy in Northport
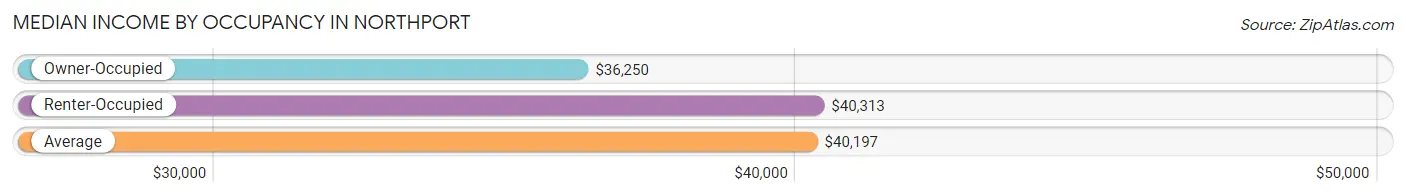
| Occupancy Type | # Households | Median Income |
| Owner-Occupied | 78 (54.5%) | $36,250 |
| Renter-Occupied | 65 (45.5%) | $40,313 |
| Average | 143 (100.0%) | $40,197 |
Occupancy by Householder Income Bracket in Northport
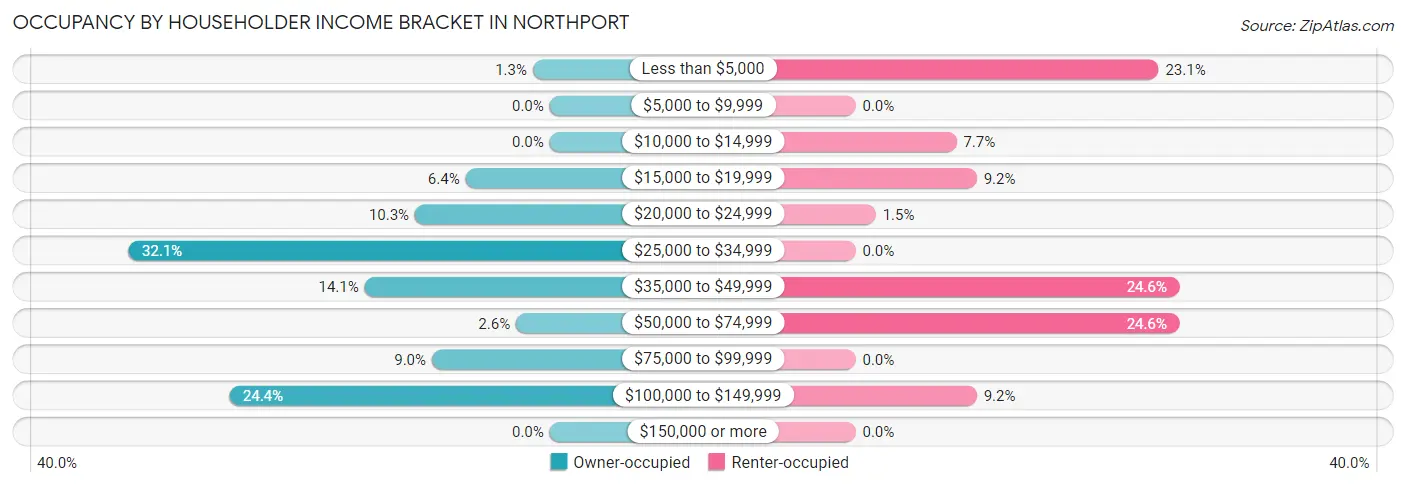
| Income Bracket | Owner-occupied | Renter-occupied |
| Less than $5,000 | 1 (1.3%) | 15 (23.1%) |
| $5,000 to $9,999 | 0 (0.0%) | 0 (0.0%) |
| $10,000 to $14,999 | 0 (0.0%) | 5 (7.7%) |
| $15,000 to $19,999 | 5 (6.4%) | 6 (9.2%) |
| $20,000 to $24,999 | 8 (10.3%) | 1 (1.5%) |
| $25,000 to $34,999 | 25 (32.1%) | 0 (0.0%) |
| $35,000 to $49,999 | 11 (14.1%) | 16 (24.6%) |
| $50,000 to $74,999 | 2 (2.6%) | 16 (24.6%) |
| $75,000 to $99,999 | 7 (9.0%) | 0 (0.0%) |
| $100,000 to $149,999 | 19 (24.4%) | 6 (9.2%) |
| $150,000 or more | 0 (0.0%) | 0 (0.0%) |
| Total | 78 (100.0%) | 65 (100.0%) |
Monthly Housing Cost Tiers in Northport
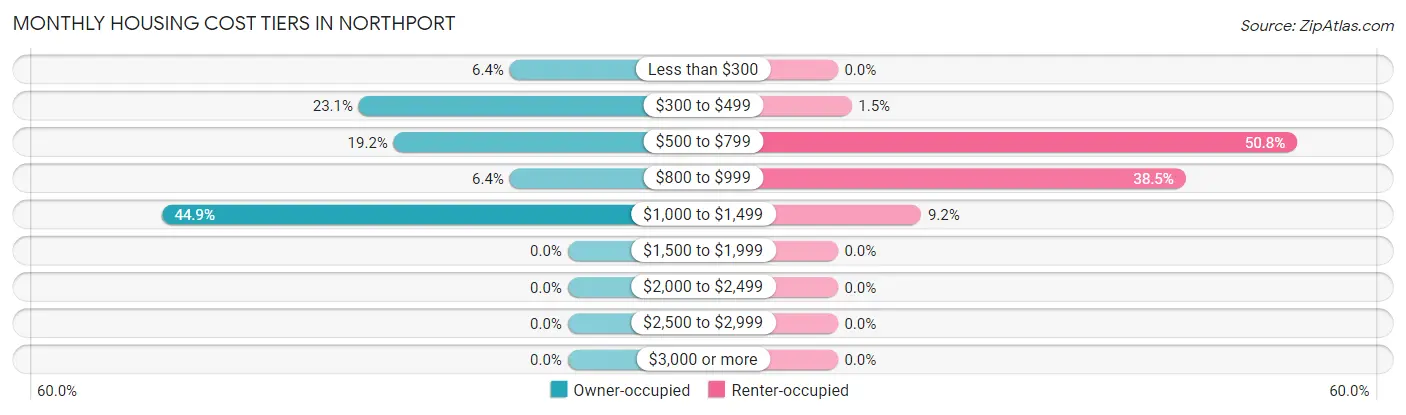
| Monthly Cost | Owner-occupied | Renter-occupied |
| Less than $300 | 5 (6.4%) | 0 (0.0%) |
| $300 to $499 | 18 (23.1%) | 1 (1.5%) |
| $500 to $799 | 15 (19.2%) | 33 (50.8%) |
| $800 to $999 | 5 (6.4%) | 25 (38.5%) |
| $1,000 to $1,499 | 35 (44.9%) | 6 (9.2%) |
| $1,500 to $1,999 | 0 (0.0%) | 0 (0.0%) |
| $2,000 to $2,499 | 0 (0.0%) | 0 (0.0%) |
| $2,500 to $2,999 | 0 (0.0%) | 0 (0.0%) |
| $3,000 or more | 0 (0.0%) | 0 (0.0%) |
| Total | 78 (100.0%) | 65 (100.0%) |
Physical Housing Characteristics in Northport
Housing Structures in Northport
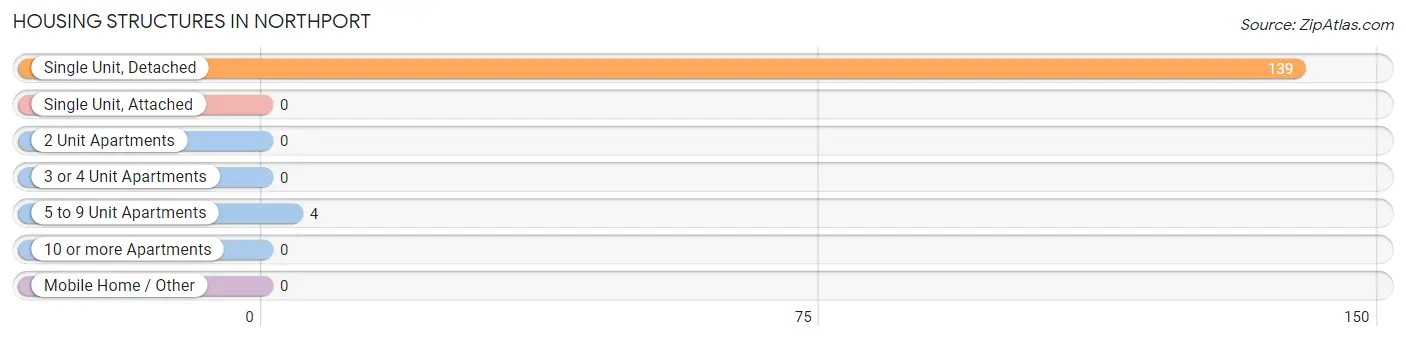
| Structure Type | # Housing Units | % Housing Units |
| Single Unit, Detached | 139 | 97.2% |
| Single Unit, Attached | 0 | 0.0% |
| 2 Unit Apartments | 0 | 0.0% |
| 3 or 4 Unit Apartments | 0 | 0.0% |
| 5 to 9 Unit Apartments | 4 | 2.8% |
| 10 or more Apartments | 0 | 0.0% |
| Mobile Home / Other | 0 | 0.0% |
| Total | 143 | 100.0% |
Housing Structures by Occupancy in Northport
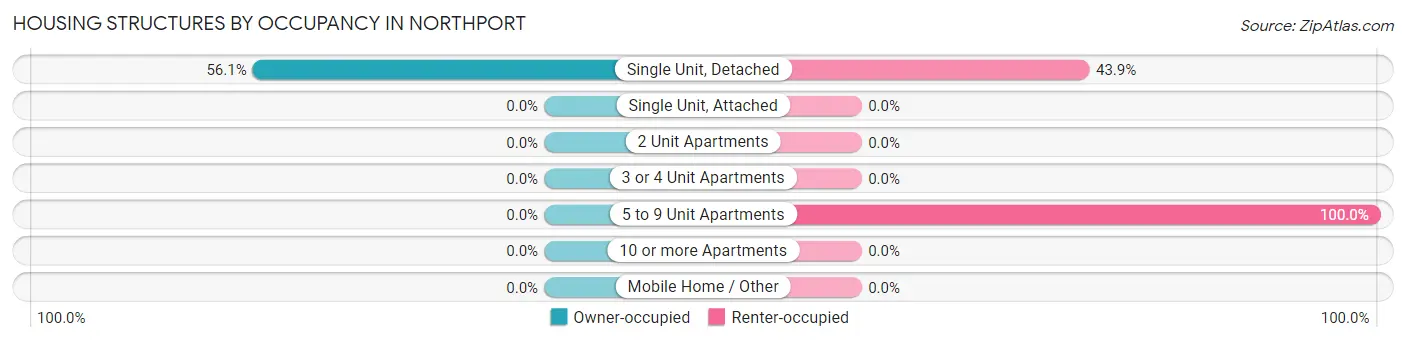
| Structure Type | Owner-occupied | Renter-occupied |
| Single Unit, Detached | 78 (56.1%) | 61 (43.9%) |
| Single Unit, Attached | 0 (0.0%) | 0 (0.0%) |
| 2 Unit Apartments | 0 (0.0%) | 0 (0.0%) |
| 3 or 4 Unit Apartments | 0 (0.0%) | 0 (0.0%) |
| 5 to 9 Unit Apartments | 0 (0.0%) | 4 (100.0%) |
| 10 or more Apartments | 0 (0.0%) | 0 (0.0%) |
| Mobile Home / Other | 0 (0.0%) | 0 (0.0%) |
| Total | 78 (54.5%) | 65 (45.5%) |
Housing Structures by Number of Rooms in Northport
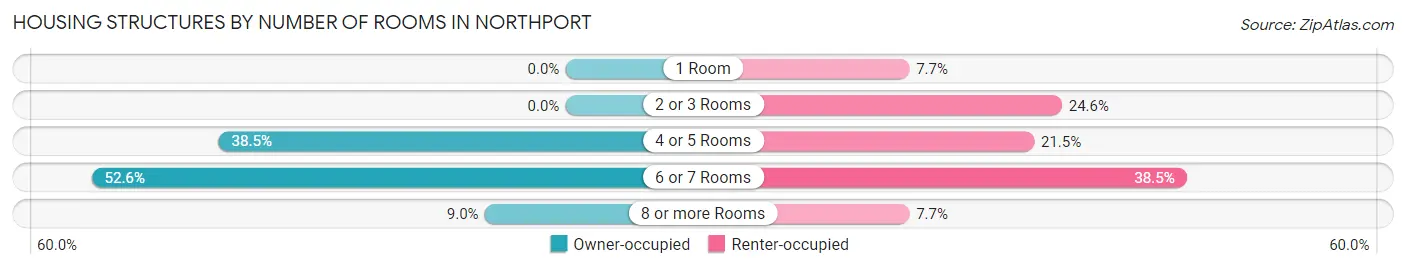
| Number of Rooms | Owner-occupied | Renter-occupied |
| 1 Room | 0 (0.0%) | 5 (7.7%) |
| 2 or 3 Rooms | 0 (0.0%) | 16 (24.6%) |
| 4 or 5 Rooms | 30 (38.5%) | 14 (21.5%) |
| 6 or 7 Rooms | 41 (52.6%) | 25 (38.5%) |
| 8 or more Rooms | 7 (9.0%) | 5 (7.7%) |
| Total | 78 (100.0%) | 65 (100.0%) |
Housing Structure by Heating Type in Northport
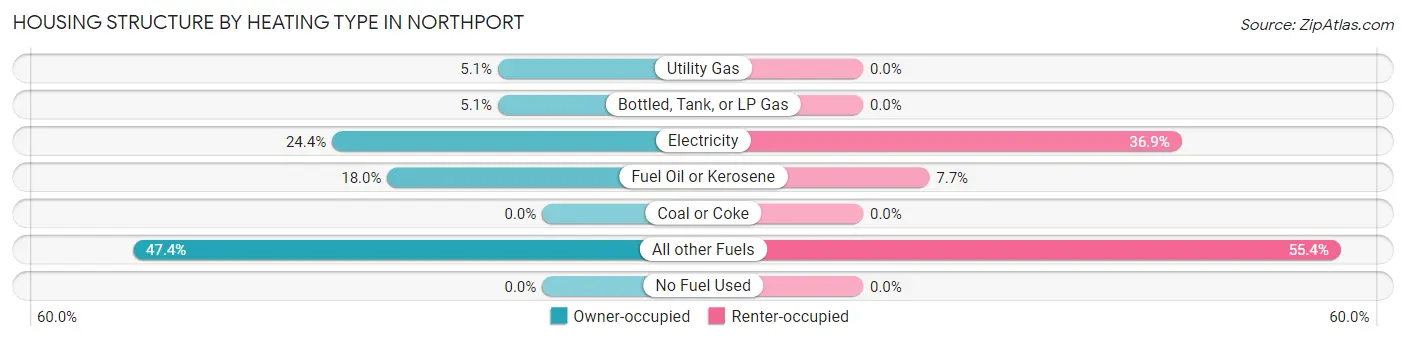
| Heating Type | Owner-occupied | Renter-occupied |
| Utility Gas | 4 (5.1%) | 0 (0.0%) |
| Bottled, Tank, or LP Gas | 4 (5.1%) | 0 (0.0%) |
| Electricity | 19 (24.4%) | 24 (36.9%) |
| Fuel Oil or Kerosene | 14 (17.9%) | 5 (7.7%) |
| Coal or Coke | 0 (0.0%) | 0 (0.0%) |
| All other Fuels | 37 (47.4%) | 36 (55.4%) |
| No Fuel Used | 0 (0.0%) | 0 (0.0%) |
| Total | 78 (100.0%) | 65 (100.0%) |
Household Vehicle Usage in Northport
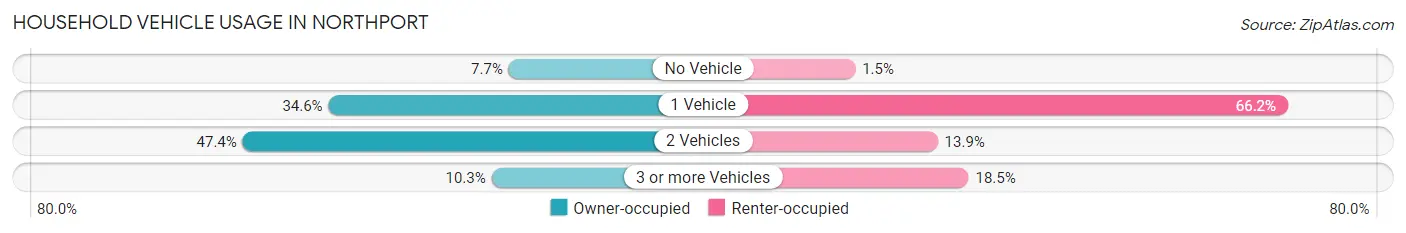
| Vehicles per Household | Owner-occupied | Renter-occupied |
| No Vehicle | 6 (7.7%) | 1 (1.5%) |
| 1 Vehicle | 27 (34.6%) | 43 (66.1%) |
| 2 Vehicles | 37 (47.4%) | 9 (13.9%) |
| 3 or more Vehicles | 8 (10.3%) | 12 (18.5%) |
| Total | 78 (100.0%) | 65 (100.0%) |
Real Estate & Mortgages in Northport
Real Estate and Mortgage Overview in Northport
| Characteristic | Without Mortgage | With Mortgage |
| Housing Units | 18 | 60 |
| Median Property Value | $191,700 | $132,700 |
| Median Household Income | $70,000 | $0 |
| Monthly Housing Costs | $375 | $0 |
| Real Estate Taxes | $1,179 | $0 |
Property Value by Mortgage Status in Northport
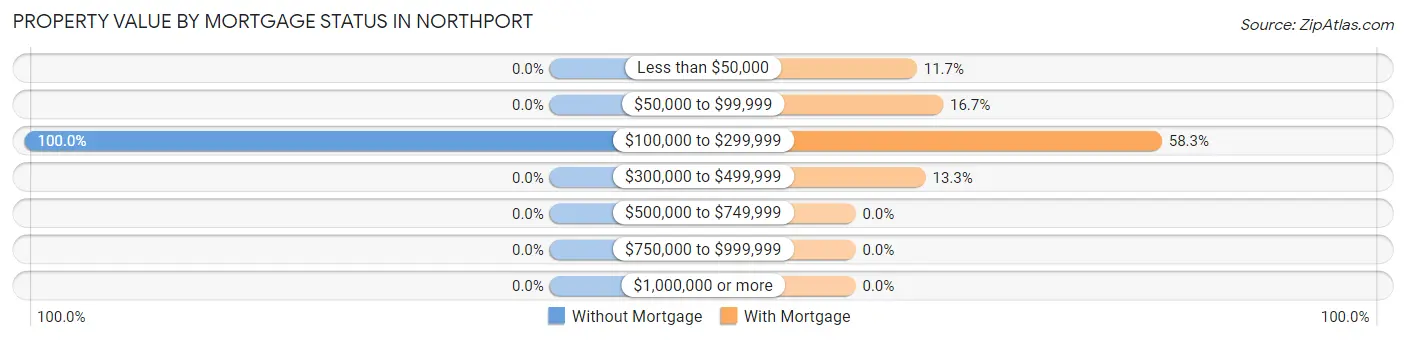
| Property Value | Without Mortgage | With Mortgage |
| Less than $50,000 | 0 (0.0%) | 7 (11.7%) |
| $50,000 to $99,999 | 0 (0.0%) | 10 (16.7%) |
| $100,000 to $299,999 | 18 (100.0%) | 35 (58.3%) |
| $300,000 to $499,999 | 0 (0.0%) | 8 (13.3%) |
| $500,000 to $749,999 | 0 (0.0%) | 0 (0.0%) |
| $750,000 to $999,999 | 0 (0.0%) | 0 (0.0%) |
| $1,000,000 or more | 0 (0.0%) | 0 (0.0%) |
| Total | 18 (100.0%) | 60 (100.0%) |
Household Income by Mortgage Status in Northport
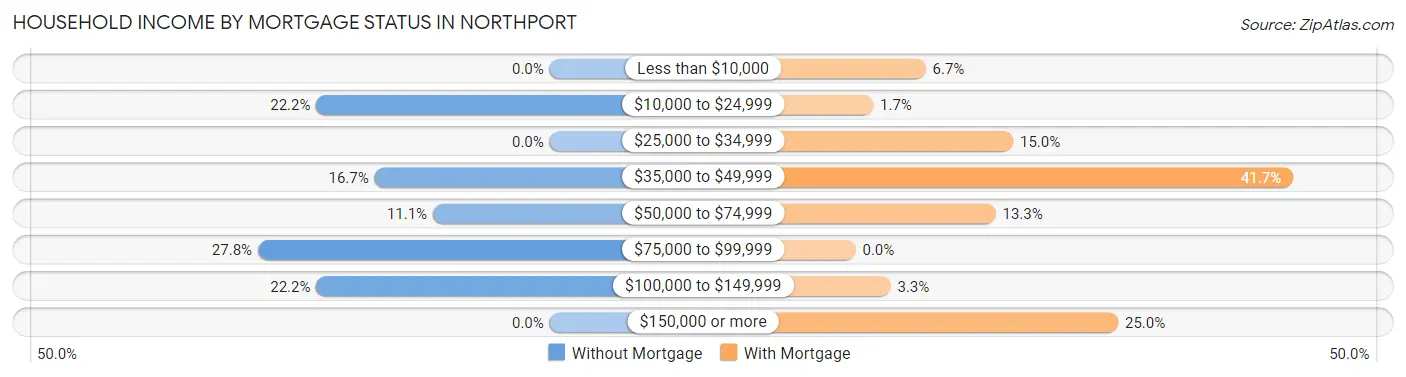
| Household Income | Without Mortgage | With Mortgage |
| Less than $10,000 | 0 (0.0%) | 4 (6.7%) |
| $10,000 to $24,999 | 4 (22.2%) | 1 (1.7%) |
| $25,000 to $34,999 | 0 (0.0%) | 9 (15.0%) |
| $35,000 to $49,999 | 3 (16.7%) | 25 (41.7%) |
| $50,000 to $74,999 | 2 (11.1%) | 8 (13.3%) |
| $75,000 to $99,999 | 5 (27.8%) | 0 (0.0%) |
| $100,000 to $149,999 | 4 (22.2%) | 2 (3.3%) |
| $150,000 or more | 0 (0.0%) | 15 (25.0%) |
| Total | 18 (100.0%) | 60 (100.0%) |
Property Value to Household Income Ratio in Northport
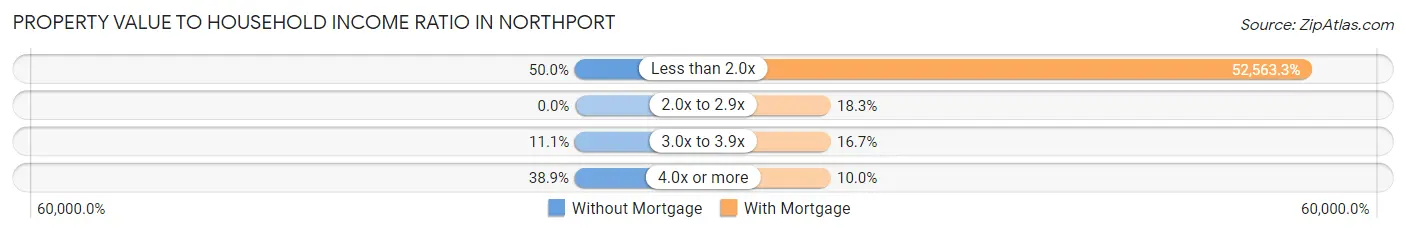
| Value-to-Income Ratio | Without Mortgage | With Mortgage |
| Less than 2.0x | 9 (50.0%) | 31,538 (52,563.3%) |
| 2.0x to 2.9x | 0 (0.0%) | 11 (18.3%) |
| 3.0x to 3.9x | 2 (11.1%) | 10 (16.7%) |
| 4.0x or more | 7 (38.9%) | 6 (10.0%) |
| Total | 18 (100.0%) | 60 (100.0%) |
Real Estate Taxes by Mortgage Status in Northport
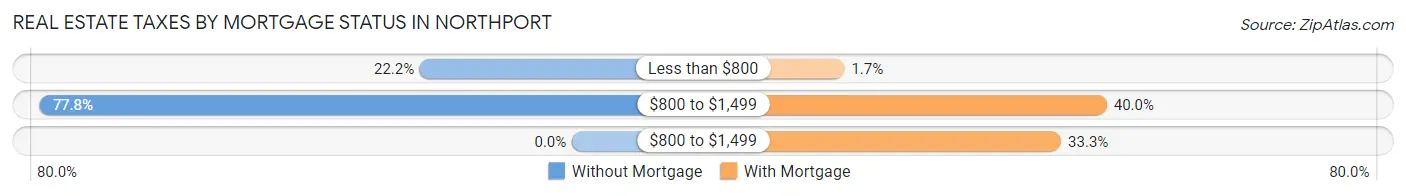
| Property Taxes | Without Mortgage | With Mortgage |
| Less than $800 | 4 (22.2%) | 1 (1.7%) |
| $800 to $1,499 | 14 (77.8%) | 24 (40.0%) |
| $800 to $1,499 | 0 (0.0%) | 20 (33.3%) |
| Total | 18 (100.0%) | 60 (100.0%) |
Health & Disability in Northport
Health Insurance Coverage by Age in Northport
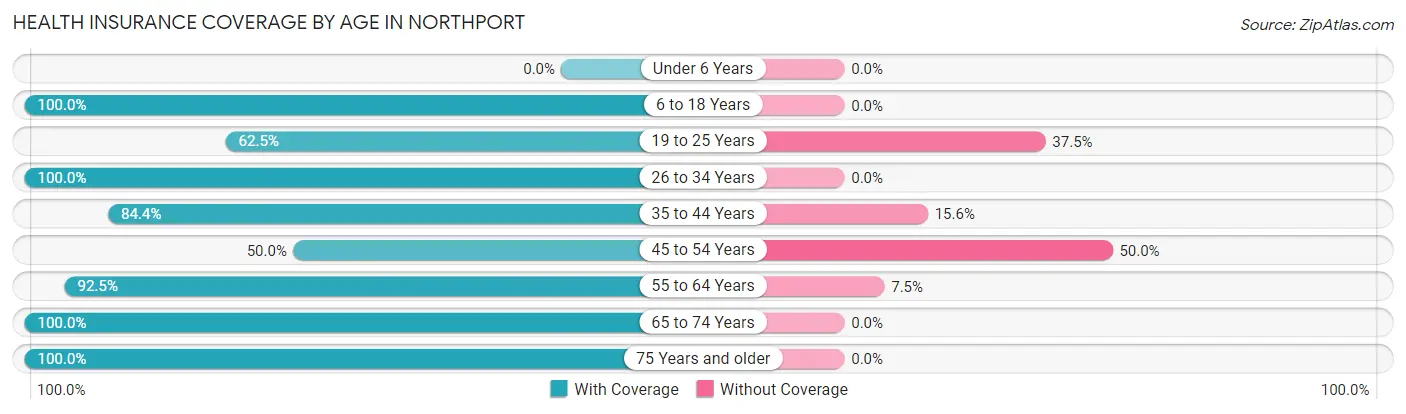
| Age Bracket | With Coverage | Without Coverage |
| Under 6 Years | 0 (0.0%) | 0 (0.0%) |
| 6 to 18 Years | 22 (100.0%) | 0 (0.0%) |
| 19 to 25 Years | 10 (62.5%) | 6 (37.5%) |
| 26 to 34 Years | 12 (100.0%) | 0 (0.0%) |
| 35 to 44 Years | 38 (84.4%) | 7 (15.6%) |
| 45 to 54 Years | 7 (50.0%) | 7 (50.0%) |
| 55 to 64 Years | 62 (92.5%) | 5 (7.5%) |
| 65 to 74 Years | 28 (100.0%) | 0 (0.0%) |
| 75 Years and older | 32 (100.0%) | 0 (0.0%) |
| Total | 211 (89.4%) | 25 (10.6%) |
Health Insurance Coverage by Citizenship Status in Northport
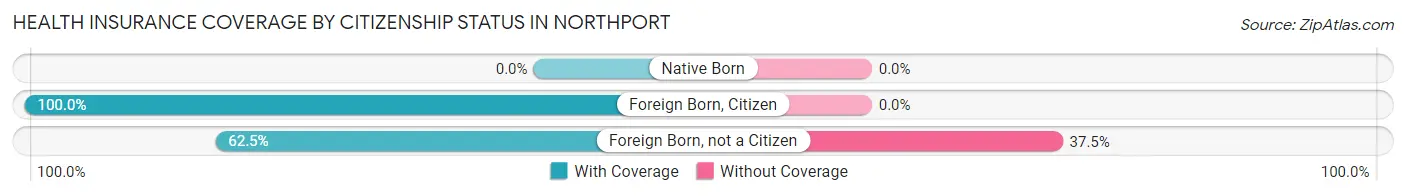
| Citizenship Status | With Coverage | Without Coverage |
| Native Born | 0 (0.0%) | 0 (0.0%) |
| Foreign Born, Citizen | 22 (100.0%) | 0 (0.0%) |
| Foreign Born, not a Citizen | 10 (62.5%) | 6 (37.5%) |
Health Insurance Coverage by Household Income in Northport
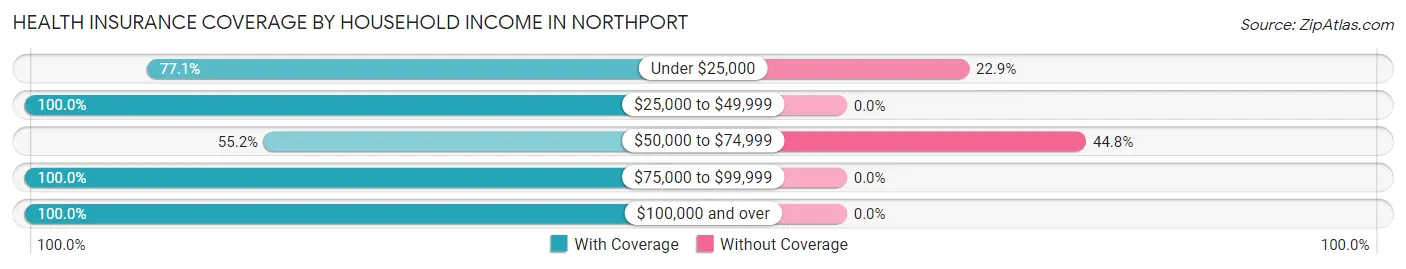
| Household Income | With Coverage | Without Coverage |
| Under $25,000 | 37 (77.1%) | 11 (22.9%) |
| $25,000 to $49,999 | 91 (100.0%) | 0 (0.0%) |
| $50,000 to $74,999 | 16 (55.2%) | 13 (44.8%) |
| $75,000 to $99,999 | 13 (100.0%) | 0 (0.0%) |
| $100,000 and over | 50 (100.0%) | 0 (0.0%) |
Public vs Private Health Insurance Coverage by Age in Northport
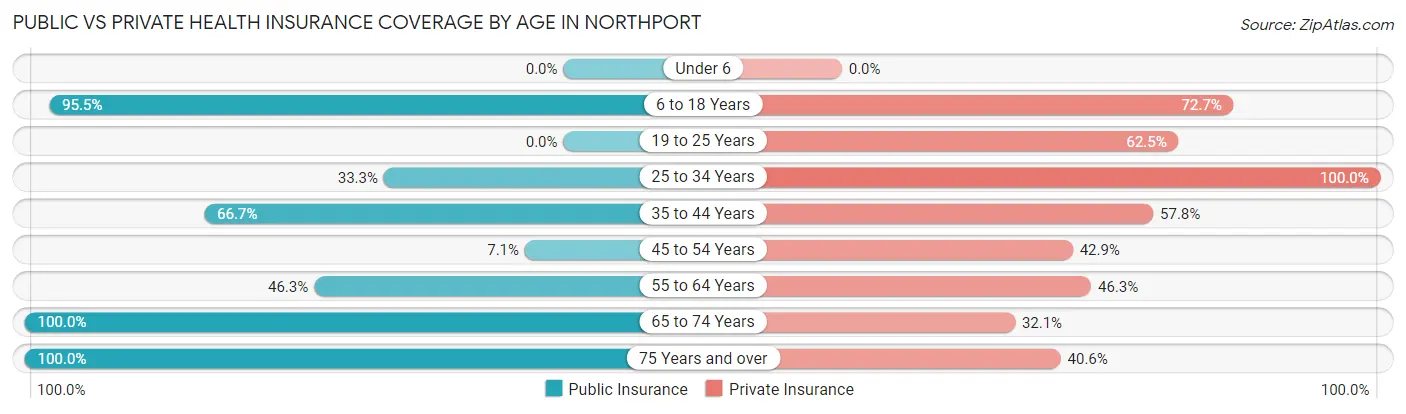
| Age Bracket | Public Insurance | Private Insurance |
| Under 6 | 0 (0.0%) | 0 (0.0%) |
| 6 to 18 Years | 21 (95.5%) | 16 (72.7%) |
| 19 to 25 Years | 0 (0.0%) | 10 (62.5%) |
| 25 to 34 Years | 4 (33.3%) | 12 (100.0%) |
| 35 to 44 Years | 30 (66.7%) | 26 (57.8%) |
| 45 to 54 Years | 1 (7.1%) | 6 (42.9%) |
| 55 to 64 Years | 31 (46.3%) | 31 (46.3%) |
| 65 to 74 Years | 28 (100.0%) | 9 (32.1%) |
| 75 Years and over | 32 (100.0%) | 13 (40.6%) |
| Total | 147 (62.3%) | 123 (52.1%) |
Disability Status by Sex by Age in Northport
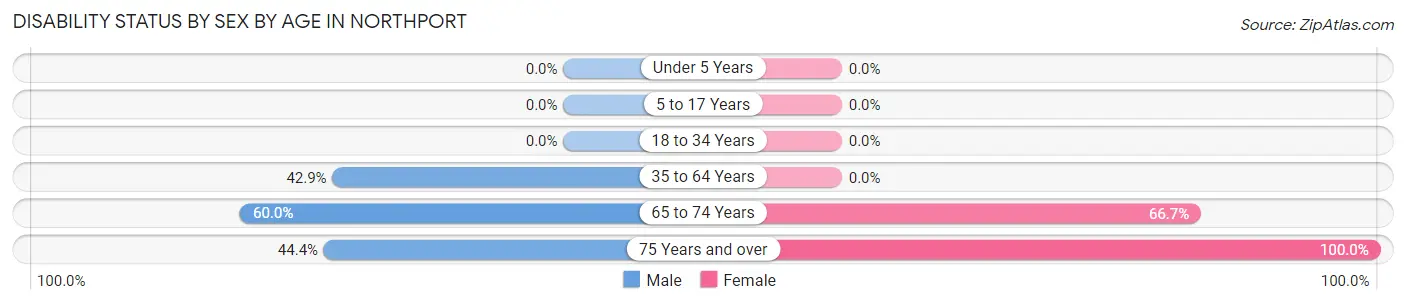
| Age Bracket | Male | Female |
| Under 5 Years | 0 (0.0%) | 0 (0.0%) |
| 5 to 17 Years | 0 (0.0%) | 0 (0.0%) |
| 18 to 34 Years | 0 (0.0%) | 0 (0.0%) |
| 35 to 64 Years | 21 (42.9%) | 0 (0.0%) |
| 65 to 74 Years | 6 (60.0%) | 12 (66.7%) |
| 75 Years and over | 4 (44.4%) | 23 (100.0%) |
Disability Class by Sex by Age in Northport
Disability Class: Hearing Difficulty
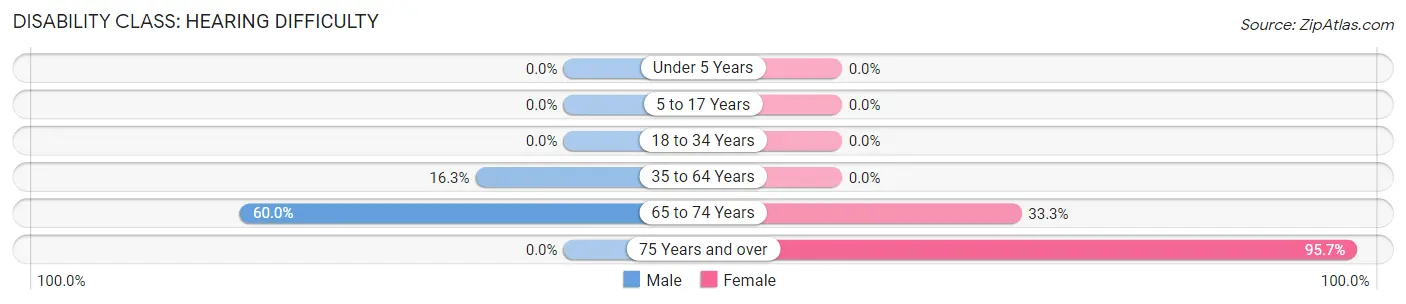
| Age Bracket | Male | Female |
| Under 5 Years | 0 (0.0%) | 0 (0.0%) |
| 5 to 17 Years | 0 (0.0%) | 0 (0.0%) |
| 18 to 34 Years | 0 (0.0%) | 0 (0.0%) |
| 35 to 64 Years | 8 (16.3%) | 0 (0.0%) |
| 65 to 74 Years | 6 (60.0%) | 6 (33.3%) |
| 75 Years and over | 0 (0.0%) | 22 (95.7%) |
Disability Class: Vision Difficulty
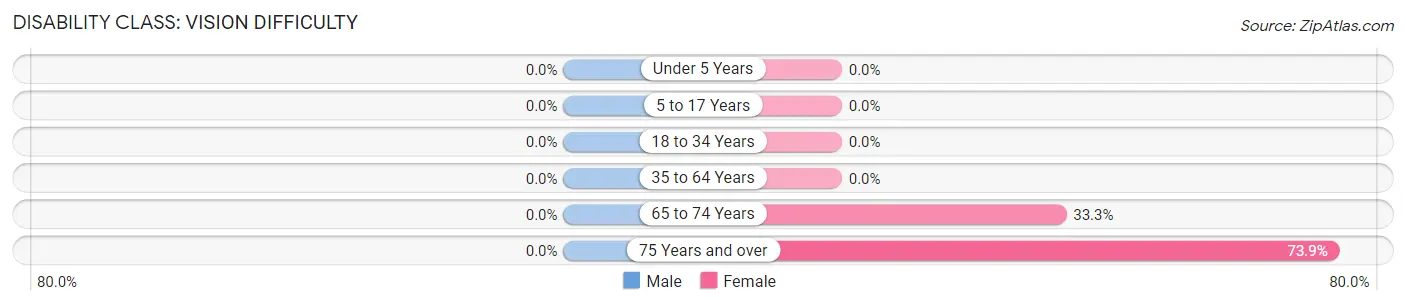
| Age Bracket | Male | Female |
| Under 5 Years | 0 (0.0%) | 0 (0.0%) |
| 5 to 17 Years | 0 (0.0%) | 0 (0.0%) |
| 18 to 34 Years | 0 (0.0%) | 0 (0.0%) |
| 35 to 64 Years | 0 (0.0%) | 0 (0.0%) |
| 65 to 74 Years | 0 (0.0%) | 6 (33.3%) |
| 75 Years and over | 0 (0.0%) | 17 (73.9%) |
Disability Class: Cognitive Difficulty
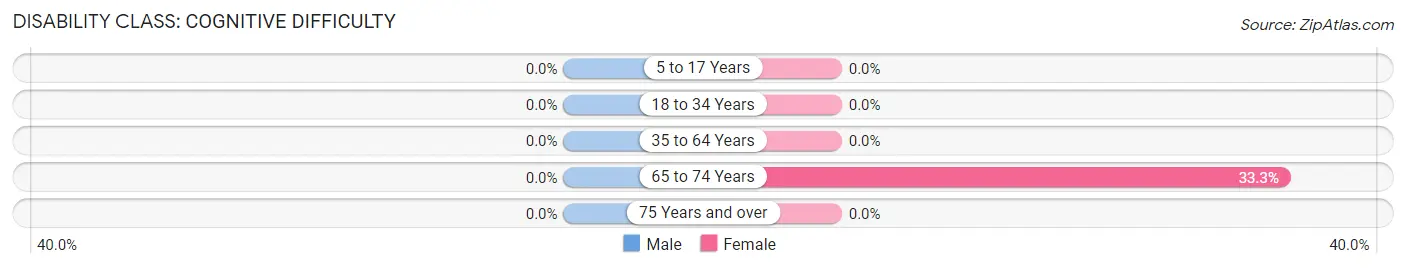
| Age Bracket | Male | Female |
| 5 to 17 Years | 0 (0.0%) | 0 (0.0%) |
| 18 to 34 Years | 0 (0.0%) | 0 (0.0%) |
| 35 to 64 Years | 0 (0.0%) | 0 (0.0%) |
| 65 to 74 Years | 0 (0.0%) | 6 (33.3%) |
| 75 Years and over | 0 (0.0%) | 0 (0.0%) |
Disability Class: Ambulatory Difficulty
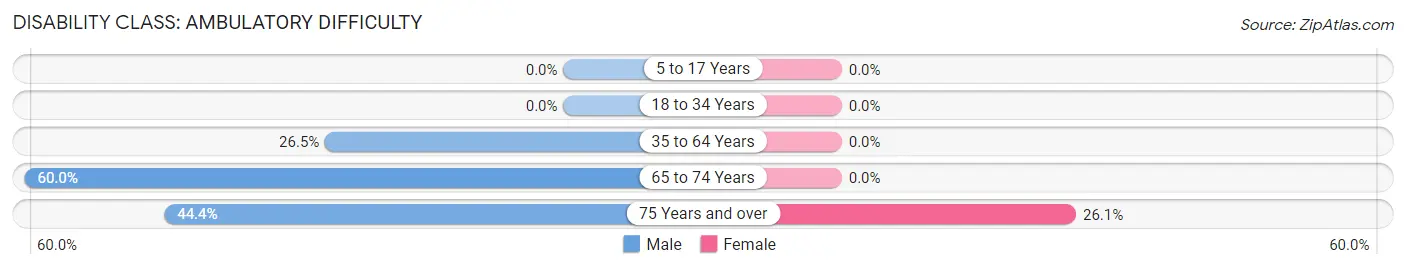
| Age Bracket | Male | Female |
| 5 to 17 Years | 0 (0.0%) | 0 (0.0%) |
| 18 to 34 Years | 0 (0.0%) | 0 (0.0%) |
| 35 to 64 Years | 13 (26.5%) | 0 (0.0%) |
| 65 to 74 Years | 6 (60.0%) | 0 (0.0%) |
| 75 Years and over | 4 (44.4%) | 6 (26.1%) |
Disability Class: Self-Care Difficulty
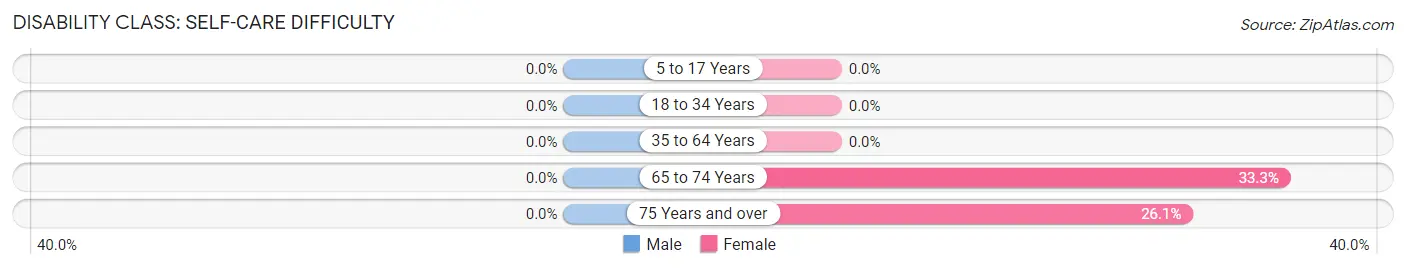
| Age Bracket | Male | Female |
| 5 to 17 Years | 0 (0.0%) | 0 (0.0%) |
| 18 to 34 Years | 0 (0.0%) | 0 (0.0%) |
| 35 to 64 Years | 0 (0.0%) | 0 (0.0%) |
| 65 to 74 Years | 0 (0.0%) | 6 (33.3%) |
| 75 Years and over | 0 (0.0%) | 6 (26.1%) |
Technology Access in Northport
Computing Device Access in Northport
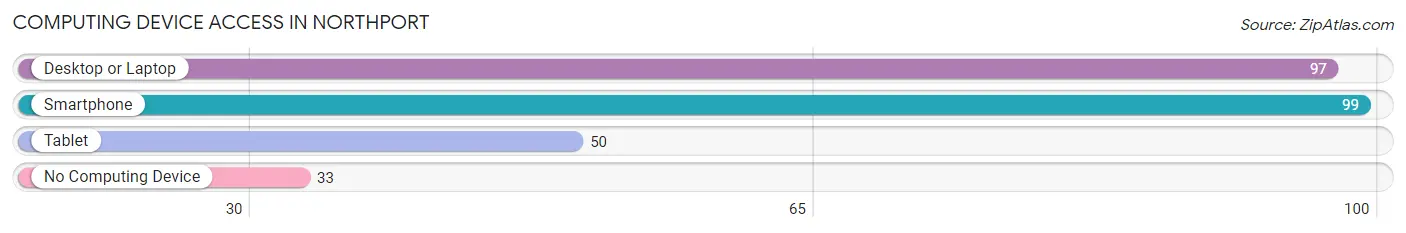
| Device Type | # Households | % Households |
| Desktop or Laptop | 97 | 67.8% |
| Smartphone | 99 | 69.2% |
| Tablet | 50 | 35.0% |
| No Computing Device | 33 | 23.1% |
| Total | 143 | 100.0% |
Internet Access in Northport
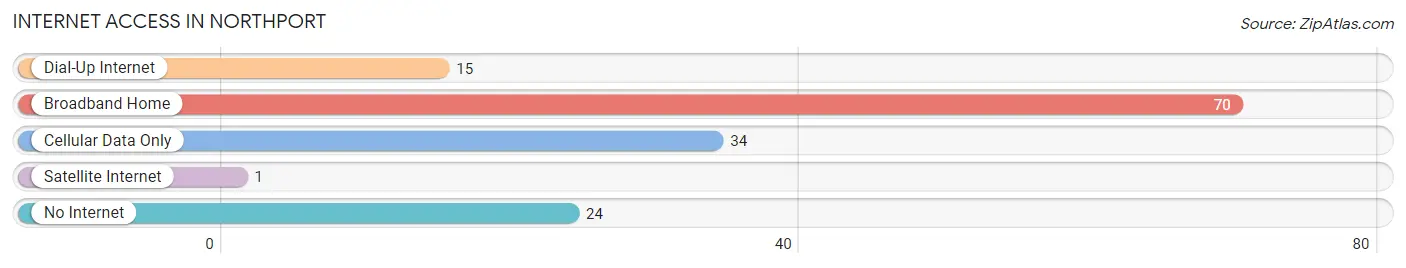
| Internet Type | # Households | % Households |
| Dial-Up Internet | 15 | 10.5% |
| Broadband Home | 70 | 48.9% |
| Cellular Data Only | 34 | 23.8% |
| Satellite Internet | 1 | 0.7% |
| No Internet | 24 | 16.8% |
| Total | 143 | 100.0% |
Northport Summary
Northport is a small town located in the northeast corner of Washington State, in the United States. It is situated on the banks of the Columbia River, near the Canadian border. The town has a population of approximately 500 people, and is the county seat of Stevens County.
History
Northport was founded in 1883 by a group of settlers from the Midwest. The town was originally called “Newport”, but the name was changed to Northport in 1885. The town was established as a trading post and supply center for the local Native American tribes, and was also a stop on the Northern Pacific Railroad.
In the early 1900s, Northport became a popular destination for tourists, due to its proximity to the Columbia River and its scenic beauty. The town was also home to a number of businesses, including a sawmill, a flour mill, a hotel, and a general store.
In the 1950s, Northport began to experience a decline in population, as many of its residents moved away to larger cities. However, the town has since experienced a resurgence in population, due to its proximity to the Canadian border and its scenic beauty.
Geography
Northport is located in the northeast corner of Washington State, in the United States. It is situated on the banks of the Columbia River, near the Canadian border. The town is located in a valley, surrounded by mountains and hills. The nearest major city is Spokane, which is located approximately 50 miles to the south.
The climate in Northport is generally mild, with warm summers and cold winters. The average annual temperature is around 50 degrees Fahrenheit. The town receives an average of 20 inches of precipitation per year.
Economy
The economy of Northport is largely based on tourism and agriculture. The town is home to a number of tourist attractions, including the Northport Historical Museum, the Northport Marina, and the Northport Golf Course. The town also has a number of small businesses, including restaurants, shops, and galleries.
Agriculture is also an important part of the local economy. The town is home to a number of farms, which produce a variety of crops, including wheat, barley, and hay.
Demographics
As of the 2010 census, the population of Northport was 498. The racial makeup of the town was 95.2% White, 0.2% African American, 0.4% Native American, 0.4% Asian, 0.2% Pacific Islander, and 3.6% from other races. The median household income was $37,500, and the median family income was $45,000.
Conclusion
Northport is a small town located in the northeast corner of Washington State, in the United States. It is situated on the banks of the Columbia River, near the Canadian border. The town has a population of approximately 500 people, and is the county seat of Stevens County. The economy of Northport is largely based on tourism and agriculture, and the town is home to a number of tourist attractions and small businesses. The racial makeup of the town is predominantly White, with a small percentage of other races. The median household income is $37,500, and the median family income is $45,000.
Common Questions
What is Per Capita Income in Northport?
Per Capita income in Northport is $28,903.
What is the Median Family Income in Northport?
Median Family Income in Northport is $67,813.
What is the Median Household income in Northport?
Median Household Income in Northport is $40,197.
What is Income or Wage Gap in Northport?
Income or Wage Gap in Northport is 34.3%.
Women in Northport earn 65.7 cents for every dollar earned by a man.
What is Inequality or Gini Index in Northport?
Inequality or Gini Index in Northport is 0.42.
What is the Total Population of Northport?
Total Population of Northport is 236.
What is the Total Male Population of Northport?
Total Male Population of Northport is 99.
What is the Total Female Population of Northport?
Total Female Population of Northport is 137.
What is the Ratio of Males per 100 Females in Northport?
There are 72.26 Males per 100 Females in Northport.
What is the Ratio of Females per 100 Males in Northport?
There are 138.38 Females per 100 Males in Northport.
What is the Median Population Age in Northport?
Median Population Age in Northport is 56.7 Years.
What is the Average Family Size in Northport
Average Family Size in Northport is 2.3 People.
What is the Average Household Size in Northport
Average Household Size in Northport is 1.6 People.
How Large is the Labor Force in Northport?
There are 108 People in the Labor Forcein in Northport.
What is the Percentage of People in the Labor Force in Northport?
50.5% of People are in the Labor Force in Northport.