South Bend, WA Map & Demographics
South Bend Map
South Bend Overview
$23,876
PER CAPITA INCOME
$57,961
AVG FAMILY INCOME
$45,156
AVG HOUSEHOLD INCOME
59.3%
WAGE / INCOME GAP [ % ]
40.7¢/ $1
WAGE / INCOME GAP [ $ ]
0.48
INEQUALITY / GINI INDEX
1,859
TOTAL POPULATION
1,027
MALE POPULATION
832
FEMALE POPULATION
123.44
MALES / 100 FEMALES
81.01
FEMALES / 100 MALES
44.5
MEDIAN AGE
3.0
AVG FAMILY SIZE
2.4
AVG HOUSEHOLD SIZE
662
LABOR FORCE [ PEOPLE ]
44.0%
PERCENT IN LABOR FORCE
1.2%
UNEMPLOYMENT RATE
South Bend Zip Codes
South Bend Area Codes
Income in South Bend
Income Overview in South Bend
Per Capita Income in South Bend is $23,876, while median incomes of families and households are $57,961 and $45,156 respectively.
| Characteristic | Number | Measure |
| Per Capita Income | 1,859 | $23,876 |
| Median Family Income | 447 | $57,961 |
| Mean Family Income | 447 | $63,569 |
| Median Household Income | 731 | $45,156 |
| Mean Household Income | 731 | $56,992 |
| Income Deficit | 447 | $0 |
| Wage / Income Gap (%) | 1,859 | 59.27% |
| Wage / Income Gap ($) | 1,859 | 40.73¢ per $1 |
| Gini / Inequality Index | 1,859 | 0.48 |
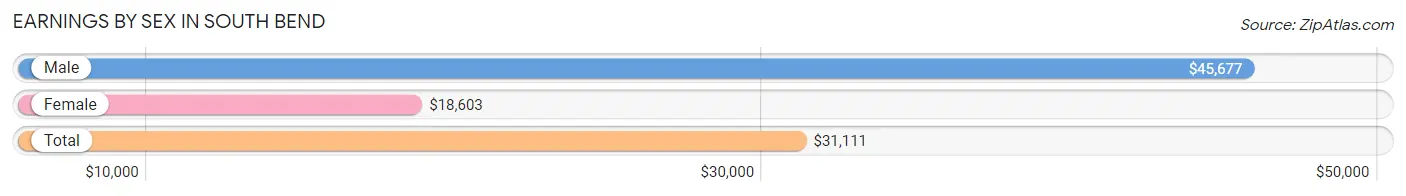
Earnings by Sex in South Bend
Average Earnings in South Bend are $31,111, $45,677 for men and $18,603 for women, a difference of 59.3%.
| Sex | Number | Average Earnings |
| Male | 413 (59.5%) | $45,677 |
| Female | 281 (40.5%) | $18,603 |
| Total | 694 (100.0%) | $31,111 |
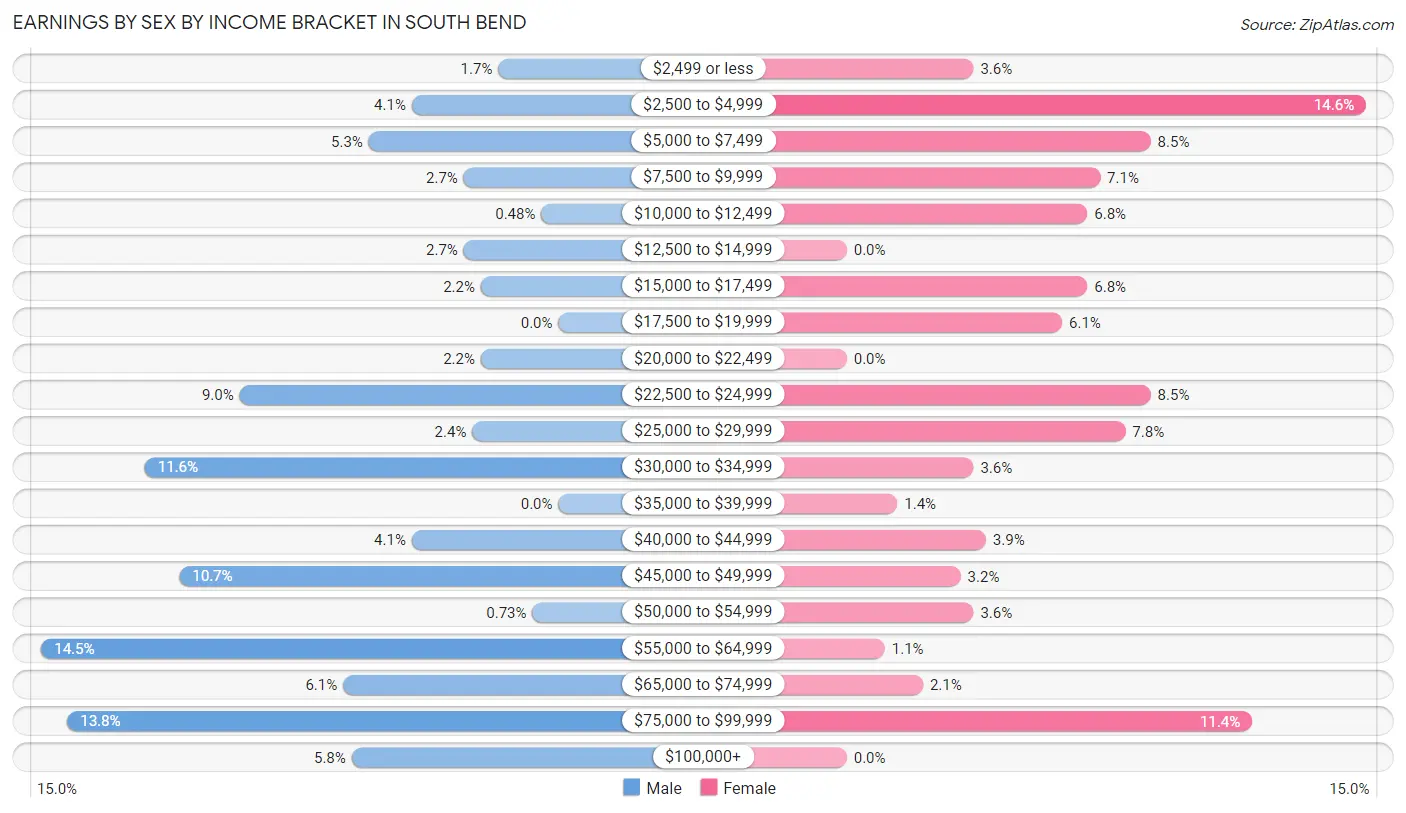
Earnings by Sex by Income Bracket in South Bend
The most common earnings brackets in South Bend are $55,000 to $64,999 for men (60 | 14.5%) and $2,500 to $4,999 for women (41 | 14.6%).
| Income | Male | Female |
| $2,499 or less | 7 (1.7%) | 10 (3.6%) |
| $2,500 to $4,999 | 17 (4.1%) | 41 (14.6%) |
| $5,000 to $7,499 | 22 (5.3%) | 24 (8.5%) |
| $7,500 to $9,999 | 11 (2.7%) | 20 (7.1%) |
| $10,000 to $12,499 | 2 (0.5%) | 19 (6.8%) |
| $12,500 to $14,999 | 11 (2.7%) | 0 (0.0%) |
| $15,000 to $17,499 | 9 (2.2%) | 19 (6.8%) |
| $17,500 to $19,999 | 0 (0.0%) | 17 (6.0%) |
| $20,000 to $22,499 | 9 (2.2%) | 0 (0.0%) |
| $22,500 to $24,999 | 37 (9.0%) | 24 (8.5%) |
| $25,000 to $29,999 | 10 (2.4%) | 22 (7.8%) |
| $30,000 to $34,999 | 48 (11.6%) | 10 (3.6%) |
| $35,000 to $39,999 | 0 (0.0%) | 4 (1.4%) |
| $40,000 to $44,999 | 17 (4.1%) | 11 (3.9%) |
| $45,000 to $49,999 | 44 (10.6%) | 9 (3.2%) |
| $50,000 to $54,999 | 3 (0.7%) | 10 (3.6%) |
| $55,000 to $64,999 | 60 (14.5%) | 3 (1.1%) |
| $65,000 to $74,999 | 25 (6.0%) | 6 (2.1%) |
| $75,000 to $99,999 | 57 (13.8%) | 32 (11.4%) |
| $100,000+ | 24 (5.8%) | 0 (0.0%) |
| Total | 413 (100.0%) | 281 (100.0%) |
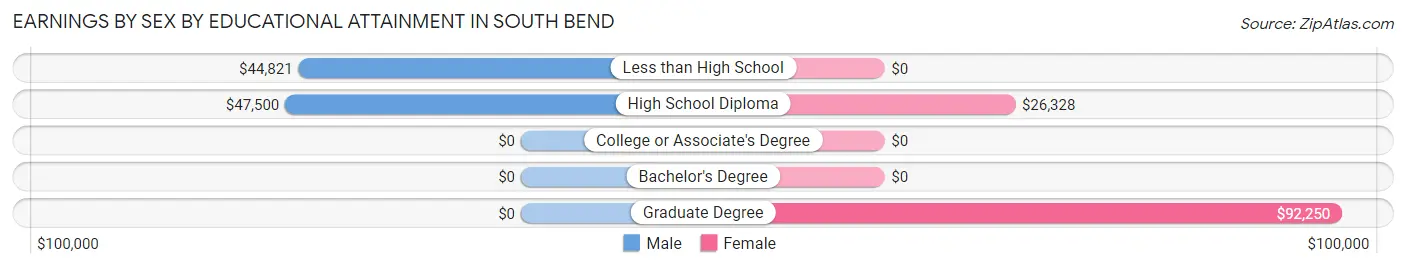
Earnings by Sex by Educational Attainment in South Bend
Average earnings in South Bend are $48,625 for men and $19,265 for women, a difference of 60.4%. Men with an educational attainment of high school diploma enjoy the highest average annual earnings of $47,500, while those with less than high school education earn the least with $44,821. Women with an educational attainment of graduate degree earn the most with the average annual earnings of $92,250, while those with high school diploma education have the smallest earnings of $26,328.
| Educational Attainment | Male Income | Female Income |
| Less than High School | $44,821 | $0 |
| High School Diploma | $47,500 | $26,328 |
| College or Associate's Degree | - | - |
| Bachelor's Degree | - | - |
| Graduate Degree | - | - |
| Total | $48,625 | $19,265 |
Family Income in South Bend
Family Income Brackets in South Bend
According to the South Bend family income data, there are 95 families falling into the $50,000 to $74,999 income range, which is the most common income bracket and makes up 21.2% of all families.
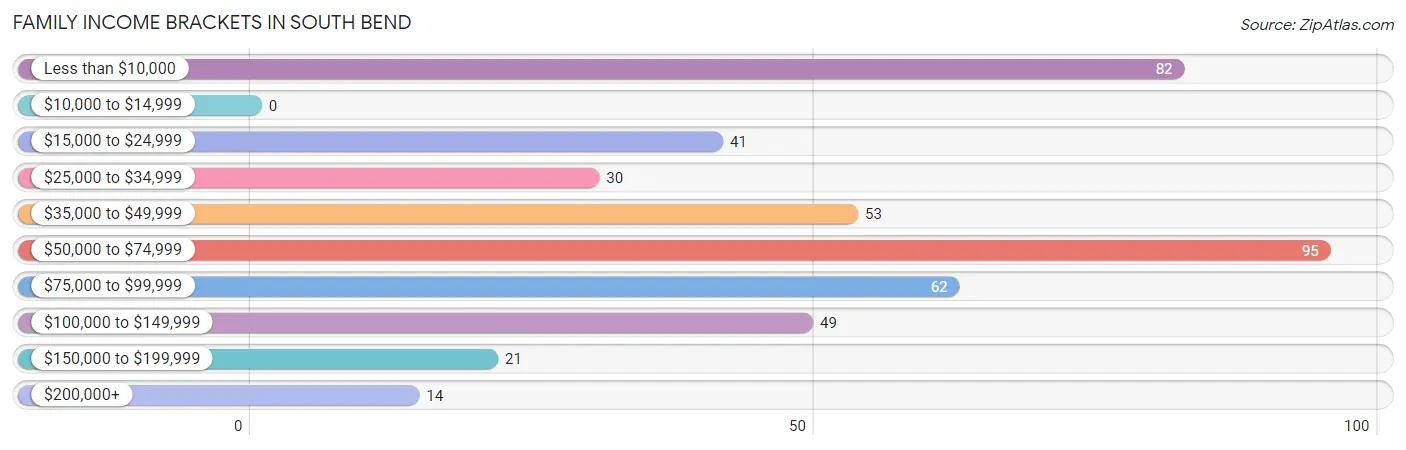
| Income Bracket | # Families | % Families |
| Less than $10,000 | 82 | 18.3% |
| $10,000 to $14,999 | 0 | 0.0% |
| $15,000 to $24,999 | 41 | 9.2% |
| $25,000 to $34,999 | 30 | 6.7% |
| $35,000 to $49,999 | 53 | 11.9% |
| $50,000 to $74,999 | 95 | 21.3% |
| $75,000 to $99,999 | 62 | 13.9% |
| $100,000 to $149,999 | 49 | 11.0% |
| $150,000 to $199,999 | 21 | 4.7% |
| $200,000+ | 14 | 3.1% |
Family Income by Famaliy Size in South Bend
4-person families (75 | 16.8%) account for the highest median family income in South Bend with $70,917 per family, while 2-person families (197 | 44.1%) have the highest median income of $21,875 per family member.
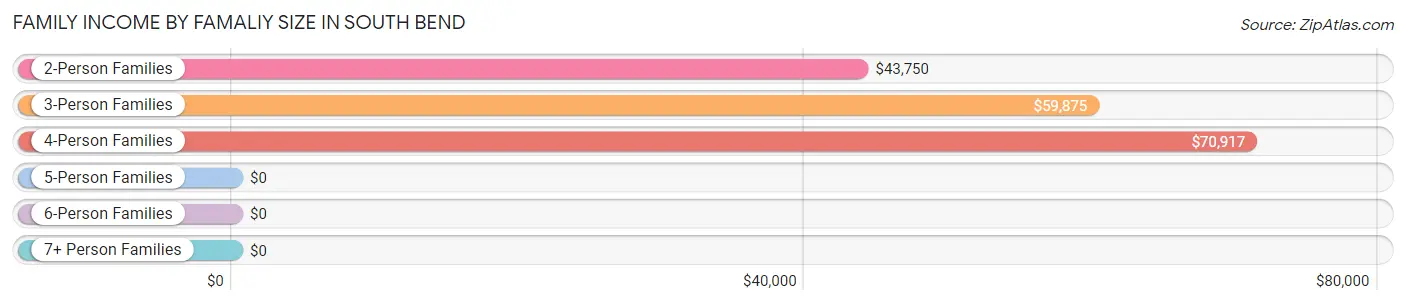
| Income Bracket | # Families | Median Income |
| 2-Person Families | 197 (44.1%) | $43,750 |
| 3-Person Families | 103 (23.0%) | $59,875 |
| 4-Person Families | 75 (16.8%) | $70,917 |
| 5-Person Families | 53 (11.9%) | $0 |
| 6-Person Families | 19 (4.3%) | $0 |
| 7+ Person Families | 0 (0.0%) | $0 |
| Total | 447 (100.0%) | $57,961 |
Family Income by Number of Earners in South Bend
The median family income in South Bend is $57,961, with families comprising 3+ earners (45) having the highest median family income of $146,042, while families with no earners (134) have the lowest median family income of $24,500, accounting for 10.1% and 30.0% of families, respectively.
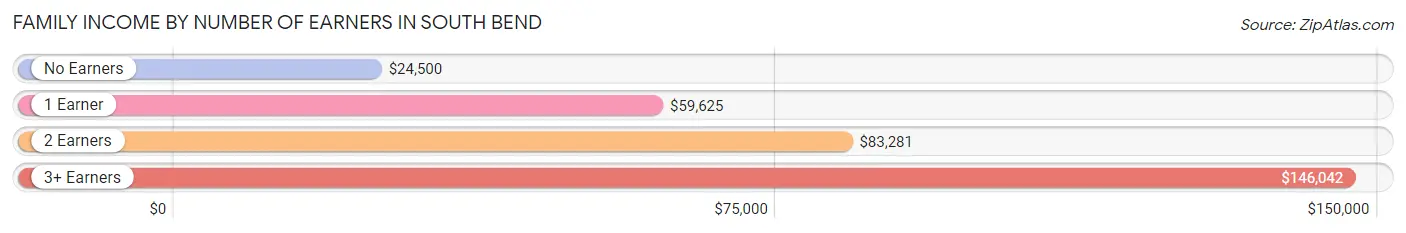
| Number of Earners | # Families | Median Income |
| No Earners | 134 (30.0%) | $24,500 |
| 1 Earner | 151 (33.8%) | $59,625 |
| 2 Earners | 117 (26.2%) | $83,281 |
| 3+ Earners | 45 (10.1%) | $146,042 |
| Total | 447 (100.0%) | $57,961 |
Household Income in South Bend
Household Income Brackets in South Bend
With 153 households falling in the category, the $50,000 to $74,999 income range is the most frequent in South Bend, accounting for 20.9% of all households. In contrast, only 26 households (3.6%) fall into the $200,000+ income bracket, making it the least populous group.
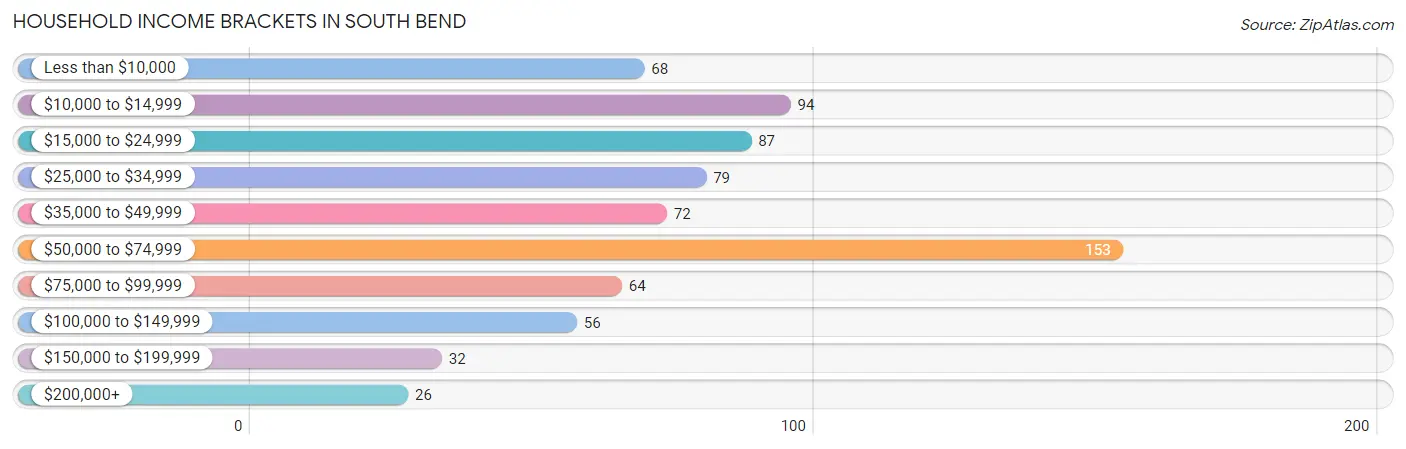
| Income Bracket | # Households | % Households |
| Less than $10,000 | 68 | 9.3% |
| $10,000 to $14,999 | 94 | 12.9% |
| $15,000 to $24,999 | 87 | 11.9% |
| $25,000 to $34,999 | 79 | 10.8% |
| $35,000 to $49,999 | 72 | 9.8% |
| $50,000 to $74,999 | 153 | 20.9% |
| $75,000 to $99,999 | 64 | 8.8% |
| $100,000 to $149,999 | 56 | 7.7% |
| $150,000 to $199,999 | 32 | 4.4% |
| $200,000+ | 26 | 3.6% |
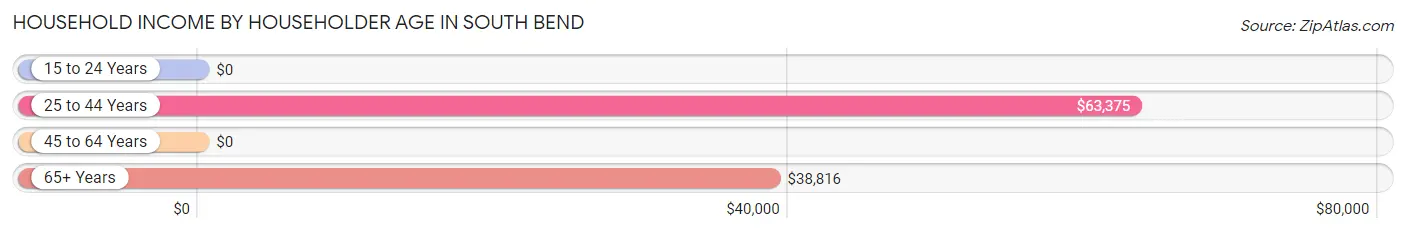
Household Income by Householder Age in South Bend
The median household income in South Bend is $45,156, with the highest median household income of $63,375 found in the 25 to 44 years age bracket for the primary householder. A total of 161 households (22.0%) fall into this category. Meanwhile, the 15 to 24 years age bracket for the primary householder has the lowest median household income of $0, with 31 households (4.2%) in this group.
| Income Bracket | # Households | Median Income |
| 15 to 24 Years | 31 (4.2%) | $0 |
| 25 to 44 Years | 161 (22.0%) | $63,375 |
| 45 to 64 Years | 297 (40.6%) | $0 |
| 65+ Years | 242 (33.1%) | $38,816 |
| Total | 731 (100.0%) | $45,156 |
Poverty in South Bend
Income Below Poverty by Sex and Age in South Bend
With 31.5% poverty level for males and 29.2% for females among the residents of South Bend, 5 year old males and 16 and 17 year old females are the most vulnerable to poverty, with 11 males (100.0%) and 16 females (53.3%) in their respective age groups living below the poverty level.
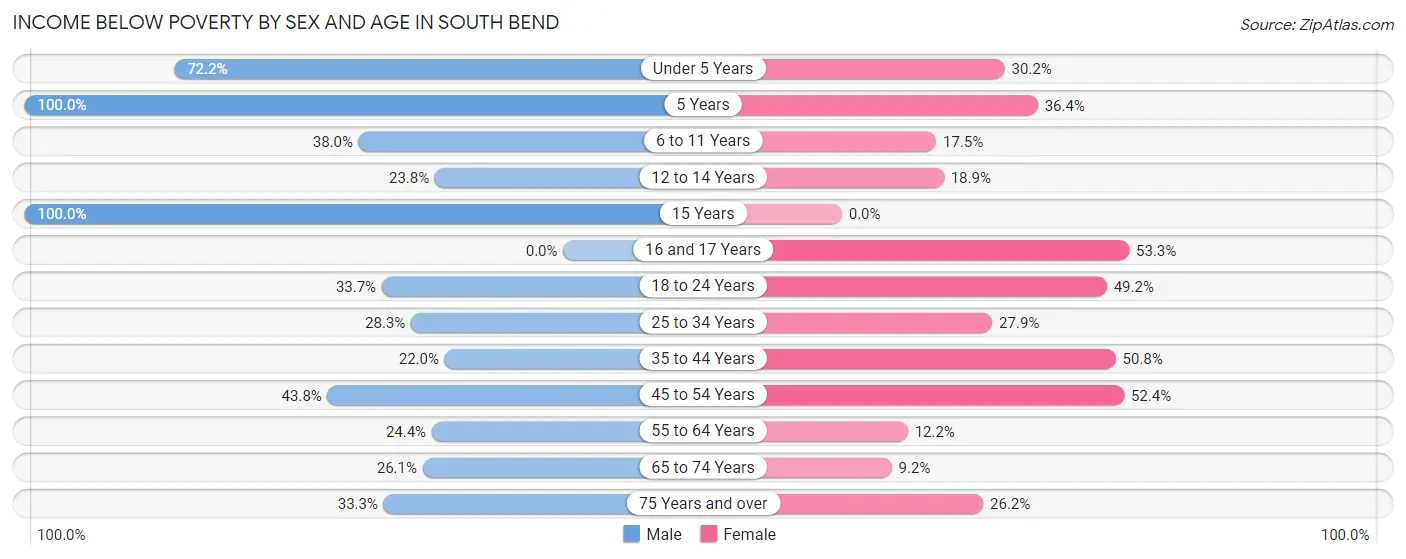
| Age Bracket | Male | Female |
| Under 5 Years | 26 (72.2%) | 13 (30.2%) |
| 5 Years | 11 (100.0%) | 4 (36.4%) |
| 6 to 11 Years | 30 (38.0%) | 7 (17.5%) |
| 12 to 14 Years | 5 (23.8%) | 7 (18.9%) |
| 15 Years | 10 (100.0%) | 0 (0.0%) |
| 16 and 17 Years | 0 (0.0%) | 16 (53.3%) |
| 18 to 24 Years | 33 (33.7%) | 30 (49.2%) |
| 25 to 34 Years | 13 (28.3%) | 12 (27.9%) |
| 35 to 44 Years | 35 (22.0%) | 61 (50.8%) |
| 45 to 54 Years | 35 (43.8%) | 44 (52.4%) |
| 55 to 64 Years | 50 (24.4%) | 17 (12.2%) |
| 65 to 74 Years | 36 (26.1%) | 11 (9.2%) |
| 75 Years and over | 22 (33.3%) | 16 (26.2%) |
| Total | 306 (31.5%) | 238 (29.2%) |
Income Above Poverty by Sex and Age in South Bend
According to the poverty statistics in South Bend, males aged 16 and 17 years and females aged 15 years are the age groups that are most secure financially, with 100.0% of males and 100.0% of females in these age groups living above the poverty line.
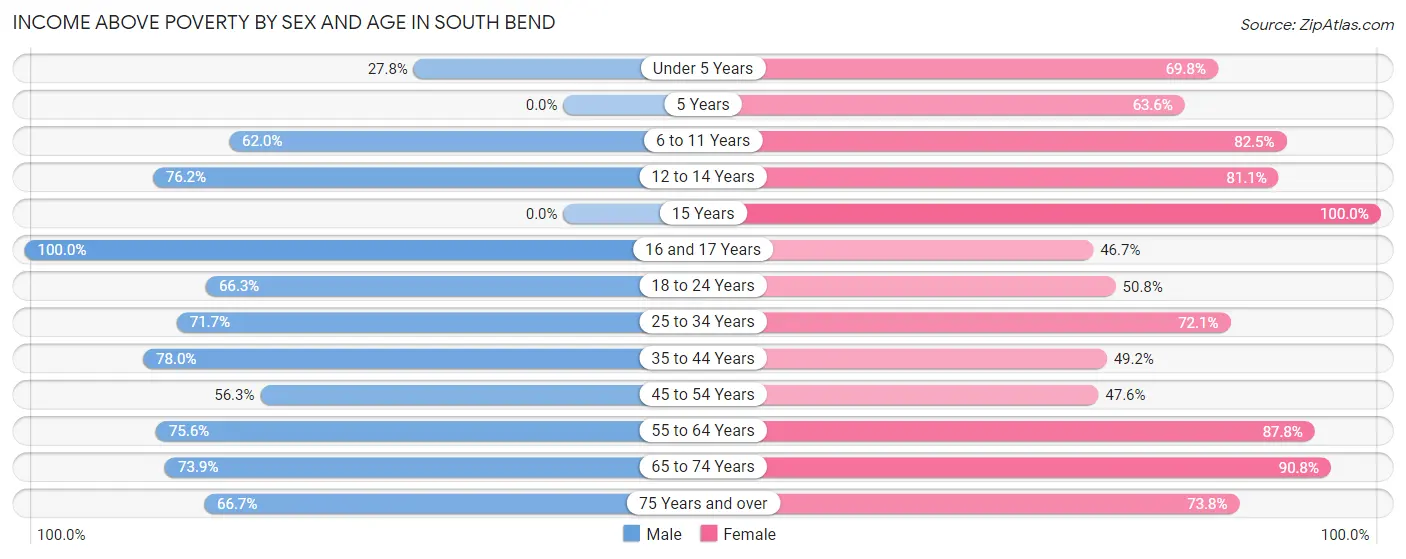
| Age Bracket | Male | Female |
| Under 5 Years | 10 (27.8%) | 30 (69.8%) |
| 5 Years | 0 (0.0%) | 7 (63.6%) |
| 6 to 11 Years | 49 (62.0%) | 33 (82.5%) |
| 12 to 14 Years | 16 (76.2%) | 30 (81.1%) |
| 15 Years | 0 (0.0%) | 28 (100.0%) |
| 16 and 17 Years | 22 (100.0%) | 14 (46.7%) |
| 18 to 24 Years | 65 (66.3%) | 31 (50.8%) |
| 25 to 34 Years | 33 (71.7%) | 31 (72.1%) |
| 35 to 44 Years | 124 (78.0%) | 59 (49.2%) |
| 45 to 54 Years | 45 (56.2%) | 40 (47.6%) |
| 55 to 64 Years | 155 (75.6%) | 122 (87.8%) |
| 65 to 74 Years | 102 (73.9%) | 108 (90.8%) |
| 75 Years and over | 44 (66.7%) | 45 (73.8%) |
| Total | 665 (68.5%) | 578 (70.8%) |
Income Below Poverty Among Married-Couple Families in South Bend
The poverty statistics for married-couple families in South Bend show that 10.6% or 26 of the total 245 families live below the poverty line. Families with 1 or 2 children have the highest poverty rate of 18.5%, comprising of 12 families. On the other hand, families with no children have the lowest poverty rate of 7.8%, which includes 14 families.
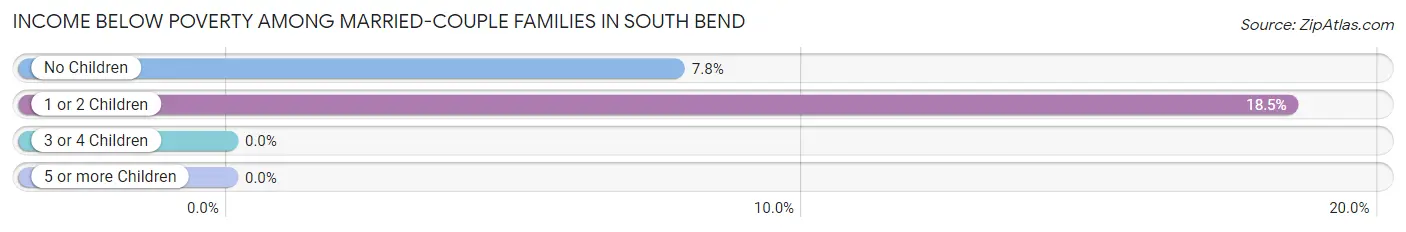
| Children | Above Poverty | Below Poverty |
| No Children | 166 (92.2%) | 14 (7.8%) |
| 1 or 2 Children | 53 (81.5%) | 12 (18.5%) |
| 3 or 4 Children | 0 (0.0%) | 0 (0.0%) |
| 5 or more Children | 0 (0.0%) | 0 (0.0%) |
| Total | 219 (89.4%) | 26 (10.6%) |
Income Below Poverty Among Single-Parent Households in South Bend
According to the poverty data in South Bend, 32.0% or 31 single-father households and 60.0% or 63 single-mother households are living below the poverty line. Among single-father households, those with 3 or 4 children have the highest poverty rate, with 18 households (50.0%) experiencing poverty. Likewise, among single-mother households, those with 1 or 2 children have the highest poverty rate, with 63 households (79.7%) falling below the poverty line.
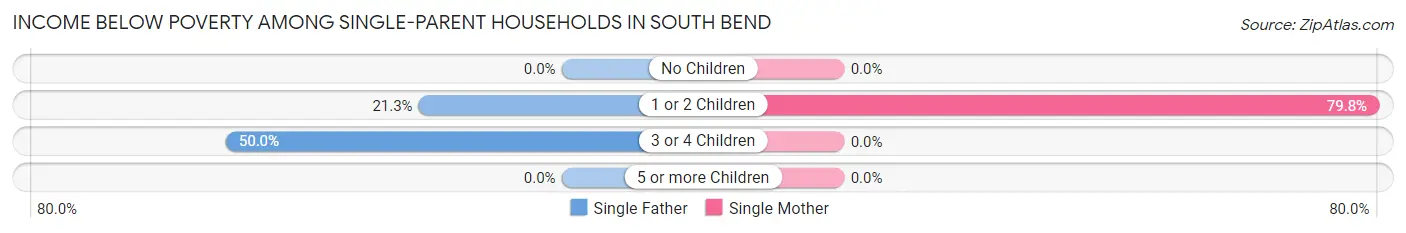
| Children | Single Father | Single Mother |
| No Children | 0 (0.0%) | 0 (0.0%) |
| 1 or 2 Children | 13 (21.3%) | 63 (79.7%) |
| 3 or 4 Children | 18 (50.0%) | 0 (0.0%) |
| 5 or more Children | 0 (0.0%) | 0 (0.0%) |
| Total | 31 (32.0%) | 63 (60.0%) |
Income Below Poverty Among Married-Couple vs Single-Parent Households in South Bend
The poverty data for South Bend shows that 26 of the married-couple family households (10.6%) and 94 of the single-parent households (46.5%) are living below the poverty level. Within the married-couple family households, those with 1 or 2 children have the highest poverty rate, with 12 households (18.5%) falling below the poverty line. Among the single-parent households, those with 1 or 2 children have the highest poverty rate, with 76 household (54.3%) living below poverty.
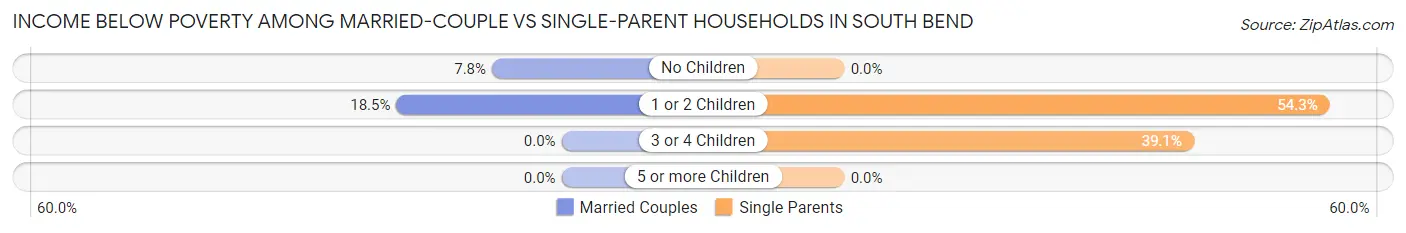
| Children | Married-Couple Families | Single-Parent Households |
| No Children | 14 (7.8%) | 0 (0.0%) |
| 1 or 2 Children | 12 (18.5%) | 76 (54.3%) |
| 3 or 4 Children | 0 (0.0%) | 18 (39.1%) |
| 5 or more Children | 0 (0.0%) | 0 (0.0%) |
| Total | 26 (10.6%) | 94 (46.5%) |
Race in South Bend
The most populous races in South Bend are White / Caucasian (1,045 | 56.2%), Hispanic or Latino (497 | 26.7%), and Some other Race (356 | 19.2%).
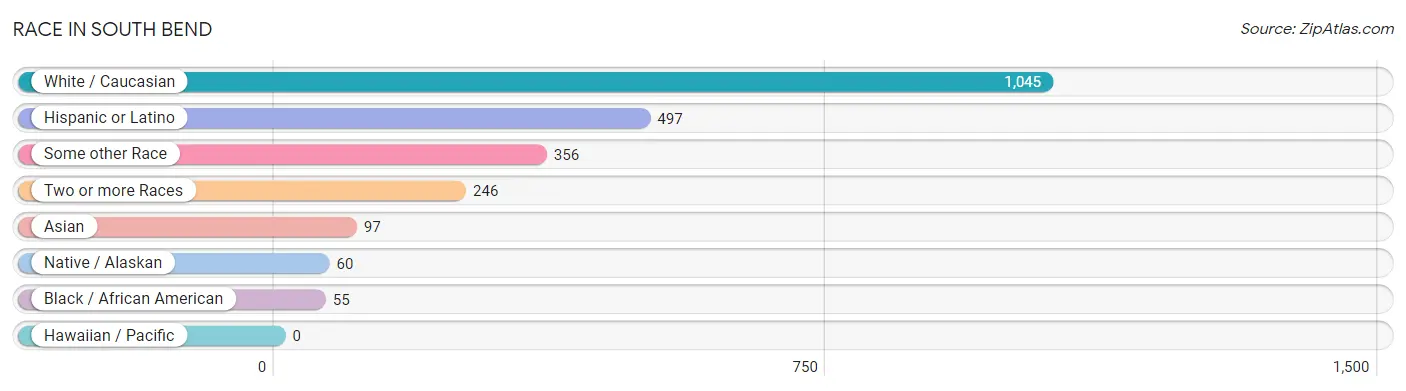
| Race | # Population | % Population |
| Asian | 97 | 5.2% |
| Black / African American | 55 | 3.0% |
| Hawaiian / Pacific | 0 | 0.0% |
| Hispanic or Latino | 497 | 26.7% |
| Native / Alaskan | 60 | 3.2% |
| White / Caucasian | 1,045 | 56.2% |
| Two or more Races | 246 | 13.2% |
| Some other Race | 356 | 19.2% |
| Total | 1,859 | 100.0% |
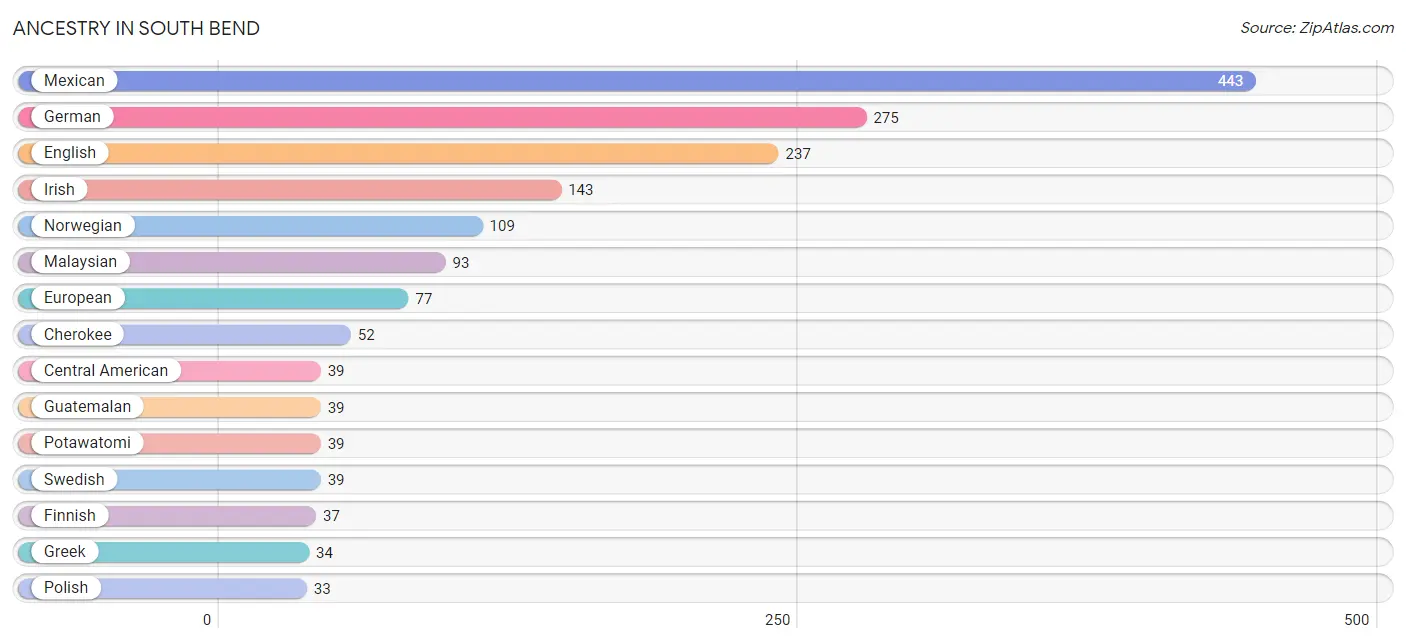
Ancestry in South Bend
The most populous ancestries reported in South Bend are Mexican (443 | 23.8%), German (275 | 14.8%), English (237 | 12.8%), Irish (143 | 7.7%), and Norwegian (109 | 5.9%), together accounting for 64.9% of all South Bend residents.
| Ancestry | # Population | % Population |
| American | 9 | 0.5% |
| Belgian | 6 | 0.3% |
| Blackfeet | 8 | 0.4% |
| British | 8 | 0.4% |
| Burmese | 6 | 0.3% |
| Central American | 39 | 2.1% |
| Cherokee | 52 | 2.8% |
| Chippewa | 16 | 0.9% |
| Choctaw | 29 | 1.6% |
| Czech | 15 | 0.8% |
| Dutch | 19 | 1.0% |
| Eastern European | 13 | 0.7% |
| English | 237 | 12.8% |
| Estonian | 6 | 0.3% |
| European | 77 | 4.1% |
| Finnish | 37 | 2.0% |
| French | 14 | 0.7% |
| German | 275 | 14.8% |
| Greek | 34 | 1.8% |
| Guatemalan | 39 | 2.1% |
| Irish | 143 | 7.7% |
| Italian | 2 | 0.1% |
| Japanese | 7 | 0.4% |
| Korean | 17 | 0.9% |
| Malaysian | 93 | 5.0% |
| Mexican | 443 | 23.8% |
| Norwegian | 109 | 5.9% |
| Polish | 33 | 1.8% |
| Potawatomi | 39 | 2.1% |
| Puget Sound Salish | 2 | 0.1% |
| Russian | 1 | 0.1% |
| Scandinavian | 12 | 0.6% |
| Scotch-Irish | 7 | 0.4% |
| Scottish | 17 | 0.9% |
| Sioux | 3 | 0.2% |
| Spanish | 15 | 0.8% |
| Sri Lankan | 9 | 0.5% |
| Swedish | 39 | 2.1% |
| Welsh | 10 | 0.5% | View All 39 Rows |
Immigrants in South Bend
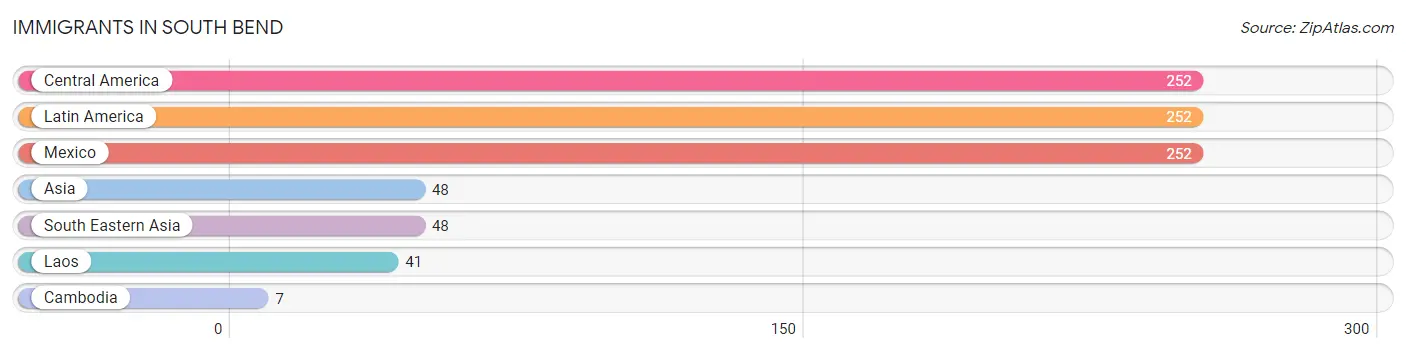
The most numerous immigrant groups reported in South Bend came from Central America (252 | 13.6%), Latin America (252 | 13.6%), Mexico (252 | 13.6%), Asia (48 | 2.6%), and South Eastern Asia (48 | 2.6%), together accounting for 45.8% of all South Bend residents.
| Immigration Origin | # Population | % Population |
| Asia | 48 | 2.6% |
| Cambodia | 7 | 0.4% |
| Central America | 252 | 13.6% |
| Laos | 41 | 2.2% |
| Latin America | 252 | 13.6% |
| Mexico | 252 | 13.6% |
| South Eastern Asia | 48 | 2.6% | View All 7 Rows |
Sex and Age in South Bend
Sex and Age in South Bend
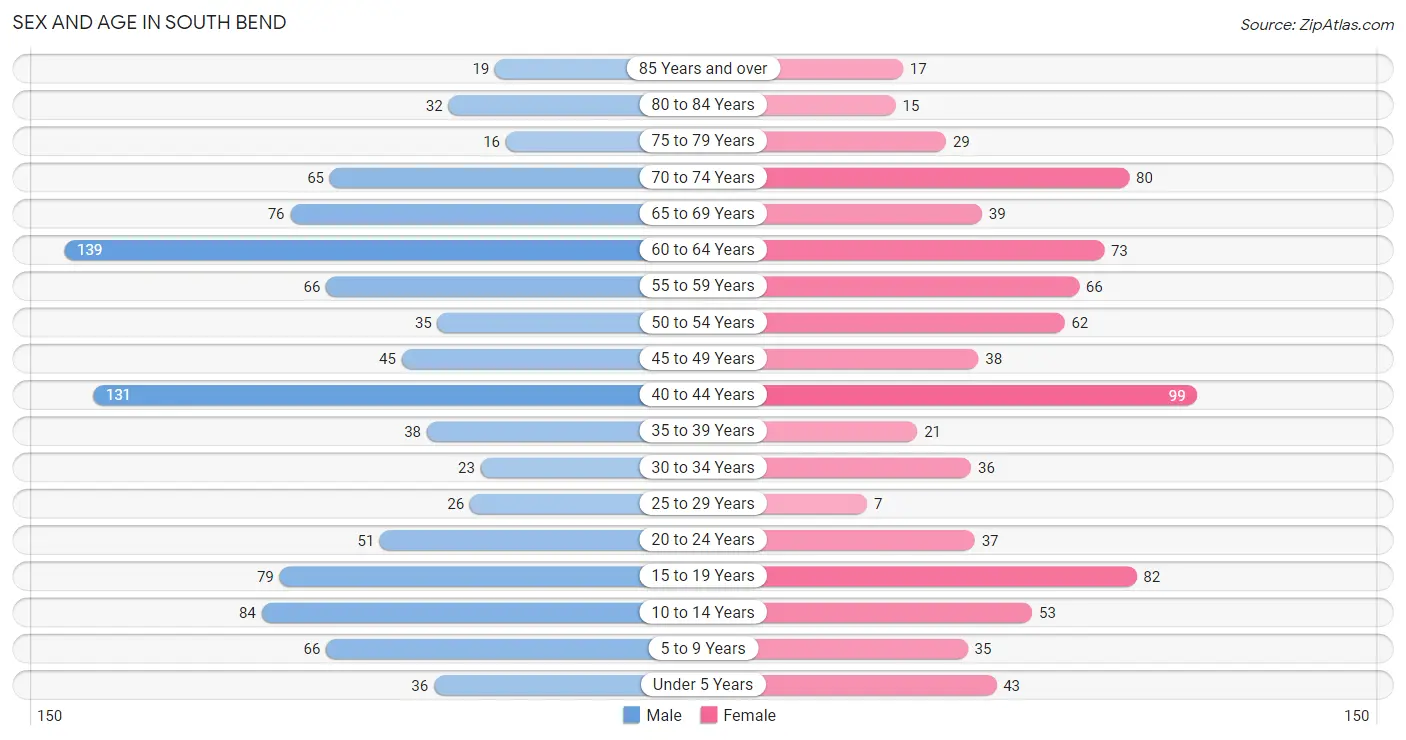
The most populous age groups in South Bend are 60 to 64 Years (139 | 13.5%) for men and 40 to 44 Years (99 | 11.9%) for women.
| Age Bracket | Male | Female |
| Under 5 Years | 36 (3.5%) | 43 (5.2%) |
| 5 to 9 Years | 66 (6.4%) | 35 (4.2%) |
| 10 to 14 Years | 84 (8.2%) | 53 (6.4%) |
| 15 to 19 Years | 79 (7.7%) | 82 (9.9%) |
| 20 to 24 Years | 51 (5.0%) | 37 (4.4%) |
| 25 to 29 Years | 26 (2.5%) | 7 (0.8%) |
| 30 to 34 Years | 23 (2.2%) | 36 (4.3%) |
| 35 to 39 Years | 38 (3.7%) | 21 (2.5%) |
| 40 to 44 Years | 131 (12.8%) | 99 (11.9%) |
| 45 to 49 Years | 45 (4.4%) | 38 (4.6%) |
| 50 to 54 Years | 35 (3.4%) | 62 (7.4%) |
| 55 to 59 Years | 66 (6.4%) | 66 (7.9%) |
| 60 to 64 Years | 139 (13.5%) | 73 (8.8%) |
| 65 to 69 Years | 76 (7.4%) | 39 (4.7%) |
| 70 to 74 Years | 65 (6.3%) | 80 (9.6%) |
| 75 to 79 Years | 16 (1.6%) | 29 (3.5%) |
| 80 to 84 Years | 32 (3.1%) | 15 (1.8%) |
| 85 Years and over | 19 (1.8%) | 17 (2.0%) |
| Total | 1,027 (100.0%) | 832 (100.0%) |
Families and Households in South Bend
Median Family Size in South Bend
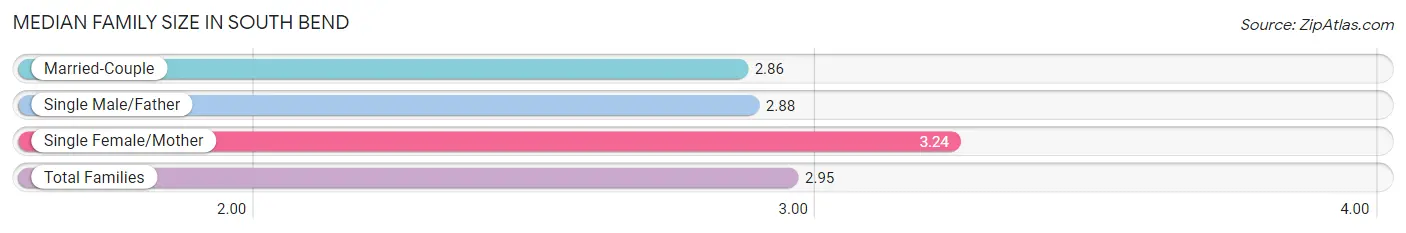
The median family size in South Bend is 2.95 persons per family, with single female/mother families (105 | 23.5%) accounting for the largest median family size of 3.24 persons per family. On the other hand, married-couple families (245 | 54.8%) represent the smallest median family size with 2.86 persons per family.
| Family Type | # Families | Family Size |
| Married-Couple | 245 (54.8%) | 2.86 |
| Single Male/Father | 97 (21.7%) | 2.88 |
| Single Female/Mother | 105 (23.5%) | 3.24 |
| Total Families | 447 (100.0%) | 2.95 |
Median Household Size in South Bend
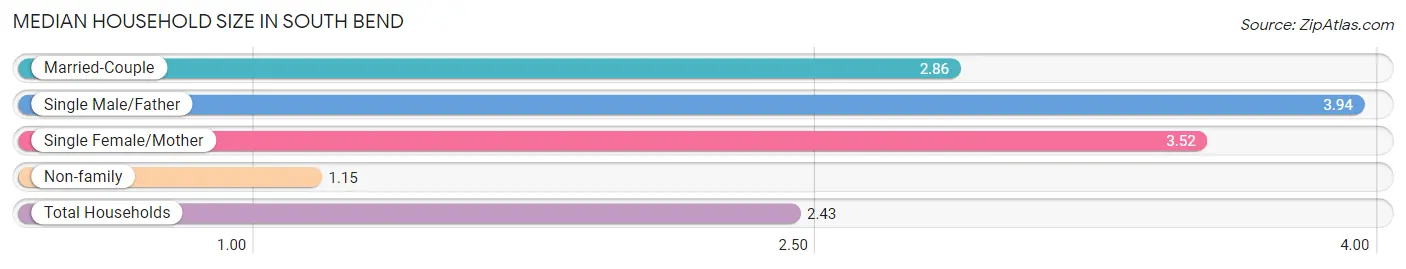
The median household size in South Bend is 2.43 persons per household, with single male/father households (97 | 13.3%) accounting for the largest median household size of 3.94 persons per household. non-family households (284 | 38.9%) represent the smallest median household size with 1.15 persons per household.
| Household Type | # Households | Household Size |
| Married-Couple | 245 (33.5%) | 2.86 |
| Single Male/Father | 97 (13.3%) | 3.94 |
| Single Female/Mother | 105 (14.4%) | 3.52 |
| Non-family | 284 (38.9%) | 1.15 |
| Total Households | 731 (100.0%) | 2.43 |
Household Size by Marriage Status in South Bend
Out of a total of 731 households in South Bend, 447 (61.2%) are family households, while 284 (38.9%) are nonfamily households. The most numerous type of family households are 2-person households, comprising 171, and the most common type of nonfamily households are 1-person households, comprising 255.
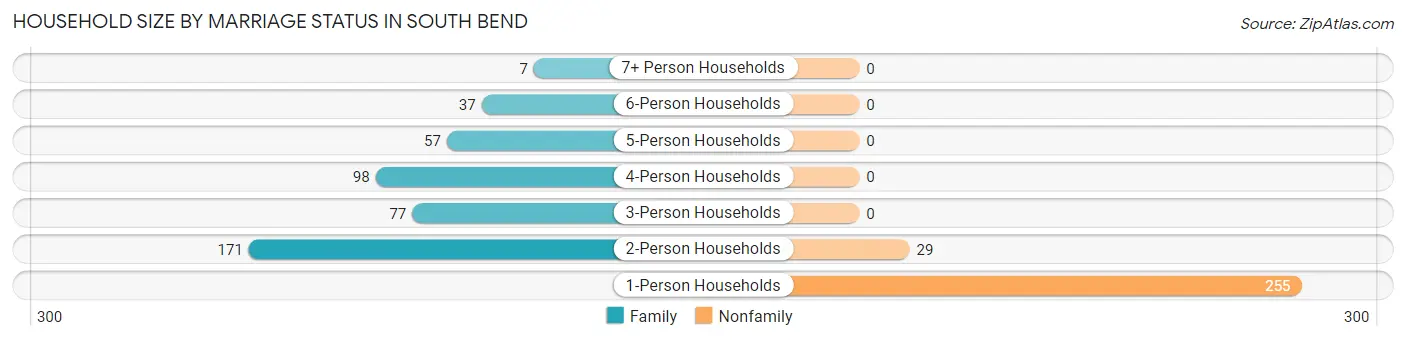
| Household Size | Family Households | Nonfamily Households |
| 1-Person Households | - | 255 (34.9%) |
| 2-Person Households | 171 (23.4%) | 29 (4.0%) |
| 3-Person Households | 77 (10.5%) | 0 (0.0%) |
| 4-Person Households | 98 (13.4%) | 0 (0.0%) |
| 5-Person Households | 57 (7.8%) | 0 (0.0%) |
| 6-Person Households | 37 (5.1%) | 0 (0.0%) |
| 7+ Person Households | 7 (1.0%) | 0 (0.0%) |
| Total | 447 (61.2%) | 284 (38.9%) |
Female Fertility in South Bend
Fertility by Age in South Bend
Average fertility rate in South Bend is 97.0 births per 1,000 women. Women in the age bracket of 20 to 34 years have the highest fertility rate with 388.0 births per 1,000 women. Women in the age bracket of 20 to 34 years acount for 100.0% of all women with births.
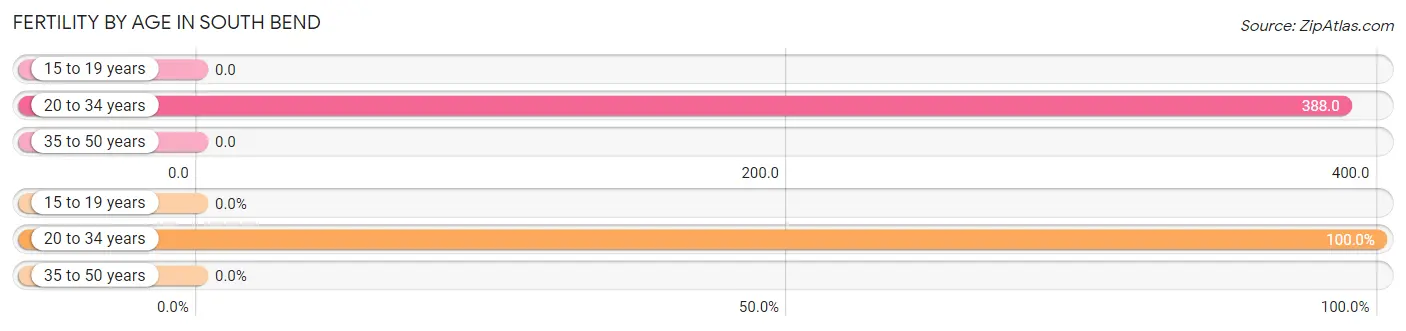
| Age Bracket | Women with Births | Births / 1,000 Women |
| 15 to 19 years | 0 (0.0%) | 0.0 |
| 20 to 34 years | 31 (100.0%) | 388.0 |
| 35 to 50 years | 0 (0.0%) | 0.0 |
| Total | 31 (100.0%) | 97.0 |
Fertility by Age by Marriage Status in South Bend
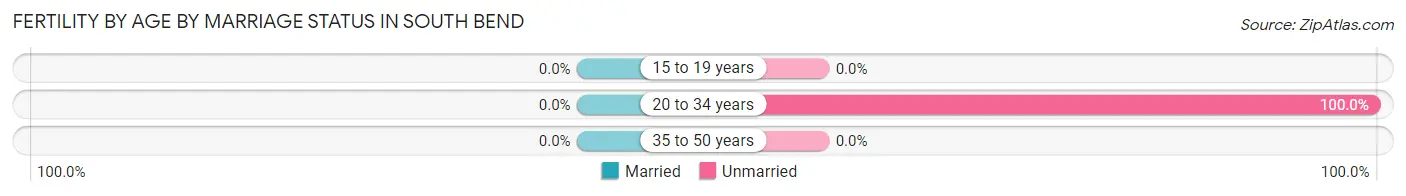
| Age Bracket | Married | Unmarried |
| 15 to 19 years | 0 (0.0%) | 0 (0.0%) |
| 20 to 34 years | 0 (0.0%) | 31 (100.0%) |
| 35 to 50 years | 0 (0.0%) | 0 (0.0%) |
| Total | 0 (0.0%) | 31 (100.0%) |
Fertility by Education in South Bend
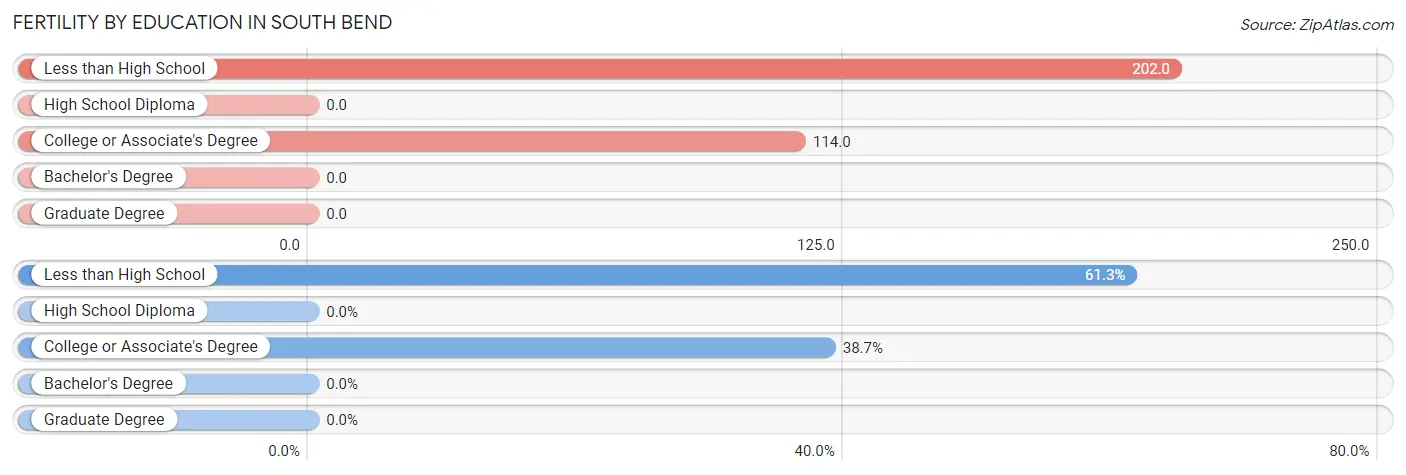
| Educational Attainment | Women with Births | Births / 1,000 Women |
| Less than High School | 19 (61.3%) | 202.0 |
| High School Diploma | 0 (0.0%) | 0.0 |
| College or Associate's Degree | 12 (38.7%) | 114.0 |
| Bachelor's Degree | 0 (0.0%) | 0.0 |
| Graduate Degree | 0 (0.0%) | 0.0 |
| Total | 31 (100.0%) | 97.0 |
Fertility by Education by Marriage Status in South Bend
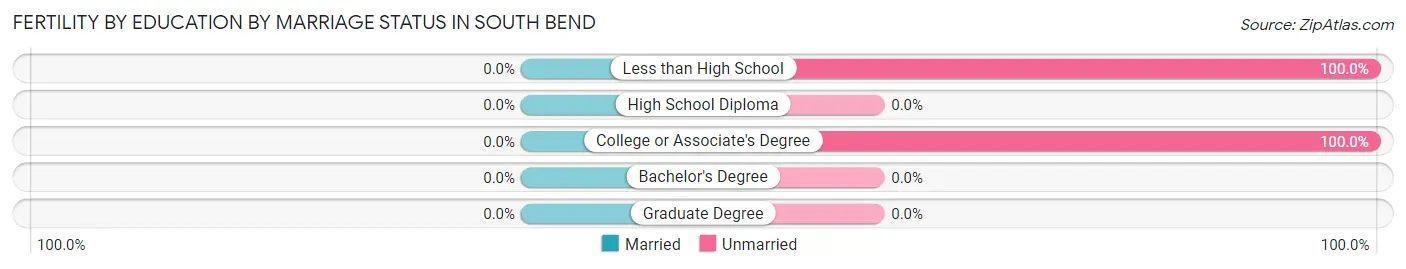
| Educational Attainment | Married | Unmarried |
| Less than High School | 0 (0.0%) | 19 (100.0%) |
| High School Diploma | 0 (0.0%) | 0 (0.0%) |
| College or Associate's Degree | 0 (0.0%) | 12 (100.0%) |
| Bachelor's Degree | 0 (0.0%) | 0 (0.0%) |
| Graduate Degree | 0 (0.0%) | 0 (0.0%) |
| Total | 0 (0.0%) | 31 (100.0%) |
Employment Characteristics in South Bend
Employment by Class of Employer in South Bend
Among the 588 employed individuals in South Bend, private company employees (358 | 60.9%), local government employees (87 | 14.8%), and state government employees (53 | 9.0%) make up the most common classes of employment.
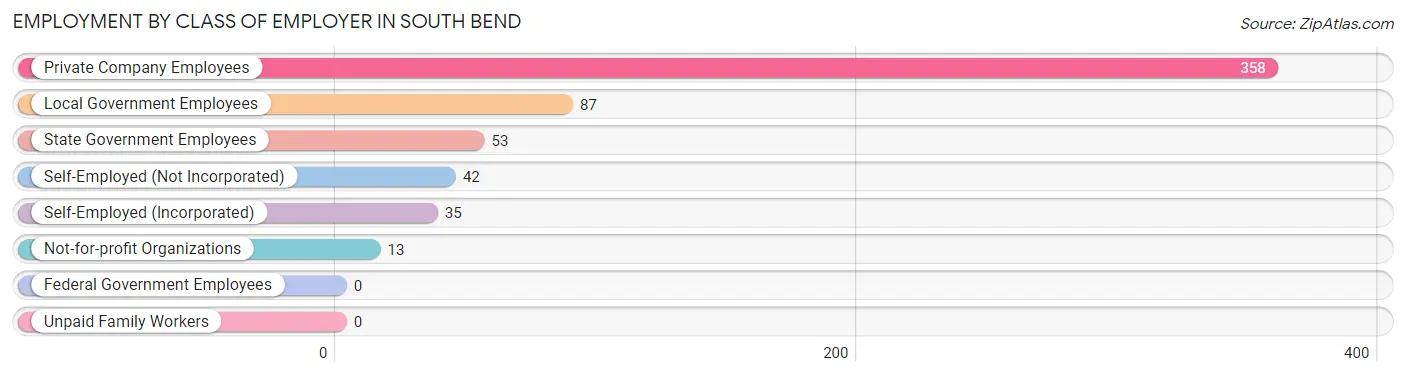
| Employer Class | # Employees | % Employees |
| Private Company Employees | 358 | 60.9% |
| Self-Employed (Incorporated) | 35 | 5.9% |
| Self-Employed (Not Incorporated) | 42 | 7.1% |
| Not-for-profit Organizations | 13 | 2.2% |
| Local Government Employees | 87 | 14.8% |
| State Government Employees | 53 | 9.0% |
| Federal Government Employees | 0 | 0.0% |
| Unpaid Family Workers | 0 | 0.0% |
| Total | 588 | 100.0% |
Employment Status by Age in South Bend
According to the labor force statistics for South Bend, out of the total population over 16 years of age (1,504), 44.0% or 662 individuals are in the labor force, with 1.2% or 8 of them unemployed. The age group with the highest labor force participation rate is 25 to 29 years, with 78.8% or 26 individuals in the labor force. Within the labor force, the 45 to 54 years age range has the highest percentage of unemployed individuals, with 7.0% or 8 of them being unemployed.
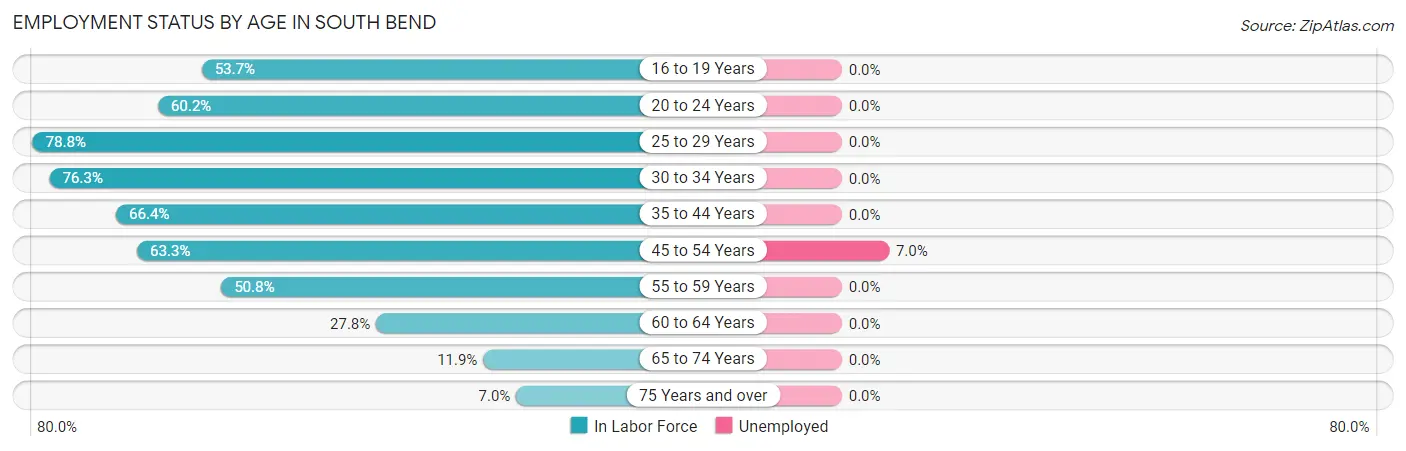
| Age Bracket | In Labor Force | Unemployed |
| 16 to 19 Years | 66 (53.7%) | 0 (0.0%) |
| 20 to 24 Years | 53 (60.2%) | 0 (0.0%) |
| 25 to 29 Years | 26 (78.8%) | 0 (0.0%) |
| 30 to 34 Years | 45 (76.3%) | 0 (0.0%) |
| 35 to 44 Years | 192 (66.4%) | 0 (0.0%) |
| 45 to 54 Years | 114 (63.3%) | 8 (7.0%) |
| 55 to 59 Years | 67 (50.8%) | 0 (0.0%) |
| 60 to 64 Years | 59 (27.8%) | 0 (0.0%) |
| 65 to 74 Years | 31 (11.9%) | 0 (0.0%) |
| 75 Years and over | 9 (7.0%) | 0 (0.0%) |
| Total | 662 (44.0%) | 8 (1.2%) |
Employment Status by Educational Attainment in South Bend
According to labor force statistics for South Bend, 55.6% of individuals (503) out of the total population between 25 and 64 years of age (905) are in the labor force, with 1.6% or 8 of them being unemployed. The group with the highest labor force participation rate are those with the educational attainment of high school diploma, with 66.2% or 196 individuals in the labor force. Within the labor force, individuals with high school diploma education have the highest percentage of unemployment, with 4.1% or 8 of them being unemployed.
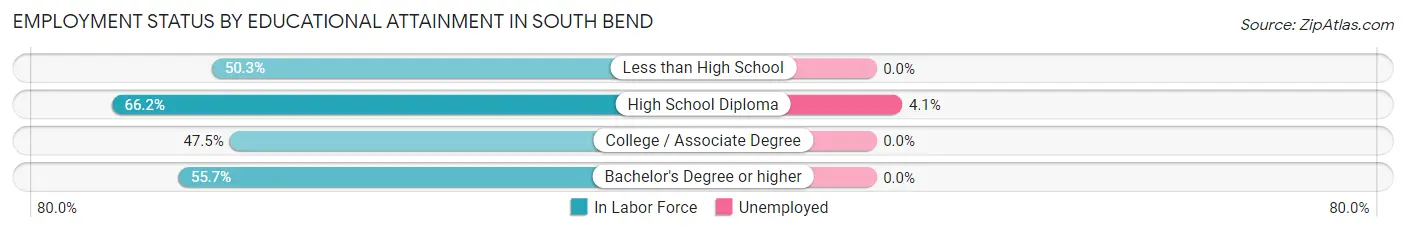
| Educational Attainment | In Labor Force | Unemployed |
| Less than High School | 88 (50.3%) | 0 (0.0%) |
| High School Diploma | 196 (66.2%) | 12 (4.1%) |
| College / Associate Degree | 131 (47.5%) | 0 (0.0%) |
| Bachelor's Degree or higher | 88 (55.7%) | 0 (0.0%) |
| Total | 503 (55.6%) | 14 (1.6%) |
Employment Occupations by Sex in South Bend
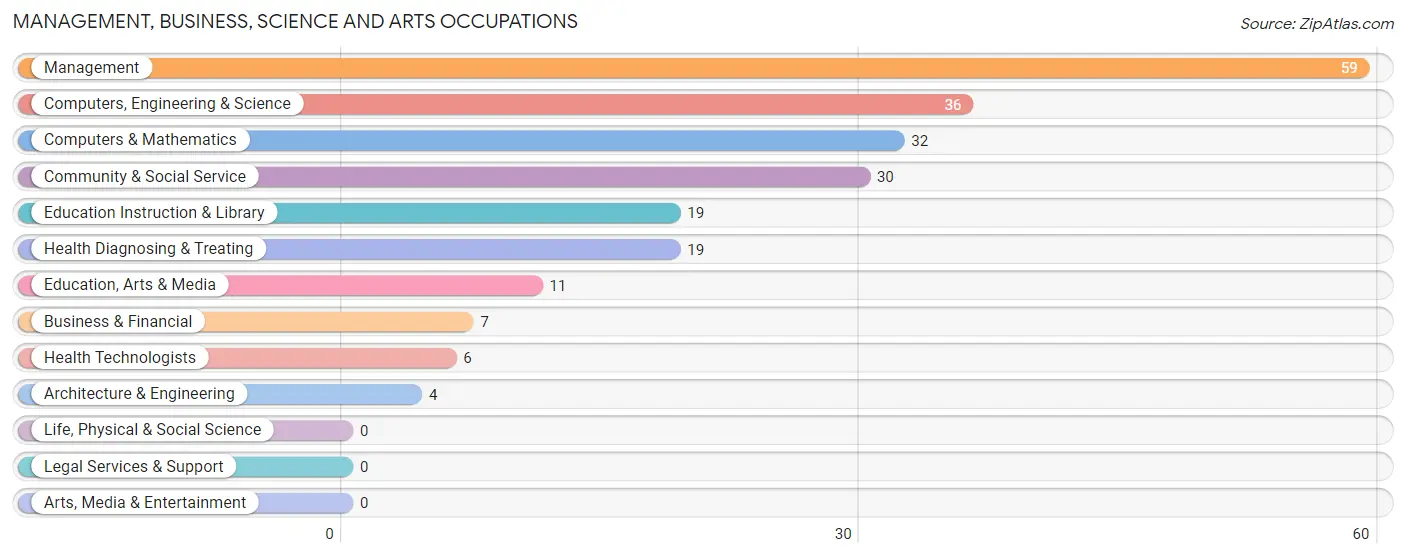
Management, Business, Science and Arts Occupations
The most common Management, Business, Science and Arts occupations in South Bend are Management (59 | 9.0%), Computers, Engineering & Science (36 | 5.5%), Computers & Mathematics (32 | 4.9%), Community & Social Service (30 | 4.6%), and Education Instruction & Library (19 | 2.9%).
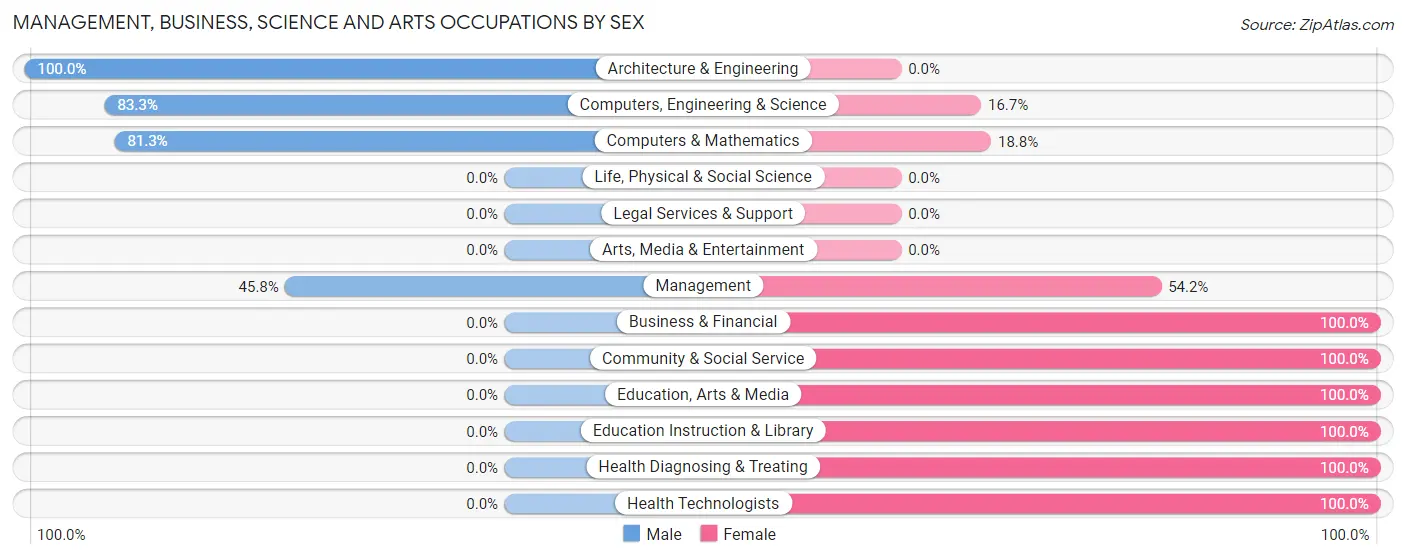
Management, Business, Science and Arts Occupations by Sex
Within the Management, Business, Science and Arts occupations in South Bend, the most male-oriented occupations are Architecture & Engineering (100.0%), Computers, Engineering & Science (83.3%), and Computers & Mathematics (81.2%), while the most female-oriented occupations are Business & Financial (100.0%), Community & Social Service (100.0%), and Education, Arts & Media (100.0%).
| Occupation | Male | Female |
| Management | 27 (45.8%) | 32 (54.2%) |
| Business & Financial | 0 (0.0%) | 7 (100.0%) |
| Computers, Engineering & Science | 30 (83.3%) | 6 (16.7%) |
| Computers & Mathematics | 26 (81.2%) | 6 (18.8%) |
| Architecture & Engineering | 4 (100.0%) | 0 (0.0%) |
| Life, Physical & Social Science | 0 (0.0%) | 0 (0.0%) |
| Community & Social Service | 0 (0.0%) | 30 (100.0%) |
| Education, Arts & Media | 0 (0.0%) | 11 (100.0%) |
| Legal Services & Support | 0 (0.0%) | 0 (0.0%) |
| Education Instruction & Library | 0 (0.0%) | 19 (100.0%) |
| Arts, Media & Entertainment | 0 (0.0%) | 0 (0.0%) |
| Health Diagnosing & Treating | 0 (0.0%) | 19 (100.0%) |
| Health Technologists | 0 (0.0%) | 6 (100.0%) |
| Total (Category) | 57 (37.8%) | 94 (62.3%) |
| Total (Overall) | 391 (59.8%) | 263 (40.2%) |
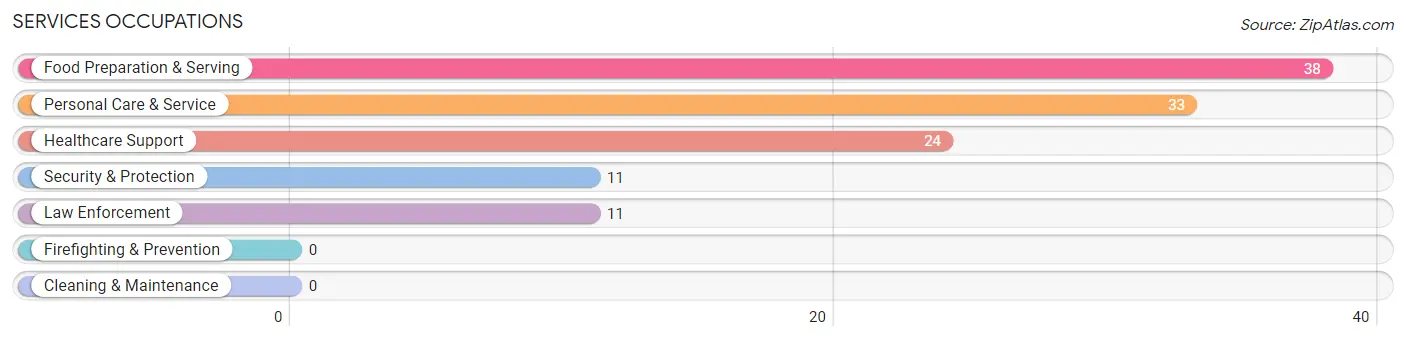
Services Occupations
The most common Services occupations in South Bend are Food Preparation & Serving (38 | 5.8%), Personal Care & Service (33 | 5.1%), Healthcare Support (24 | 3.7%), Security & Protection (11 | 1.7%), and Law Enforcement (11 | 1.7%).
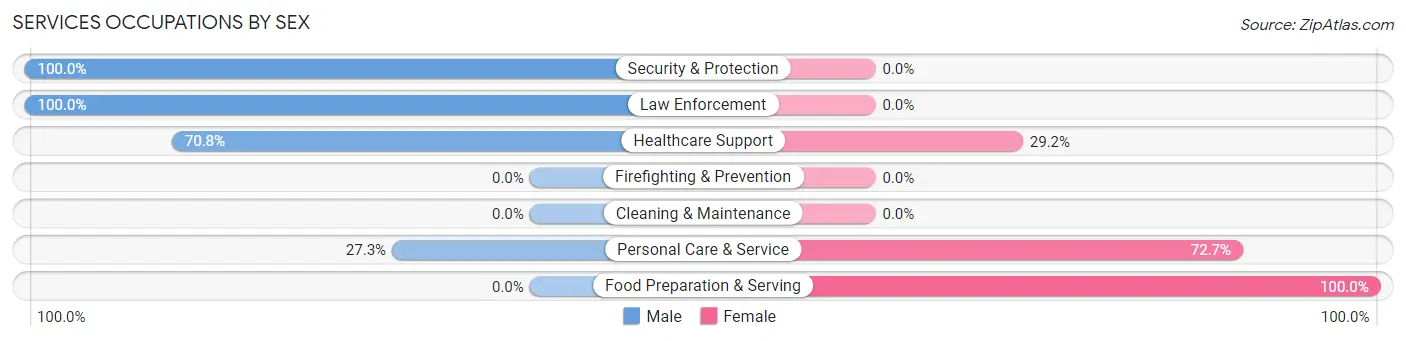
Services Occupations by Sex
Within the Services occupations in South Bend, the most male-oriented occupations are Security & Protection (100.0%), Law Enforcement (100.0%), and Healthcare Support (70.8%), while the most female-oriented occupations are Food Preparation & Serving (100.0%), Personal Care & Service (72.7%), and Healthcare Support (29.2%).
| Occupation | Male | Female |
| Healthcare Support | 17 (70.8%) | 7 (29.2%) |
| Security & Protection | 11 (100.0%) | 0 (0.0%) |
| Firefighting & Prevention | 0 (0.0%) | 0 (0.0%) |
| Law Enforcement | 11 (100.0%) | 0 (0.0%) |
| Food Preparation & Serving | 0 (0.0%) | 38 (100.0%) |
| Cleaning & Maintenance | 0 (0.0%) | 0 (0.0%) |
| Personal Care & Service | 9 (27.3%) | 24 (72.7%) |
| Total (Category) | 37 (34.9%) | 69 (65.1%) |
| Total (Overall) | 391 (59.8%) | 263 (40.2%) |
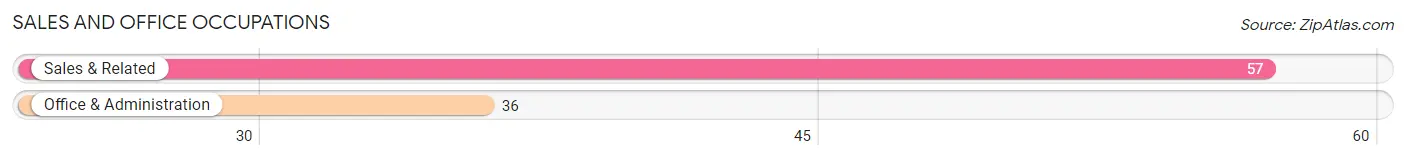
Sales and Office Occupations
The most common Sales and Office occupations in South Bend are Sales & Related (57 | 8.7%), and Office & Administration (36 | 5.5%).
Sales and Office Occupations by Sex
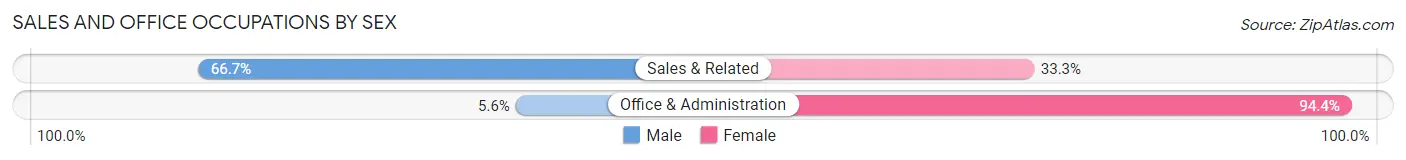
| Occupation | Male | Female |
| Sales & Related | 38 (66.7%) | 19 (33.3%) |
| Office & Administration | 2 (5.6%) | 34 (94.4%) |
| Total (Category) | 40 (43.0%) | 53 (57.0%) |
| Total (Overall) | 391 (59.8%) | 263 (40.2%) |
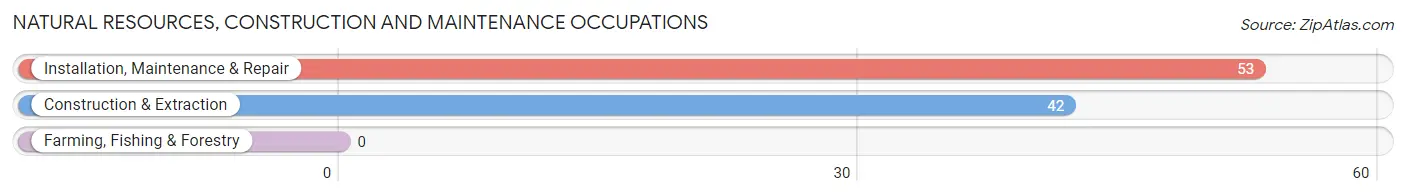
Natural Resources, Construction and Maintenance Occupations
The most common Natural Resources, Construction and Maintenance occupations in South Bend are Installation, Maintenance & Repair (53 | 8.1%), and Construction & Extraction (42 | 6.4%).
Natural Resources, Construction and Maintenance Occupations by Sex
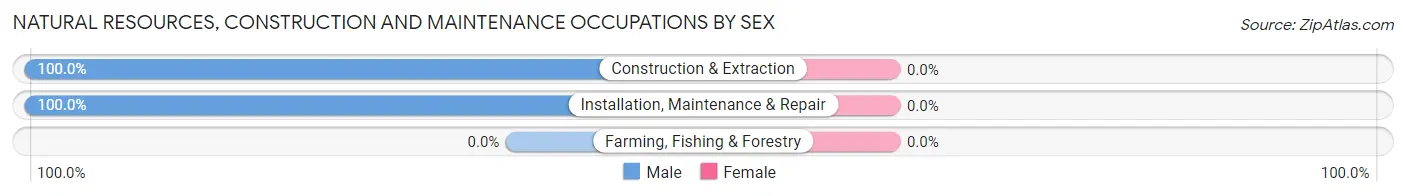
| Occupation | Male | Female |
| Farming, Fishing & Forestry | 0 (0.0%) | 0 (0.0%) |
| Construction & Extraction | 42 (100.0%) | 0 (0.0%) |
| Installation, Maintenance & Repair | 53 (100.0%) | 0 (0.0%) |
| Total (Category) | 95 (100.0%) | 0 (0.0%) |
| Total (Overall) | 391 (59.8%) | 263 (40.2%) |
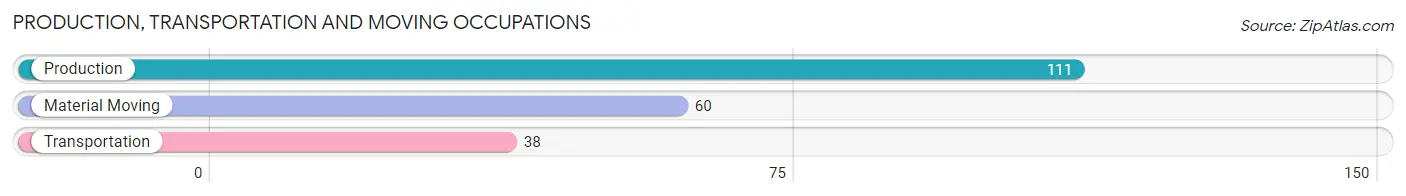
Production, Transportation and Moving Occupations
The most common Production, Transportation and Moving occupations in South Bend are Production (111 | 17.0%), Material Moving (60 | 9.2%), and Transportation (38 | 5.8%).
Production, Transportation and Moving Occupations by Sex
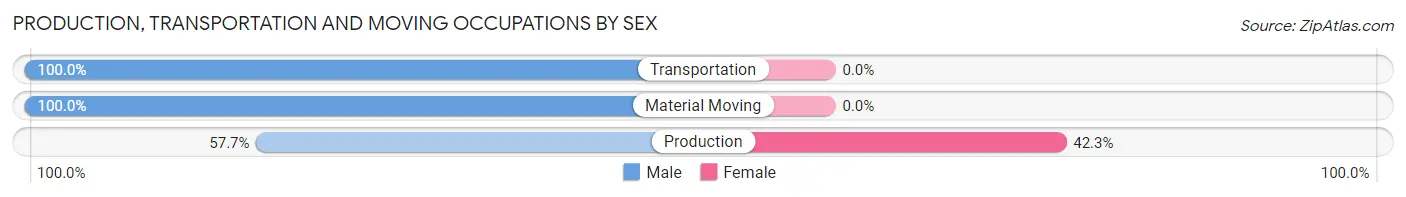
| Occupation | Male | Female |
| Production | 64 (57.7%) | 47 (42.3%) |
| Transportation | 38 (100.0%) | 0 (0.0%) |
| Material Moving | 60 (100.0%) | 0 (0.0%) |
| Total (Category) | 162 (77.5%) | 47 (22.5%) |
| Total (Overall) | 391 (59.8%) | 263 (40.2%) |
Employment Industries by Sex in South Bend
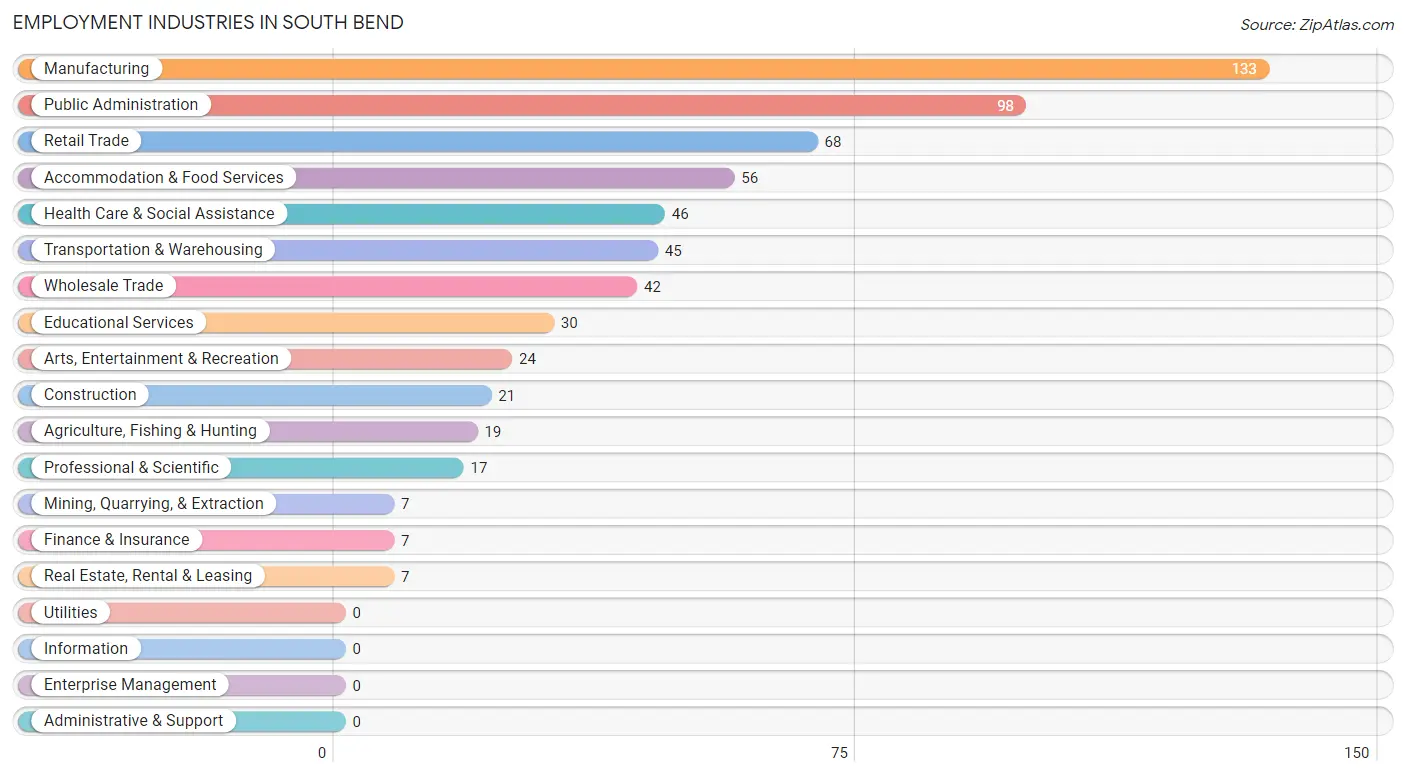
Employment Industries in South Bend
The major employment industries in South Bend include Manufacturing (133 | 20.3%), Public Administration (98 | 15.0%), Retail Trade (68 | 10.4%), Accommodation & Food Services (56 | 8.6%), and Health Care & Social Assistance (46 | 7.0%).
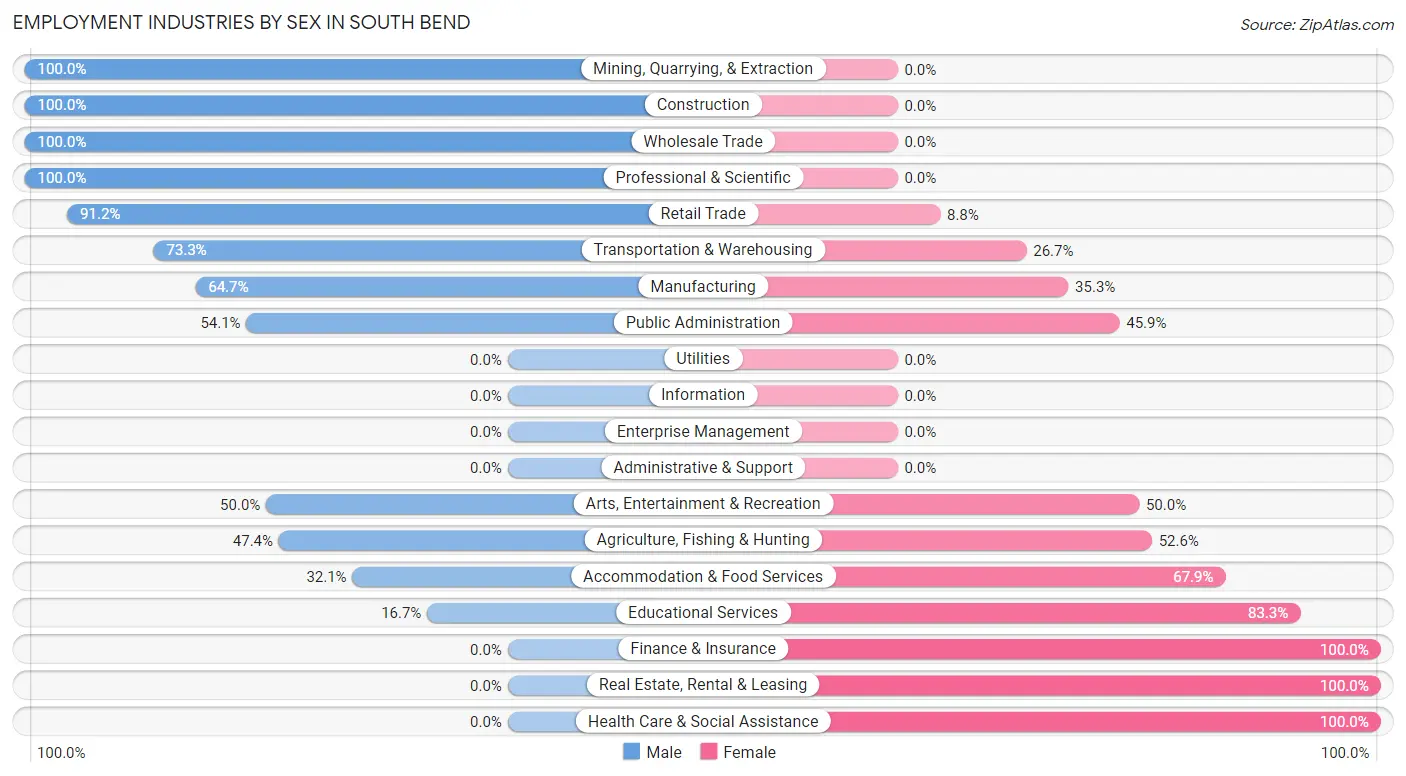
Employment Industries by Sex in South Bend
The South Bend industries that see more men than women are Mining, Quarrying, & Extraction (100.0%), Construction (100.0%), and Wholesale Trade (100.0%), whereas the industries that tend to have a higher number of women are Finance & Insurance (100.0%), Real Estate, Rental & Leasing (100.0%), and Health Care & Social Assistance (100.0%).
| Industry | Male | Female |
| Agriculture, Fishing & Hunting | 9 (47.4%) | 10 (52.6%) |
| Mining, Quarrying, & Extraction | 7 (100.0%) | 0 (0.0%) |
| Construction | 21 (100.0%) | 0 (0.0%) |
| Manufacturing | 86 (64.7%) | 47 (35.3%) |
| Wholesale Trade | 42 (100.0%) | 0 (0.0%) |
| Retail Trade | 62 (91.2%) | 6 (8.8%) |
| Transportation & Warehousing | 33 (73.3%) | 12 (26.7%) |
| Utilities | 0 (0.0%) | 0 (0.0%) |
| Information | 0 (0.0%) | 0 (0.0%) |
| Finance & Insurance | 0 (0.0%) | 7 (100.0%) |
| Real Estate, Rental & Leasing | 0 (0.0%) | 7 (100.0%) |
| Professional & Scientific | 17 (100.0%) | 0 (0.0%) |
| Enterprise Management | 0 (0.0%) | 0 (0.0%) |
| Administrative & Support | 0 (0.0%) | 0 (0.0%) |
| Educational Services | 5 (16.7%) | 25 (83.3%) |
| Health Care & Social Assistance | 0 (0.0%) | 46 (100.0%) |
| Arts, Entertainment & Recreation | 12 (50.0%) | 12 (50.0%) |
| Accommodation & Food Services | 18 (32.1%) | 38 (67.9%) |
| Public Administration | 53 (54.1%) | 45 (45.9%) |
| Total | 391 (59.8%) | 263 (40.2%) |
Education in South Bend
School Enrollment in South Bend
The most common levels of schooling among the 381 students in South Bend are middle school (111 | 29.1%), elementary school (104 | 27.3%), and high school (92 | 24.1%).
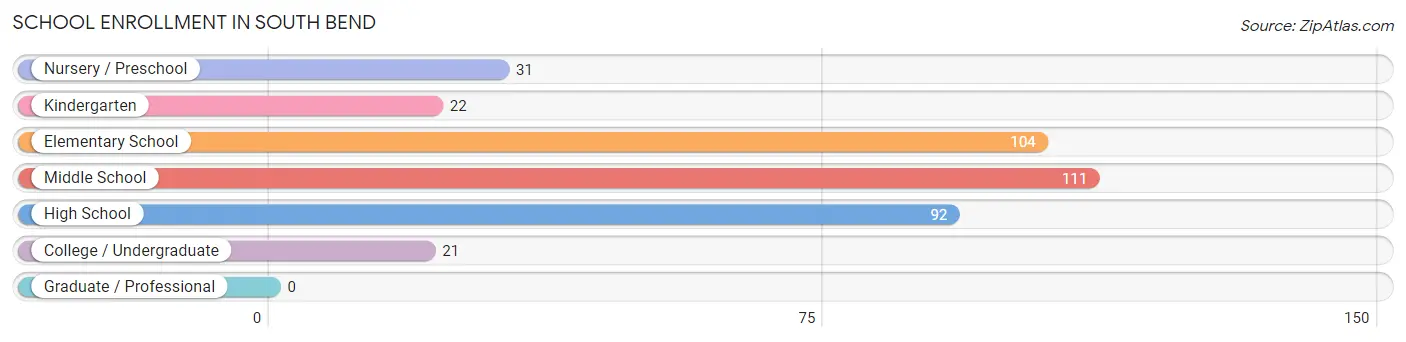
| School Level | # Students | % Students |
| Nursery / Preschool | 31 | 8.1% |
| Kindergarten | 22 | 5.8% |
| Elementary School | 104 | 27.3% |
| Middle School | 111 | 29.1% |
| High School | 92 | 24.1% |
| College / Undergraduate | 21 | 5.5% |
| Graduate / Professional | 0 | 0.0% |
| Total | 381 | 100.0% |
School Enrollment by Age by Funding Source in South Bend
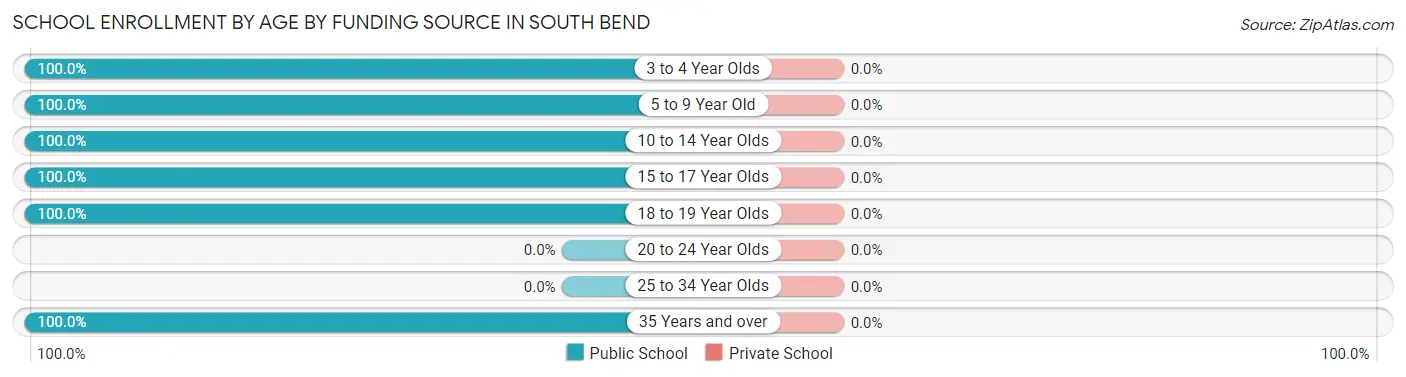
| Age Bracket | Public School | Private School |
| 3 to 4 Year Olds | 38 (100.0%) | 0 (0.0%) |
| 5 to 9 Year Old | 101 (100.0%) | 0 (0.0%) |
| 10 to 14 Year Olds | 131 (100.0%) | 0 (0.0%) |
| 15 to 17 Year Olds | 90 (100.0%) | 0 (0.0%) |
| 18 to 19 Year Olds | 11 (100.0%) | 0 (0.0%) |
| 20 to 24 Year Olds | 0 (0.0%) | 0 (0.0%) |
| 25 to 34 Year Olds | 0 (0.0%) | 0 (0.0%) |
| 35 Years and over | 10 (100.0%) | 0 (0.0%) |
| Total | 381 (100.0%) | 0 (0.0%) |
Educational Attainment by Field of Study in South Bend
Education (72 | 31.4%), business (48 | 21.0%), arts & humanities (35 | 15.3%), computers & mathematics (22 | 9.6%), and communications (16 | 7.0%) are the most common fields of study among 229 individuals in South Bend who have obtained a bachelor's degree or higher.
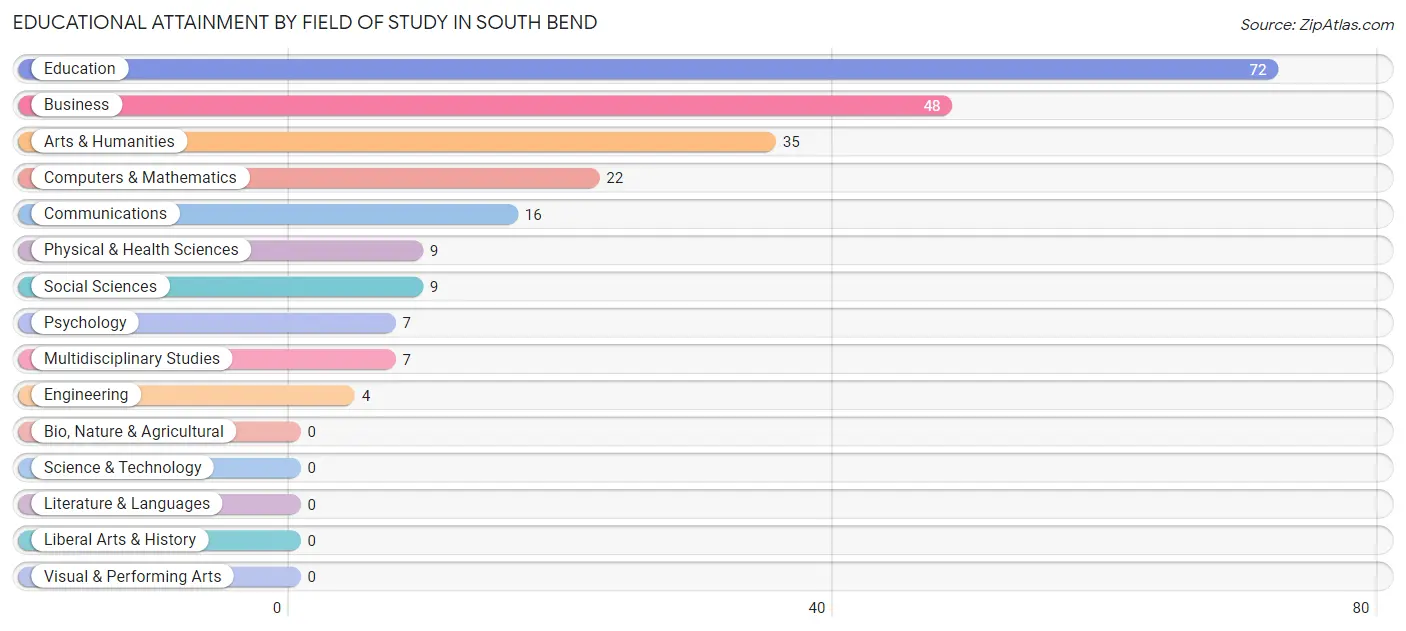
| Field of Study | # Graduates | % Graduates |
| Computers & Mathematics | 22 | 9.6% |
| Bio, Nature & Agricultural | 0 | 0.0% |
| Physical & Health Sciences | 9 | 3.9% |
| Psychology | 7 | 3.1% |
| Social Sciences | 9 | 3.9% |
| Engineering | 4 | 1.8% |
| Multidisciplinary Studies | 7 | 3.1% |
| Science & Technology | 0 | 0.0% |
| Business | 48 | 21.0% |
| Education | 72 | 31.4% |
| Literature & Languages | 0 | 0.0% |
| Liberal Arts & History | 0 | 0.0% |
| Visual & Performing Arts | 0 | 0.0% |
| Communications | 16 | 7.0% |
| Arts & Humanities | 35 | 15.3% |
| Total | 229 | 100.0% |
Transportation & Commute in South Bend
Vehicle Availability by Sex in South Bend
The most prevalent vehicle ownership categories in South Bend are males with 4 vehicles (128, accounting for 36.9%) and females with 4 vehicles (64, making up 57.1%).
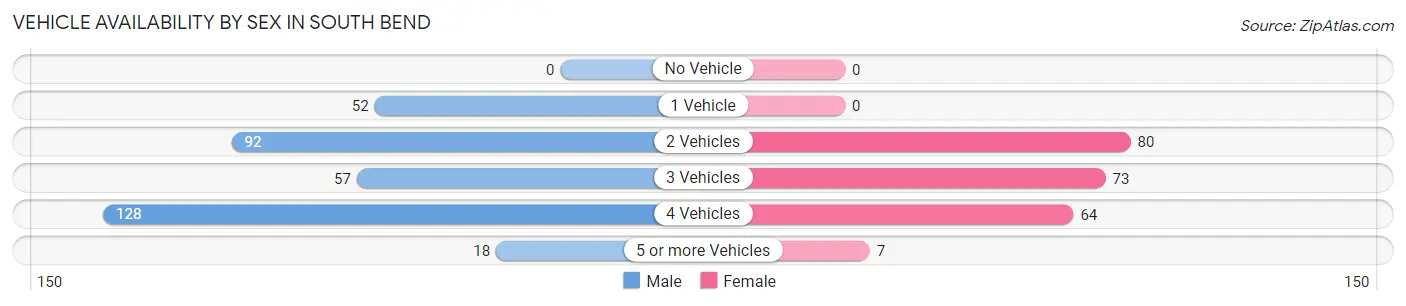
| Vehicles Available | Male | Female |
| No Vehicle | 0 (0.0%) | 0 (0.0%) |
| 1 Vehicle | 52 (15.0%) | 0 (0.0%) |
| 2 Vehicles | 92 (26.5%) | 80 (35.7%) |
| 3 Vehicles | 57 (16.4%) | 73 (32.6%) |
| 4 Vehicles | 128 (36.9%) | 64 (28.6%) |
| 5 or more Vehicles | 18 (5.2%) | 7 (3.1%) |
| Total | 347 (100.0%) | 224 (100.0%) |
Commute Time in South Bend
The most frequently occuring commute durations in South Bend are 5 to 9 minutes (171 commuters, 32.7%), 45 to 59 minutes (115 commuters, 22.0%), and less than 5 minutes (67 commuters, 12.8%).
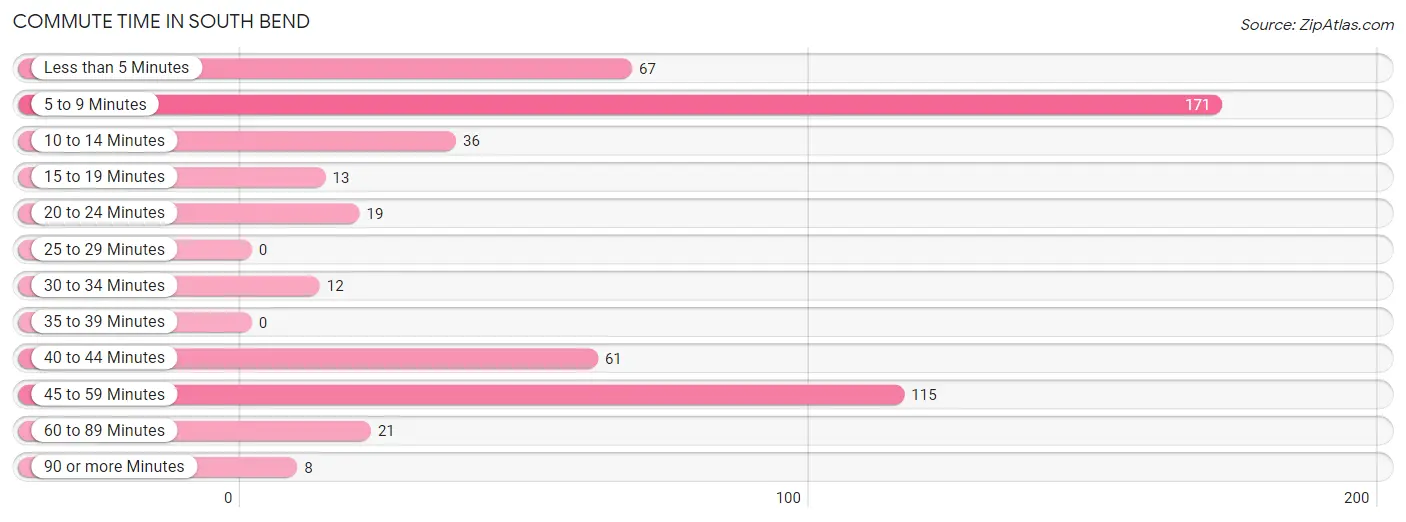
| Commute Time | # Commuters | % Commuters |
| Less than 5 Minutes | 67 | 12.8% |
| 5 to 9 Minutes | 171 | 32.7% |
| 10 to 14 Minutes | 36 | 6.9% |
| 15 to 19 Minutes | 13 | 2.5% |
| 20 to 24 Minutes | 19 | 3.6% |
| 25 to 29 Minutes | 0 | 0.0% |
| 30 to 34 Minutes | 12 | 2.3% |
| 35 to 39 Minutes | 0 | 0.0% |
| 40 to 44 Minutes | 61 | 11.7% |
| 45 to 59 Minutes | 115 | 22.0% |
| 60 to 89 Minutes | 21 | 4.0% |
| 90 or more Minutes | 8 | 1.5% |
Commute Time by Sex in South Bend
The most common commute times in South Bend are 45 to 59 minutes (93 commuters, 27.8%) for males and 5 to 9 minutes (79 commuters, 41.8%) for females.
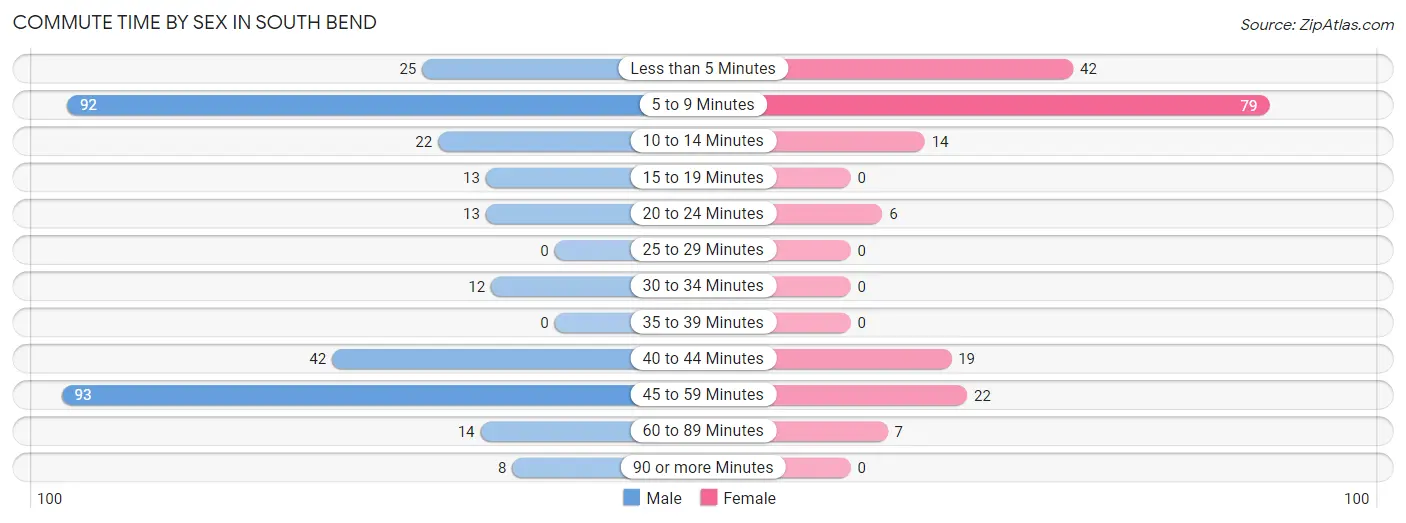
| Commute Time | Male | Female |
| Less than 5 Minutes | 25 (7.5%) | 42 (22.2%) |
| 5 to 9 Minutes | 92 (27.5%) | 79 (41.8%) |
| 10 to 14 Minutes | 22 (6.6%) | 14 (7.4%) |
| 15 to 19 Minutes | 13 (3.9%) | 0 (0.0%) |
| 20 to 24 Minutes | 13 (3.9%) | 6 (3.2%) |
| 25 to 29 Minutes | 0 (0.0%) | 0 (0.0%) |
| 30 to 34 Minutes | 12 (3.6%) | 0 (0.0%) |
| 35 to 39 Minutes | 0 (0.0%) | 0 (0.0%) |
| 40 to 44 Minutes | 42 (12.6%) | 19 (10.1%) |
| 45 to 59 Minutes | 93 (27.8%) | 22 (11.6%) |
| 60 to 89 Minutes | 14 (4.2%) | 7 (3.7%) |
| 90 or more Minutes | 8 (2.4%) | 0 (0.0%) |
Time of Departure to Work by Sex in South Bend
The most frequent times of departure to work in South Bend are 5:00 AM to 5:29 AM (71, 21.3%) for males and 7:00 AM to 7:29 AM (39, 20.6%) for females.
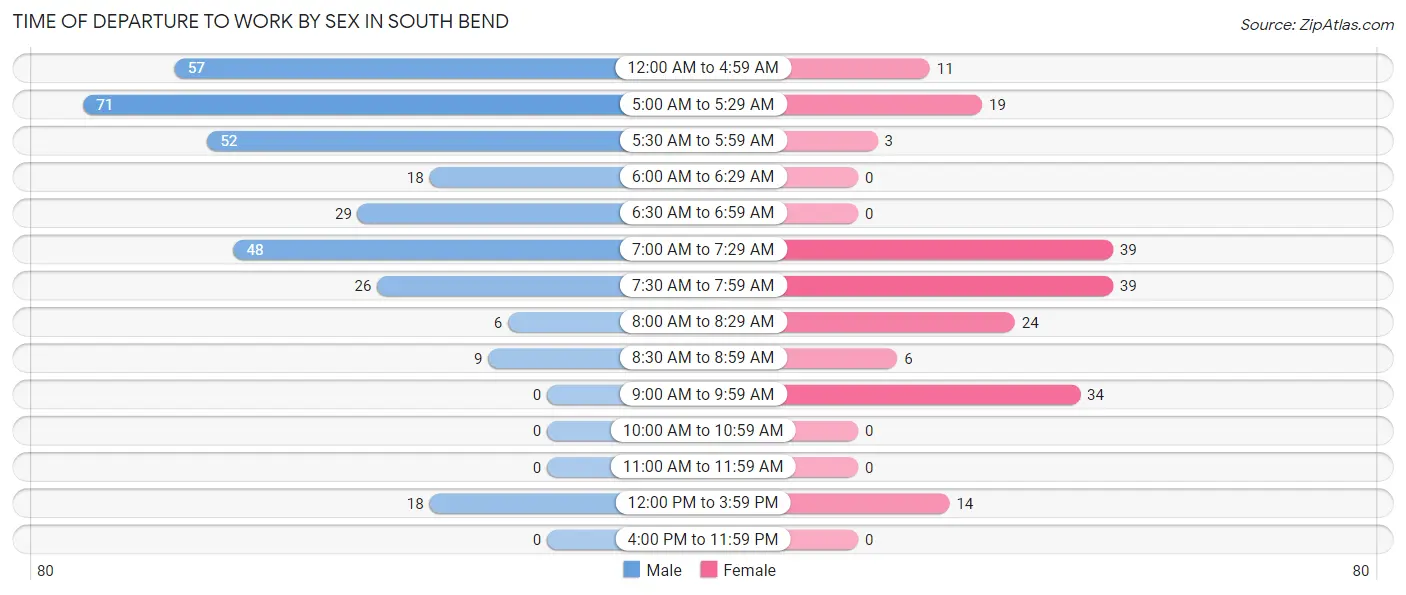
| Time of Departure | Male | Female |
| 12:00 AM to 4:59 AM | 57 (17.1%) | 11 (5.8%) |
| 5:00 AM to 5:29 AM | 71 (21.3%) | 19 (10.1%) |
| 5:30 AM to 5:59 AM | 52 (15.6%) | 3 (1.6%) |
| 6:00 AM to 6:29 AM | 18 (5.4%) | 0 (0.0%) |
| 6:30 AM to 6:59 AM | 29 (8.7%) | 0 (0.0%) |
| 7:00 AM to 7:29 AM | 48 (14.4%) | 39 (20.6%) |
| 7:30 AM to 7:59 AM | 26 (7.8%) | 39 (20.6%) |
| 8:00 AM to 8:29 AM | 6 (1.8%) | 24 (12.7%) |
| 8:30 AM to 8:59 AM | 9 (2.7%) | 6 (3.2%) |
| 9:00 AM to 9:59 AM | 0 (0.0%) | 34 (18.0%) |
| 10:00 AM to 10:59 AM | 0 (0.0%) | 0 (0.0%) |
| 11:00 AM to 11:59 AM | 0 (0.0%) | 0 (0.0%) |
| 12:00 PM to 3:59 PM | 18 (5.4%) | 14 (7.4%) |
| 4:00 PM to 11:59 PM | 0 (0.0%) | 0 (0.0%) |
| Total | 334 (100.0%) | 189 (100.0%) |
Housing Occupancy in South Bend
Occupancy by Ownership in South Bend
Of the total 731 dwellings in South Bend, owner-occupied units account for 437 (59.8%), while renter-occupied units make up 294 (40.2%).
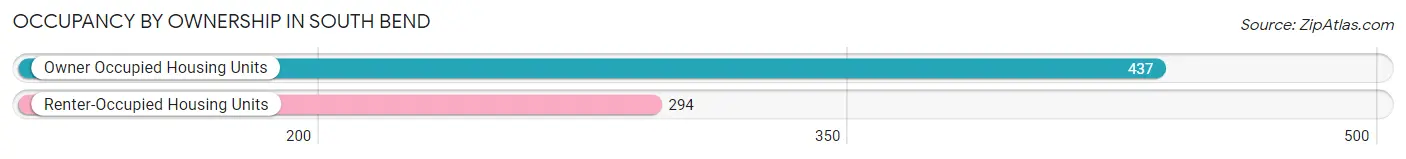
| Occupancy | # Housing Units | % Housing Units |
| Owner Occupied Housing Units | 437 | 59.8% |
| Renter-Occupied Housing Units | 294 | 40.2% |
| Total Occupied Housing Units | 731 | 100.0% |
Occupancy by Household Size in South Bend
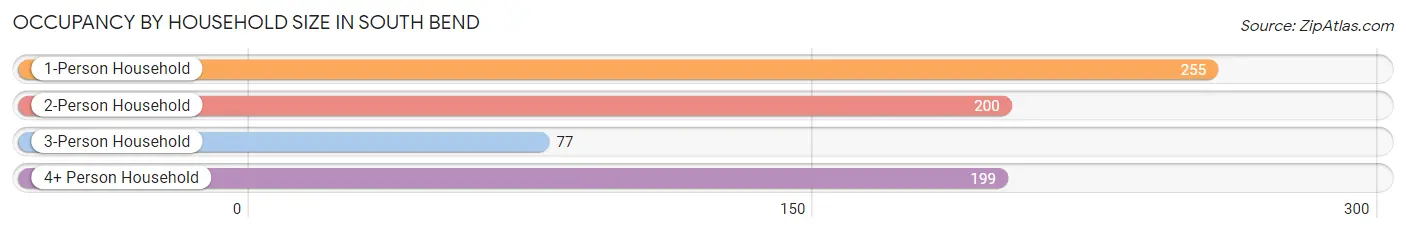
| Household Size | # Housing Units | % Housing Units |
| 1-Person Household | 255 | 34.9% |
| 2-Person Household | 200 | 27.4% |
| 3-Person Household | 77 | 10.5% |
| 4+ Person Household | 199 | 27.2% |
| Total Housing Units | 731 | 100.0% |
Occupancy by Ownership by Household Size in South Bend
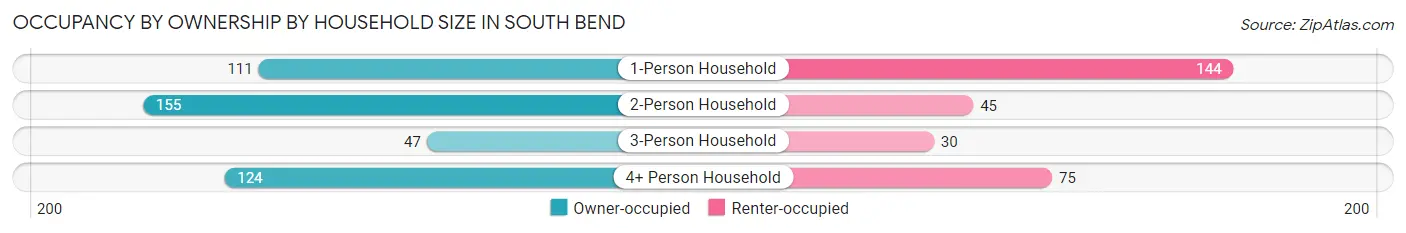
| Household Size | Owner-occupied | Renter-occupied |
| 1-Person Household | 111 (43.5%) | 144 (56.5%) |
| 2-Person Household | 155 (77.5%) | 45 (22.5%) |
| 3-Person Household | 47 (61.0%) | 30 (39.0%) |
| 4+ Person Household | 124 (62.3%) | 75 (37.7%) |
| Total Housing Units | 437 (59.8%) | 294 (40.2%) |
Occupancy by Educational Attainment in South Bend
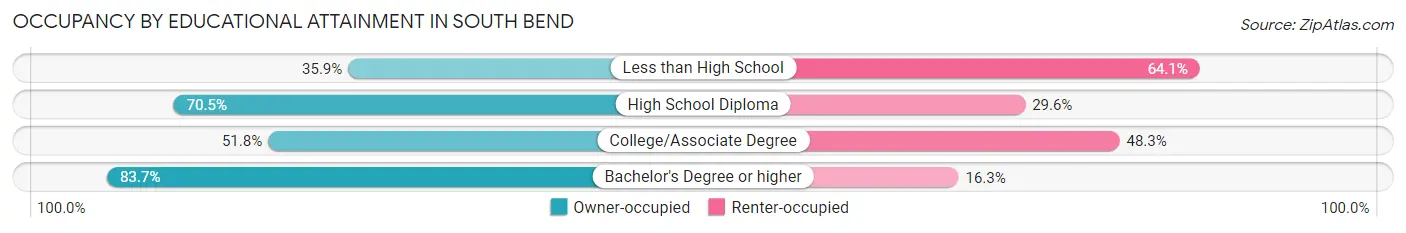
| Household Size | Owner-occupied | Renter-occupied |
| Less than High School | 52 (35.9%) | 93 (64.1%) |
| High School Diploma | 124 (70.5%) | 52 (29.5%) |
| College/Associate Degree | 133 (51.7%) | 124 (48.2%) |
| Bachelor's Degree or higher | 128 (83.7%) | 25 (16.3%) |
Occupancy by Age of Householder in South Bend
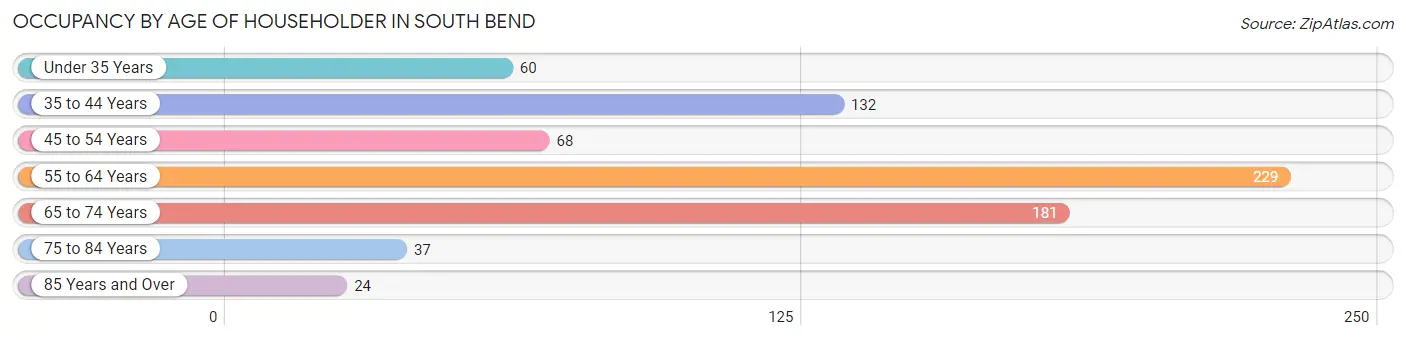
| Age Bracket | # Households | % Households |
| Under 35 Years | 60 | 8.2% |
| 35 to 44 Years | 132 | 18.1% |
| 45 to 54 Years | 68 | 9.3% |
| 55 to 64 Years | 229 | 31.3% |
| 65 to 74 Years | 181 | 24.8% |
| 75 to 84 Years | 37 | 5.1% |
| 85 Years and Over | 24 | 3.3% |
| Total | 731 | 100.0% |
Housing Finances in South Bend
Median Income by Occupancy in South Bend
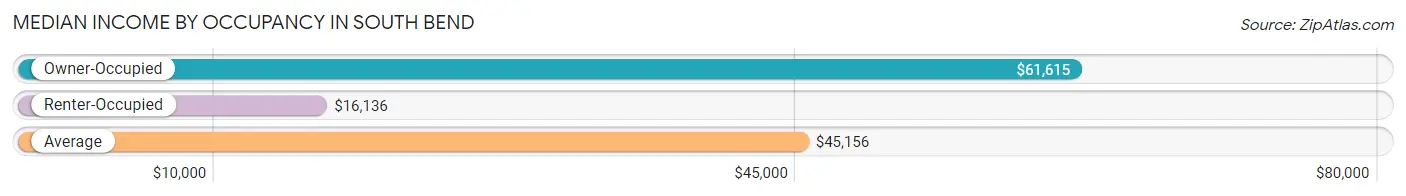
| Occupancy Type | # Households | Median Income |
| Owner-Occupied | 437 (59.8%) | $61,615 |
| Renter-Occupied | 294 (40.2%) | $16,136 |
| Average | 731 (100.0%) | $45,156 |
Occupancy by Householder Income Bracket in South Bend
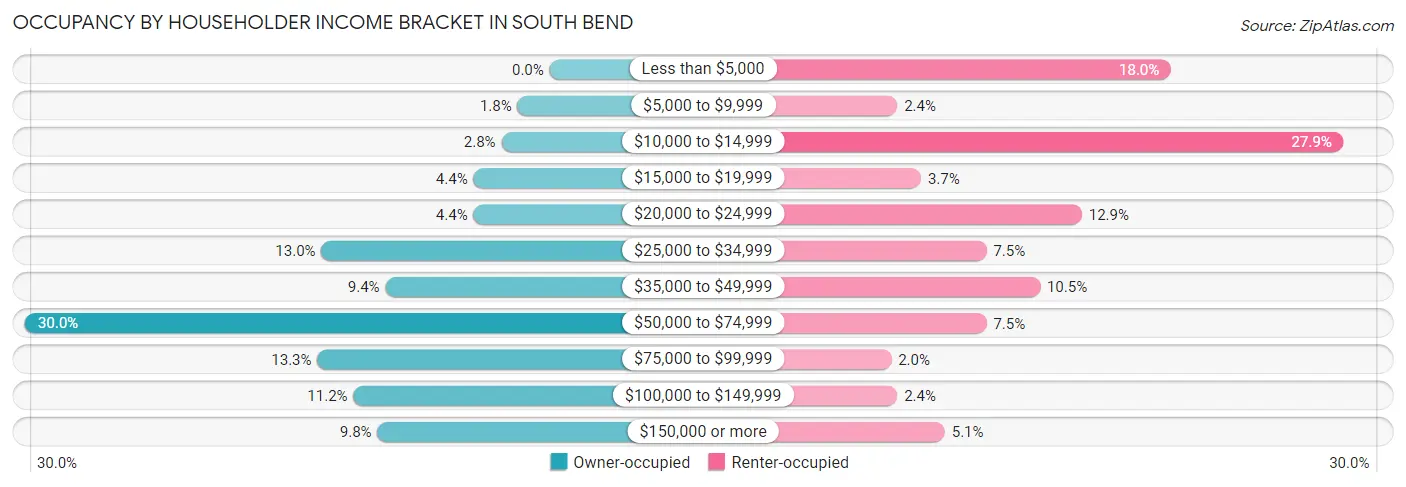
| Income Bracket | Owner-occupied | Renter-occupied |
| Less than $5,000 | 0 (0.0%) | 53 (18.0%) |
| $5,000 to $9,999 | 8 (1.8%) | 7 (2.4%) |
| $10,000 to $14,999 | 12 (2.8%) | 82 (27.9%) |
| $15,000 to $19,999 | 19 (4.3%) | 11 (3.7%) |
| $20,000 to $24,999 | 19 (4.3%) | 38 (12.9%) |
| $25,000 to $34,999 | 57 (13.0%) | 22 (7.5%) |
| $35,000 to $49,999 | 41 (9.4%) | 31 (10.5%) |
| $50,000 to $74,999 | 131 (30.0%) | 22 (7.5%) |
| $75,000 to $99,999 | 58 (13.3%) | 6 (2.0%) |
| $100,000 to $149,999 | 49 (11.2%) | 7 (2.4%) |
| $150,000 or more | 43 (9.8%) | 15 (5.1%) |
| Total | 437 (100.0%) | 294 (100.0%) |
Monthly Housing Cost Tiers in South Bend
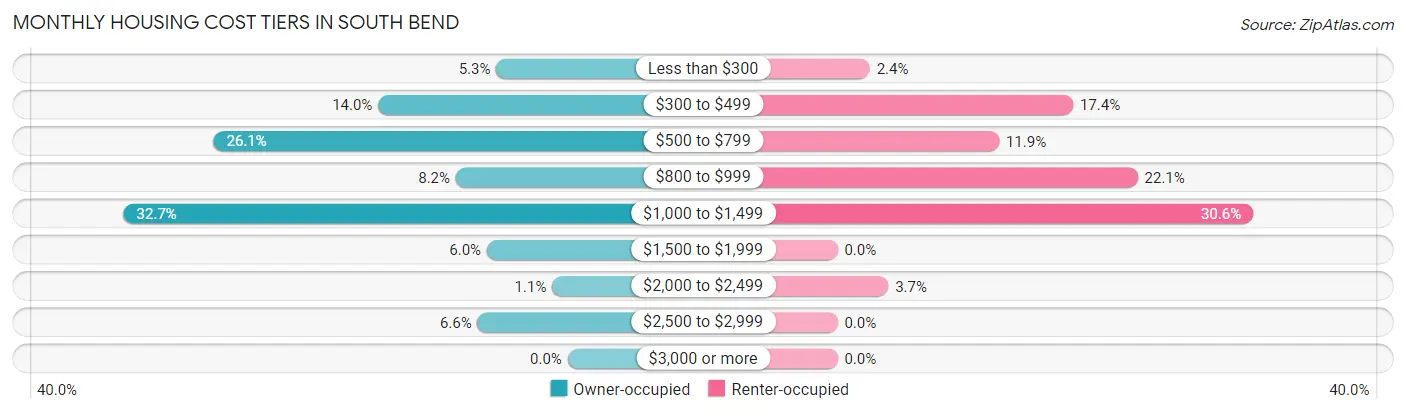
| Monthly Cost | Owner-occupied | Renter-occupied |
| Less than $300 | 23 (5.3%) | 7 (2.4%) |
| $300 to $499 | 61 (14.0%) | 51 (17.3%) |
| $500 to $799 | 114 (26.1%) | 35 (11.9%) |
| $800 to $999 | 36 (8.2%) | 65 (22.1%) |
| $1,000 to $1,499 | 143 (32.7%) | 90 (30.6%) |
| $1,500 to $1,999 | 26 (5.9%) | 0 (0.0%) |
| $2,000 to $2,499 | 5 (1.1%) | 11 (3.7%) |
| $2,500 to $2,999 | 29 (6.6%) | 0 (0.0%) |
| $3,000 or more | 0 (0.0%) | 0 (0.0%) |
| Total | 437 (100.0%) | 294 (100.0%) |
Physical Housing Characteristics in South Bend
Housing Structures in South Bend
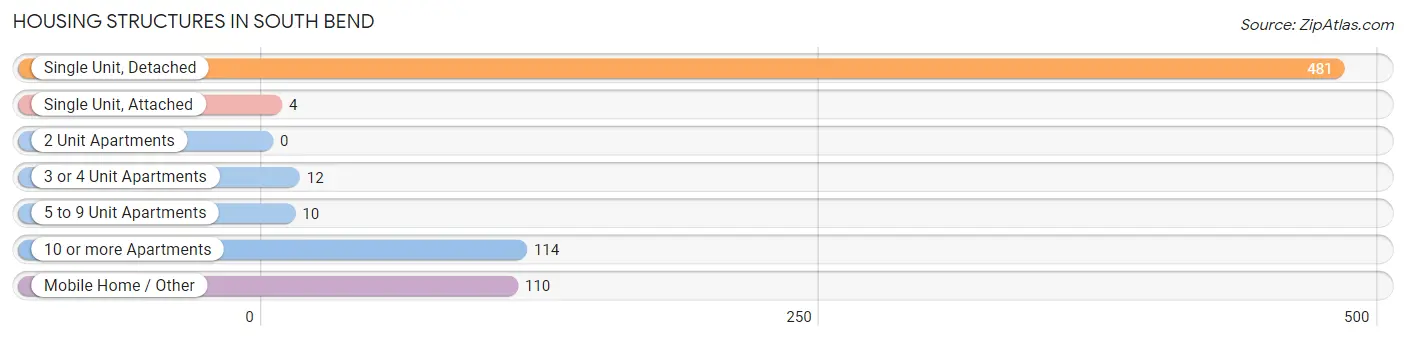
| Structure Type | # Housing Units | % Housing Units |
| Single Unit, Detached | 481 | 65.8% |
| Single Unit, Attached | 4 | 0.5% |
| 2 Unit Apartments | 0 | 0.0% |
| 3 or 4 Unit Apartments | 12 | 1.6% |
| 5 to 9 Unit Apartments | 10 | 1.4% |
| 10 or more Apartments | 114 | 15.6% |
| Mobile Home / Other | 110 | 15.0% |
| Total | 731 | 100.0% |
Housing Structures by Occupancy in South Bend
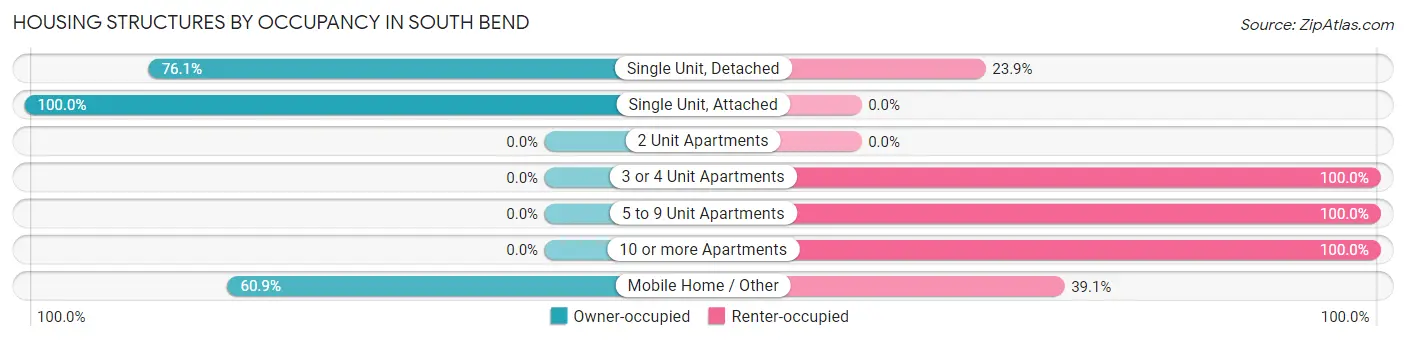
| Structure Type | Owner-occupied | Renter-occupied |
| Single Unit, Detached | 366 (76.1%) | 115 (23.9%) |
| Single Unit, Attached | 4 (100.0%) | 0 (0.0%) |
| 2 Unit Apartments | 0 (0.0%) | 0 (0.0%) |
| 3 or 4 Unit Apartments | 0 (0.0%) | 12 (100.0%) |
| 5 to 9 Unit Apartments | 0 (0.0%) | 10 (100.0%) |
| 10 or more Apartments | 0 (0.0%) | 114 (100.0%) |
| Mobile Home / Other | 67 (60.9%) | 43 (39.1%) |
| Total | 437 (59.8%) | 294 (40.2%) |
Housing Structures by Number of Rooms in South Bend
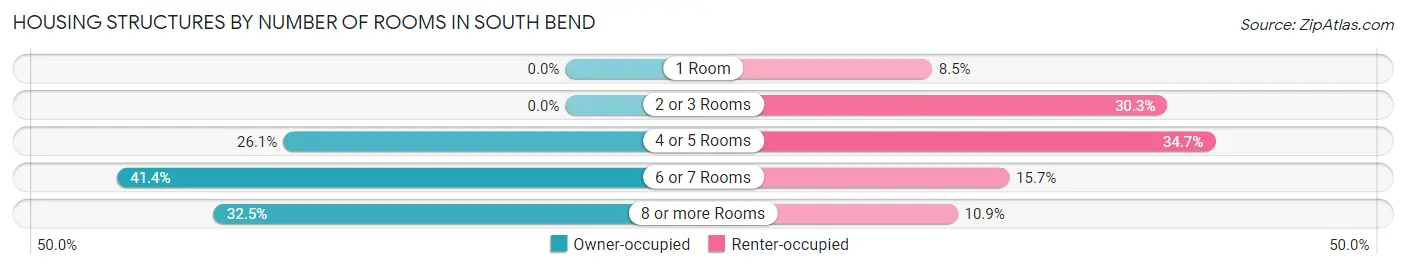
| Number of Rooms | Owner-occupied | Renter-occupied |
| 1 Room | 0 (0.0%) | 25 (8.5%) |
| 2 or 3 Rooms | 0 (0.0%) | 89 (30.3%) |
| 4 or 5 Rooms | 114 (26.1%) | 102 (34.7%) |
| 6 or 7 Rooms | 181 (41.4%) | 46 (15.7%) |
| 8 or more Rooms | 142 (32.5%) | 32 (10.9%) |
| Total | 437 (100.0%) | 294 (100.0%) |
Housing Structure by Heating Type in South Bend
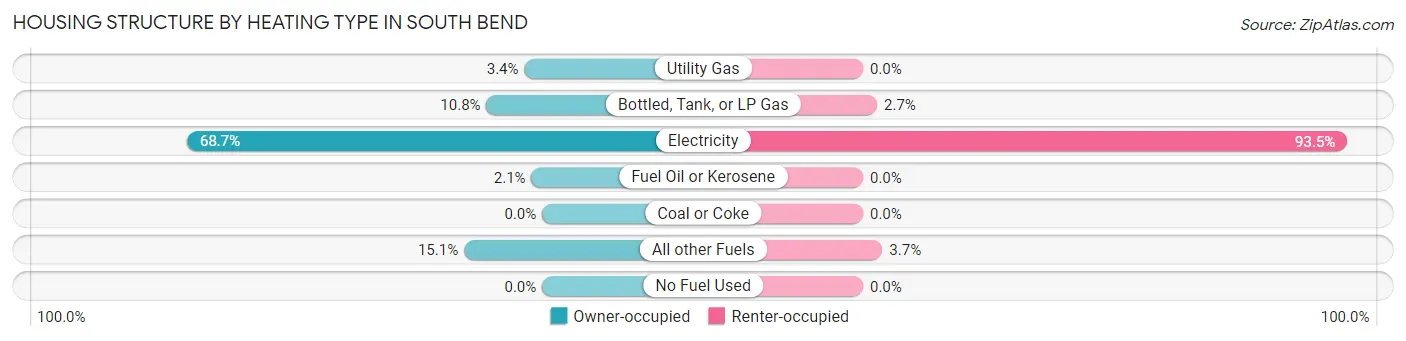
| Heating Type | Owner-occupied | Renter-occupied |
| Utility Gas | 15 (3.4%) | 0 (0.0%) |
| Bottled, Tank, or LP Gas | 47 (10.8%) | 8 (2.7%) |
| Electricity | 300 (68.6%) | 275 (93.5%) |
| Fuel Oil or Kerosene | 9 (2.1%) | 0 (0.0%) |
| Coal or Coke | 0 (0.0%) | 0 (0.0%) |
| All other Fuels | 66 (15.1%) | 11 (3.7%) |
| No Fuel Used | 0 (0.0%) | 0 (0.0%) |
| Total | 437 (100.0%) | 294 (100.0%) |
Household Vehicle Usage in South Bend
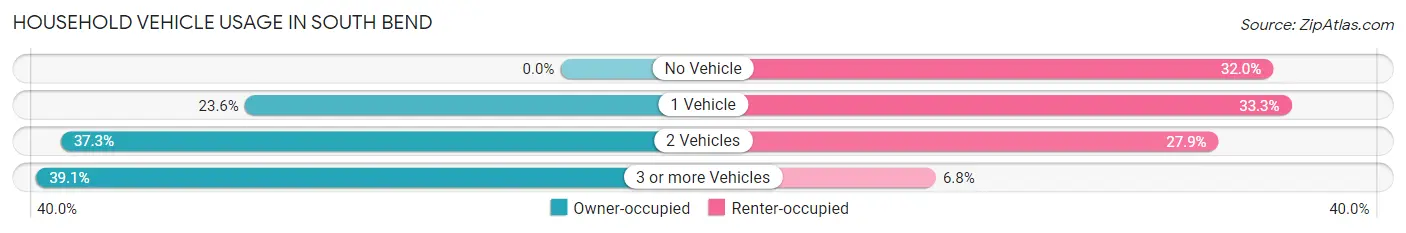
| Vehicles per Household | Owner-occupied | Renter-occupied |
| No Vehicle | 0 (0.0%) | 94 (32.0%) |
| 1 Vehicle | 103 (23.6%) | 98 (33.3%) |
| 2 Vehicles | 163 (37.3%) | 82 (27.9%) |
| 3 or more Vehicles | 171 (39.1%) | 20 (6.8%) |
| Total | 437 (100.0%) | 294 (100.0%) |
Real Estate & Mortgages in South Bend
Real Estate and Mortgage Overview in South Bend
| Characteristic | Without Mortgage | With Mortgage |
| Housing Units | 182 | 255 |
| Median Property Value | $239,600 | $193,000 |
| Median Household Income | $53,182 | $36 |
| Monthly Housing Costs | $523 | $0 |
| Real Estate Taxes | $1,414 | $0 |
Property Value by Mortgage Status in South Bend
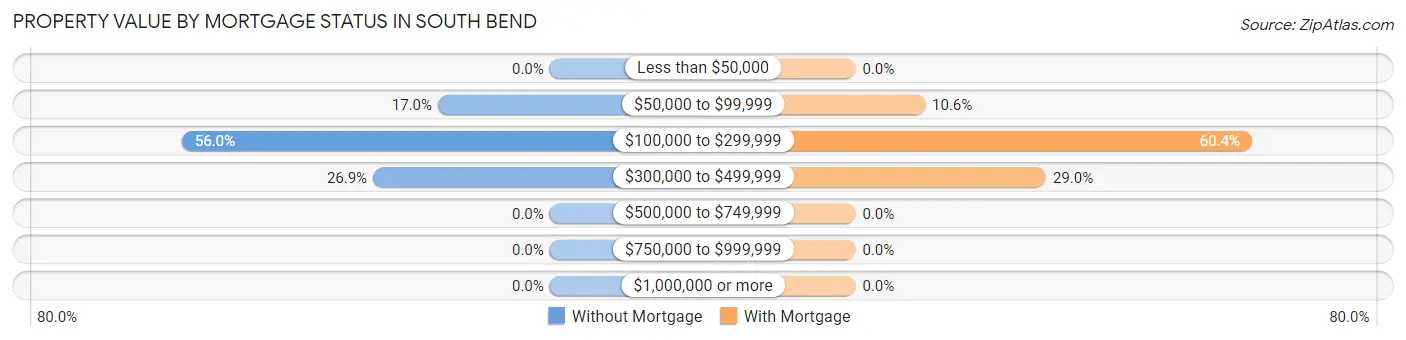
| Property Value | Without Mortgage | With Mortgage |
| Less than $50,000 | 0 (0.0%) | 0 (0.0%) |
| $50,000 to $99,999 | 31 (17.0%) | 27 (10.6%) |
| $100,000 to $299,999 | 102 (56.0%) | 154 (60.4%) |
| $300,000 to $499,999 | 49 (26.9%) | 74 (29.0%) |
| $500,000 to $749,999 | 0 (0.0%) | 0 (0.0%) |
| $750,000 to $999,999 | 0 (0.0%) | 0 (0.0%) |
| $1,000,000 or more | 0 (0.0%) | 0 (0.0%) |
| Total | 182 (100.0%) | 255 (100.0%) |
Household Income by Mortgage Status in South Bend
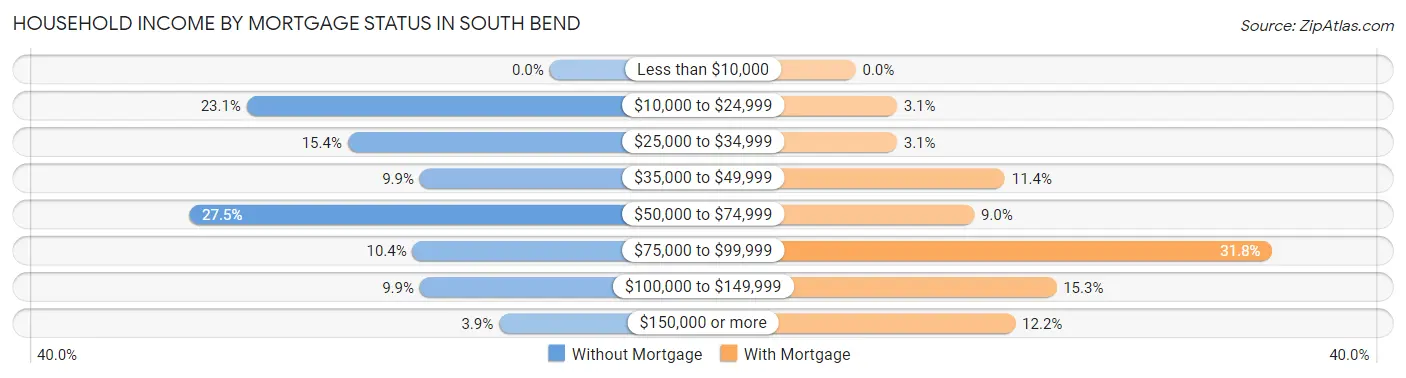
| Household Income | Without Mortgage | With Mortgage |
| Less than $10,000 | 0 (0.0%) | 0 (0.0%) |
| $10,000 to $24,999 | 42 (23.1%) | 8 (3.1%) |
| $25,000 to $34,999 | 28 (15.4%) | 8 (3.1%) |
| $35,000 to $49,999 | 18 (9.9%) | 29 (11.4%) |
| $50,000 to $74,999 | 50 (27.5%) | 23 (9.0%) |
| $75,000 to $99,999 | 19 (10.4%) | 81 (31.8%) |
| $100,000 to $149,999 | 18 (9.9%) | 39 (15.3%) |
| $150,000 or more | 7 (3.8%) | 31 (12.2%) |
| Total | 182 (100.0%) | 255 (100.0%) |
Property Value to Household Income Ratio in South Bend
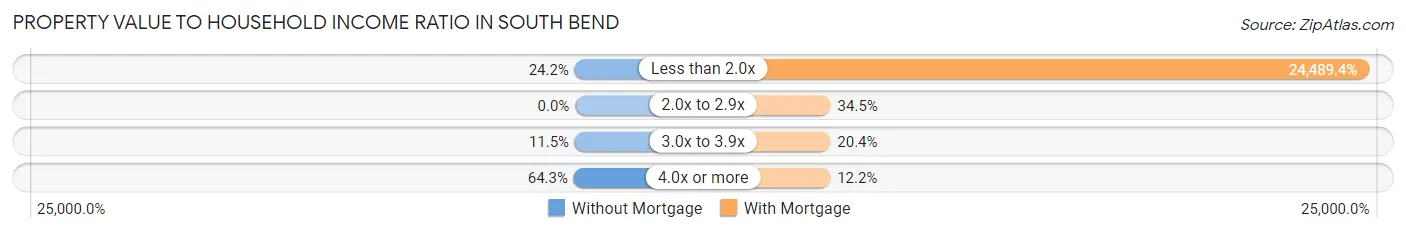
| Value-to-Income Ratio | Without Mortgage | With Mortgage |
| Less than 2.0x | 44 (24.2%) | 62,448 (24,489.4%) |
| 2.0x to 2.9x | 0 (0.0%) | 88 (34.5%) |
| 3.0x to 3.9x | 21 (11.5%) | 52 (20.4%) |
| 4.0x or more | 117 (64.3%) | 31 (12.2%) |
| Total | 182 (100.0%) | 255 (100.0%) |
Real Estate Taxes by Mortgage Status in South Bend
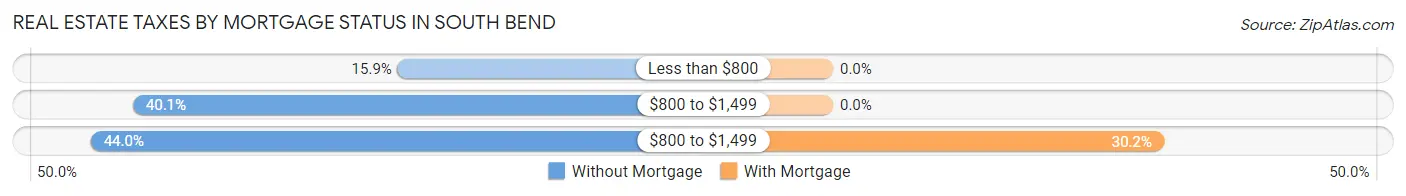
| Property Taxes | Without Mortgage | With Mortgage |
| Less than $800 | 29 (15.9%) | 0 (0.0%) |
| $800 to $1,499 | 73 (40.1%) | 0 (0.0%) |
| $800 to $1,499 | 80 (44.0%) | 77 (30.2%) |
| Total | 182 (100.0%) | 255 (100.0%) |
Health & Disability in South Bend
Health Insurance Coverage by Age in South Bend
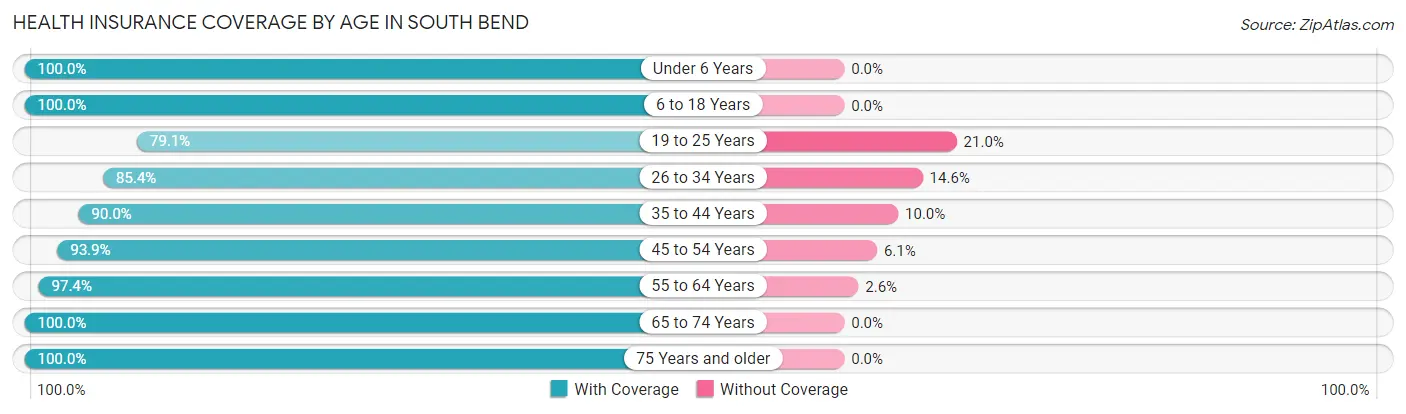
| Age Bracket | With Coverage | Without Coverage |
| Under 6 Years | 101 (100.0%) | 0 (0.0%) |
| 6 to 18 Years | 317 (100.0%) | 0 (0.0%) |
| 19 to 25 Years | 117 (79.0%) | 31 (20.9%) |
| 26 to 34 Years | 76 (85.4%) | 13 (14.6%) |
| 35 to 44 Years | 251 (90.0%) | 28 (10.0%) |
| 45 to 54 Years | 154 (93.9%) | 10 (6.1%) |
| 55 to 64 Years | 335 (97.4%) | 9 (2.6%) |
| 65 to 74 Years | 257 (100.0%) | 0 (0.0%) |
| 75 Years and older | 127 (100.0%) | 0 (0.0%) |
| Total | 1,735 (95.0%) | 91 (5.0%) |
Health Insurance Coverage by Citizenship Status in South Bend
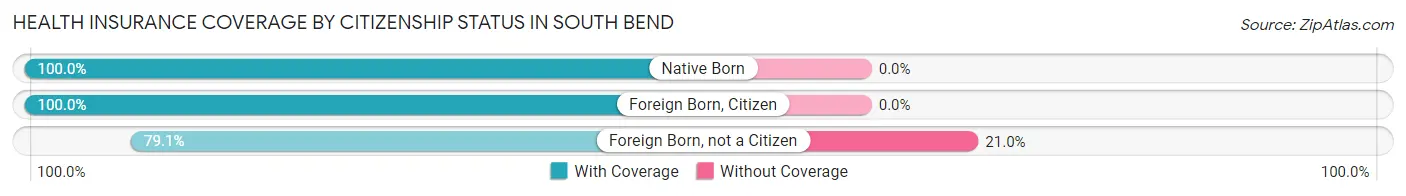
| Citizenship Status | With Coverage | Without Coverage |
| Native Born | 101 (100.0%) | 0 (0.0%) |
| Foreign Born, Citizen | 317 (100.0%) | 0 (0.0%) |
| Foreign Born, not a Citizen | 117 (79.0%) | 31 (20.9%) |
Health Insurance Coverage by Household Income in South Bend
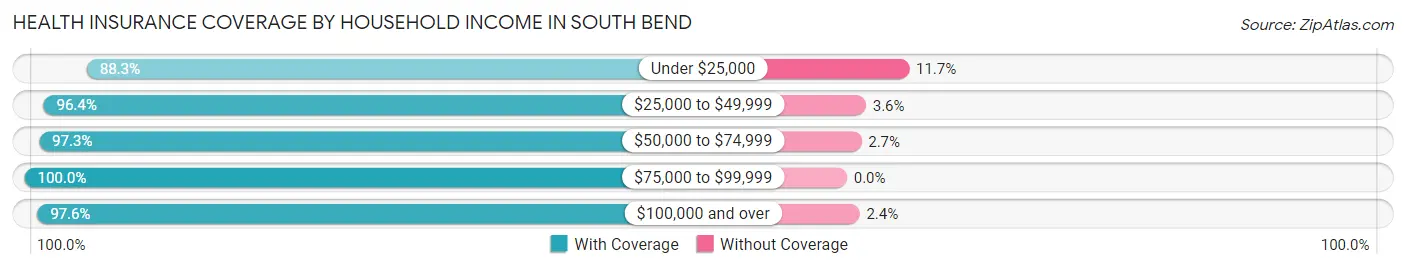
| Household Income | With Coverage | Without Coverage |
| Under $25,000 | 303 (88.3%) | 40 (11.7%) |
| $25,000 to $49,999 | 352 (96.4%) | 13 (3.6%) |
| $50,000 to $74,999 | 431 (97.3%) | 12 (2.7%) |
| $75,000 to $99,999 | 249 (100.0%) | 0 (0.0%) |
| $100,000 and over | 370 (97.6%) | 9 (2.4%) |
Public vs Private Health Insurance Coverage by Age in South Bend
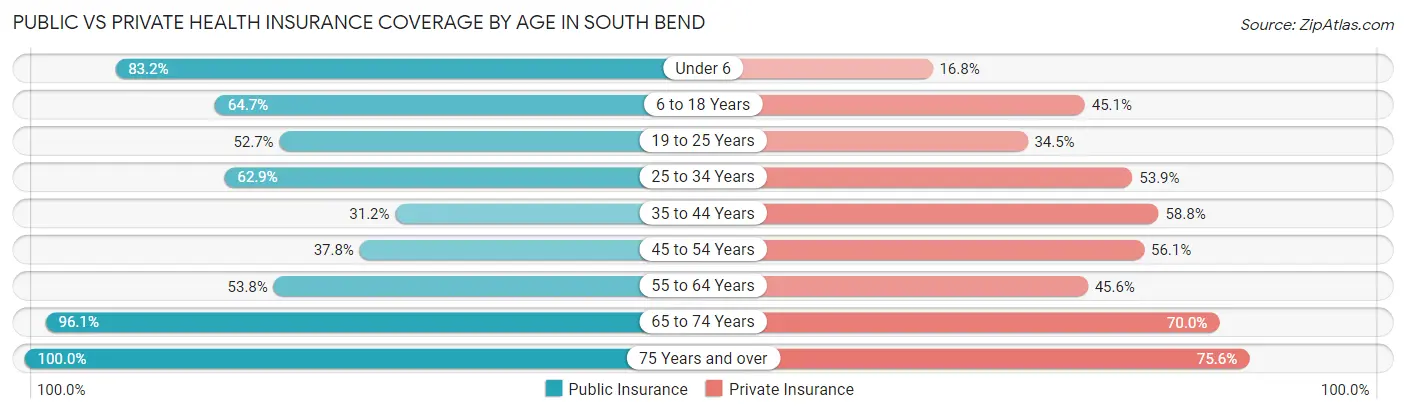
| Age Bracket | Public Insurance | Private Insurance |
| Under 6 | 84 (83.2%) | 17 (16.8%) |
| 6 to 18 Years | 205 (64.7%) | 143 (45.1%) |
| 19 to 25 Years | 78 (52.7%) | 51 (34.5%) |
| 25 to 34 Years | 56 (62.9%) | 48 (53.9%) |
| 35 to 44 Years | 87 (31.2%) | 164 (58.8%) |
| 45 to 54 Years | 62 (37.8%) | 92 (56.1%) |
| 55 to 64 Years | 185 (53.8%) | 157 (45.6%) |
| 65 to 74 Years | 247 (96.1%) | 180 (70.0%) |
| 75 Years and over | 127 (100.0%) | 96 (75.6%) |
| Total | 1,131 (61.9%) | 948 (51.9%) |
Disability Status by Sex by Age in South Bend
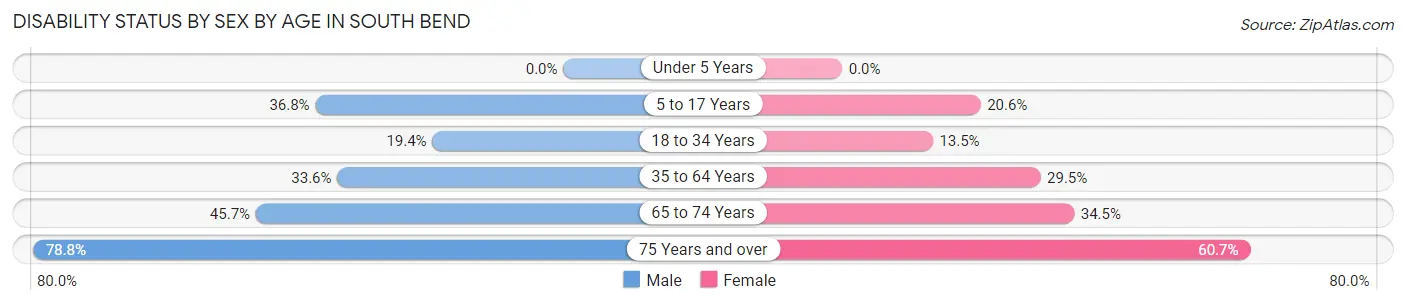
| Age Bracket | Male | Female |
| Under 5 Years | 0 (0.0%) | 0 (0.0%) |
| 5 to 17 Years | 67 (36.8%) | 30 (20.5%) |
| 18 to 34 Years | 28 (19.4%) | 14 (13.5%) |
| 35 to 64 Years | 149 (33.6%) | 101 (29.4%) |
| 65 to 74 Years | 63 (45.7%) | 41 (34.4%) |
| 75 Years and over | 52 (78.8%) | 37 (60.7%) |
Disability Class by Sex by Age in South Bend
Disability Class: Hearing Difficulty
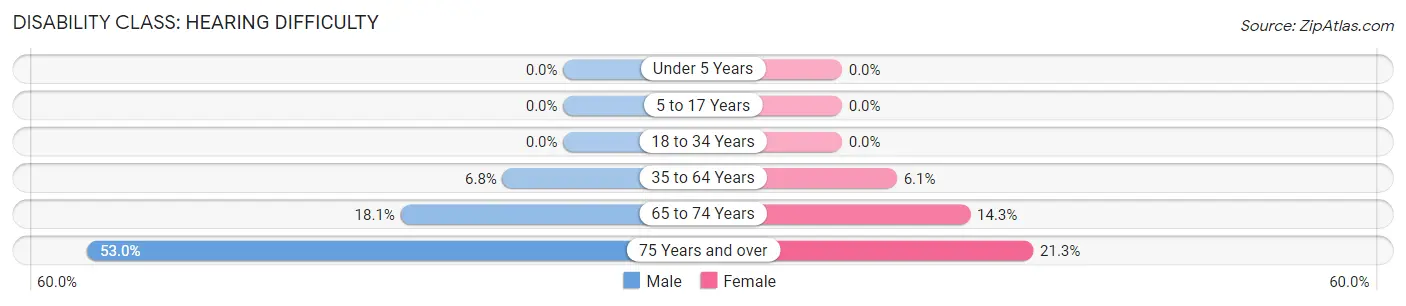
| Age Bracket | Male | Female |
| Under 5 Years | 0 (0.0%) | 0 (0.0%) |
| 5 to 17 Years | 0 (0.0%) | 0 (0.0%) |
| 18 to 34 Years | 0 (0.0%) | 0 (0.0%) |
| 35 to 64 Years | 30 (6.8%) | 21 (6.1%) |
| 65 to 74 Years | 25 (18.1%) | 17 (14.3%) |
| 75 Years and over | 35 (53.0%) | 13 (21.3%) |
Disability Class: Vision Difficulty
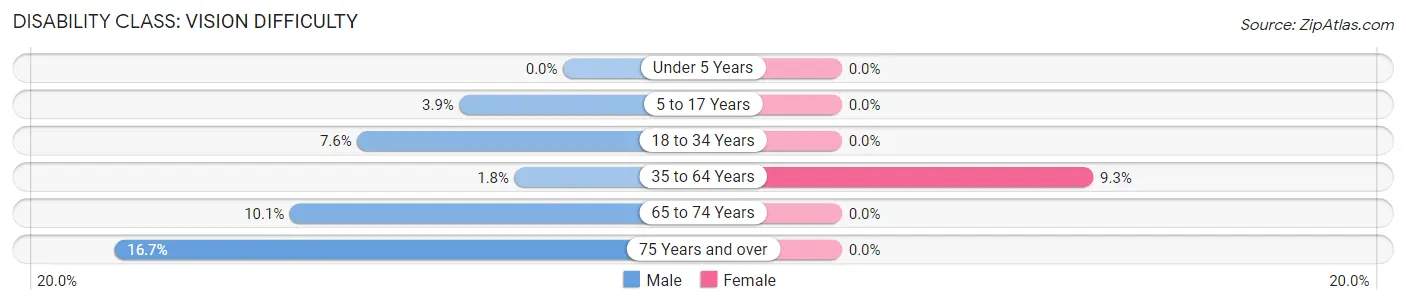
| Age Bracket | Male | Female |
| Under 5 Years | 0 (0.0%) | 0 (0.0%) |
| 5 to 17 Years | 7 (3.8%) | 0 (0.0%) |
| 18 to 34 Years | 11 (7.6%) | 0 (0.0%) |
| 35 to 64 Years | 8 (1.8%) | 32 (9.3%) |
| 65 to 74 Years | 14 (10.1%) | 0 (0.0%) |
| 75 Years and over | 11 (16.7%) | 0 (0.0%) |
Disability Class: Cognitive Difficulty
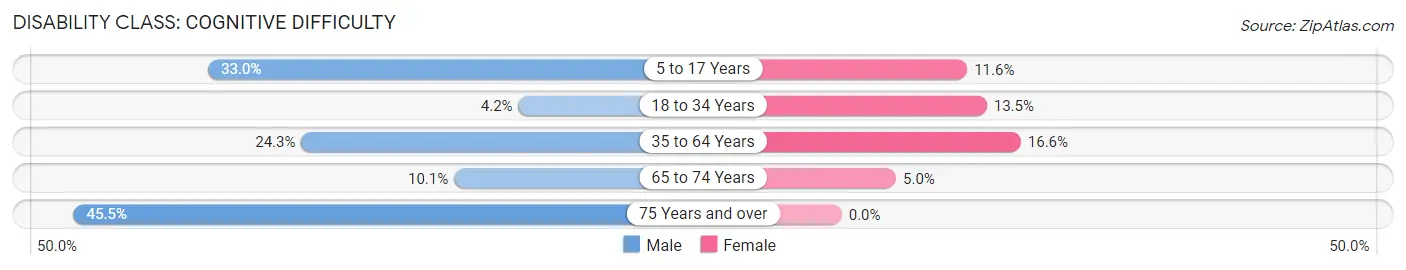
| Age Bracket | Male | Female |
| 5 to 17 Years | 60 (33.0%) | 17 (11.6%) |
| 18 to 34 Years | 6 (4.2%) | 14 (13.5%) |
| 35 to 64 Years | 108 (24.3%) | 57 (16.6%) |
| 65 to 74 Years | 14 (10.1%) | 6 (5.0%) |
| 75 Years and over | 30 (45.5%) | 0 (0.0%) |
Disability Class: Ambulatory Difficulty
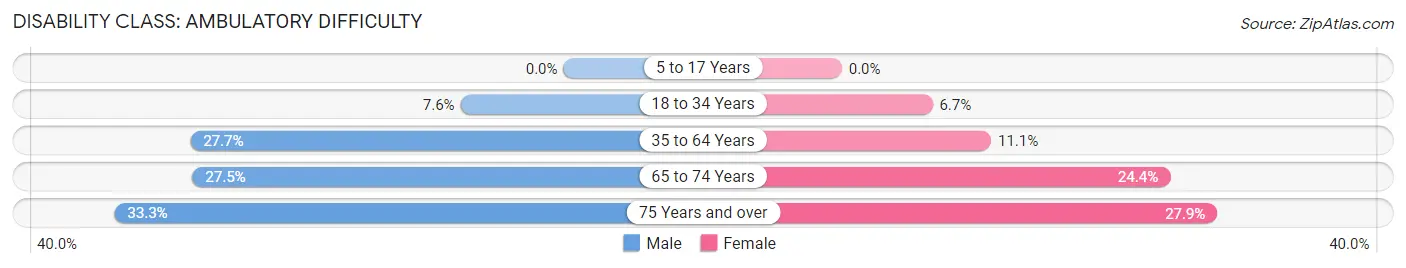
| Age Bracket | Male | Female |
| 5 to 17 Years | 0 (0.0%) | 0 (0.0%) |
| 18 to 34 Years | 11 (7.6%) | 7 (6.7%) |
| 35 to 64 Years | 123 (27.7%) | 38 (11.1%) |
| 65 to 74 Years | 38 (27.5%) | 29 (24.4%) |
| 75 Years and over | 22 (33.3%) | 17 (27.9%) |
Disability Class: Self-Care Difficulty
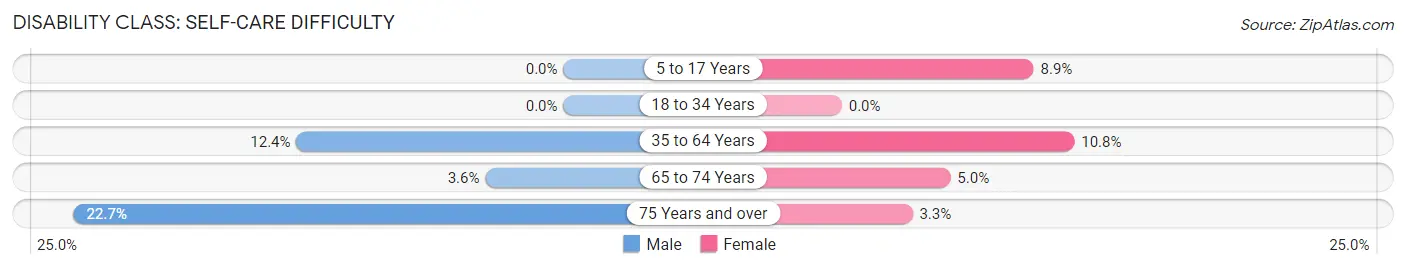
| Age Bracket | Male | Female |
| 5 to 17 Years | 0 (0.0%) | 13 (8.9%) |
| 18 to 34 Years | 0 (0.0%) | 0 (0.0%) |
| 35 to 64 Years | 55 (12.4%) | 37 (10.8%) |
| 65 to 74 Years | 5 (3.6%) | 6 (5.0%) |
| 75 Years and over | 15 (22.7%) | 2 (3.3%) |
Technology Access in South Bend
Computing Device Access in South Bend
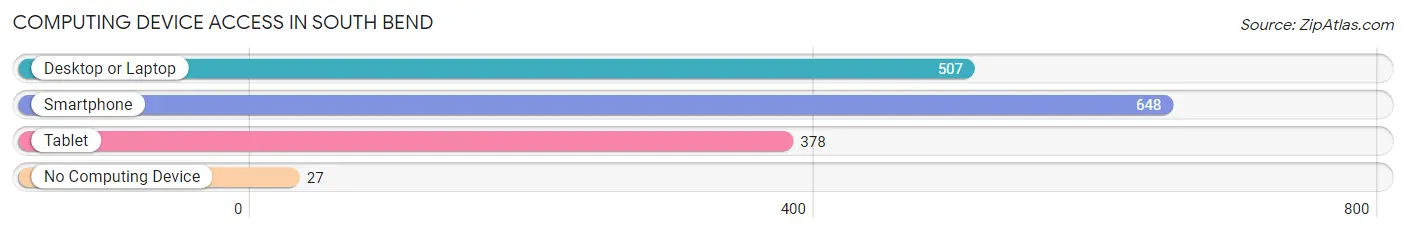
| Device Type | # Households | % Households |
| Desktop or Laptop | 507 | 69.4% |
| Smartphone | 648 | 88.6% |
| Tablet | 378 | 51.7% |
| No Computing Device | 27 | 3.7% |
| Total | 731 | 100.0% |
Internet Access in South Bend
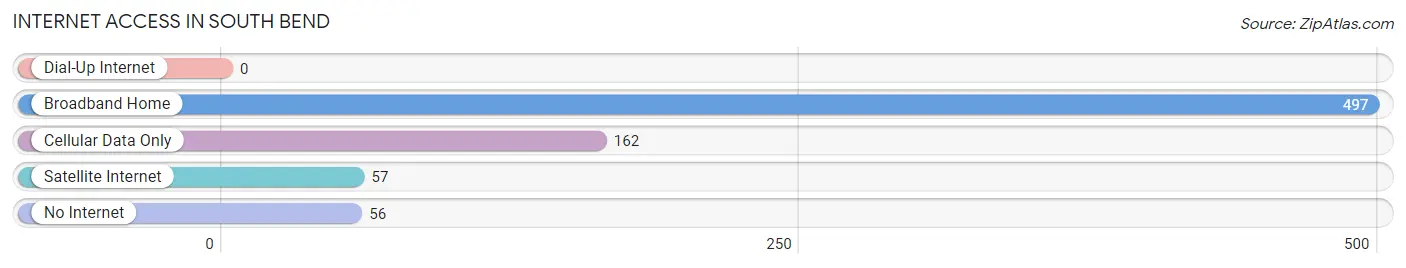
| Internet Type | # Households | % Households |
| Dial-Up Internet | 0 | 0.0% |
| Broadband Home | 497 | 68.0% |
| Cellular Data Only | 162 | 22.2% |
| Satellite Internet | 57 | 7.8% |
| No Internet | 56 | 7.7% |
| Total | 731 | 100.0% |
South Bend Summary
South Bend is a city located in Pacific County, Washington, United States. It is situated on the Willapa River, approximately 20 miles (32 km) from the Pacific Ocean. The population was 1,743 at the 2010 census.
History
South Bend was founded in 1853 by a group of settlers from the Midwest. The city was named after the bend in the Willapa River, which was the site of the first settlement. The settlers were attracted to the area by the abundance of timber and the potential for fishing.
The first sawmill was built in 1854, and the city quickly grew as more settlers arrived. By the late 1800s, South Bend had become a major lumber port, with ships carrying lumber to ports around the world. The city also had a thriving fishing industry, with salmon, halibut, and other fish being caught in the Willapa River.
In the early 1900s, the city began to diversify its economy. A cannery was built in 1906, and a paper mill was built in 1910. The paper mill was later sold to Weyerhaeuser, which operated it until it closed in the late 1990s.
Geography
South Bend is located at 46°45′N 123°45′W (46.75, -123.75). According to the United States Census Bureau, the city has a total area of 1.3 square miles (3.4 km2), all of it land.
The city is located on the Willapa River, which flows into Willapa Bay. The bay is part of the Pacific Ocean, and is home to a variety of marine life, including salmon, halibut, and other fish.
Economy
South Bend’s economy is largely based on fishing, forestry, and tourism. The city is home to several seafood processing plants, which process salmon, halibut, and other fish caught in the Willapa River. The city also has a thriving timber industry, with several sawmills and lumber yards.
Tourism is also an important part of the local economy. The city is home to several parks, including the Willapa National Wildlife Refuge, which is a popular destination for birdwatchers. The city also has several museums, including the Willapa Bay Maritime Museum and the South Bend Historical Museum.
Demographics
As of the census of 2010, there were 1,743 people, 745 households, and 463 families residing in the city. The population density was 1,323.8 people per square mile (510.7/km2). There were 845 housing units at an average density of 645.4 per square mile (249.3/km2). The racial makeup of the city was 87.2% White, 0.2% African American, 1.2% Native American, 0.7% Asian, 0.1% Pacific Islander, 8.2% from other races, and 2.6% from two or more races. Hispanic or Latino of any race were 14.2% of the population.
There were 745 households, out of which 28.2% had children under the age of 18 living with them, 44.2% were married couples living together, 12.7% had a female householder with no husband present, and 37.2% were non-families. 32.2% of all households were made up of individuals, and 14.2% had someone living alone who was 65 years of age or older. The average household size was 2.34 and the average family size was 2.93.
In the city, the population was spread out, with 24.2% under the age of 18, 8.2% from 18 to 24, 24.2% from 25 to 44, 25.2% from 45 to 64, and 18.2% who were 65 years of age or older. The median age was 40 years. For every 100 females, there were 94.2 males. For every 100 females age 18 and over, there were 91.2 males.
The median income for a household in the city was $30,938, and the median income for a family was $37,500. Males had a median income of $30,000 versus $21,250 for females. The per capita income for the city was $16,845. About 11.2% of families and 14.2% of the population were below the poverty line, including 19.2% of those under age 18 and 8.2% of those age 65 or over.
Common Questions
What is Per Capita Income in South Bend?
Per Capita income in South Bend is $23,876.
What is the Median Family Income in South Bend?
Median Family Income in South Bend is $57,961.
What is the Median Household income in South Bend?
Median Household Income in South Bend is $45,156.
What is Income or Wage Gap in South Bend?
Income or Wage Gap in South Bend is 59.3%.
Women in South Bend earn 40.7 cents for every dollar earned by a man.
What is Inequality or Gini Index in South Bend?
Inequality or Gini Index in South Bend is 0.48.
What is the Total Population of South Bend?
Total Population of South Bend is 1,859.
What is the Total Male Population of South Bend?
Total Male Population of South Bend is 1,027.
What is the Total Female Population of South Bend?
Total Female Population of South Bend is 832.
What is the Ratio of Males per 100 Females in South Bend?
There are 123.44 Males per 100 Females in South Bend.
What is the Ratio of Females per 100 Males in South Bend?
There are 81.01 Females per 100 Males in South Bend.
What is the Median Population Age in South Bend?
Median Population Age in South Bend is 44.5 Years.
What is the Average Family Size in South Bend
Average Family Size in South Bend is 3.0 People.
What is the Average Household Size in South Bend
Average Household Size in South Bend is 2.4 People.
How Large is the Labor Force in South Bend?
There are 662 People in the Labor Forcein in South Bend.
What is the Percentage of People in the Labor Force in South Bend?
44.0% of People are in the Labor Force in South Bend.
What is the Unemployment Rate in South Bend?
Unemployment Rate in South Bend is 1.2%.