Pe Ell, WA Map & Demographics
Pe Ell Map
Pe Ell Overview
$29,365
PER CAPITA INCOME
$78,438
AVG FAMILY INCOME
$58,281
AVG HOUSEHOLD INCOME
57.0%
WAGE / INCOME GAP [ % ]
43.0¢/ $1
WAGE / INCOME GAP [ $ ]
0.36
INEQUALITY / GINI INDEX
513
TOTAL POPULATION
285
MALE POPULATION
228
FEMALE POPULATION
125.00
MALES / 100 FEMALES
80.00
FEMALES / 100 MALES
38.4
MEDIAN AGE
2.9
AVG FAMILY SIZE
2.3
AVG HOUSEHOLD SIZE
250
LABOR FORCE [ PEOPLE ]
55.3%
PERCENT IN LABOR FORCE
Pe Ell Zip Codes
Pe Ell Area Codes
Income in Pe Ell
Income Overview in Pe Ell
Per Capita Income in Pe Ell is $29,365, while median incomes of families and households are $78,438 and $58,281 respectively.
| Characteristic | Number | Measure |
| Per Capita Income | 513 | $29,365 |
| Median Family Income | 133 | $78,438 |
| Mean Family Income | 133 | $72,286 |
| Median Household Income | 223 | $58,281 |
| Mean Household Income | 223 | $64,926 |
| Income Deficit | 133 | $0 |
| Wage / Income Gap (%) | 513 | 57.04% |
| Wage / Income Gap ($) | 513 | 42.96¢ per $1 |
| Gini / Inequality Index | 513 | 0.36 |
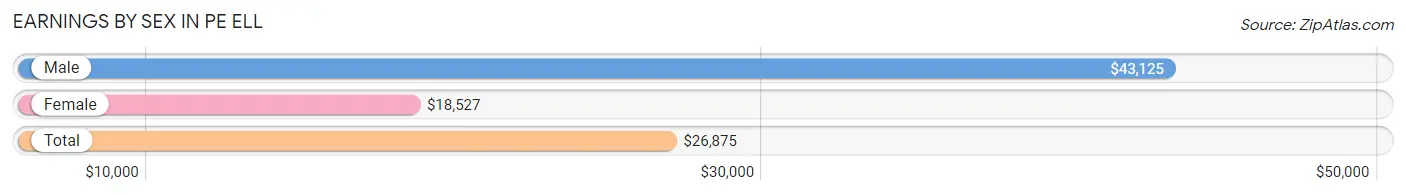
Earnings by Sex in Pe Ell
Average Earnings in Pe Ell are $26,875, $43,125 for men and $18,527 for women, a difference of 57.0%.
| Sex | Number | Average Earnings |
| Male | 145 (49.0%) | $43,125 |
| Female | 151 (51.0%) | $18,527 |
| Total | 296 (100.0%) | $26,875 |
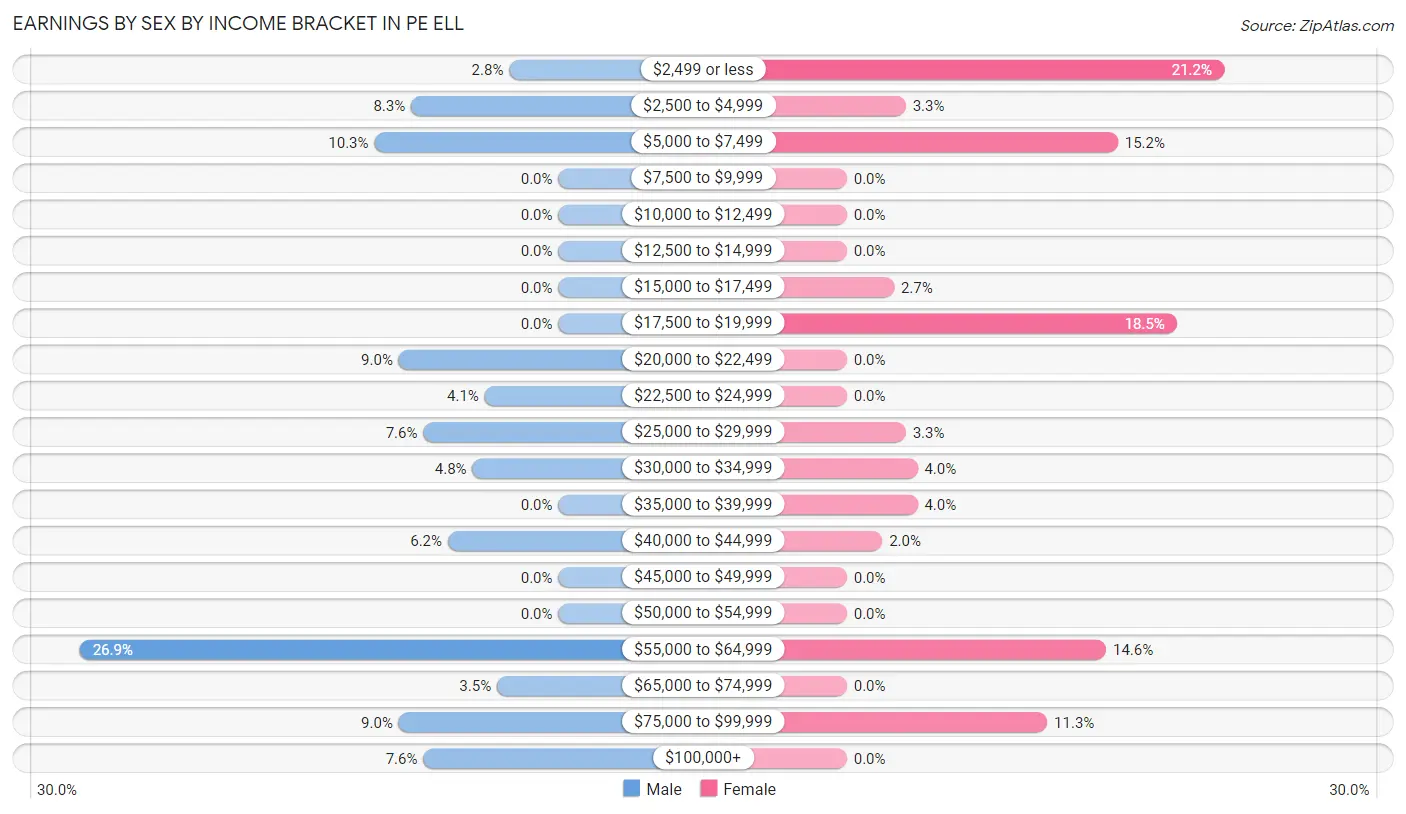
Earnings by Sex by Income Bracket in Pe Ell
The most common earnings brackets in Pe Ell are $55,000 to $64,999 for men (39 | 26.9%) and $2,499 or less for women (32 | 21.2%).
| Income | Male | Female |
| $2,499 or less | 4 (2.8%) | 32 (21.2%) |
| $2,500 to $4,999 | 12 (8.3%) | 5 (3.3%) |
| $5,000 to $7,499 | 15 (10.3%) | 23 (15.2%) |
| $7,500 to $9,999 | 0 (0.0%) | 0 (0.0%) |
| $10,000 to $12,499 | 0 (0.0%) | 0 (0.0%) |
| $12,500 to $14,999 | 0 (0.0%) | 0 (0.0%) |
| $15,000 to $17,499 | 0 (0.0%) | 4 (2.6%) |
| $17,500 to $19,999 | 0 (0.0%) | 28 (18.5%) |
| $20,000 to $22,499 | 13 (9.0%) | 0 (0.0%) |
| $22,500 to $24,999 | 6 (4.1%) | 0 (0.0%) |
| $25,000 to $29,999 | 11 (7.6%) | 5 (3.3%) |
| $30,000 to $34,999 | 7 (4.8%) | 6 (4.0%) |
| $35,000 to $39,999 | 0 (0.0%) | 6 (4.0%) |
| $40,000 to $44,999 | 9 (6.2%) | 3 (2.0%) |
| $45,000 to $49,999 | 0 (0.0%) | 0 (0.0%) |
| $50,000 to $54,999 | 0 (0.0%) | 0 (0.0%) |
| $55,000 to $64,999 | 39 (26.9%) | 22 (14.6%) |
| $65,000 to $74,999 | 5 (3.5%) | 0 (0.0%) |
| $75,000 to $99,999 | 13 (9.0%) | 17 (11.3%) |
| $100,000+ | 11 (7.6%) | 0 (0.0%) |
| Total | 145 (100.0%) | 151 (100.0%) |
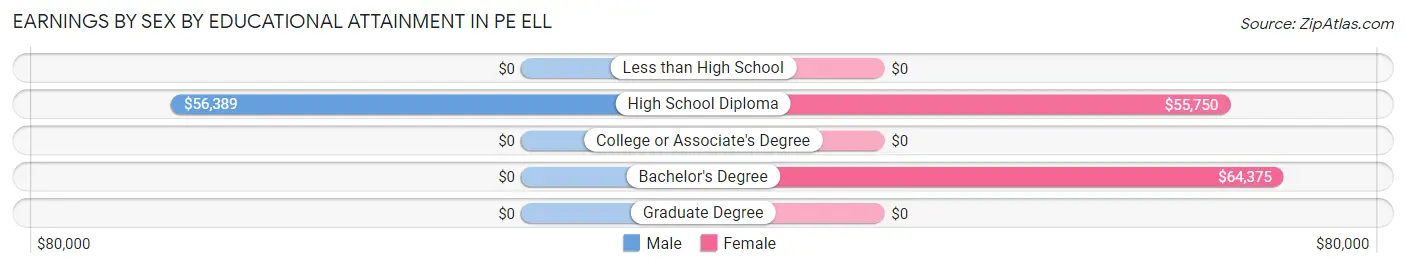
Earnings by Sex by Educational Attainment in Pe Ell
Average earnings in Pe Ell are $55,625 for men and $48,750 for women, a difference of 12.4%. Men with an educational attainment of high school diploma enjoy the highest average annual earnings of $56,389, while those with high school diploma education earn the least with $56,389. Women with an educational attainment of bachelor's degree earn the most with the average annual earnings of $64,375, while those with high school diploma education have the smallest earnings of $55,750.
| Educational Attainment | Male Income | Female Income |
| Less than High School | - | - |
| High School Diploma | $56,389 | $55,750 |
| College or Associate's Degree | - | - |
| Bachelor's Degree | - | - |
| Graduate Degree | - | - |
| Total | $55,625 | $48,750 |
Family Income in Pe Ell
Family Income Brackets in Pe Ell
According to the Pe Ell family income data, there are 33 families falling into the $75,000 to $99,999 income range, which is the most common income bracket and makes up 24.8% of all families.
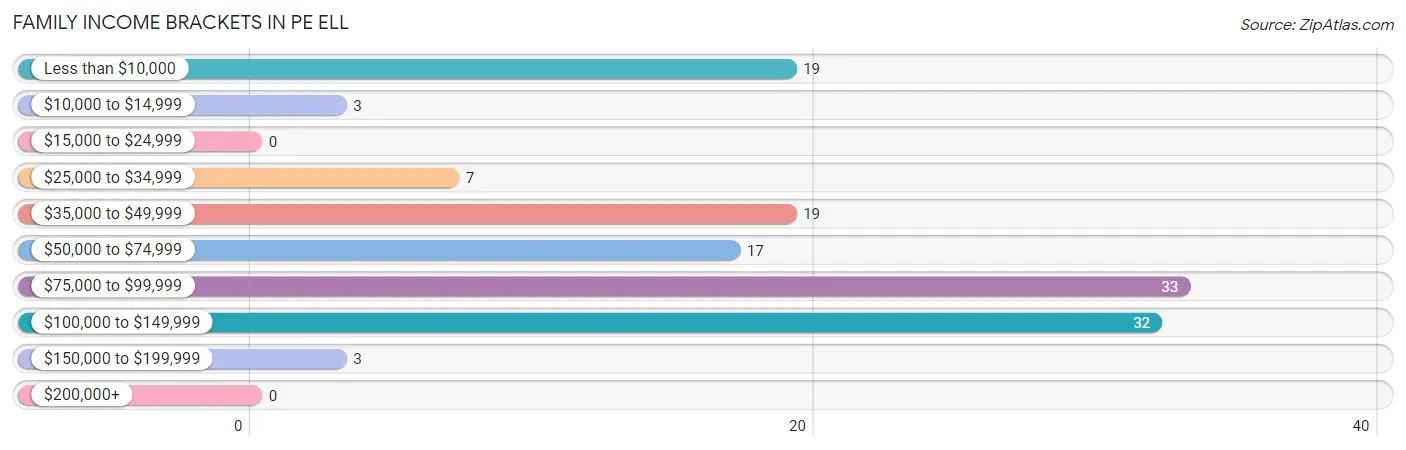
| Income Bracket | # Families | % Families |
| Less than $10,000 | 19 | 14.3% |
| $10,000 to $14,999 | 3 | 2.3% |
| $15,000 to $24,999 | 0 | 0.0% |
| $25,000 to $34,999 | 7 | 5.3% |
| $35,000 to $49,999 | 19 | 14.3% |
| $50,000 to $74,999 | 17 | 12.8% |
| $75,000 to $99,999 | 33 | 24.8% |
| $100,000 to $149,999 | 32 | 24.1% |
| $150,000 to $199,999 | 3 | 2.3% |
| $200,000+ | 0 | 0.0% |
Family Income by Famaliy Size in Pe Ell
4-person families (30 | 22.6%) account for the highest median family income in Pe Ell with $138,750 per family, while 4-person families (30 | 22.6%) have the highest median income of $34,688 per family member.
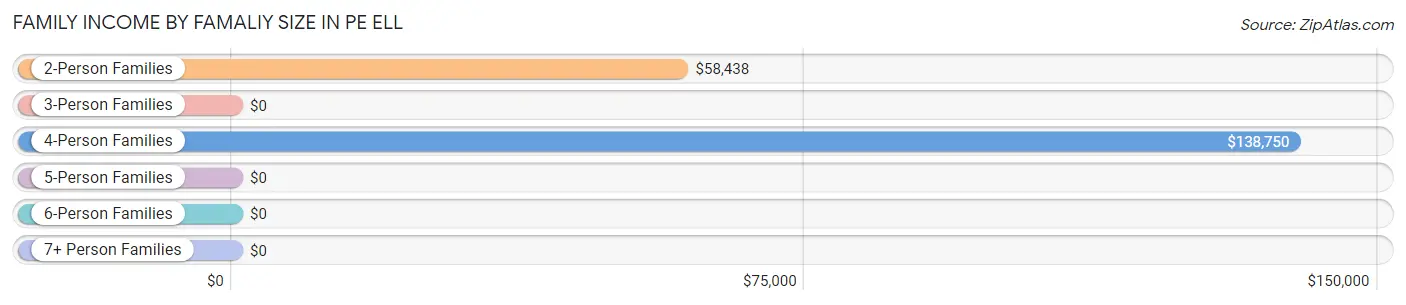
| Income Bracket | # Families | Median Income |
| 2-Person Families | 78 (58.7%) | $58,438 |
| 3-Person Families | 21 (15.8%) | $0 |
| 4-Person Families | 30 (22.6%) | $138,750 |
| 5-Person Families | 4 (3.0%) | $0 |
| 6-Person Families | 0 (0.0%) | $0 |
| 7+ Person Families | 0 (0.0%) | $0 |
| Total | 133 (100.0%) | $78,438 |
Family Income by Number of Earners in Pe Ell
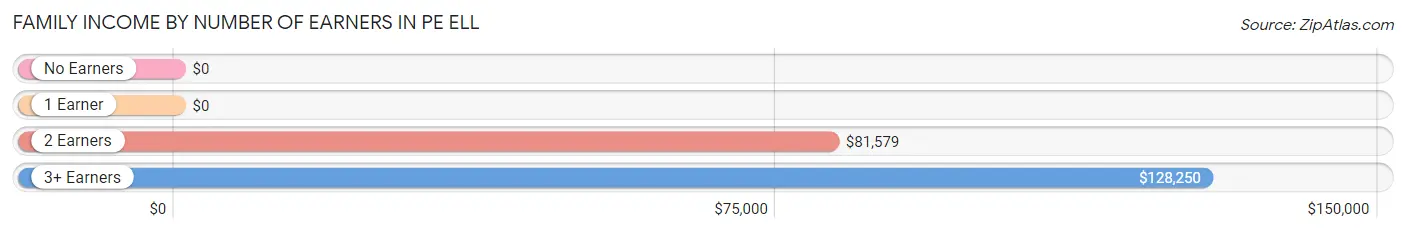
| Number of Earners | # Families | Median Income |
| No Earners | 34 (25.6%) | $0 |
| 1 Earner | 24 (18.0%) | $0 |
| 2 Earners | 50 (37.6%) | $81,579 |
| 3+ Earners | 25 (18.8%) | $128,250 |
| Total | 133 (100.0%) | $78,438 |
Household Income in Pe Ell
Household Income Brackets in Pe Ell
With 43 households falling in the category, the $35,000 to $49,999 income range is the most frequent in Pe Ell, accounting for 19.3% of all households.
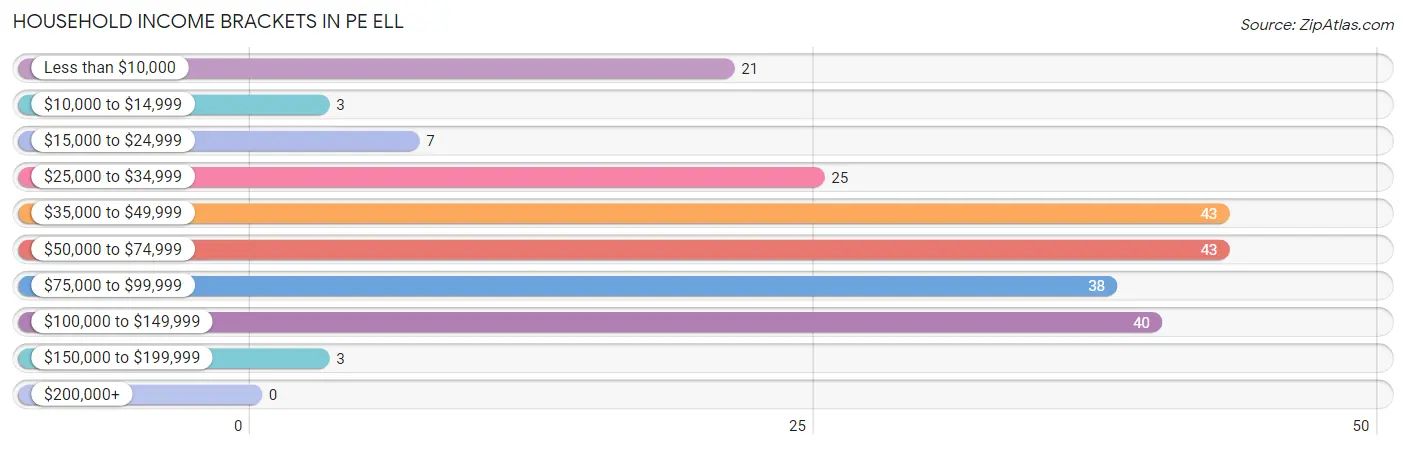
| Income Bracket | # Households | % Households |
| Less than $10,000 | 21 | 9.4% |
| $10,000 to $14,999 | 3 | 1.3% |
| $15,000 to $24,999 | 7 | 3.1% |
| $25,000 to $34,999 | 25 | 11.2% |
| $35,000 to $49,999 | 43 | 19.3% |
| $50,000 to $74,999 | 43 | 19.3% |
| $75,000 to $99,999 | 38 | 17.0% |
| $100,000 to $149,999 | 40 | 17.9% |
| $150,000 to $199,999 | 3 | 1.3% |
| $200,000+ | 0 | 0.0% |
Household Income by Householder Age in Pe Ell
The median household income in Pe Ell is $58,281, with the highest median household income of $81,184 found in the 25 to 44 years age bracket for the primary householder. A total of 78 households (35.0%) fall into this category. Meanwhile, the 15 to 24 years age bracket for the primary householder has the lowest median household income of $0, with 3 households (1.3%) in this group.
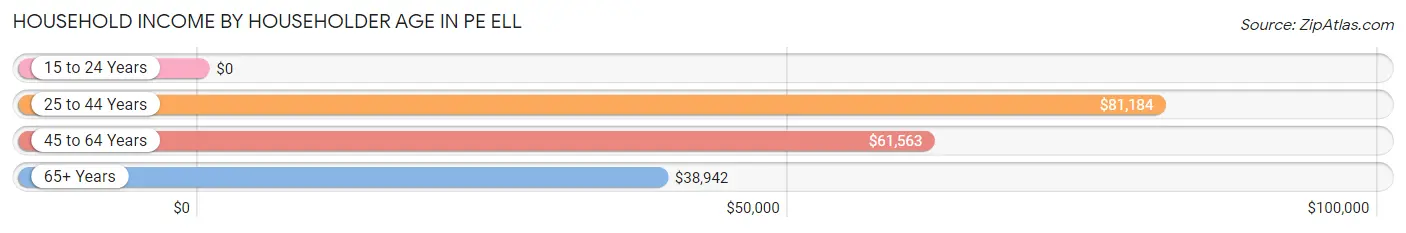
| Income Bracket | # Households | Median Income |
| 15 to 24 Years | 3 (1.3%) | $0 |
| 25 to 44 Years | 78 (35.0%) | $81,184 |
| 45 to 64 Years | 73 (32.7%) | $61,563 |
| 65+ Years | 69 (30.9%) | $38,942 |
| Total | 223 (100.0%) | $58,281 |
Poverty in Pe Ell
Income Below Poverty by Sex and Age in Pe Ell
With 19.0% poverty level for males and 10.1% for females among the residents of Pe Ell, 18 to 24 year old males and 55 to 64 year old females are the most vulnerable to poverty, with 10 males (76.9%) and 10 females (76.9%) in their respective age groups living below the poverty level.
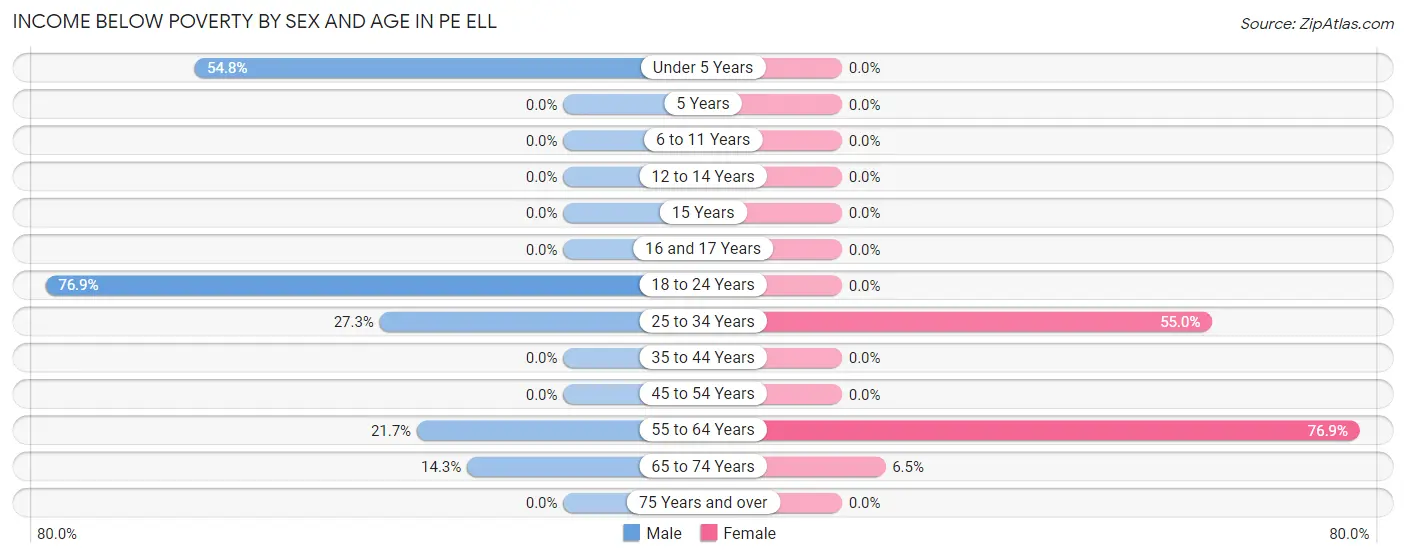
| Age Bracket | Male | Female |
| Under 5 Years | 17 (54.8%) | 0 (0.0%) |
| 5 Years | 0 (0.0%) | 0 (0.0%) |
| 6 to 11 Years | 0 (0.0%) | 0 (0.0%) |
| 12 to 14 Years | 0 (0.0%) | 0 (0.0%) |
| 15 Years | 0 (0.0%) | 0 (0.0%) |
| 16 and 17 Years | 0 (0.0%) | 0 (0.0%) |
| 18 to 24 Years | 10 (76.9%) | 0 (0.0%) |
| 25 to 34 Years | 9 (27.3%) | 11 (55.0%) |
| 35 to 44 Years | 0 (0.0%) | 0 (0.0%) |
| 45 to 54 Years | 0 (0.0%) | 0 (0.0%) |
| 55 to 64 Years | 10 (21.7%) | 10 (76.9%) |
| 65 to 74 Years | 8 (14.3%) | 2 (6.5%) |
| 75 Years and over | 0 (0.0%) | 0 (0.0%) |
| Total | 54 (19.0%) | 23 (10.1%) |
Income Above Poverty by Sex and Age in Pe Ell
According to the poverty statistics in Pe Ell, males aged 6 to 11 years and females aged under 5 years are the age groups that are most secure financially, with 100.0% of males and 100.0% of females in these age groups living above the poverty line.
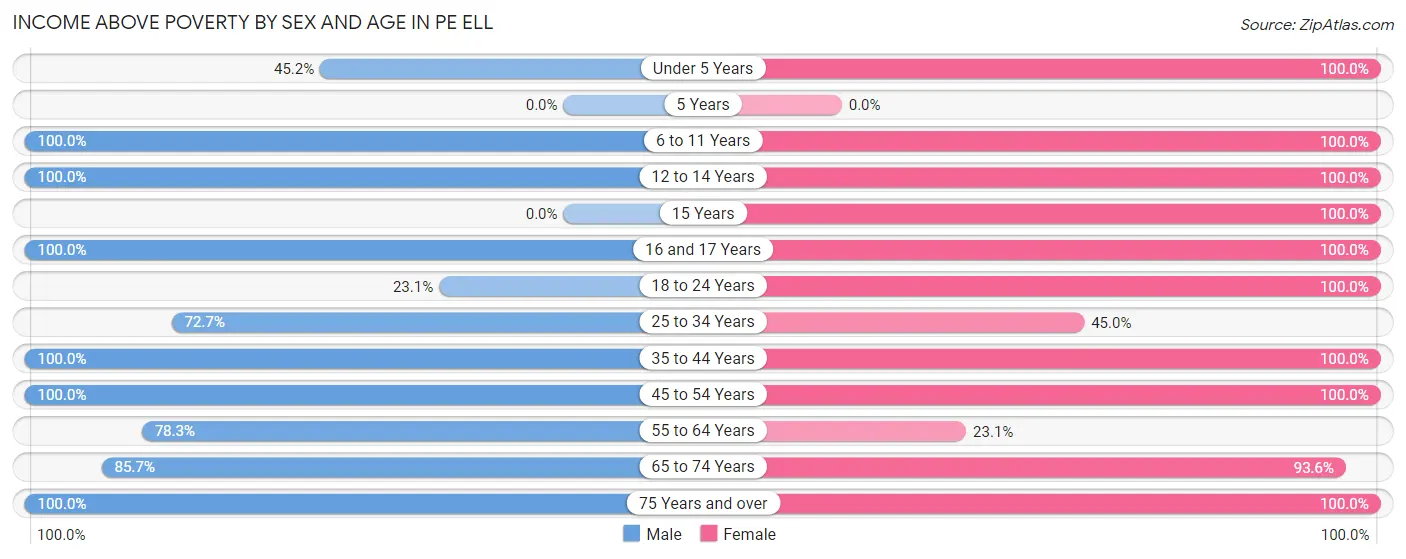
| Age Bracket | Male | Female |
| Under 5 Years | 14 (45.2%) | 13 (100.0%) |
| 5 Years | 0 (0.0%) | 0 (0.0%) |
| 6 to 11 Years | 7 (100.0%) | 4 (100.0%) |
| 12 to 14 Years | 3 (100.0%) | 2 (100.0%) |
| 15 Years | 0 (0.0%) | 1 (100.0%) |
| 16 and 17 Years | 22 (100.0%) | 26 (100.0%) |
| 18 to 24 Years | 3 (23.1%) | 47 (100.0%) |
| 25 to 34 Years | 24 (72.7%) | 9 (45.0%) |
| 35 to 44 Years | 30 (100.0%) | 31 (100.0%) |
| 45 to 54 Years | 31 (100.0%) | 20 (100.0%) |
| 55 to 64 Years | 36 (78.3%) | 3 (23.1%) |
| 65 to 74 Years | 48 (85.7%) | 29 (93.5%) |
| 75 Years and over | 13 (100.0%) | 20 (100.0%) |
| Total | 231 (81.0%) | 205 (89.9%) |
Income Below Poverty Among Married-Couple Families in Pe Ell
The poverty statistics for married-couple families in Pe Ell show that 11.1% or 12 of the total 108 families live below the poverty line. Families with no children have the highest poverty rate of 18.5%, comprising of 12 families. On the other hand, families with 1 or 2 children have the lowest poverty rate of 0.0%, which includes 0 families.
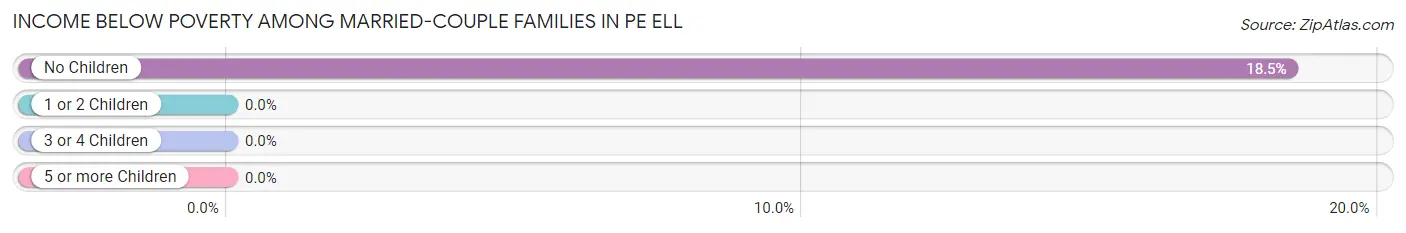
| Children | Above Poverty | Below Poverty |
| No Children | 53 (81.5%) | 12 (18.5%) |
| 1 or 2 Children | 39 (100.0%) | 0 (0.0%) |
| 3 or 4 Children | 4 (100.0%) | 0 (0.0%) |
| 5 or more Children | 0 (0.0%) | 0 (0.0%) |
| Total | 96 (88.9%) | 12 (11.1%) |
Income Below Poverty Among Single-Parent Households in Pe Ell
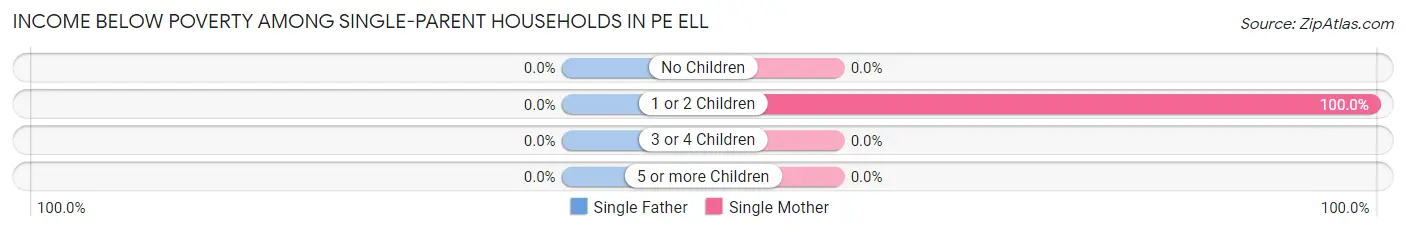
| Children | Single Father | Single Mother |
| No Children | 0 (0.0%) | 0 (0.0%) |
| 1 or 2 Children | 0 (0.0%) | 10 (100.0%) |
| 3 or 4 Children | 0 (0.0%) | 0 (0.0%) |
| 5 or more Children | 0 (0.0%) | 0 (0.0%) |
| Total | 0 (0.0%) | 10 (83.3%) |
Income Below Poverty Among Married-Couple vs Single-Parent Households in Pe Ell
The poverty data for Pe Ell shows that 12 of the married-couple family households (11.1%) and 10 of the single-parent households (40.0%) are living below the poverty level. Within the married-couple family households, those with no children have the highest poverty rate, with 12 households (18.5%) falling below the poverty line. Among the single-parent households, those with 1 or 2 children have the highest poverty rate, with 10 household (100.0%) living below poverty.
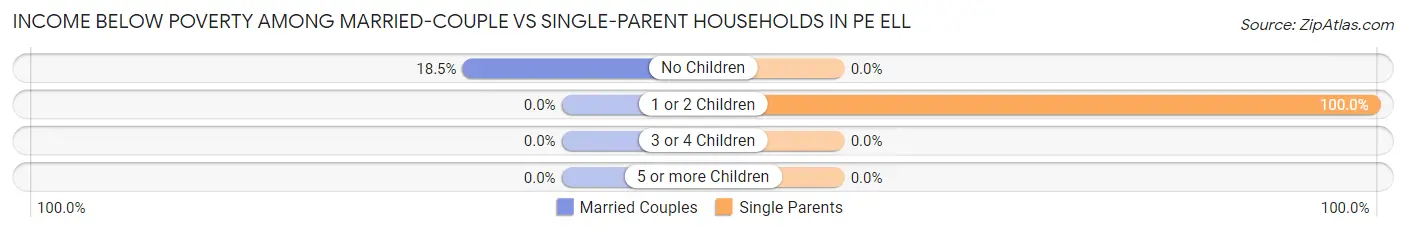
| Children | Married-Couple Families | Single-Parent Households |
| No Children | 12 (18.5%) | 0 (0.0%) |
| 1 or 2 Children | 0 (0.0%) | 10 (100.0%) |
| 3 or 4 Children | 0 (0.0%) | 0 (0.0%) |
| 5 or more Children | 0 (0.0%) | 0 (0.0%) |
| Total | 12 (11.1%) | 10 (40.0%) |
Race in Pe Ell
The most populous races in Pe Ell are White / Caucasian (444 | 86.6%), Two or more Races (67 | 13.1%), and Hispanic or Latino (56 | 10.9%).
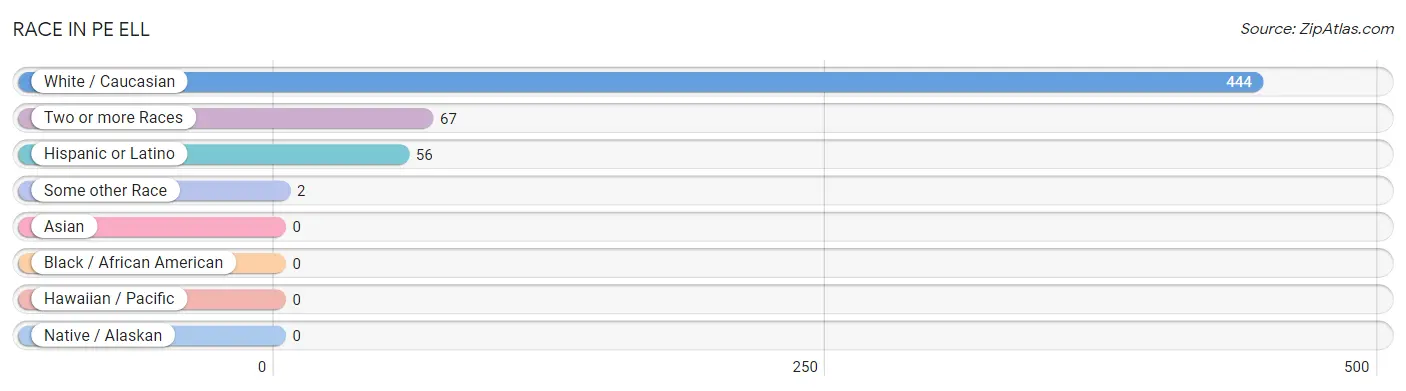
| Race | # Population | % Population |
| Asian | 0 | 0.0% |
| Black / African American | 0 | 0.0% |
| Hawaiian / Pacific | 0 | 0.0% |
| Hispanic or Latino | 56 | 10.9% |
| Native / Alaskan | 0 | 0.0% |
| White / Caucasian | 444 | 86.6% |
| Two or more Races | 67 | 13.1% |
| Some other Race | 2 | 0.4% |
| Total | 513 | 100.0% |
Ancestry in Pe Ell
The most populous ancestries reported in Pe Ell are Polish (83 | 16.2%), German (73 | 14.2%), Irish (71 | 13.8%), Mexican (46 | 9.0%), and Norwegian (44 | 8.6%), together accounting for 61.8% of all Pe Ell residents.
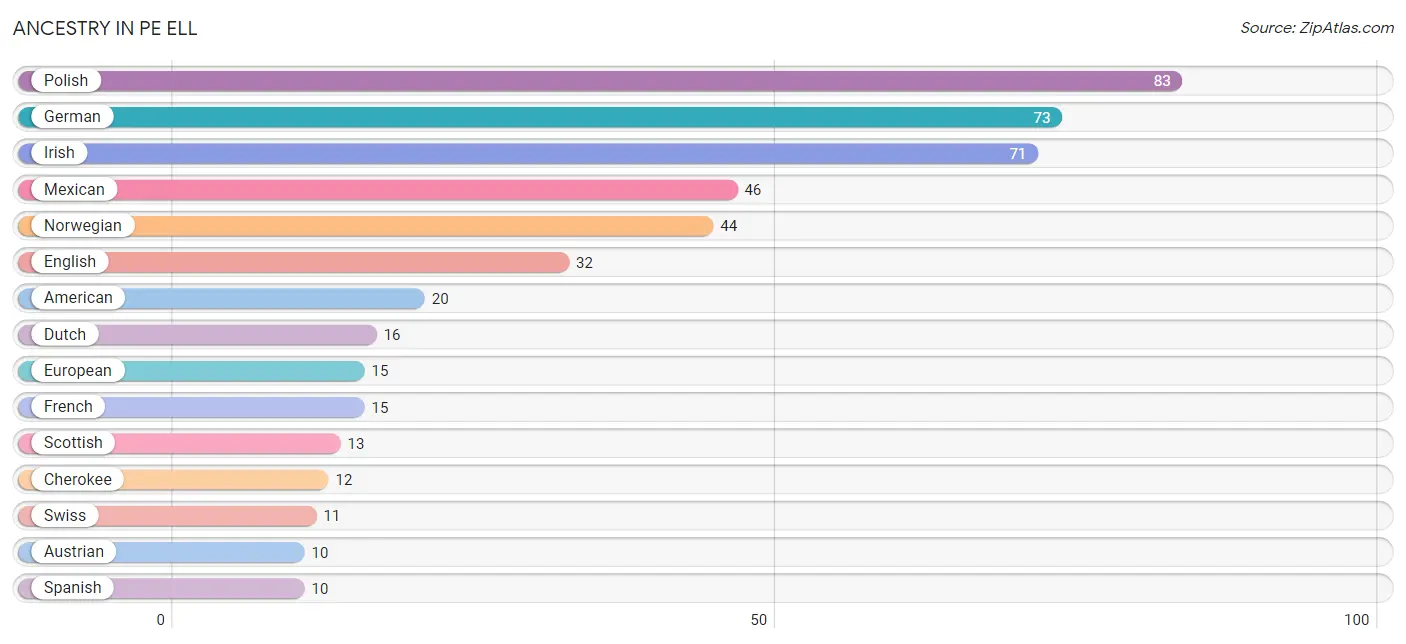
| Ancestry | # Population | % Population |
| American | 20 | 3.9% |
| Austrian | 10 | 1.9% |
| Bhutanese | 6 | 1.2% |
| Cambodian | 7 | 1.4% |
| Cherokee | 12 | 2.3% |
| Chickasaw | 4 | 0.8% |
| Dutch | 16 | 3.1% |
| English | 32 | 6.2% |
| European | 15 | 2.9% |
| French | 15 | 2.9% |
| German | 73 | 14.2% |
| Irish | 71 | 13.8% |
| Mexican | 46 | 9.0% |
| Native Hawaiian | 3 | 0.6% |
| Norwegian | 44 | 8.6% |
| Polish | 83 | 16.2% |
| Scotch-Irish | 2 | 0.4% |
| Scottish | 13 | 2.5% |
| Spanish | 10 | 1.9% |
| Swedish | 10 | 1.9% |
| Swiss | 11 | 2.1% | View All 21 Rows |
Immigrants in Pe Ell
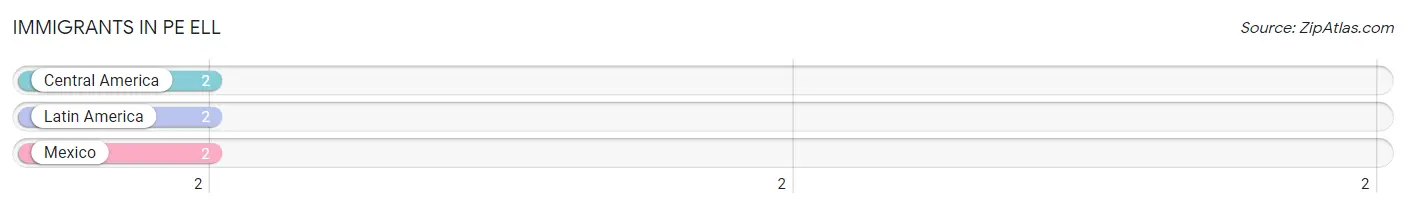
The most numerous immigrant groups reported in Pe Ell came from Central America (2 | 0.4%), Latin America (2 | 0.4%), and Mexico (2 | 0.4%), together accounting for 1.2% of all Pe Ell residents.
| Immigration Origin | # Population | % Population |
| Central America | 2 | 0.4% |
| Latin America | 2 | 0.4% |
| Mexico | 2 | 0.4% | View All 3 Rows |
Sex and Age in Pe Ell
Sex and Age in Pe Ell
The most populous age groups in Pe Ell are 15 to 19 Years (32 | 11.2%) for men and 20 to 24 Years (47 | 20.6%) for women.
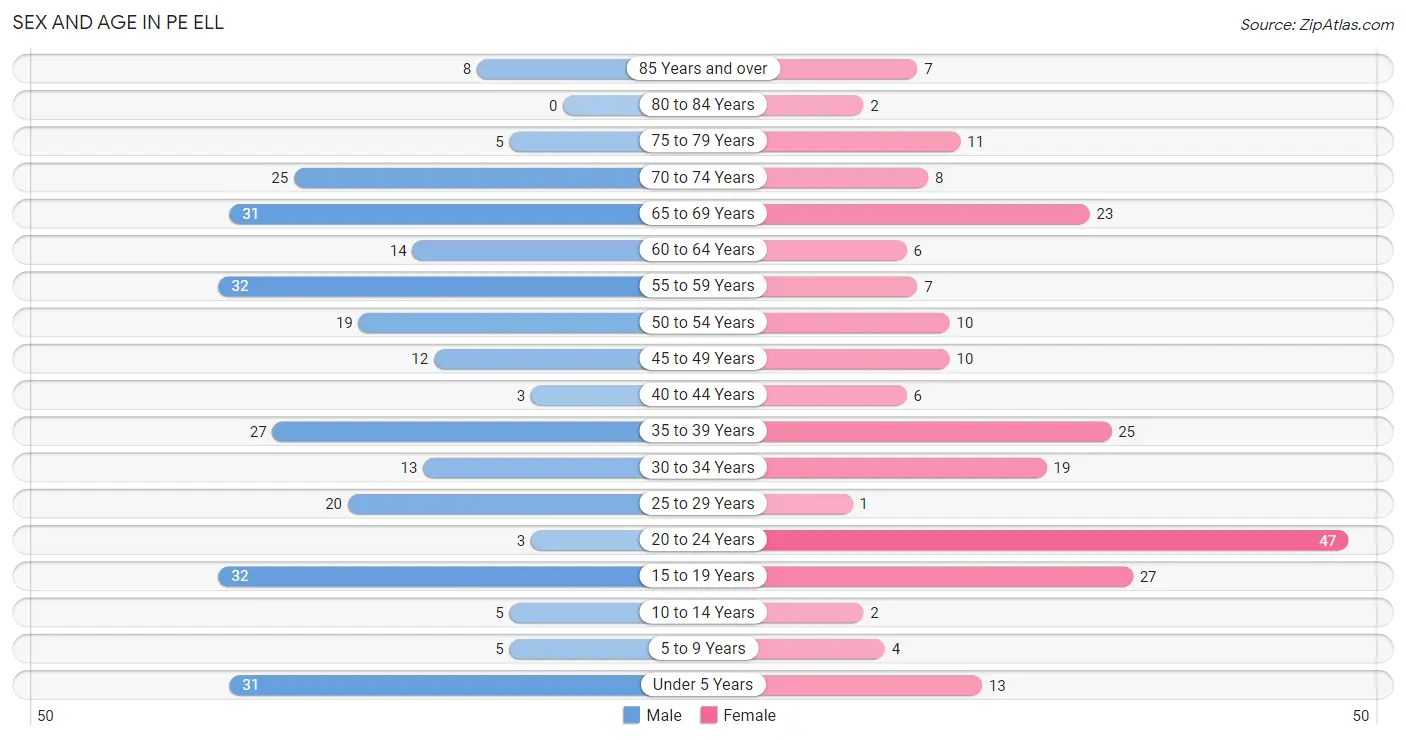
| Age Bracket | Male | Female |
| Under 5 Years | 31 (10.9%) | 13 (5.7%) |
| 5 to 9 Years | 5 (1.8%) | 4 (1.8%) |
| 10 to 14 Years | 5 (1.8%) | 2 (0.9%) |
| 15 to 19 Years | 32 (11.2%) | 27 (11.8%) |
| 20 to 24 Years | 3 (1.1%) | 47 (20.6%) |
| 25 to 29 Years | 20 (7.0%) | 1 (0.4%) |
| 30 to 34 Years | 13 (4.6%) | 19 (8.3%) |
| 35 to 39 Years | 27 (9.5%) | 25 (11.0%) |
| 40 to 44 Years | 3 (1.1%) | 6 (2.6%) |
| 45 to 49 Years | 12 (4.2%) | 10 (4.4%) |
| 50 to 54 Years | 19 (6.7%) | 10 (4.4%) |
| 55 to 59 Years | 32 (11.2%) | 7 (3.1%) |
| 60 to 64 Years | 14 (4.9%) | 6 (2.6%) |
| 65 to 69 Years | 31 (10.9%) | 23 (10.1%) |
| 70 to 74 Years | 25 (8.8%) | 8 (3.5%) |
| 75 to 79 Years | 5 (1.8%) | 11 (4.8%) |
| 80 to 84 Years | 0 (0.0%) | 2 (0.9%) |
| 85 Years and over | 8 (2.8%) | 7 (3.1%) |
| Total | 285 (100.0%) | 228 (100.0%) |
Families and Households in Pe Ell
Median Family Size in Pe Ell
The median family size in Pe Ell is 2.88 persons per family, with single male/father families (13 | 9.8%) accounting for the largest median family size of 3.15 persons per family. On the other hand, single female/mother families (12 | 9.0%) represent the smallest median family size with 2.75 persons per family.
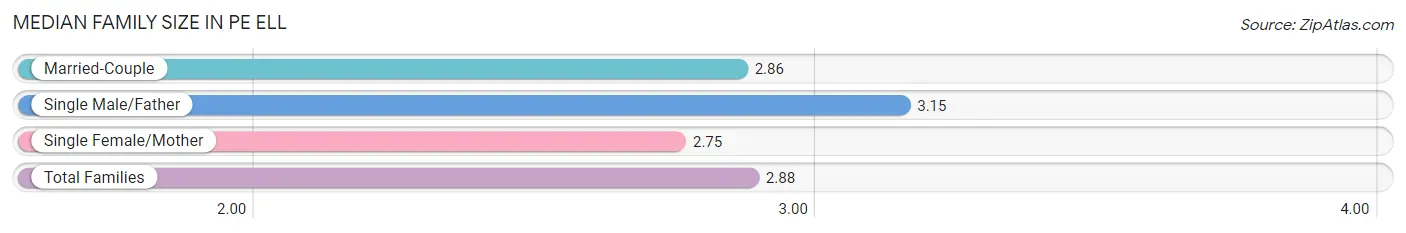
| Family Type | # Families | Family Size |
| Married-Couple | 108 (81.2%) | 2.86 |
| Single Male/Father | 13 (9.8%) | 3.15 |
| Single Female/Mother | 12 (9.0%) | 2.75 |
| Total Families | 133 (100.0%) | 2.88 |
Median Household Size in Pe Ell
The median household size in Pe Ell is 2.30 persons per household, with single male/father households (13 | 5.8%) accounting for the largest median household size of 3.15 persons per household. non-family households (90 | 40.4%) represent the smallest median household size with 1.33 persons per household.
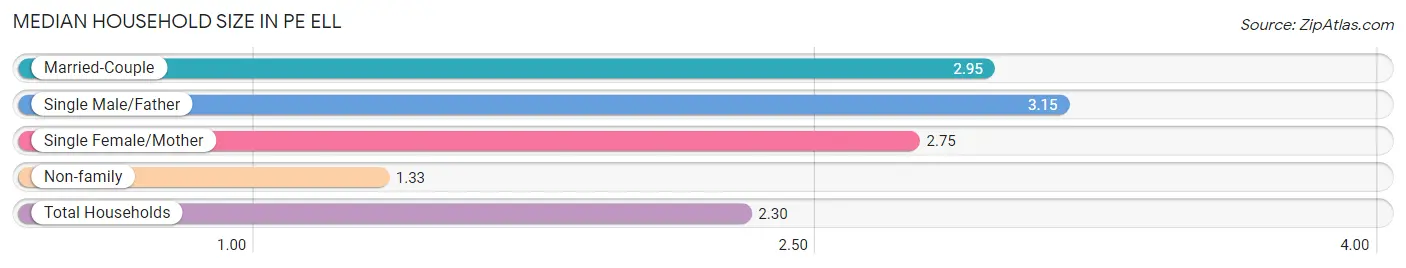
| Household Type | # Households | Household Size |
| Married-Couple | 108 (48.4%) | 2.95 |
| Single Male/Father | 13 (5.8%) | 3.15 |
| Single Female/Mother | 12 (5.4%) | 2.75 |
| Non-family | 90 (40.4%) | 1.33 |
| Total Households | 223 (100.0%) | 2.30 |
Household Size by Marriage Status in Pe Ell
Out of a total of 223 households in Pe Ell, 133 (59.6%) are family households, while 90 (40.4%) are nonfamily households. The most numerous type of family households are 2-person households, comprising 78, and the most common type of nonfamily households are 1-person households, comprising 68.
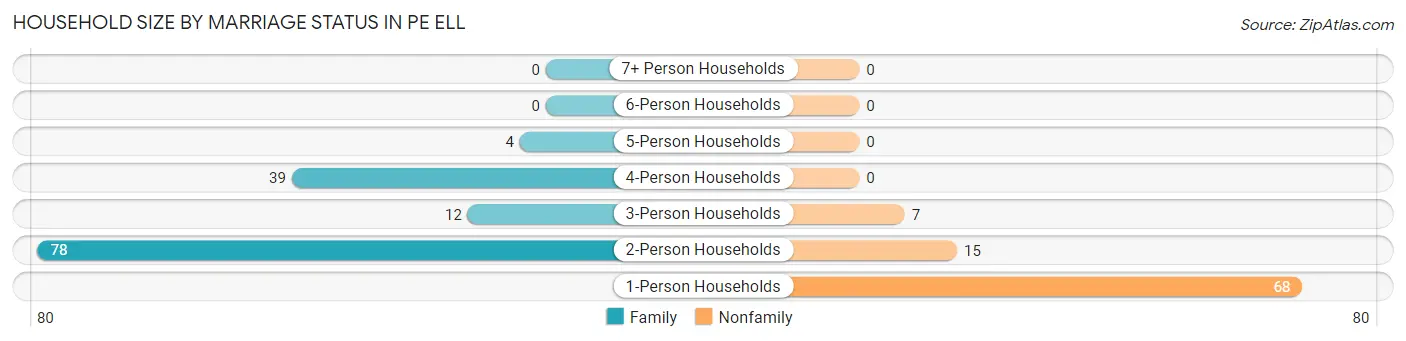
| Household Size | Family Households | Nonfamily Households |
| 1-Person Households | - | 68 (30.5%) |
| 2-Person Households | 78 (35.0%) | 15 (6.7%) |
| 3-Person Households | 12 (5.4%) | 7 (3.1%) |
| 4-Person Households | 39 (17.5%) | 0 (0.0%) |
| 5-Person Households | 4 (1.8%) | 0 (0.0%) |
| 6-Person Households | 0 (0.0%) | 0 (0.0%) |
| 7+ Person Households | 0 (0.0%) | 0 (0.0%) |
| Total | 133 (59.6%) | 90 (40.4%) |
Female Fertility in Pe Ell
Fertility by Age in Pe Ell
Average fertility rate in Pe Ell is 67.0 births per 1,000 women. Women in the age bracket of 20 to 34 years have the highest fertility rate with 134.0 births per 1,000 women. Women in the age bracket of 20 to 34 years acount for 100.0% of all women with births.
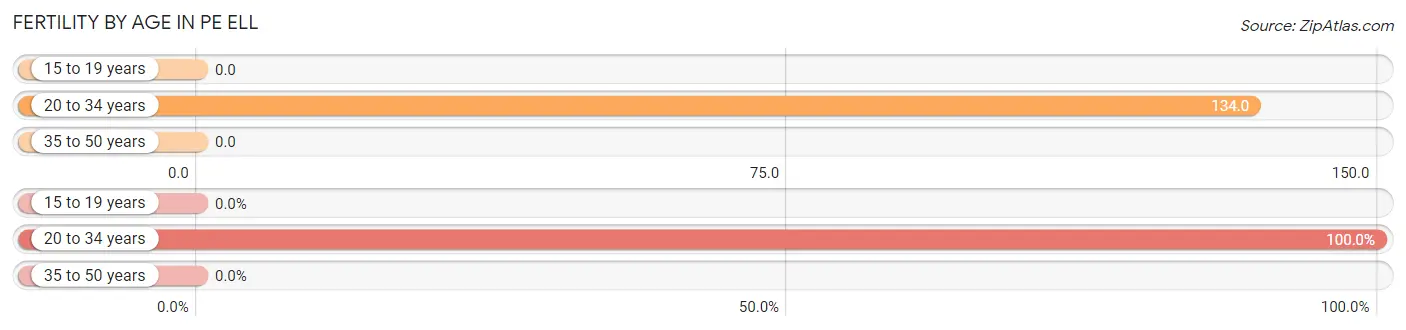
| Age Bracket | Women with Births | Births / 1,000 Women |
| 15 to 19 years | 0 (0.0%) | 0.0 |
| 20 to 34 years | 9 (100.0%) | 134.0 |
| 35 to 50 years | 0 (0.0%) | 0.0 |
| Total | 9 (100.0%) | 67.0 |
Fertility by Age by Marriage Status in Pe Ell
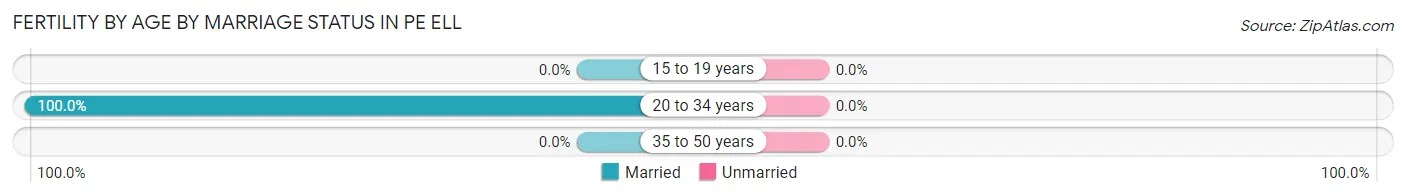
| Age Bracket | Married | Unmarried |
| 15 to 19 years | 0 (0.0%) | 0 (0.0%) |
| 20 to 34 years | 9 (100.0%) | 0 (0.0%) |
| 35 to 50 years | 0 (0.0%) | 0 (0.0%) |
| Total | 9 (100.0%) | 0 (0.0%) |
Fertility by Education in Pe Ell
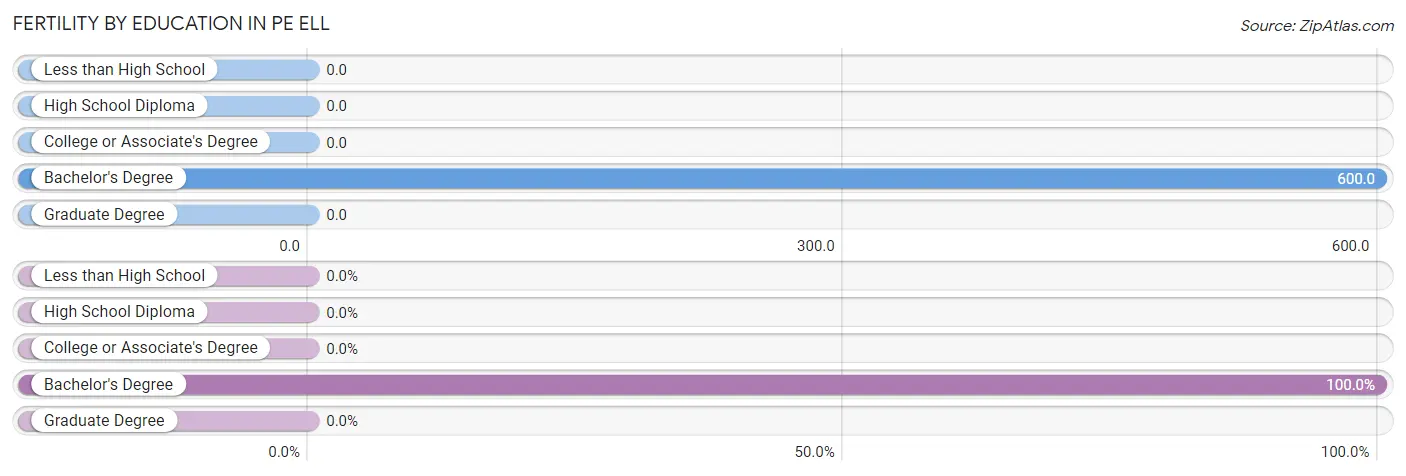
| Educational Attainment | Women with Births | Births / 1,000 Women |
| Less than High School | 0 (0.0%) | 0.0 |
| High School Diploma | 0 (0.0%) | 0.0 |
| College or Associate's Degree | 0 (0.0%) | 0.0 |
| Bachelor's Degree | 9 (100.0%) | 600.0 |
| Graduate Degree | 0 (0.0%) | 0.0 |
| Total | 9 (100.0%) | 67.0 |
Fertility by Education by Marriage Status in Pe Ell
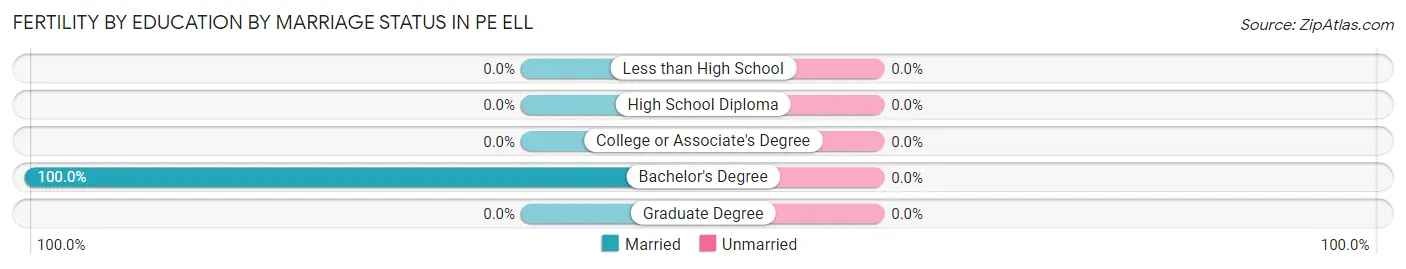
| Educational Attainment | Married | Unmarried |
| Less than High School | 0 (0.0%) | 0 (0.0%) |
| High School Diploma | 0 (0.0%) | 0 (0.0%) |
| College or Associate's Degree | 0 (0.0%) | 0 (0.0%) |
| Bachelor's Degree | 9 (100.0%) | 0 (0.0%) |
| Graduate Degree | 0 (0.0%) | 0 (0.0%) |
| Total | 9 (100.0%) | 0 (0.0%) |
Employment Characteristics in Pe Ell
Employment by Class of Employer in Pe Ell
Among the 247 employed individuals in Pe Ell, private company employees (147 | 59.5%), self-employed (not incorporated) (43 | 17.4%), and local government employees (27 | 10.9%) make up the most common classes of employment.
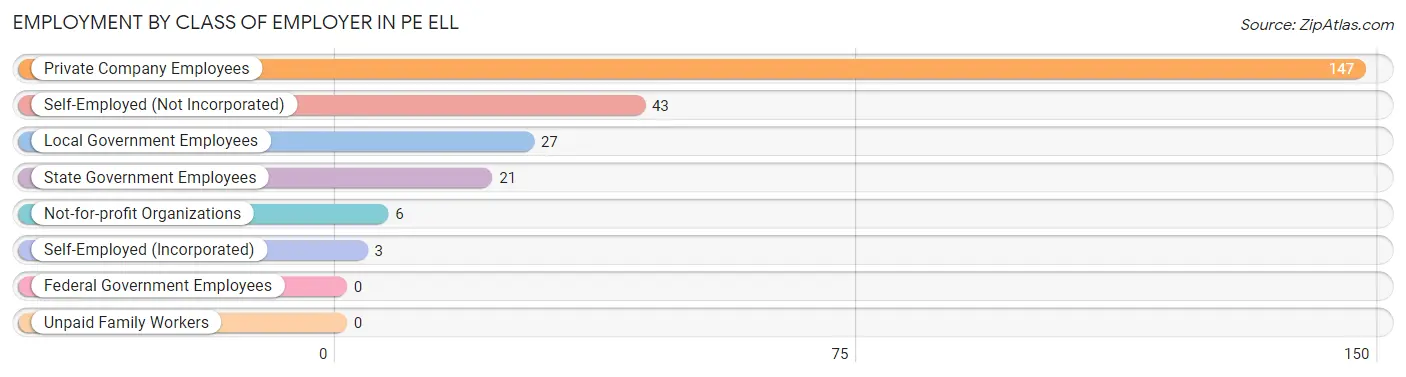
| Employer Class | # Employees | % Employees |
| Private Company Employees | 147 | 59.5% |
| Self-Employed (Incorporated) | 3 | 1.2% |
| Self-Employed (Not Incorporated) | 43 | 17.4% |
| Not-for-profit Organizations | 6 | 2.4% |
| Local Government Employees | 27 | 10.9% |
| State Government Employees | 21 | 8.5% |
| Federal Government Employees | 0 | 0.0% |
| Unpaid Family Workers | 0 | 0.0% |
| Total | 247 | 100.0% |
Employment Status by Age in Pe Ell
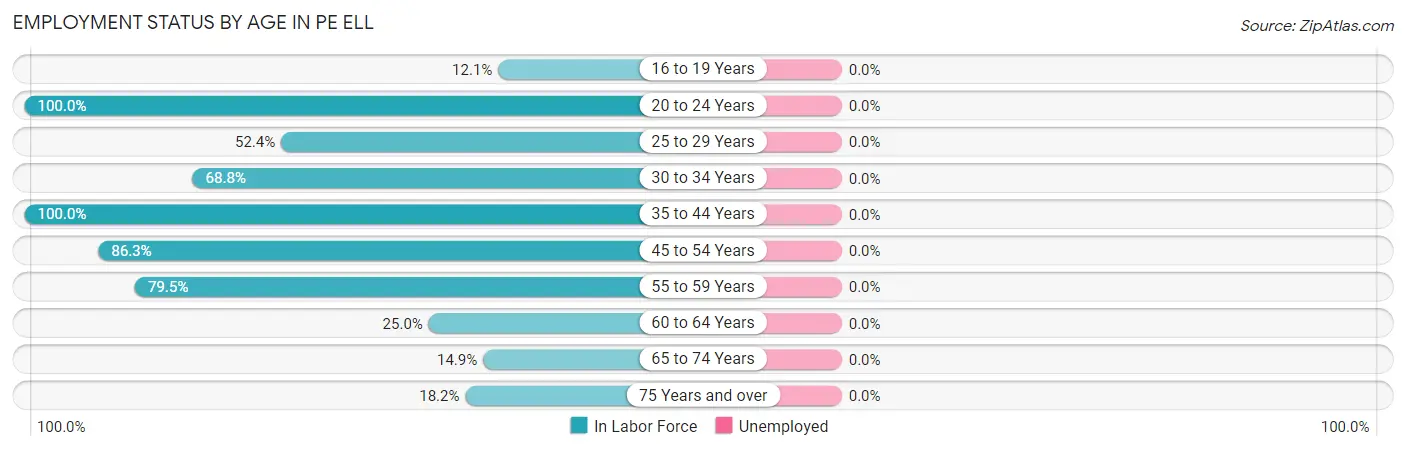
| Age Bracket | In Labor Force | Unemployed |
| 16 to 19 Years | 7 (12.1%) | 0 (0.0%) |
| 20 to 24 Years | 50 (100.0%) | 0 (0.0%) |
| 25 to 29 Years | 11 (52.4%) | 0 (0.0%) |
| 30 to 34 Years | 22 (68.8%) | 0 (0.0%) |
| 35 to 44 Years | 61 (100.0%) | 0 (0.0%) |
| 45 to 54 Years | 44 (86.3%) | 0 (0.0%) |
| 55 to 59 Years | 31 (79.5%) | 0 (0.0%) |
| 60 to 64 Years | 5 (25.0%) | 0 (0.0%) |
| 65 to 74 Years | 13 (14.9%) | 0 (0.0%) |
| 75 Years and over | 6 (18.2%) | 0 (0.0%) |
| Total | 250 (55.3%) | 0 (0.0%) |
Employment Status by Educational Attainment in Pe Ell
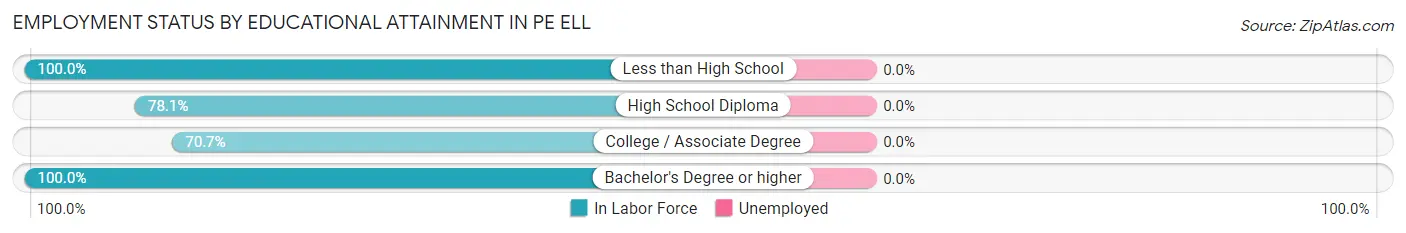
| Educational Attainment | In Labor Force | Unemployed |
| Less than High School | 7 (100.0%) | 0 (0.0%) |
| High School Diploma | 57 (78.1%) | 0 (0.0%) |
| College / Associate Degree | 82 (70.7%) | 0 (0.0%) |
| Bachelor's Degree or higher | 28 (100.0%) | 0 (0.0%) |
| Total | 174 (77.7%) | 0 (0.0%) |
Employment Occupations by Sex in Pe Ell
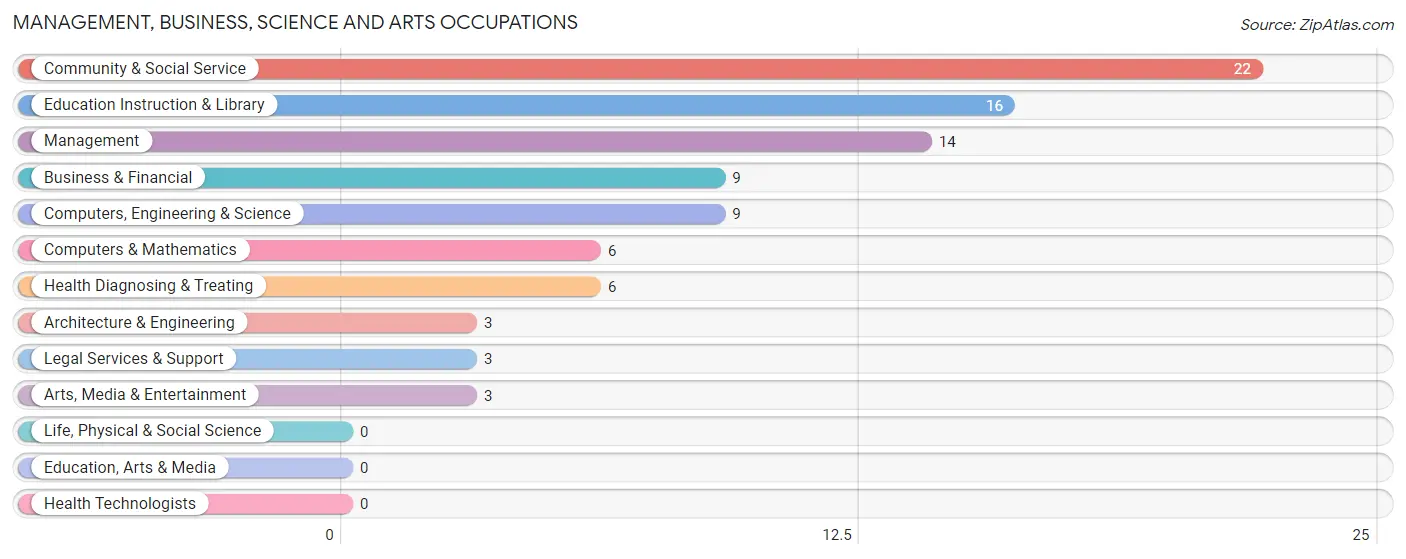
Management, Business, Science and Arts Occupations
The most common Management, Business, Science and Arts occupations in Pe Ell are Community & Social Service (22 | 8.8%), Education Instruction & Library (16 | 6.4%), Management (14 | 5.6%), Business & Financial (9 | 3.6%), and Computers, Engineering & Science (9 | 3.6%).
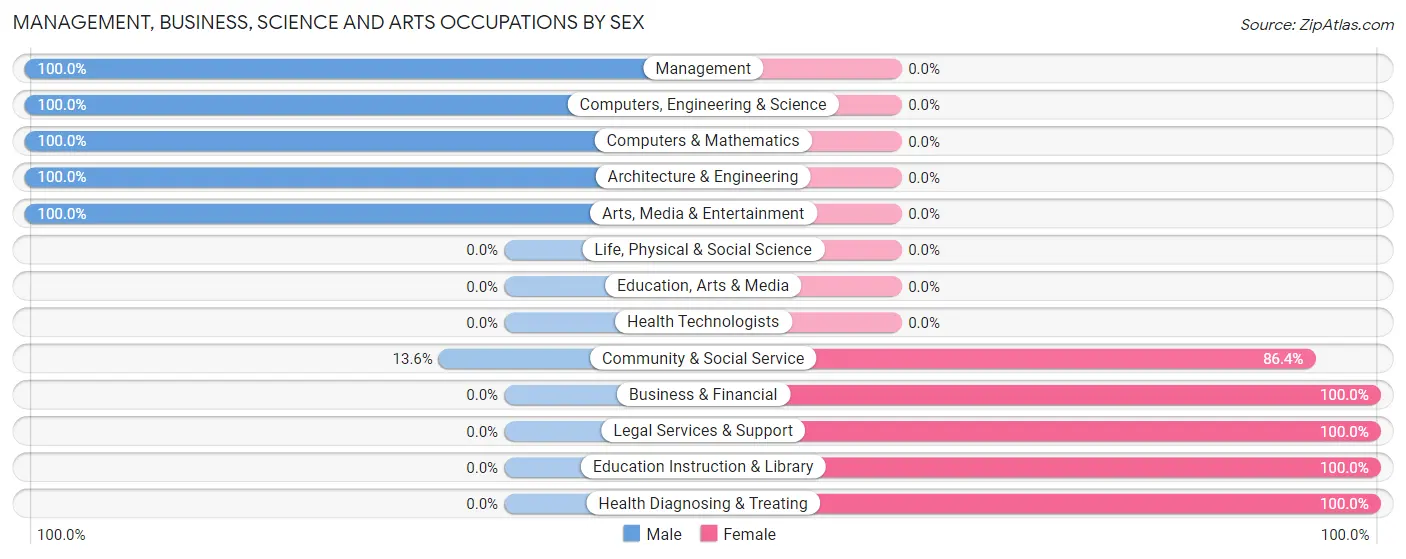
Management, Business, Science and Arts Occupations by Sex
Within the Management, Business, Science and Arts occupations in Pe Ell, the most male-oriented occupations are Management (100.0%), Computers, Engineering & Science (100.0%), and Computers & Mathematics (100.0%), while the most female-oriented occupations are Business & Financial (100.0%), Legal Services & Support (100.0%), and Education Instruction & Library (100.0%).
| Occupation | Male | Female |
| Management | 14 (100.0%) | 0 (0.0%) |
| Business & Financial | 0 (0.0%) | 9 (100.0%) |
| Computers, Engineering & Science | 9 (100.0%) | 0 (0.0%) |
| Computers & Mathematics | 6 (100.0%) | 0 (0.0%) |
| Architecture & Engineering | 3 (100.0%) | 0 (0.0%) |
| Life, Physical & Social Science | 0 (0.0%) | 0 (0.0%) |
| Community & Social Service | 3 (13.6%) | 19 (86.4%) |
| Education, Arts & Media | 0 (0.0%) | 0 (0.0%) |
| Legal Services & Support | 0 (0.0%) | 3 (100.0%) |
| Education Instruction & Library | 0 (0.0%) | 16 (100.0%) |
| Arts, Media & Entertainment | 3 (100.0%) | 0 (0.0%) |
| Health Diagnosing & Treating | 0 (0.0%) | 6 (100.0%) |
| Health Technologists | 0 (0.0%) | 0 (0.0%) |
| Total (Category) | 26 (43.3%) | 34 (56.7%) |
| Total (Overall) | 133 (53.2%) | 117 (46.8%) |
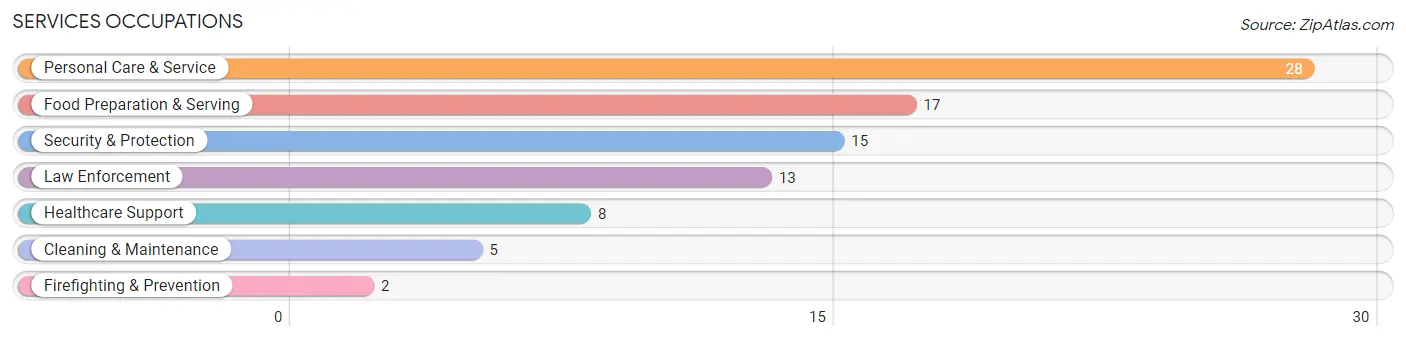
Services Occupations
The most common Services occupations in Pe Ell are Personal Care & Service (28 | 11.2%), Food Preparation & Serving (17 | 6.8%), Security & Protection (15 | 6.0%), Law Enforcement (13 | 5.2%), and Healthcare Support (8 | 3.2%).
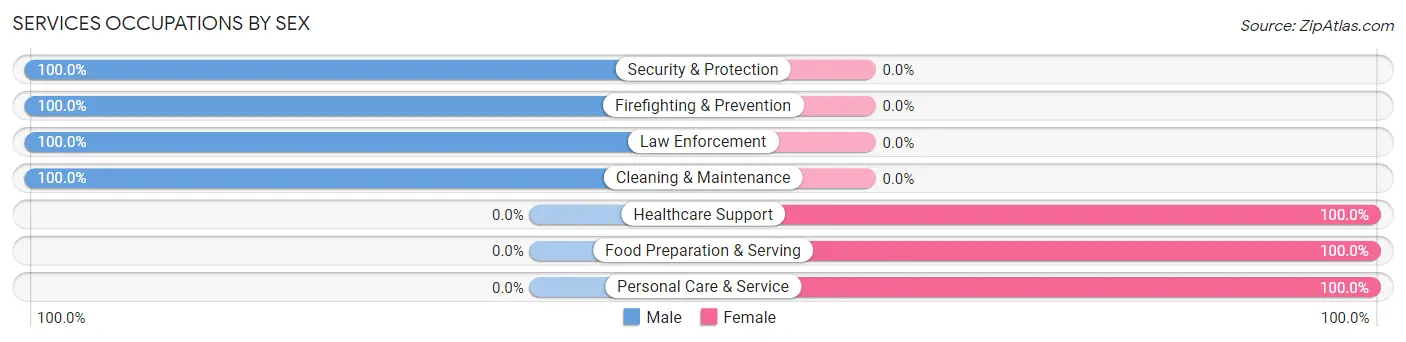
Services Occupations by Sex
Within the Services occupations in Pe Ell, the most male-oriented occupations are Security & Protection (100.0%), Firefighting & Prevention (100.0%), and Law Enforcement (100.0%), while the most female-oriented occupations are Healthcare Support (100.0%), Food Preparation & Serving (100.0%), and Personal Care & Service (100.0%).
| Occupation | Male | Female |
| Healthcare Support | 0 (0.0%) | 8 (100.0%) |
| Security & Protection | 15 (100.0%) | 0 (0.0%) |
| Firefighting & Prevention | 2 (100.0%) | 0 (0.0%) |
| Law Enforcement | 13 (100.0%) | 0 (0.0%) |
| Food Preparation & Serving | 0 (0.0%) | 17 (100.0%) |
| Cleaning & Maintenance | 5 (100.0%) | 0 (0.0%) |
| Personal Care & Service | 0 (0.0%) | 28 (100.0%) |
| Total (Category) | 20 (27.4%) | 53 (72.6%) |
| Total (Overall) | 133 (53.2%) | 117 (46.8%) |
Sales and Office Occupations
The most common Sales and Office occupations in Pe Ell are Sales & Related (16 | 6.4%), and Office & Administration (6 | 2.4%).
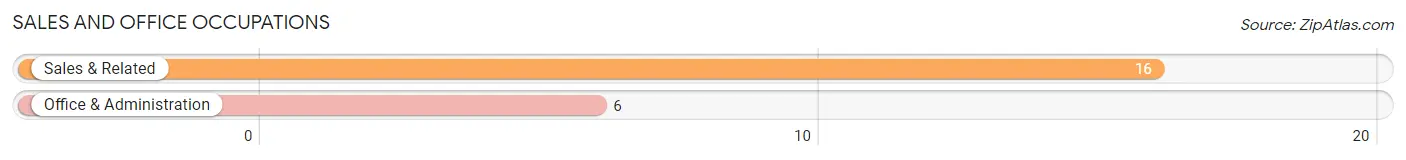
Sales and Office Occupations by Sex
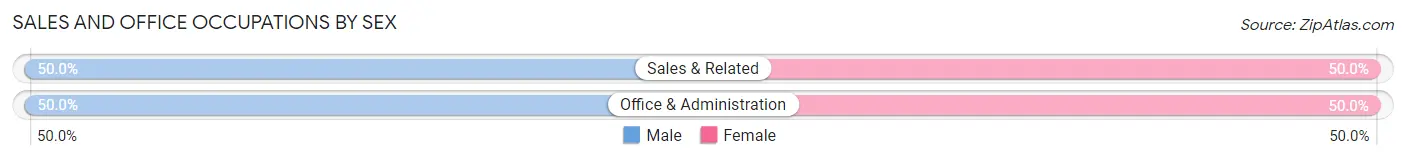
| Occupation | Male | Female |
| Sales & Related | 8 (50.0%) | 8 (50.0%) |
| Office & Administration | 3 (50.0%) | 3 (50.0%) |
| Total (Category) | 11 (50.0%) | 11 (50.0%) |
| Total (Overall) | 133 (53.2%) | 117 (46.8%) |
Natural Resources, Construction and Maintenance Occupations
The most common Natural Resources, Construction and Maintenance occupations in Pe Ell are Construction & Extraction (11 | 4.4%), Farming, Fishing & Forestry (8 | 3.2%), and Installation, Maintenance & Repair (5 | 2.0%).
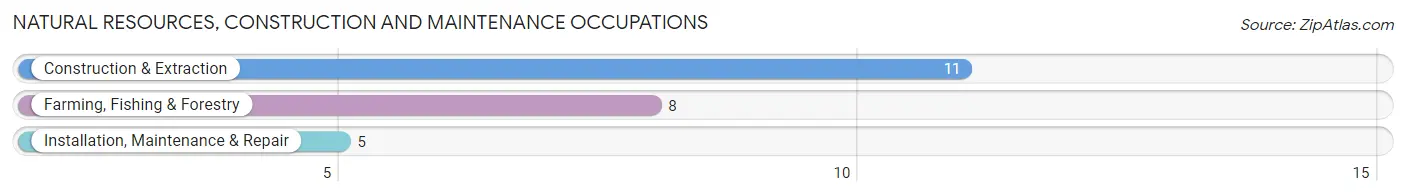
Natural Resources, Construction and Maintenance Occupations by Sex
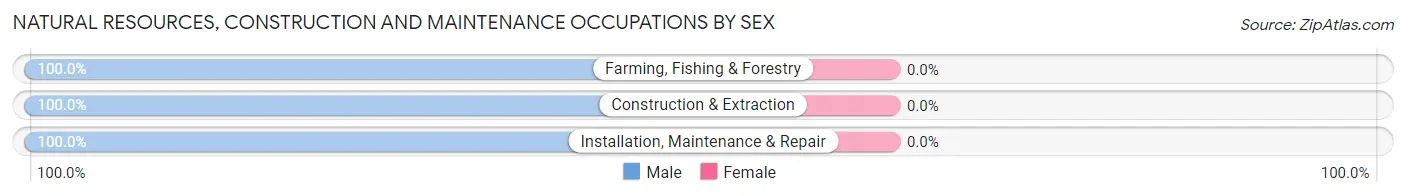
| Occupation | Male | Female |
| Farming, Fishing & Forestry | 8 (100.0%) | 0 (0.0%) |
| Construction & Extraction | 11 (100.0%) | 0 (0.0%) |
| Installation, Maintenance & Repair | 5 (100.0%) | 0 (0.0%) |
| Total (Category) | 24 (100.0%) | 0 (0.0%) |
| Total (Overall) | 133 (53.2%) | 117 (46.8%) |
Production, Transportation and Moving Occupations
The most common Production, Transportation and Moving occupations in Pe Ell are Material Moving (33 | 13.2%), Transportation (25 | 10.0%), and Production (13 | 5.2%).
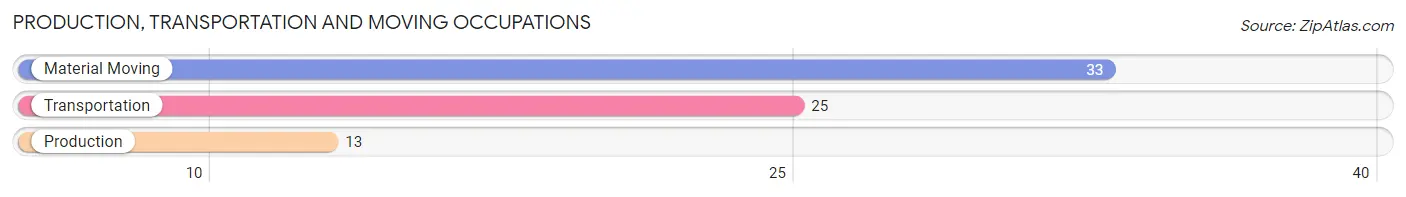
Production, Transportation and Moving Occupations by Sex
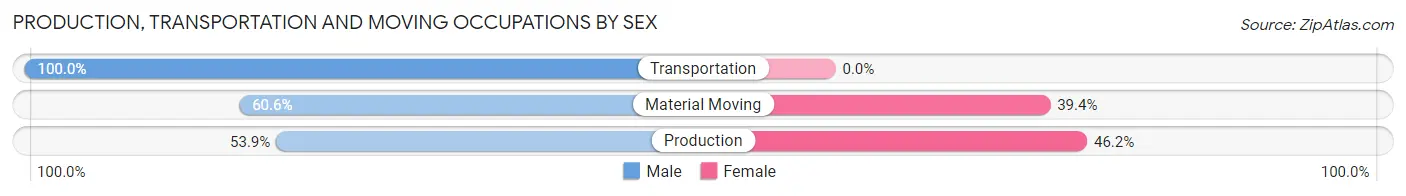
| Occupation | Male | Female |
| Production | 7 (53.8%) | 6 (46.2%) |
| Transportation | 25 (100.0%) | 0 (0.0%) |
| Material Moving | 20 (60.6%) | 13 (39.4%) |
| Total (Category) | 52 (73.2%) | 19 (26.8%) |
| Total (Overall) | 133 (53.2%) | 117 (46.8%) |
Employment Industries by Sex in Pe Ell
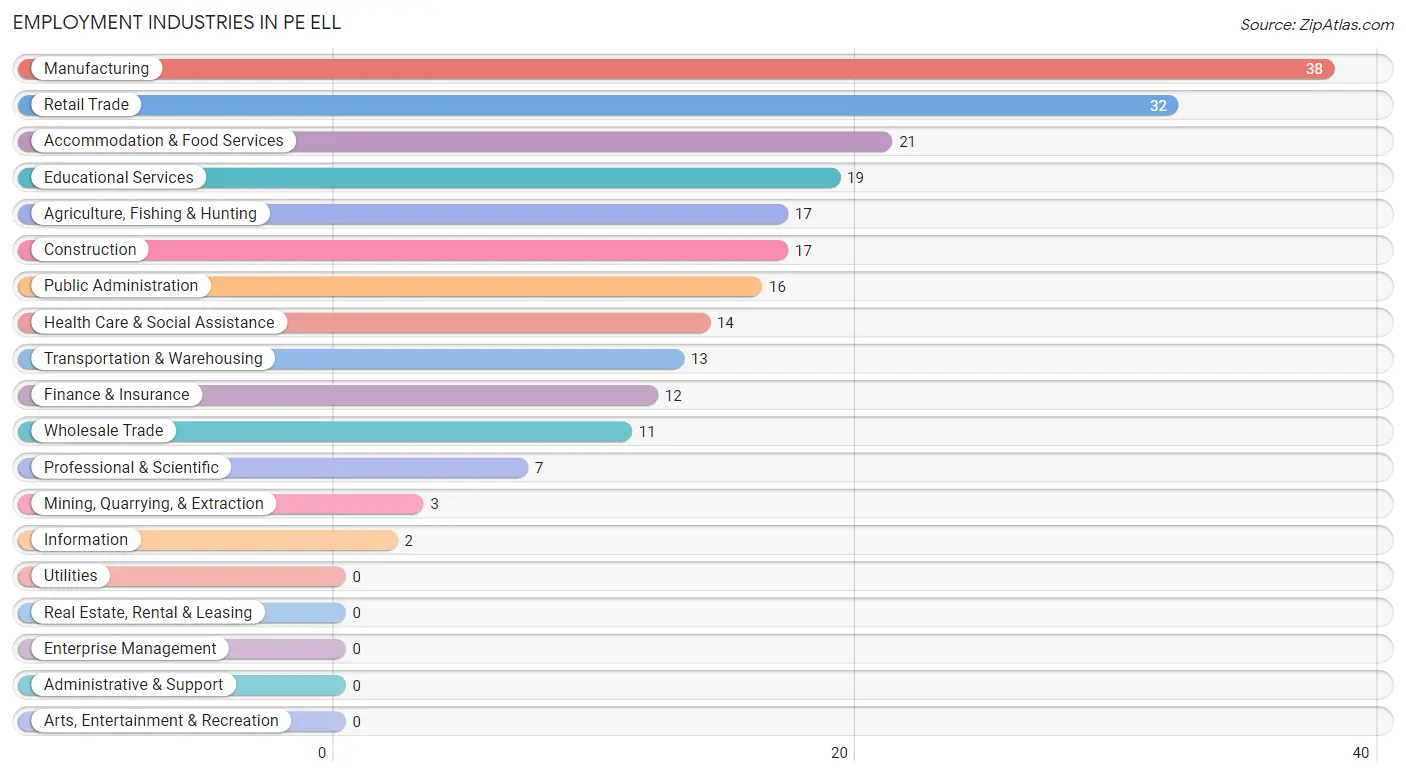
Employment Industries in Pe Ell
The major employment industries in Pe Ell include Manufacturing (38 | 15.2%), Retail Trade (32 | 12.8%), Accommodation & Food Services (21 | 8.4%), Educational Services (19 | 7.6%), and Agriculture, Fishing & Hunting (17 | 6.8%).
Employment Industries by Sex in Pe Ell
The Pe Ell industries that see more men than women are Agriculture, Fishing & Hunting (100.0%), Mining, Quarrying, & Extraction (100.0%), and Construction (100.0%), whereas the industries that tend to have a higher number of women are Information (100.0%), Finance & Insurance (100.0%), and Retail Trade (87.5%).
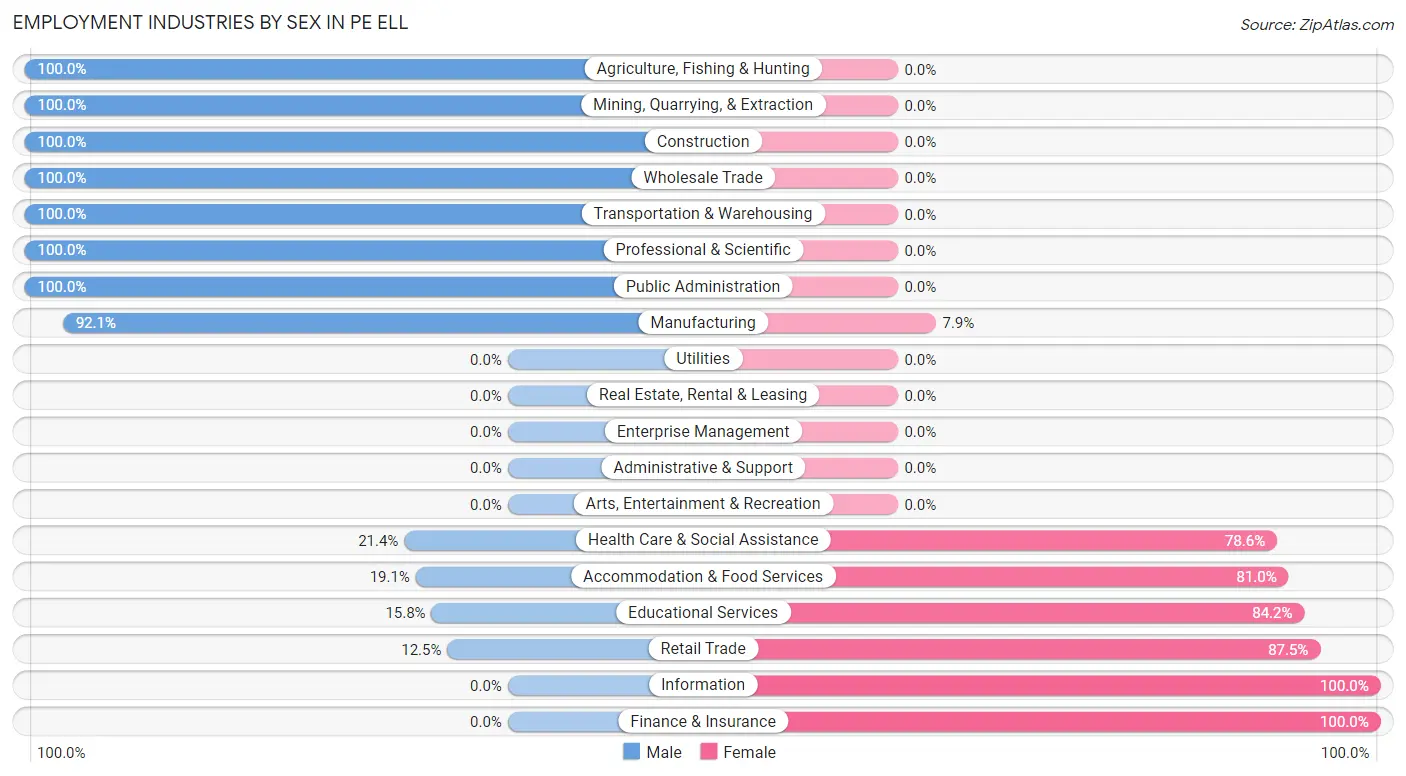
| Industry | Male | Female |
| Agriculture, Fishing & Hunting | 17 (100.0%) | 0 (0.0%) |
| Mining, Quarrying, & Extraction | 3 (100.0%) | 0 (0.0%) |
| Construction | 17 (100.0%) | 0 (0.0%) |
| Manufacturing | 35 (92.1%) | 3 (7.9%) |
| Wholesale Trade | 11 (100.0%) | 0 (0.0%) |
| Retail Trade | 4 (12.5%) | 28 (87.5%) |
| Transportation & Warehousing | 13 (100.0%) | 0 (0.0%) |
| Utilities | 0 (0.0%) | 0 (0.0%) |
| Information | 0 (0.0%) | 2 (100.0%) |
| Finance & Insurance | 0 (0.0%) | 12 (100.0%) |
| Real Estate, Rental & Leasing | 0 (0.0%) | 0 (0.0%) |
| Professional & Scientific | 7 (100.0%) | 0 (0.0%) |
| Enterprise Management | 0 (0.0%) | 0 (0.0%) |
| Administrative & Support | 0 (0.0%) | 0 (0.0%) |
| Educational Services | 3 (15.8%) | 16 (84.2%) |
| Health Care & Social Assistance | 3 (21.4%) | 11 (78.6%) |
| Arts, Entertainment & Recreation | 0 (0.0%) | 0 (0.0%) |
| Accommodation & Food Services | 4 (19.1%) | 17 (80.9%) |
| Public Administration | 16 (100.0%) | 0 (0.0%) |
| Total | 133 (53.2%) | 117 (46.8%) |
Education in Pe Ell
School Enrollment in Pe Ell
The most common levels of schooling among the 102 students in Pe Ell are high school (59 | 57.8%), nursery / preschool (17 | 16.7%), and elementary school (11 | 10.8%).
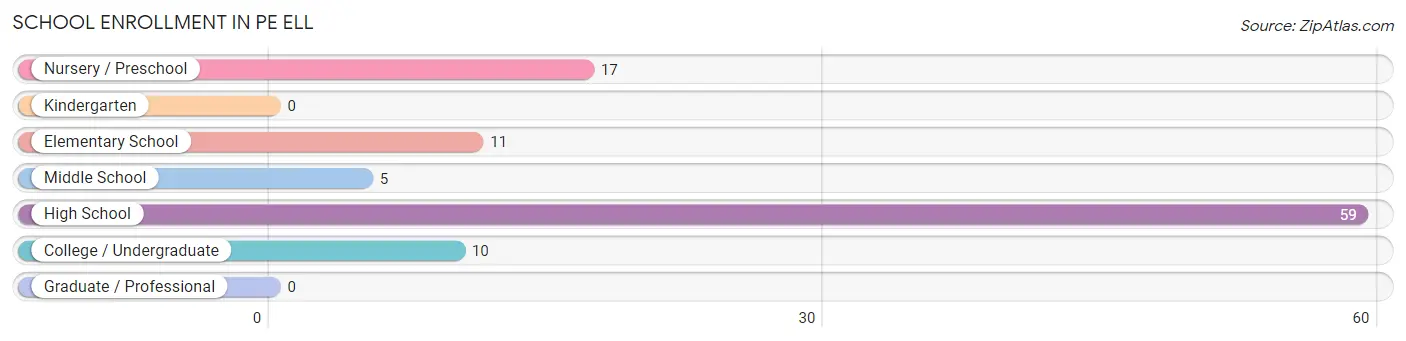
| School Level | # Students | % Students |
| Nursery / Preschool | 17 | 16.7% |
| Kindergarten | 0 | 0.0% |
| Elementary School | 11 | 10.8% |
| Middle School | 5 | 4.9% |
| High School | 59 | 57.8% |
| College / Undergraduate | 10 | 9.8% |
| Graduate / Professional | 0 | 0.0% |
| Total | 102 | 100.0% |
School Enrollment by Age by Funding Source in Pe Ell
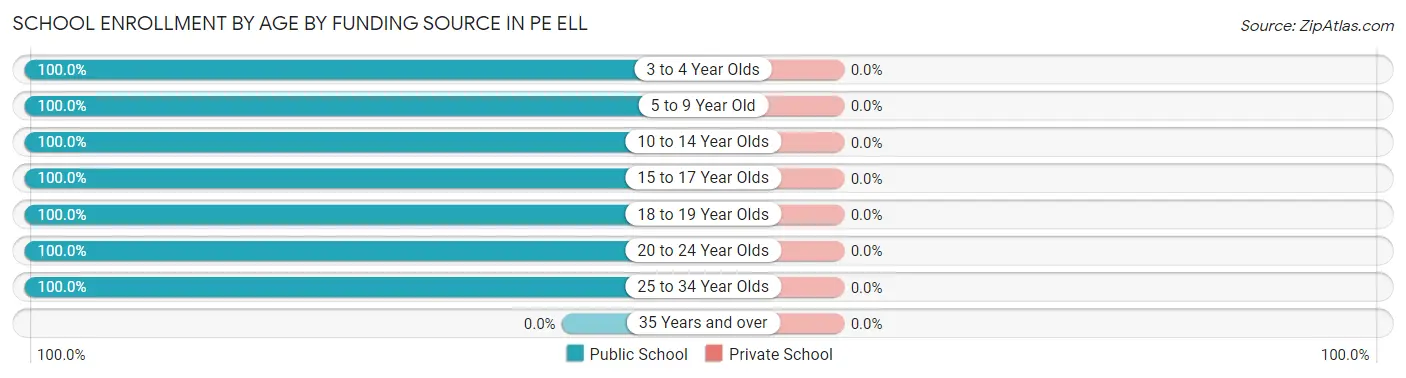
| Age Bracket | Public School | Private School |
| 3 to 4 Year Olds | 17 (100.0%) | 0 (0.0%) |
| 5 to 9 Year Old | 9 (100.0%) | 0 (0.0%) |
| 10 to 14 Year Olds | 7 (100.0%) | 0 (0.0%) |
| 15 to 17 Year Olds | 49 (100.0%) | 0 (0.0%) |
| 18 to 19 Year Olds | 10 (100.0%) | 0 (0.0%) |
| 20 to 24 Year Olds | 6 (100.0%) | 0 (0.0%) |
| 25 to 34 Year Olds | 4 (100.0%) | 0 (0.0%) |
| 35 Years and over | 0 (0.0%) | 0 (0.0%) |
| Total | 102 (100.0%) | 0 (0.0%) |
Educational Attainment by Field of Study in Pe Ell
Science & technology (14 | 41.2%), education (11 | 32.4%), business (6 | 17.6%), and engineering (3 | 8.8%) are the most common fields of study among 34 individuals in Pe Ell who have obtained a bachelor's degree or higher.
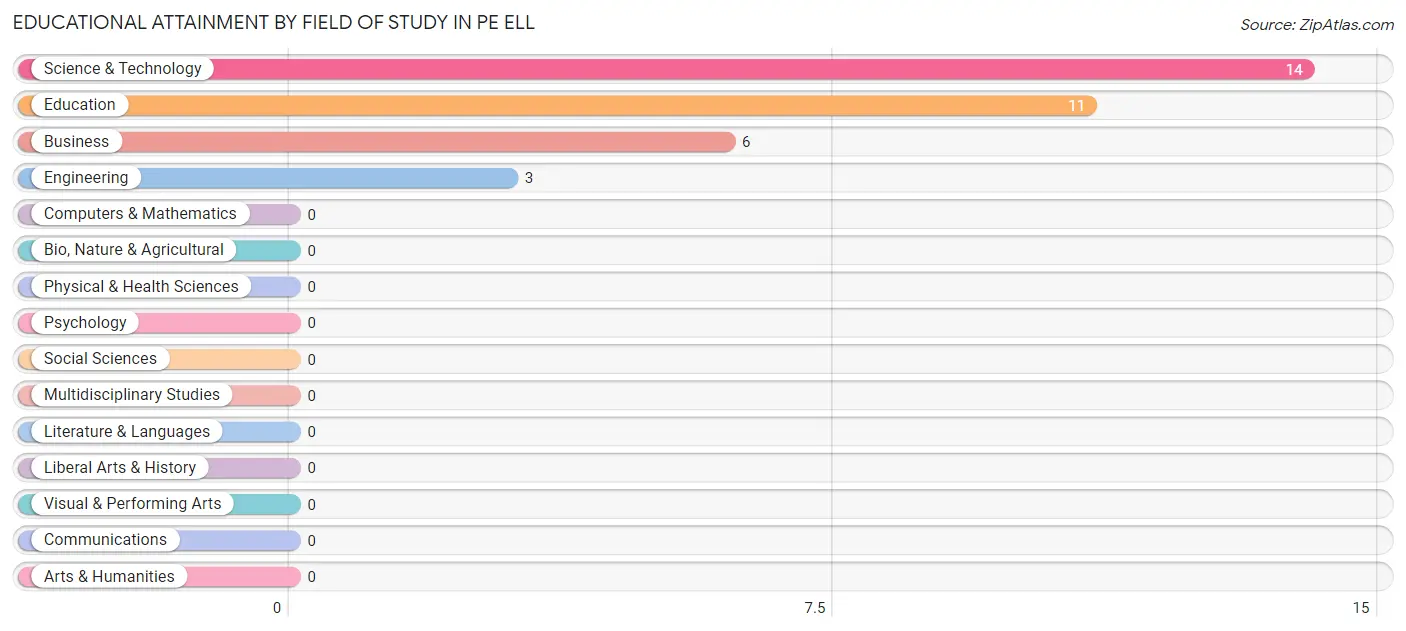
| Field of Study | # Graduates | % Graduates |
| Computers & Mathematics | 0 | 0.0% |
| Bio, Nature & Agricultural | 0 | 0.0% |
| Physical & Health Sciences | 0 | 0.0% |
| Psychology | 0 | 0.0% |
| Social Sciences | 0 | 0.0% |
| Engineering | 3 | 8.8% |
| Multidisciplinary Studies | 0 | 0.0% |
| Science & Technology | 14 | 41.2% |
| Business | 6 | 17.6% |
| Education | 11 | 32.4% |
| Literature & Languages | 0 | 0.0% |
| Liberal Arts & History | 0 | 0.0% |
| Visual & Performing Arts | 0 | 0.0% |
| Communications | 0 | 0.0% |
| Arts & Humanities | 0 | 0.0% |
| Total | 34 | 100.0% |
Transportation & Commute in Pe Ell
Vehicle Availability by Sex in Pe Ell
The most prevalent vehicle ownership categories in Pe Ell are males with 2 vehicles (71, accounting for 54.6%) and females with 2 vehicles (55, making up 60.7%).
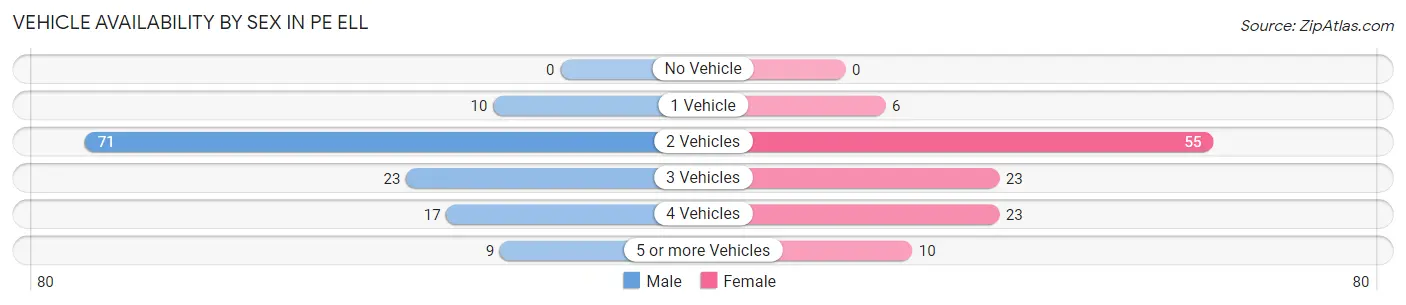
| Vehicles Available | Male | Female |
| No Vehicle | 0 (0.0%) | 0 (0.0%) |
| 1 Vehicle | 10 (7.7%) | 6 (5.1%) |
| 2 Vehicles | 71 (54.6%) | 55 (47.0%) |
| 3 Vehicles | 23 (17.7%) | 23 (19.7%) |
| 4 Vehicles | 17 (13.1%) | 23 (19.7%) |
| 5 or more Vehicles | 9 (6.9%) | 10 (8.6%) |
| Total | 130 (100.0%) | 117 (100.0%) |
Commute Time in Pe Ell
The most frequently occuring commute durations in Pe Ell are 45 to 59 minutes (57 commuters, 25.0%), less than 5 minutes (37 commuters, 16.2%), and 35 to 39 minutes (33 commuters, 14.5%).
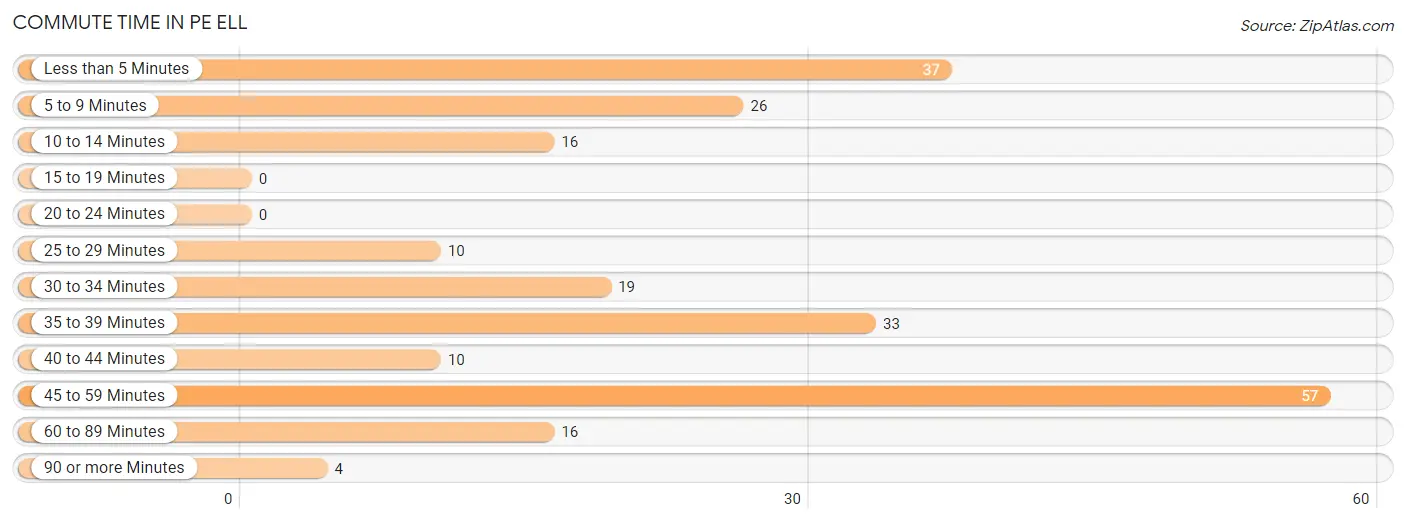
| Commute Time | # Commuters | % Commuters |
| Less than 5 Minutes | 37 | 16.2% |
| 5 to 9 Minutes | 26 | 11.4% |
| 10 to 14 Minutes | 16 | 7.0% |
| 15 to 19 Minutes | 0 | 0.0% |
| 20 to 24 Minutes | 0 | 0.0% |
| 25 to 29 Minutes | 10 | 4.4% |
| 30 to 34 Minutes | 19 | 8.3% |
| 35 to 39 Minutes | 33 | 14.5% |
| 40 to 44 Minutes | 10 | 4.4% |
| 45 to 59 Minutes | 57 | 25.0% |
| 60 to 89 Minutes | 16 | 7.0% |
| 90 or more Minutes | 4 | 1.8% |
Commute Time by Sex in Pe Ell
The most common commute times in Pe Ell are 35 to 39 minutes (28 commuters, 22.8%) for males and 45 to 59 minutes (34 commuters, 32.4%) for females.
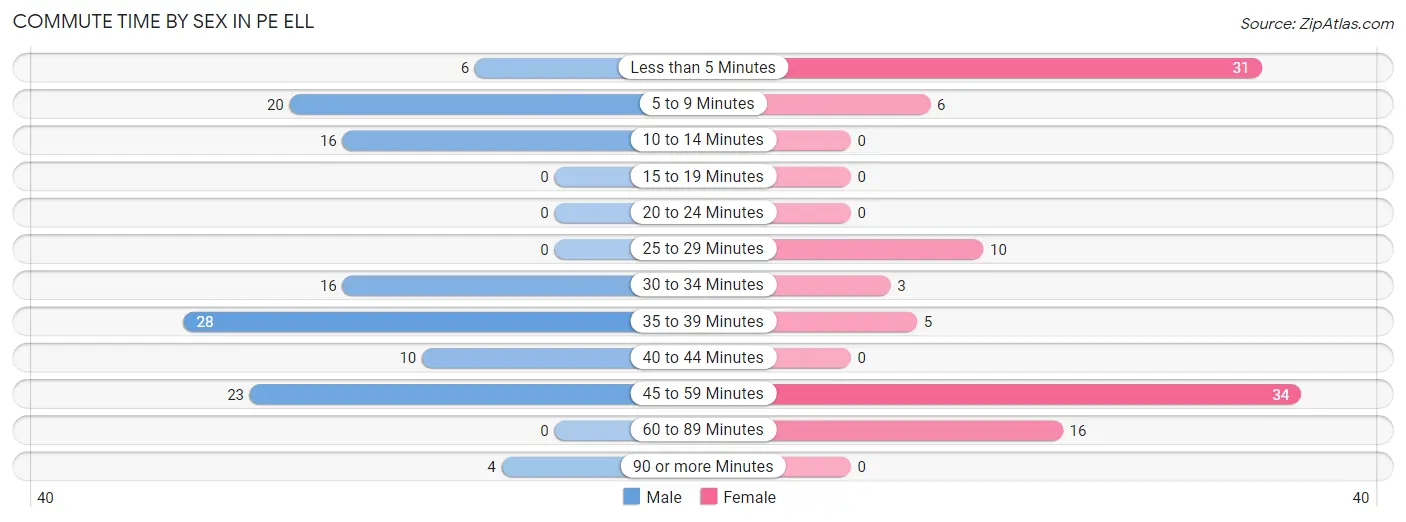
| Commute Time | Male | Female |
| Less than 5 Minutes | 6 (4.9%) | 31 (29.5%) |
| 5 to 9 Minutes | 20 (16.3%) | 6 (5.7%) |
| 10 to 14 Minutes | 16 (13.0%) | 0 (0.0%) |
| 15 to 19 Minutes | 0 (0.0%) | 0 (0.0%) |
| 20 to 24 Minutes | 0 (0.0%) | 0 (0.0%) |
| 25 to 29 Minutes | 0 (0.0%) | 10 (9.5%) |
| 30 to 34 Minutes | 16 (13.0%) | 3 (2.9%) |
| 35 to 39 Minutes | 28 (22.8%) | 5 (4.8%) |
| 40 to 44 Minutes | 10 (8.1%) | 0 (0.0%) |
| 45 to 59 Minutes | 23 (18.7%) | 34 (32.4%) |
| 60 to 89 Minutes | 0 (0.0%) | 16 (15.2%) |
| 90 or more Minutes | 4 (3.3%) | 0 (0.0%) |
Time of Departure to Work by Sex in Pe Ell
The most frequent times of departure to work in Pe Ell are 12:00 AM to 4:59 AM (43, 35.0%) for males and 9:00 AM to 9:59 AM (41, 39.1%) for females.
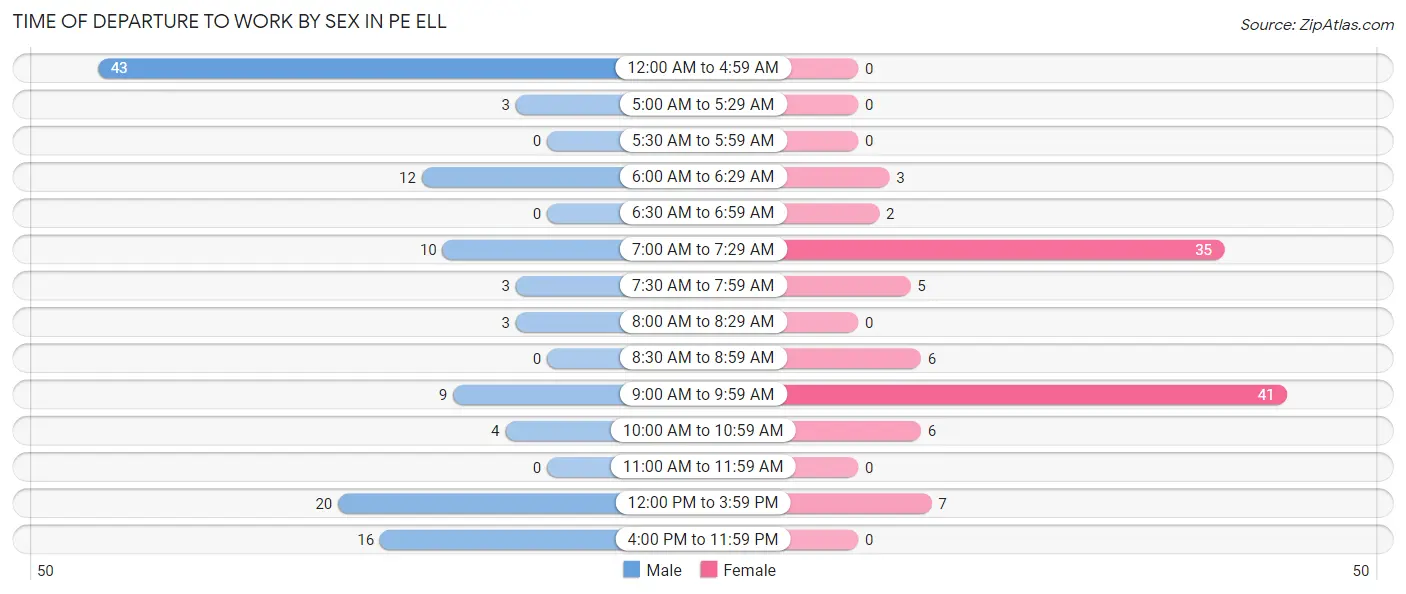
| Time of Departure | Male | Female |
| 12:00 AM to 4:59 AM | 43 (35.0%) | 0 (0.0%) |
| 5:00 AM to 5:29 AM | 3 (2.4%) | 0 (0.0%) |
| 5:30 AM to 5:59 AM | 0 (0.0%) | 0 (0.0%) |
| 6:00 AM to 6:29 AM | 12 (9.8%) | 3 (2.9%) |
| 6:30 AM to 6:59 AM | 0 (0.0%) | 2 (1.9%) |
| 7:00 AM to 7:29 AM | 10 (8.1%) | 35 (33.3%) |
| 7:30 AM to 7:59 AM | 3 (2.4%) | 5 (4.8%) |
| 8:00 AM to 8:29 AM | 3 (2.4%) | 0 (0.0%) |
| 8:30 AM to 8:59 AM | 0 (0.0%) | 6 (5.7%) |
| 9:00 AM to 9:59 AM | 9 (7.3%) | 41 (39.1%) |
| 10:00 AM to 10:59 AM | 4 (3.3%) | 6 (5.7%) |
| 11:00 AM to 11:59 AM | 0 (0.0%) | 0 (0.0%) |
| 12:00 PM to 3:59 PM | 20 (16.3%) | 7 (6.7%) |
| 4:00 PM to 11:59 PM | 16 (13.0%) | 0 (0.0%) |
| Total | 123 (100.0%) | 105 (100.0%) |
Housing Occupancy in Pe Ell
Occupancy by Ownership in Pe Ell
Of the total 223 dwellings in Pe Ell, owner-occupied units account for 171 (76.7%), while renter-occupied units make up 52 (23.3%).
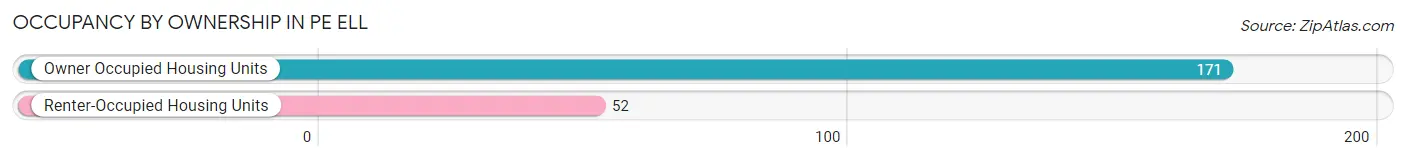
| Occupancy | # Housing Units | % Housing Units |
| Owner Occupied Housing Units | 171 | 76.7% |
| Renter-Occupied Housing Units | 52 | 23.3% |
| Total Occupied Housing Units | 223 | 100.0% |
Occupancy by Household Size in Pe Ell
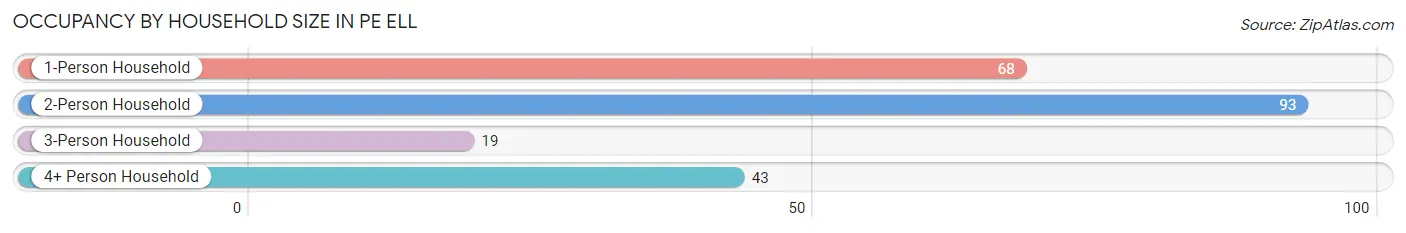
| Household Size | # Housing Units | % Housing Units |
| 1-Person Household | 68 | 30.5% |
| 2-Person Household | 93 | 41.7% |
| 3-Person Household | 19 | 8.5% |
| 4+ Person Household | 43 | 19.3% |
| Total Housing Units | 223 | 100.0% |
Occupancy by Ownership by Household Size in Pe Ell
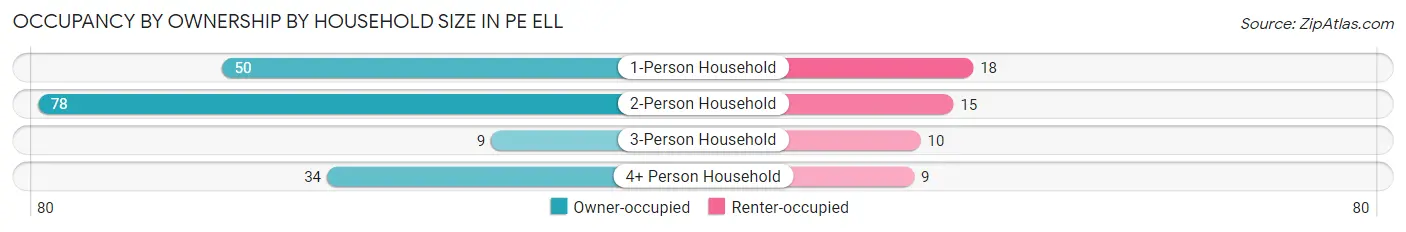
| Household Size | Owner-occupied | Renter-occupied |
| 1-Person Household | 50 (73.5%) | 18 (26.5%) |
| 2-Person Household | 78 (83.9%) | 15 (16.1%) |
| 3-Person Household | 9 (47.4%) | 10 (52.6%) |
| 4+ Person Household | 34 (79.1%) | 9 (20.9%) |
| Total Housing Units | 171 (76.7%) | 52 (23.3%) |
Occupancy by Educational Attainment in Pe Ell
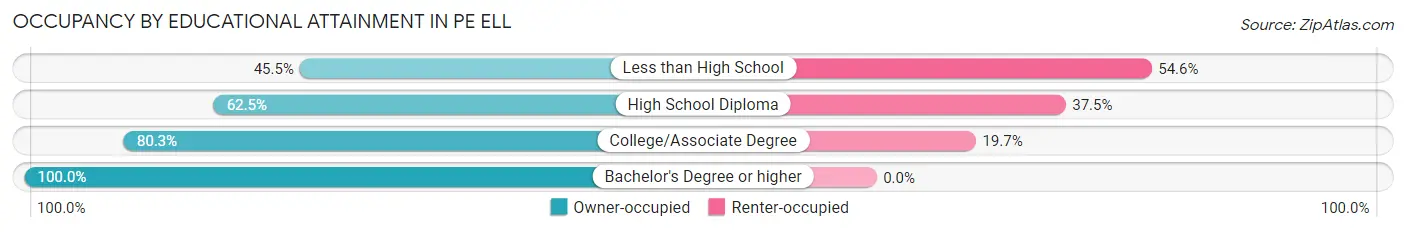
| Household Size | Owner-occupied | Renter-occupied |
| Less than High School | 10 (45.5%) | 12 (54.5%) |
| High School Diploma | 25 (62.5%) | 15 (37.5%) |
| College/Associate Degree | 102 (80.3%) | 25 (19.7%) |
| Bachelor's Degree or higher | 34 (100.0%) | 0 (0.0%) |
Occupancy by Age of Householder in Pe Ell
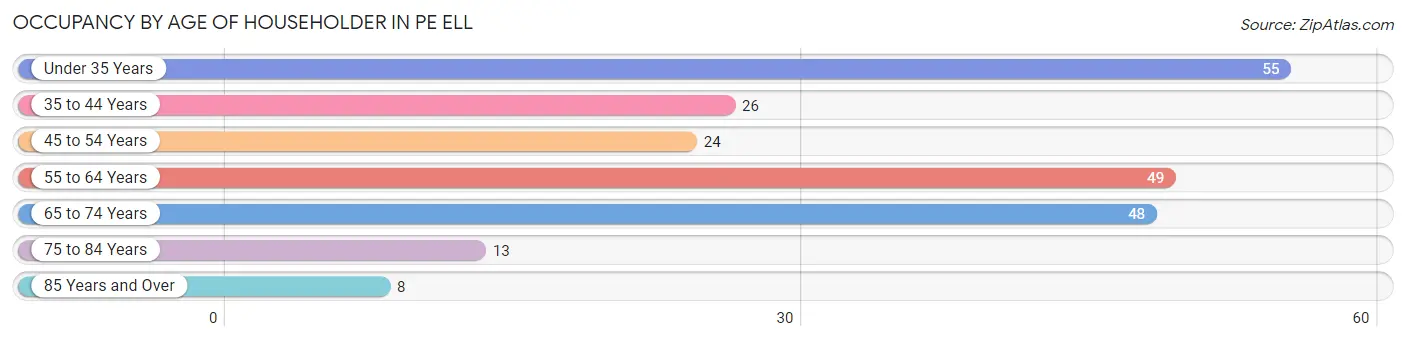
| Age Bracket | # Households | % Households |
| Under 35 Years | 55 | 24.7% |
| 35 to 44 Years | 26 | 11.7% |
| 45 to 54 Years | 24 | 10.8% |
| 55 to 64 Years | 49 | 22.0% |
| 65 to 74 Years | 48 | 21.5% |
| 75 to 84 Years | 13 | 5.8% |
| 85 Years and Over | 8 | 3.6% |
| Total | 223 | 100.0% |
Housing Finances in Pe Ell
Median Income by Occupancy in Pe Ell
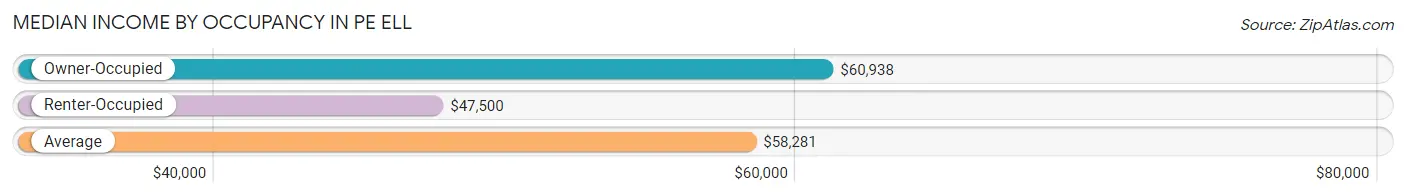
| Occupancy Type | # Households | Median Income |
| Owner-Occupied | 171 (76.7%) | $60,938 |
| Renter-Occupied | 52 (23.3%) | $47,500 |
| Average | 223 (100.0%) | $58,281 |
Occupancy by Householder Income Bracket in Pe Ell
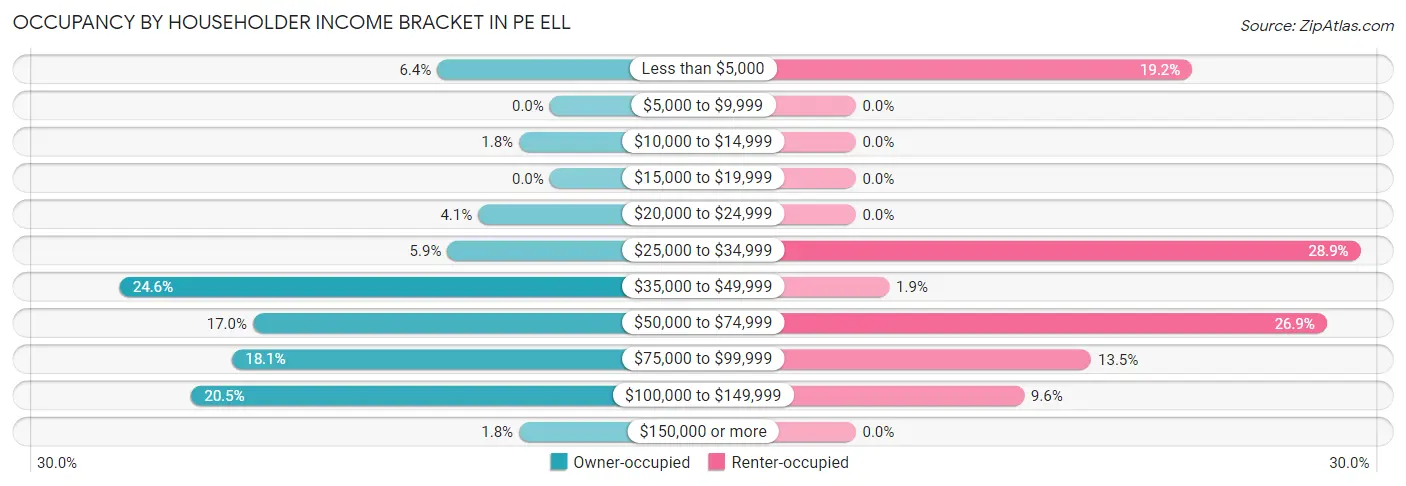
| Income Bracket | Owner-occupied | Renter-occupied |
| Less than $5,000 | 11 (6.4%) | 10 (19.2%) |
| $5,000 to $9,999 | 0 (0.0%) | 0 (0.0%) |
| $10,000 to $14,999 | 3 (1.8%) | 0 (0.0%) |
| $15,000 to $19,999 | 0 (0.0%) | 0 (0.0%) |
| $20,000 to $24,999 | 7 (4.1%) | 0 (0.0%) |
| $25,000 to $34,999 | 10 (5.9%) | 15 (28.8%) |
| $35,000 to $49,999 | 42 (24.6%) | 1 (1.9%) |
| $50,000 to $74,999 | 29 (17.0%) | 14 (26.9%) |
| $75,000 to $99,999 | 31 (18.1%) | 7 (13.5%) |
| $100,000 to $149,999 | 35 (20.5%) | 5 (9.6%) |
| $150,000 or more | 3 (1.8%) | 0 (0.0%) |
| Total | 171 (100.0%) | 52 (100.0%) |
Monthly Housing Cost Tiers in Pe Ell
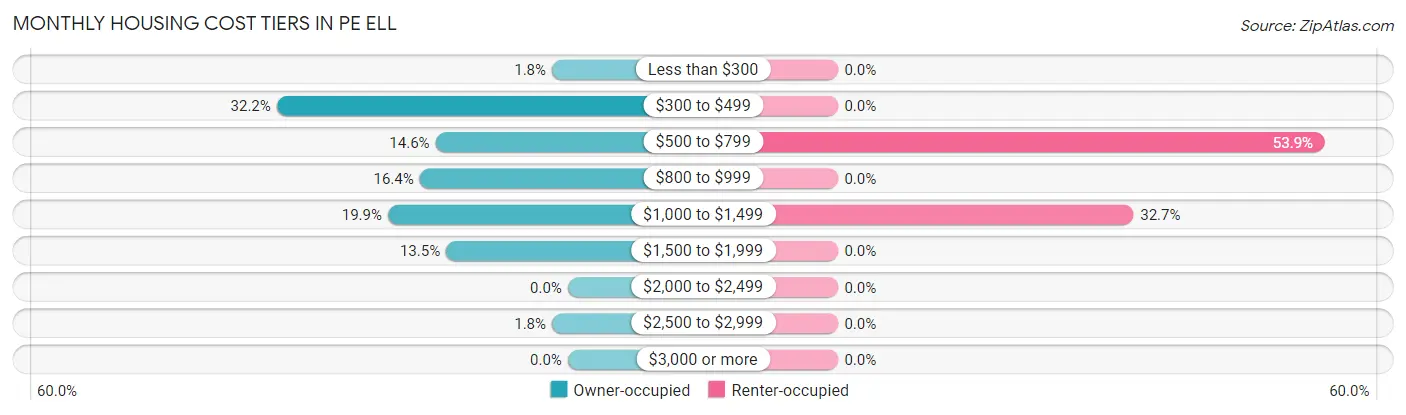
| Monthly Cost | Owner-occupied | Renter-occupied |
| Less than $300 | 3 (1.8%) | 0 (0.0%) |
| $300 to $499 | 55 (32.2%) | 0 (0.0%) |
| $500 to $799 | 25 (14.6%) | 28 (53.8%) |
| $800 to $999 | 28 (16.4%) | 0 (0.0%) |
| $1,000 to $1,499 | 34 (19.9%) | 17 (32.7%) |
| $1,500 to $1,999 | 23 (13.5%) | 0 (0.0%) |
| $2,000 to $2,499 | 0 (0.0%) | 0 (0.0%) |
| $2,500 to $2,999 | 3 (1.8%) | 0 (0.0%) |
| $3,000 or more | 0 (0.0%) | 0 (0.0%) |
| Total | 171 (100.0%) | 52 (100.0%) |
Physical Housing Characteristics in Pe Ell
Housing Structures in Pe Ell
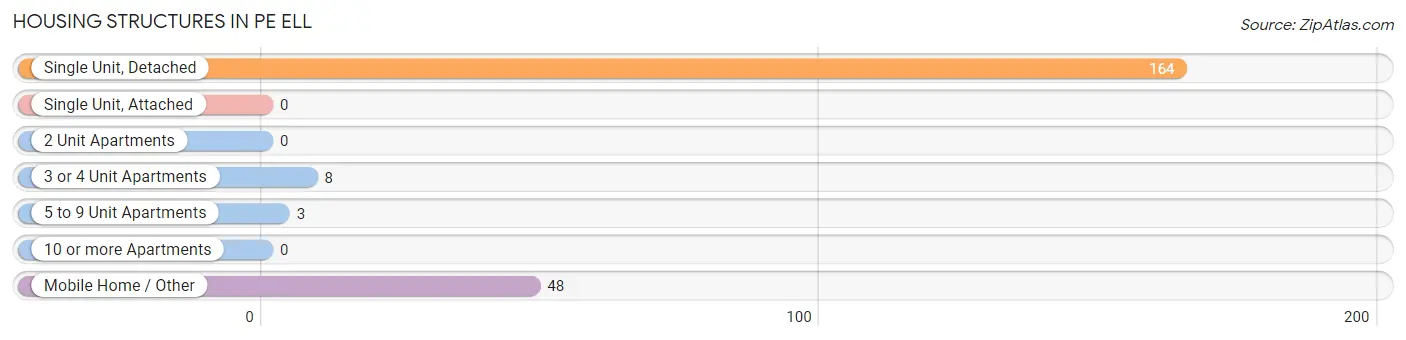
| Structure Type | # Housing Units | % Housing Units |
| Single Unit, Detached | 164 | 73.5% |
| Single Unit, Attached | 0 | 0.0% |
| 2 Unit Apartments | 0 | 0.0% |
| 3 or 4 Unit Apartments | 8 | 3.6% |
| 5 to 9 Unit Apartments | 3 | 1.3% |
| 10 or more Apartments | 0 | 0.0% |
| Mobile Home / Other | 48 | 21.5% |
| Total | 223 | 100.0% |
Housing Structures by Occupancy in Pe Ell
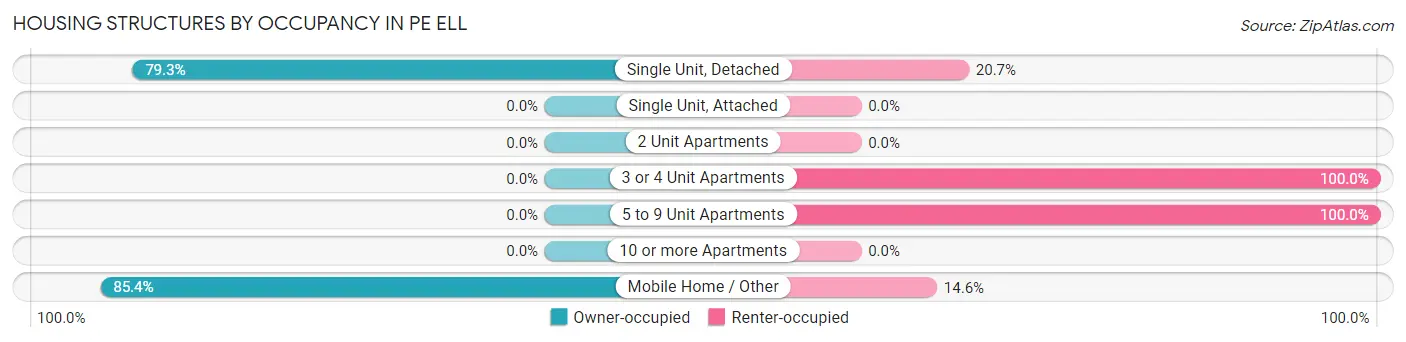
| Structure Type | Owner-occupied | Renter-occupied |
| Single Unit, Detached | 130 (79.3%) | 34 (20.7%) |
| Single Unit, Attached | 0 (0.0%) | 0 (0.0%) |
| 2 Unit Apartments | 0 (0.0%) | 0 (0.0%) |
| 3 or 4 Unit Apartments | 0 (0.0%) | 8 (100.0%) |
| 5 to 9 Unit Apartments | 0 (0.0%) | 3 (100.0%) |
| 10 or more Apartments | 0 (0.0%) | 0 (0.0%) |
| Mobile Home / Other | 41 (85.4%) | 7 (14.6%) |
| Total | 171 (76.7%) | 52 (23.3%) |
Housing Structures by Number of Rooms in Pe Ell
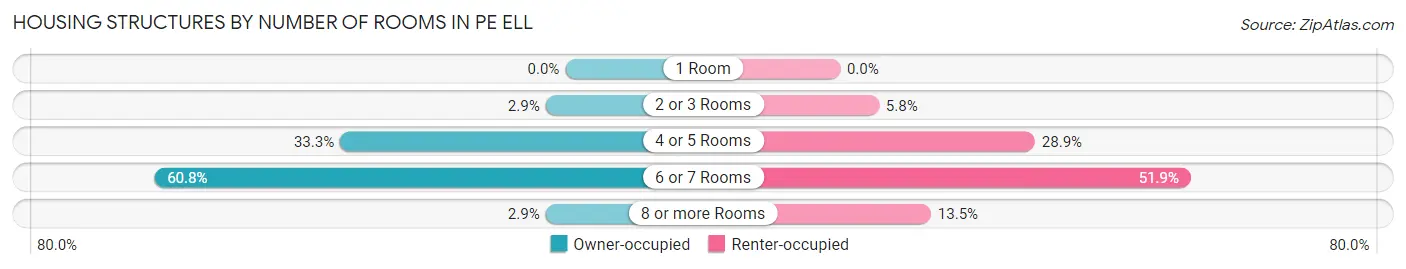
| Number of Rooms | Owner-occupied | Renter-occupied |
| 1 Room | 0 (0.0%) | 0 (0.0%) |
| 2 or 3 Rooms | 5 (2.9%) | 3 (5.8%) |
| 4 or 5 Rooms | 57 (33.3%) | 15 (28.8%) |
| 6 or 7 Rooms | 104 (60.8%) | 27 (51.9%) |
| 8 or more Rooms | 5 (2.9%) | 7 (13.5%) |
| Total | 171 (100.0%) | 52 (100.0%) |
Housing Structure by Heating Type in Pe Ell
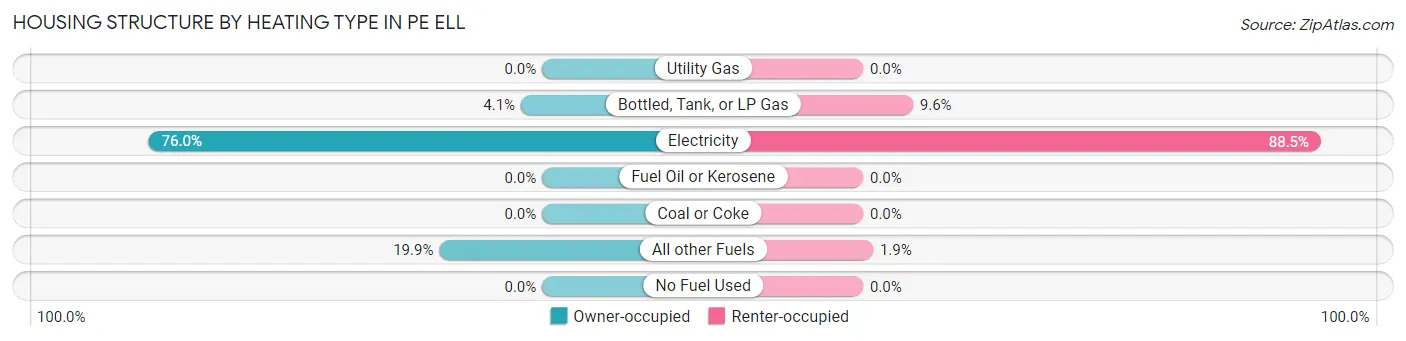
| Heating Type | Owner-occupied | Renter-occupied |
| Utility Gas | 0 (0.0%) | 0 (0.0%) |
| Bottled, Tank, or LP Gas | 7 (4.1%) | 5 (9.6%) |
| Electricity | 130 (76.0%) | 46 (88.5%) |
| Fuel Oil or Kerosene | 0 (0.0%) | 0 (0.0%) |
| Coal or Coke | 0 (0.0%) | 0 (0.0%) |
| All other Fuels | 34 (19.9%) | 1 (1.9%) |
| No Fuel Used | 0 (0.0%) | 0 (0.0%) |
| Total | 171 (100.0%) | 52 (100.0%) |
Household Vehicle Usage in Pe Ell
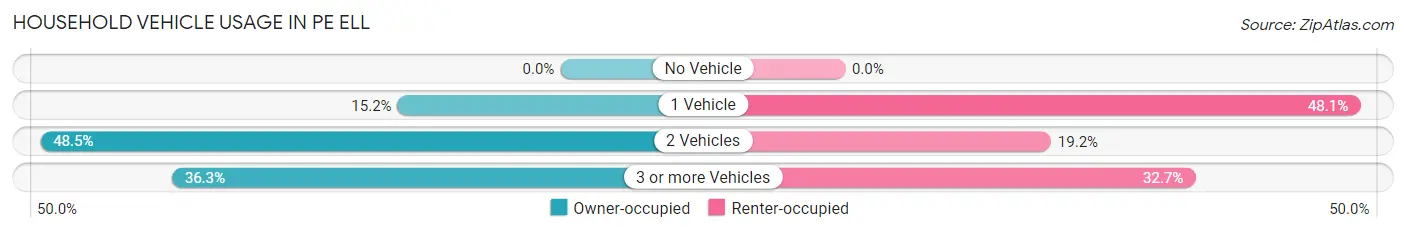
| Vehicles per Household | Owner-occupied | Renter-occupied |
| No Vehicle | 0 (0.0%) | 0 (0.0%) |
| 1 Vehicle | 26 (15.2%) | 25 (48.1%) |
| 2 Vehicles | 83 (48.5%) | 10 (19.2%) |
| 3 or more Vehicles | 62 (36.3%) | 17 (32.7%) |
| Total | 171 (100.0%) | 52 (100.0%) |
Real Estate & Mortgages in Pe Ell
Real Estate and Mortgage Overview in Pe Ell
| Characteristic | Without Mortgage | With Mortgage |
| Housing Units | 77 | 94 |
| Median Property Value | $164,100 | $158,300 |
| Median Household Income | $38,942 | $0 |
| Monthly Housing Costs | $451 | $0 |
| Real Estate Taxes | $853 | $13 |
Property Value by Mortgage Status in Pe Ell
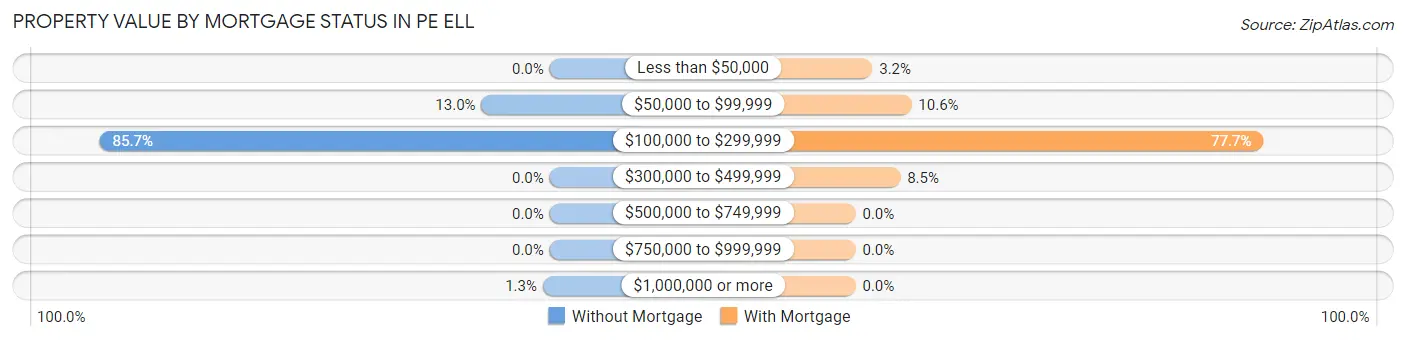
| Property Value | Without Mortgage | With Mortgage |
| Less than $50,000 | 0 (0.0%) | 3 (3.2%) |
| $50,000 to $99,999 | 10 (13.0%) | 10 (10.6%) |
| $100,000 to $299,999 | 66 (85.7%) | 73 (77.7%) |
| $300,000 to $499,999 | 0 (0.0%) | 8 (8.5%) |
| $500,000 to $749,999 | 0 (0.0%) | 0 (0.0%) |
| $750,000 to $999,999 | 0 (0.0%) | 0 (0.0%) |
| $1,000,000 or more | 1 (1.3%) | 0 (0.0%) |
| Total | 77 (100.0%) | 94 (100.0%) |
Household Income by Mortgage Status in Pe Ell
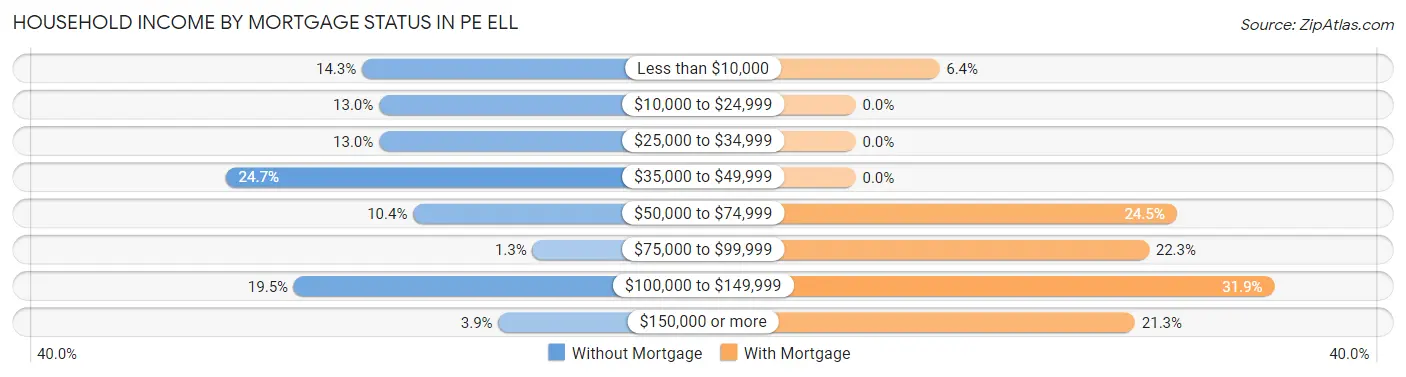
| Household Income | Without Mortgage | With Mortgage |
| Less than $10,000 | 11 (14.3%) | 6 (6.4%) |
| $10,000 to $24,999 | 10 (13.0%) | 0 (0.0%) |
| $25,000 to $34,999 | 10 (13.0%) | 0 (0.0%) |
| $35,000 to $49,999 | 19 (24.7%) | 0 (0.0%) |
| $50,000 to $74,999 | 8 (10.4%) | 23 (24.5%) |
| $75,000 to $99,999 | 1 (1.3%) | 21 (22.3%) |
| $100,000 to $149,999 | 15 (19.5%) | 30 (31.9%) |
| $150,000 or more | 3 (3.9%) | 20 (21.3%) |
| Total | 77 (100.0%) | 94 (100.0%) |
Property Value to Household Income Ratio in Pe Ell
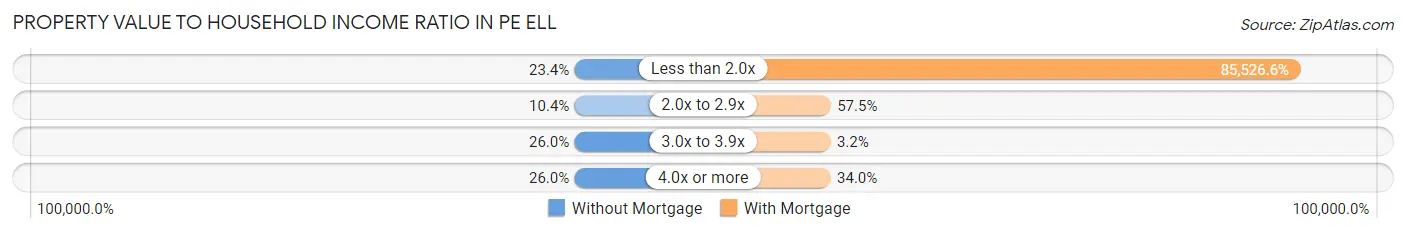
| Value-to-Income Ratio | Without Mortgage | With Mortgage |
| Less than 2.0x | 18 (23.4%) | 80,395 (85,526.6%) |
| 2.0x to 2.9x | 8 (10.4%) | 54 (57.5%) |
| 3.0x to 3.9x | 20 (26.0%) | 3 (3.2%) |
| 4.0x or more | 20 (26.0%) | 32 (34.0%) |
| Total | 77 (100.0%) | 94 (100.0%) |
Real Estate Taxes by Mortgage Status in Pe Ell
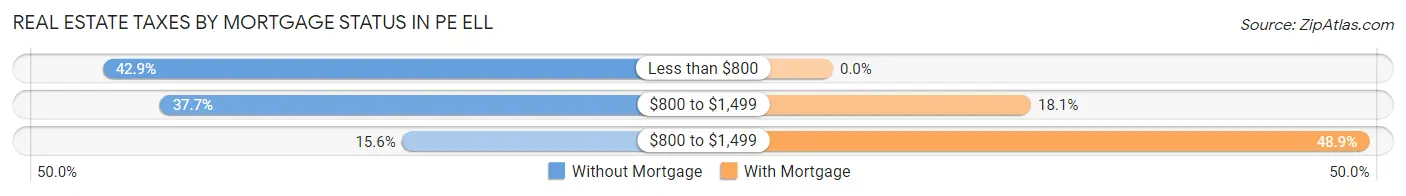
| Property Taxes | Without Mortgage | With Mortgage |
| Less than $800 | 33 (42.9%) | 0 (0.0%) |
| $800 to $1,499 | 29 (37.7%) | 17 (18.1%) |
| $800 to $1,499 | 12 (15.6%) | 46 (48.9%) |
| Total | 77 (100.0%) | 94 (100.0%) |
Health & Disability in Pe Ell
Health Insurance Coverage by Age in Pe Ell
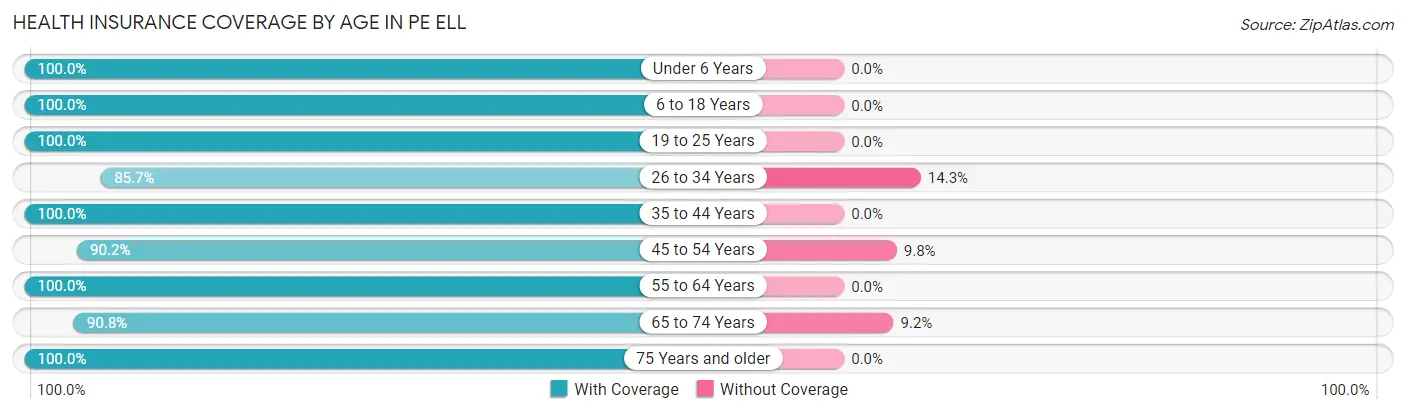
| Age Bracket | With Coverage | Without Coverage |
| Under 6 Years | 44 (100.0%) | 0 (0.0%) |
| 6 to 18 Years | 75 (100.0%) | 0 (0.0%) |
| 19 to 25 Years | 54 (100.0%) | 0 (0.0%) |
| 26 to 34 Years | 42 (85.7%) | 7 (14.3%) |
| 35 to 44 Years | 61 (100.0%) | 0 (0.0%) |
| 45 to 54 Years | 46 (90.2%) | 5 (9.8%) |
| 55 to 64 Years | 59 (100.0%) | 0 (0.0%) |
| 65 to 74 Years | 79 (90.8%) | 8 (9.2%) |
| 75 Years and older | 33 (100.0%) | 0 (0.0%) |
| Total | 493 (96.1%) | 20 (3.9%) |
Health Insurance Coverage by Citizenship Status in Pe Ell
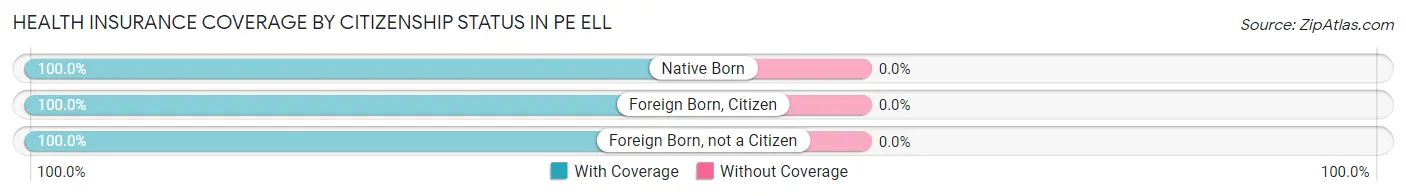
| Citizenship Status | With Coverage | Without Coverage |
| Native Born | 44 (100.0%) | 0 (0.0%) |
| Foreign Born, Citizen | 75 (100.0%) | 0 (0.0%) |
| Foreign Born, not a Citizen | 54 (100.0%) | 0 (0.0%) |
Health Insurance Coverage by Household Income in Pe Ell
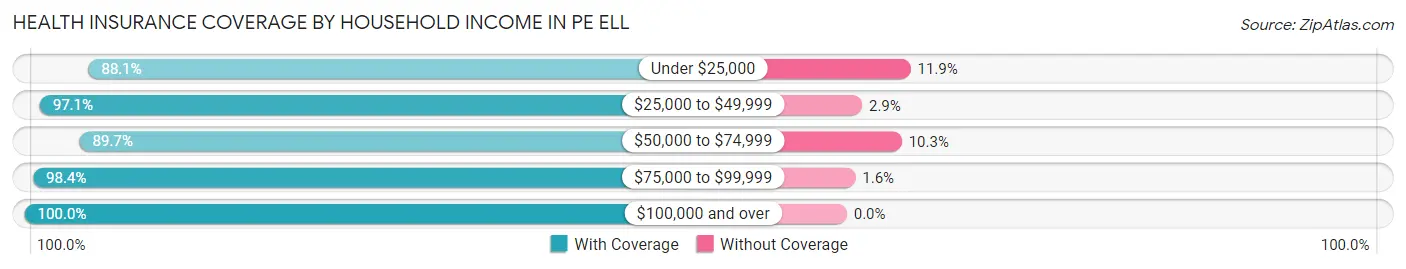
| Household Income | With Coverage | Without Coverage |
| Under $25,000 | 59 (88.1%) | 8 (11.9%) |
| $25,000 to $49,999 | 102 (97.1%) | 3 (2.9%) |
| $50,000 to $74,999 | 61 (89.7%) | 7 (10.3%) |
| $75,000 to $99,999 | 123 (98.4%) | 2 (1.6%) |
| $100,000 and over | 148 (100.0%) | 0 (0.0%) |
Public vs Private Health Insurance Coverage by Age in Pe Ell
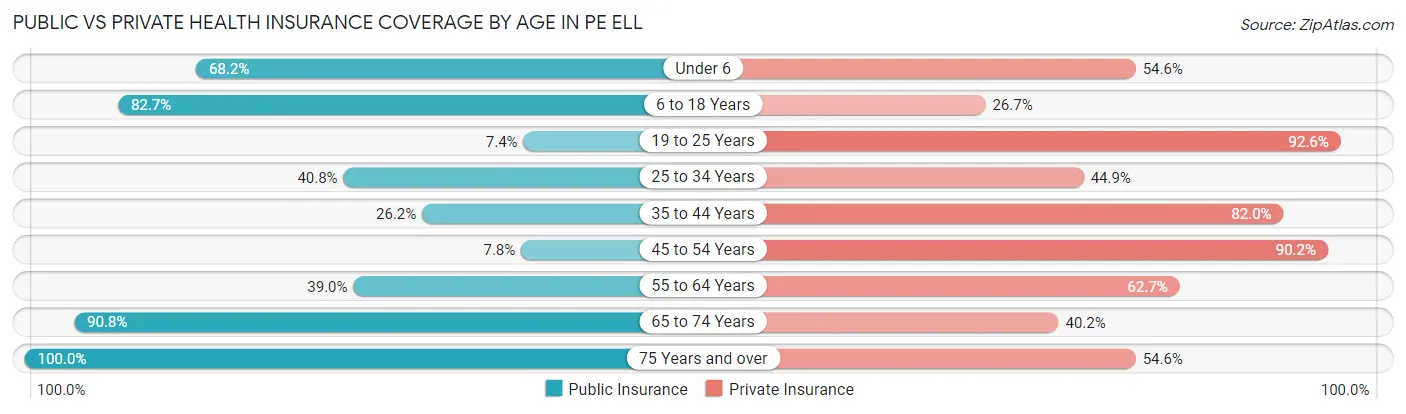
| Age Bracket | Public Insurance | Private Insurance |
| Under 6 | 30 (68.2%) | 24 (54.5%) |
| 6 to 18 Years | 62 (82.7%) | 20 (26.7%) |
| 19 to 25 Years | 4 (7.4%) | 50 (92.6%) |
| 25 to 34 Years | 20 (40.8%) | 22 (44.9%) |
| 35 to 44 Years | 16 (26.2%) | 50 (82.0%) |
| 45 to 54 Years | 4 (7.8%) | 46 (90.2%) |
| 55 to 64 Years | 23 (39.0%) | 37 (62.7%) |
| 65 to 74 Years | 79 (90.8%) | 35 (40.2%) |
| 75 Years and over | 33 (100.0%) | 18 (54.5%) |
| Total | 271 (52.8%) | 302 (58.9%) |
Disability Status by Sex by Age in Pe Ell
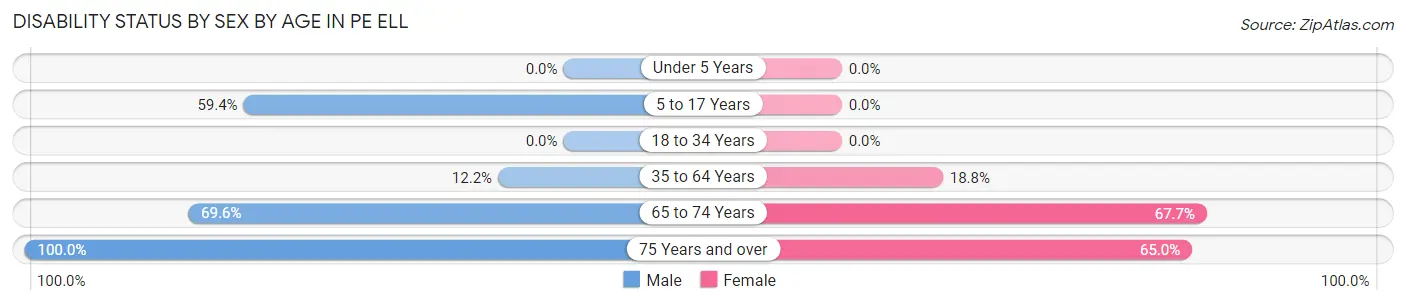
| Age Bracket | Male | Female |
| Under 5 Years | 0 (0.0%) | 0 (0.0%) |
| 5 to 17 Years | 19 (59.4%) | 0 (0.0%) |
| 18 to 34 Years | 0 (0.0%) | 0 (0.0%) |
| 35 to 64 Years | 13 (12.1%) | 12 (18.8%) |
| 65 to 74 Years | 39 (69.6%) | 21 (67.7%) |
| 75 Years and over | 13 (100.0%) | 13 (65.0%) |
Disability Class by Sex by Age in Pe Ell
Disability Class: Hearing Difficulty
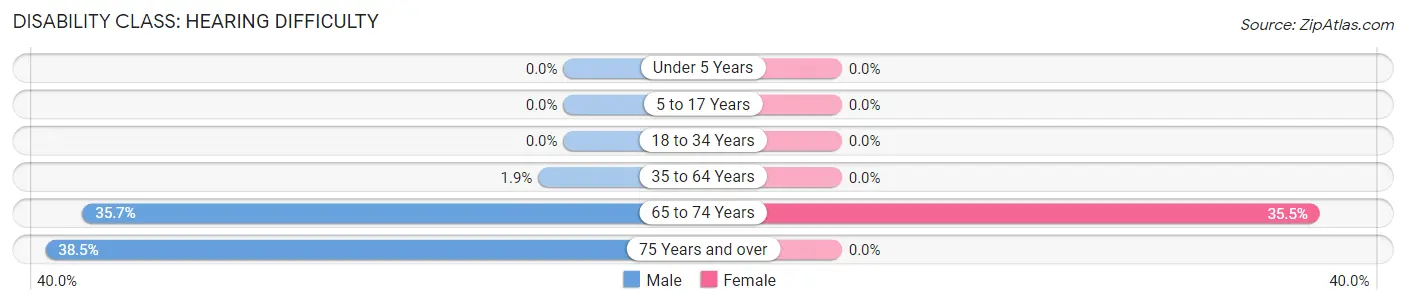
| Age Bracket | Male | Female |
| Under 5 Years | 0 (0.0%) | 0 (0.0%) |
| 5 to 17 Years | 0 (0.0%) | 0 (0.0%) |
| 18 to 34 Years | 0 (0.0%) | 0 (0.0%) |
| 35 to 64 Years | 2 (1.9%) | 0 (0.0%) |
| 65 to 74 Years | 20 (35.7%) | 11 (35.5%) |
| 75 Years and over | 5 (38.5%) | 0 (0.0%) |
Disability Class: Vision Difficulty
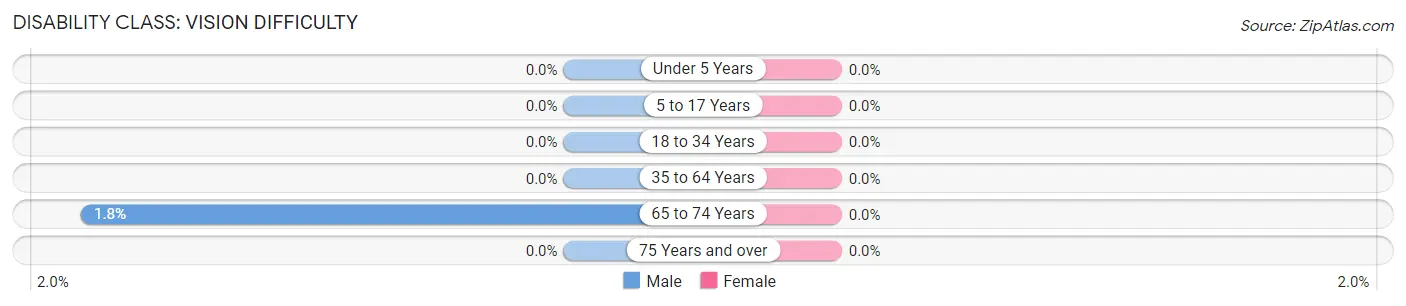
| Age Bracket | Male | Female |
| Under 5 Years | 0 (0.0%) | 0 (0.0%) |
| 5 to 17 Years | 0 (0.0%) | 0 (0.0%) |
| 18 to 34 Years | 0 (0.0%) | 0 (0.0%) |
| 35 to 64 Years | 0 (0.0%) | 0 (0.0%) |
| 65 to 74 Years | 1 (1.8%) | 0 (0.0%) |
| 75 Years and over | 0 (0.0%) | 0 (0.0%) |
Disability Class: Cognitive Difficulty
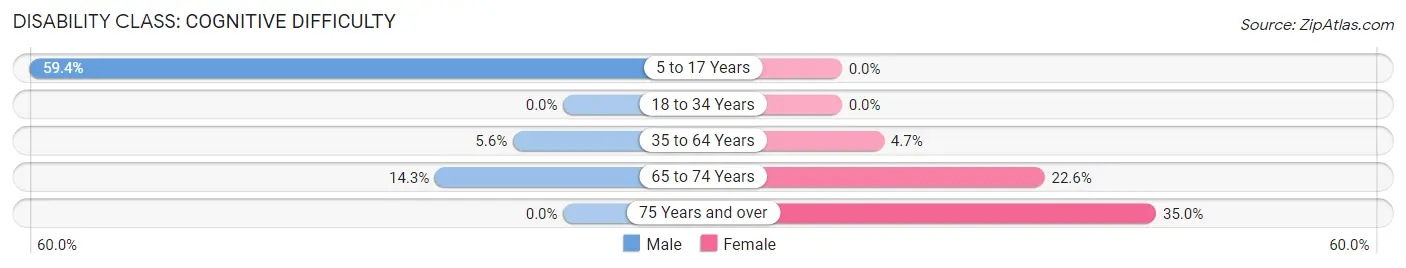
| Age Bracket | Male | Female |
| 5 to 17 Years | 19 (59.4%) | 0 (0.0%) |
| 18 to 34 Years | 0 (0.0%) | 0 (0.0%) |
| 35 to 64 Years | 6 (5.6%) | 3 (4.7%) |
| 65 to 74 Years | 8 (14.3%) | 7 (22.6%) |
| 75 Years and over | 0 (0.0%) | 7 (35.0%) |
Disability Class: Ambulatory Difficulty
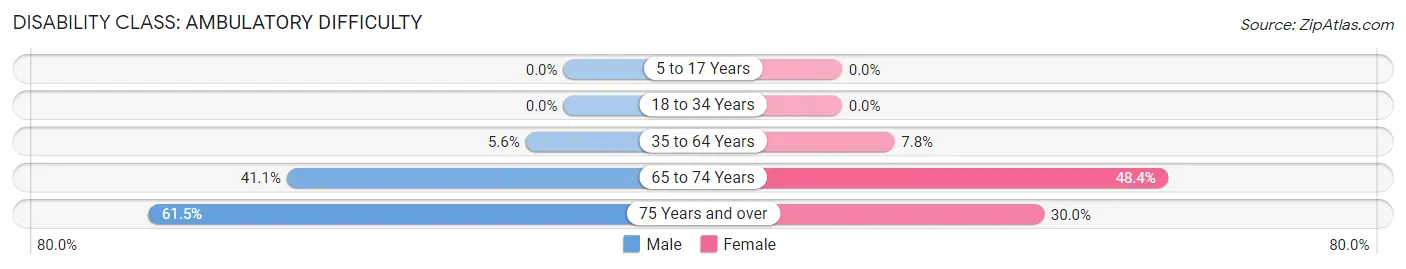
| Age Bracket | Male | Female |
| 5 to 17 Years | 0 (0.0%) | 0 (0.0%) |
| 18 to 34 Years | 0 (0.0%) | 0 (0.0%) |
| 35 to 64 Years | 6 (5.6%) | 5 (7.8%) |
| 65 to 74 Years | 23 (41.1%) | 15 (48.4%) |
| 75 Years and over | 8 (61.5%) | 6 (30.0%) |
Disability Class: Self-Care Difficulty
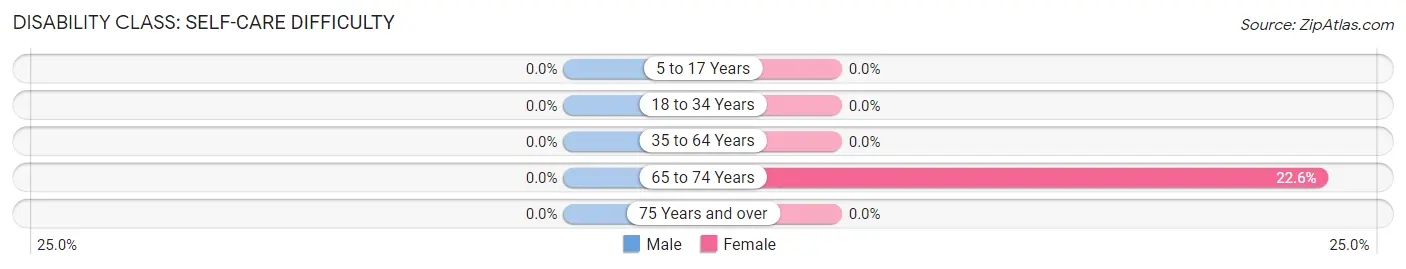
| Age Bracket | Male | Female |
| 5 to 17 Years | 0 (0.0%) | 0 (0.0%) |
| 18 to 34 Years | 0 (0.0%) | 0 (0.0%) |
| 35 to 64 Years | 0 (0.0%) | 0 (0.0%) |
| 65 to 74 Years | 0 (0.0%) | 7 (22.6%) |
| 75 Years and over | 0 (0.0%) | 0 (0.0%) |
Technology Access in Pe Ell
Computing Device Access in Pe Ell
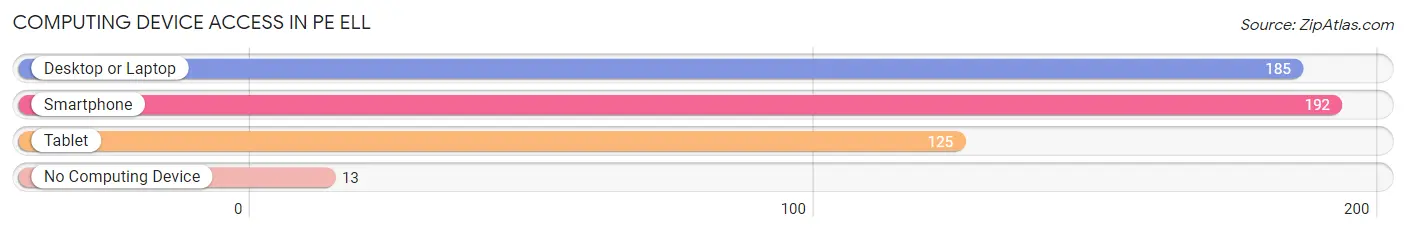
| Device Type | # Households | % Households |
| Desktop or Laptop | 185 | 83.0% |
| Smartphone | 192 | 86.1% |
| Tablet | 125 | 56.0% |
| No Computing Device | 13 | 5.8% |
| Total | 223 | 100.0% |
Internet Access in Pe Ell
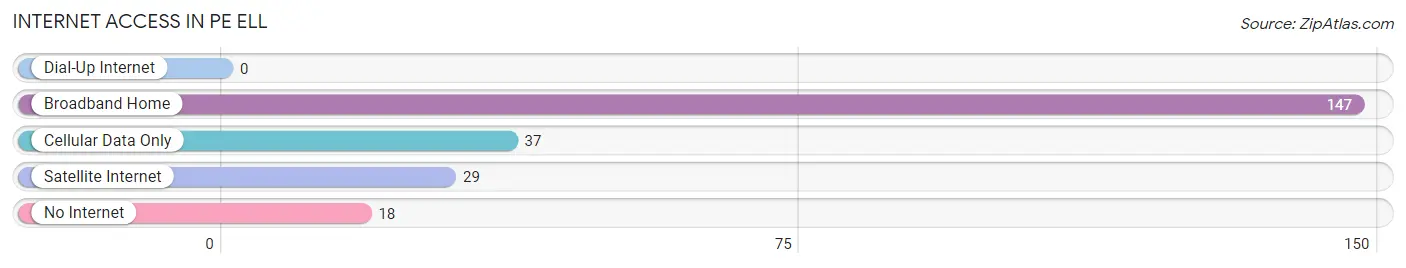
| Internet Type | # Households | % Households |
| Dial-Up Internet | 0 | 0.0% |
| Broadband Home | 147 | 65.9% |
| Cellular Data Only | 37 | 16.6% |
| Satellite Internet | 29 | 13.0% |
| No Internet | 18 | 8.1% |
| Total | 223 | 100.0% |
Pe Ell Summary
Pe Ell is a small town located in Lewis County, Washington, United States. It is situated in the Willapa Hills region of the state, approximately 50 miles southwest of Olympia, the state capital. The population of Pe Ell was 845 at the 2010 census.
History
The area around Pe Ell was first settled in the late 1800s by homesteaders. The town was officially incorporated in 1902 and was named after the nearby Pe Ell Creek. The creek was named after a local Native American chief, Pe Ell.
The town was originally a logging and farming community, and the local economy was largely based on these industries. In the early 1900s, the town was home to several sawmills and a shingle mill. The town also had a railroad station, which connected it to the larger cities of the region.
In the 1950s, the town began to decline as the logging industry moved away. The railroad station was closed in the 1960s, and the town’s population began to decline.
Geography
Pe Ell is located in the Willapa Hills region of Washington, approximately 50 miles southwest of Olympia. The town is situated on the banks of the Chehalis River, and is surrounded by rolling hills and forests.
The climate in Pe Ell is mild and temperate, with warm summers and cool winters. The average annual temperature is around 50 degrees Fahrenheit.
Economy
The economy of Pe Ell is largely based on agriculture and forestry. The town is home to several farms, and the surrounding area is used for timber production.
The town also has a small manufacturing sector, with several small businesses located in the area. The town is also home to a few retail stores, restaurants, and other services.
Demographics
As of the 2010 census, the population of Pe Ell was 845. The racial makeup of the town was 94.3% White, 0.7% Native American, 0.4% Asian, 0.2% African American, and 4.4% from other races.
The median household income in Pe Ell was $37,500, and the median family income was $45,000. The per capita income was $19,000.
Conclusion
Pe Ell is a small town located in Lewis County, Washington. It is situated in the Willapa Hills region of the state, and is surrounded by rolling hills and forests. The town’s economy is largely based on agriculture and forestry, and the population is mostly White. The median household income in Pe Ell is $37,500, and the per capita income is $19,000.
Common Questions
What is Per Capita Income in Pe Ell?
Per Capita income in Pe Ell is $29,365.
What is the Median Family Income in Pe Ell?
Median Family Income in Pe Ell is $78,438.
What is the Median Household income in Pe Ell?
Median Household Income in Pe Ell is $58,281.
What is Income or Wage Gap in Pe Ell?
Income or Wage Gap in Pe Ell is 57.0%.
Women in Pe Ell earn 43.0 cents for every dollar earned by a man.
What is Inequality or Gini Index in Pe Ell?
Inequality or Gini Index in Pe Ell is 0.36.
What is the Total Population of Pe Ell?
Total Population of Pe Ell is 513.
What is the Total Male Population of Pe Ell?
Total Male Population of Pe Ell is 285.
What is the Total Female Population of Pe Ell?
Total Female Population of Pe Ell is 228.
What is the Ratio of Males per 100 Females in Pe Ell?
There are 125.00 Males per 100 Females in Pe Ell.
What is the Ratio of Females per 100 Males in Pe Ell?
There are 80.00 Females per 100 Males in Pe Ell.
What is the Median Population Age in Pe Ell?
Median Population Age in Pe Ell is 38.4 Years.
What is the Average Family Size in Pe Ell
Average Family Size in Pe Ell is 2.9 People.
What is the Average Household Size in Pe Ell
Average Household Size in Pe Ell is 2.3 People.
How Large is the Labor Force in Pe Ell?
There are 250 People in the Labor Forcein in Pe Ell.
What is the Percentage of People in the Labor Force in Pe Ell?
55.3% of People are in the Labor Force in Pe Ell.