Loon Lake, WA Map & Demographics
Loon Lake Map
Loon Lake Overview
$40,579
PER CAPITA INCOME
$68,867
AVG FAMILY INCOME
$67,188
AVG HOUSEHOLD INCOME
2.9%
WAGE / INCOME GAP [ % ]
97.1¢/ $1
WAGE / INCOME GAP [ $ ]
0.52
INEQUALITY / GINI INDEX
702
TOTAL POPULATION
335
MALE POPULATION
367
FEMALE POPULATION
91.28
MALES / 100 FEMALES
109.55
FEMALES / 100 MALES
61.6
MEDIAN AGE
2.5
AVG FAMILY SIZE
2.1
AVG HOUSEHOLD SIZE
266
LABOR FORCE [ PEOPLE ]
41.6%
PERCENT IN LABOR FORCE
4.1%
UNEMPLOYMENT RATE
Loon Lake Zip Codes
Loon Lake Area Codes
Income in Loon Lake
Income Overview in Loon Lake
Per Capita Income in Loon Lake is $40,579, while median incomes of families and households are $68,867 and $67,188 respectively.
| Characteristic | Number | Measure |
| Per Capita Income | 702 | $40,579 |
| Median Family Income | 235 | $68,867 |
| Mean Family Income | 235 | $93,423 |
| Median Household Income | 335 | $67,188 |
| Mean Household Income | 335 | $87,010 |
| Income Deficit | 235 | $0 |
| Wage / Income Gap (%) | 702 | 2.91% |
| Wage / Income Gap ($) | 702 | 97.09¢ per $1 |
| Gini / Inequality Index | 702 | 0.52 |
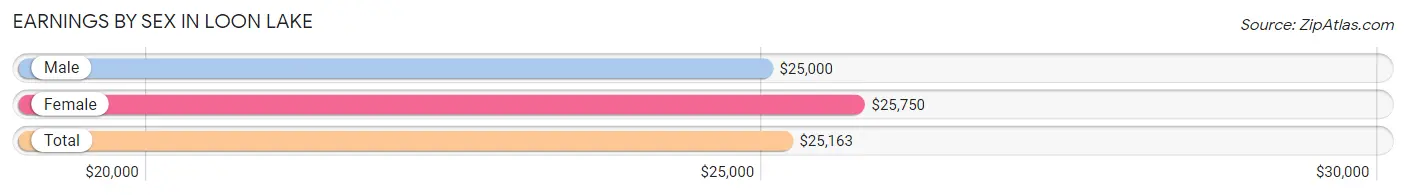
Earnings by Sex in Loon Lake
Average Earnings in Loon Lake are $25,163, $25,000 for men and $25,750 for women, a difference of 2.9%.
| Sex | Number | Average Earnings |
| Male | 142 (48.1%) | $25,000 |
| Female | 153 (51.9%) | $25,750 |
| Total | 295 (100.0%) | $25,163 |
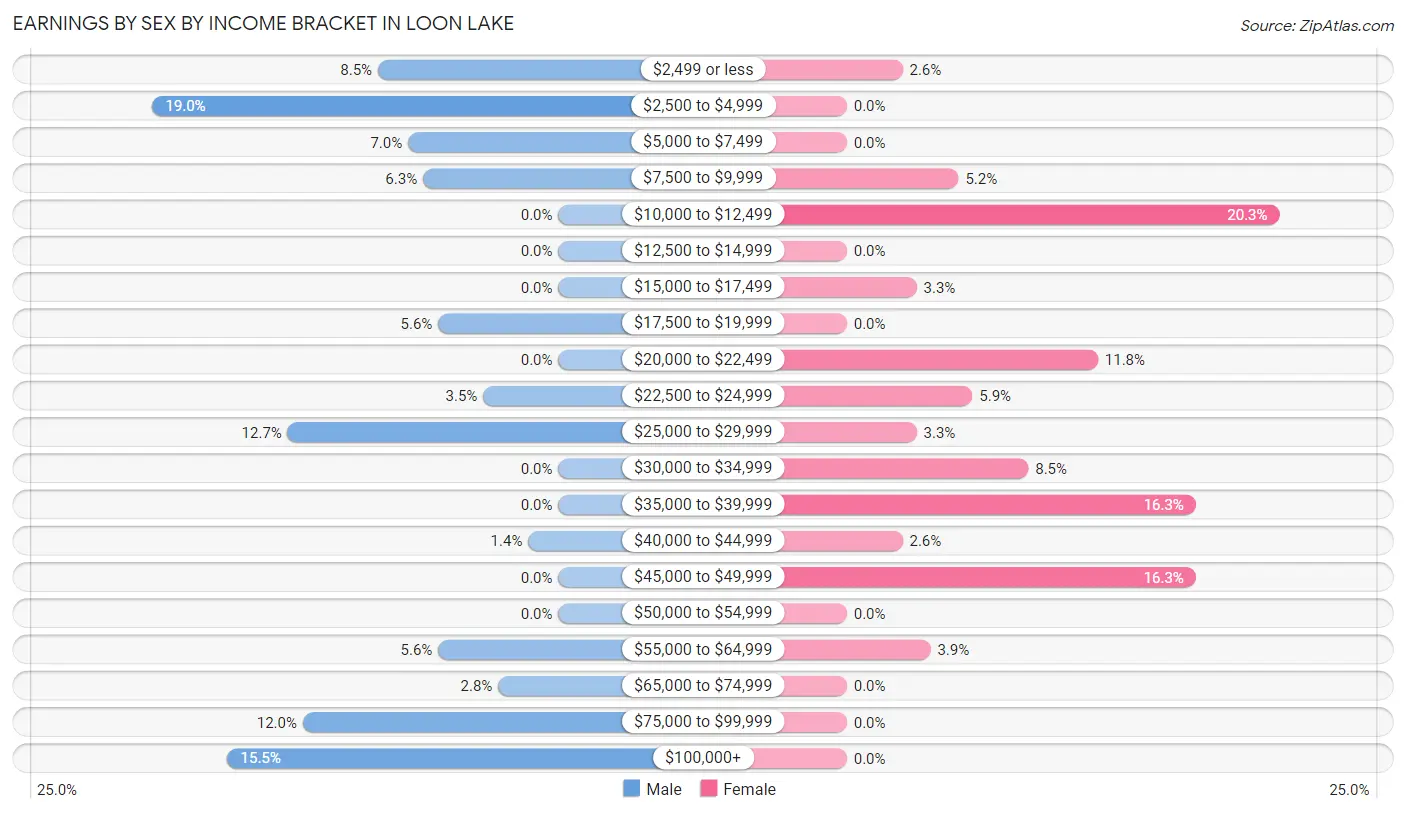
Earnings by Sex by Income Bracket in Loon Lake
The most common earnings brackets in Loon Lake are $2,500 to $4,999 for men (27 | 19.0%) and $10,000 to $12,499 for women (31 | 20.3%).
| Income | Male | Female |
| $2,499 or less | 12 (8.5%) | 4 (2.6%) |
| $2,500 to $4,999 | 27 (19.0%) | 0 (0.0%) |
| $5,000 to $7,499 | 10 (7.0%) | 0 (0.0%) |
| $7,500 to $9,999 | 9 (6.3%) | 8 (5.2%) |
| $10,000 to $12,499 | 0 (0.0%) | 31 (20.3%) |
| $12,500 to $14,999 | 0 (0.0%) | 0 (0.0%) |
| $15,000 to $17,499 | 0 (0.0%) | 5 (3.3%) |
| $17,500 to $19,999 | 8 (5.6%) | 0 (0.0%) |
| $20,000 to $22,499 | 0 (0.0%) | 18 (11.8%) |
| $22,500 to $24,999 | 5 (3.5%) | 9 (5.9%) |
| $25,000 to $29,999 | 18 (12.7%) | 5 (3.3%) |
| $30,000 to $34,999 | 0 (0.0%) | 13 (8.5%) |
| $35,000 to $39,999 | 0 (0.0%) | 25 (16.3%) |
| $40,000 to $44,999 | 2 (1.4%) | 4 (2.6%) |
| $45,000 to $49,999 | 0 (0.0%) | 25 (16.3%) |
| $50,000 to $54,999 | 0 (0.0%) | 0 (0.0%) |
| $55,000 to $64,999 | 8 (5.6%) | 6 (3.9%) |
| $65,000 to $74,999 | 4 (2.8%) | 0 (0.0%) |
| $75,000 to $99,999 | 17 (12.0%) | 0 (0.0%) |
| $100,000+ | 22 (15.5%) | 0 (0.0%) |
| Total | 142 (100.0%) | 153 (100.0%) |
Earnings by Sex by Educational Attainment in Loon Lake

| Educational Attainment | Male Income | Female Income |
| Less than High School | - | - |
| High School Diploma | - | - |
| College or Associate's Degree | - | - |
| Bachelor's Degree | - | - |
| Graduate Degree | - | - |
| Total | $25,556 | $25,750 |
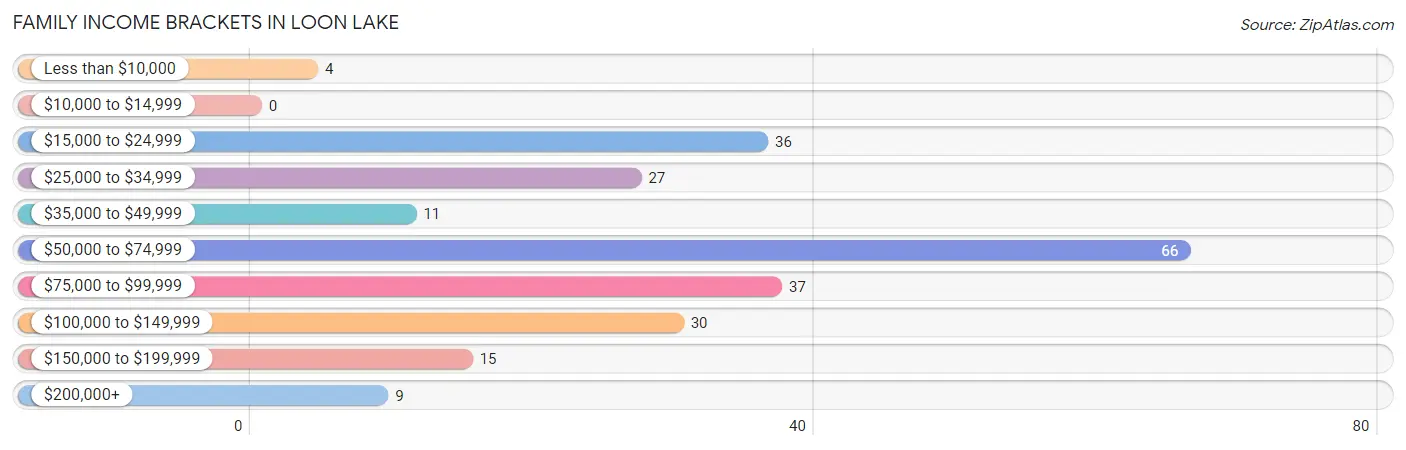
Family Income in Loon Lake
Family Income Brackets in Loon Lake
According to the Loon Lake family income data, there are 66 families falling into the $50,000 to $74,999 income range, which is the most common income bracket and makes up 28.1% of all families.
| Income Bracket | # Families | % Families |
| Less than $10,000 | 4 | 1.7% |
| $10,000 to $14,999 | 0 | 0.0% |
| $15,000 to $24,999 | 36 | 15.3% |
| $25,000 to $34,999 | 27 | 11.5% |
| $35,000 to $49,999 | 11 | 4.7% |
| $50,000 to $74,999 | 66 | 28.1% |
| $75,000 to $99,999 | 37 | 15.7% |
| $100,000 to $149,999 | 30 | 12.8% |
| $150,000 to $199,999 | 15 | 6.4% |
| $200,000+ | 9 | 3.8% |
Family Income by Famaliy Size in Loon Lake
3-person families (40 | 17.0%) account for the highest median family income in Loon Lake with $88,750 per family, while 2-person families (161 | 68.5%) have the highest median income of $33,062 per family member.
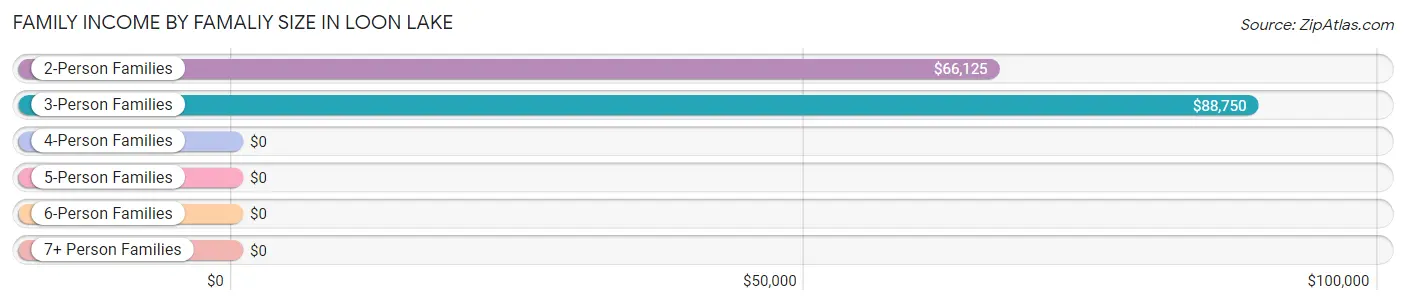
| Income Bracket | # Families | Median Income |
| 2-Person Families | 161 (68.5%) | $66,125 |
| 3-Person Families | 40 (17.0%) | $88,750 |
| 4-Person Families | 32 (13.6%) | $0 |
| 5-Person Families | 2 (0.9%) | $0 |
| 6-Person Families | 0 (0.0%) | $0 |
| 7+ Person Families | 0 (0.0%) | $0 |
| Total | 235 (100.0%) | $68,867 |
Family Income by Number of Earners in Loon Lake
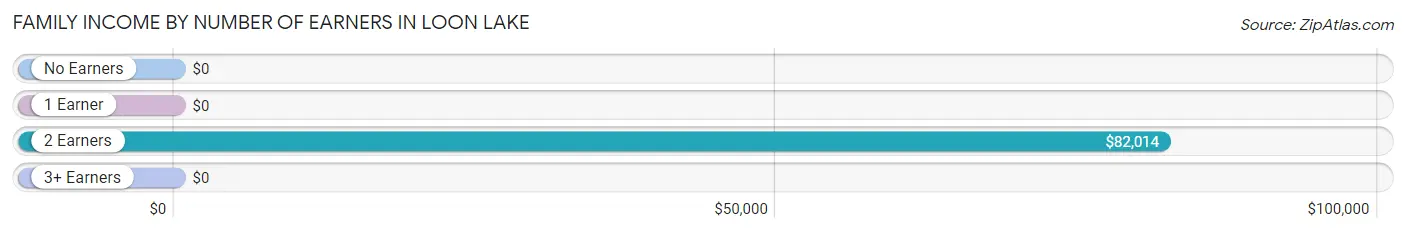
| Number of Earners | # Families | Median Income |
| No Earners | 88 (37.4%) | $0 |
| 1 Earner | 65 (27.7%) | $0 |
| 2 Earners | 57 (24.3%) | $82,014 |
| 3+ Earners | 25 (10.6%) | $0 |
| Total | 235 (100.0%) | $68,867 |
Household Income in Loon Lake
Household Income Brackets in Loon Lake
With 81 households falling in the category, the $50,000 to $74,999 income range is the most frequent in Loon Lake, accounting for 24.2% of all households. In contrast, only 15 households (4.5%) fall into the $35,000 to $49,999 income bracket, making it the least populous group.
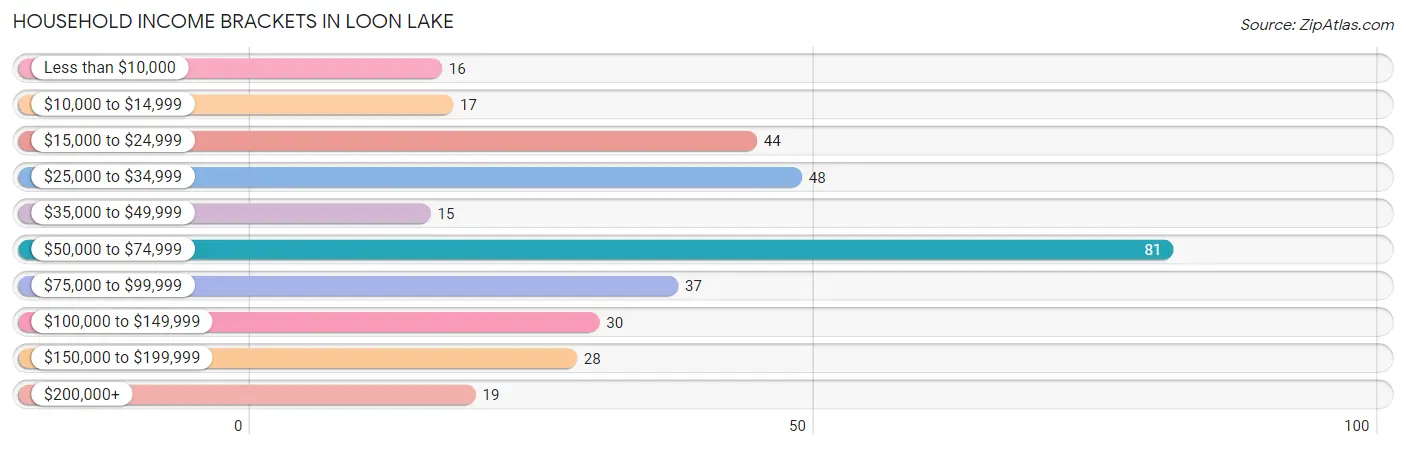
| Income Bracket | # Households | % Households |
| Less than $10,000 | 16 | 4.8% |
| $10,000 to $14,999 | 17 | 5.1% |
| $15,000 to $24,999 | 44 | 13.1% |
| $25,000 to $34,999 | 48 | 14.3% |
| $35,000 to $49,999 | 15 | 4.5% |
| $50,000 to $74,999 | 81 | 24.2% |
| $75,000 to $99,999 | 37 | 11.0% |
| $100,000 to $149,999 | 30 | 9.0% |
| $150,000 to $199,999 | 28 | 8.4% |
| $200,000+ | 19 | 5.7% |
Household Income by Householder Age in Loon Lake
The median household income in Loon Lake is $67,188, with the highest median household income of $73,125 found in the 45 to 64 years age bracket for the primary householder. A total of 146 households (43.6%) fall into this category.
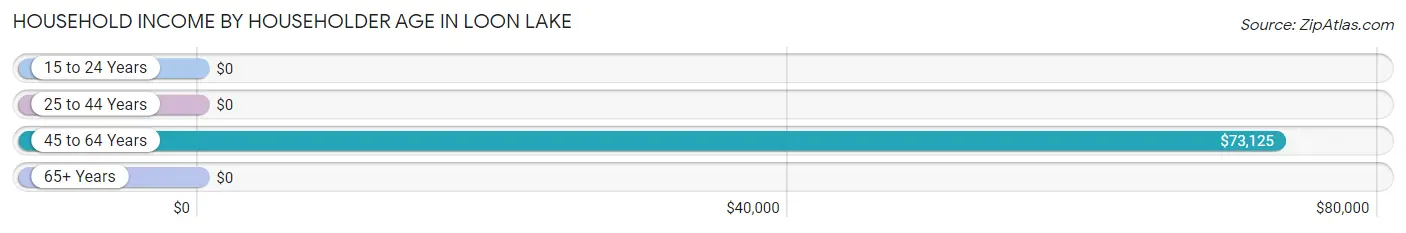
| Income Bracket | # Households | Median Income |
| 15 to 24 Years | 0 (0.0%) | $0 |
| 25 to 44 Years | 27 (8.1%) | $0 |
| 45 to 64 Years | 146 (43.6%) | $73,125 |
| 65+ Years | 162 (48.4%) | $0 |
| Total | 335 (100.0%) | $67,188 |
Poverty in Loon Lake
Income Below Poverty by Sex and Age in Loon Lake
With 14.3% poverty level for males and 5.7% for females among the residents of Loon Lake, 55 to 64 year old males and 65 to 74 year old females are the most vulnerable to poverty, with 40 males (32.5%) and 17 females (12.9%) in their respective age groups living below the poverty level.
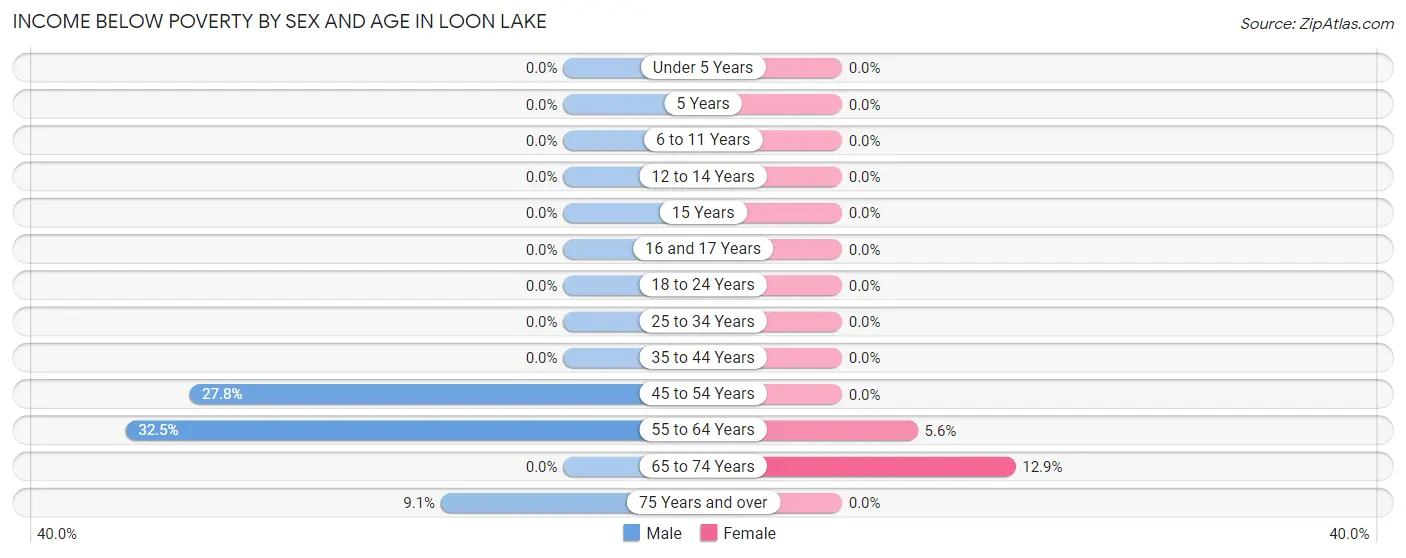
| Age Bracket | Male | Female |
| Under 5 Years | 0 (0.0%) | 0 (0.0%) |
| 5 Years | 0 (0.0%) | 0 (0.0%) |
| 6 to 11 Years | 0 (0.0%) | 0 (0.0%) |
| 12 to 14 Years | 0 (0.0%) | 0 (0.0%) |
| 15 Years | 0 (0.0%) | 0 (0.0%) |
| 16 and 17 Years | 0 (0.0%) | 0 (0.0%) |
| 18 to 24 Years | 0 (0.0%) | 0 (0.0%) |
| 25 to 34 Years | 0 (0.0%) | 0 (0.0%) |
| 35 to 44 Years | 0 (0.0%) | 0 (0.0%) |
| 45 to 54 Years | 5 (27.8%) | 0 (0.0%) |
| 55 to 64 Years | 40 (32.5%) | 4 (5.6%) |
| 65 to 74 Years | 0 (0.0%) | 17 (12.9%) |
| 75 Years and over | 3 (9.1%) | 0 (0.0%) |
| Total | 48 (14.3%) | 21 (5.7%) |
Income Above Poverty by Sex and Age in Loon Lake
According to the poverty statistics in Loon Lake, males aged 6 to 11 years and females aged under 5 years are the age groups that are most secure financially, with 100.0% of males and 100.0% of females in these age groups living above the poverty line.
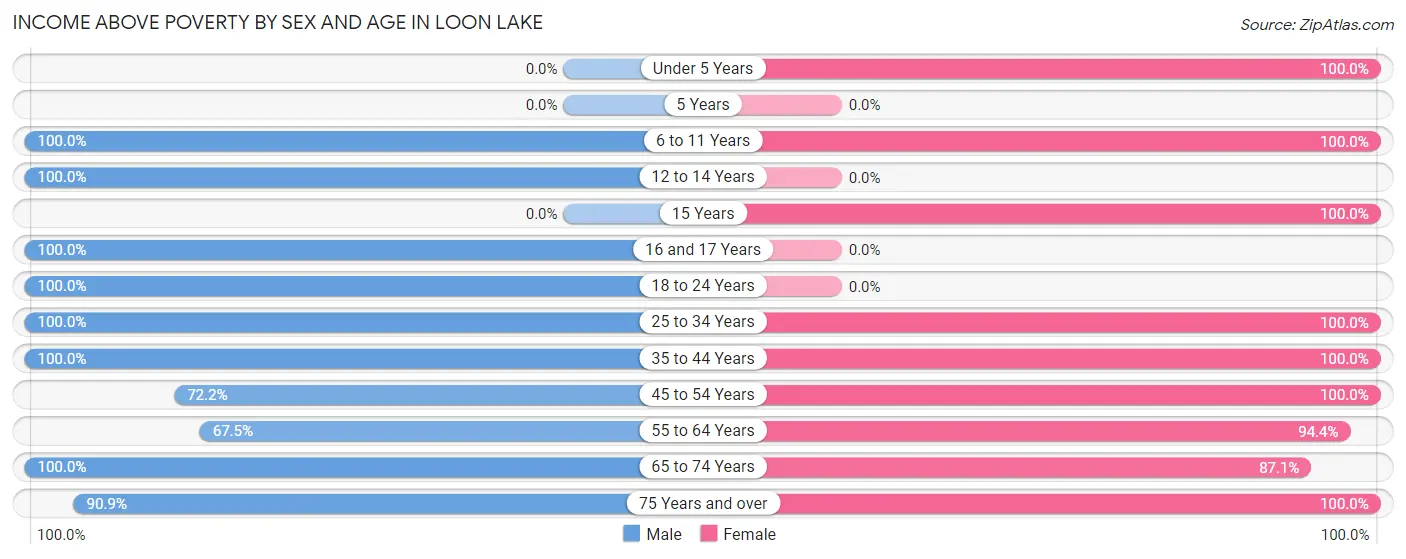
| Age Bracket | Male | Female |
| Under 5 Years | 0 (0.0%) | 4 (100.0%) |
| 5 Years | 0 (0.0%) | 0 (0.0%) |
| 6 to 11 Years | 9 (100.0%) | 34 (100.0%) |
| 12 to 14 Years | 12 (100.0%) | 0 (0.0%) |
| 15 Years | 0 (0.0%) | 4 (100.0%) |
| 16 and 17 Years | 2 (100.0%) | 0 (0.0%) |
| 18 to 24 Years | 8 (100.0%) | 0 (0.0%) |
| 25 to 34 Years | 5 (100.0%) | 16 (100.0%) |
| 35 to 44 Years | 55 (100.0%) | 43 (100.0%) |
| 45 to 54 Years | 13 (72.2%) | 31 (100.0%) |
| 55 to 64 Years | 83 (67.5%) | 67 (94.4%) |
| 65 to 74 Years | 70 (100.0%) | 115 (87.1%) |
| 75 Years and over | 30 (90.9%) | 32 (100.0%) |
| Total | 287 (85.7%) | 346 (94.3%) |
Income Below Poverty Among Married-Couple Families in Loon Lake
The poverty statistics for married-couple families in Loon Lake show that 11.6% or 21 of the total 181 families live below the poverty line. Families with no children have the highest poverty rate of 12.8%, comprising of 21 families. On the other hand, families with 1 or 2 children have the lowest poverty rate of 0.0%, which includes 0 families.
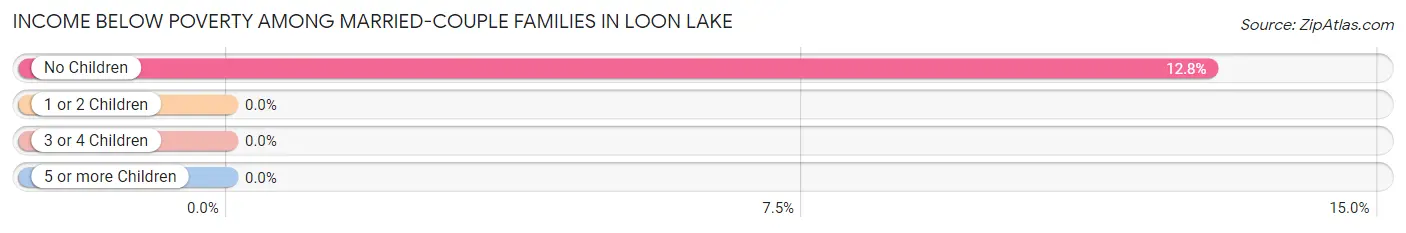
| Children | Above Poverty | Below Poverty |
| No Children | 143 (87.2%) | 21 (12.8%) |
| 1 or 2 Children | 15 (100.0%) | 0 (0.0%) |
| 3 or 4 Children | 2 (100.0%) | 0 (0.0%) |
| 5 or more Children | 0 (0.0%) | 0 (0.0%) |
| Total | 160 (88.4%) | 21 (11.6%) |
Income Below Poverty Among Single-Parent Households in Loon Lake
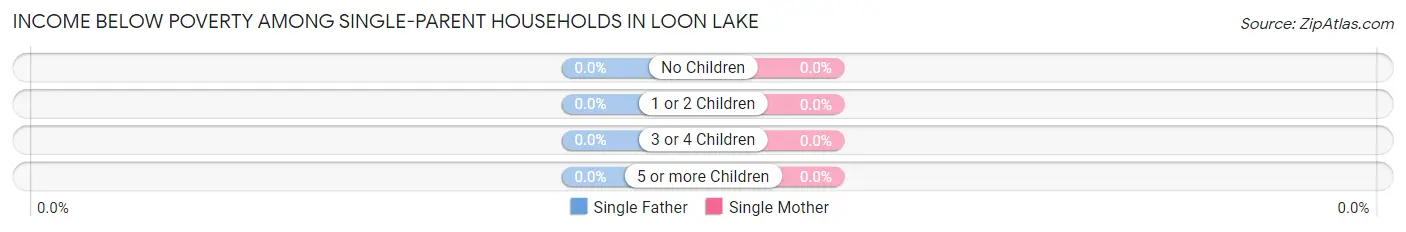
| Children | Single Father | Single Mother |
| No Children | 0 (0.0%) | 0 (0.0%) |
| 1 or 2 Children | 0 (0.0%) | 0 (0.0%) |
| 3 or 4 Children | 0 (0.0%) | 0 (0.0%) |
| 5 or more Children | 0 (0.0%) | 0 (0.0%) |
| Total | 0 (0.0%) | 0 (0.0%) |
Income Below Poverty Among Married-Couple vs Single-Parent Households in Loon Lake
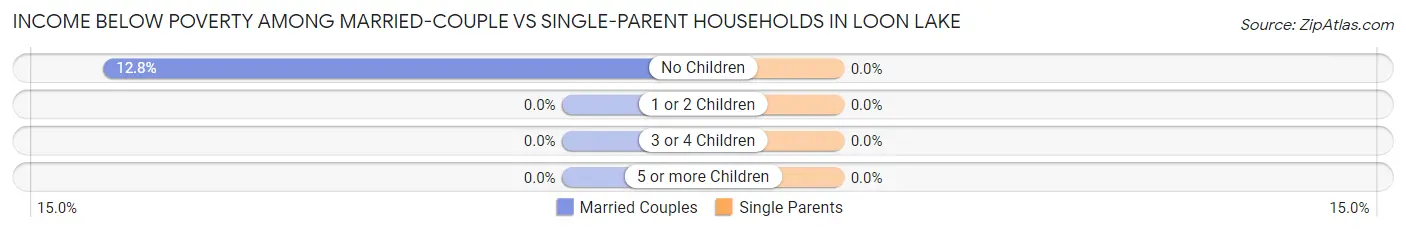
| Children | Married-Couple Families | Single-Parent Households |
| No Children | 21 (12.8%) | 0 (0.0%) |
| 1 or 2 Children | 0 (0.0%) | 0 (0.0%) |
| 3 or 4 Children | 0 (0.0%) | 0 (0.0%) |
| 5 or more Children | 0 (0.0%) | 0 (0.0%) |
| Total | 21 (11.6%) | 0 (0.0%) |
Race in Loon Lake
The most populous races in Loon Lake are White / Caucasian (681 | 97.0%), Asian (11 | 1.6%), and Hispanic or Latino (10 | 1.4%).
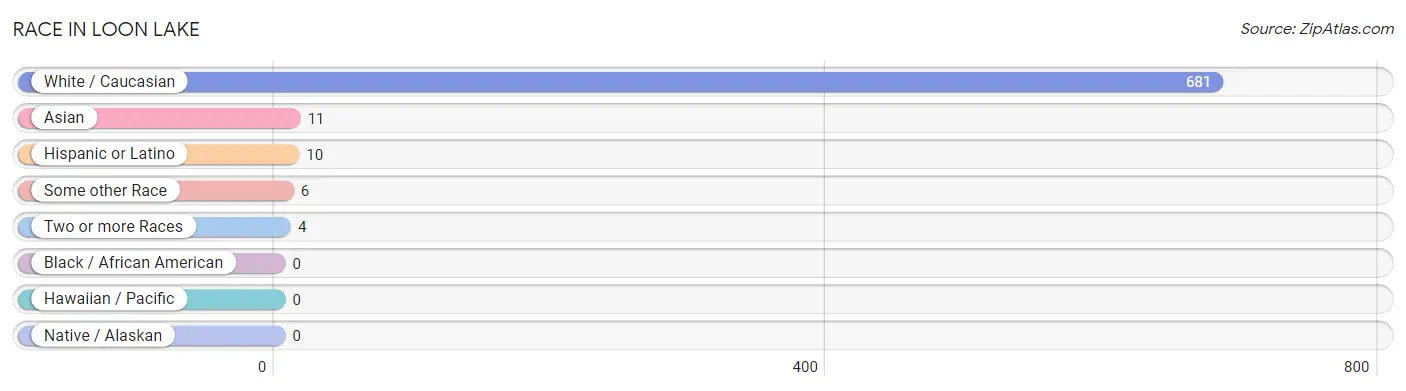
| Race | # Population | % Population |
| Asian | 11 | 1.6% |
| Black / African American | 0 | 0.0% |
| Hawaiian / Pacific | 0 | 0.0% |
| Hispanic or Latino | 10 | 1.4% |
| Native / Alaskan | 0 | 0.0% |
| White / Caucasian | 681 | 97.0% |
| Two or more Races | 4 | 0.6% |
| Some other Race | 6 | 0.9% |
| Total | 702 | 100.0% |
Ancestry in Loon Lake
The most populous ancestries reported in Loon Lake are European (137 | 19.5%), English (132 | 18.8%), German (81 | 11.5%), Irish (47 | 6.7%), and Norwegian (45 | 6.4%), together accounting for 63.0% of all Loon Lake residents.
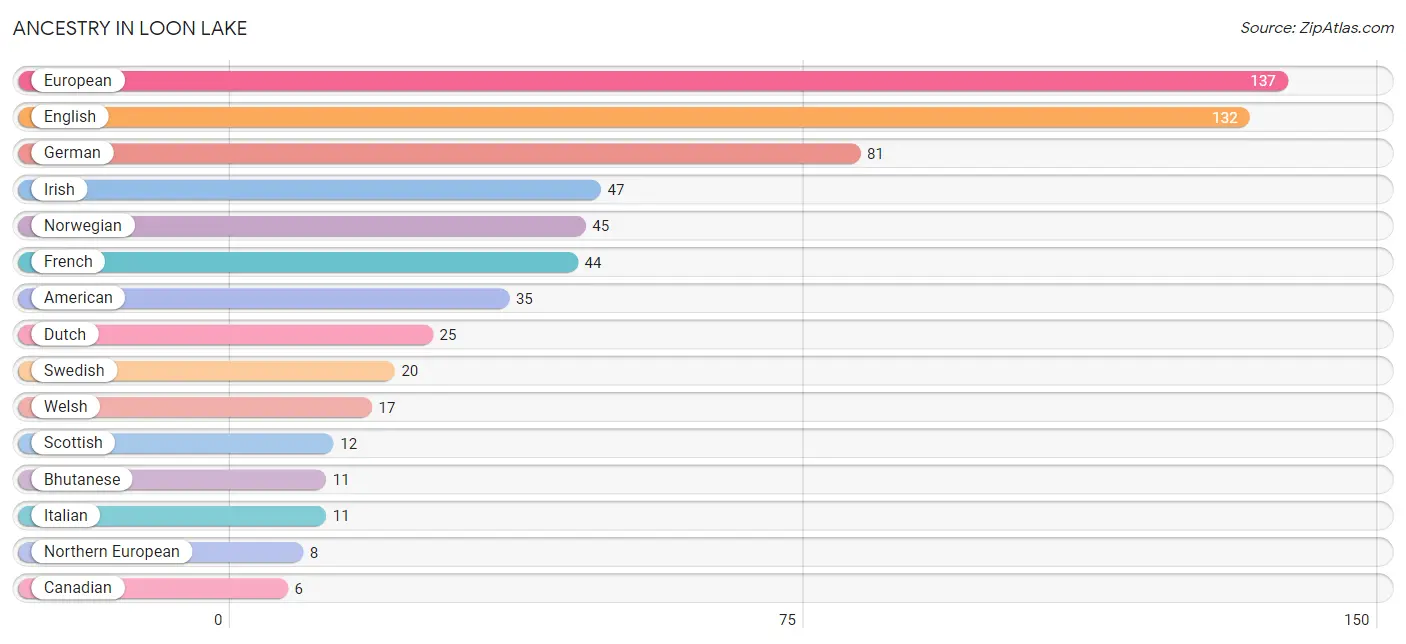
| Ancestry | # Population | % Population |
| American | 35 | 5.0% |
| Bhutanese | 11 | 1.6% |
| British | 4 | 0.6% |
| Canadian | 6 | 0.9% |
| Danish | 5 | 0.7% |
| Dutch | 25 | 3.6% |
| English | 132 | 18.8% |
| European | 137 | 19.5% |
| French | 44 | 6.3% |
| German | 81 | 11.5% |
| Irish | 47 | 6.7% |
| Italian | 11 | 1.6% |
| Mexican | 6 | 0.9% |
| Northern European | 8 | 1.1% |
| Norwegian | 45 | 6.4% |
| Polish | 3 | 0.4% |
| Scandinavian | 5 | 0.7% |
| Scottish | 12 | 1.7% |
| Spaniard | 4 | 0.6% |
| Swedish | 20 | 2.9% |
| Welsh | 17 | 2.4% |
| Yugoslavian | 4 | 0.6% | View All 22 Rows |
Immigrants in Loon Lake
The most numerous immigrant groups reported in Loon Lake came from Asia (11 | 1.6%), Eastern Asia (11 | 1.6%), and Japan (11 | 1.6%), together accounting for 4.7% of all Loon Lake residents.
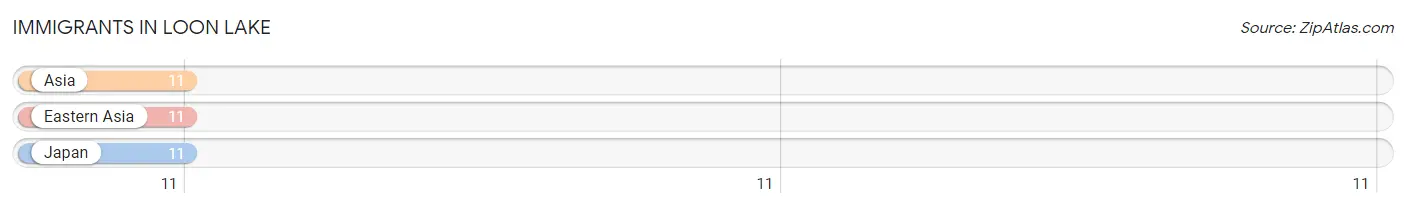
| Immigration Origin | # Population | % Population |
| Asia | 11 | 1.6% |
| Eastern Asia | 11 | 1.6% |
| Japan | 11 | 1.6% | View All 3 Rows |
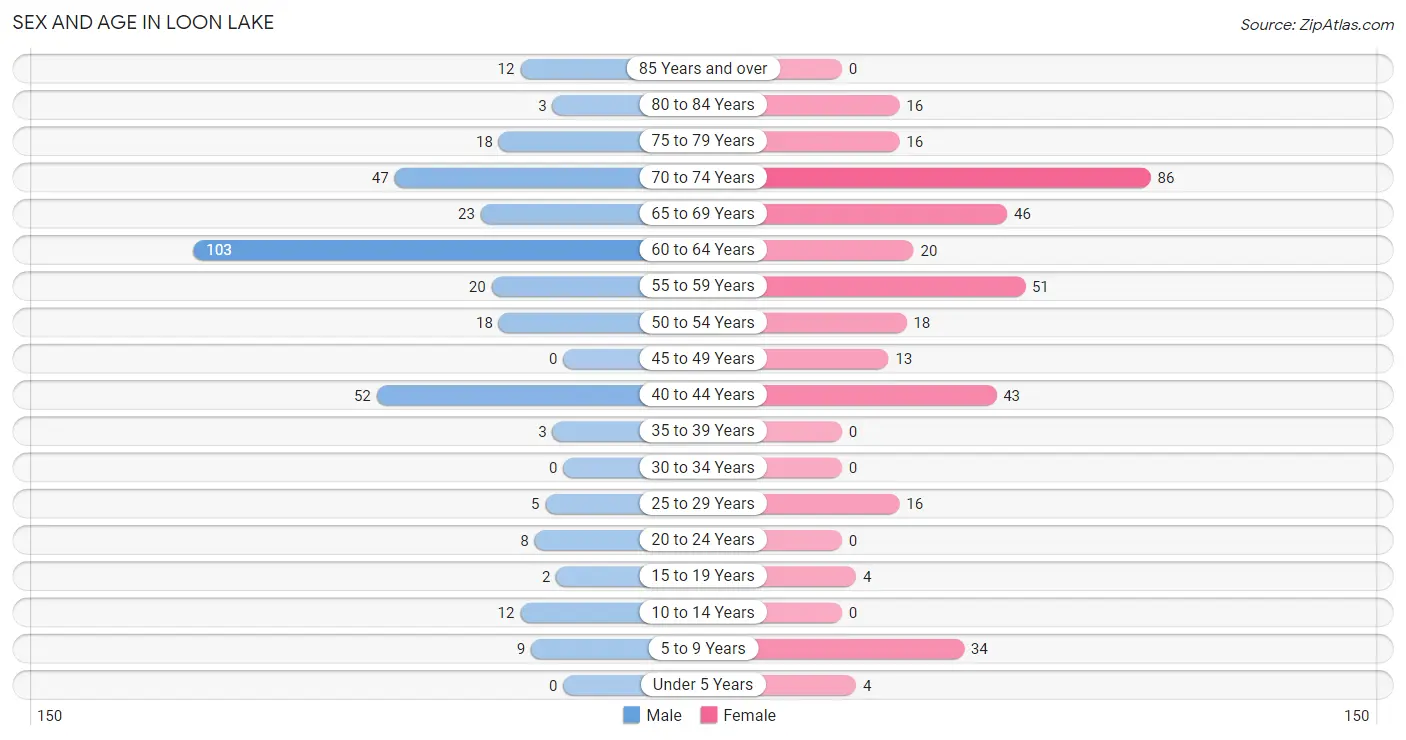
Sex and Age in Loon Lake
Sex and Age in Loon Lake
The most populous age groups in Loon Lake are 60 to 64 Years (103 | 30.7%) for men and 70 to 74 Years (86 | 23.4%) for women.
| Age Bracket | Male | Female |
| Under 5 Years | 0 (0.0%) | 4 (1.1%) |
| 5 to 9 Years | 9 (2.7%) | 34 (9.3%) |
| 10 to 14 Years | 12 (3.6%) | 0 (0.0%) |
| 15 to 19 Years | 2 (0.6%) | 4 (1.1%) |
| 20 to 24 Years | 8 (2.4%) | 0 (0.0%) |
| 25 to 29 Years | 5 (1.5%) | 16 (4.4%) |
| 30 to 34 Years | 0 (0.0%) | 0 (0.0%) |
| 35 to 39 Years | 3 (0.9%) | 0 (0.0%) |
| 40 to 44 Years | 52 (15.5%) | 43 (11.7%) |
| 45 to 49 Years | 0 (0.0%) | 13 (3.5%) |
| 50 to 54 Years | 18 (5.4%) | 18 (4.9%) |
| 55 to 59 Years | 20 (6.0%) | 51 (13.9%) |
| 60 to 64 Years | 103 (30.7%) | 20 (5.4%) |
| 65 to 69 Years | 23 (6.9%) | 46 (12.5%) |
| 70 to 74 Years | 47 (14.0%) | 86 (23.4%) |
| 75 to 79 Years | 18 (5.4%) | 16 (4.4%) |
| 80 to 84 Years | 3 (0.9%) | 16 (4.4%) |
| 85 Years and over | 12 (3.6%) | 0 (0.0%) |
| Total | 335 (100.0%) | 367 (100.0%) |
Families and Households in Loon Lake
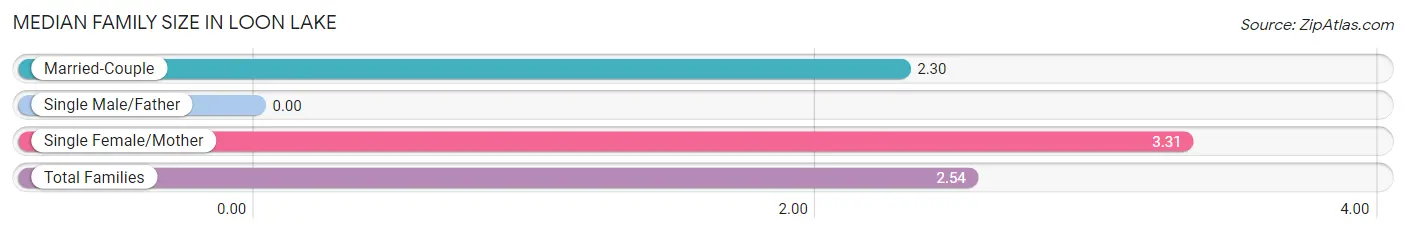
Median Family Size in Loon Lake
| Family Type | # Families | Family Size |
| Married-Couple | 181 (77.0%) | 2.30 |
| Single Male/Father | 0 (0.0%) | - |
| Single Female/Mother | 54 (23.0%) | 3.31 |
| Total Families | 235 (100.0%) | 2.54 |
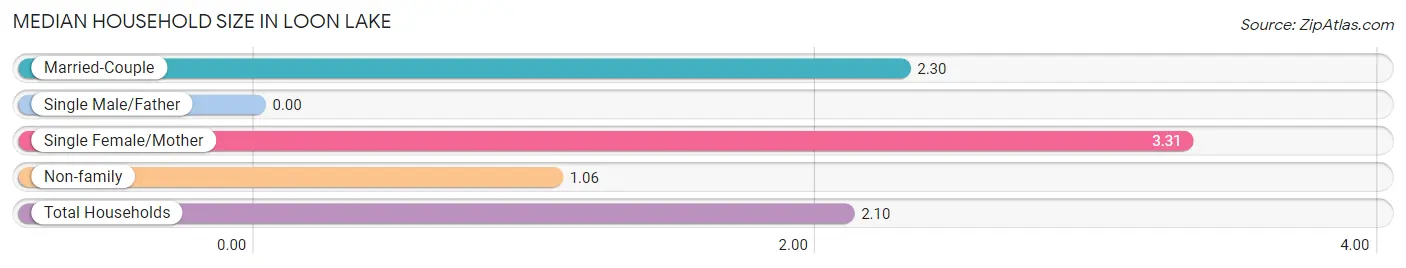
Median Household Size in Loon Lake
| Household Type | # Households | Household Size |
| Married-Couple | 181 (54.0%) | 2.30 |
| Single Male/Father | 0 (0.0%) | - |
| Single Female/Mother | 54 (16.1%) | 3.31 |
| Non-family | 100 (29.8%) | 1.06 |
| Total Households | 335 (100.0%) | 2.10 |
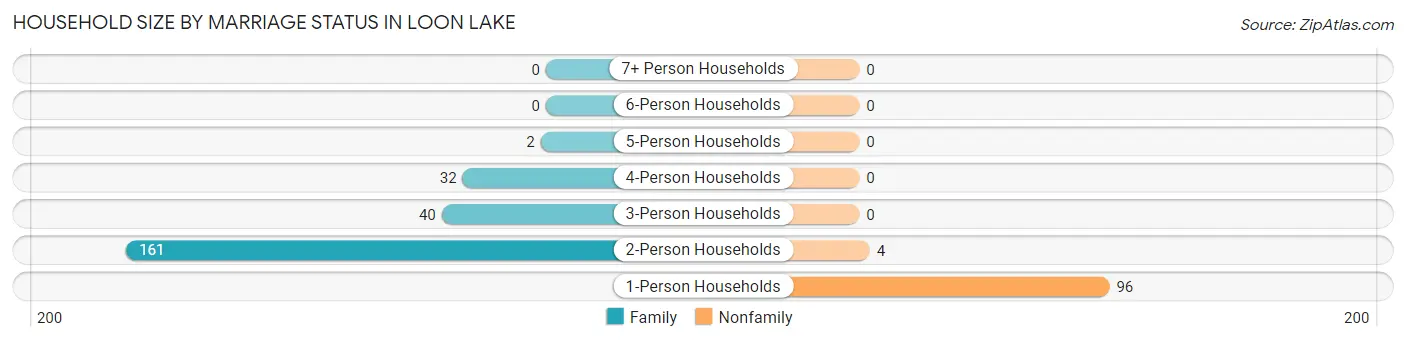
Household Size by Marriage Status in Loon Lake
Out of a total of 335 households in Loon Lake, 235 (70.2%) are family households, while 100 (29.8%) are nonfamily households. The most numerous type of family households are 2-person households, comprising 161, and the most common type of nonfamily households are 1-person households, comprising 96.
| Household Size | Family Households | Nonfamily Households |
| 1-Person Households | - | 96 (28.7%) |
| 2-Person Households | 161 (48.1%) | 4 (1.2%) |
| 3-Person Households | 40 (11.9%) | 0 (0.0%) |
| 4-Person Households | 32 (9.6%) | 0 (0.0%) |
| 5-Person Households | 2 (0.6%) | 0 (0.0%) |
| 6-Person Households | 0 (0.0%) | 0 (0.0%) |
| 7+ Person Households | 0 (0.0%) | 0 (0.0%) |
| Total | 235 (70.2%) | 100 (29.8%) |
Female Fertility in Loon Lake
Fertility by Age in Loon Lake
Average fertility rate in Loon Lake is 92.0 births per 1,000 women. Women in the age bracket of 20 to 34 years have the highest fertility rate with 438.0 births per 1,000 women. Women in the age bracket of 20 to 34 years acount for 100.0% of all women with births.
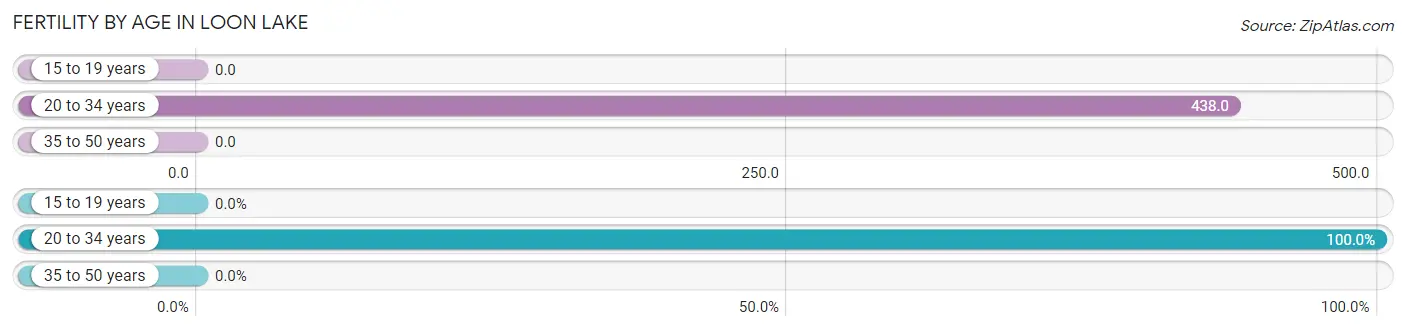
| Age Bracket | Women with Births | Births / 1,000 Women |
| 15 to 19 years | 0 (0.0%) | 0.0 |
| 20 to 34 years | 7 (100.0%) | 438.0 |
| 35 to 50 years | 0 (0.0%) | 0.0 |
| Total | 7 (100.0%) | 92.0 |
Fertility by Age by Marriage Status in Loon Lake
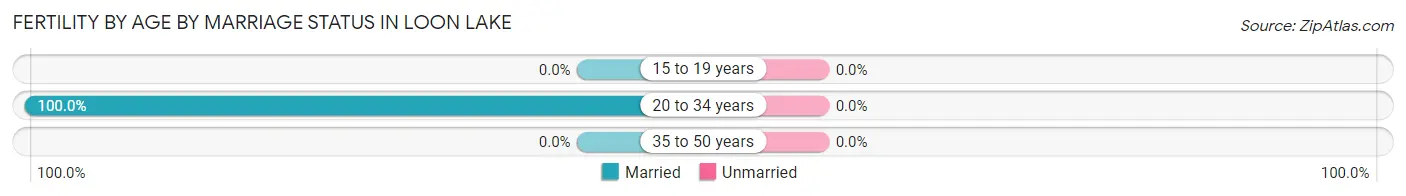
| Age Bracket | Married | Unmarried |
| 15 to 19 years | 0 (0.0%) | 0 (0.0%) |
| 20 to 34 years | 7 (100.0%) | 0 (0.0%) |
| 35 to 50 years | 0 (0.0%) | 0 (0.0%) |
| Total | 7 (100.0%) | 0 (0.0%) |
Fertility by Education in Loon Lake
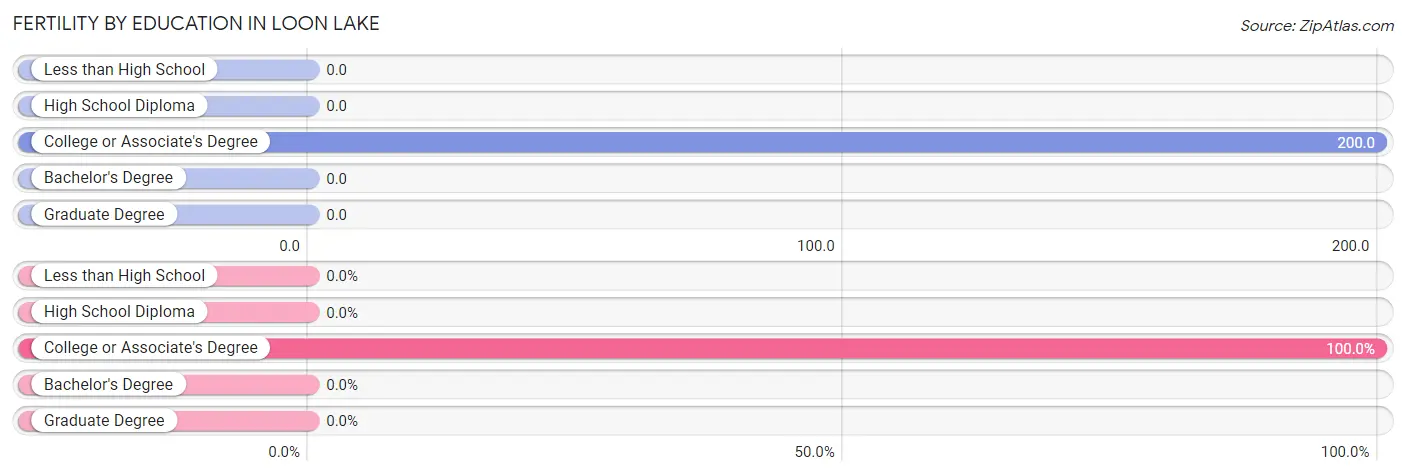
| Educational Attainment | Women with Births | Births / 1,000 Women |
| Less than High School | 0 (0.0%) | 0.0 |
| High School Diploma | 0 (0.0%) | 0.0 |
| College or Associate's Degree | 7 (100.0%) | 200.0 |
| Bachelor's Degree | 0 (0.0%) | 0.0 |
| Graduate Degree | 0 (0.0%) | 0.0 |
| Total | 7 (100.0%) | 92.0 |
Fertility by Education by Marriage Status in Loon Lake
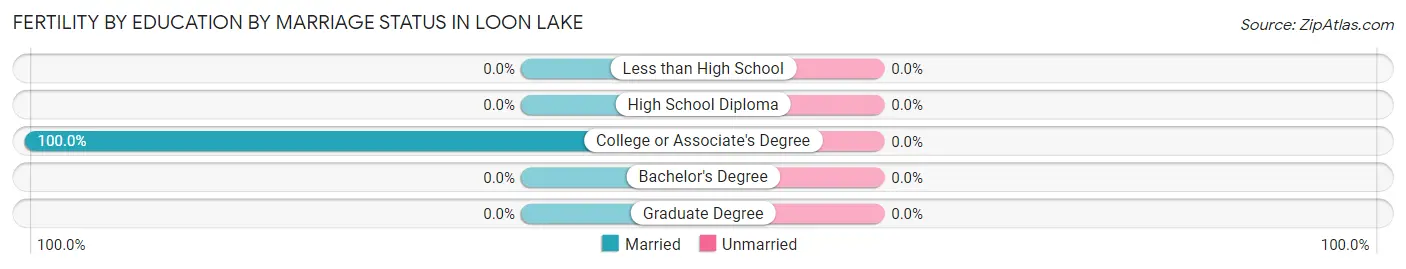
| Educational Attainment | Married | Unmarried |
| Less than High School | 0 (0.0%) | 0 (0.0%) |
| High School Diploma | 0 (0.0%) | 0 (0.0%) |
| College or Associate's Degree | 7 (100.0%) | 0 (0.0%) |
| Bachelor's Degree | 0 (0.0%) | 0 (0.0%) |
| Graduate Degree | 0 (0.0%) | 0 (0.0%) |
| Total | 7 (100.0%) | 0 (0.0%) |
Employment Characteristics in Loon Lake
Employment by Class of Employer in Loon Lake
Among the 250 employed individuals in Loon Lake, self-employed (not incorporated) (95 | 38.0%), private company employees (88 | 35.2%), and local government employees (25 | 10.0%) make up the most common classes of employment.
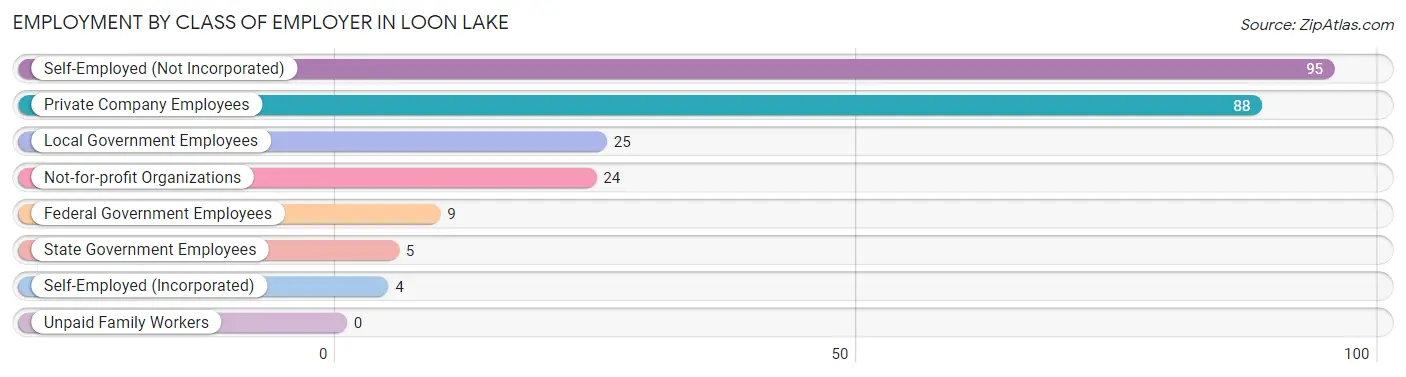
| Employer Class | # Employees | % Employees |
| Private Company Employees | 88 | 35.2% |
| Self-Employed (Incorporated) | 4 | 1.6% |
| Self-Employed (Not Incorporated) | 95 | 38.0% |
| Not-for-profit Organizations | 24 | 9.6% |
| Local Government Employees | 25 | 10.0% |
| State Government Employees | 5 | 2.0% |
| Federal Government Employees | 9 | 3.6% |
| Unpaid Family Workers | 0 | 0.0% |
| Total | 250 | 100.0% |
Employment Status by Age in Loon Lake
According to the labor force statistics for Loon Lake, out of the total population over 16 years of age (639), 41.6% or 266 individuals are in the labor force, with 4.1% or 11 of them unemployed. The age group with the highest labor force participation rate is 35 to 44 years, with 95.9% or 94 individuals in the labor force. Within the labor force, the 75 years and over age range has the highest percentage of unemployed individuals, with 100.0% or 8 of them being unemployed.
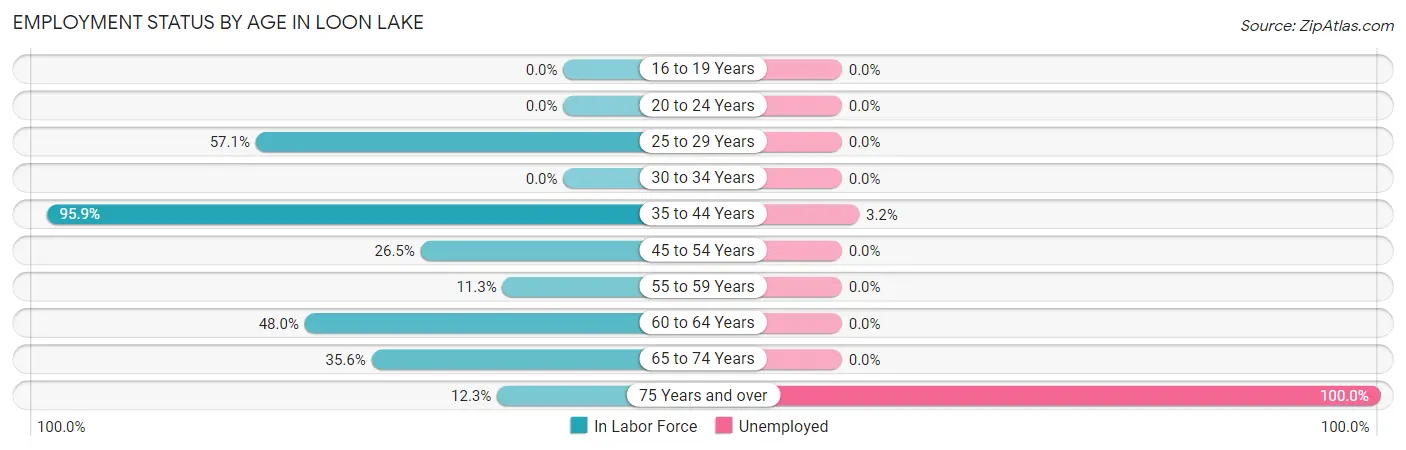
| Age Bracket | In Labor Force | Unemployed |
| 16 to 19 Years | 0 (0.0%) | 0 (0.0%) |
| 20 to 24 Years | 0 (0.0%) | 0 (0.0%) |
| 25 to 29 Years | 12 (57.1%) | 0 (0.0%) |
| 30 to 34 Years | 0 (0.0%) | 0 (0.0%) |
| 35 to 44 Years | 94 (95.9%) | 3 (3.2%) |
| 45 to 54 Years | 13 (26.5%) | 0 (0.0%) |
| 55 to 59 Years | 8 (11.3%) | 0 (0.0%) |
| 60 to 64 Years | 59 (48.0%) | 0 (0.0%) |
| 65 to 74 Years | 72 (35.6%) | 0 (0.0%) |
| 75 Years and over | 8 (12.3%) | 8 (100.0%) |
| Total | 266 (41.6%) | 11 (4.1%) |
Employment Status by Educational Attainment in Loon Lake
According to labor force statistics for Loon Lake, 51.4% of individuals (186) out of the total population between 25 and 64 years of age (362) are in the labor force, with 1.6% or 3 of them being unemployed. The group with the highest labor force participation rate are those with the educational attainment of bachelor's degree or higher, with 77.8% or 63 individuals in the labor force. Within the labor force, individuals with college / associate degree education have the highest percentage of unemployment, with 4.9% or 3 of them being unemployed.
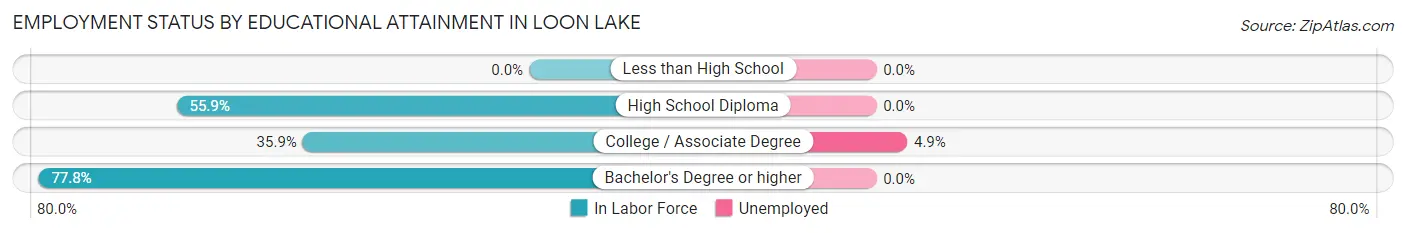
| Educational Attainment | In Labor Force | Unemployed |
| Less than High School | 0 (0.0%) | 0 (0.0%) |
| High School Diploma | 62 (55.9%) | 0 (0.0%) |
| College / Associate Degree | 61 (35.9%) | 8 (4.9%) |
| Bachelor's Degree or higher | 63 (77.8%) | 0 (0.0%) |
| Total | 186 (51.4%) | 6 (1.6%) |
Employment Occupations by Sex in Loon Lake
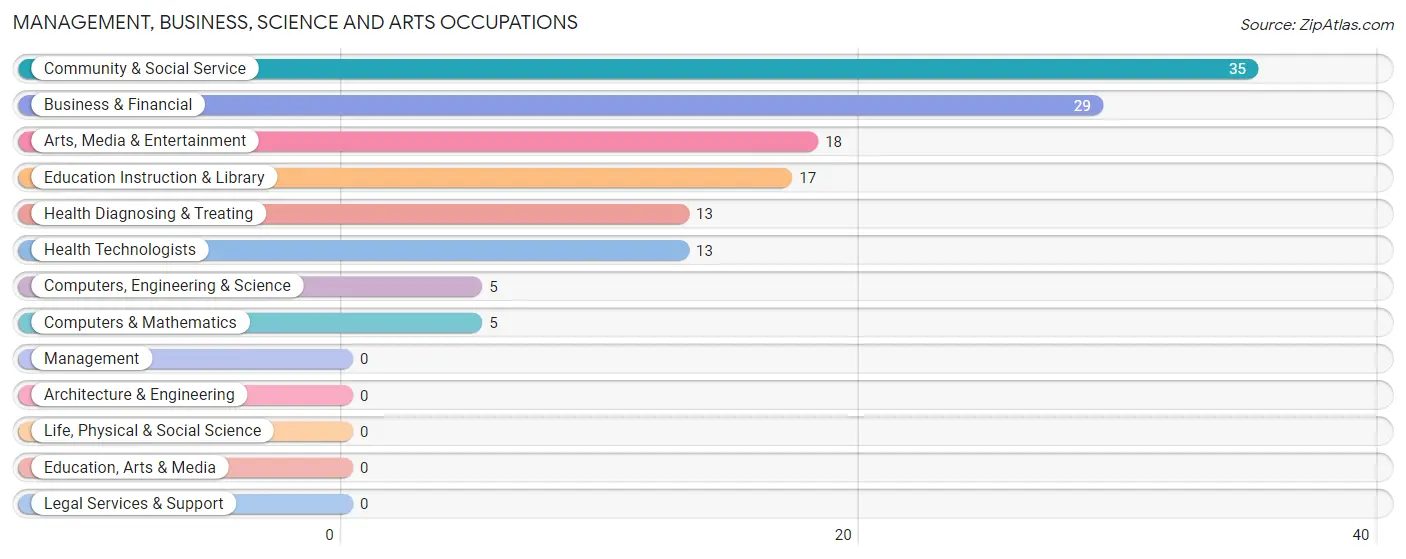
Management, Business, Science and Arts Occupations
The most common Management, Business, Science and Arts occupations in Loon Lake are Community & Social Service (35 | 13.7%), Business & Financial (29 | 11.4%), Arts, Media & Entertainment (18 | 7.1%), Education Instruction & Library (17 | 6.7%), and Health Diagnosing & Treating (13 | 5.1%).
Management, Business, Science and Arts Occupations by Sex
Within the Management, Business, Science and Arts occupations in Loon Lake, the most male-oriented occupations are Computers, Engineering & Science (100.0%), Computers & Mathematics (100.0%), and Health Diagnosing & Treating (69.2%), while the most female-oriented occupations are Arts, Media & Entertainment (100.0%), Community & Social Service (88.6%), and Business & Financial (86.2%).
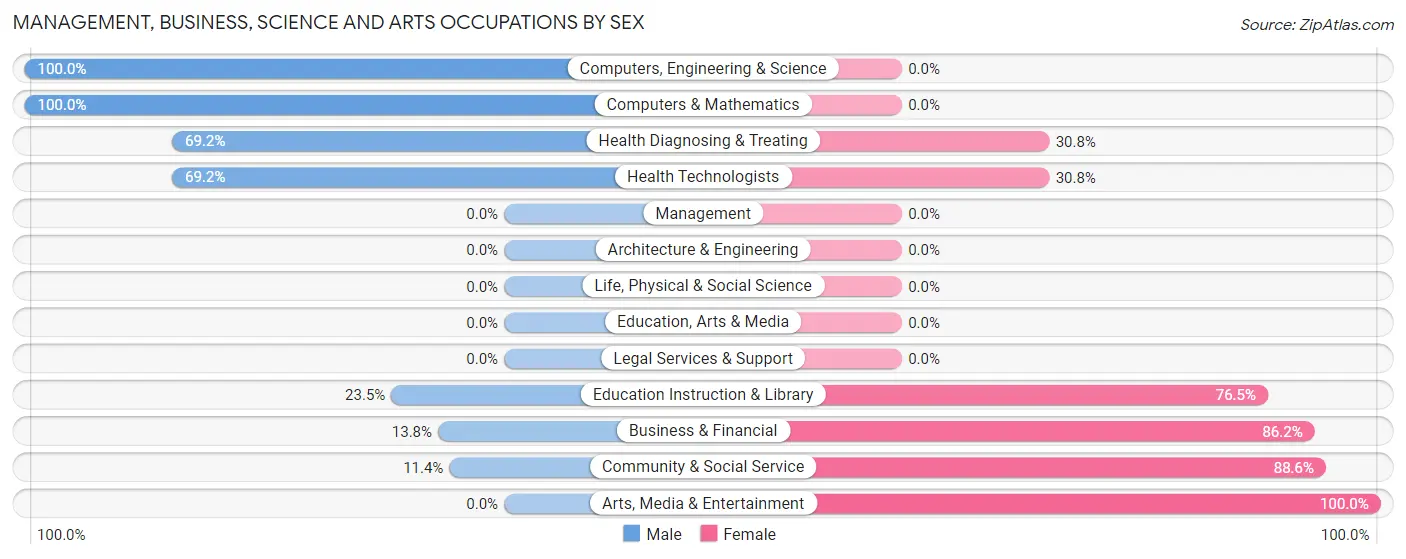
| Occupation | Male | Female |
| Management | 0 (0.0%) | 0 (0.0%) |
| Business & Financial | 4 (13.8%) | 25 (86.2%) |
| Computers, Engineering & Science | 5 (100.0%) | 0 (0.0%) |
| Computers & Mathematics | 5 (100.0%) | 0 (0.0%) |
| Architecture & Engineering | 0 (0.0%) | 0 (0.0%) |
| Life, Physical & Social Science | 0 (0.0%) | 0 (0.0%) |
| Community & Social Service | 4 (11.4%) | 31 (88.6%) |
| Education, Arts & Media | 0 (0.0%) | 0 (0.0%) |
| Legal Services & Support | 0 (0.0%) | 0 (0.0%) |
| Education Instruction & Library | 4 (23.5%) | 13 (76.5%) |
| Arts, Media & Entertainment | 0 (0.0%) | 18 (100.0%) |
| Health Diagnosing & Treating | 9 (69.2%) | 4 (30.8%) |
| Health Technologists | 9 (69.2%) | 4 (30.8%) |
| Total (Category) | 22 (26.8%) | 60 (73.2%) |
| Total (Overall) | 110 (43.1%) | 145 (56.9%) |
Services Occupations
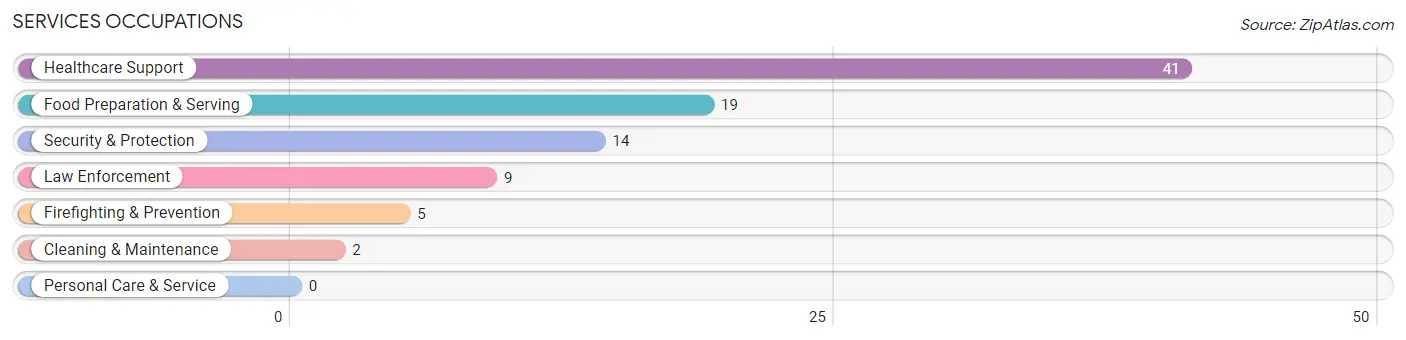
The most common Services occupations in Loon Lake are Healthcare Support (41 | 16.1%), Food Preparation & Serving (19 | 7.4%), Security & Protection (14 | 5.5%), Law Enforcement (9 | 3.5%), and Firefighting & Prevention (5 | 2.0%).
Services Occupations by Sex
Within the Services occupations in Loon Lake, the most male-oriented occupations are Security & Protection (100.0%), Firefighting & Prevention (100.0%), and Law Enforcement (100.0%), while the most female-oriented occupations are Healthcare Support (100.0%), and Food Preparation & Serving (68.4%).
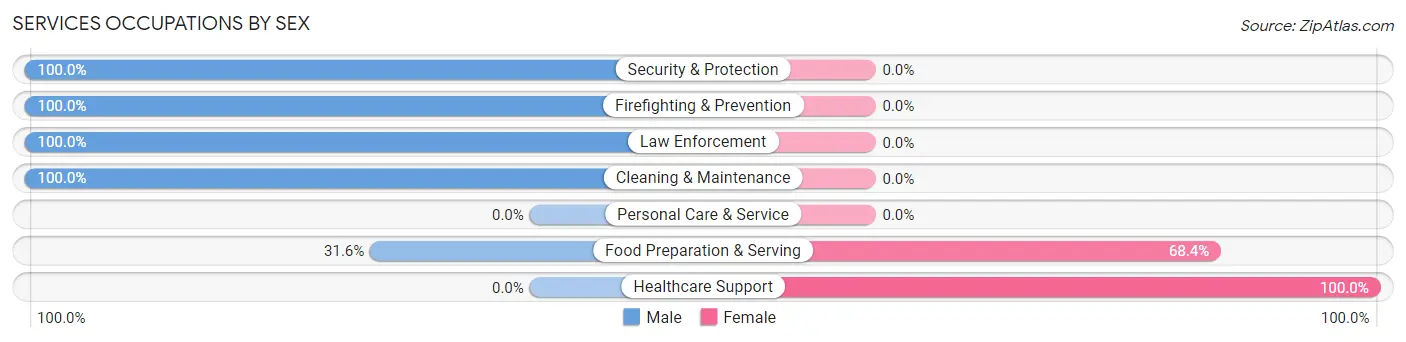
| Occupation | Male | Female |
| Healthcare Support | 0 (0.0%) | 41 (100.0%) |
| Security & Protection | 14 (100.0%) | 0 (0.0%) |
| Firefighting & Prevention | 5 (100.0%) | 0 (0.0%) |
| Law Enforcement | 9 (100.0%) | 0 (0.0%) |
| Food Preparation & Serving | 6 (31.6%) | 13 (68.4%) |
| Cleaning & Maintenance | 2 (100.0%) | 0 (0.0%) |
| Personal Care & Service | 0 (0.0%) | 0 (0.0%) |
| Total (Category) | 22 (28.9%) | 54 (71.1%) |
| Total (Overall) | 110 (43.1%) | 145 (56.9%) |
Sales and Office Occupations
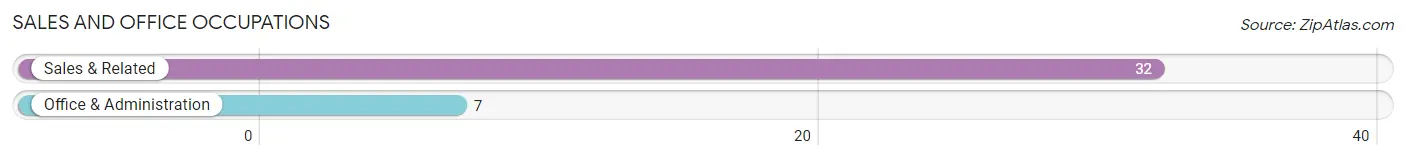
The most common Sales and Office occupations in Loon Lake are Sales & Related (32 | 12.6%), and Office & Administration (7 | 2.8%).
Sales and Office Occupations by Sex
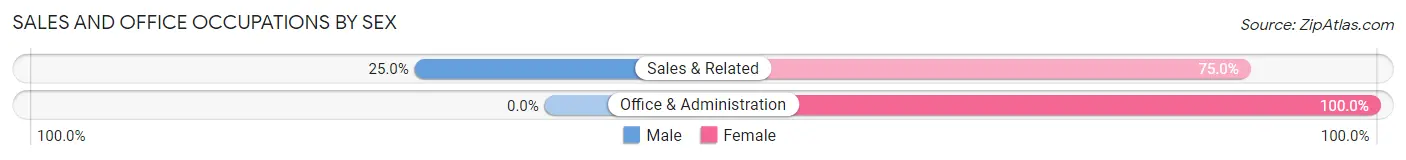
| Occupation | Male | Female |
| Sales & Related | 8 (25.0%) | 24 (75.0%) |
| Office & Administration | 0 (0.0%) | 7 (100.0%) |
| Total (Category) | 8 (20.5%) | 31 (79.5%) |
| Total (Overall) | 110 (43.1%) | 145 (56.9%) |
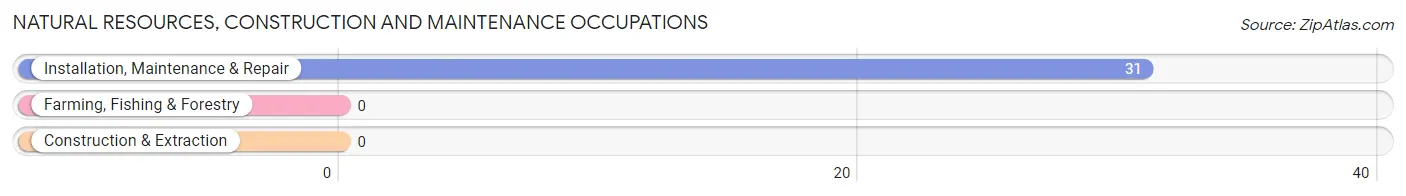
Natural Resources, Construction and Maintenance Occupations
The most common Natural Resources, Construction and Maintenance occupations in Loon Lake are , and Installation, Maintenance & Repair (31 | 12.2%).
Natural Resources, Construction and Maintenance Occupations by Sex
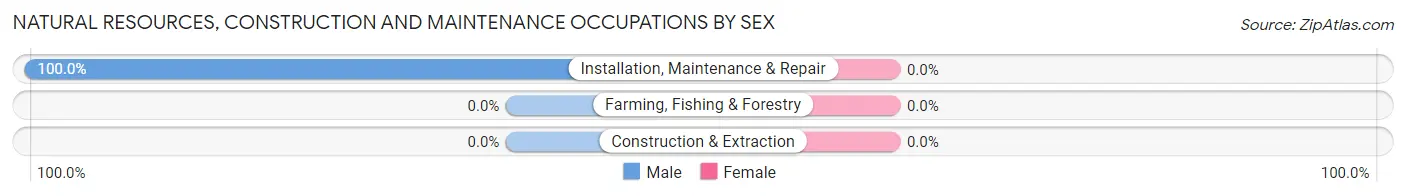
| Occupation | Male | Female |
| Farming, Fishing & Forestry | 0 (0.0%) | 0 (0.0%) |
| Construction & Extraction | 0 (0.0%) | 0 (0.0%) |
| Installation, Maintenance & Repair | 31 (100.0%) | 0 (0.0%) |
| Total (Category) | 31 (100.0%) | 0 (0.0%) |
| Total (Overall) | 110 (43.1%) | 145 (56.9%) |
Production, Transportation and Moving Occupations
The most common Production, Transportation and Moving occupations in Loon Lake are Material Moving (18 | 7.1%), Production (5 | 2.0%), and Transportation (4 | 1.6%).
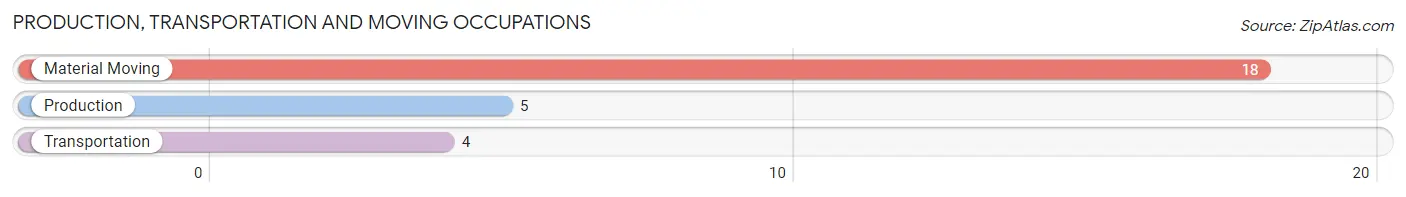
Production, Transportation and Moving Occupations by Sex
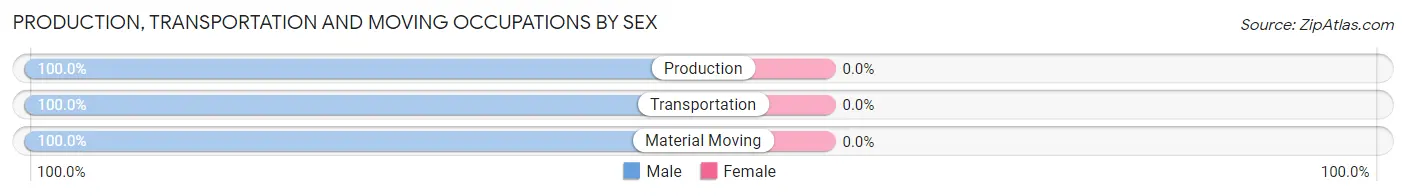
| Occupation | Male | Female |
| Production | 5 (100.0%) | 0 (0.0%) |
| Transportation | 4 (100.0%) | 0 (0.0%) |
| Material Moving | 18 (100.0%) | 0 (0.0%) |
| Total (Category) | 27 (100.0%) | 0 (0.0%) |
| Total (Overall) | 110 (43.1%) | 145 (56.9%) |
Employment Industries by Sex in Loon Lake
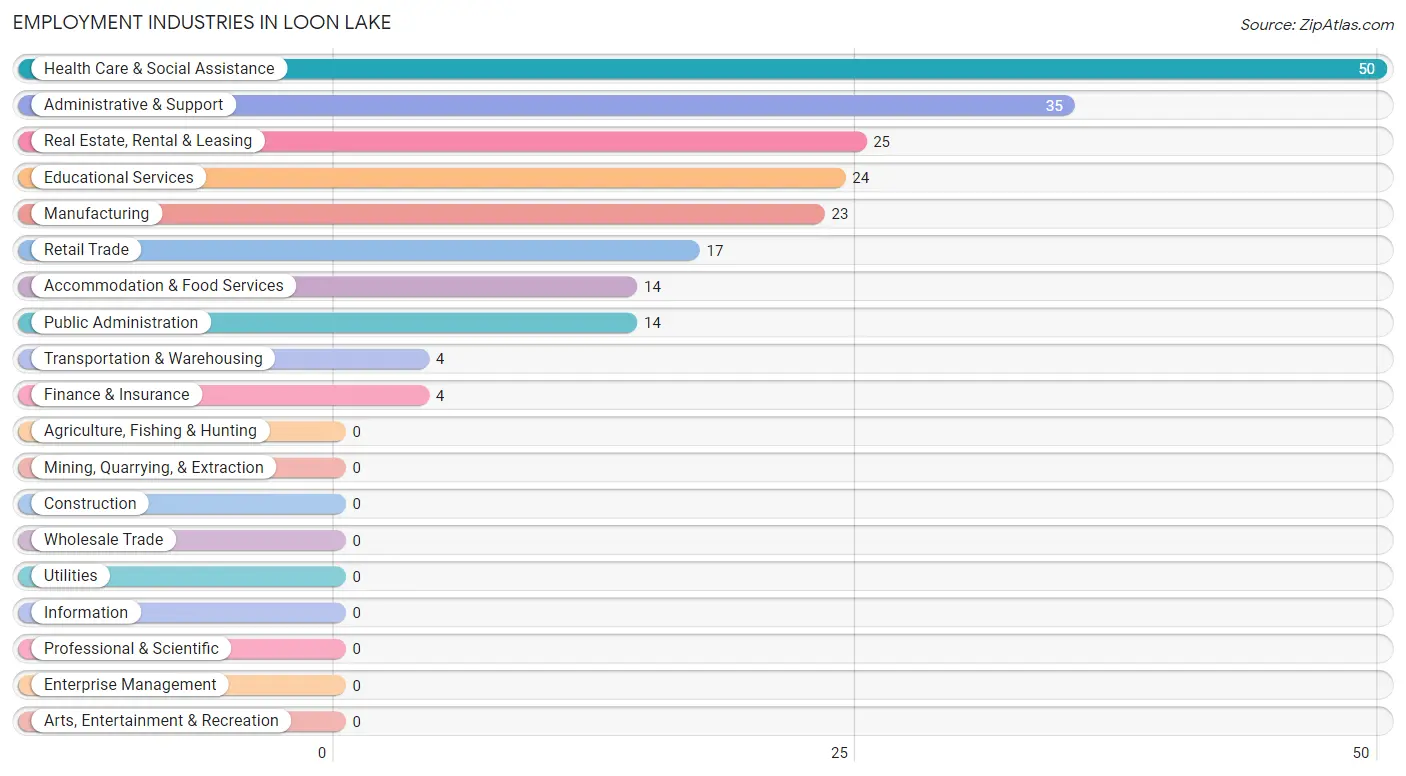
Employment Industries in Loon Lake
The major employment industries in Loon Lake include Health Care & Social Assistance (50 | 19.6%), Administrative & Support (35 | 13.7%), Real Estate, Rental & Leasing (25 | 9.8%), Educational Services (24 | 9.4%), and Manufacturing (23 | 9.0%).
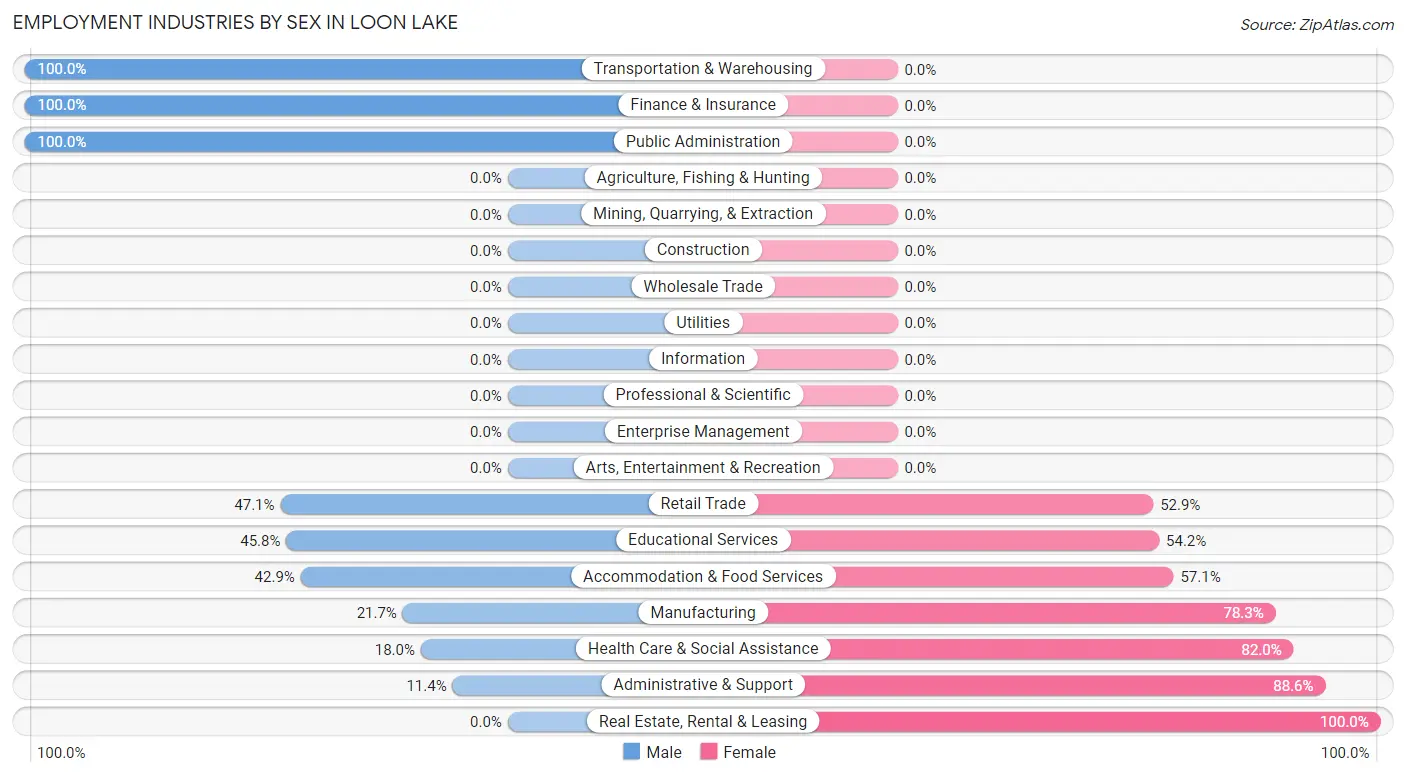
Employment Industries by Sex in Loon Lake
The Loon Lake industries that see more men than women are Transportation & Warehousing (100.0%), Finance & Insurance (100.0%), and Public Administration (100.0%), whereas the industries that tend to have a higher number of women are Real Estate, Rental & Leasing (100.0%), Administrative & Support (88.6%), and Health Care & Social Assistance (82.0%).
| Industry | Male | Female |
| Agriculture, Fishing & Hunting | 0 (0.0%) | 0 (0.0%) |
| Mining, Quarrying, & Extraction | 0 (0.0%) | 0 (0.0%) |
| Construction | 0 (0.0%) | 0 (0.0%) |
| Manufacturing | 5 (21.7%) | 18 (78.3%) |
| Wholesale Trade | 0 (0.0%) | 0 (0.0%) |
| Retail Trade | 8 (47.1%) | 9 (52.9%) |
| Transportation & Warehousing | 4 (100.0%) | 0 (0.0%) |
| Utilities | 0 (0.0%) | 0 (0.0%) |
| Information | 0 (0.0%) | 0 (0.0%) |
| Finance & Insurance | 4 (100.0%) | 0 (0.0%) |
| Real Estate, Rental & Leasing | 0 (0.0%) | 25 (100.0%) |
| Professional & Scientific | 0 (0.0%) | 0 (0.0%) |
| Enterprise Management | 0 (0.0%) | 0 (0.0%) |
| Administrative & Support | 4 (11.4%) | 31 (88.6%) |
| Educational Services | 11 (45.8%) | 13 (54.2%) |
| Health Care & Social Assistance | 9 (18.0%) | 41 (82.0%) |
| Arts, Entertainment & Recreation | 0 (0.0%) | 0 (0.0%) |
| Accommodation & Food Services | 6 (42.9%) | 8 (57.1%) |
| Public Administration | 14 (100.0%) | 0 (0.0%) |
| Total | 110 (43.1%) | 145 (56.9%) |
Education in Loon Lake
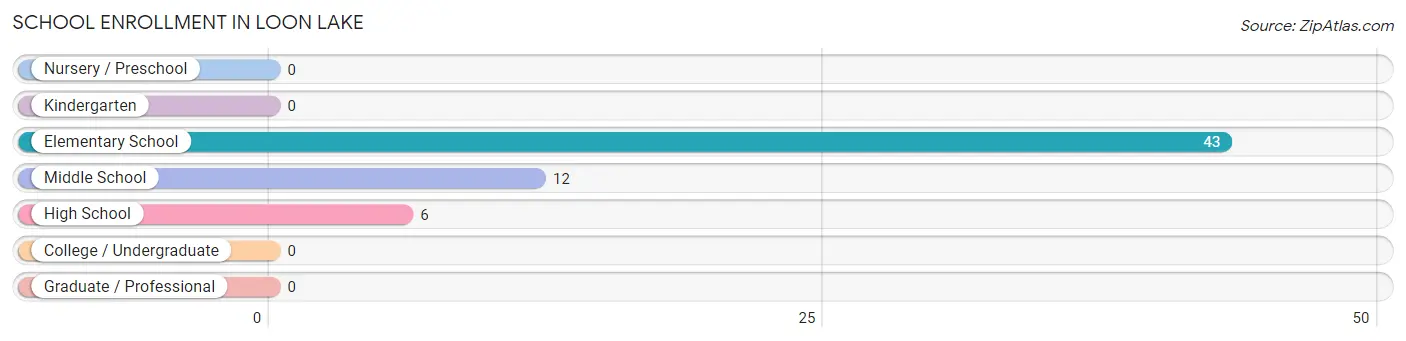
School Enrollment in Loon Lake
The most common levels of schooling among the 61 students in Loon Lake are elementary school (43 | 70.5%), middle school (12 | 19.7%), and high school (6 | 9.8%).
| School Level | # Students | % Students |
| Nursery / Preschool | 0 | 0.0% |
| Kindergarten | 0 | 0.0% |
| Elementary School | 43 | 70.5% |
| Middle School | 12 | 19.7% |
| High School | 6 | 9.8% |
| College / Undergraduate | 0 | 0.0% |
| Graduate / Professional | 0 | 0.0% |
| Total | 61 | 100.0% |
School Enrollment by Age by Funding Source in Loon Lake
Out of a total of 61 students who are enrolled in schools in Loon Lake, 25 (41.0%) attend a private institution, while the remaining 36 (59.0%) are enrolled in public schools. The age group of 5 to 9 year old has the highest likelihood of being enrolled in private schools, with 25 (58.1% in the age bracket) enrolled. Conversely, the age group of 10 to 14 year olds has the lowest likelihood of being enrolled in a private school, with 12 (100.0% in the age bracket) attending a public institution.
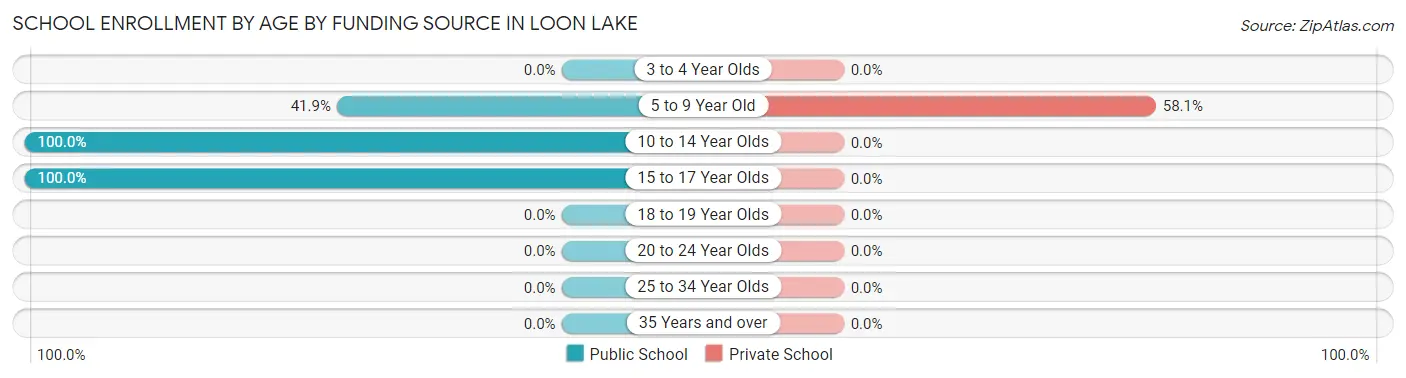
| Age Bracket | Public School | Private School |
| 3 to 4 Year Olds | 0 (0.0%) | 0 (0.0%) |
| 5 to 9 Year Old | 18 (41.9%) | 25 (58.1%) |
| 10 to 14 Year Olds | 12 (100.0%) | 0 (0.0%) |
| 15 to 17 Year Olds | 6 (100.0%) | 0 (0.0%) |
| 18 to 19 Year Olds | 0 (0.0%) | 0 (0.0%) |
| 20 to 24 Year Olds | 0 (0.0%) | 0 (0.0%) |
| 25 to 34 Year Olds | 0 (0.0%) | 0 (0.0%) |
| 35 Years and over | 0 (0.0%) | 0 (0.0%) |
| Total | 36 (59.0%) | 25 (41.0%) |
Educational Attainment by Field of Study in Loon Lake
Education (55 | 28.2%), social sciences (32 | 16.4%), psychology (31 | 15.9%), business (30 | 15.4%), and engineering (10 | 5.1%) are the most common fields of study among 195 individuals in Loon Lake who have obtained a bachelor's degree or higher.
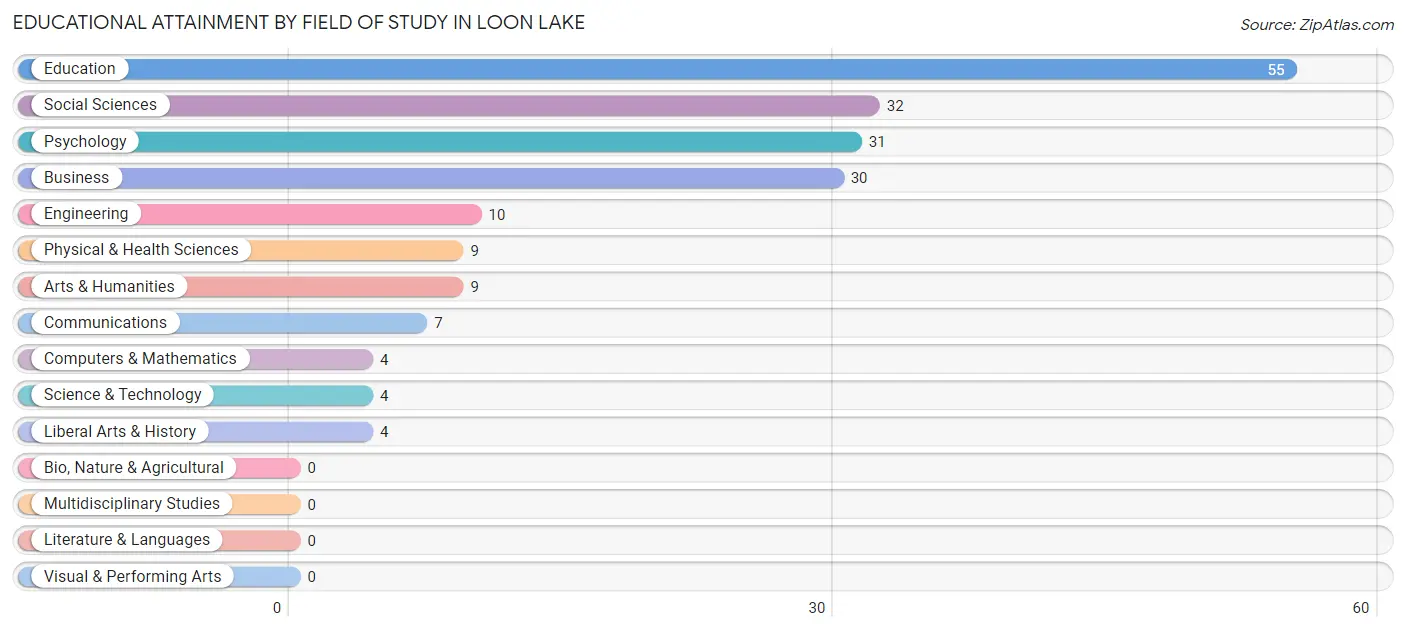
| Field of Study | # Graduates | % Graduates |
| Computers & Mathematics | 4 | 2.1% |
| Bio, Nature & Agricultural | 0 | 0.0% |
| Physical & Health Sciences | 9 | 4.6% |
| Psychology | 31 | 15.9% |
| Social Sciences | 32 | 16.4% |
| Engineering | 10 | 5.1% |
| Multidisciplinary Studies | 0 | 0.0% |
| Science & Technology | 4 | 2.1% |
| Business | 30 | 15.4% |
| Education | 55 | 28.2% |
| Literature & Languages | 0 | 0.0% |
| Liberal Arts & History | 4 | 2.1% |
| Visual & Performing Arts | 0 | 0.0% |
| Communications | 7 | 3.6% |
| Arts & Humanities | 9 | 4.6% |
| Total | 195 | 100.0% |
Transportation & Commute in Loon Lake
Vehicle Availability by Sex in Loon Lake
The most prevalent vehicle ownership categories in Loon Lake are males with 2 vehicles (58, accounting for 52.7%) and females with 2 vehicles (62, making up 41.4%).
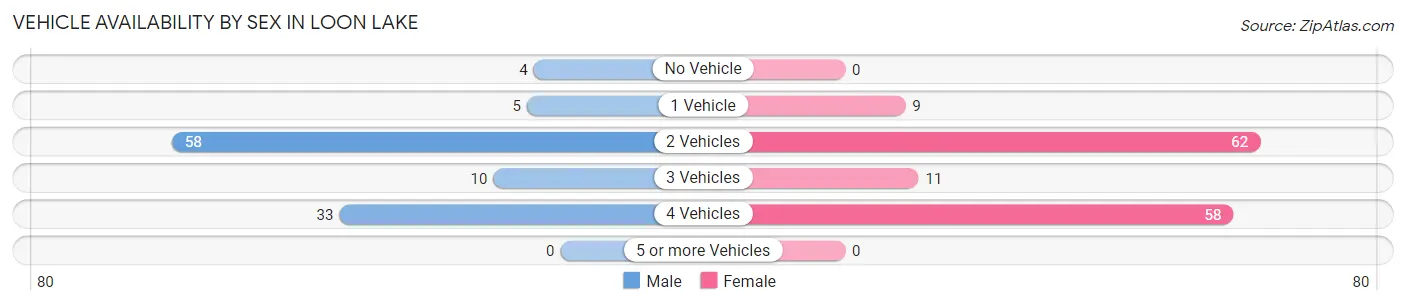
| Vehicles Available | Male | Female |
| No Vehicle | 4 (3.6%) | 0 (0.0%) |
| 1 Vehicle | 5 (4.5%) | 9 (6.4%) |
| 2 Vehicles | 58 (52.7%) | 62 (44.3%) |
| 3 Vehicles | 10 (9.1%) | 11 (7.9%) |
| 4 Vehicles | 33 (30.0%) | 58 (41.4%) |
| 5 or more Vehicles | 0 (0.0%) | 0 (0.0%) |
| Total | 110 (100.0%) | 140 (100.0%) |
Commute Time in Loon Lake
The most frequently occuring commute durations in Loon Lake are 45 to 59 minutes (62 commuters, 34.3%), 40 to 44 minutes (40 commuters, 22.1%), and 30 to 34 minutes (25 commuters, 13.8%).
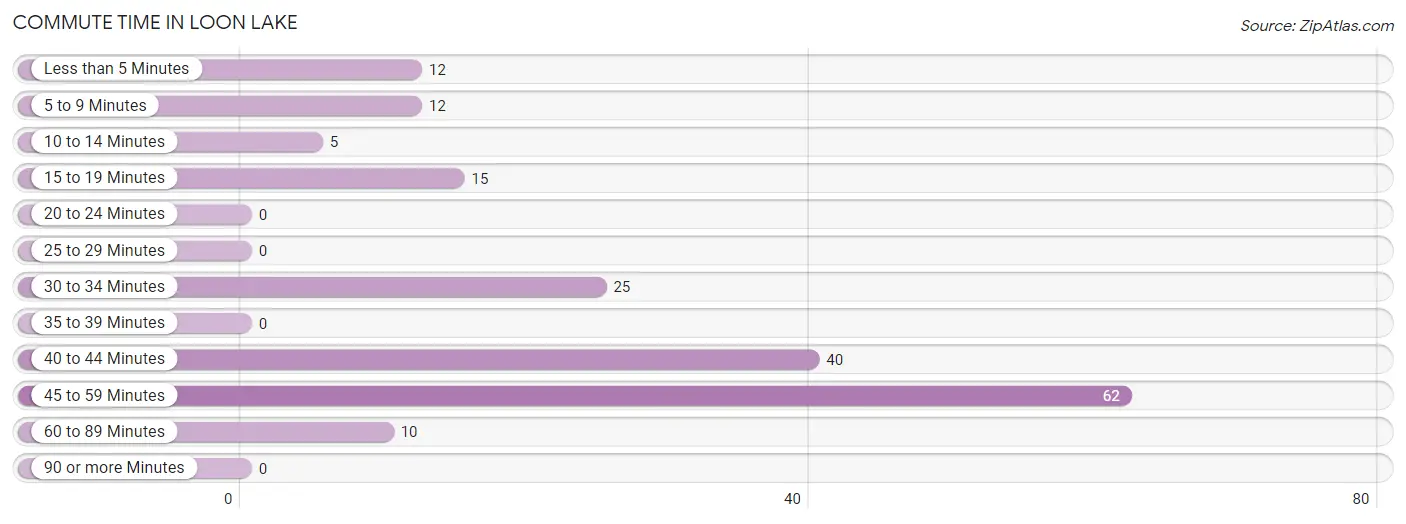
| Commute Time | # Commuters | % Commuters |
| Less than 5 Minutes | 12 | 6.6% |
| 5 to 9 Minutes | 12 | 6.6% |
| 10 to 14 Minutes | 5 | 2.8% |
| 15 to 19 Minutes | 15 | 8.3% |
| 20 to 24 Minutes | 0 | 0.0% |
| 25 to 29 Minutes | 0 | 0.0% |
| 30 to 34 Minutes | 25 | 13.8% |
| 35 to 39 Minutes | 0 | 0.0% |
| 40 to 44 Minutes | 40 | 22.1% |
| 45 to 59 Minutes | 62 | 34.3% |
| 60 to 89 Minutes | 10 | 5.5% |
| 90 or more Minutes | 0 | 0.0% |
Commute Time by Sex in Loon Lake
The most common commute times in Loon Lake are 45 to 59 minutes (62 commuters, 70.5%) for males and 40 to 44 minutes (31 commuters, 33.3%) for females.
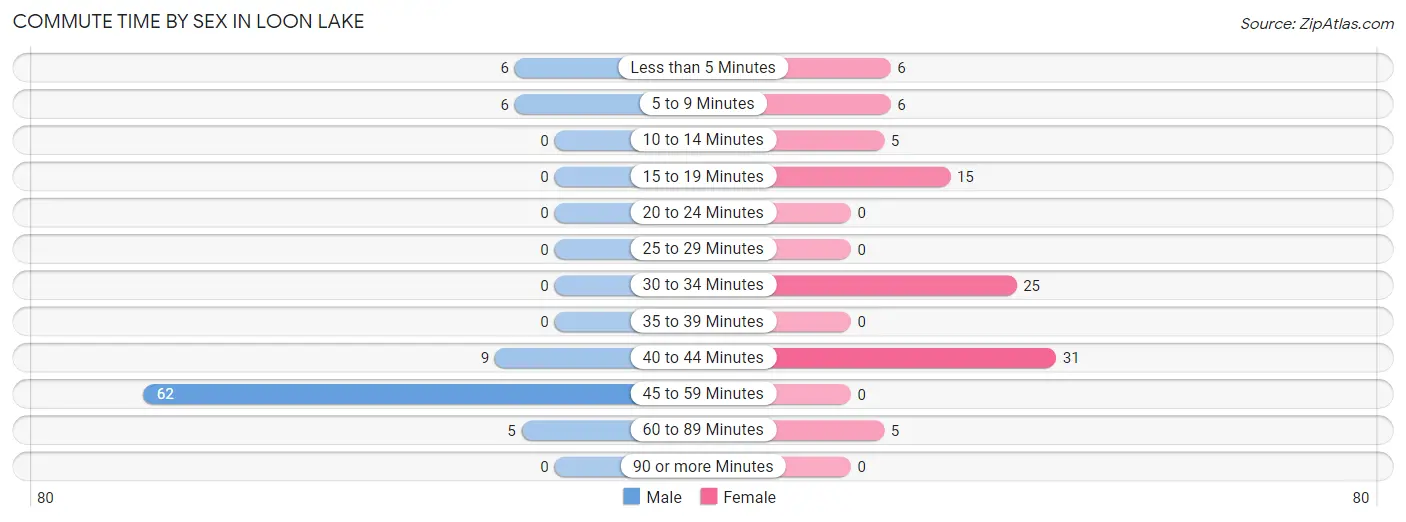
| Commute Time | Male | Female |
| Less than 5 Minutes | 6 (6.8%) | 6 (6.5%) |
| 5 to 9 Minutes | 6 (6.8%) | 6 (6.5%) |
| 10 to 14 Minutes | 0 (0.0%) | 5 (5.4%) |
| 15 to 19 Minutes | 0 (0.0%) | 15 (16.1%) |
| 20 to 24 Minutes | 0 (0.0%) | 0 (0.0%) |
| 25 to 29 Minutes | 0 (0.0%) | 0 (0.0%) |
| 30 to 34 Minutes | 0 (0.0%) | 25 (26.9%) |
| 35 to 39 Minutes | 0 (0.0%) | 0 (0.0%) |
| 40 to 44 Minutes | 9 (10.2%) | 31 (33.3%) |
| 45 to 59 Minutes | 62 (70.5%) | 0 (0.0%) |
| 60 to 89 Minutes | 5 (5.7%) | 5 (5.4%) |
| 90 or more Minutes | 0 (0.0%) | 0 (0.0%) |
Time of Departure to Work by Sex in Loon Lake
The most frequent times of departure to work in Loon Lake are 12:00 AM to 4:59 AM (41, 46.6%) for males and 7:00 AM to 7:29 AM (56, 60.2%) for females.
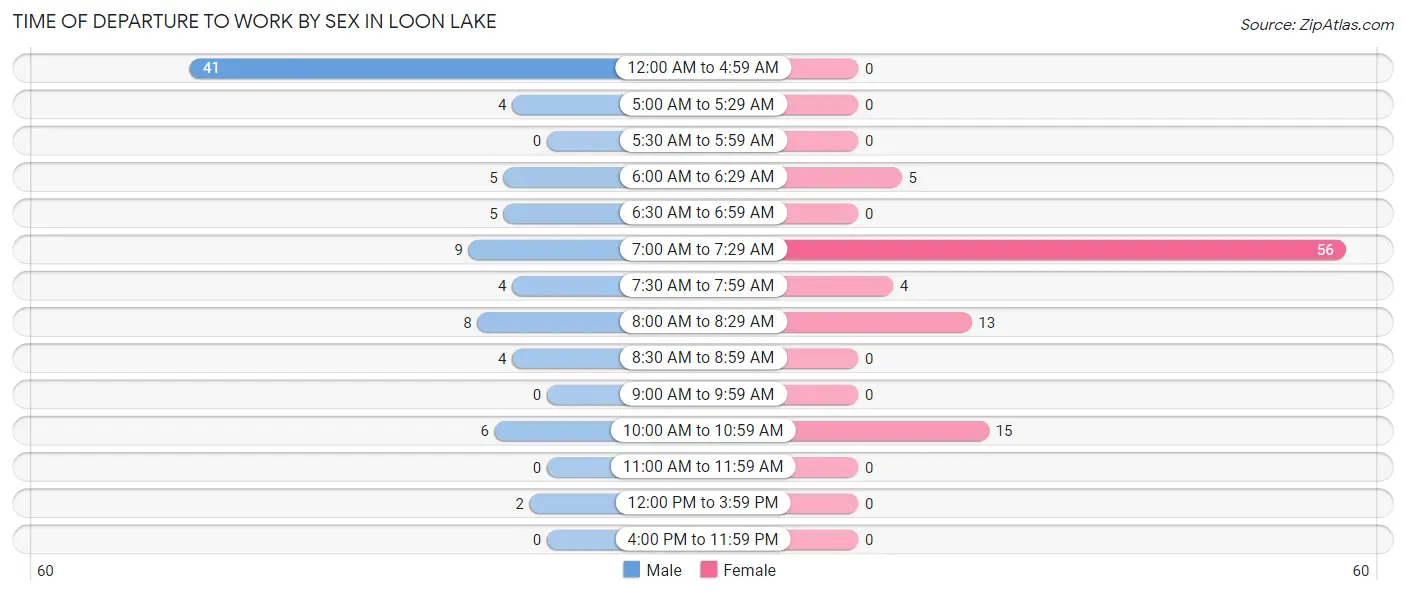
| Time of Departure | Male | Female |
| 12:00 AM to 4:59 AM | 41 (46.6%) | 0 (0.0%) |
| 5:00 AM to 5:29 AM | 4 (4.5%) | 0 (0.0%) |
| 5:30 AM to 5:59 AM | 0 (0.0%) | 0 (0.0%) |
| 6:00 AM to 6:29 AM | 5 (5.7%) | 5 (5.4%) |
| 6:30 AM to 6:59 AM | 5 (5.7%) | 0 (0.0%) |
| 7:00 AM to 7:29 AM | 9 (10.2%) | 56 (60.2%) |
| 7:30 AM to 7:59 AM | 4 (4.5%) | 4 (4.3%) |
| 8:00 AM to 8:29 AM | 8 (9.1%) | 13 (14.0%) |
| 8:30 AM to 8:59 AM | 4 (4.5%) | 0 (0.0%) |
| 9:00 AM to 9:59 AM | 0 (0.0%) | 0 (0.0%) |
| 10:00 AM to 10:59 AM | 6 (6.8%) | 15 (16.1%) |
| 11:00 AM to 11:59 AM | 0 (0.0%) | 0 (0.0%) |
| 12:00 PM to 3:59 PM | 2 (2.3%) | 0 (0.0%) |
| 4:00 PM to 11:59 PM | 0 (0.0%) | 0 (0.0%) |
| Total | 88 (100.0%) | 93 (100.0%) |
Housing Occupancy in Loon Lake
Occupancy by Ownership in Loon Lake
Of the total 335 dwellings in Loon Lake, owner-occupied units account for 320 (95.5%), while renter-occupied units make up 15 (4.5%).
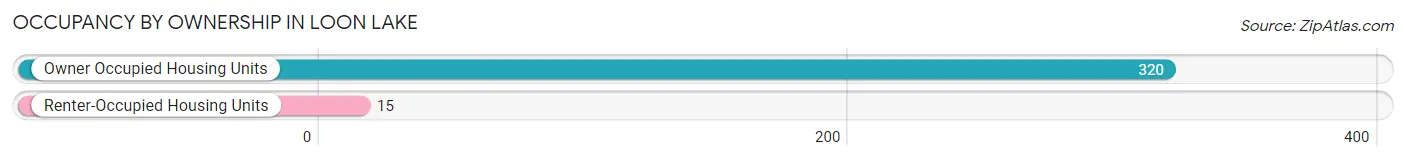
| Occupancy | # Housing Units | % Housing Units |
| Owner Occupied Housing Units | 320 | 95.5% |
| Renter-Occupied Housing Units | 15 | 4.5% |
| Total Occupied Housing Units | 335 | 100.0% |
Occupancy by Household Size in Loon Lake
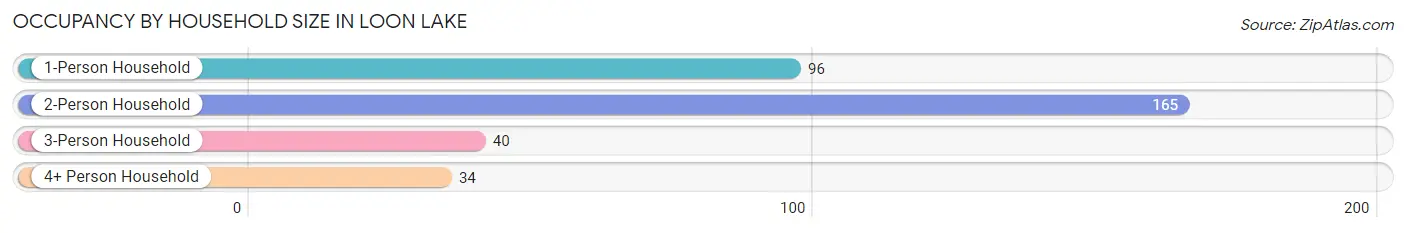
| Household Size | # Housing Units | % Housing Units |
| 1-Person Household | 96 | 28.7% |
| 2-Person Household | 165 | 49.2% |
| 3-Person Household | 40 | 11.9% |
| 4+ Person Household | 34 | 10.2% |
| Total Housing Units | 335 | 100.0% |
Occupancy by Ownership by Household Size in Loon Lake
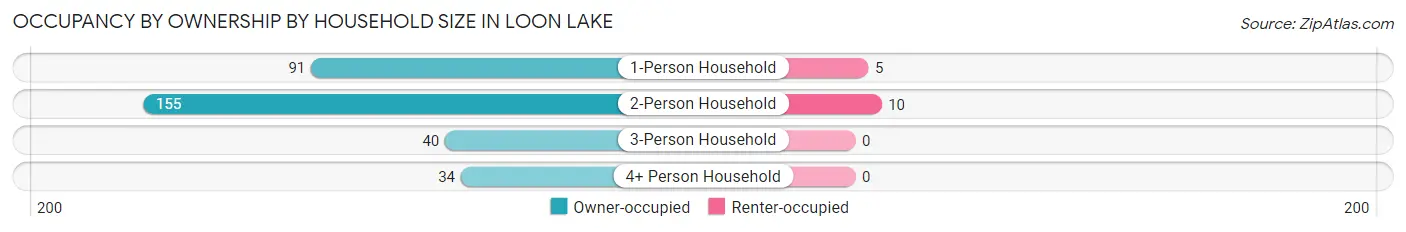
| Household Size | Owner-occupied | Renter-occupied |
| 1-Person Household | 91 (94.8%) | 5 (5.2%) |
| 2-Person Household | 155 (93.9%) | 10 (6.1%) |
| 3-Person Household | 40 (100.0%) | 0 (0.0%) |
| 4+ Person Household | 34 (100.0%) | 0 (0.0%) |
| Total Housing Units | 320 (95.5%) | 15 (4.5%) |
Occupancy by Educational Attainment in Loon Lake
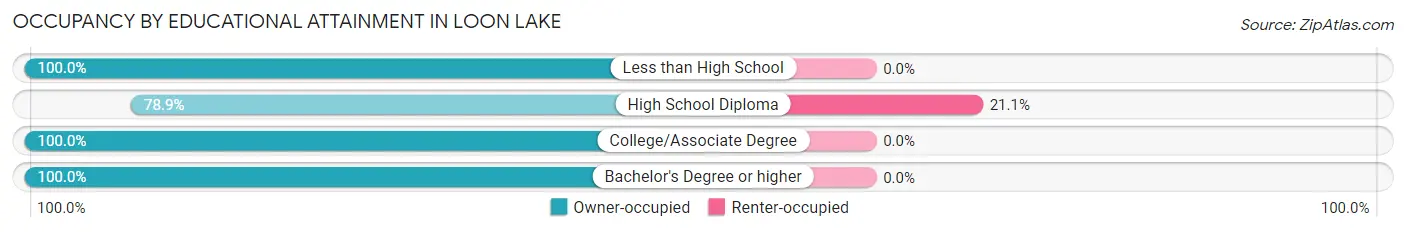
| Household Size | Owner-occupied | Renter-occupied |
| Less than High School | 23 (100.0%) | 0 (0.0%) |
| High School Diploma | 56 (78.9%) | 15 (21.1%) |
| College/Associate Degree | 144 (100.0%) | 0 (0.0%) |
| Bachelor's Degree or higher | 97 (100.0%) | 0 (0.0%) |
Occupancy by Age of Householder in Loon Lake
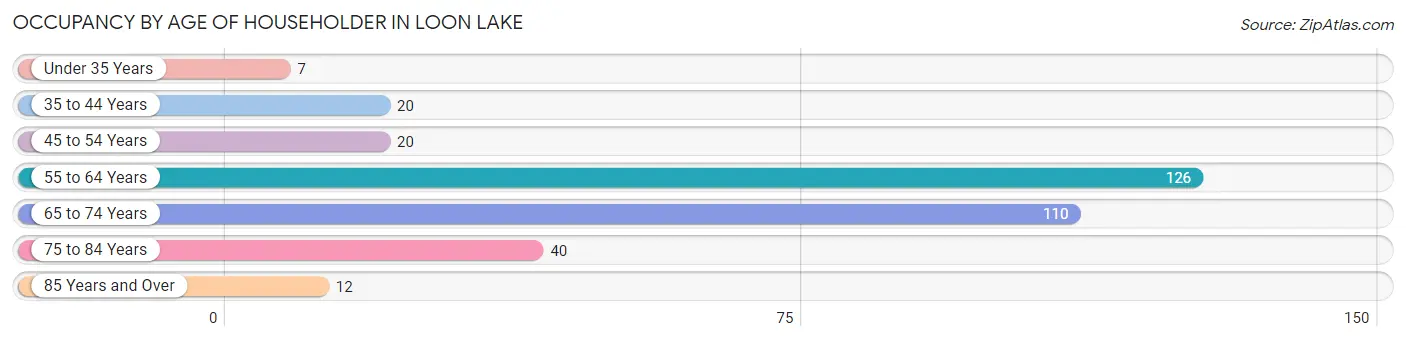
| Age Bracket | # Households | % Households |
| Under 35 Years | 7 | 2.1% |
| 35 to 44 Years | 20 | 6.0% |
| 45 to 54 Years | 20 | 6.0% |
| 55 to 64 Years | 126 | 37.6% |
| 65 to 74 Years | 110 | 32.8% |
| 75 to 84 Years | 40 | 11.9% |
| 85 Years and Over | 12 | 3.6% |
| Total | 335 | 100.0% |
Housing Finances in Loon Lake
Median Income by Occupancy in Loon Lake
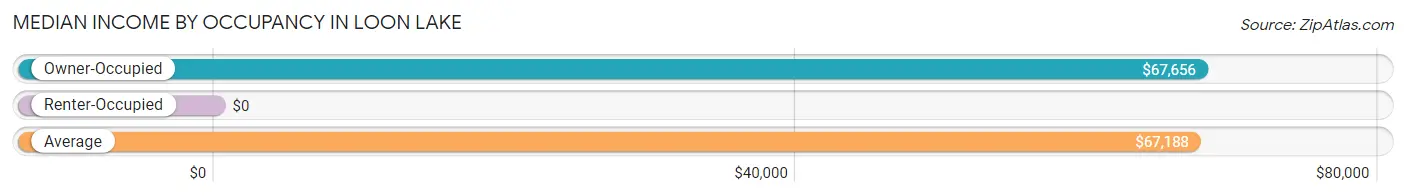
| Occupancy Type | # Households | Median Income |
| Owner-Occupied | 320 (95.5%) | $67,656 |
| Renter-Occupied | 15 (4.5%) | $0 |
| Average | 335 (100.0%) | $67,188 |
Occupancy by Householder Income Bracket in Loon Lake
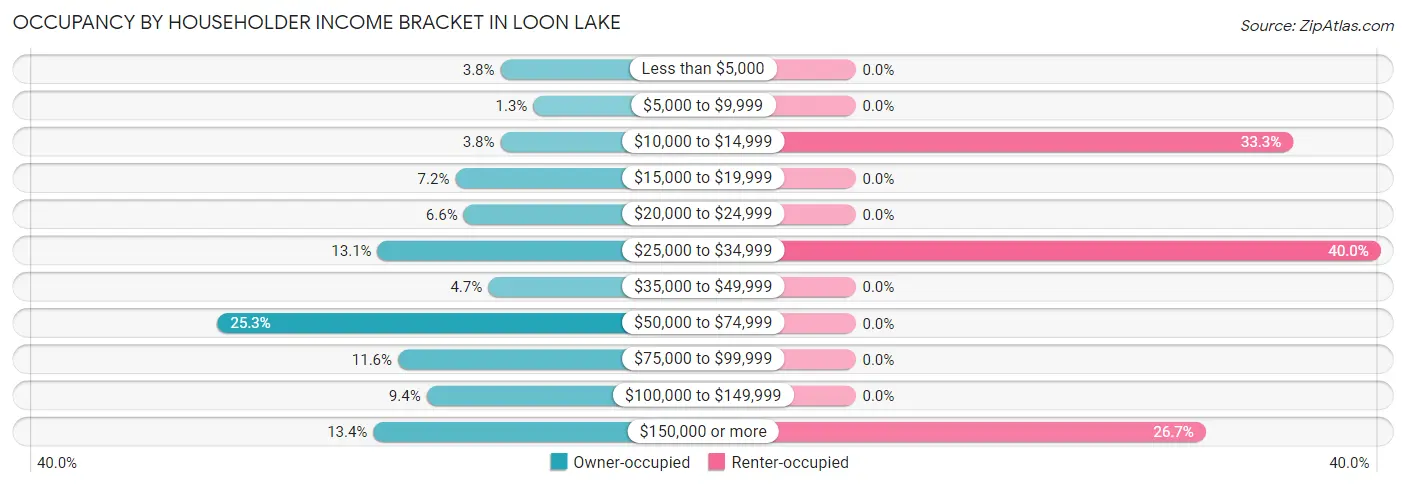
| Income Bracket | Owner-occupied | Renter-occupied |
| Less than $5,000 | 12 (3.7%) | 0 (0.0%) |
| $5,000 to $9,999 | 4 (1.3%) | 0 (0.0%) |
| $10,000 to $14,999 | 12 (3.7%) | 5 (33.3%) |
| $15,000 to $19,999 | 23 (7.2%) | 0 (0.0%) |
| $20,000 to $24,999 | 21 (6.6%) | 0 (0.0%) |
| $25,000 to $34,999 | 42 (13.1%) | 6 (40.0%) |
| $35,000 to $49,999 | 15 (4.7%) | 0 (0.0%) |
| $50,000 to $74,999 | 81 (25.3%) | 0 (0.0%) |
| $75,000 to $99,999 | 37 (11.6%) | 0 (0.0%) |
| $100,000 to $149,999 | 30 (9.4%) | 0 (0.0%) |
| $150,000 or more | 43 (13.4%) | 4 (26.7%) |
| Total | 320 (100.0%) | 15 (100.0%) |
Monthly Housing Cost Tiers in Loon Lake
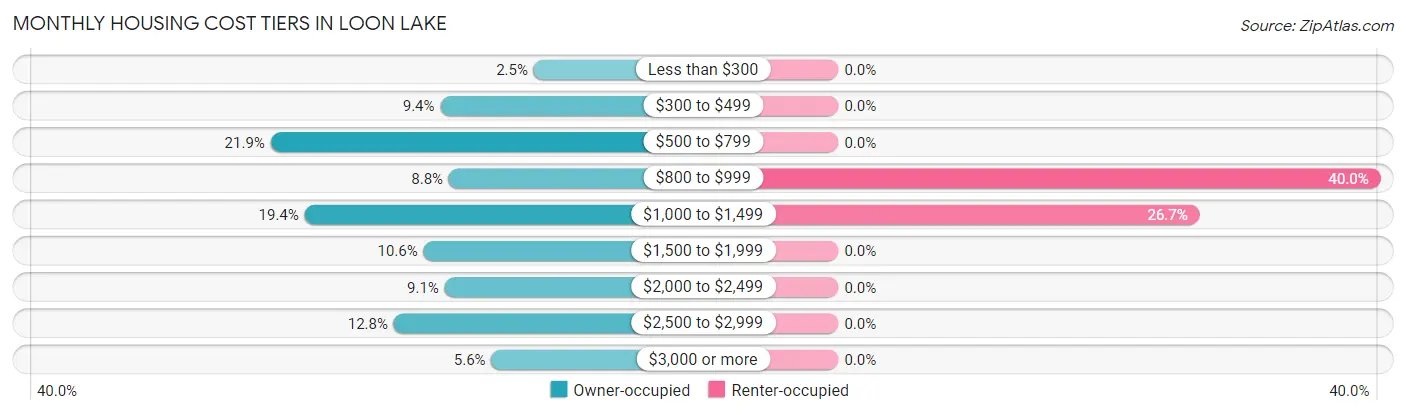
| Monthly Cost | Owner-occupied | Renter-occupied |
| Less than $300 | 8 (2.5%) | 0 (0.0%) |
| $300 to $499 | 30 (9.4%) | 0 (0.0%) |
| $500 to $799 | 70 (21.9%) | 0 (0.0%) |
| $800 to $999 | 28 (8.7%) | 6 (40.0%) |
| $1,000 to $1,499 | 62 (19.4%) | 4 (26.7%) |
| $1,500 to $1,999 | 34 (10.6%) | 0 (0.0%) |
| $2,000 to $2,499 | 29 (9.1%) | 0 (0.0%) |
| $2,500 to $2,999 | 41 (12.8%) | 0 (0.0%) |
| $3,000 or more | 18 (5.6%) | 0 (0.0%) |
| Total | 320 (100.0%) | 15 (100.0%) |
Physical Housing Characteristics in Loon Lake
Housing Structures in Loon Lake
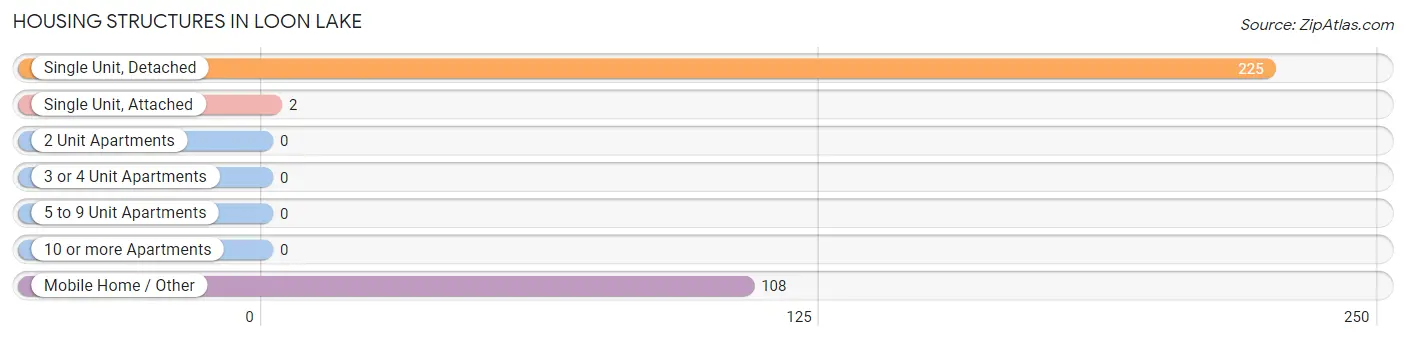
| Structure Type | # Housing Units | % Housing Units |
| Single Unit, Detached | 225 | 67.2% |
| Single Unit, Attached | 2 | 0.6% |
| 2 Unit Apartments | 0 | 0.0% |
| 3 or 4 Unit Apartments | 0 | 0.0% |
| 5 to 9 Unit Apartments | 0 | 0.0% |
| 10 or more Apartments | 0 | 0.0% |
| Mobile Home / Other | 108 | 32.2% |
| Total | 335 | 100.0% |
Housing Structures by Occupancy in Loon Lake
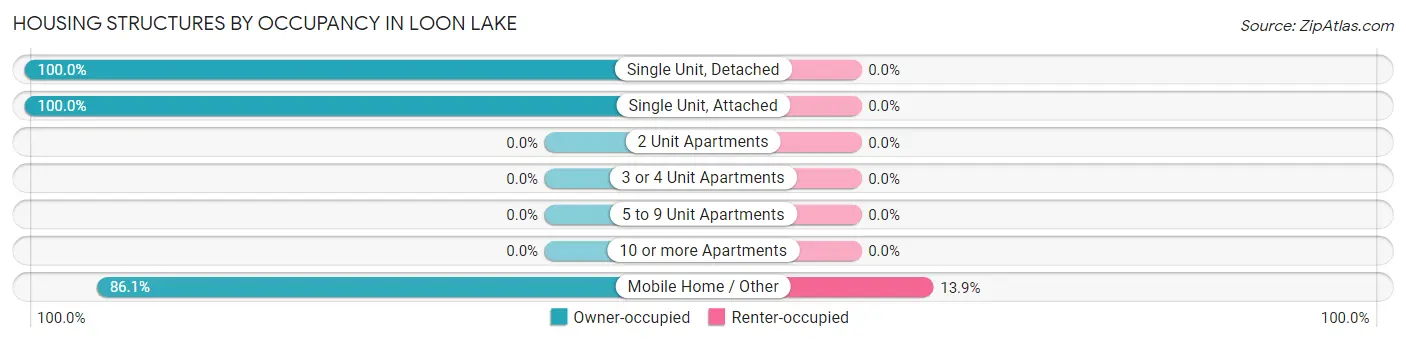
| Structure Type | Owner-occupied | Renter-occupied |
| Single Unit, Detached | 225 (100.0%) | 0 (0.0%) |
| Single Unit, Attached | 2 (100.0%) | 0 (0.0%) |
| 2 Unit Apartments | 0 (0.0%) | 0 (0.0%) |
| 3 or 4 Unit Apartments | 0 (0.0%) | 0 (0.0%) |
| 5 to 9 Unit Apartments | 0 (0.0%) | 0 (0.0%) |
| 10 or more Apartments | 0 (0.0%) | 0 (0.0%) |
| Mobile Home / Other | 93 (86.1%) | 15 (13.9%) |
| Total | 320 (95.5%) | 15 (4.5%) |
Housing Structures by Number of Rooms in Loon Lake
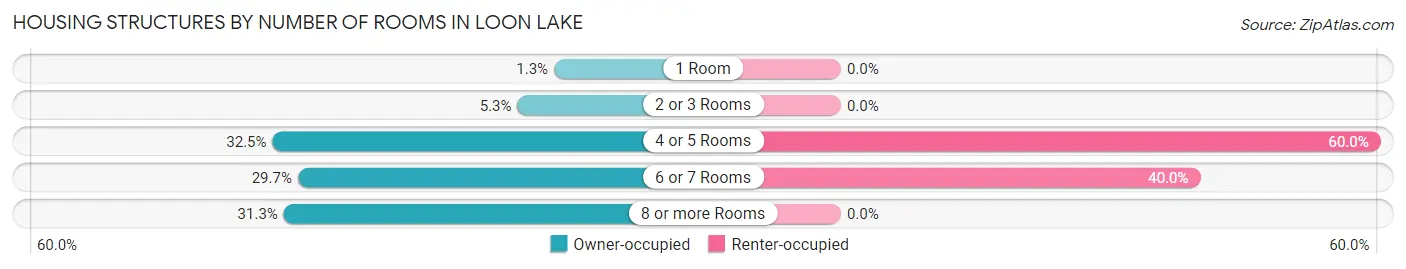
| Number of Rooms | Owner-occupied | Renter-occupied |
| 1 Room | 4 (1.3%) | 0 (0.0%) |
| 2 or 3 Rooms | 17 (5.3%) | 0 (0.0%) |
| 4 or 5 Rooms | 104 (32.5%) | 9 (60.0%) |
| 6 or 7 Rooms | 95 (29.7%) | 6 (40.0%) |
| 8 or more Rooms | 100 (31.2%) | 0 (0.0%) |
| Total | 320 (100.0%) | 15 (100.0%) |
Housing Structure by Heating Type in Loon Lake
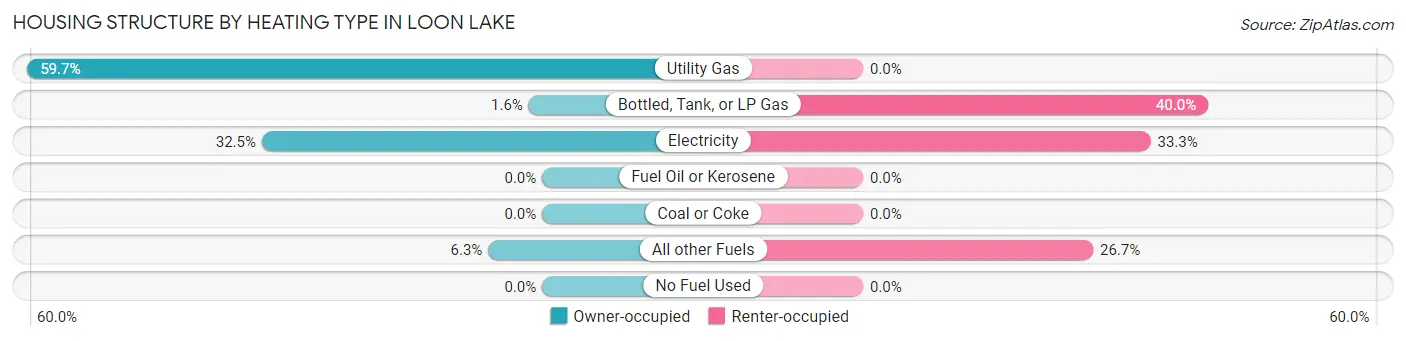
| Heating Type | Owner-occupied | Renter-occupied |
| Utility Gas | 191 (59.7%) | 0 (0.0%) |
| Bottled, Tank, or LP Gas | 5 (1.6%) | 6 (40.0%) |
| Electricity | 104 (32.5%) | 5 (33.3%) |
| Fuel Oil or Kerosene | 0 (0.0%) | 0 (0.0%) |
| Coal or Coke | 0 (0.0%) | 0 (0.0%) |
| All other Fuels | 20 (6.2%) | 4 (26.7%) |
| No Fuel Used | 0 (0.0%) | 0 (0.0%) |
| Total | 320 (100.0%) | 15 (100.0%) |
Household Vehicle Usage in Loon Lake
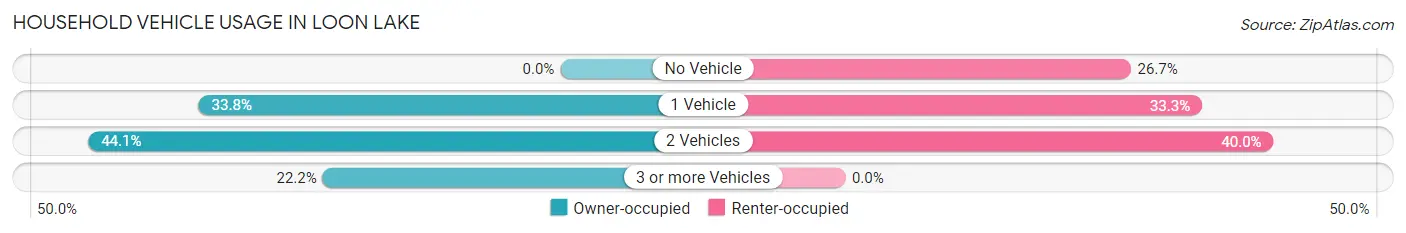
| Vehicles per Household | Owner-occupied | Renter-occupied |
| No Vehicle | 0 (0.0%) | 4 (26.7%) |
| 1 Vehicle | 108 (33.8%) | 5 (33.3%) |
| 2 Vehicles | 141 (44.1%) | 6 (40.0%) |
| 3 or more Vehicles | 71 (22.2%) | 0 (0.0%) |
| Total | 320 (100.0%) | 15 (100.0%) |
Real Estate & Mortgages in Loon Lake
Real Estate and Mortgage Overview in Loon Lake
| Characteristic | Without Mortgage | With Mortgage |
| Housing Units | 129 | 191 |
| Median Property Value | $156,600 | $401,400 |
| Median Household Income | $30,250 | $43 |
| Monthly Housing Costs | $578 | $18 |
| Real Estate Taxes | - | - |
Property Value by Mortgage Status in Loon Lake
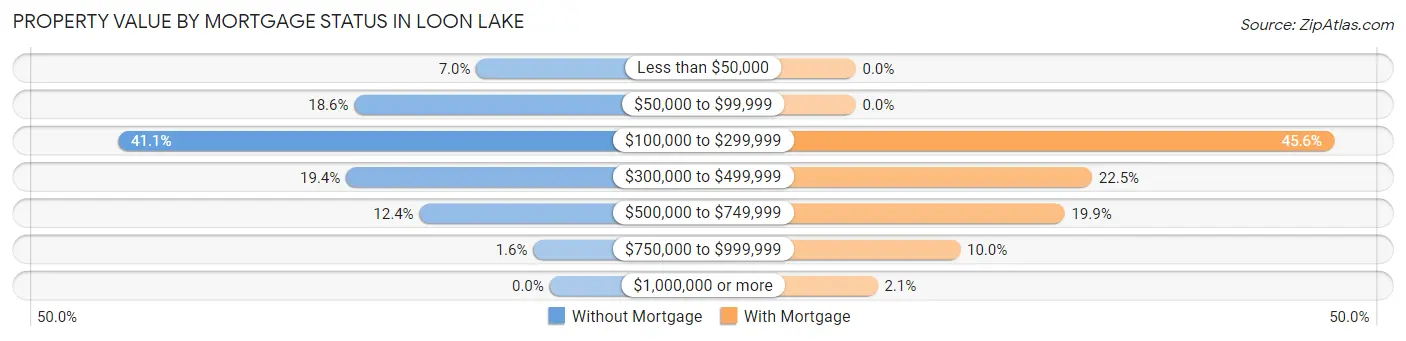
| Property Value | Without Mortgage | With Mortgage |
| Less than $50,000 | 9 (7.0%) | 0 (0.0%) |
| $50,000 to $99,999 | 24 (18.6%) | 0 (0.0%) |
| $100,000 to $299,999 | 53 (41.1%) | 87 (45.6%) |
| $300,000 to $499,999 | 25 (19.4%) | 43 (22.5%) |
| $500,000 to $749,999 | 16 (12.4%) | 38 (19.9%) |
| $750,000 to $999,999 | 2 (1.5%) | 19 (10.0%) |
| $1,000,000 or more | 0 (0.0%) | 4 (2.1%) |
| Total | 129 (100.0%) | 191 (100.0%) |
Household Income by Mortgage Status in Loon Lake
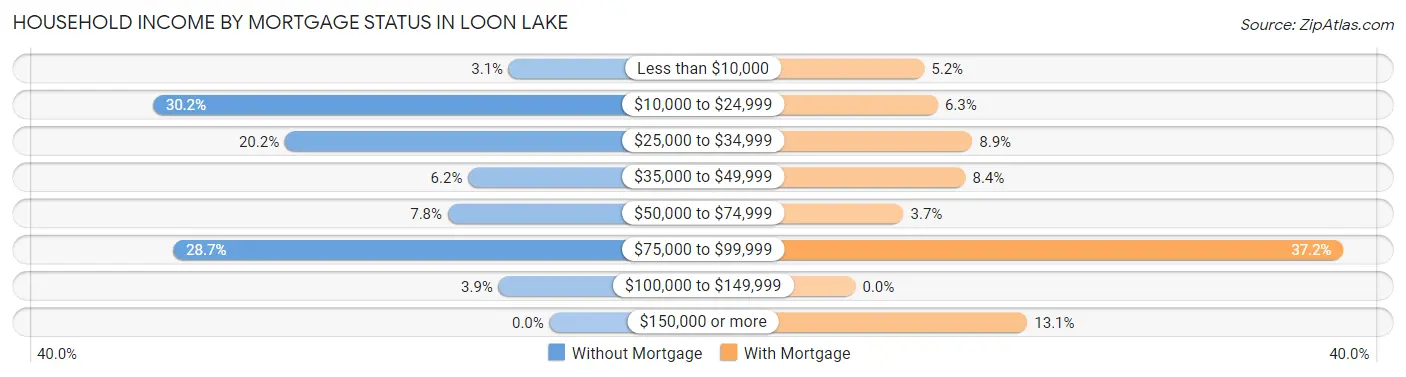
| Household Income | Without Mortgage | With Mortgage |
| Less than $10,000 | 4 (3.1%) | 10 (5.2%) |
| $10,000 to $24,999 | 39 (30.2%) | 12 (6.3%) |
| $25,000 to $34,999 | 26 (20.2%) | 17 (8.9%) |
| $35,000 to $49,999 | 8 (6.2%) | 16 (8.4%) |
| $50,000 to $74,999 | 10 (7.7%) | 7 (3.7%) |
| $75,000 to $99,999 | 37 (28.7%) | 71 (37.2%) |
| $100,000 to $149,999 | 5 (3.9%) | 0 (0.0%) |
| $150,000 or more | 0 (0.0%) | 25 (13.1%) |
| Total | 129 (100.0%) | 191 (100.0%) |
Property Value to Household Income Ratio in Loon Lake
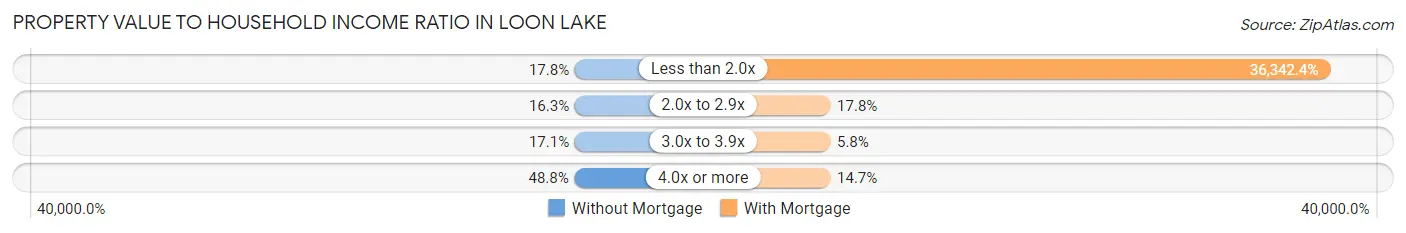
| Value-to-Income Ratio | Without Mortgage | With Mortgage |
| Less than 2.0x | 23 (17.8%) | 69,414 (36,342.4%) |
| 2.0x to 2.9x | 21 (16.3%) | 34 (17.8%) |
| 3.0x to 3.9x | 22 (17.1%) | 11 (5.8%) |
| 4.0x or more | 63 (48.8%) | 28 (14.7%) |
| Total | 129 (100.0%) | 191 (100.0%) |
Real Estate Taxes by Mortgage Status in Loon Lake
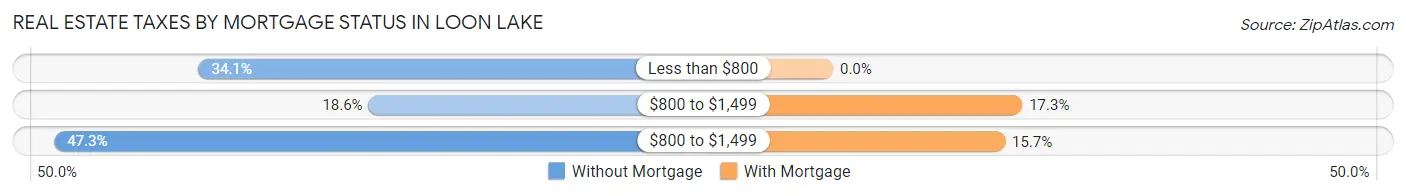
| Property Taxes | Without Mortgage | With Mortgage |
| Less than $800 | 44 (34.1%) | 0 (0.0%) |
| $800 to $1,499 | 24 (18.6%) | 33 (17.3%) |
| $800 to $1,499 | 61 (47.3%) | 30 (15.7%) |
| Total | 129 (100.0%) | 191 (100.0%) |
Health & Disability in Loon Lake
Health Insurance Coverage by Age in Loon Lake
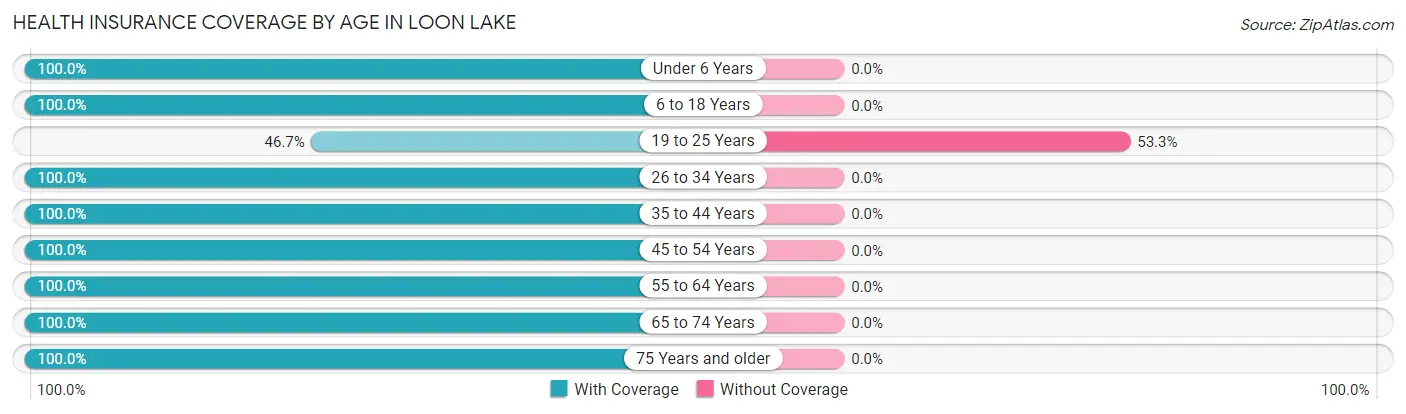
| Age Bracket | With Coverage | Without Coverage |
| Under 6 Years | 4 (100.0%) | 0 (0.0%) |
| 6 to 18 Years | 61 (100.0%) | 0 (0.0%) |
| 19 to 25 Years | 7 (46.7%) | 8 (53.3%) |
| 26 to 34 Years | 14 (100.0%) | 0 (0.0%) |
| 35 to 44 Years | 98 (100.0%) | 0 (0.0%) |
| 45 to 54 Years | 49 (100.0%) | 0 (0.0%) |
| 55 to 64 Years | 194 (100.0%) | 0 (0.0%) |
| 65 to 74 Years | 202 (100.0%) | 0 (0.0%) |
| 75 Years and older | 65 (100.0%) | 0 (0.0%) |
| Total | 694 (98.9%) | 8 (1.1%) |
Health Insurance Coverage by Citizenship Status in Loon Lake
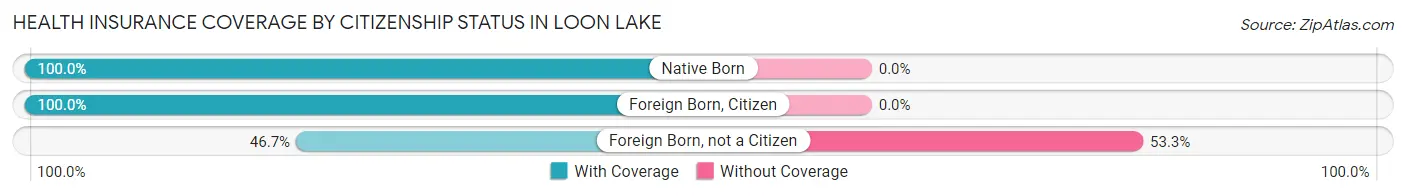
| Citizenship Status | With Coverage | Without Coverage |
| Native Born | 4 (100.0%) | 0 (0.0%) |
| Foreign Born, Citizen | 61 (100.0%) | 0 (0.0%) |
| Foreign Born, not a Citizen | 7 (46.7%) | 8 (53.3%) |
Health Insurance Coverage by Household Income in Loon Lake
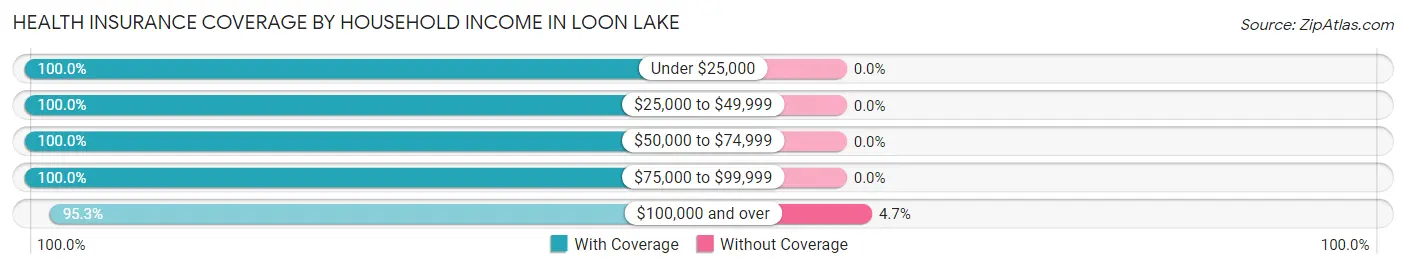
| Household Income | With Coverage | Without Coverage |
| Under $25,000 | 119 (100.0%) | 0 (0.0%) |
| $25,000 to $49,999 | 106 (100.0%) | 0 (0.0%) |
| $50,000 to $74,999 | 229 (100.0%) | 0 (0.0%) |
| $75,000 to $99,999 | 78 (100.0%) | 0 (0.0%) |
| $100,000 and over | 162 (95.3%) | 8 (4.7%) |
Public vs Private Health Insurance Coverage by Age in Loon Lake
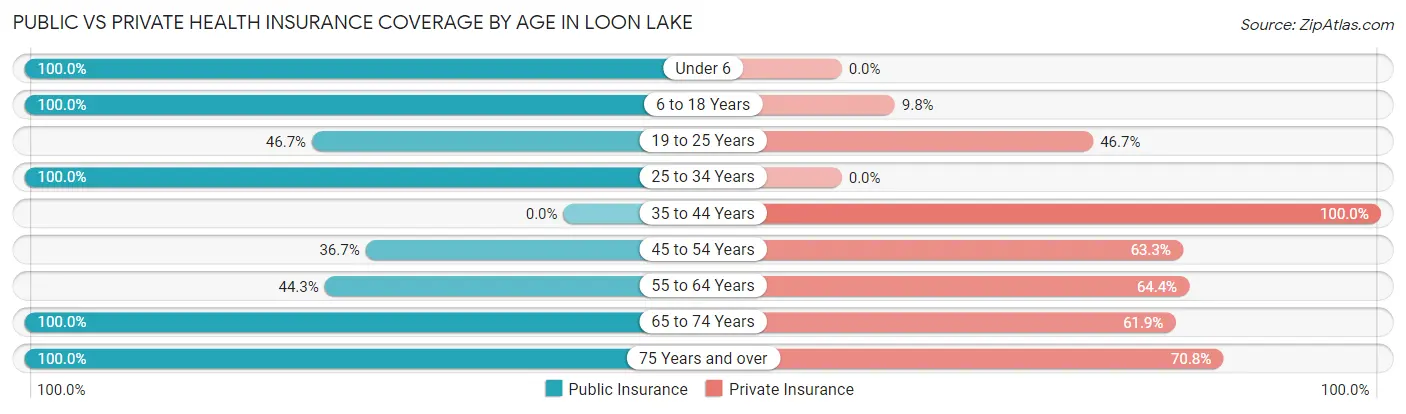
| Age Bracket | Public Insurance | Private Insurance |
| Under 6 | 4 (100.0%) | 0 (0.0%) |
| 6 to 18 Years | 61 (100.0%) | 6 (9.8%) |
| 19 to 25 Years | 7 (46.7%) | 7 (46.7%) |
| 25 to 34 Years | 14 (100.0%) | 0 (0.0%) |
| 35 to 44 Years | 0 (0.0%) | 98 (100.0%) |
| 45 to 54 Years | 18 (36.7%) | 31 (63.3%) |
| 55 to 64 Years | 86 (44.3%) | 125 (64.4%) |
| 65 to 74 Years | 202 (100.0%) | 125 (61.9%) |
| 75 Years and over | 65 (100.0%) | 46 (70.8%) |
| Total | 457 (65.1%) | 438 (62.4%) |
Disability Status by Sex by Age in Loon Lake
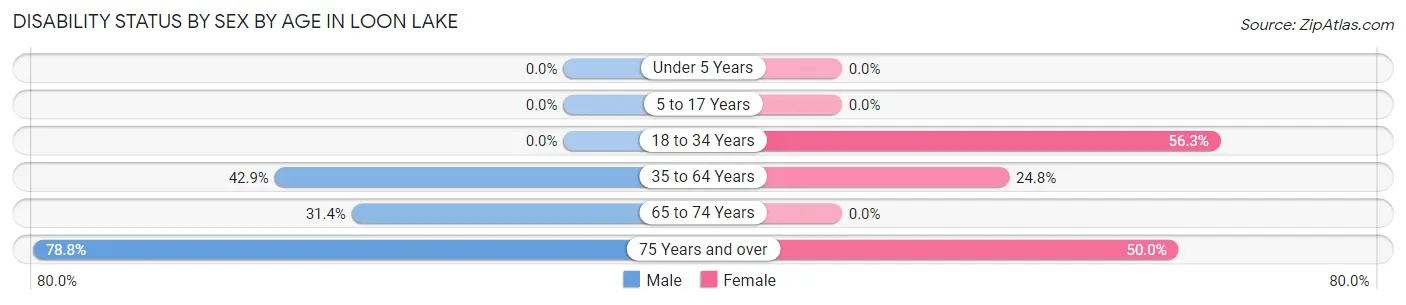
| Age Bracket | Male | Female |
| Under 5 Years | 0 (0.0%) | 0 (0.0%) |
| 5 to 17 Years | 0 (0.0%) | 0 (0.0%) |
| 18 to 34 Years | 0 (0.0%) | 9 (56.2%) |
| 35 to 64 Years | 84 (42.9%) | 36 (24.8%) |
| 65 to 74 Years | 22 (31.4%) | 0 (0.0%) |
| 75 Years and over | 26 (78.8%) | 16 (50.0%) |
Disability Class by Sex by Age in Loon Lake
Disability Class: Hearing Difficulty
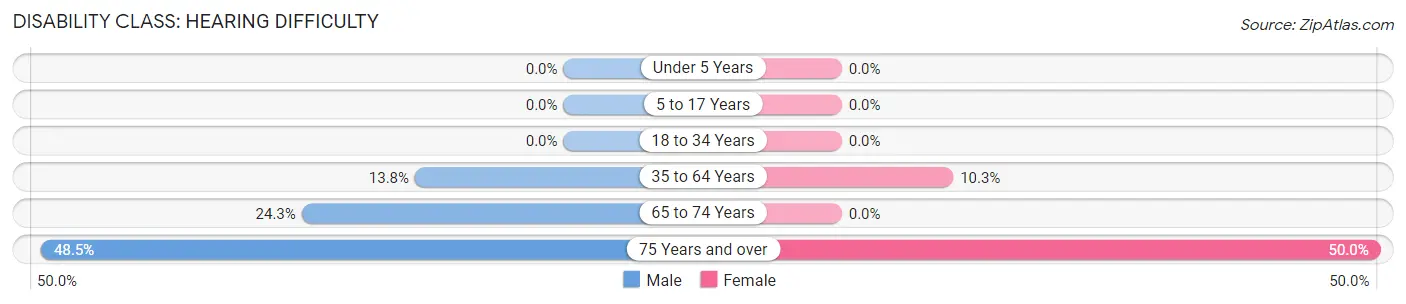
| Age Bracket | Male | Female |
| Under 5 Years | 0 (0.0%) | 0 (0.0%) |
| 5 to 17 Years | 0 (0.0%) | 0 (0.0%) |
| 18 to 34 Years | 0 (0.0%) | 0 (0.0%) |
| 35 to 64 Years | 27 (13.8%) | 15 (10.3%) |
| 65 to 74 Years | 17 (24.3%) | 0 (0.0%) |
| 75 Years and over | 16 (48.5%) | 16 (50.0%) |
Disability Class: Vision Difficulty
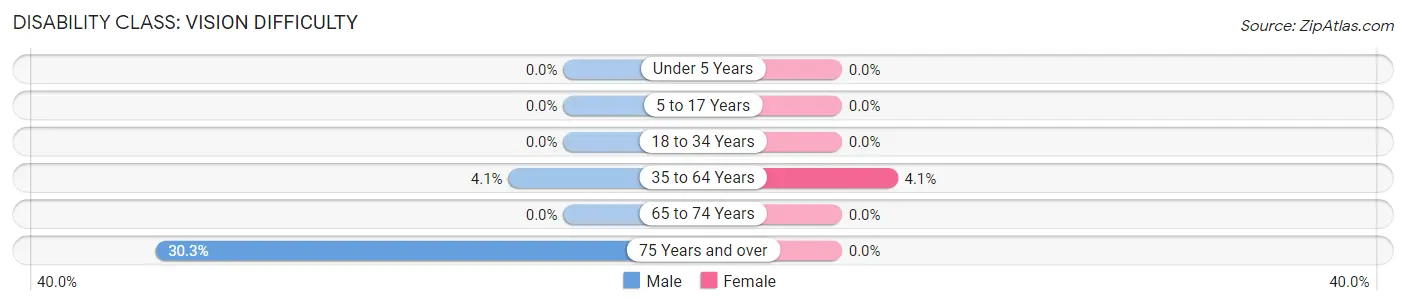
| Age Bracket | Male | Female |
| Under 5 Years | 0 (0.0%) | 0 (0.0%) |
| 5 to 17 Years | 0 (0.0%) | 0 (0.0%) |
| 18 to 34 Years | 0 (0.0%) | 0 (0.0%) |
| 35 to 64 Years | 8 (4.1%) | 6 (4.1%) |
| 65 to 74 Years | 0 (0.0%) | 0 (0.0%) |
| 75 Years and over | 10 (30.3%) | 0 (0.0%) |
Disability Class: Cognitive Difficulty
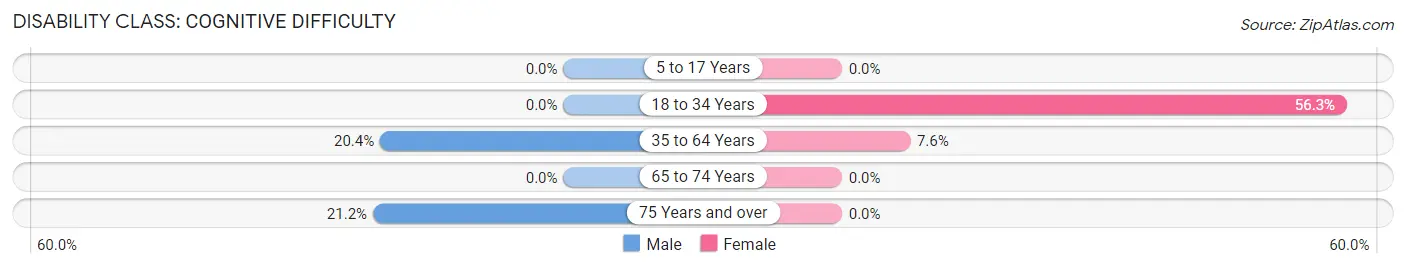
| Age Bracket | Male | Female |
| 5 to 17 Years | 0 (0.0%) | 0 (0.0%) |
| 18 to 34 Years | 0 (0.0%) | 9 (56.2%) |
| 35 to 64 Years | 40 (20.4%) | 11 (7.6%) |
| 65 to 74 Years | 0 (0.0%) | 0 (0.0%) |
| 75 Years and over | 7 (21.2%) | 0 (0.0%) |
Disability Class: Ambulatory Difficulty
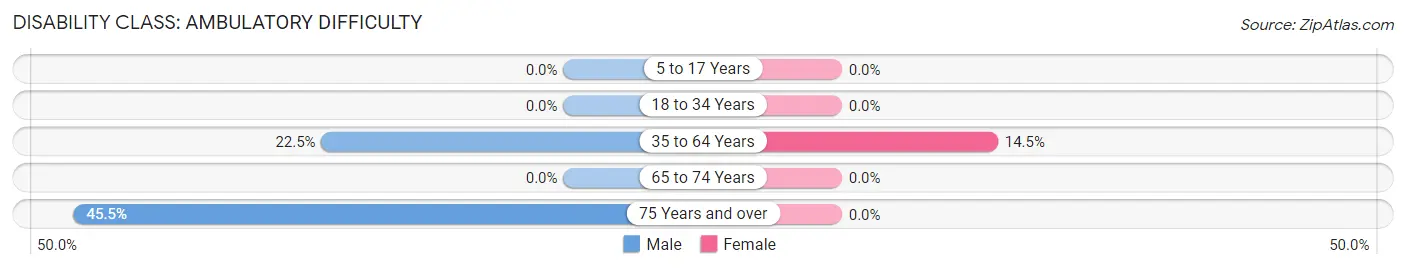
| Age Bracket | Male | Female |
| 5 to 17 Years | 0 (0.0%) | 0 (0.0%) |
| 18 to 34 Years | 0 (0.0%) | 0 (0.0%) |
| 35 to 64 Years | 44 (22.5%) | 21 (14.5%) |
| 65 to 74 Years | 0 (0.0%) | 0 (0.0%) |
| 75 Years and over | 15 (45.5%) | 0 (0.0%) |
Disability Class: Self-Care Difficulty
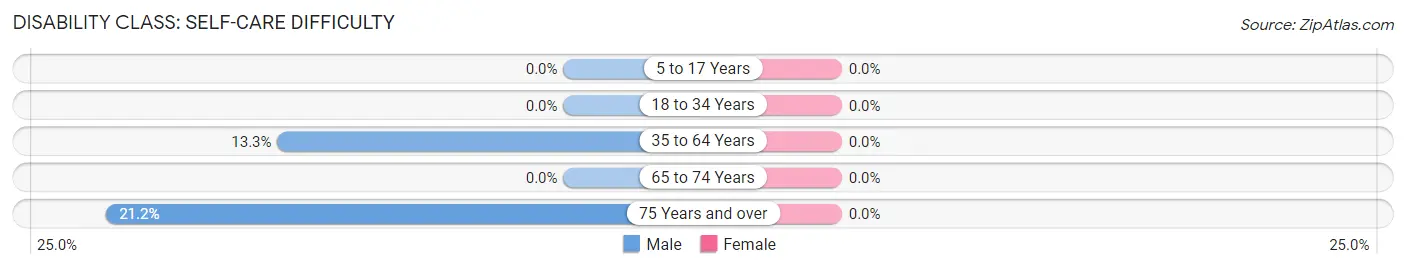
| Age Bracket | Male | Female |
| 5 to 17 Years | 0 (0.0%) | 0 (0.0%) |
| 18 to 34 Years | 0 (0.0%) | 0 (0.0%) |
| 35 to 64 Years | 26 (13.3%) | 0 (0.0%) |
| 65 to 74 Years | 0 (0.0%) | 0 (0.0%) |
| 75 Years and over | 7 (21.2%) | 0 (0.0%) |
Technology Access in Loon Lake
Computing Device Access in Loon Lake
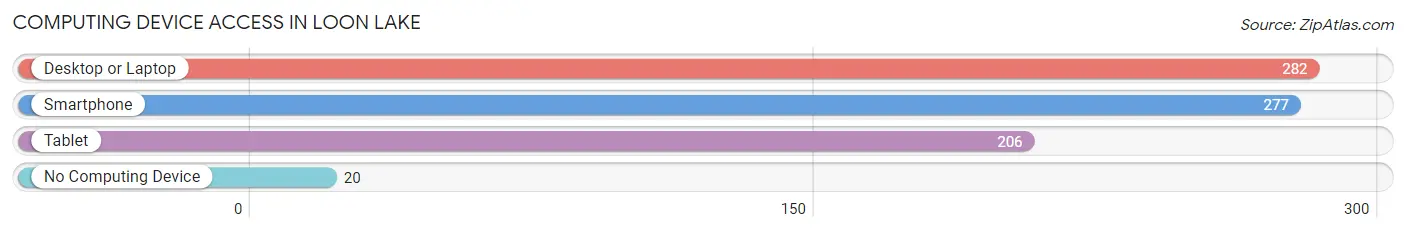
| Device Type | # Households | % Households |
| Desktop or Laptop | 282 | 84.2% |
| Smartphone | 277 | 82.7% |
| Tablet | 206 | 61.5% |
| No Computing Device | 20 | 6.0% |
| Total | 335 | 100.0% |
Internet Access in Loon Lake
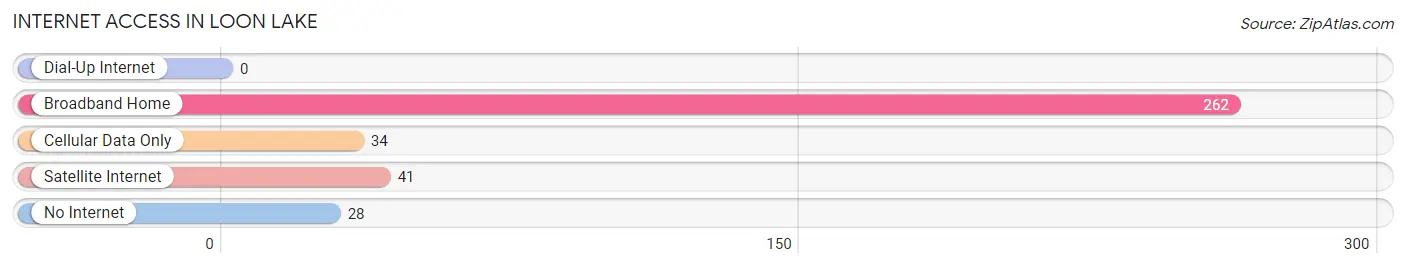
| Internet Type | # Households | % Households |
| Dial-Up Internet | 0 | 0.0% |
| Broadband Home | 262 | 78.2% |
| Cellular Data Only | 34 | 10.2% |
| Satellite Internet | 41 | 12.2% |
| No Internet | 28 | 8.4% |
| Total | 335 | 100.0% |
Loon Lake Summary
Loon Lake is a small town located in Stevens County, Washington, United States. It is situated on the eastern shore of Loon Lake, a natural lake that is part of the Pend Oreille River system. The town is located approximately 20 miles north of Spokane, Washington and is part of the Spokane Metropolitan Statistical Area. The population of Loon Lake was 1,093 at the 2010 census.
History
The area around Loon Lake has been inhabited by Native Americans for thousands of years. The Kalispel Tribe, also known as the Pend d'Oreille, has lived in the area since time immemorial. The first non-Native American settlers arrived in the area in the late 1800s. The town of Loon Lake was officially established in 1891.
The town was named after the lake, which was named by early settlers who were impressed by the large number of loons that inhabited the lake. The town quickly grew and by the early 1900s, it had become a popular tourist destination. The town was home to several resorts, including the Loon Lake Hotel, which was built in 1906.
Geography
Loon Lake is located at 47°51'25" North, 117°25'45" West (47.857, -117.429). The town is situated on the eastern shore of Loon Lake, a natural lake that is part of the Pend Oreille River system. The lake is approximately 4 miles long and 1 mile wide. The town is located approximately 20 miles north of Spokane, Washington and is part of the Spokane Metropolitan Statistical Area.
The town is located in a rural area and is surrounded by forests and rolling hills. The terrain is mostly flat, with some hills and valleys. The climate is generally mild, with warm summers and cold winters.
Economy
The economy of Loon Lake is largely based on tourism. The town is home to several resorts, including the Loon Lake Hotel, which was built in 1906. The town also has several restaurants, bars, and other businesses that cater to tourists.
The town is also home to several small businesses, including a lumber mill, a sawmill, and a woodworking shop. The town is also home to a small airport, which is used for recreational flying.
Demographics
As of the 2010 census, the population of Loon Lake was 1,093. The racial makeup of the town was 95.3% White, 0.7% Native American, 0.3% Asian, 0.2% African American, 0.1% Pacific Islander, and 2.4% from other races. The median household income was $37,917 and the median family income was $45,625.
Conclusion
Loon Lake is a small town located in Stevens County, Washington, United States. It is situated on the eastern shore of Loon Lake, a natural lake that is part of the Pend Oreille River system. The town is located approximately 20 miles north of Spokane, Washington and is part of the Spokane Metropolitan Statistical Area. The population of Loon Lake was 1,093 at the 2010 census. The economy of Loon Lake is largely based on tourism, with several resorts, restaurants, bars, and other businesses catering to tourists. The racial makeup of the town was 95.3% White, 0.7% Native American, 0.3% Asian, 0.2% African American, 0.1% Pacific Islander, and 2.4% from other races. The median household income was $37,917 and the median family income was $45,625.
Common Questions
What is Per Capita Income in Loon Lake?
Per Capita income in Loon Lake is $40,579.
What is the Median Family Income in Loon Lake?
Median Family Income in Loon Lake is $68,867.
What is the Median Household income in Loon Lake?
Median Household Income in Loon Lake is $67,188.
What is Income or Wage Gap in Loon Lake?
Income or Wage Gap in Loon Lake is 2.9%.
Women in Loon Lake earn 97.1 cents for every dollar earned by a man.
What is Inequality or Gini Index in Loon Lake?
Inequality or Gini Index in Loon Lake is 0.52.
What is the Total Population of Loon Lake?
Total Population of Loon Lake is 702.
What is the Total Male Population of Loon Lake?
Total Male Population of Loon Lake is 335.
What is the Total Female Population of Loon Lake?
Total Female Population of Loon Lake is 367.
What is the Ratio of Males per 100 Females in Loon Lake?
There are 91.28 Males per 100 Females in Loon Lake.
What is the Ratio of Females per 100 Males in Loon Lake?
There are 109.55 Females per 100 Males in Loon Lake.
What is the Median Population Age in Loon Lake?
Median Population Age in Loon Lake is 61.6 Years.
What is the Average Family Size in Loon Lake
Average Family Size in Loon Lake is 2.5 People.
What is the Average Household Size in Loon Lake
Average Household Size in Loon Lake is 2.1 People.
How Large is the Labor Force in Loon Lake?
There are 266 People in the Labor Forcein in Loon Lake.
What is the Percentage of People in the Labor Force in Loon Lake?
41.6% of People are in the Labor Force in Loon Lake.
What is the Unemployment Rate in Loon Lake?
Unemployment Rate in Loon Lake is 4.1%.