Cle Elum, WA Map & Demographics
Cle Elum Map
Cle Elum Overview
$37,551
PER CAPITA INCOME
$63,309
AVG FAMILY INCOME
$56,645
AVG HOUSEHOLD INCOME
33.9%
WAGE / INCOME GAP [ % ]
66.1¢/ $1
WAGE / INCOME GAP [ $ ]
0.44
INEQUALITY / GINI INDEX
2,116
TOTAL POPULATION
1,032
MALE POPULATION
1,084
FEMALE POPULATION
95.20
MALES / 100 FEMALES
105.04
FEMALES / 100 MALES
48.6
MEDIAN AGE
2.8
AVG FAMILY SIZE
2.0
AVG HOUSEHOLD SIZE
1,086
LABOR FORCE [ PEOPLE ]
57.8%
PERCENT IN LABOR FORCE
2.2%
UNEMPLOYMENT RATE
Cle Elum Zip Codes
Cle Elum Area Codes
Income in Cle Elum
Income Overview in Cle Elum
Per Capita Income in Cle Elum is $37,551, while median incomes of families and households are $63,309 and $56,645 respectively.
| Characteristic | Number | Measure |
| Per Capita Income | 2,116 | $37,551 |
| Median Family Income | 501 | $63,309 |
| Mean Family Income | 501 | $93,695 |
| Median Household Income | 1,061 | $56,645 |
| Mean Household Income | 1,061 | $75,960 |
| Income Deficit | 501 | $0 |
| Wage / Income Gap (%) | 2,116 | 33.86% |
| Wage / Income Gap ($) | 2,116 | 66.14¢ per $1 |
| Gini / Inequality Index | 2,116 | 0.44 |
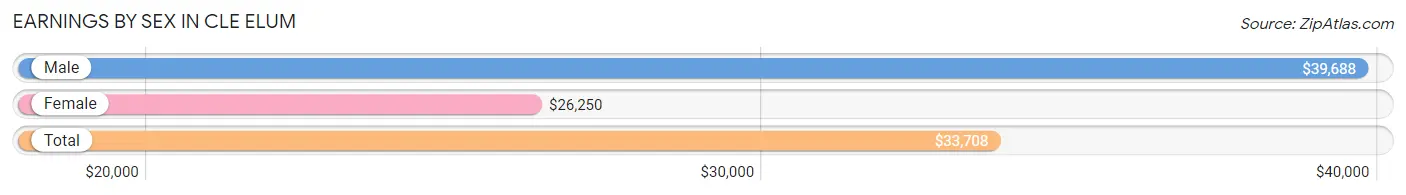
Earnings by Sex in Cle Elum
Average Earnings in Cle Elum are $33,708, $39,688 for men and $26,250 for women, a difference of 33.9%.
| Sex | Number | Average Earnings |
| Male | 639 (54.3%) | $39,688 |
| Female | 538 (45.7%) | $26,250 |
| Total | 1,177 (100.0%) | $33,708 |
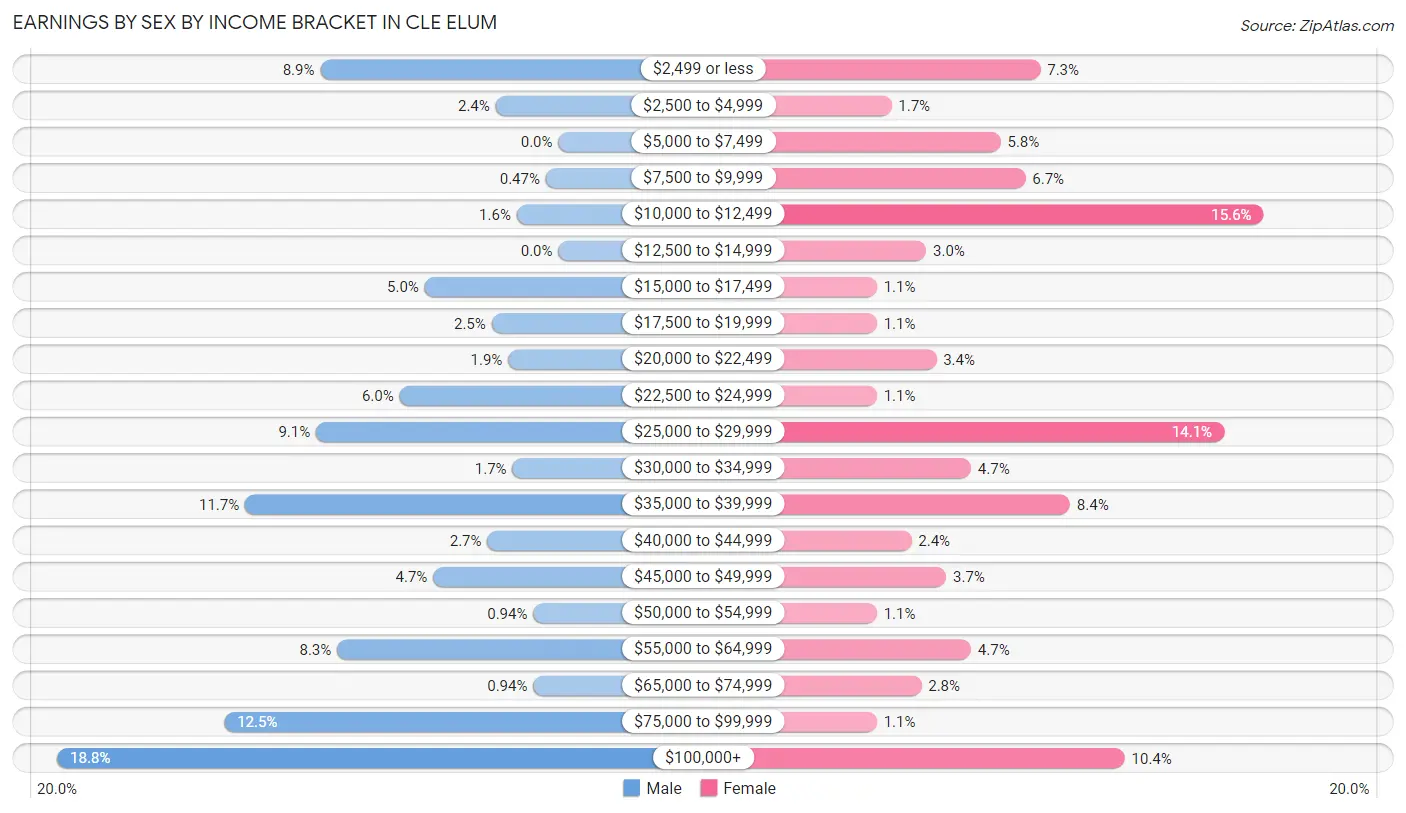
Earnings by Sex by Income Bracket in Cle Elum
The most common earnings brackets in Cle Elum are $100,000+ for men (120 | 18.8%) and $10,000 to $12,499 for women (84 | 15.6%).
| Income | Male | Female |
| $2,499 or less | 57 (8.9%) | 39 (7.2%) |
| $2,500 to $4,999 | 15 (2.4%) | 9 (1.7%) |
| $5,000 to $7,499 | 0 (0.0%) | 31 (5.8%) |
| $7,500 to $9,999 | 3 (0.5%) | 36 (6.7%) |
| $10,000 to $12,499 | 10 (1.6%) | 84 (15.6%) |
| $12,500 to $14,999 | 0 (0.0%) | 16 (3.0%) |
| $15,000 to $17,499 | 32 (5.0%) | 6 (1.1%) |
| $17,500 to $19,999 | 16 (2.5%) | 6 (1.1%) |
| $20,000 to $22,499 | 12 (1.9%) | 18 (3.4%) |
| $22,500 to $24,999 | 38 (5.9%) | 6 (1.1%) |
| $25,000 to $29,999 | 58 (9.1%) | 76 (14.1%) |
| $30,000 to $34,999 | 11 (1.7%) | 25 (4.6%) |
| $35,000 to $39,999 | 75 (11.7%) | 45 (8.4%) |
| $40,000 to $44,999 | 17 (2.7%) | 13 (2.4%) |
| $45,000 to $49,999 | 30 (4.7%) | 20 (3.7%) |
| $50,000 to $54,999 | 6 (0.9%) | 6 (1.1%) |
| $55,000 to $64,999 | 53 (8.3%) | 25 (4.6%) |
| $65,000 to $74,999 | 6 (0.9%) | 15 (2.8%) |
| $75,000 to $99,999 | 80 (12.5%) | 6 (1.1%) |
| $100,000+ | 120 (18.8%) | 56 (10.4%) |
| Total | 639 (100.0%) | 538 (100.0%) |
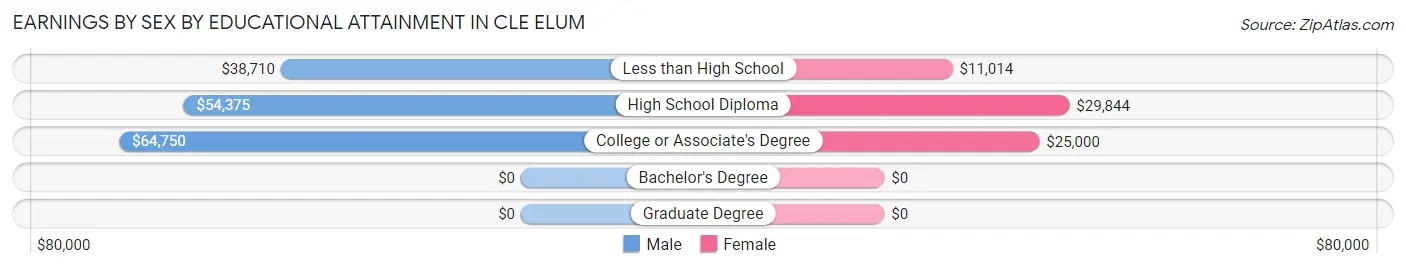
Earnings by Sex by Educational Attainment in Cle Elum
Average earnings in Cle Elum are $49,833 for men and $28,646 for women, a difference of 42.5%. Men with an educational attainment of college or associate's degree enjoy the highest average annual earnings of $64,750, while those with less than high school education earn the least with $38,710. Women with an educational attainment of high school diploma earn the most with the average annual earnings of $29,844, while those with less than high school education have the smallest earnings of $11,014.
| Educational Attainment | Male Income | Female Income |
| Less than High School | $38,710 | $11,014 |
| High School Diploma | $54,375 | $29,844 |
| College or Associate's Degree | $64,750 | $25,000 |
| Bachelor's Degree | - | - |
| Graduate Degree | - | - |
| Total | $49,833 | $28,646 |
Family Income in Cle Elum
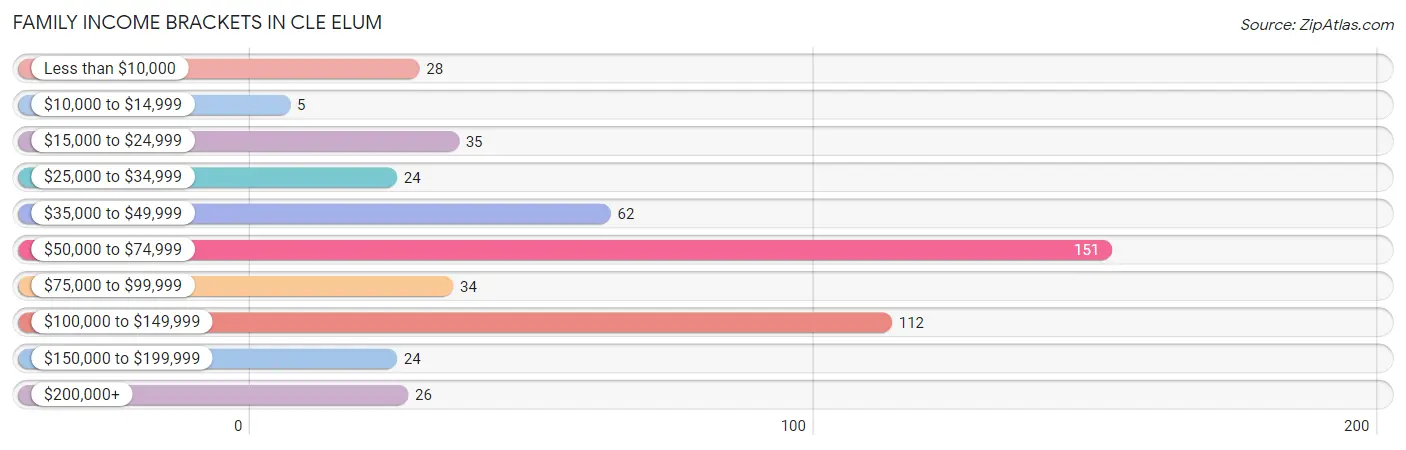
Family Income Brackets in Cle Elum
According to the Cle Elum family income data, there are 151 families falling into the $50,000 to $74,999 income range, which is the most common income bracket and makes up 30.1% of all families. Conversely, the $10,000 to $14,999 income bracket is the least frequent group with only 5 families (1.0%) belonging to this category.
| Income Bracket | # Families | % Families |
| Less than $10,000 | 28 | 5.6% |
| $10,000 to $14,999 | 5 | 1.0% |
| $15,000 to $24,999 | 35 | 7.0% |
| $25,000 to $34,999 | 24 | 4.8% |
| $35,000 to $49,999 | 62 | 12.4% |
| $50,000 to $74,999 | 151 | 30.1% |
| $75,000 to $99,999 | 34 | 6.8% |
| $100,000 to $149,999 | 112 | 22.4% |
| $150,000 to $199,999 | 24 | 4.8% |
| $200,000+ | 26 | 5.2% |
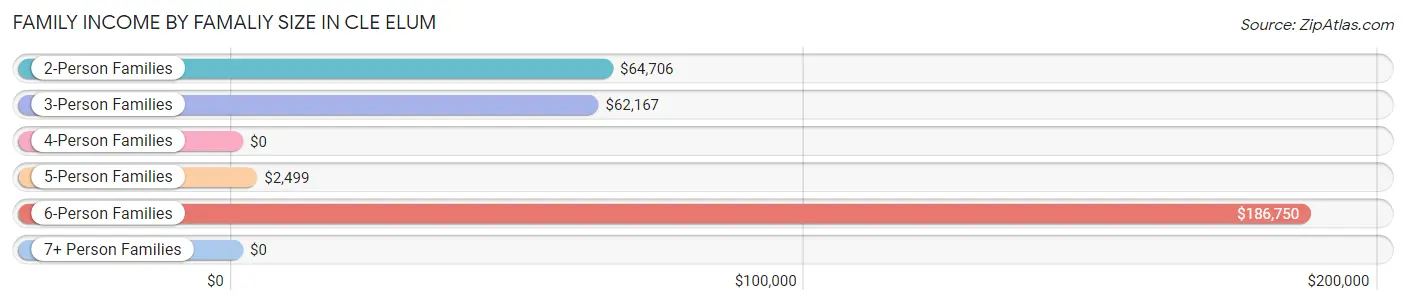
Family Income by Famaliy Size in Cle Elum
6-person families (22 | 4.4%) account for the highest median family income in Cle Elum with $186,750 per family, while 2-person families (322 | 64.3%) have the highest median income of $32,353 per family member.
| Income Bracket | # Families | Median Income |
| 2-Person Families | 322 (64.3%) | $64,706 |
| 3-Person Families | 102 (20.4%) | $62,167 |
| 4-Person Families | 27 (5.4%) | $0 |
| 5-Person Families | 23 (4.6%) | $2,499 |
| 6-Person Families | 22 (4.4%) | $186,750 |
| 7+ Person Families | 5 (1.0%) | $0 |
| Total | 501 (100.0%) | $63,309 |
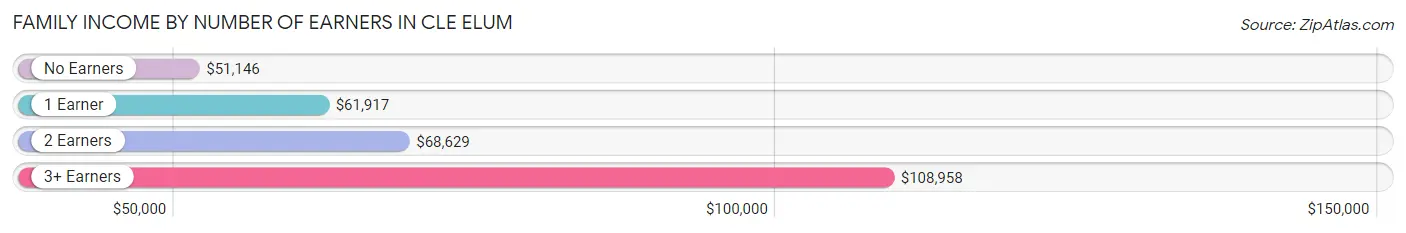
Family Income by Number of Earners in Cle Elum
The median family income in Cle Elum is $63,309, with families comprising 3+ earners (71) having the highest median family income of $108,958, while families with no earners (139) have the lowest median family income of $51,146, accounting for 14.2% and 27.7% of families, respectively.
| Number of Earners | # Families | Median Income |
| No Earners | 139 (27.7%) | $51,146 |
| 1 Earner | 121 (24.1%) | $61,917 |
| 2 Earners | 170 (33.9%) | $68,629 |
| 3+ Earners | 71 (14.2%) | $108,958 |
| Total | 501 (100.0%) | $63,309 |
Household Income in Cle Elum
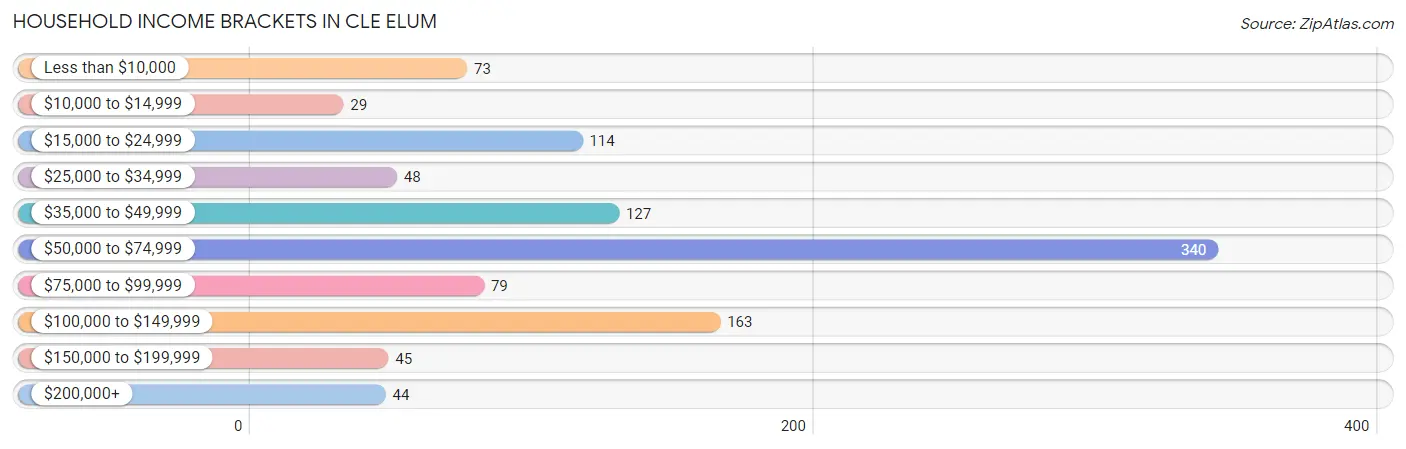
Household Income Brackets in Cle Elum
With 340 households falling in the category, the $50,000 to $74,999 income range is the most frequent in Cle Elum, accounting for 32.1% of all households. In contrast, only 29 households (2.7%) fall into the $10,000 to $14,999 income bracket, making it the least populous group.
| Income Bracket | # Households | % Households |
| Less than $10,000 | 73 | 6.9% |
| $10,000 to $14,999 | 29 | 2.7% |
| $15,000 to $24,999 | 114 | 10.7% |
| $25,000 to $34,999 | 48 | 4.5% |
| $35,000 to $49,999 | 127 | 12.0% |
| $50,000 to $74,999 | 340 | 32.0% |
| $75,000 to $99,999 | 79 | 7.4% |
| $100,000 to $149,999 | 163 | 15.4% |
| $150,000 to $199,999 | 45 | 4.2% |
| $200,000+ | 44 | 4.1% |
Household Income by Householder Age in Cle Elum
The median household income in Cle Elum is $56,645, with the highest median household income of $68,319 found in the 45 to 64 years age bracket for the primary householder. A total of 455 households (42.9%) fall into this category. Meanwhile, the 15 to 24 years age bracket for the primary householder has the lowest median household income of $49,844, with 93 households (8.8%) in this group.
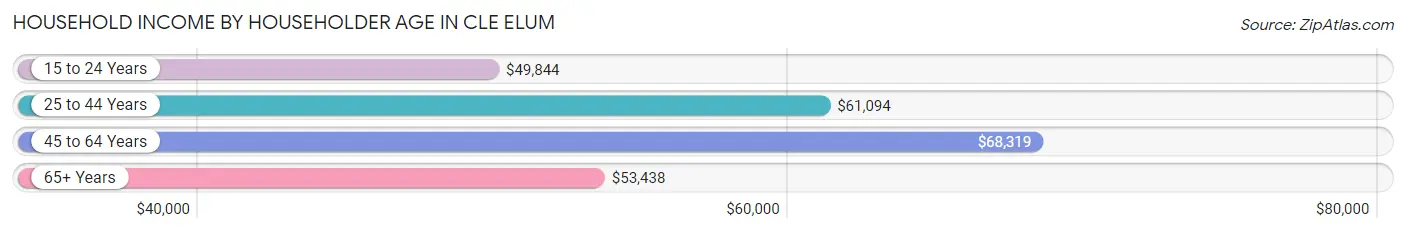
| Income Bracket | # Households | Median Income |
| 15 to 24 Years | 93 (8.8%) | $49,844 |
| 25 to 44 Years | 239 (22.5%) | $61,094 |
| 45 to 64 Years | 455 (42.9%) | $68,319 |
| 65+ Years | 274 (25.8%) | $53,438 |
| Total | 1,061 (100.0%) | $56,645 |
Poverty in Cle Elum
Income Below Poverty by Sex and Age in Cle Elum
With 8.2% poverty level for males and 24.3% for females among the residents of Cle Elum, 12 to 14 year old males and 5 year old females are the most vulnerable to poverty, with 24 males (66.7%) and 4 females (100.0%) in their respective age groups living below the poverty level.
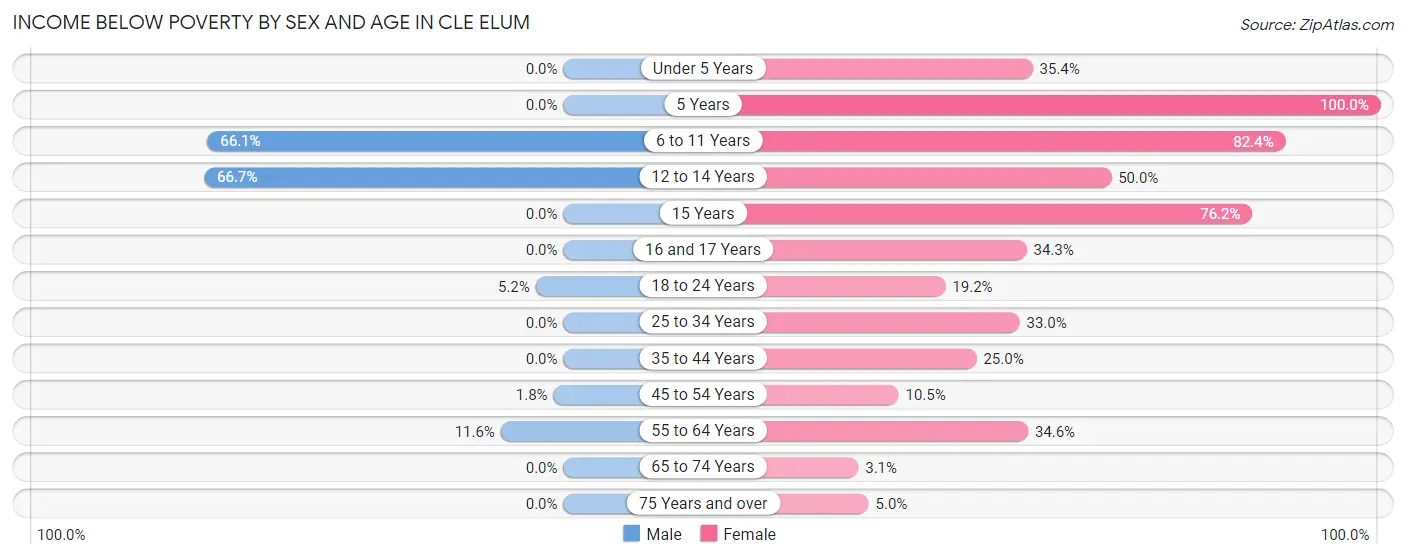
| Age Bracket | Male | Female |
| Under 5 Years | 0 (0.0%) | 17 (35.4%) |
| 5 Years | 0 (0.0%) | 4 (100.0%) |
| 6 to 11 Years | 37 (66.1%) | 42 (82.4%) |
| 12 to 14 Years | 24 (66.7%) | 4 (50.0%) |
| 15 Years | 0 (0.0%) | 16 (76.2%) |
| 16 and 17 Years | 0 (0.0%) | 12 (34.3%) |
| 18 to 24 Years | 5 (5.1%) | 20 (19.2%) |
| 25 to 34 Years | 0 (0.0%) | 32 (33.0%) |
| 35 to 44 Years | 0 (0.0%) | 19 (25.0%) |
| 45 to 54 Years | 4 (1.8%) | 20 (10.5%) |
| 55 to 64 Years | 15 (11.6%) | 66 (34.5%) |
| 65 to 74 Years | 0 (0.0%) | 3 (3.1%) |
| 75 Years and over | 0 (0.0%) | 8 (5.0%) |
| Total | 85 (8.2%) | 263 (24.3%) |
Income Above Poverty by Sex and Age in Cle Elum
According to the poverty statistics in Cle Elum, males aged 5 years and females aged 65 to 74 years are the age groups that are most secure financially, with 100.0% of males and 96.9% of females in these age groups living above the poverty line.
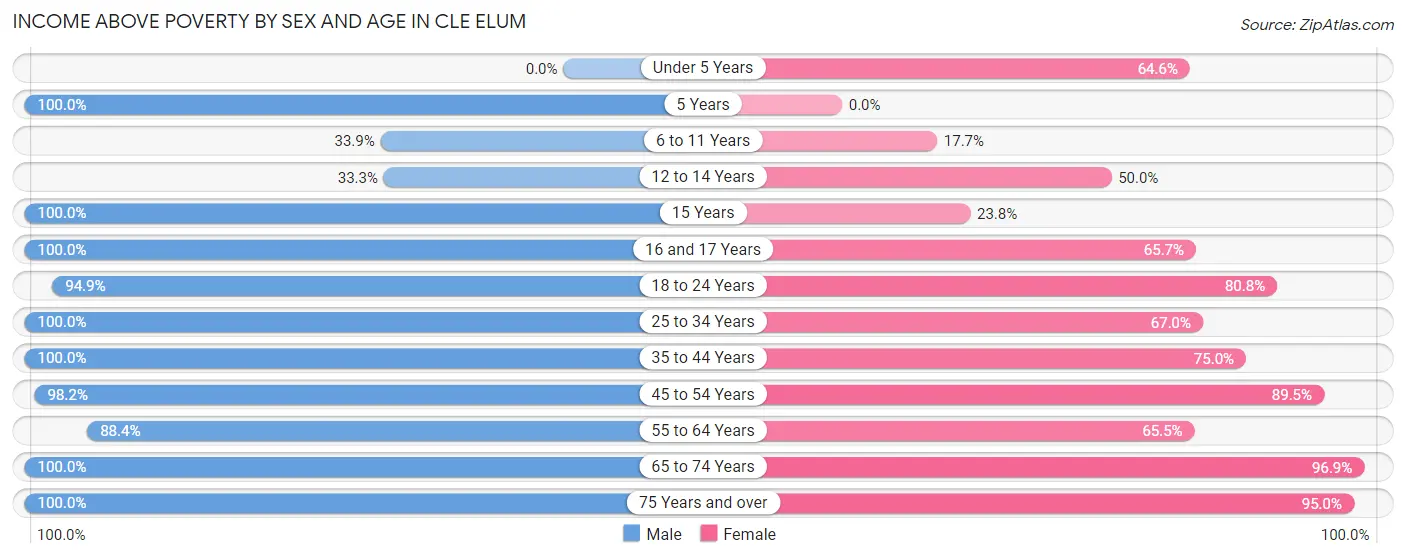
| Age Bracket | Male | Female |
| Under 5 Years | 0 (0.0%) | 31 (64.6%) |
| 5 Years | 8 (100.0%) | 0 (0.0%) |
| 6 to 11 Years | 19 (33.9%) | 9 (17.6%) |
| 12 to 14 Years | 12 (33.3%) | 4 (50.0%) |
| 15 Years | 5 (100.0%) | 5 (23.8%) |
| 16 and 17 Years | 68 (100.0%) | 23 (65.7%) |
| 18 to 24 Years | 92 (94.9%) | 84 (80.8%) |
| 25 to 34 Years | 158 (100.0%) | 65 (67.0%) |
| 35 to 44 Years | 74 (100.0%) | 57 (75.0%) |
| 45 to 54 Years | 213 (98.2%) | 170 (89.5%) |
| 55 to 64 Years | 114 (88.4%) | 125 (65.4%) |
| 65 to 74 Years | 87 (100.0%) | 95 (96.9%) |
| 75 Years and over | 97 (100.0%) | 153 (95.0%) |
| Total | 947 (91.8%) | 821 (75.7%) |
Income Below Poverty Among Married-Couple Families in Cle Elum
The poverty statistics for married-couple families in Cle Elum show that 1.4% or 5 of the total 358 families live below the poverty line. Families with 5 or more children have the highest poverty rate of 100.0%, comprising of 5 families. On the other hand, families with no children have the lowest poverty rate of 0.0%, which includes 0 families.
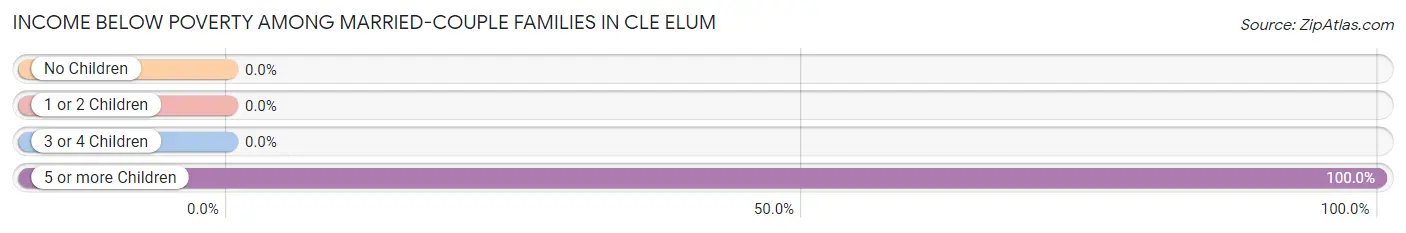
| Children | Above Poverty | Below Poverty |
| No Children | 276 (100.0%) | 0 (0.0%) |
| 1 or 2 Children | 56 (100.0%) | 0 (0.0%) |
| 3 or 4 Children | 21 (100.0%) | 0 (0.0%) |
| 5 or more Children | 0 (0.0%) | 5 (100.0%) |
| Total | 353 (98.6%) | 5 (1.4%) |
Income Below Poverty Among Single-Parent Households in Cle Elum
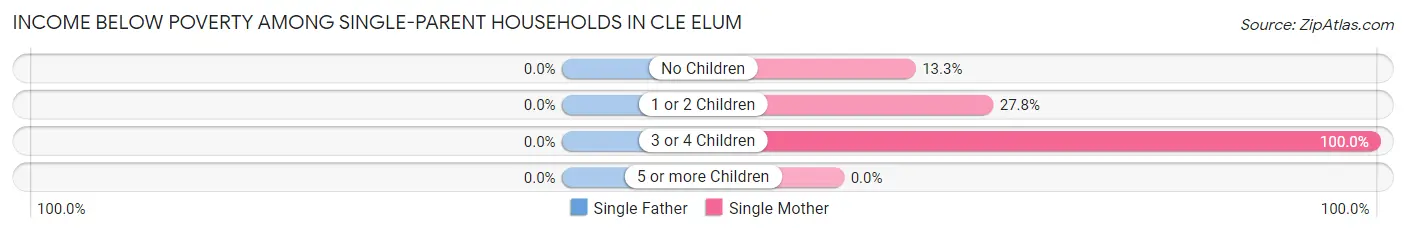
| Children | Single Father | Single Mother |
| No Children | 0 (0.0%) | 4 (13.3%) |
| 1 or 2 Children | 0 (0.0%) | 20 (27.8%) |
| 3 or 4 Children | 0 (0.0%) | 28 (100.0%) |
| 5 or more Children | 0 (0.0%) | 0 (0.0%) |
| Total | 0 (0.0%) | 52 (40.0%) |
Income Below Poverty Among Married-Couple vs Single-Parent Households in Cle Elum
The poverty data for Cle Elum shows that 5 of the married-couple family households (1.4%) and 52 of the single-parent households (36.4%) are living below the poverty level. Within the married-couple family households, those with 5 or more children have the highest poverty rate, with 5 households (100.0%) falling below the poverty line. Among the single-parent households, those with 3 or 4 children have the highest poverty rate, with 28 household (100.0%) living below poverty.
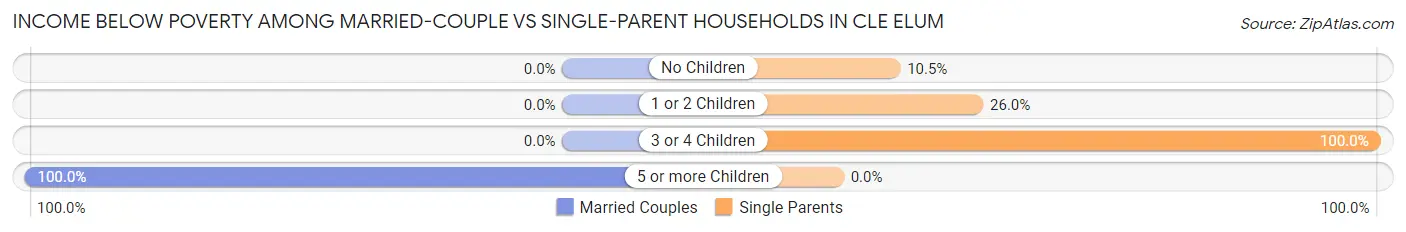
| Children | Married-Couple Families | Single-Parent Households |
| No Children | 0 (0.0%) | 4 (10.5%) |
| 1 or 2 Children | 0 (0.0%) | 20 (26.0%) |
| 3 or 4 Children | 0 (0.0%) | 28 (100.0%) |
| 5 or more Children | 5 (100.0%) | 0 (0.0%) |
| Total | 5 (1.4%) | 52 (36.4%) |
Race in Cle Elum
The most populous races in Cle Elum are White / Caucasian (1,721 | 81.3%), Some other Race (253 | 12.0%), and Hispanic or Latino (225 | 10.6%).
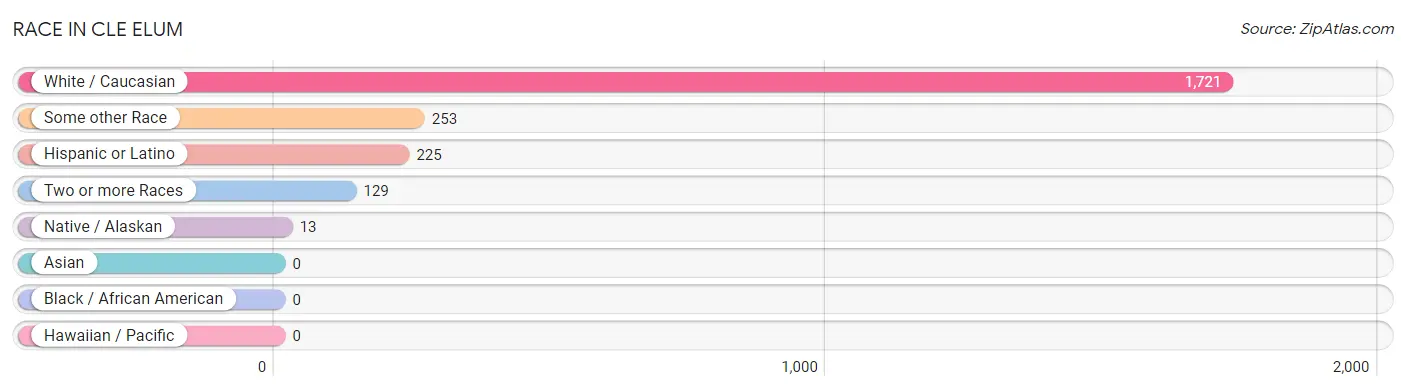
| Race | # Population | % Population |
| Asian | 0 | 0.0% |
| Black / African American | 0 | 0.0% |
| Hawaiian / Pacific | 0 | 0.0% |
| Hispanic or Latino | 225 | 10.6% |
| Native / Alaskan | 13 | 0.6% |
| White / Caucasian | 1,721 | 81.3% |
| Two or more Races | 129 | 6.1% |
| Some other Race | 253 | 12.0% |
| Total | 2,116 | 100.0% |
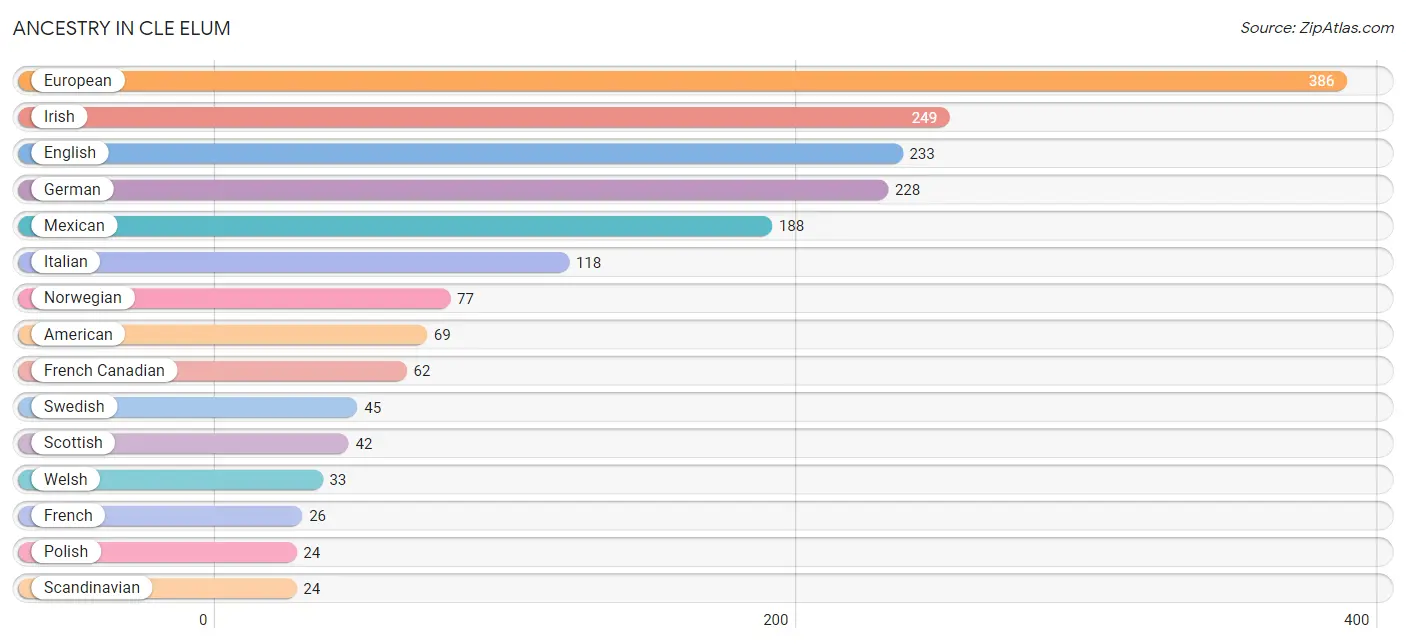
Ancestry in Cle Elum
The most populous ancestries reported in Cle Elum are European (386 | 18.2%), Irish (249 | 11.8%), English (233 | 11.0%), German (228 | 10.8%), and Mexican (188 | 8.9%), together accounting for 60.7% of all Cle Elum residents.
| Ancestry | # Population | % Population |
| American | 69 | 3.3% |
| Austrian | 5 | 0.2% |
| Blackfeet | 12 | 0.6% |
| British | 13 | 0.6% |
| Central American | 22 | 1.0% |
| Cherokee | 11 | 0.5% |
| Colombian | 15 | 0.7% |
| Costa Rican | 10 | 0.5% |
| Cree | 8 | 0.4% |
| Croatian | 15 | 0.7% |
| Delaware | 1 | 0.1% |
| Dutch | 20 | 0.9% |
| Eastern European | 2 | 0.1% |
| English | 233 | 11.0% |
| European | 386 | 18.2% |
| Finnish | 13 | 0.6% |
| French | 26 | 1.2% |
| French Canadian | 62 | 2.9% |
| German | 228 | 10.8% |
| Hungarian | 2 | 0.1% |
| Indian (Asian) | 3 | 0.1% |
| Irish | 249 | 11.8% |
| Italian | 118 | 5.6% |
| Laotian | 4 | 0.2% |
| Mexican | 188 | 8.9% |
| Norwegian | 77 | 3.6% |
| Panamanian | 12 | 0.6% |
| Pennsylvania German | 12 | 0.6% |
| Polish | 24 | 1.1% |
| Puget Sound Salish | 5 | 0.2% |
| Russian | 5 | 0.2% |
| Scandinavian | 24 | 1.1% |
| Scotch-Irish | 3 | 0.1% |
| Scottish | 42 | 2.0% |
| South American | 15 | 0.7% |
| Swedish | 45 | 2.1% |
| Ukrainian | 11 | 0.5% |
| Welsh | 33 | 1.6% |
| Yakama | 6 | 0.3% |
| Yugoslavian | 7 | 0.3% | View All 40 Rows |
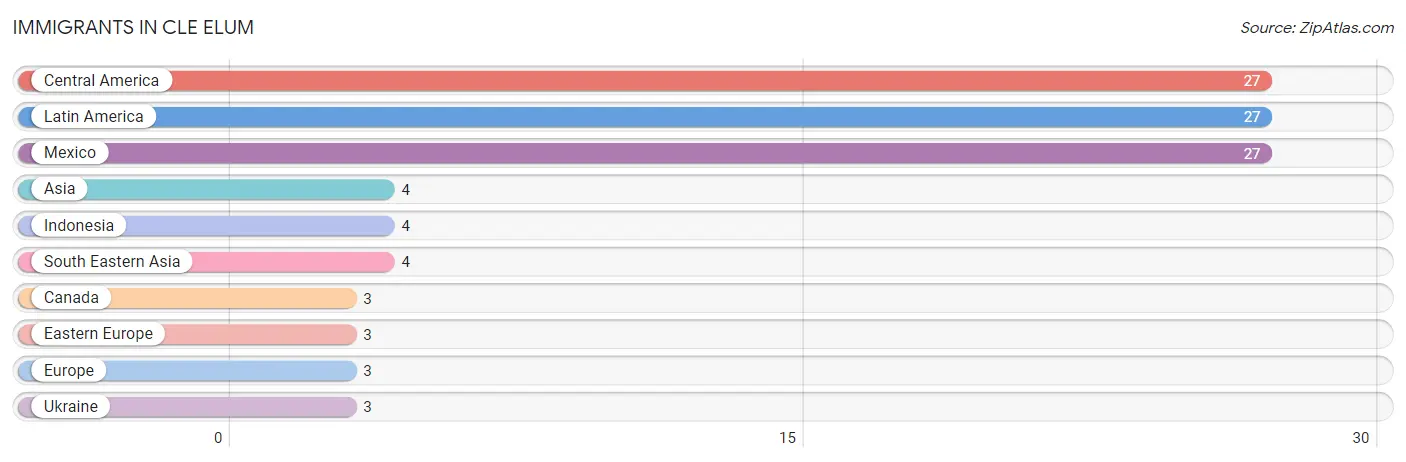
Immigrants in Cle Elum
The most numerous immigrant groups reported in Cle Elum came from Central America (27 | 1.3%), Latin America (27 | 1.3%), Mexico (27 | 1.3%), Asia (4 | 0.2%), and Indonesia (4 | 0.2%), together accounting for 4.2% of all Cle Elum residents.
| Immigration Origin | # Population | % Population |
| Asia | 4 | 0.2% |
| Canada | 3 | 0.1% |
| Central America | 27 | 1.3% |
| Eastern Europe | 3 | 0.1% |
| Europe | 3 | 0.1% |
| Indonesia | 4 | 0.2% |
| Latin America | 27 | 1.3% |
| Mexico | 27 | 1.3% |
| South Eastern Asia | 4 | 0.2% |
| Ukraine | 3 | 0.1% | View All 10 Rows |
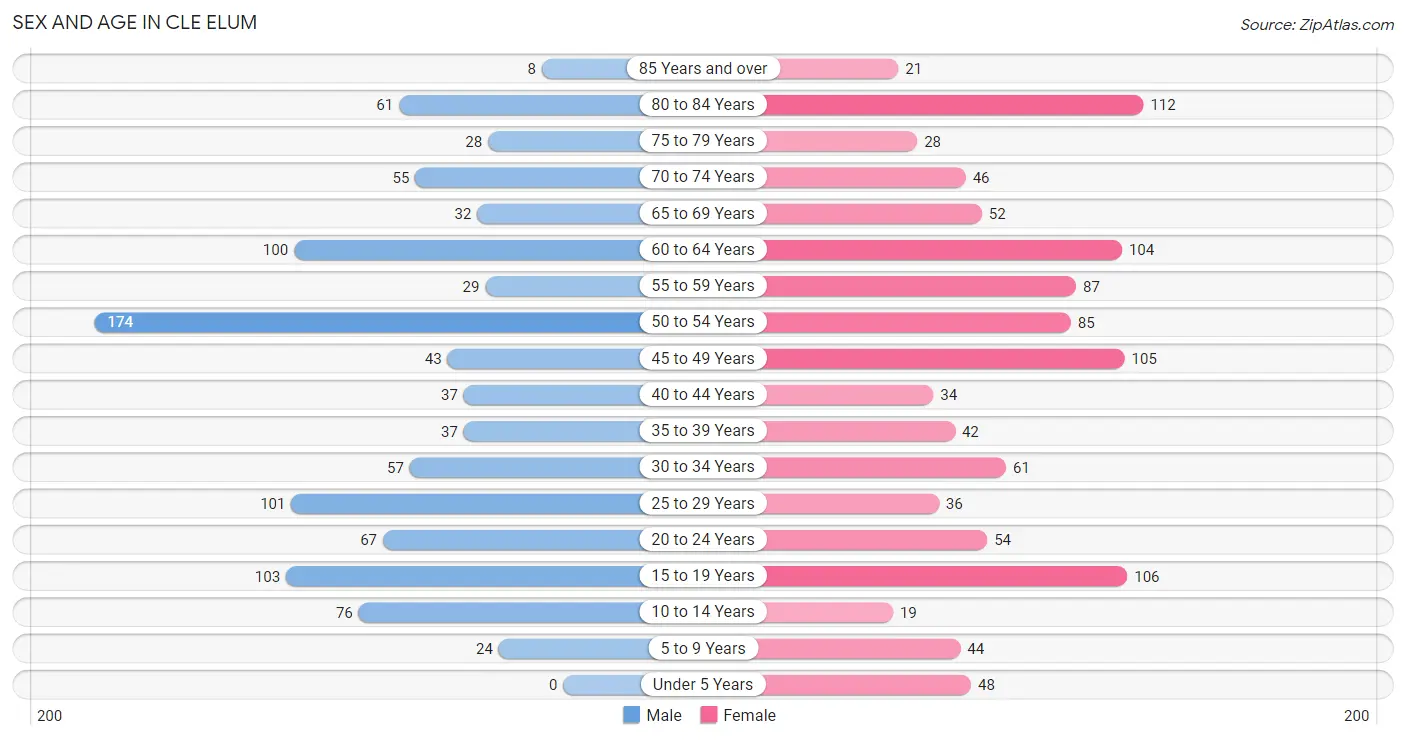
Sex and Age in Cle Elum
Sex and Age in Cle Elum
The most populous age groups in Cle Elum are 50 to 54 Years (174 | 16.9%) for men and 80 to 84 Years (112 | 10.3%) for women.
| Age Bracket | Male | Female |
| Under 5 Years | 0 (0.0%) | 48 (4.4%) |
| 5 to 9 Years | 24 (2.3%) | 44 (4.1%) |
| 10 to 14 Years | 76 (7.4%) | 19 (1.8%) |
| 15 to 19 Years | 103 (10.0%) | 106 (9.8%) |
| 20 to 24 Years | 67 (6.5%) | 54 (5.0%) |
| 25 to 29 Years | 101 (9.8%) | 36 (3.3%) |
| 30 to 34 Years | 57 (5.5%) | 61 (5.6%) |
| 35 to 39 Years | 37 (3.6%) | 42 (3.9%) |
| 40 to 44 Years | 37 (3.6%) | 34 (3.1%) |
| 45 to 49 Years | 43 (4.2%) | 105 (9.7%) |
| 50 to 54 Years | 174 (16.9%) | 85 (7.8%) |
| 55 to 59 Years | 29 (2.8%) | 87 (8.0%) |
| 60 to 64 Years | 100 (9.7%) | 104 (9.6%) |
| 65 to 69 Years | 32 (3.1%) | 52 (4.8%) |
| 70 to 74 Years | 55 (5.3%) | 46 (4.2%) |
| 75 to 79 Years | 28 (2.7%) | 28 (2.6%) |
| 80 to 84 Years | 61 (5.9%) | 112 (10.3%) |
| 85 Years and over | 8 (0.8%) | 21 (1.9%) |
| Total | 1,032 (100.0%) | 1,084 (100.0%) |
Families and Households in Cle Elum
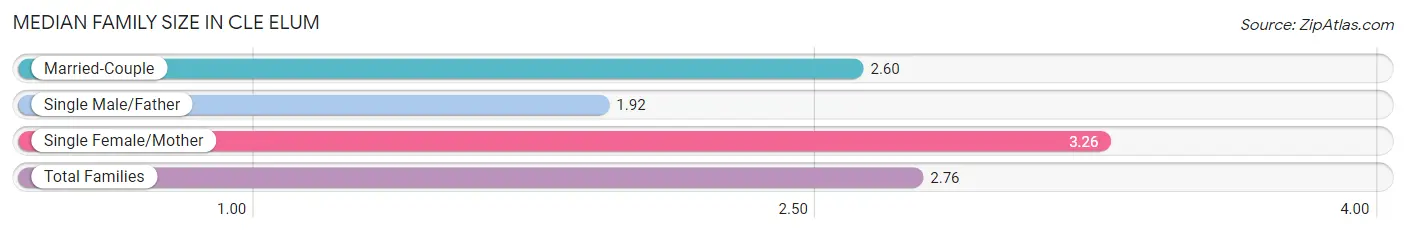
Median Family Size in Cle Elum
The median family size in Cle Elum is 2.76 persons per family, with single female/mother families (130 | 26.0%) accounting for the largest median family size of 3.26 persons per family. On the other hand, single male/father families (13 | 2.6%) represent the smallest median family size with 1.92 persons per family.
| Family Type | # Families | Family Size |
| Married-Couple | 358 (71.5%) | 2.60 |
| Single Male/Father | 13 (2.6%) | 1.92 |
| Single Female/Mother | 130 (26.0%) | 3.26 |
| Total Families | 501 (100.0%) | 2.76 |
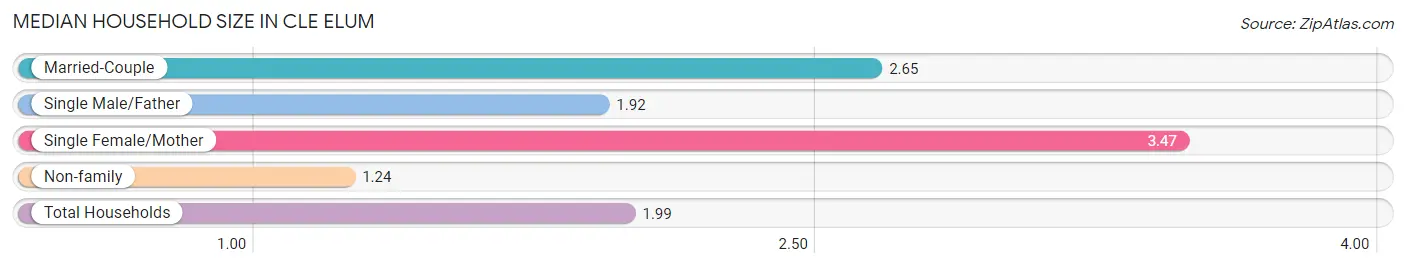
Median Household Size in Cle Elum
The median household size in Cle Elum is 1.99 persons per household, with single female/mother households (130 | 12.2%) accounting for the largest median household size of 3.47 persons per household. non-family households (560 | 52.8%) represent the smallest median household size with 1.24 persons per household.
| Household Type | # Households | Household Size |
| Married-Couple | 358 (33.7%) | 2.65 |
| Single Male/Father | 13 (1.2%) | 1.92 |
| Single Female/Mother | 130 (12.2%) | 3.47 |
| Non-family | 560 (52.8%) | 1.24 |
| Total Households | 1,061 (100.0%) | 1.99 |
Household Size by Marriage Status in Cle Elum
Out of a total of 1,061 households in Cle Elum, 501 (47.2%) are family households, while 560 (52.8%) are nonfamily households. The most numerous type of family households are 2-person households, comprising 319, and the most common type of nonfamily households are 1-person households, comprising 379.
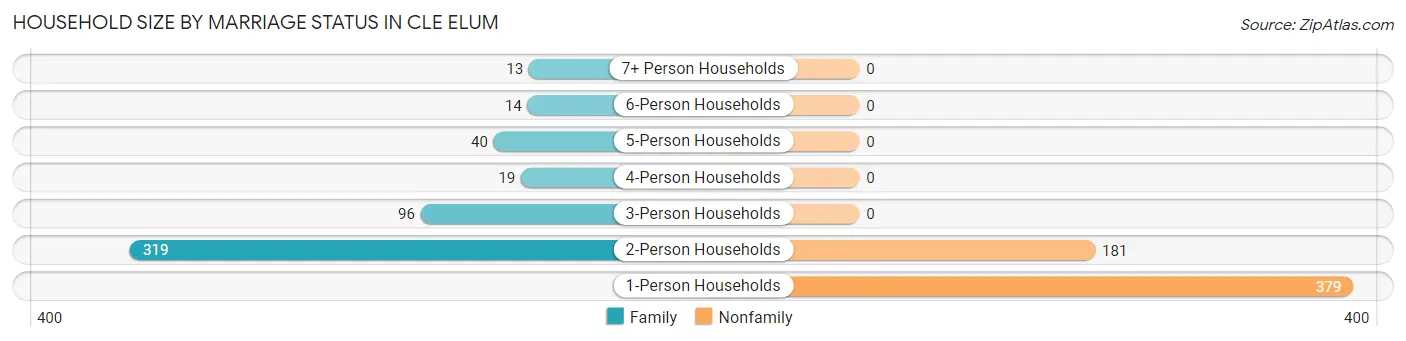
| Household Size | Family Households | Nonfamily Households |
| 1-Person Households | - | 379 (35.7%) |
| 2-Person Households | 319 (30.1%) | 181 (17.1%) |
| 3-Person Households | 96 (9.0%) | 0 (0.0%) |
| 4-Person Households | 19 (1.8%) | 0 (0.0%) |
| 5-Person Households | 40 (3.8%) | 0 (0.0%) |
| 6-Person Households | 14 (1.3%) | 0 (0.0%) |
| 7+ Person Households | 13 (1.2%) | 0 (0.0%) |
| Total | 501 (47.2%) | 560 (52.8%) |
Female Fertility in Cle Elum
Fertility by Age in Cle Elum
Average fertility rate in Cle Elum is 60.0 births per 1,000 women. Women in the age bracket of 20 to 34 years have the highest fertility rate with 192.0 births per 1,000 women. Women in the age bracket of 20 to 34 years acount for 100.0% of all women with births.
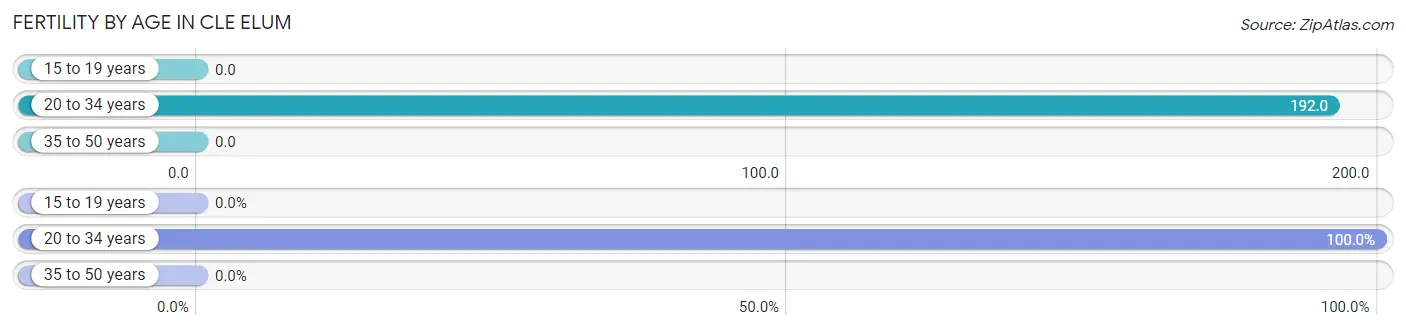
| Age Bracket | Women with Births | Births / 1,000 Women |
| 15 to 19 years | 0 (0.0%) | 0.0 |
| 20 to 34 years | 29 (100.0%) | 192.0 |
| 35 to 50 years | 0 (0.0%) | 0.0 |
| Total | 29 (100.0%) | 60.0 |
Fertility by Age by Marriage Status in Cle Elum
51.7% of women with births (29) in Cle Elum are married. The highest percentage of unmarried women with births falls into 20 to 34 years age bracket with 48.3% of them unmarried at the time of birth, while the lowest percentage of unmarried women with births belong to 20 to 34 years age bracket with 48.3% of them unmarried.
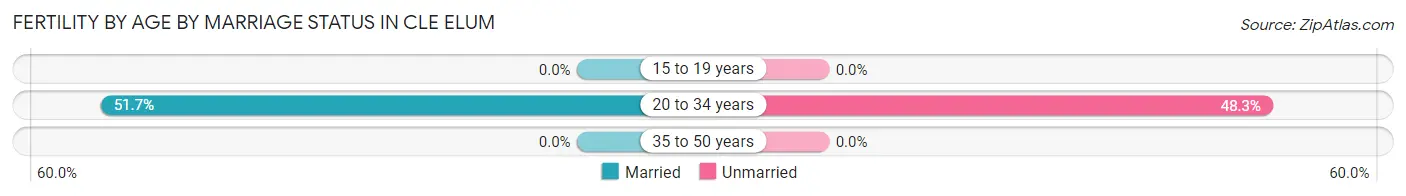
| Age Bracket | Married | Unmarried |
| 15 to 19 years | 0 (0.0%) | 0 (0.0%) |
| 20 to 34 years | 15 (51.7%) | 14 (48.3%) |
| 35 to 50 years | 0 (0.0%) | 0 (0.0%) |
| Total | 15 (51.7%) | 14 (48.3%) |
Fertility by Education in Cle Elum
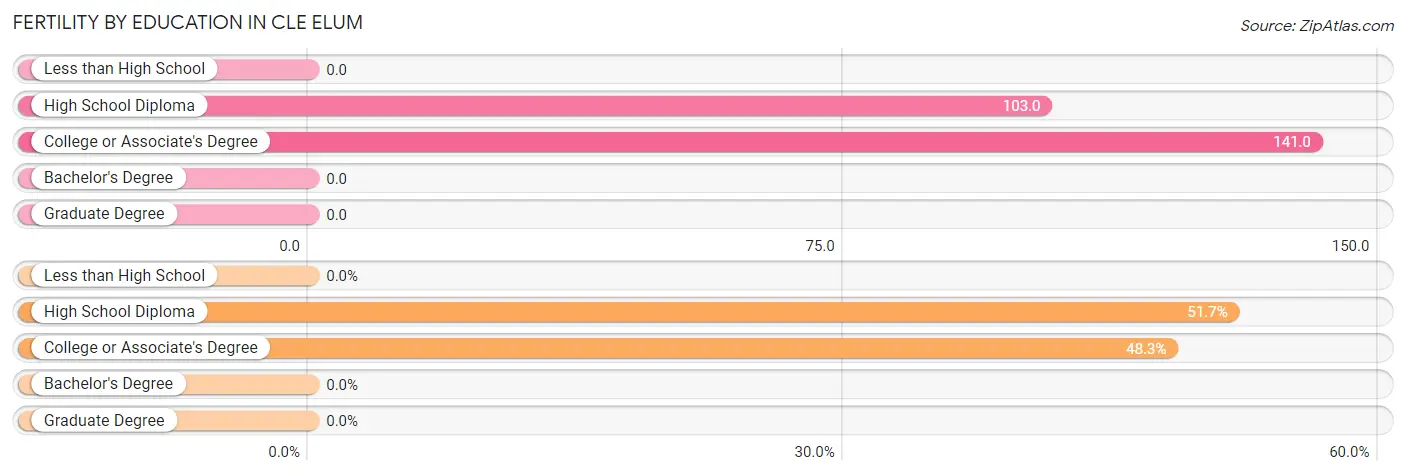
| Educational Attainment | Women with Births | Births / 1,000 Women |
| Less than High School | 0 (0.0%) | 0.0 |
| High School Diploma | 15 (51.7%) | 103.0 |
| College or Associate's Degree | 14 (48.3%) | 141.0 |
| Bachelor's Degree | 0 (0.0%) | 0.0 |
| Graduate Degree | 0 (0.0%) | 0.0 |
| Total | 29 (100.0%) | 60.0 |
Fertility by Education by Marriage Status in Cle Elum
48.3% of women with births in Cle Elum are unmarried. Women with the educational attainment of high school diploma are most likely to be married with 100.0% of them married at childbirth, while women with the educational attainment of college or associate's degree are least likely to be married with 100.0% of them unmarried at childbirth.
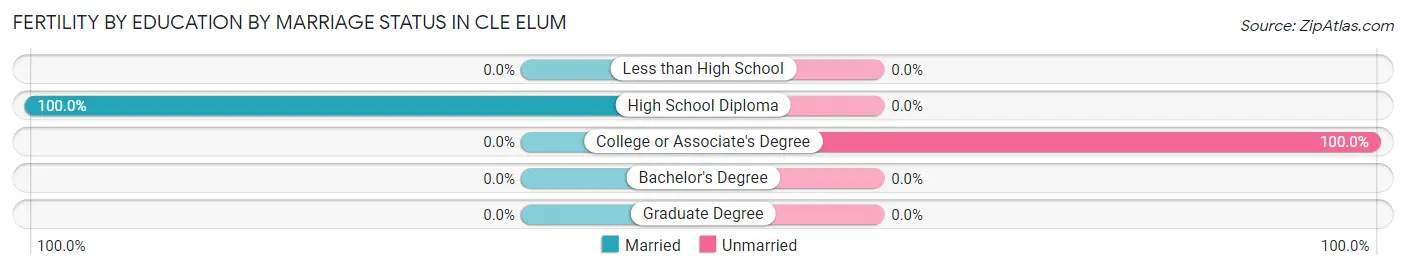
| Educational Attainment | Married | Unmarried |
| Less than High School | 0 (0.0%) | 0 (0.0%) |
| High School Diploma | 15 (100.0%) | 0 (0.0%) |
| College or Associate's Degree | 0 (0.0%) | 14 (100.0%) |
| Bachelor's Degree | 0 (0.0%) | 0 (0.0%) |
| Graduate Degree | 0 (0.0%) | 0 (0.0%) |
| Total | 15 (51.7%) | 14 (48.3%) |
Employment Characteristics in Cle Elum
Employment by Class of Employer in Cle Elum
Among the 1,043 employed individuals in Cle Elum, private company employees (695 | 66.6%), self-employed (not incorporated) (121 | 11.6%), and self-employed (incorporated) (77 | 7.4%) make up the most common classes of employment.
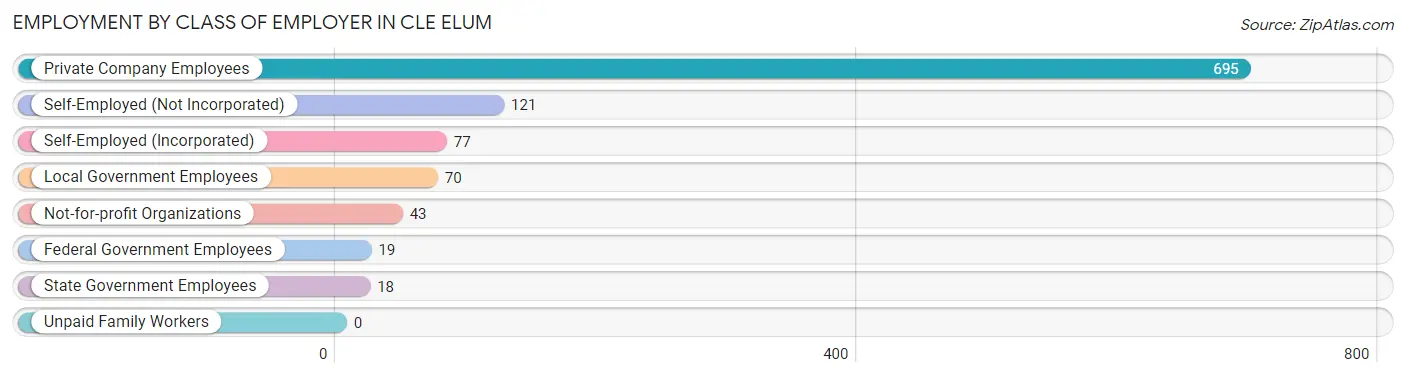
| Employer Class | # Employees | % Employees |
| Private Company Employees | 695 | 66.6% |
| Self-Employed (Incorporated) | 77 | 7.4% |
| Self-Employed (Not Incorporated) | 121 | 11.6% |
| Not-for-profit Organizations | 43 | 4.1% |
| Local Government Employees | 70 | 6.7% |
| State Government Employees | 18 | 1.7% |
| Federal Government Employees | 19 | 1.8% |
| Unpaid Family Workers | 0 | 0.0% |
| Total | 1,043 | 100.0% |
Employment Status by Age in Cle Elum
According to the labor force statistics for Cle Elum, out of the total population over 16 years of age (1,879), 57.8% or 1,086 individuals are in the labor force, with 2.2% or 24 of them unemployed. The age group with the highest labor force participation rate is 25 to 29 years, with 100.0% or 137 individuals in the labor force. Within the labor force, the 60 to 64 years age range has the highest percentage of unemployed individuals, with 14.6% or 22 of them being unemployed.
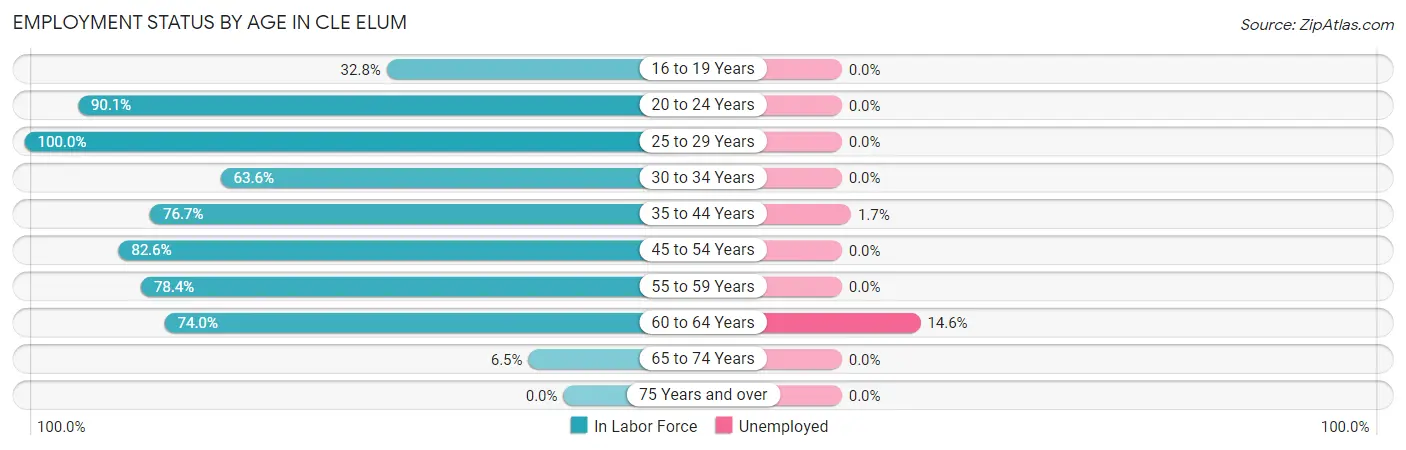
| Age Bracket | In Labor Force | Unemployed |
| 16 to 19 Years | 60 (32.8%) | 0 (0.0%) |
| 20 to 24 Years | 109 (90.1%) | 0 (0.0%) |
| 25 to 29 Years | 137 (100.0%) | 0 (0.0%) |
| 30 to 34 Years | 75 (63.6%) | 0 (0.0%) |
| 35 to 44 Years | 115 (76.7%) | 2 (1.7%) |
| 45 to 54 Years | 336 (82.6%) | 0 (0.0%) |
| 55 to 59 Years | 91 (78.4%) | 0 (0.0%) |
| 60 to 64 Years | 151 (74.0%) | 22 (14.6%) |
| 65 to 74 Years | 12 (6.5%) | 0 (0.0%) |
| 75 Years and over | 0 (0.0%) | 0 (0.0%) |
| Total | 1,086 (57.8%) | 24 (2.2%) |
Employment Status by Educational Attainment in Cle Elum
According to labor force statistics for Cle Elum, 79.9% of individuals (904) out of the total population between 25 and 64 years of age (1,132) are in the labor force, with 2.7% or 24 of them being unemployed. The group with the highest labor force participation rate are those with the educational attainment of bachelor's degree or higher, with 85.3% or 174 individuals in the labor force. Within the labor force, individuals with college / associate degree education have the highest percentage of unemployment, with 7.3% or 19 of them being unemployed.
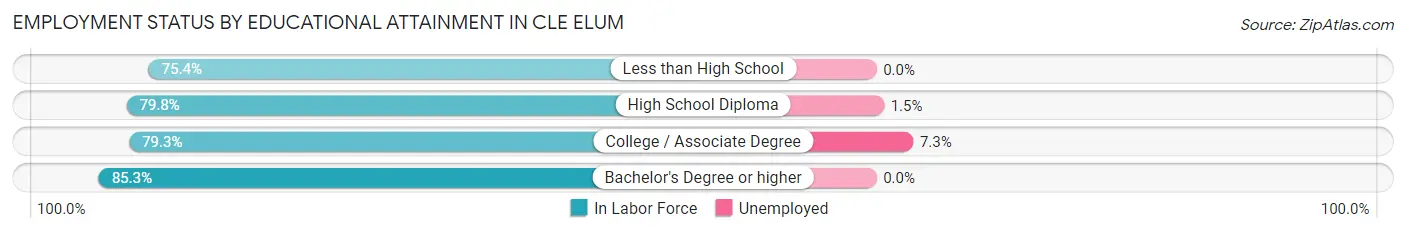
| Educational Attainment | In Labor Force | Unemployed |
| Less than High School | 135 (75.4%) | 0 (0.0%) |
| High School Diploma | 335 (79.8%) | 6 (1.5%) |
| College / Associate Degree | 261 (79.3%) | 24 (7.3%) |
| Bachelor's Degree or higher | 174 (85.3%) | 0 (0.0%) |
| Total | 904 (79.9%) | 31 (2.7%) |
Employment Occupations by Sex in Cle Elum
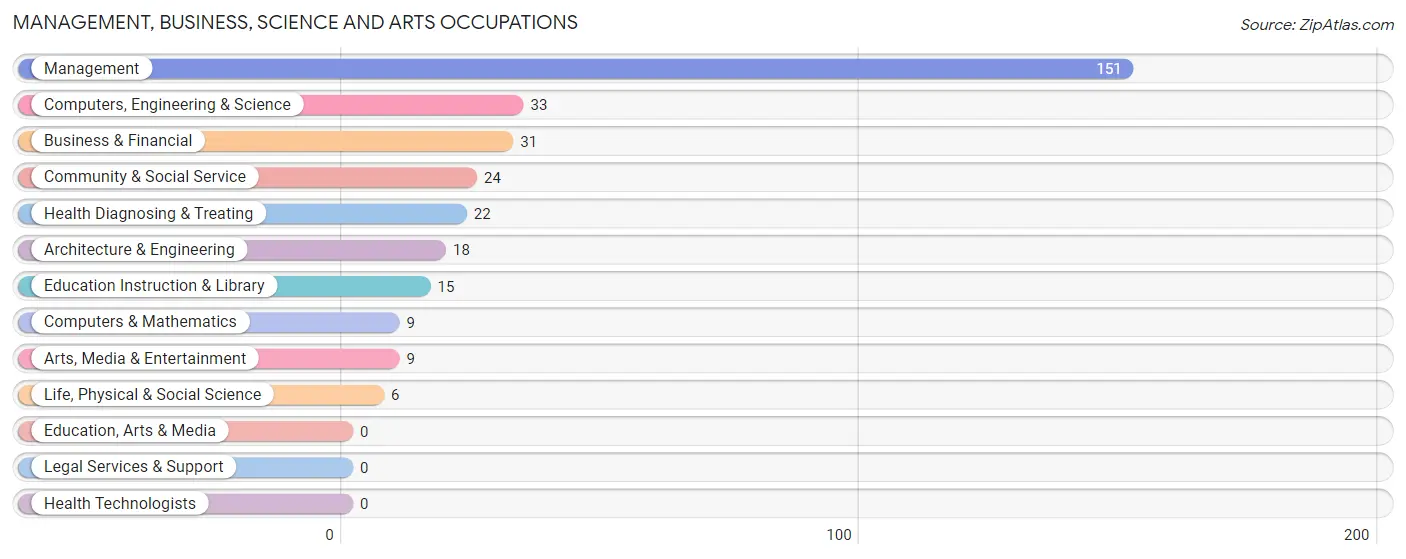
Management, Business, Science and Arts Occupations
The most common Management, Business, Science and Arts occupations in Cle Elum are Management (151 | 14.2%), Computers, Engineering & Science (33 | 3.1%), Business & Financial (31 | 2.9%), Community & Social Service (24 | 2.3%), and Health Diagnosing & Treating (22 | 2.1%).
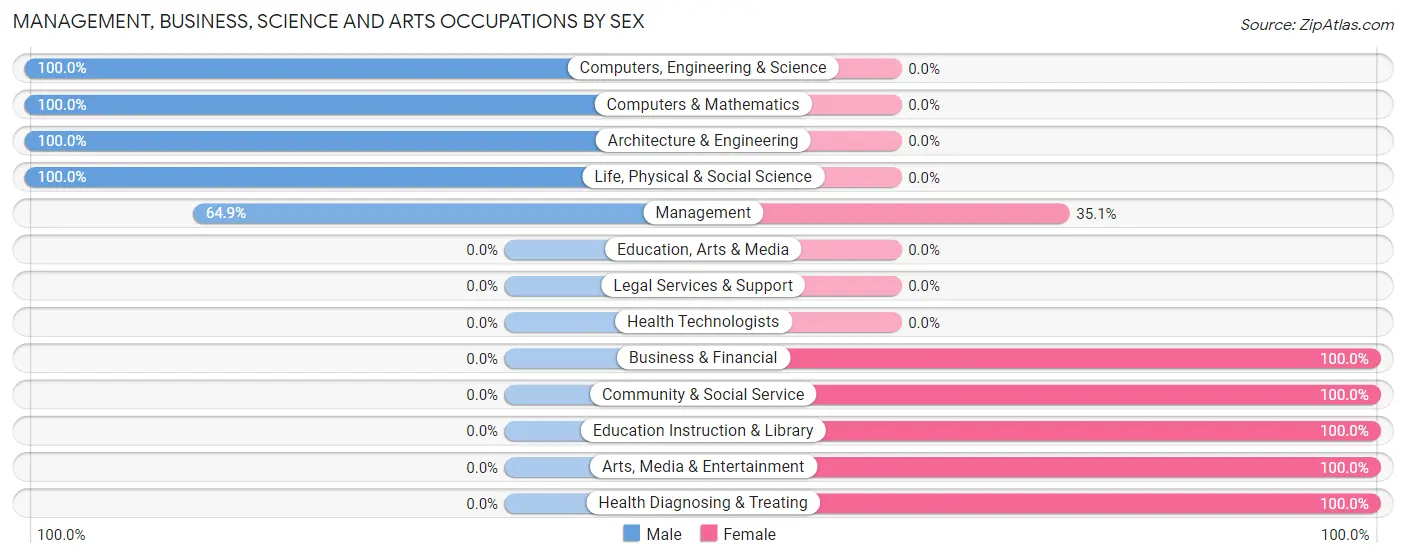
Management, Business, Science and Arts Occupations by Sex
Within the Management, Business, Science and Arts occupations in Cle Elum, the most male-oriented occupations are Computers, Engineering & Science (100.0%), Computers & Mathematics (100.0%), and Architecture & Engineering (100.0%), while the most female-oriented occupations are Business & Financial (100.0%), Community & Social Service (100.0%), and Education Instruction & Library (100.0%).
| Occupation | Male | Female |
| Management | 98 (64.9%) | 53 (35.1%) |
| Business & Financial | 0 (0.0%) | 31 (100.0%) |
| Computers, Engineering & Science | 33 (100.0%) | 0 (0.0%) |
| Computers & Mathematics | 9 (100.0%) | 0 (0.0%) |
| Architecture & Engineering | 18 (100.0%) | 0 (0.0%) |
| Life, Physical & Social Science | 6 (100.0%) | 0 (0.0%) |
| Community & Social Service | 0 (0.0%) | 24 (100.0%) |
| Education, Arts & Media | 0 (0.0%) | 0 (0.0%) |
| Legal Services & Support | 0 (0.0%) | 0 (0.0%) |
| Education Instruction & Library | 0 (0.0%) | 15 (100.0%) |
| Arts, Media & Entertainment | 0 (0.0%) | 9 (100.0%) |
| Health Diagnosing & Treating | 0 (0.0%) | 22 (100.0%) |
| Health Technologists | 0 (0.0%) | 0 (0.0%) |
| Total (Category) | 131 (50.2%) | 130 (49.8%) |
| Total (Overall) | 574 (54.0%) | 488 (46.0%) |
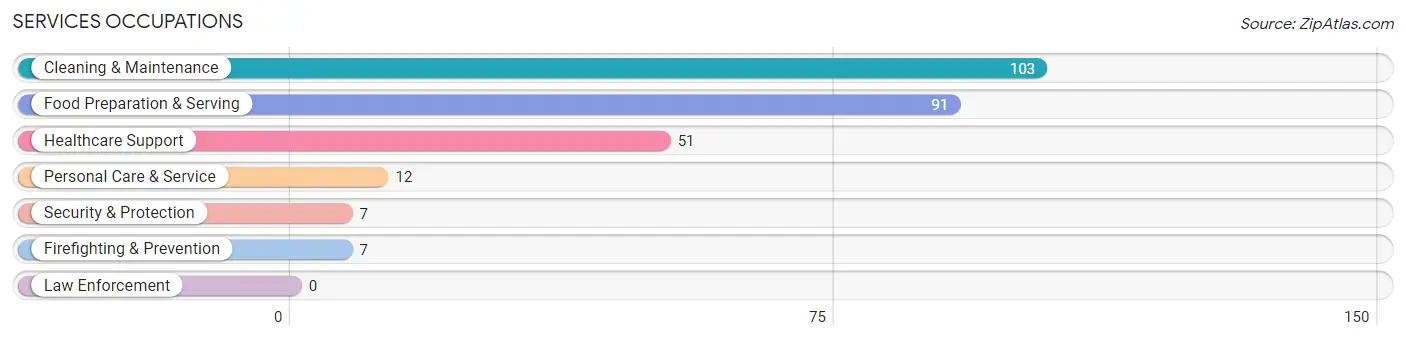
Services Occupations
The most common Services occupations in Cle Elum are Cleaning & Maintenance (103 | 9.7%), Food Preparation & Serving (91 | 8.6%), Healthcare Support (51 | 4.8%), Personal Care & Service (12 | 1.1%), and Security & Protection (7 | 0.7%).
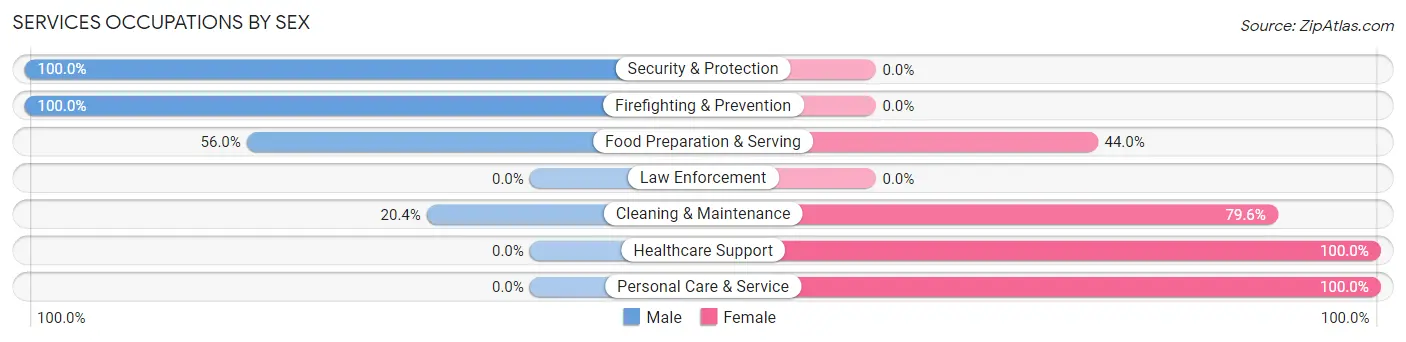
Services Occupations by Sex
Within the Services occupations in Cle Elum, the most male-oriented occupations are Security & Protection (100.0%), Firefighting & Prevention (100.0%), and Food Preparation & Serving (56.0%), while the most female-oriented occupations are Healthcare Support (100.0%), Personal Care & Service (100.0%), and Cleaning & Maintenance (79.6%).
| Occupation | Male | Female |
| Healthcare Support | 0 (0.0%) | 51 (100.0%) |
| Security & Protection | 7 (100.0%) | 0 (0.0%) |
| Firefighting & Prevention | 7 (100.0%) | 0 (0.0%) |
| Law Enforcement | 0 (0.0%) | 0 (0.0%) |
| Food Preparation & Serving | 51 (56.0%) | 40 (44.0%) |
| Cleaning & Maintenance | 21 (20.4%) | 82 (79.6%) |
| Personal Care & Service | 0 (0.0%) | 12 (100.0%) |
| Total (Category) | 79 (29.9%) | 185 (70.1%) |
| Total (Overall) | 574 (54.0%) | 488 (46.0%) |
Sales and Office Occupations
The most common Sales and Office occupations in Cle Elum are Office & Administration (80 | 7.5%), and Sales & Related (73 | 6.9%).

Sales and Office Occupations by Sex
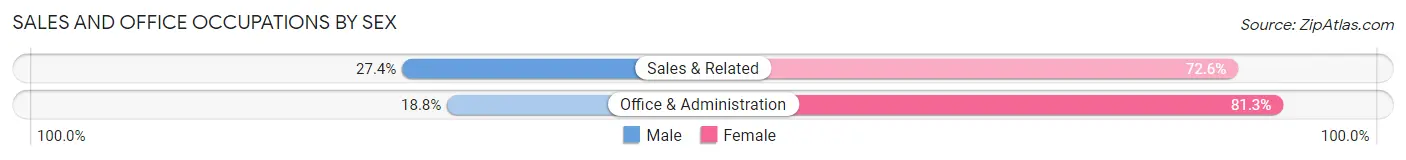
| Occupation | Male | Female |
| Sales & Related | 20 (27.4%) | 53 (72.6%) |
| Office & Administration | 15 (18.8%) | 65 (81.2%) |
| Total (Category) | 35 (22.9%) | 118 (77.1%) |
| Total (Overall) | 574 (54.0%) | 488 (46.0%) |
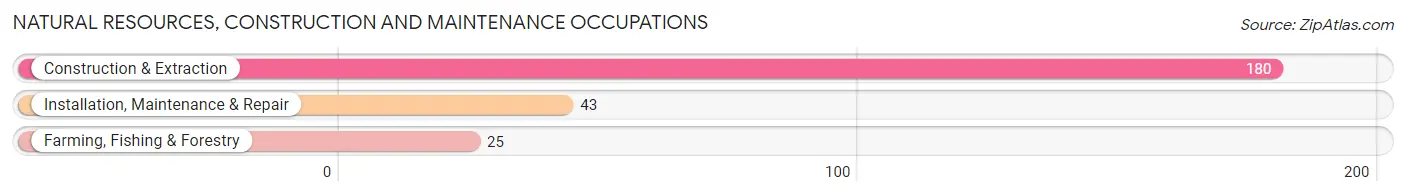
Natural Resources, Construction and Maintenance Occupations
The most common Natural Resources, Construction and Maintenance occupations in Cle Elum are Construction & Extraction (180 | 17.0%), Installation, Maintenance & Repair (43 | 4.1%), and Farming, Fishing & Forestry (25 | 2.4%).
Natural Resources, Construction and Maintenance Occupations by Sex
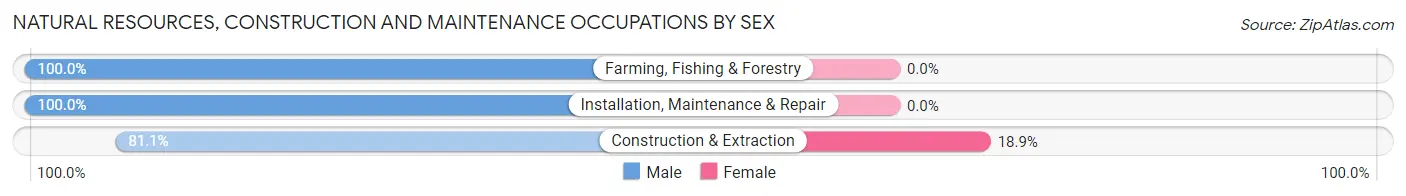
| Occupation | Male | Female |
| Farming, Fishing & Forestry | 25 (100.0%) | 0 (0.0%) |
| Construction & Extraction | 146 (81.1%) | 34 (18.9%) |
| Installation, Maintenance & Repair | 43 (100.0%) | 0 (0.0%) |
| Total (Category) | 214 (86.3%) | 34 (13.7%) |
| Total (Overall) | 574 (54.0%) | 488 (46.0%) |
Production, Transportation and Moving Occupations
The most common Production, Transportation and Moving occupations in Cle Elum are Material Moving (108 | 10.2%), Production (15 | 1.4%), and Transportation (13 | 1.2%).
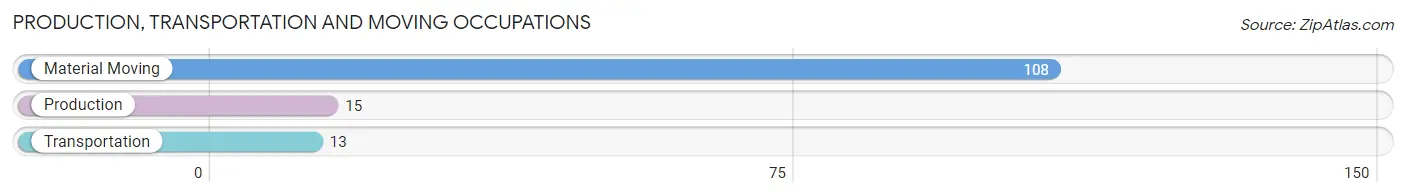
Production, Transportation and Moving Occupations by Sex
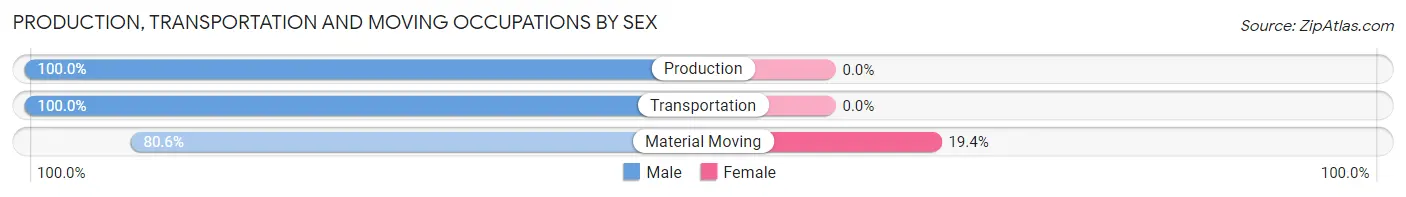
| Occupation | Male | Female |
| Production | 15 (100.0%) | 0 (0.0%) |
| Transportation | 13 (100.0%) | 0 (0.0%) |
| Material Moving | 87 (80.6%) | 21 (19.4%) |
| Total (Category) | 115 (84.6%) | 21 (15.4%) |
| Total (Overall) | 574 (54.0%) | 488 (46.0%) |
Employment Industries by Sex in Cle Elum
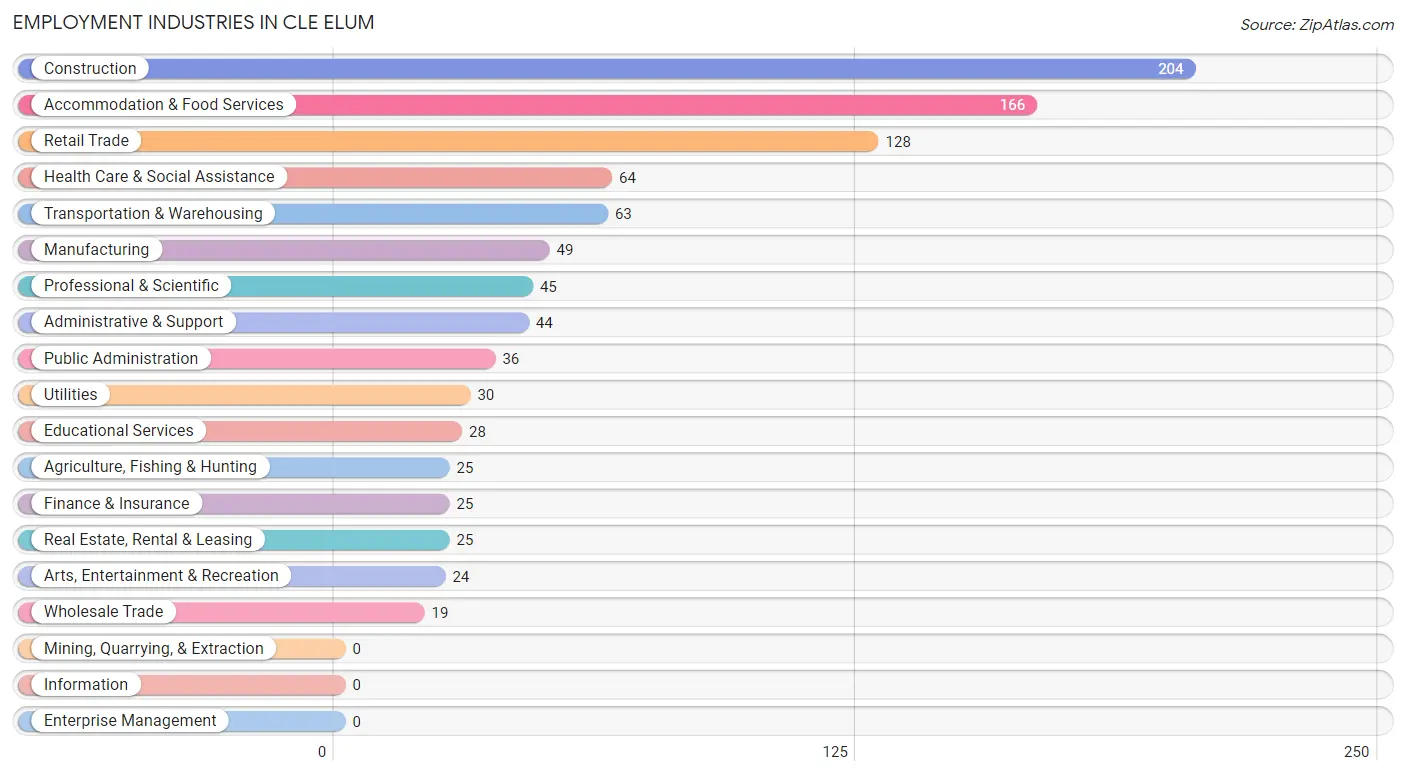
Employment Industries in Cle Elum
The major employment industries in Cle Elum include Construction (204 | 19.2%), Accommodation & Food Services (166 | 15.6%), Retail Trade (128 | 12.0%), Health Care & Social Assistance (64 | 6.0%), and Transportation & Warehousing (63 | 5.9%).
Employment Industries by Sex in Cle Elum
The Cle Elum industries that see more men than women are Agriculture, Fishing & Hunting (100.0%), Construction (91.7%), and Public Administration (83.3%), whereas the industries that tend to have a higher number of women are Health Care & Social Assistance (100.0%), Arts, Entertainment & Recreation (100.0%), and Finance & Insurance (72.0%).
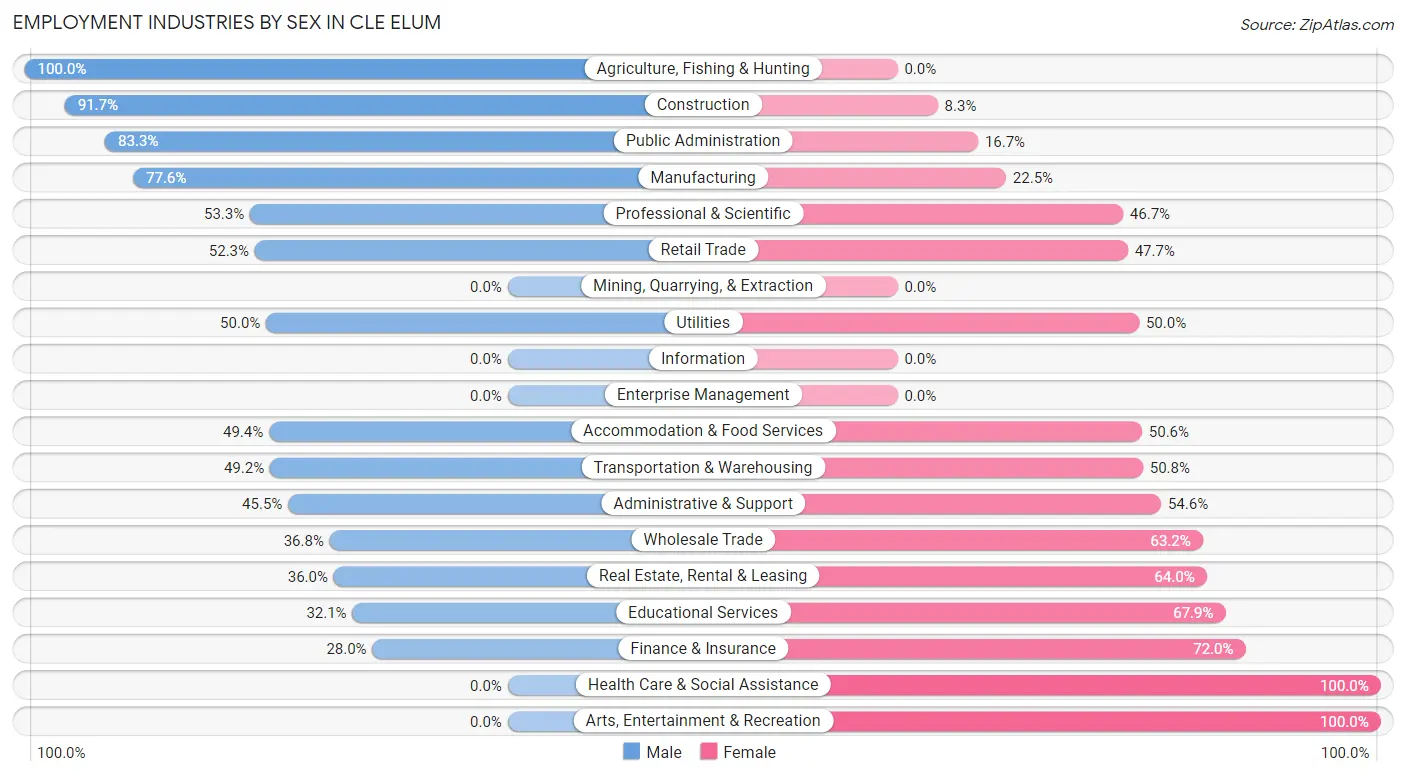
| Industry | Male | Female |
| Agriculture, Fishing & Hunting | 25 (100.0%) | 0 (0.0%) |
| Mining, Quarrying, & Extraction | 0 (0.0%) | 0 (0.0%) |
| Construction | 187 (91.7%) | 17 (8.3%) |
| Manufacturing | 38 (77.5%) | 11 (22.5%) |
| Wholesale Trade | 7 (36.8%) | 12 (63.2%) |
| Retail Trade | 67 (52.3%) | 61 (47.7%) |
| Transportation & Warehousing | 31 (49.2%) | 32 (50.8%) |
| Utilities | 15 (50.0%) | 15 (50.0%) |
| Information | 0 (0.0%) | 0 (0.0%) |
| Finance & Insurance | 7 (28.0%) | 18 (72.0%) |
| Real Estate, Rental & Leasing | 9 (36.0%) | 16 (64.0%) |
| Professional & Scientific | 24 (53.3%) | 21 (46.7%) |
| Enterprise Management | 0 (0.0%) | 0 (0.0%) |
| Administrative & Support | 20 (45.5%) | 24 (54.5%) |
| Educational Services | 9 (32.1%) | 19 (67.9%) |
| Health Care & Social Assistance | 0 (0.0%) | 64 (100.0%) |
| Arts, Entertainment & Recreation | 0 (0.0%) | 24 (100.0%) |
| Accommodation & Food Services | 82 (49.4%) | 84 (50.6%) |
| Public Administration | 30 (83.3%) | 6 (16.7%) |
| Total | 574 (54.0%) | 488 (46.0%) |
Education in Cle Elum
School Enrollment in Cle Elum
The most common levels of schooling among the 370 students in Cle Elum are high school (134 | 36.2%), middle school (95 | 25.7%), and college / undergraduate (62 | 16.8%).
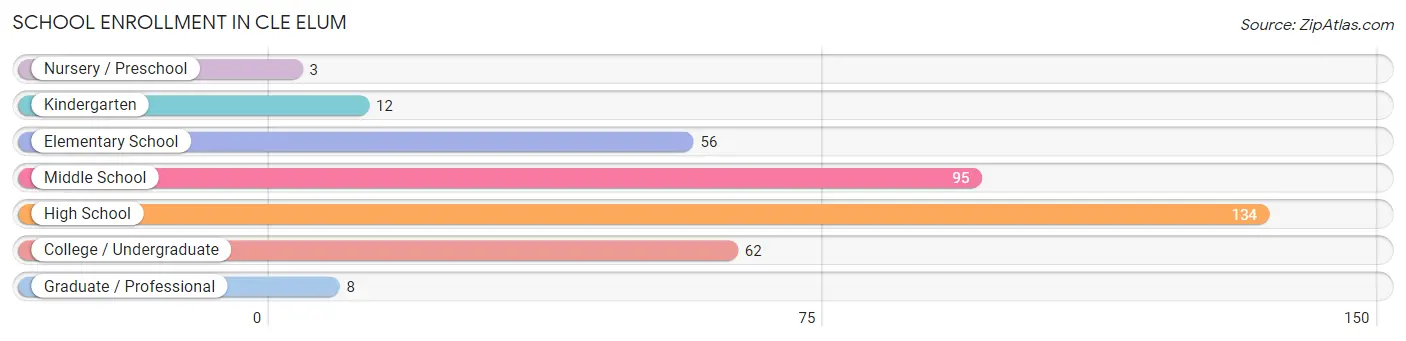
| School Level | # Students | % Students |
| Nursery / Preschool | 3 | 0.8% |
| Kindergarten | 12 | 3.2% |
| Elementary School | 56 | 15.1% |
| Middle School | 95 | 25.7% |
| High School | 134 | 36.2% |
| College / Undergraduate | 62 | 16.8% |
| Graduate / Professional | 8 | 2.2% |
| Total | 370 | 100.0% |
School Enrollment by Age by Funding Source in Cle Elum
Out of a total of 370 students who are enrolled in schools in Cle Elum, 18 (4.9%) attend a private institution, while the remaining 352 (95.1%) are enrolled in public schools. The age group of 35 years and over has the highest likelihood of being enrolled in private schools, with 9 (75.0% in the age bracket) enrolled. Conversely, the age group of 3 to 4 year olds has the lowest likelihood of being enrolled in a private school, with 3 (100.0% in the age bracket) attending a public institution.
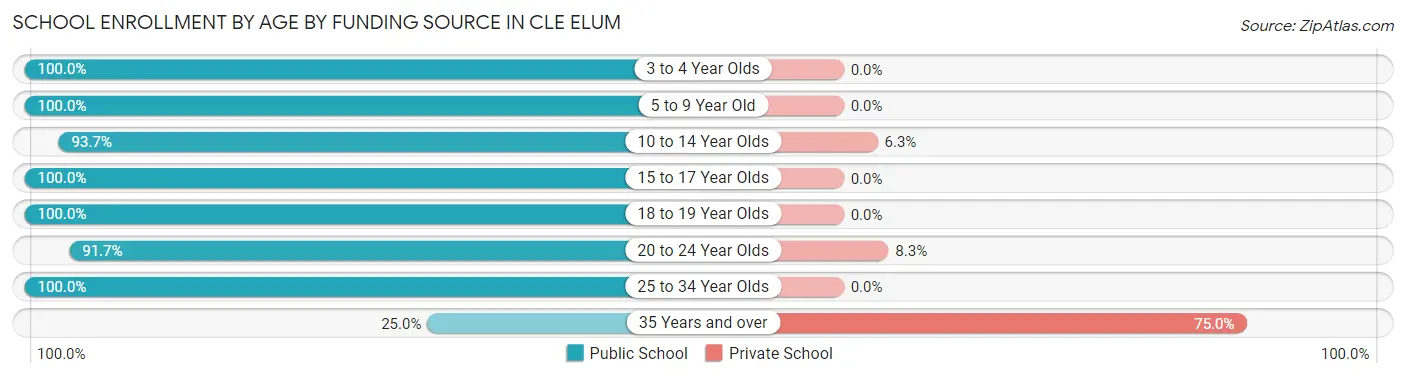
| Age Bracket | Public School | Private School |
| 3 to 4 Year Olds | 3 (100.0%) | 0 (0.0%) |
| 5 to 9 Year Old | 68 (100.0%) | 0 (0.0%) |
| 10 to 14 Year Olds | 89 (93.7%) | 6 (6.3%) |
| 15 to 17 Year Olds | 129 (100.0%) | 0 (0.0%) |
| 18 to 19 Year Olds | 5 (100.0%) | 0 (0.0%) |
| 20 to 24 Year Olds | 33 (91.7%) | 3 (8.3%) |
| 25 to 34 Year Olds | 22 (100.0%) | 0 (0.0%) |
| 35 Years and over | 3 (25.0%) | 9 (75.0%) |
| Total | 352 (95.1%) | 18 (4.9%) |
Educational Attainment by Field of Study in Cle Elum
Science & technology (52 | 23.1%), business (49 | 21.8%), physical & health sciences (18 | 8.0%), liberal arts & history (17 | 7.6%), and visual & performing arts (17 | 7.6%) are the most common fields of study among 225 individuals in Cle Elum who have obtained a bachelor's degree or higher.
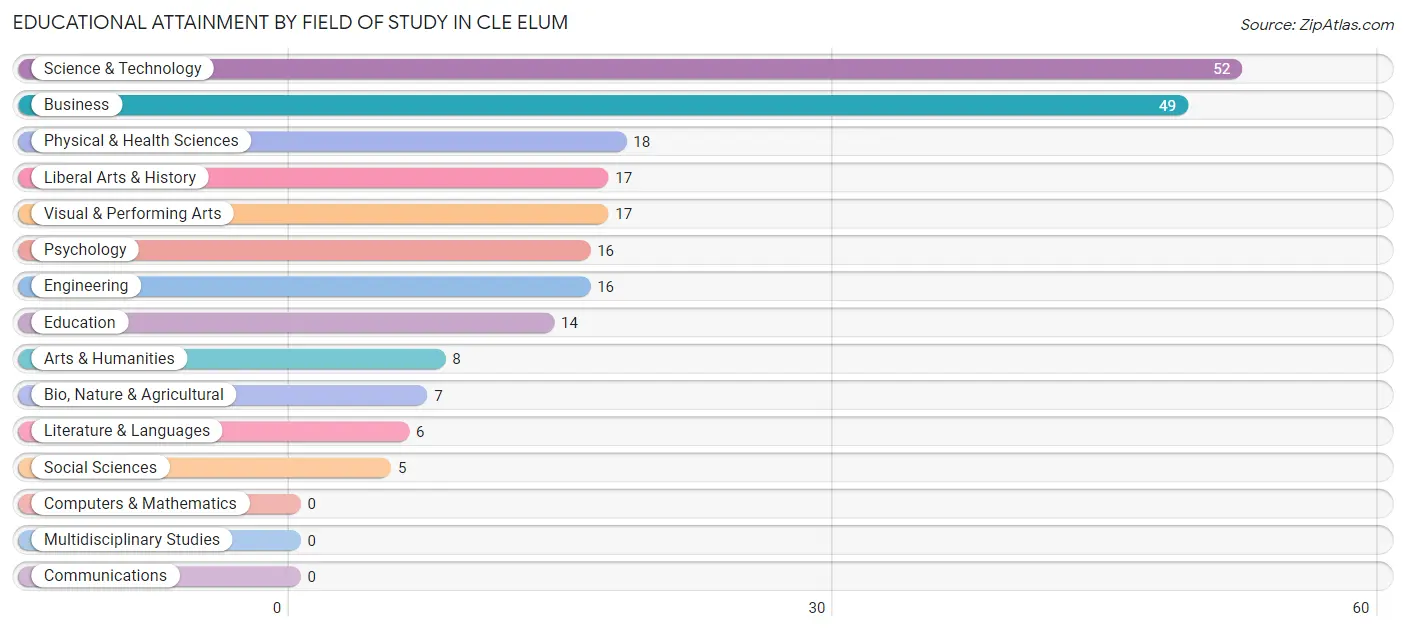
| Field of Study | # Graduates | % Graduates |
| Computers & Mathematics | 0 | 0.0% |
| Bio, Nature & Agricultural | 7 | 3.1% |
| Physical & Health Sciences | 18 | 8.0% |
| Psychology | 16 | 7.1% |
| Social Sciences | 5 | 2.2% |
| Engineering | 16 | 7.1% |
| Multidisciplinary Studies | 0 | 0.0% |
| Science & Technology | 52 | 23.1% |
| Business | 49 | 21.8% |
| Education | 14 | 6.2% |
| Literature & Languages | 6 | 2.7% |
| Liberal Arts & History | 17 | 7.6% |
| Visual & Performing Arts | 17 | 7.6% |
| Communications | 0 | 0.0% |
| Arts & Humanities | 8 | 3.6% |
| Total | 225 | 100.0% |
Transportation & Commute in Cle Elum
Vehicle Availability by Sex in Cle Elum
The most prevalent vehicle ownership categories in Cle Elum are males with 2 vehicles (191, accounting for 33.5%) and females with 2 vehicles (202, making up 40.5%).
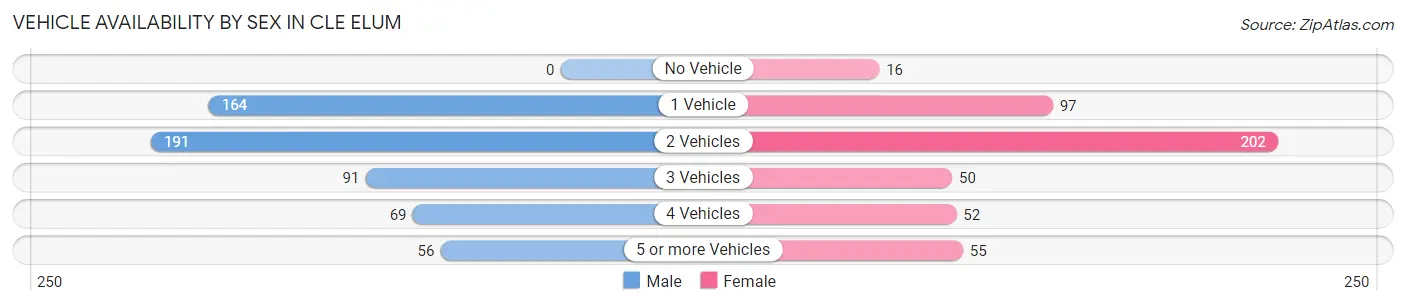
| Vehicles Available | Male | Female |
| No Vehicle | 0 (0.0%) | 16 (3.4%) |
| 1 Vehicle | 164 (28.7%) | 97 (20.5%) |
| 2 Vehicles | 191 (33.5%) | 202 (42.8%) |
| 3 Vehicles | 91 (15.9%) | 50 (10.6%) |
| 4 Vehicles | 69 (12.1%) | 52 (11.0%) |
| 5 or more Vehicles | 56 (9.8%) | 55 (11.7%) |
| Total | 571 (100.0%) | 472 (100.0%) |
Commute Time in Cle Elum
The most frequently occuring commute durations in Cle Elum are 5 to 9 minutes (299 commuters, 32.0%), 15 to 19 minutes (161 commuters, 17.2%), and 10 to 14 minutes (116 commuters, 12.4%).
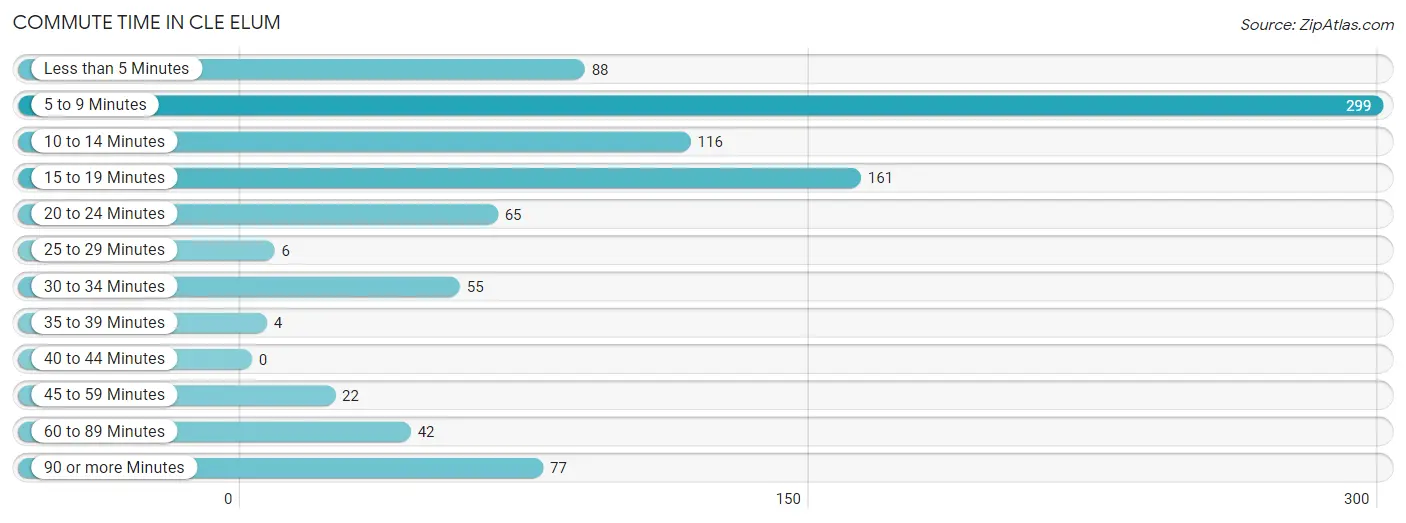
| Commute Time | # Commuters | % Commuters |
| Less than 5 Minutes | 88 | 9.4% |
| 5 to 9 Minutes | 299 | 32.0% |
| 10 to 14 Minutes | 116 | 12.4% |
| 15 to 19 Minutes | 161 | 17.2% |
| 20 to 24 Minutes | 65 | 7.0% |
| 25 to 29 Minutes | 6 | 0.6% |
| 30 to 34 Minutes | 55 | 5.9% |
| 35 to 39 Minutes | 4 | 0.4% |
| 40 to 44 Minutes | 0 | 0.0% |
| 45 to 59 Minutes | 22 | 2.4% |
| 60 to 89 Minutes | 42 | 4.5% |
| 90 or more Minutes | 77 | 8.2% |
Commute Time by Sex in Cle Elum
The most common commute times in Cle Elum are 5 to 9 minutes (175 commuters, 33.0%) for males and 5 to 9 minutes (124 commuters, 30.6%) for females.
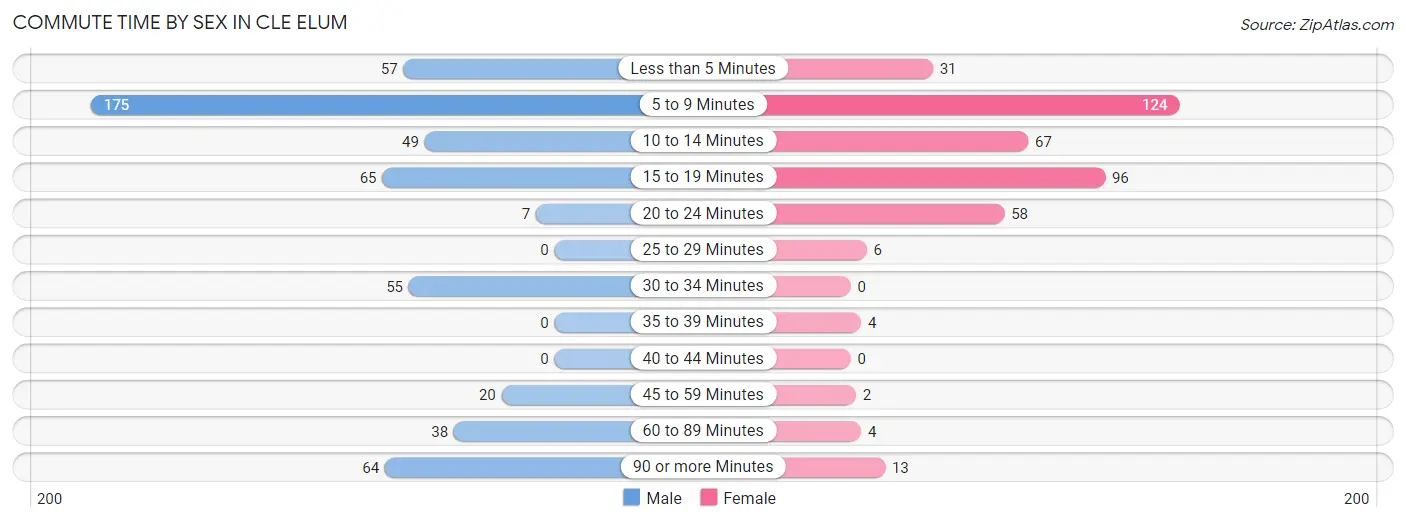
| Commute Time | Male | Female |
| Less than 5 Minutes | 57 (10.7%) | 31 (7.6%) |
| 5 to 9 Minutes | 175 (33.0%) | 124 (30.6%) |
| 10 to 14 Minutes | 49 (9.2%) | 67 (16.5%) |
| 15 to 19 Minutes | 65 (12.3%) | 96 (23.7%) |
| 20 to 24 Minutes | 7 (1.3%) | 58 (14.3%) |
| 25 to 29 Minutes | 0 (0.0%) | 6 (1.5%) |
| 30 to 34 Minutes | 55 (10.4%) | 0 (0.0%) |
| 35 to 39 Minutes | 0 (0.0%) | 4 (1.0%) |
| 40 to 44 Minutes | 0 (0.0%) | 0 (0.0%) |
| 45 to 59 Minutes | 20 (3.8%) | 2 (0.5%) |
| 60 to 89 Minutes | 38 (7.2%) | 4 (1.0%) |
| 90 or more Minutes | 64 (12.1%) | 13 (3.2%) |
Time of Departure to Work by Sex in Cle Elum
The most frequent times of departure to work in Cle Elum are 6:30 AM to 6:59 AM (98, 18.5%) for males and 9:00 AM to 9:59 AM (105, 25.9%) for females.
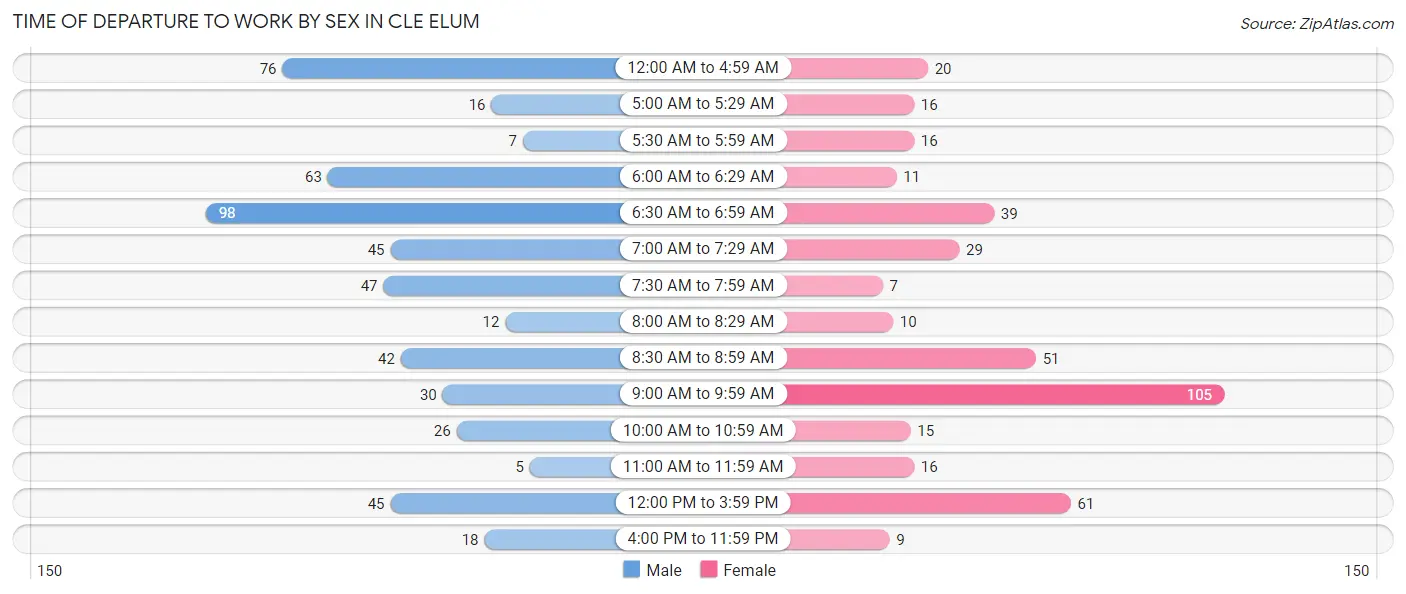
| Time of Departure | Male | Female |
| 12:00 AM to 4:59 AM | 76 (14.3%) | 20 (4.9%) |
| 5:00 AM to 5:29 AM | 16 (3.0%) | 16 (4.0%) |
| 5:30 AM to 5:59 AM | 7 (1.3%) | 16 (4.0%) |
| 6:00 AM to 6:29 AM | 63 (11.9%) | 11 (2.7%) |
| 6:30 AM to 6:59 AM | 98 (18.5%) | 39 (9.6%) |
| 7:00 AM to 7:29 AM | 45 (8.5%) | 29 (7.2%) |
| 7:30 AM to 7:59 AM | 47 (8.9%) | 7 (1.7%) |
| 8:00 AM to 8:29 AM | 12 (2.3%) | 10 (2.5%) |
| 8:30 AM to 8:59 AM | 42 (7.9%) | 51 (12.6%) |
| 9:00 AM to 9:59 AM | 30 (5.7%) | 105 (25.9%) |
| 10:00 AM to 10:59 AM | 26 (4.9%) | 15 (3.7%) |
| 11:00 AM to 11:59 AM | 5 (0.9%) | 16 (4.0%) |
| 12:00 PM to 3:59 PM | 45 (8.5%) | 61 (15.1%) |
| 4:00 PM to 11:59 PM | 18 (3.4%) | 9 (2.2%) |
| Total | 530 (100.0%) | 405 (100.0%) |
Housing Occupancy in Cle Elum
Occupancy by Ownership in Cle Elum
Of the total 1,061 dwellings in Cle Elum, owner-occupied units account for 633 (59.7%), while renter-occupied units make up 428 (40.3%).
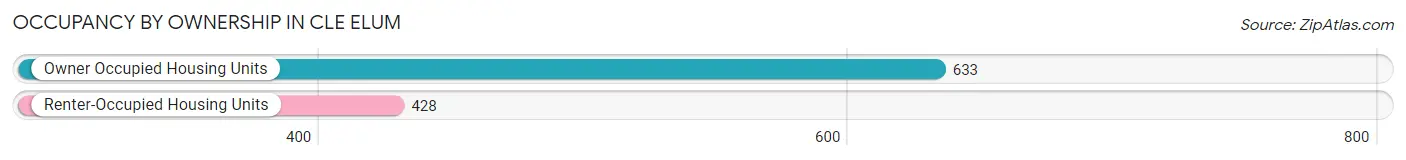
| Occupancy | # Housing Units | % Housing Units |
| Owner Occupied Housing Units | 633 | 59.7% |
| Renter-Occupied Housing Units | 428 | 40.3% |
| Total Occupied Housing Units | 1,061 | 100.0% |
Occupancy by Household Size in Cle Elum
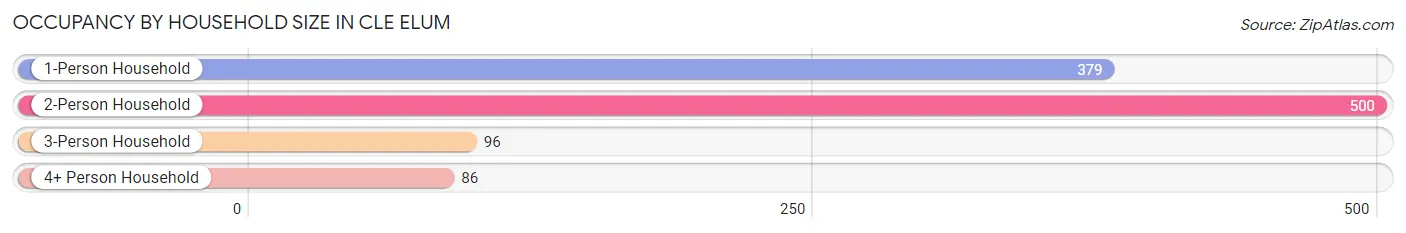
| Household Size | # Housing Units | % Housing Units |
| 1-Person Household | 379 | 35.7% |
| 2-Person Household | 500 | 47.1% |
| 3-Person Household | 96 | 9.0% |
| 4+ Person Household | 86 | 8.1% |
| Total Housing Units | 1,061 | 100.0% |
Occupancy by Ownership by Household Size in Cle Elum
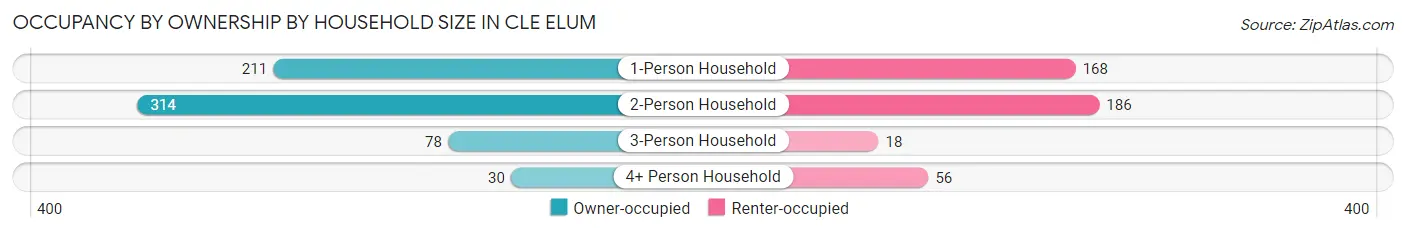
| Household Size | Owner-occupied | Renter-occupied |
| 1-Person Household | 211 (55.7%) | 168 (44.3%) |
| 2-Person Household | 314 (62.8%) | 186 (37.2%) |
| 3-Person Household | 78 (81.2%) | 18 (18.8%) |
| 4+ Person Household | 30 (34.9%) | 56 (65.1%) |
| Total Housing Units | 633 (59.7%) | 428 (40.3%) |
Occupancy by Educational Attainment in Cle Elum
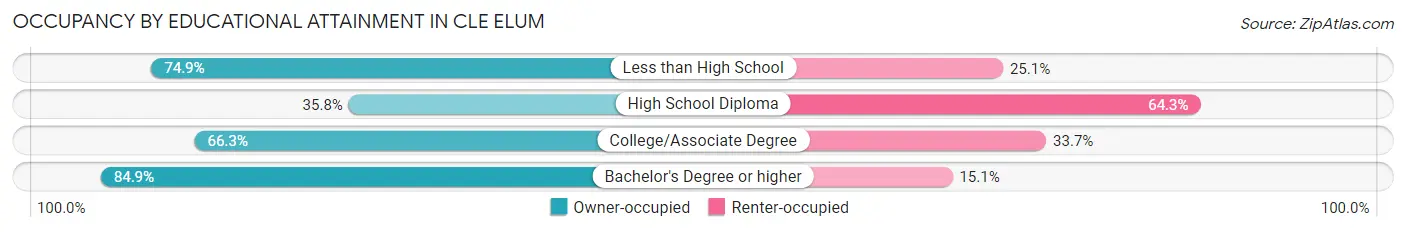
| Household Size | Owner-occupied | Renter-occupied |
| Less than High School | 131 (74.9%) | 44 (25.1%) |
| High School Diploma | 133 (35.7%) | 239 (64.2%) |
| College/Associate Degree | 240 (66.3%) | 122 (33.7%) |
| Bachelor's Degree or higher | 129 (84.9%) | 23 (15.1%) |
Occupancy by Age of Householder in Cle Elum
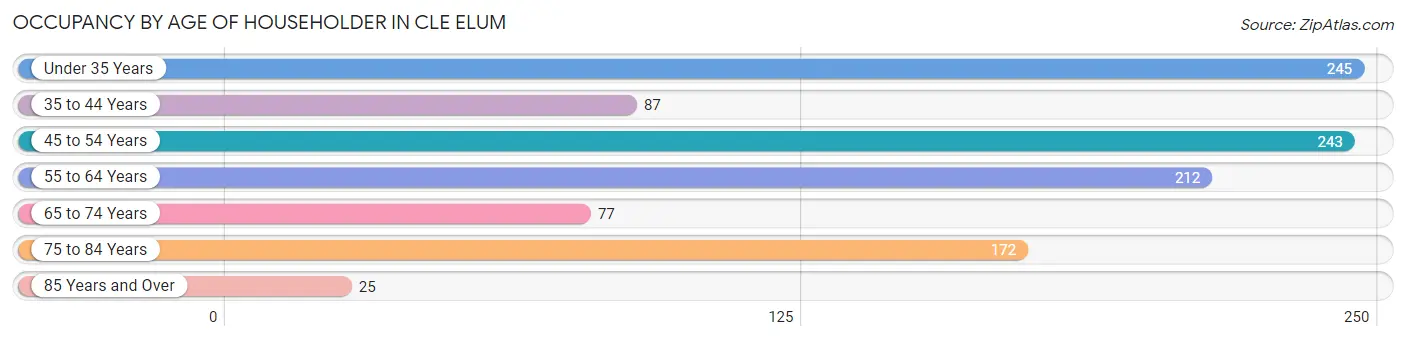
| Age Bracket | # Households | % Households |
| Under 35 Years | 245 | 23.1% |
| 35 to 44 Years | 87 | 8.2% |
| 45 to 54 Years | 243 | 22.9% |
| 55 to 64 Years | 212 | 20.0% |
| 65 to 74 Years | 77 | 7.3% |
| 75 to 84 Years | 172 | 16.2% |
| 85 Years and Over | 25 | 2.4% |
| Total | 1,061 | 100.0% |
Housing Finances in Cle Elum
Median Income by Occupancy in Cle Elum
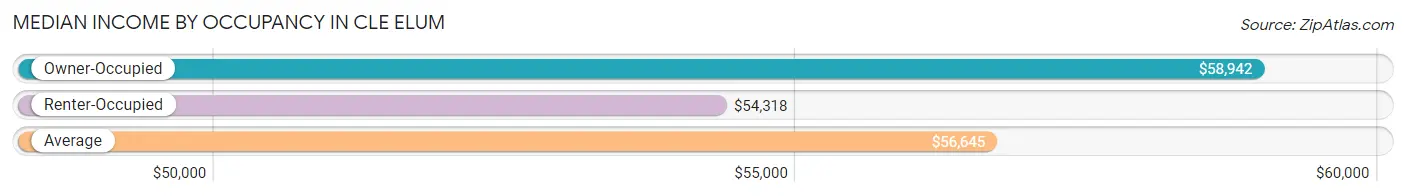
| Occupancy Type | # Households | Median Income |
| Owner-Occupied | 633 (59.7%) | $58,942 |
| Renter-Occupied | 428 (40.3%) | $54,318 |
| Average | 1,061 (100.0%) | $56,645 |
Occupancy by Householder Income Bracket in Cle Elum
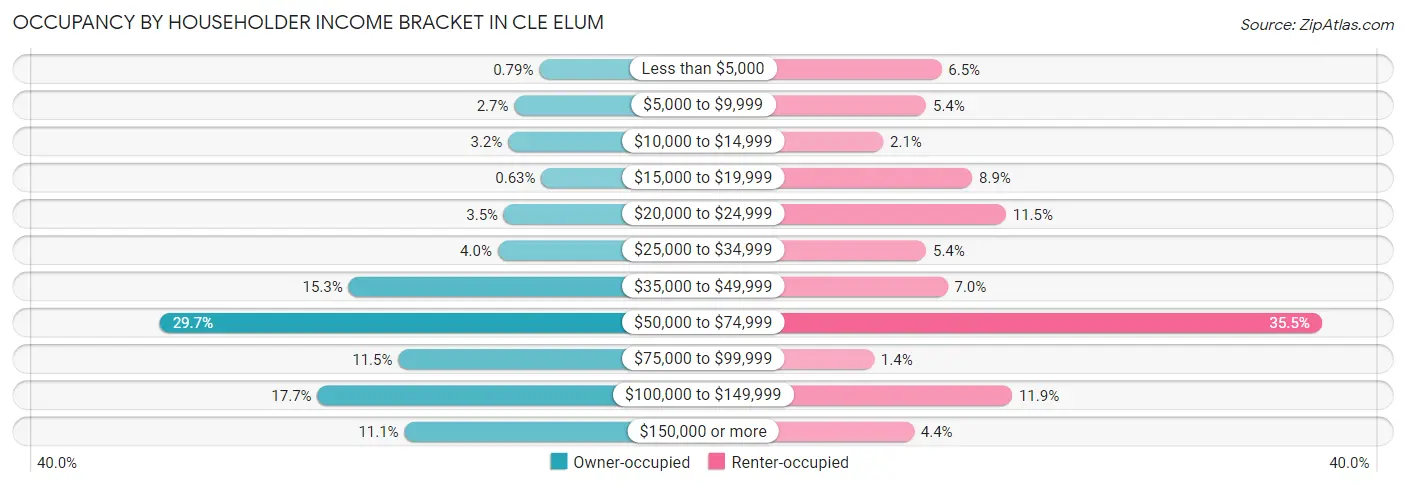
| Income Bracket | Owner-occupied | Renter-occupied |
| Less than $5,000 | 5 (0.8%) | 28 (6.5%) |
| $5,000 to $9,999 | 17 (2.7%) | 23 (5.4%) |
| $10,000 to $14,999 | 20 (3.2%) | 9 (2.1%) |
| $15,000 to $19,999 | 4 (0.6%) | 38 (8.9%) |
| $20,000 to $24,999 | 22 (3.5%) | 49 (11.5%) |
| $25,000 to $34,999 | 25 (4.0%) | 23 (5.4%) |
| $35,000 to $49,999 | 97 (15.3%) | 30 (7.0%) |
| $50,000 to $74,999 | 188 (29.7%) | 152 (35.5%) |
| $75,000 to $99,999 | 73 (11.5%) | 6 (1.4%) |
| $100,000 to $149,999 | 112 (17.7%) | 51 (11.9%) |
| $150,000 or more | 70 (11.1%) | 19 (4.4%) |
| Total | 633 (100.0%) | 428 (100.0%) |
Monthly Housing Cost Tiers in Cle Elum
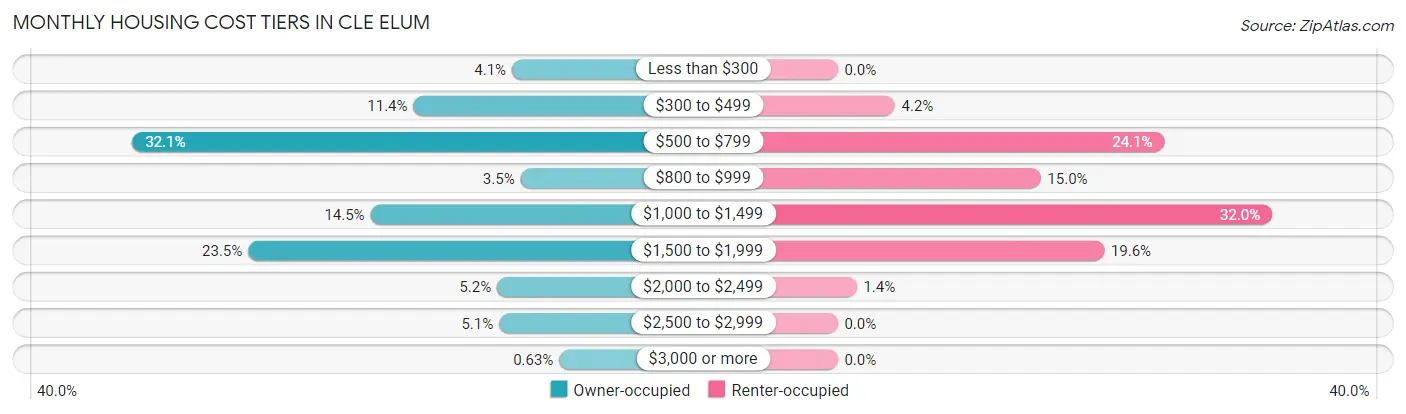
| Monthly Cost | Owner-occupied | Renter-occupied |
| Less than $300 | 26 (4.1%) | 0 (0.0%) |
| $300 to $499 | 72 (11.4%) | 18 (4.2%) |
| $500 to $799 | 203 (32.1%) | 103 (24.1%) |
| $800 to $999 | 22 (3.5%) | 64 (14.9%) |
| $1,000 to $1,499 | 92 (14.5%) | 137 (32.0%) |
| $1,500 to $1,999 | 149 (23.5%) | 84 (19.6%) |
| $2,000 to $2,499 | 33 (5.2%) | 6 (1.4%) |
| $2,500 to $2,999 | 32 (5.1%) | 0 (0.0%) |
| $3,000 or more | 4 (0.6%) | 0 (0.0%) |
| Total | 633 (100.0%) | 428 (100.0%) |
Physical Housing Characteristics in Cle Elum
Housing Structures in Cle Elum
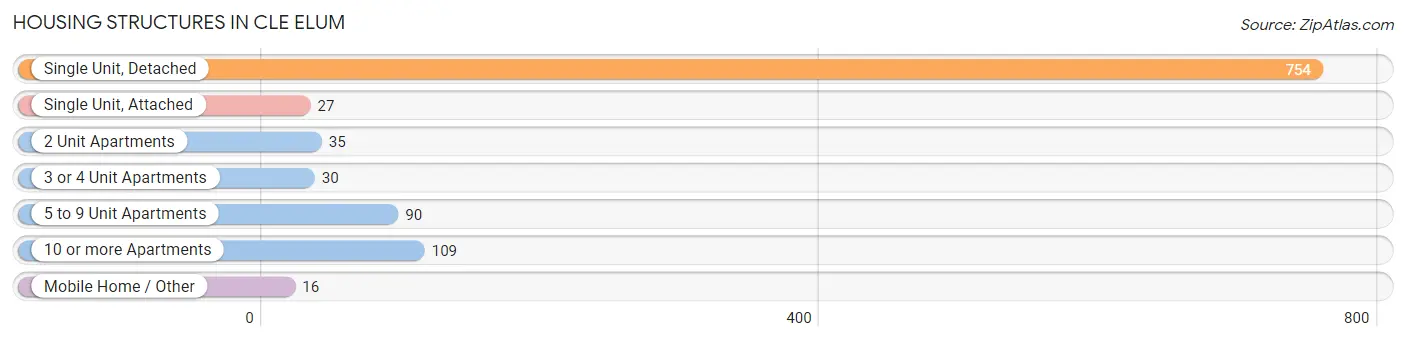
| Structure Type | # Housing Units | % Housing Units |
| Single Unit, Detached | 754 | 71.1% |
| Single Unit, Attached | 27 | 2.5% |
| 2 Unit Apartments | 35 | 3.3% |
| 3 or 4 Unit Apartments | 30 | 2.8% |
| 5 to 9 Unit Apartments | 90 | 8.5% |
| 10 or more Apartments | 109 | 10.3% |
| Mobile Home / Other | 16 | 1.5% |
| Total | 1,061 | 100.0% |
Housing Structures by Occupancy in Cle Elum
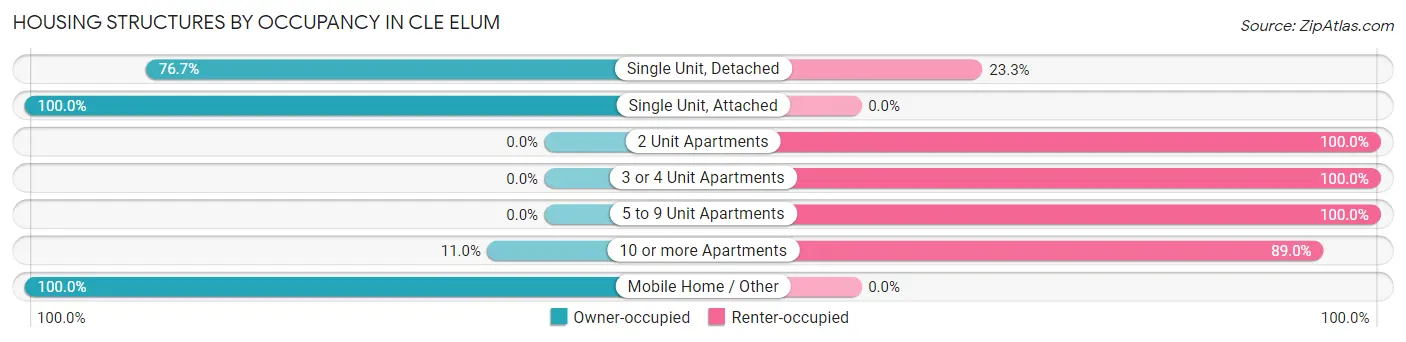
| Structure Type | Owner-occupied | Renter-occupied |
| Single Unit, Detached | 578 (76.7%) | 176 (23.3%) |
| Single Unit, Attached | 27 (100.0%) | 0 (0.0%) |
| 2 Unit Apartments | 0 (0.0%) | 35 (100.0%) |
| 3 or 4 Unit Apartments | 0 (0.0%) | 30 (100.0%) |
| 5 to 9 Unit Apartments | 0 (0.0%) | 90 (100.0%) |
| 10 or more Apartments | 12 (11.0%) | 97 (89.0%) |
| Mobile Home / Other | 16 (100.0%) | 0 (0.0%) |
| Total | 633 (59.7%) | 428 (40.3%) |
Housing Structures by Number of Rooms in Cle Elum
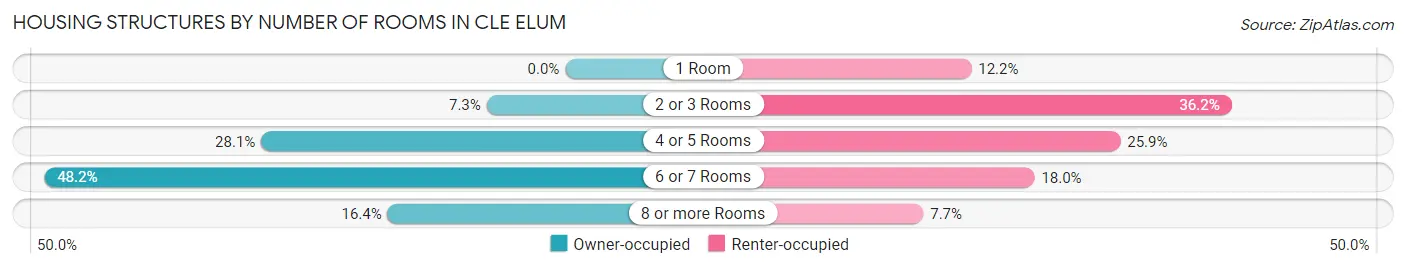
| Number of Rooms | Owner-occupied | Renter-occupied |
| 1 Room | 0 (0.0%) | 52 (12.1%) |
| 2 or 3 Rooms | 46 (7.3%) | 155 (36.2%) |
| 4 or 5 Rooms | 178 (28.1%) | 111 (25.9%) |
| 6 or 7 Rooms | 305 (48.2%) | 77 (18.0%) |
| 8 or more Rooms | 104 (16.4%) | 33 (7.7%) |
| Total | 633 (100.0%) | 428 (100.0%) |
Housing Structure by Heating Type in Cle Elum
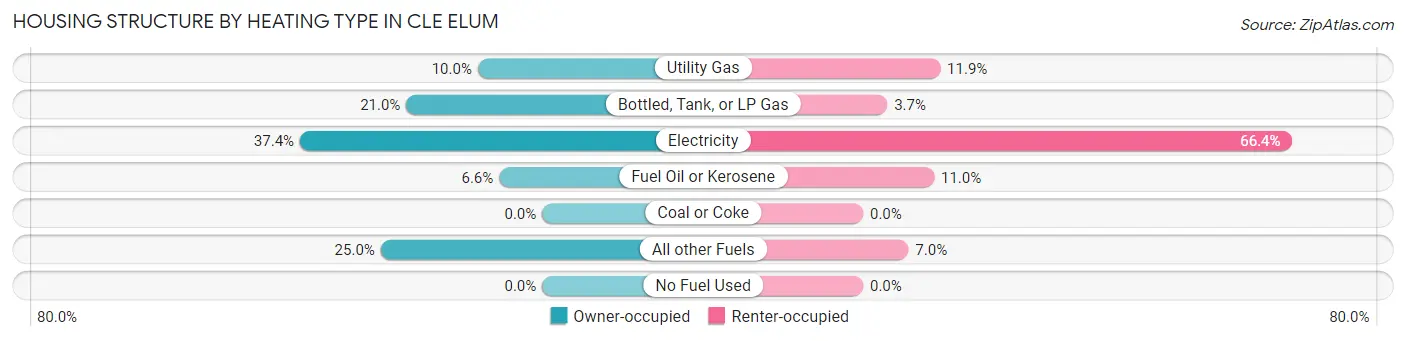
| Heating Type | Owner-occupied | Renter-occupied |
| Utility Gas | 63 (10.0%) | 51 (11.9%) |
| Bottled, Tank, or LP Gas | 133 (21.0%) | 16 (3.7%) |
| Electricity | 237 (37.4%) | 284 (66.4%) |
| Fuel Oil or Kerosene | 42 (6.6%) | 47 (11.0%) |
| Coal or Coke | 0 (0.0%) | 0 (0.0%) |
| All other Fuels | 158 (25.0%) | 30 (7.0%) |
| No Fuel Used | 0 (0.0%) | 0 (0.0%) |
| Total | 633 (100.0%) | 428 (100.0%) |
Household Vehicle Usage in Cle Elum
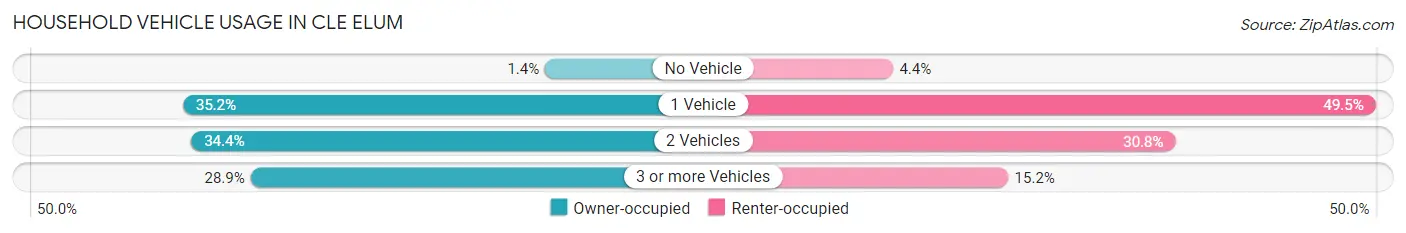
| Vehicles per Household | Owner-occupied | Renter-occupied |
| No Vehicle | 9 (1.4%) | 19 (4.4%) |
| 1 Vehicle | 223 (35.2%) | 212 (49.5%) |
| 2 Vehicles | 218 (34.4%) | 132 (30.8%) |
| 3 or more Vehicles | 183 (28.9%) | 65 (15.2%) |
| Total | 633 (100.0%) | 428 (100.0%) |
Real Estate & Mortgages in Cle Elum
Real Estate and Mortgage Overview in Cle Elum
| Characteristic | Without Mortgage | With Mortgage |
| Housing Units | 324 | 309 |
| Median Property Value | $475,000 | $309,300 |
| Median Household Income | $54,470 | $45 |
| Monthly Housing Costs | $613 | $4 |
| Real Estate Taxes | $2,311 | $0 |
Property Value by Mortgage Status in Cle Elum
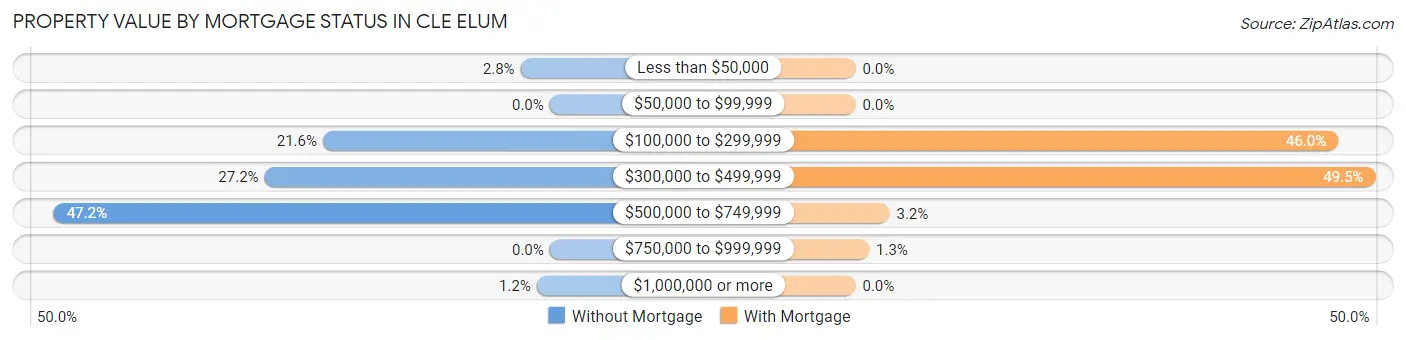
| Property Value | Without Mortgage | With Mortgage |
| Less than $50,000 | 9 (2.8%) | 0 (0.0%) |
| $50,000 to $99,999 | 0 (0.0%) | 0 (0.0%) |
| $100,000 to $299,999 | 70 (21.6%) | 142 (46.0%) |
| $300,000 to $499,999 | 88 (27.2%) | 153 (49.5%) |
| $500,000 to $749,999 | 153 (47.2%) | 10 (3.2%) |
| $750,000 to $999,999 | 0 (0.0%) | 4 (1.3%) |
| $1,000,000 or more | 4 (1.2%) | 0 (0.0%) |
| Total | 324 (100.0%) | 309 (100.0%) |
Household Income by Mortgage Status in Cle Elum
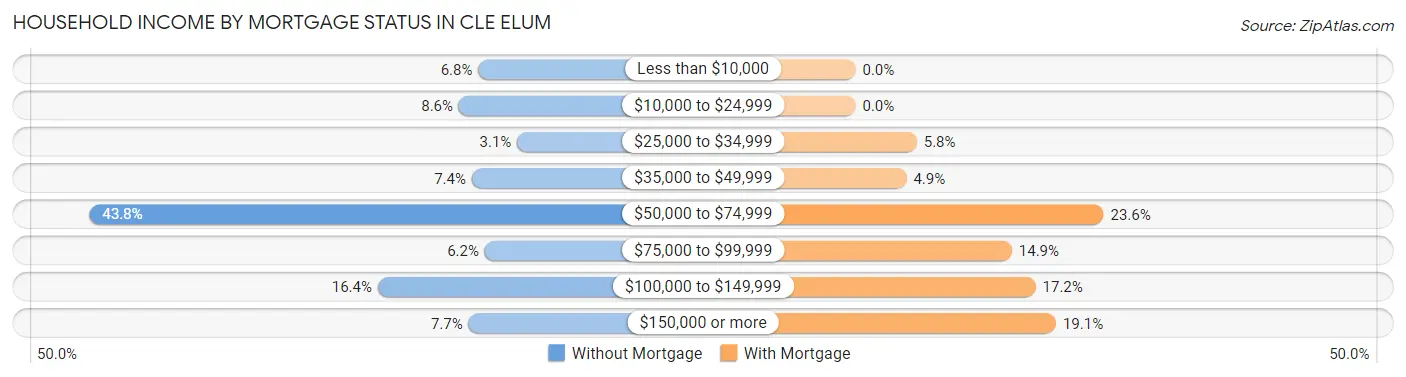
| Household Income | Without Mortgage | With Mortgage |
| Less than $10,000 | 22 (6.8%) | 0 (0.0%) |
| $10,000 to $24,999 | 28 (8.6%) | 0 (0.0%) |
| $25,000 to $34,999 | 10 (3.1%) | 18 (5.8%) |
| $35,000 to $49,999 | 24 (7.4%) | 15 (4.9%) |
| $50,000 to $74,999 | 142 (43.8%) | 73 (23.6%) |
| $75,000 to $99,999 | 20 (6.2%) | 46 (14.9%) |
| $100,000 to $149,999 | 53 (16.4%) | 53 (17.2%) |
| $150,000 or more | 25 (7.7%) | 59 (19.1%) |
| Total | 324 (100.0%) | 309 (100.0%) |
Property Value to Household Income Ratio in Cle Elum
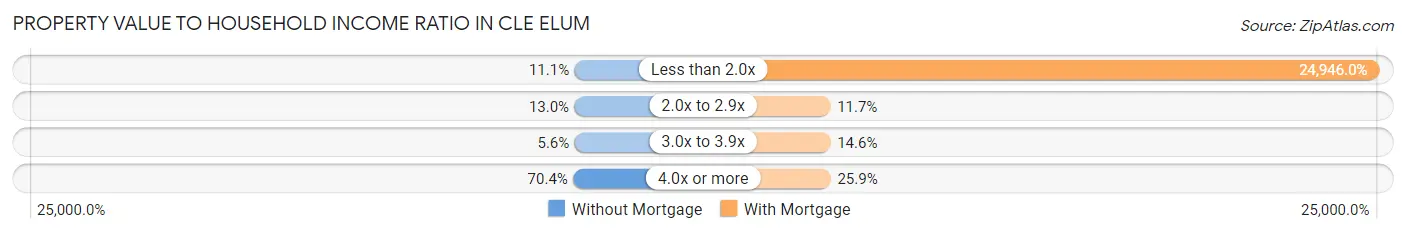
| Value-to-Income Ratio | Without Mortgage | With Mortgage |
| Less than 2.0x | 36 (11.1%) | 77,083 (24,945.9%) |
| 2.0x to 2.9x | 42 (13.0%) | 36 (11.7%) |
| 3.0x to 3.9x | 18 (5.6%) | 45 (14.6%) |
| 4.0x or more | 228 (70.4%) | 80 (25.9%) |
| Total | 324 (100.0%) | 309 (100.0%) |
Real Estate Taxes by Mortgage Status in Cle Elum
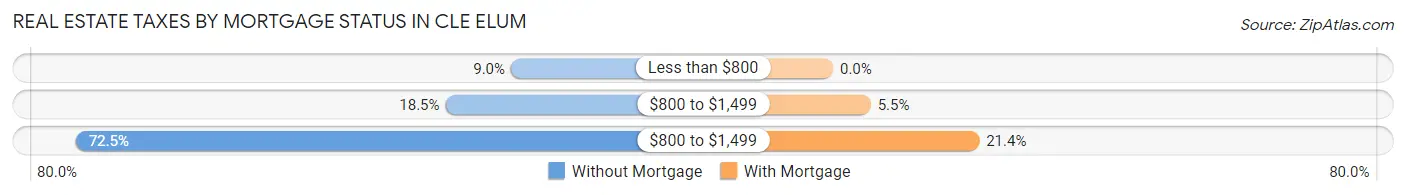
| Property Taxes | Without Mortgage | With Mortgage |
| Less than $800 | 29 (8.9%) | 0 (0.0%) |
| $800 to $1,499 | 60 (18.5%) | 17 (5.5%) |
| $800 to $1,499 | 235 (72.5%) | 66 (21.4%) |
| Total | 324 (100.0%) | 309 (100.0%) |
Health & Disability in Cle Elum
Health Insurance Coverage by Age in Cle Elum
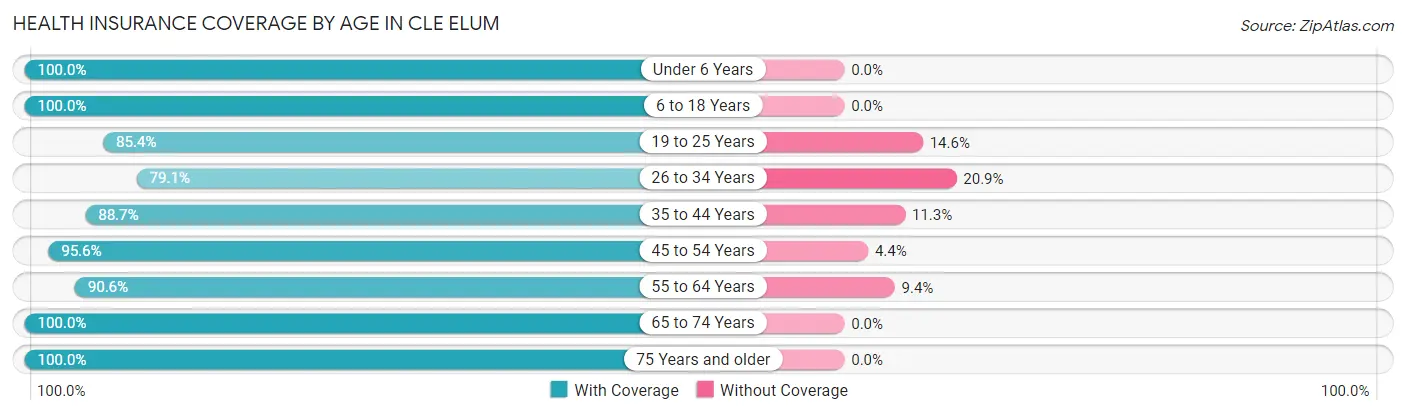
| Age Bracket | With Coverage | Without Coverage |
| Under 6 Years | 60 (100.0%) | 0 (0.0%) |
| 6 to 18 Years | 287 (100.0%) | 0 (0.0%) |
| 19 to 25 Years | 175 (85.4%) | 30 (14.6%) |
| 26 to 34 Years | 193 (79.1%) | 51 (20.9%) |
| 35 to 44 Years | 133 (88.7%) | 17 (11.3%) |
| 45 to 54 Years | 389 (95.6%) | 18 (4.4%) |
| 55 to 64 Years | 290 (90.6%) | 30 (9.4%) |
| 65 to 74 Years | 185 (100.0%) | 0 (0.0%) |
| 75 Years and older | 258 (100.0%) | 0 (0.0%) |
| Total | 1,970 (93.1%) | 146 (6.9%) |
Health Insurance Coverage by Citizenship Status in Cle Elum
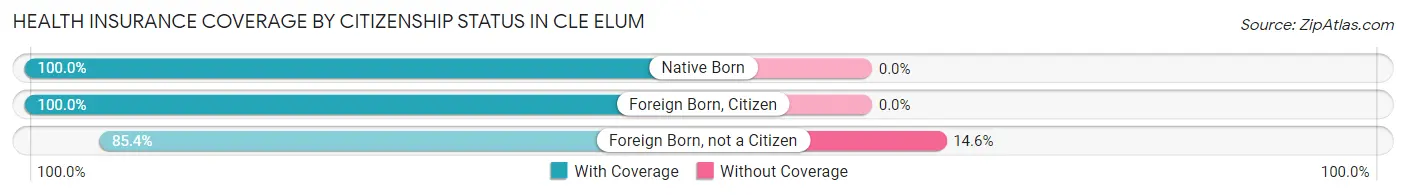
| Citizenship Status | With Coverage | Without Coverage |
| Native Born | 60 (100.0%) | 0 (0.0%) |
| Foreign Born, Citizen | 287 (100.0%) | 0 (0.0%) |
| Foreign Born, not a Citizen | 175 (85.4%) | 30 (14.6%) |
Health Insurance Coverage by Household Income in Cle Elum
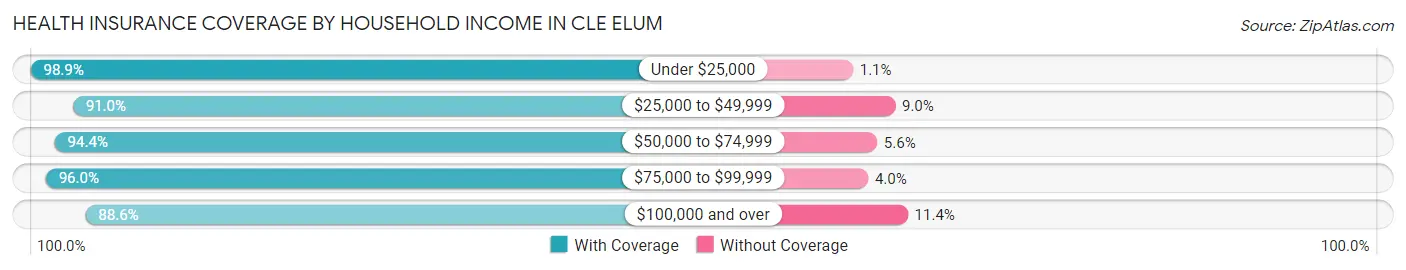
| Household Income | With Coverage | Without Coverage |
| Under $25,000 | 352 (98.9%) | 4 (1.1%) |
| $25,000 to $49,999 | 332 (91.0%) | 33 (9.0%) |
| $50,000 to $74,999 | 636 (94.4%) | 38 (5.6%) |
| $75,000 to $99,999 | 145 (96.0%) | 6 (4.0%) |
| $100,000 and over | 505 (88.6%) | 65 (11.4%) |
Public vs Private Health Insurance Coverage by Age in Cle Elum
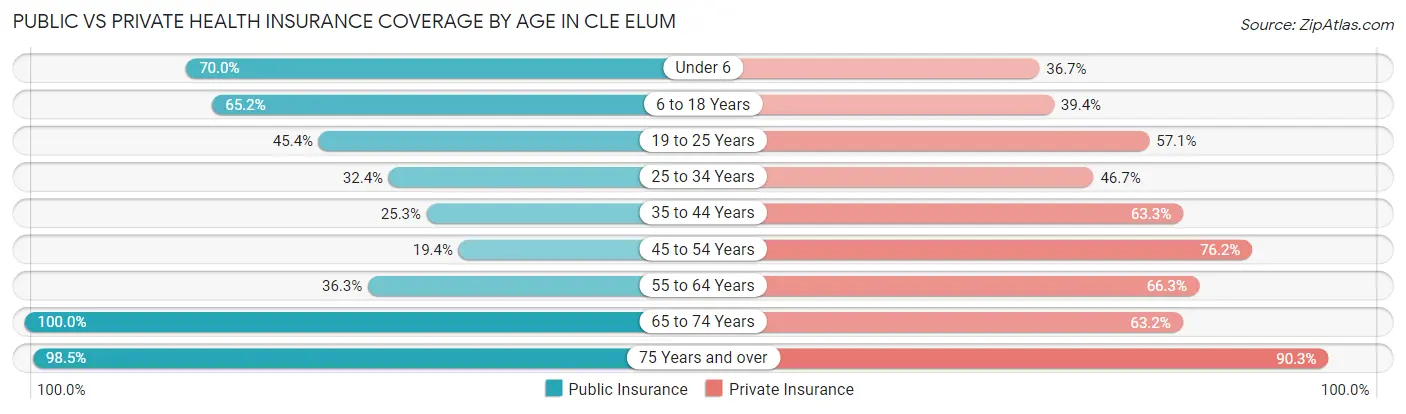
| Age Bracket | Public Insurance | Private Insurance |
| Under 6 | 42 (70.0%) | 22 (36.7%) |
| 6 to 18 Years | 187 (65.2%) | 113 (39.4%) |
| 19 to 25 Years | 93 (45.4%) | 117 (57.1%) |
| 25 to 34 Years | 79 (32.4%) | 114 (46.7%) |
| 35 to 44 Years | 38 (25.3%) | 95 (63.3%) |
| 45 to 54 Years | 79 (19.4%) | 310 (76.2%) |
| 55 to 64 Years | 116 (36.2%) | 212 (66.2%) |
| 65 to 74 Years | 185 (100.0%) | 117 (63.2%) |
| 75 Years and over | 254 (98.5%) | 233 (90.3%) |
| Total | 1,073 (50.7%) | 1,333 (63.0%) |
Disability Status by Sex by Age in Cle Elum
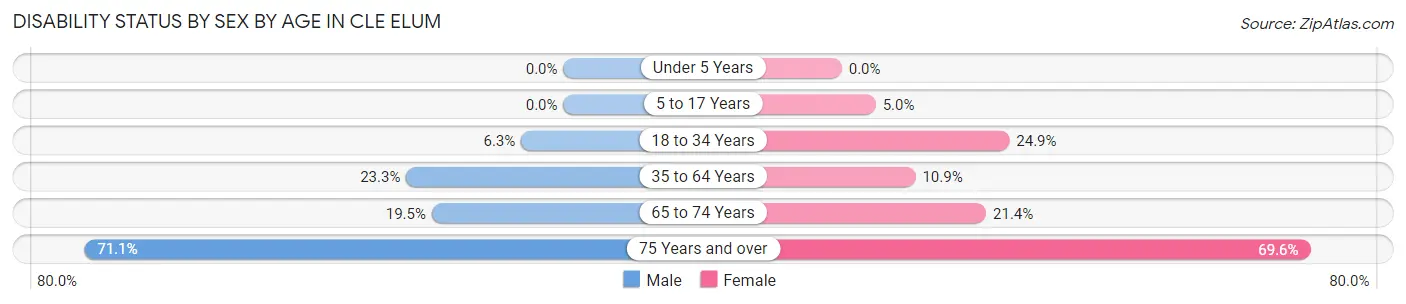
| Age Bracket | Male | Female |
| Under 5 Years | 0 (0.0%) | 0 (0.0%) |
| 5 to 17 Years | 0 (0.0%) | 6 (5.0%) |
| 18 to 34 Years | 16 (6.3%) | 50 (24.9%) |
| 35 to 64 Years | 98 (23.3%) | 50 (10.9%) |
| 65 to 74 Years | 17 (19.5%) | 21 (21.4%) |
| 75 Years and over | 69 (71.1%) | 112 (69.6%) |
Disability Class by Sex by Age in Cle Elum
Disability Class: Hearing Difficulty
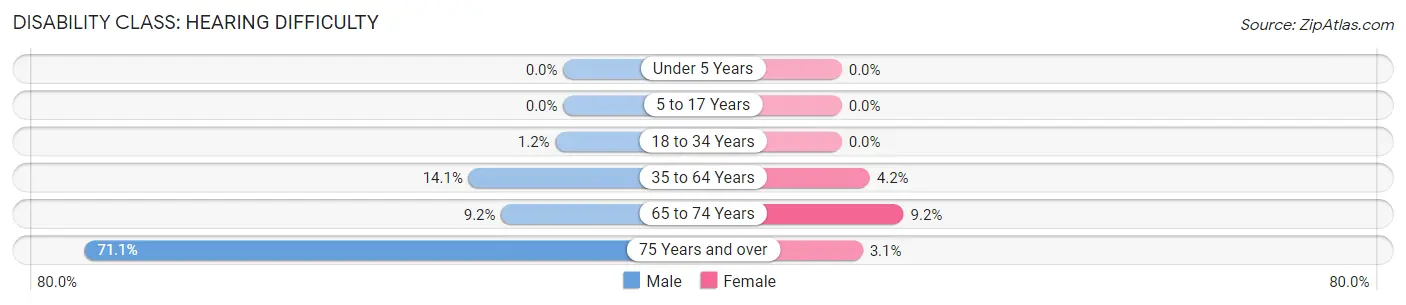
| Age Bracket | Male | Female |
| Under 5 Years | 0 (0.0%) | 0 (0.0%) |
| 5 to 17 Years | 0 (0.0%) | 0 (0.0%) |
| 18 to 34 Years | 3 (1.2%) | 0 (0.0%) |
| 35 to 64 Years | 59 (14.1%) | 19 (4.2%) |
| 65 to 74 Years | 8 (9.2%) | 9 (9.2%) |
| 75 Years and over | 69 (71.1%) | 5 (3.1%) |
Disability Class: Vision Difficulty
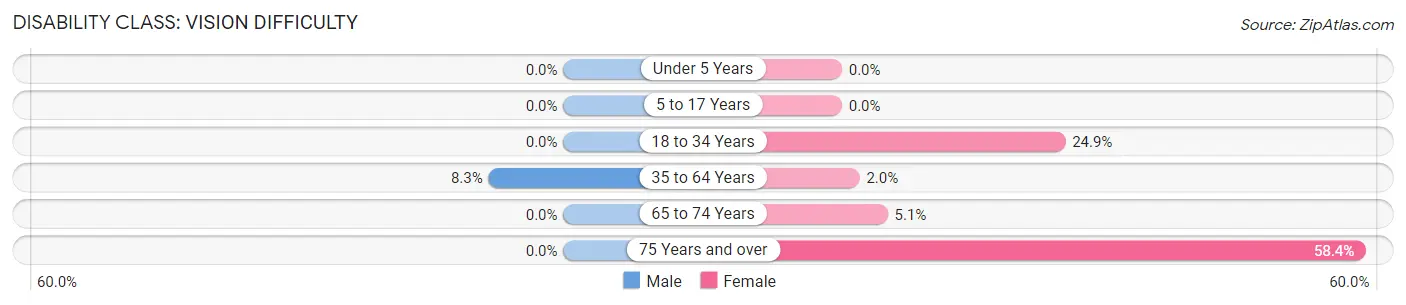
| Age Bracket | Male | Female |
| Under 5 Years | 0 (0.0%) | 0 (0.0%) |
| 5 to 17 Years | 0 (0.0%) | 0 (0.0%) |
| 18 to 34 Years | 0 (0.0%) | 50 (24.9%) |
| 35 to 64 Years | 35 (8.3%) | 9 (2.0%) |
| 65 to 74 Years | 0 (0.0%) | 5 (5.1%) |
| 75 Years and over | 0 (0.0%) | 94 (58.4%) |
Disability Class: Cognitive Difficulty
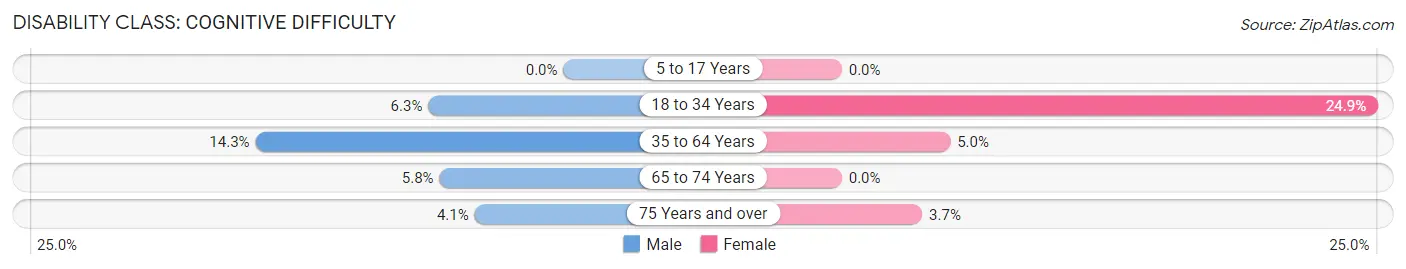
| Age Bracket | Male | Female |
| 5 to 17 Years | 0 (0.0%) | 0 (0.0%) |
| 18 to 34 Years | 16 (6.3%) | 50 (24.9%) |
| 35 to 64 Years | 60 (14.3%) | 23 (5.0%) |
| 65 to 74 Years | 5 (5.8%) | 0 (0.0%) |
| 75 Years and over | 4 (4.1%) | 6 (3.7%) |
Disability Class: Ambulatory Difficulty
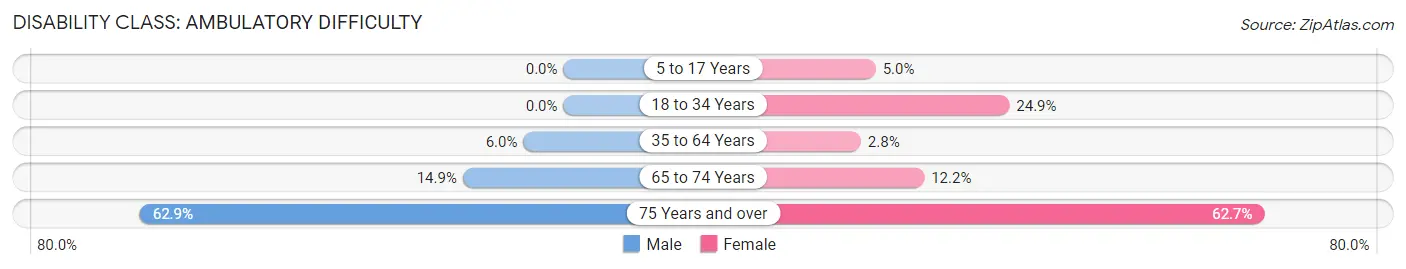
| Age Bracket | Male | Female |
| 5 to 17 Years | 0 (0.0%) | 6 (5.0%) |
| 18 to 34 Years | 0 (0.0%) | 50 (24.9%) |
| 35 to 64 Years | 25 (5.9%) | 13 (2.8%) |
| 65 to 74 Years | 13 (14.9%) | 12 (12.2%) |
| 75 Years and over | 61 (62.9%) | 101 (62.7%) |
Disability Class: Self-Care Difficulty
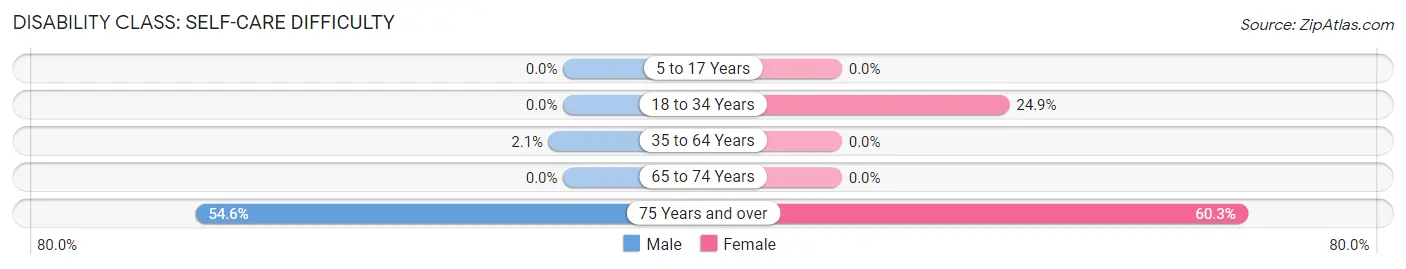
| Age Bracket | Male | Female |
| 5 to 17 Years | 0 (0.0%) | 0 (0.0%) |
| 18 to 34 Years | 0 (0.0%) | 50 (24.9%) |
| 35 to 64 Years | 9 (2.1%) | 0 (0.0%) |
| 65 to 74 Years | 0 (0.0%) | 0 (0.0%) |
| 75 Years and over | 53 (54.6%) | 97 (60.3%) |
Technology Access in Cle Elum
Computing Device Access in Cle Elum
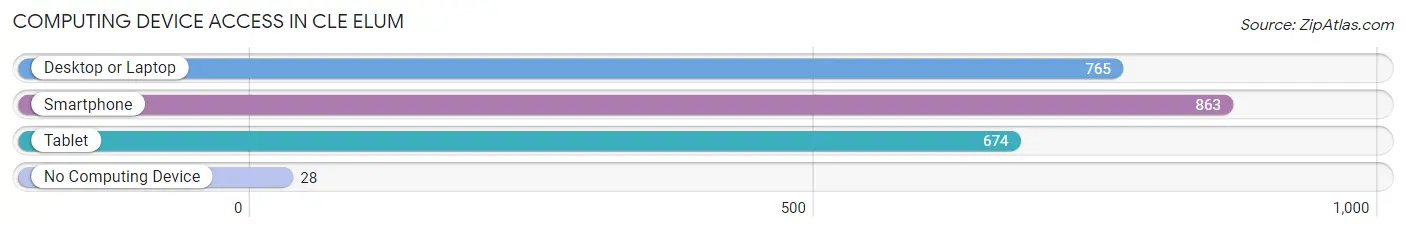
| Device Type | # Households | % Households |
| Desktop or Laptop | 765 | 72.1% |
| Smartphone | 863 | 81.3% |
| Tablet | 674 | 63.5% |
| No Computing Device | 28 | 2.6% |
| Total | 1,061 | 100.0% |
Internet Access in Cle Elum
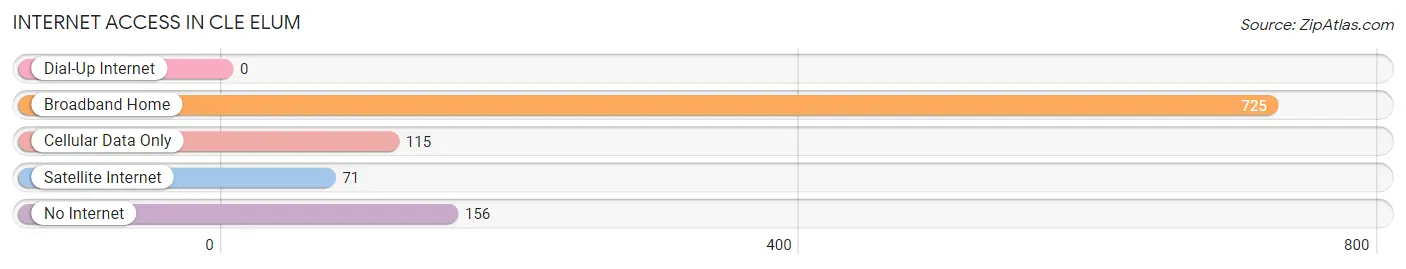
| Internet Type | # Households | % Households |
| Dial-Up Internet | 0 | 0.0% |
| Broadband Home | 725 | 68.3% |
| Cellular Data Only | 115 | 10.8% |
| Satellite Internet | 71 | 6.7% |
| No Internet | 156 | 14.7% |
| Total | 1,061 | 100.0% |
Cle Elum Summary
Introduction
Cle Elum is a small city located in Kittitas County, Washington, United States. It is situated in the Cascade Mountains, approximately 80 miles east of Seattle. The city is known for its outdoor recreation opportunities, including skiing, hiking, camping, and fishing. The population of Cle Elum was 1,869 at the 2010 census.
History
The area around Cle Elum was first inhabited by the Yakama and Kittitas tribes. The first white settlers arrived in the area in the late 1800s, and the town was officially incorporated in 1902. The name “Cle Elum” is derived from the Native American word for “swift water”.
The town was originally a mining and logging community, and the local economy was heavily dependent on these industries. In the early 1900s, the Northern Pacific Railway built a line through the town, which helped to spur economic growth. The town also became a popular tourist destination, as visitors flocked to the area to enjoy the outdoor recreation opportunities.
Geography
Cle Elum is located in the Cascade Mountains of Washington State, approximately 80 miles east of Seattle. The city is situated at an elevation of 2,400 feet, and is surrounded by mountains and forests. The city is located on the banks of the Cle Elum River, which is a tributary of the Yakima River.
The climate in Cle Elum is generally mild, with warm summers and cold winters. The average annual temperature is 45 degrees Fahrenheit, and the average annual precipitation is 18 inches.
Economy
The economy of Cle Elum is largely based on tourism and outdoor recreation. The city is home to several ski resorts, including the Summit at Snoqualmie and the Summit West Ski Area. The city also offers a variety of outdoor activities, such as hiking, camping, fishing, and hunting.
In addition to tourism, the city is also home to several manufacturing and technology companies. The city is home to the Cle Elum Manufacturing Company, which produces a variety of products, including furniture, tools, and automotive parts. The city is also home to several technology companies, including Microsoft, Amazon, and Google.
Demographics
As of the 2010 census, the population of Cle Elum was 1,869. The racial makeup of the city was 91.3% White, 0.7% African American, 0.7% Native American, 0.7% Asian, 0.2% Pacific Islander, 4.2% from other races, and 2.1% from two or more races. Hispanic or Latino of any race were 8.2% of the population.
The median income for a household in Cle Elum was $41,250, and the median income for a family was $50,000. The per capita income for the city was $20,945. About 11.2% of families and 14.2% of the population were below the poverty line, including 18.2% of those under age 18 and 8.3% of those age 65 or over.
Conclusion
Cle Elum is a small city located in the Cascade Mountains of Washington State. The city is known for its outdoor recreation opportunities, and the local economy is largely based on tourism and outdoor recreation. The population of Cle Elum was 1,869 at the 2010 census, and the racial makeup of the city was 91.3% White, 0.7% African American, 0.7% Native American, 0.7% Asian, 0.2% Pacific Islander, 4.2% from other races, and 2.1% from two or more races. The median income for a household in Cle Elum was $41,250, and the median income for a family was $50,000. The city is home to several ski resorts, manufacturing companies, and technology companies.
Common Questions
What is Per Capita Income in Cle Elum?
Per Capita income in Cle Elum is $37,551.
What is the Median Family Income in Cle Elum?
Median Family Income in Cle Elum is $63,309.
What is the Median Household income in Cle Elum?
Median Household Income in Cle Elum is $56,645.
What is Income or Wage Gap in Cle Elum?
Income or Wage Gap in Cle Elum is 33.9%.
Women in Cle Elum earn 66.1 cents for every dollar earned by a man.
What is Inequality or Gini Index in Cle Elum?
Inequality or Gini Index in Cle Elum is 0.44.
What is the Total Population of Cle Elum?
Total Population of Cle Elum is 2,116.
What is the Total Male Population of Cle Elum?
Total Male Population of Cle Elum is 1,032.
What is the Total Female Population of Cle Elum?
Total Female Population of Cle Elum is 1,084.
What is the Ratio of Males per 100 Females in Cle Elum?
There are 95.20 Males per 100 Females in Cle Elum.
What is the Ratio of Females per 100 Males in Cle Elum?
There are 105.04 Females per 100 Males in Cle Elum.
What is the Median Population Age in Cle Elum?
Median Population Age in Cle Elum is 48.6 Years.
What is the Average Family Size in Cle Elum
Average Family Size in Cle Elum is 2.8 People.
What is the Average Household Size in Cle Elum
Average Household Size in Cle Elum is 2.0 People.
How Large is the Labor Force in Cle Elum?
There are 1,086 People in the Labor Forcein in Cle Elum.
What is the Percentage of People in the Labor Force in Cle Elum?
57.8% of People are in the Labor Force in Cle Elum.
What is the Unemployment Rate in Cle Elum?
Unemployment Rate in Cle Elum is 2.2%.