Westport, WA Map & Demographics
Westport Map
Westport Overview
$31,523
PER CAPITA INCOME
$86,853
AVG FAMILY INCOME
$54,271
AVG HOUSEHOLD INCOME
12.5%
WAGE / INCOME GAP [ % ]
87.5¢/ $1
WAGE / INCOME GAP [ $ ]
0.45
INEQUALITY / GINI INDEX
2,498
TOTAL POPULATION
1,185
MALE POPULATION
1,313
FEMALE POPULATION
90.25
MALES / 100 FEMALES
110.80
FEMALES / 100 MALES
40.3
MEDIAN AGE
3.5
AVG FAMILY SIZE
2.4
AVG HOUSEHOLD SIZE
967
LABOR FORCE [ PEOPLE ]
49.4%
PERCENT IN LABOR FORCE
2.1%
UNEMPLOYMENT RATE
Westport Zip Codes
Westport Area Codes
Income in Westport
Income Overview in Westport
Per Capita Income in Westport is $31,523, while median incomes of families and households are $86,853 and $54,271 respectively.
| Characteristic | Number | Measure |
| Per Capita Income | 2,498 | $31,523 |
| Median Family Income | 548 | $86,853 |
| Mean Family Income | 548 | $82,454 |
| Median Household Income | 1,042 | $54,271 |
| Mean Household Income | 1,042 | $69,039 |
| Income Deficit | 548 | $0 |
| Wage / Income Gap (%) | 2,498 | 12.47% |
| Wage / Income Gap ($) | 2,498 | 87.53¢ per $1 |
| Gini / Inequality Index | 2,498 | 0.45 |
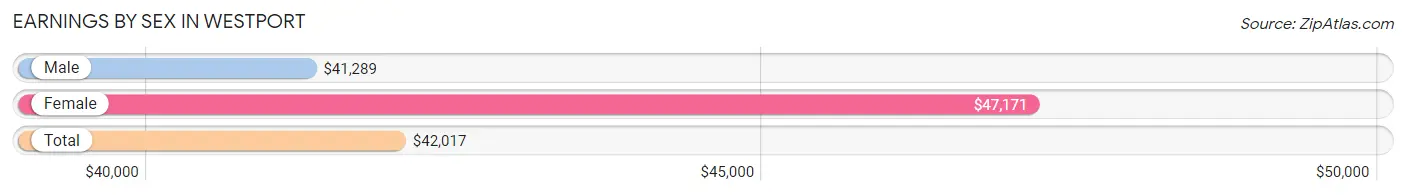
Earnings by Sex in Westport
Average Earnings in Westport are $42,017, $41,289 for men and $47,171 for women, a difference of 12.5%.
| Sex | Number | Average Earnings |
| Male | 596 (55.4%) | $41,289 |
| Female | 479 (44.6%) | $47,171 |
| Total | 1,075 (100.0%) | $42,017 |
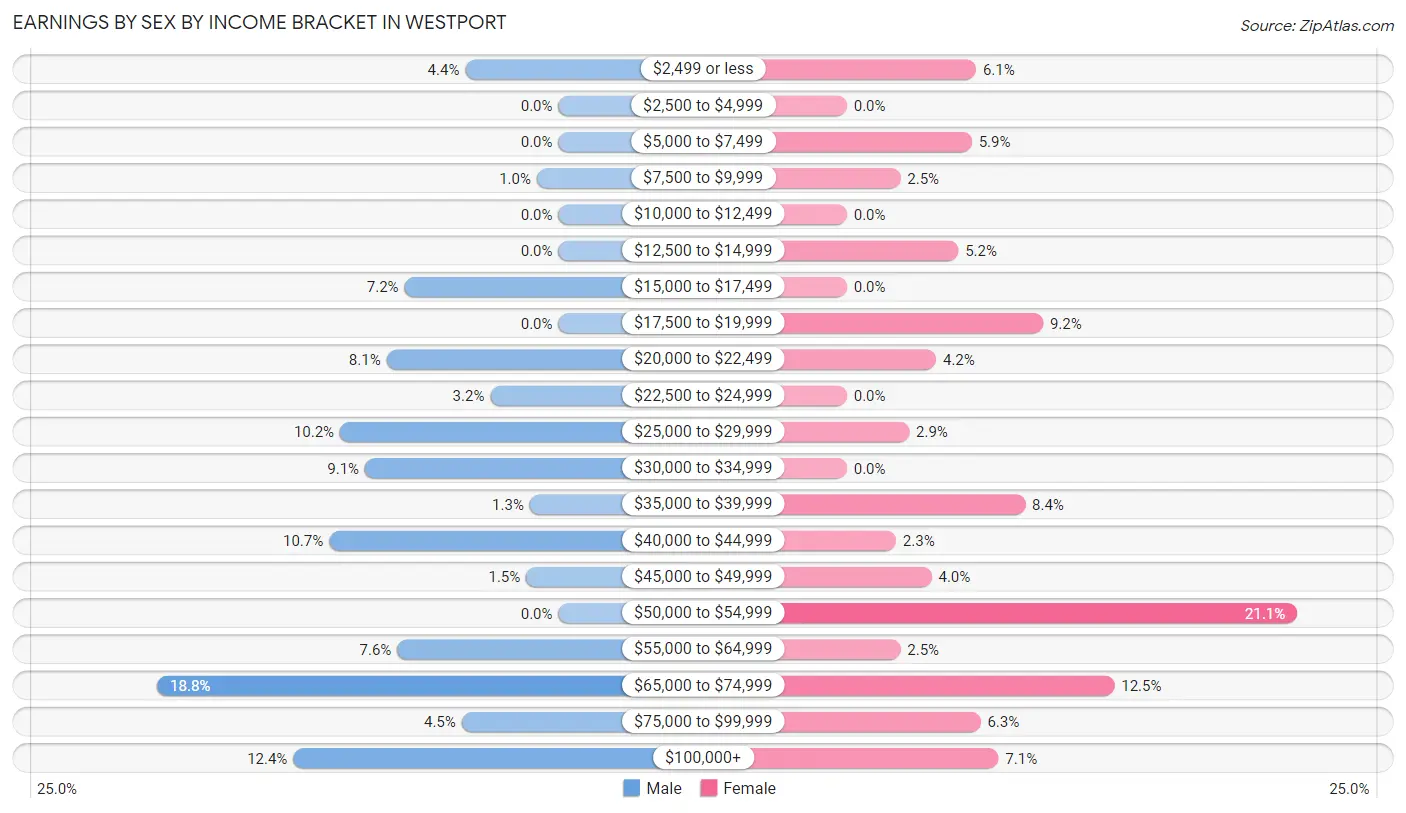
Earnings by Sex by Income Bracket in Westport
The most common earnings brackets in Westport are $65,000 to $74,999 for men (112 | 18.8%) and $50,000 to $54,999 for women (101 | 21.1%).
| Income | Male | Female |
| $2,499 or less | 26 (4.4%) | 29 (6.0%) |
| $2,500 to $4,999 | 0 (0.0%) | 0 (0.0%) |
| $5,000 to $7,499 | 0 (0.0%) | 28 (5.9%) |
| $7,500 to $9,999 | 6 (1.0%) | 12 (2.5%) |
| $10,000 to $12,499 | 0 (0.0%) | 0 (0.0%) |
| $12,500 to $14,999 | 0 (0.0%) | 25 (5.2%) |
| $15,000 to $17,499 | 43 (7.2%) | 0 (0.0%) |
| $17,500 to $19,999 | 0 (0.0%) | 44 (9.2%) |
| $20,000 to $22,499 | 48 (8.1%) | 20 (4.2%) |
| $22,500 to $24,999 | 19 (3.2%) | 0 (0.0%) |
| $25,000 to $29,999 | 61 (10.2%) | 14 (2.9%) |
| $30,000 to $34,999 | 54 (9.1%) | 0 (0.0%) |
| $35,000 to $39,999 | 8 (1.3%) | 40 (8.4%) |
| $40,000 to $44,999 | 64 (10.7%) | 11 (2.3%) |
| $45,000 to $49,999 | 9 (1.5%) | 19 (4.0%) |
| $50,000 to $54,999 | 0 (0.0%) | 101 (21.1%) |
| $55,000 to $64,999 | 45 (7.5%) | 12 (2.5%) |
| $65,000 to $74,999 | 112 (18.8%) | 60 (12.5%) |
| $75,000 to $99,999 | 27 (4.5%) | 30 (6.3%) |
| $100,000+ | 74 (12.4%) | 34 (7.1%) |
| Total | 596 (100.0%) | 479 (100.0%) |
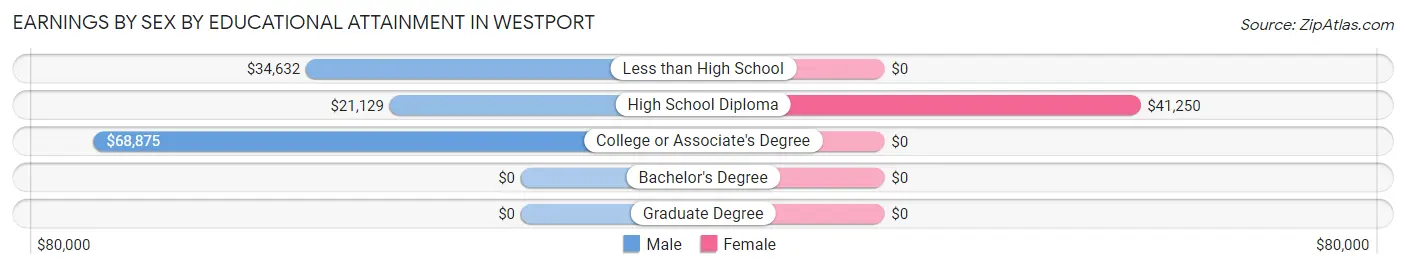
Earnings by Sex by Educational Attainment in Westport
Average earnings in Westport are $55,250 for men and $45,066 for women, a difference of 18.4%. Men with an educational attainment of college or associate's degree enjoy the highest average annual earnings of $68,875, while those with high school diploma education earn the least with $21,129. Women with an educational attainment of high school diploma earn the most with the average annual earnings of $41,250, while those with high school diploma education have the smallest earnings of $41,250.
| Educational Attainment | Male Income | Female Income |
| Less than High School | $34,632 | $0 |
| High School Diploma | $21,129 | $41,250 |
| College or Associate's Degree | $68,875 | $0 |
| Bachelor's Degree | - | - |
| Graduate Degree | - | - |
| Total | $55,250 | $45,066 |
Family Income in Westport
Family Income Brackets in Westport
According to the Westport family income data, there are 156 families falling into the $75,000 to $99,999 income range, which is the most common income bracket and makes up 28.5% of all families.
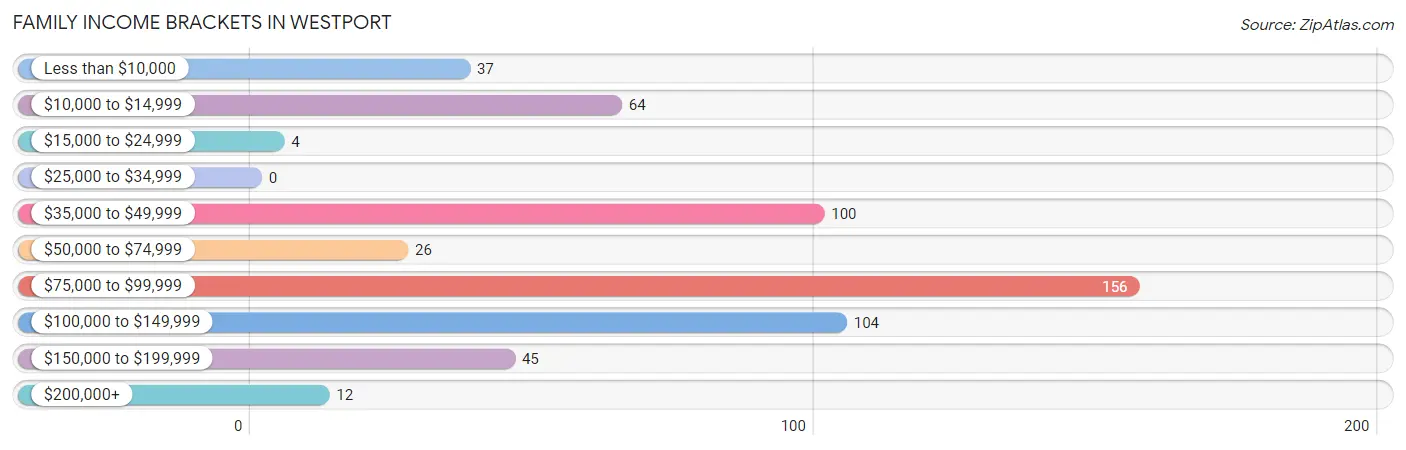
| Income Bracket | # Families | % Families |
| Less than $10,000 | 37 | 6.8% |
| $10,000 to $14,999 | 64 | 11.7% |
| $15,000 to $24,999 | 4 | 0.7% |
| $25,000 to $34,999 | 0 | 0.0% |
| $35,000 to $49,999 | 100 | 18.2% |
| $50,000 to $74,999 | 26 | 4.7% |
| $75,000 to $99,999 | 156 | 28.5% |
| $100,000 to $149,999 | 104 | 19.0% |
| $150,000 to $199,999 | 45 | 8.2% |
| $200,000+ | 12 | 2.2% |
Family Income by Famaliy Size in Westport
2-person families (210 | 38.3%) account for the highest median family income in Westport with $97,321 per family, while 2-person families (210 | 38.3%) have the highest median income of $48,660 per family member.
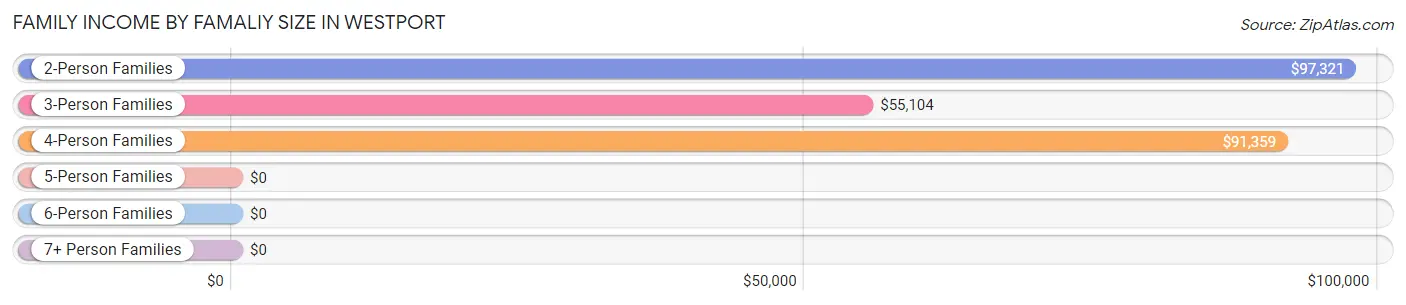
| Income Bracket | # Families | Median Income |
| 2-Person Families | 210 (38.3%) | $97,321 |
| 3-Person Families | 209 (38.1%) | $55,104 |
| 4-Person Families | 77 (14.1%) | $91,359 |
| 5-Person Families | 0 (0.0%) | $0 |
| 6-Person Families | 17 (3.1%) | $0 |
| 7+ Person Families | 35 (6.4%) | $0 |
| Total | 548 (100.0%) | $86,853 |
Family Income by Number of Earners in Westport
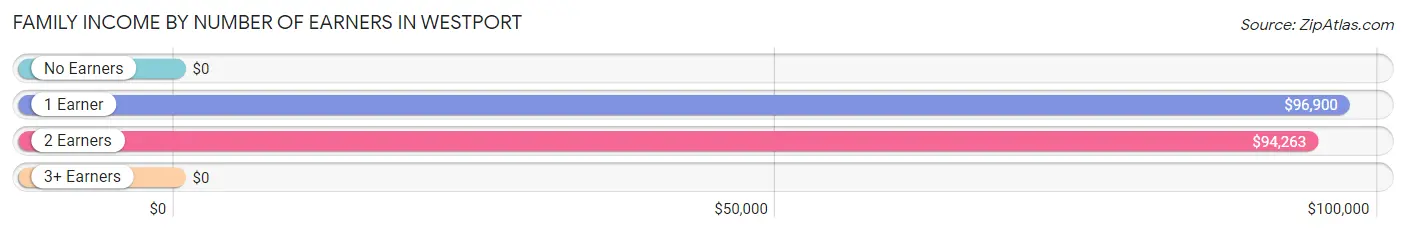
| Number of Earners | # Families | Median Income |
| No Earners | 183 (33.4%) | $0 |
| 1 Earner | 86 (15.7%) | $96,900 |
| 2 Earners | 265 (48.4%) | $94,263 |
| 3+ Earners | 14 (2.5%) | $0 |
| Total | 548 (100.0%) | $86,853 |
Household Income in Westport
Household Income Brackets in Westport
With 203 households falling in the category, the $75,000 to $99,999 income range is the most frequent in Westport, accounting for 19.5% of all households. In contrast, only 27 households (2.6%) fall into the $200,000+ income bracket, making it the least populous group.
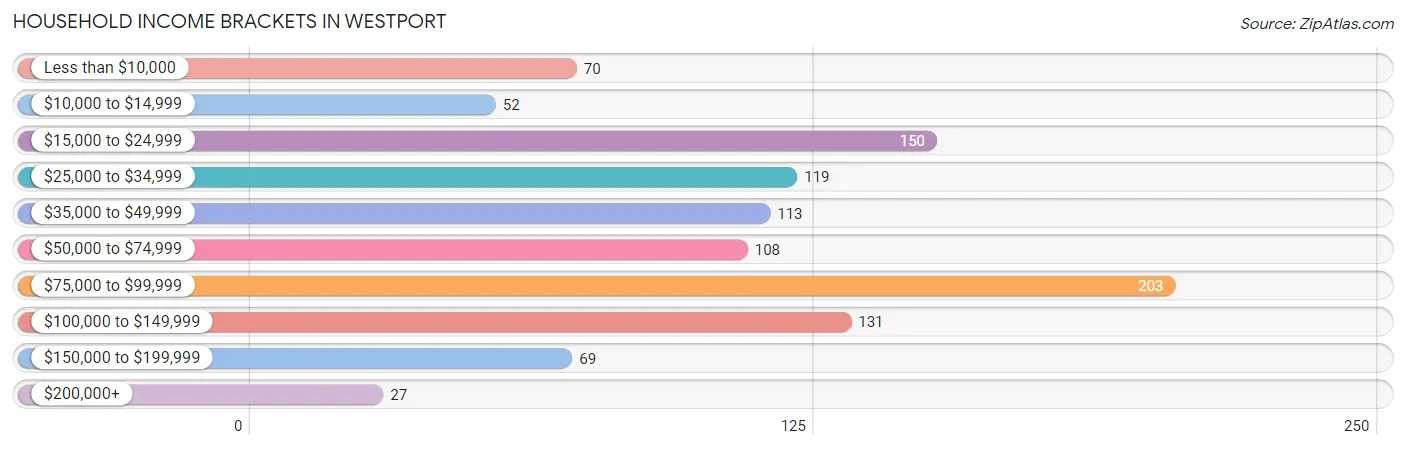
| Income Bracket | # Households | % Households |
| Less than $10,000 | 70 | 6.7% |
| $10,000 to $14,999 | 52 | 5.0% |
| $15,000 to $24,999 | 150 | 14.4% |
| $25,000 to $34,999 | 119 | 11.4% |
| $35,000 to $49,999 | 113 | 10.8% |
| $50,000 to $74,999 | 108 | 10.4% |
| $75,000 to $99,999 | 203 | 19.5% |
| $100,000 to $149,999 | 131 | 12.6% |
| $150,000 to $199,999 | 69 | 6.6% |
| $200,000+ | 27 | 2.6% |
Household Income by Householder Age in Westport
The median household income in Westport is $54,271, with the highest median household income of $81,037 found in the 25 to 44 years age bracket for the primary householder. A total of 252 households (24.2%) fall into this category. Meanwhile, the 15 to 24 years age bracket for the primary householder has the lowest median household income of $0, with 39 households (3.7%) in this group.
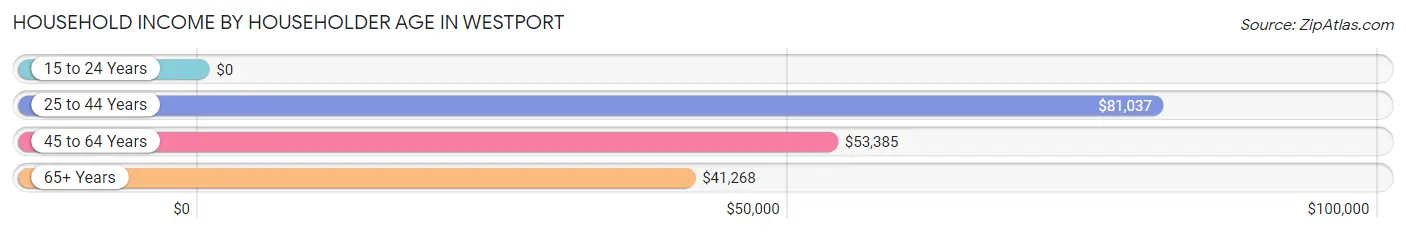
| Income Bracket | # Households | Median Income |
| 15 to 24 Years | 39 (3.7%) | $0 |
| 25 to 44 Years | 252 (24.2%) | $81,037 |
| 45 to 64 Years | 387 (37.1%) | $53,385 |
| 65+ Years | 364 (34.9%) | $41,268 |
| Total | 1,042 (100.0%) | $54,271 |
Poverty in Westport
Income Below Poverty by Sex and Age in Westport
With 23.3% poverty level for males and 20.9% for females among the residents of Westport, 15 year old males and 12 to 14 year old females are the most vulnerable to poverty, with 32 males (100.0%) and 33 females (70.2%) in their respective age groups living below the poverty level.
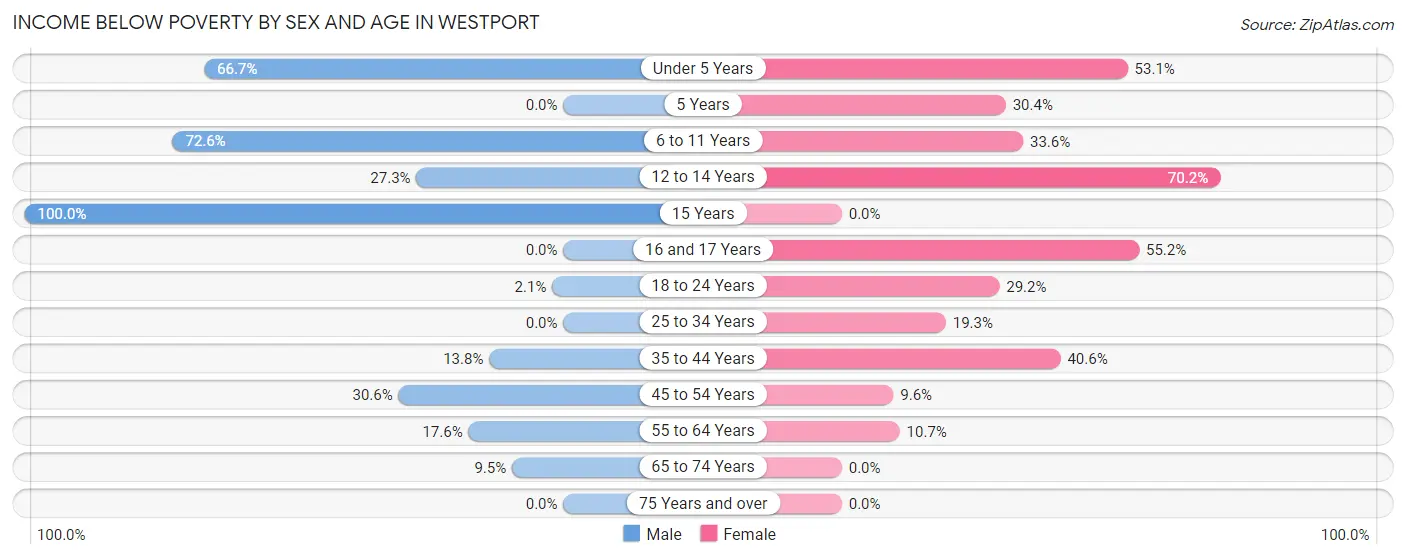
| Age Bracket | Male | Female |
| Under 5 Years | 100 (66.7%) | 26 (53.1%) |
| 5 Years | 0 (0.0%) | 14 (30.4%) |
| 6 to 11 Years | 37 (72.6%) | 37 (33.6%) |
| 12 to 14 Years | 15 (27.3%) | 33 (70.2%) |
| 15 Years | 32 (100.0%) | 0 (0.0%) |
| 16 and 17 Years | 0 (0.0%) | 16 (55.2%) |
| 18 to 24 Years | 2 (2.1%) | 38 (29.2%) |
| 25 to 34 Years | 0 (0.0%) | 33 (19.3%) |
| 35 to 44 Years | 15 (13.8%) | 41 (40.6%) |
| 45 to 54 Years | 26 (30.6%) | 11 (9.6%) |
| 55 to 64 Years | 25 (17.6%) | 26 (10.7%) |
| 65 to 74 Years | 22 (9.5%) | 0 (0.0%) |
| 75 Years and over | 0 (0.0%) | 0 (0.0%) |
| Total | 274 (23.3%) | 275 (20.9%) |
Income Above Poverty by Sex and Age in Westport
According to the poverty statistics in Westport, males aged 25 to 34 years and females aged 65 to 74 years are the age groups that are most secure financially, with 100.0% of males and 100.0% of females in these age groups living above the poverty line.
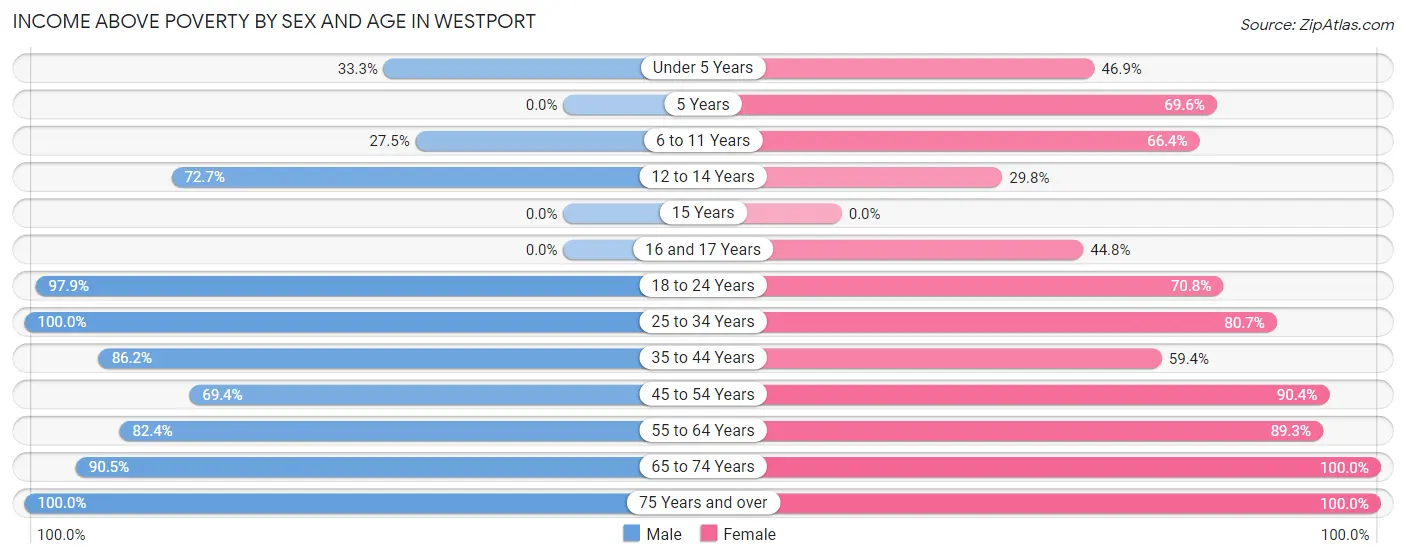
| Age Bracket | Male | Female |
| Under 5 Years | 50 (33.3%) | 23 (46.9%) |
| 5 Years | 0 (0.0%) | 32 (69.6%) |
| 6 to 11 Years | 14 (27.5%) | 73 (66.4%) |
| 12 to 14 Years | 40 (72.7%) | 14 (29.8%) |
| 15 Years | 0 (0.0%) | 0 (0.0%) |
| 16 and 17 Years | 0 (0.0%) | 13 (44.8%) |
| 18 to 24 Years | 95 (97.9%) | 92 (70.8%) |
| 25 to 34 Years | 192 (100.0%) | 138 (80.7%) |
| 35 to 44 Years | 94 (86.2%) | 60 (59.4%) |
| 45 to 54 Years | 59 (69.4%) | 104 (90.4%) |
| 55 to 64 Years | 117 (82.4%) | 216 (89.3%) |
| 65 to 74 Years | 209 (90.5%) | 196 (100.0%) |
| 75 Years and over | 32 (100.0%) | 77 (100.0%) |
| Total | 902 (76.7%) | 1,038 (79.1%) |
Income Below Poverty Among Married-Couple Families in Westport
The poverty statistics for married-couple families in Westport show that 9.1% or 40 of the total 440 families live below the poverty line. Families with 5 or more children have the highest poverty rate of 100.0%, comprising of 15 families. On the other hand, families with 1 or 2 children have the lowest poverty rate of 0.0%, which includes 0 families.
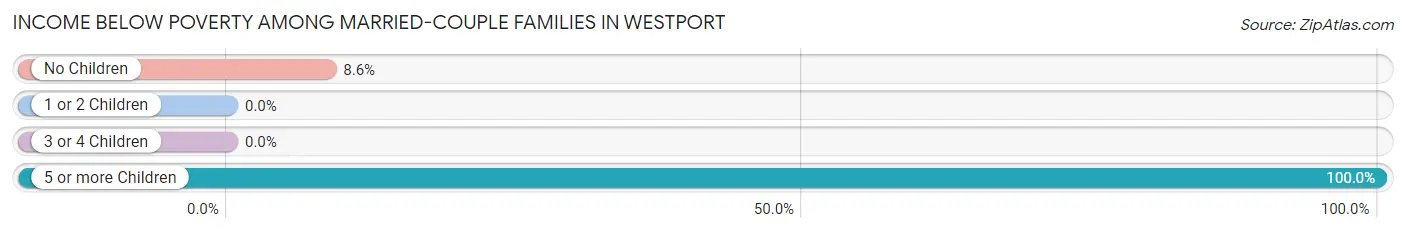
| Children | Above Poverty | Below Poverty |
| No Children | 267 (91.4%) | 25 (8.6%) |
| 1 or 2 Children | 133 (100.0%) | 0 (0.0%) |
| 3 or 4 Children | 0 (0.0%) | 0 (0.0%) |
| 5 or more Children | 0 (0.0%) | 15 (100.0%) |
| Total | 400 (90.9%) | 40 (9.1%) |
Income Below Poverty Among Single-Parent Households in Westport
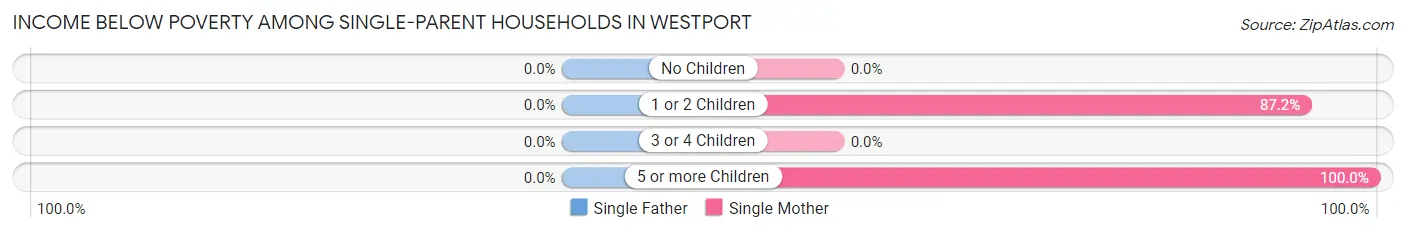
| Children | Single Father | Single Mother |
| No Children | 0 (0.0%) | 0 (0.0%) |
| 1 or 2 Children | 0 (0.0%) | 41 (87.2%) |
| 3 or 4 Children | 0 (0.0%) | 0 (0.0%) |
| 5 or more Children | 0 (0.0%) | 20 (100.0%) |
| Total | 0 (0.0%) | 61 (56.5%) |
Income Below Poverty Among Married-Couple vs Single-Parent Households in Westport
The poverty data for Westport shows that 40 of the married-couple family households (9.1%) and 61 of the single-parent households (56.5%) are living below the poverty level. Within the married-couple family households, those with 5 or more children have the highest poverty rate, with 15 households (100.0%) falling below the poverty line. Among the single-parent households, those with 5 or more children have the highest poverty rate, with 20 household (100.0%) living below poverty.
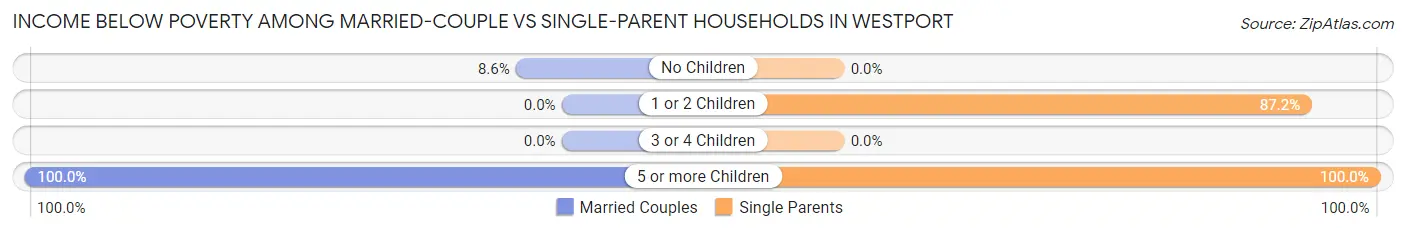
| Children | Married-Couple Families | Single-Parent Households |
| No Children | 25 (8.6%) | 0 (0.0%) |
| 1 or 2 Children | 0 (0.0%) | 41 (87.2%) |
| 3 or 4 Children | 0 (0.0%) | 0 (0.0%) |
| 5 or more Children | 15 (100.0%) | 20 (100.0%) |
| Total | 40 (9.1%) | 61 (56.5%) |
Race in Westport
The most populous races in Westport are White / Caucasian (2,255 | 90.3%), Hispanic or Latino (317 | 12.7%), and Some other Race (225 | 9.0%).
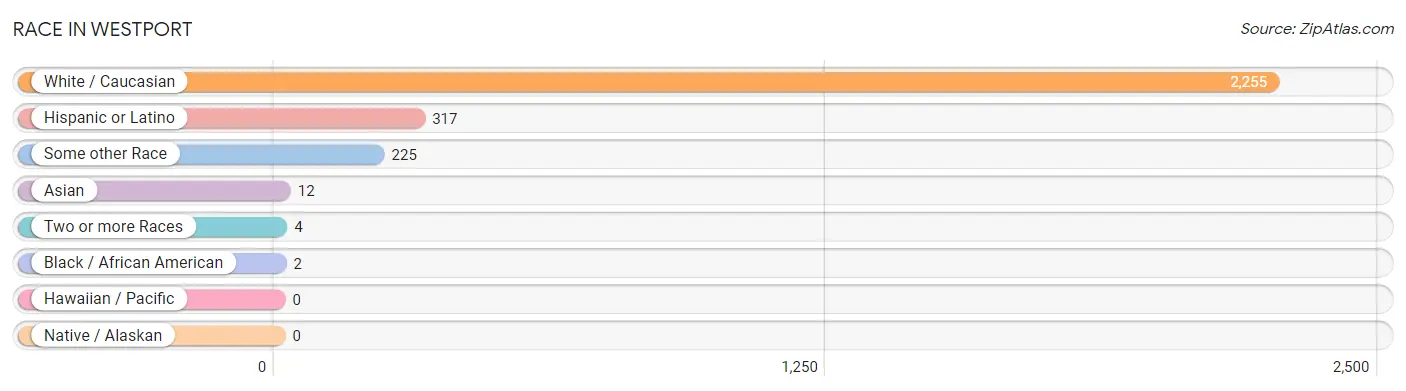
| Race | # Population | % Population |
| Asian | 12 | 0.5% |
| Black / African American | 2 | 0.1% |
| Hawaiian / Pacific | 0 | 0.0% |
| Hispanic or Latino | 317 | 12.7% |
| Native / Alaskan | 0 | 0.0% |
| White / Caucasian | 2,255 | 90.3% |
| Two or more Races | 4 | 0.2% |
| Some other Race | 225 | 9.0% |
| Total | 2,498 | 100.0% |
Ancestry in Westport
The most populous ancestries reported in Westport are Irish (385 | 15.4%), German (338 | 13.5%), Mexican (236 | 9.5%), English (226 | 9.0%), and Norwegian (191 | 7.6%), together accounting for 55.1% of all Westport residents.
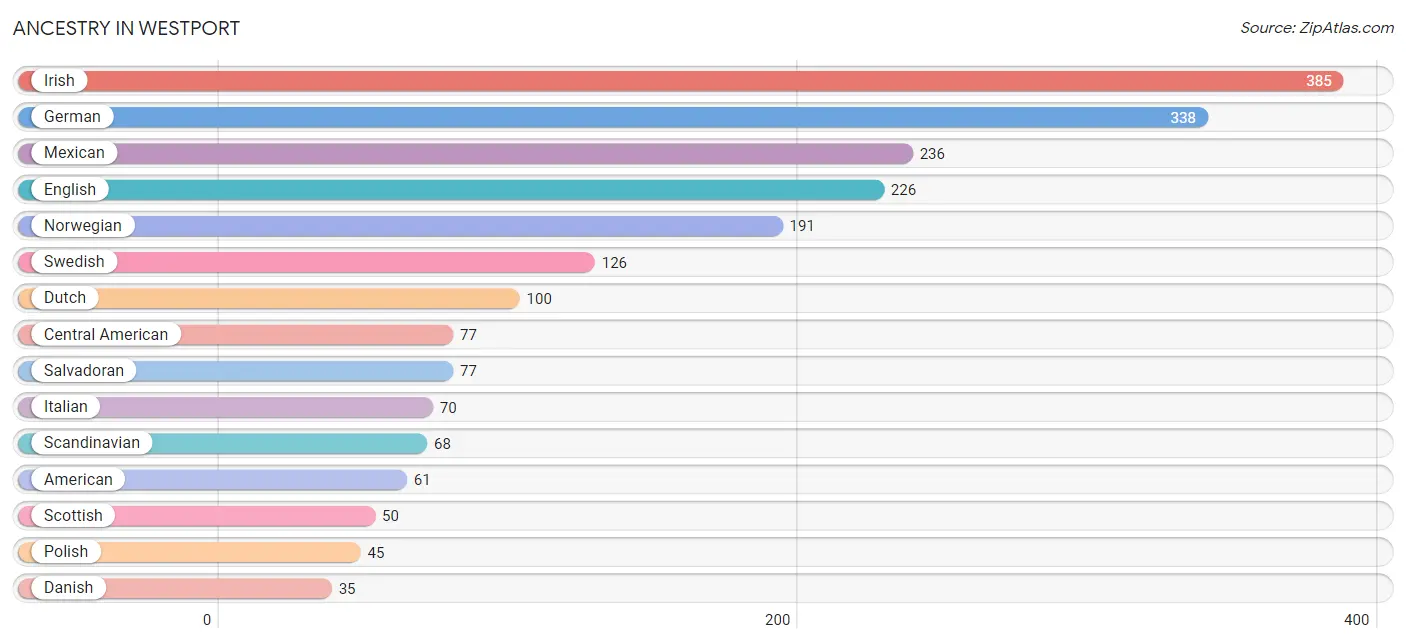
| Ancestry | # Population | % Population |
| American | 61 | 2.4% |
| Central American | 77 | 3.1% |
| Cuban | 3 | 0.1% |
| Danish | 35 | 1.4% |
| Dutch | 100 | 4.0% |
| English | 226 | 9.0% |
| Finnish | 15 | 0.6% |
| French | 14 | 0.6% |
| German | 338 | 13.5% |
| Hungarian | 34 | 1.4% |
| Irish | 385 | 15.4% |
| Italian | 70 | 2.8% |
| Mexican | 236 | 9.5% |
| Norwegian | 191 | 7.6% |
| Polish | 45 | 1.8% |
| Salvadoran | 77 | 3.1% |
| Scandinavian | 68 | 2.7% |
| Scottish | 50 | 2.0% |
| Serbian | 17 | 0.7% |
| Swedish | 126 | 5.0% |
| Thai | 12 | 0.5% |
| Welsh | 13 | 0.5% | View All 22 Rows |
Immigrants in Westport
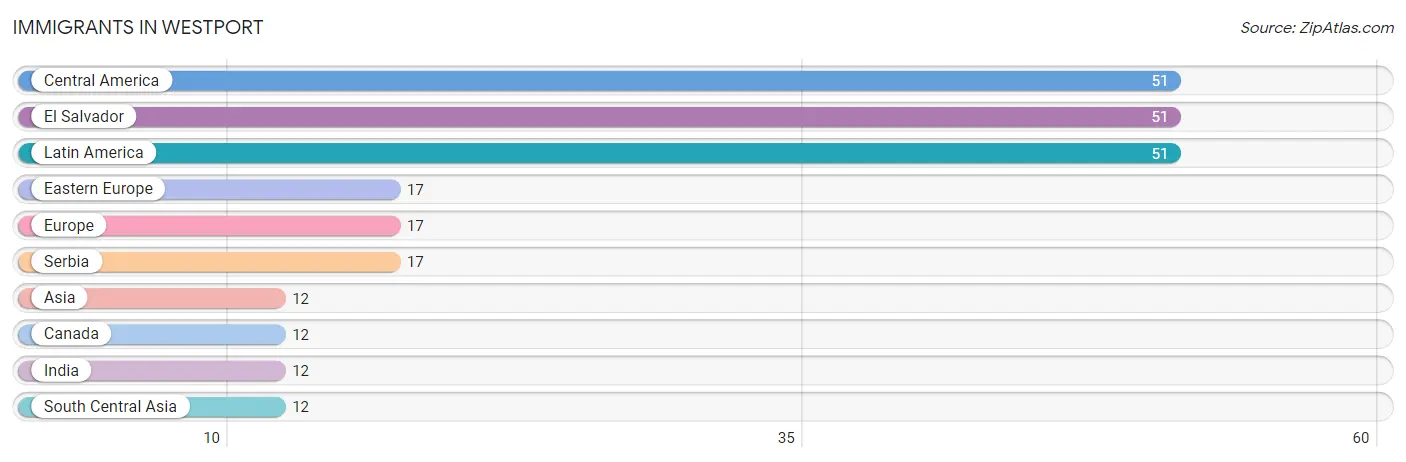
The most numerous immigrant groups reported in Westport came from Central America (51 | 2.0%), El Salvador (51 | 2.0%), Latin America (51 | 2.0%), Eastern Europe (17 | 0.7%), and Europe (17 | 0.7%), together accounting for 7.5% of all Westport residents.
| Immigration Origin | # Population | % Population |
| Asia | 12 | 0.5% |
| Canada | 12 | 0.5% |
| Central America | 51 | 2.0% |
| Eastern Europe | 17 | 0.7% |
| El Salvador | 51 | 2.0% |
| Europe | 17 | 0.7% |
| India | 12 | 0.5% |
| Latin America | 51 | 2.0% |
| Serbia | 17 | 0.7% |
| South Central Asia | 12 | 0.5% | View All 10 Rows |
Sex and Age in Westport
Sex and Age in Westport
The most populous age groups in Westport are 65 to 69 Years (165 | 13.9%) for men and 60 to 64 Years (201 | 15.3%) for women.
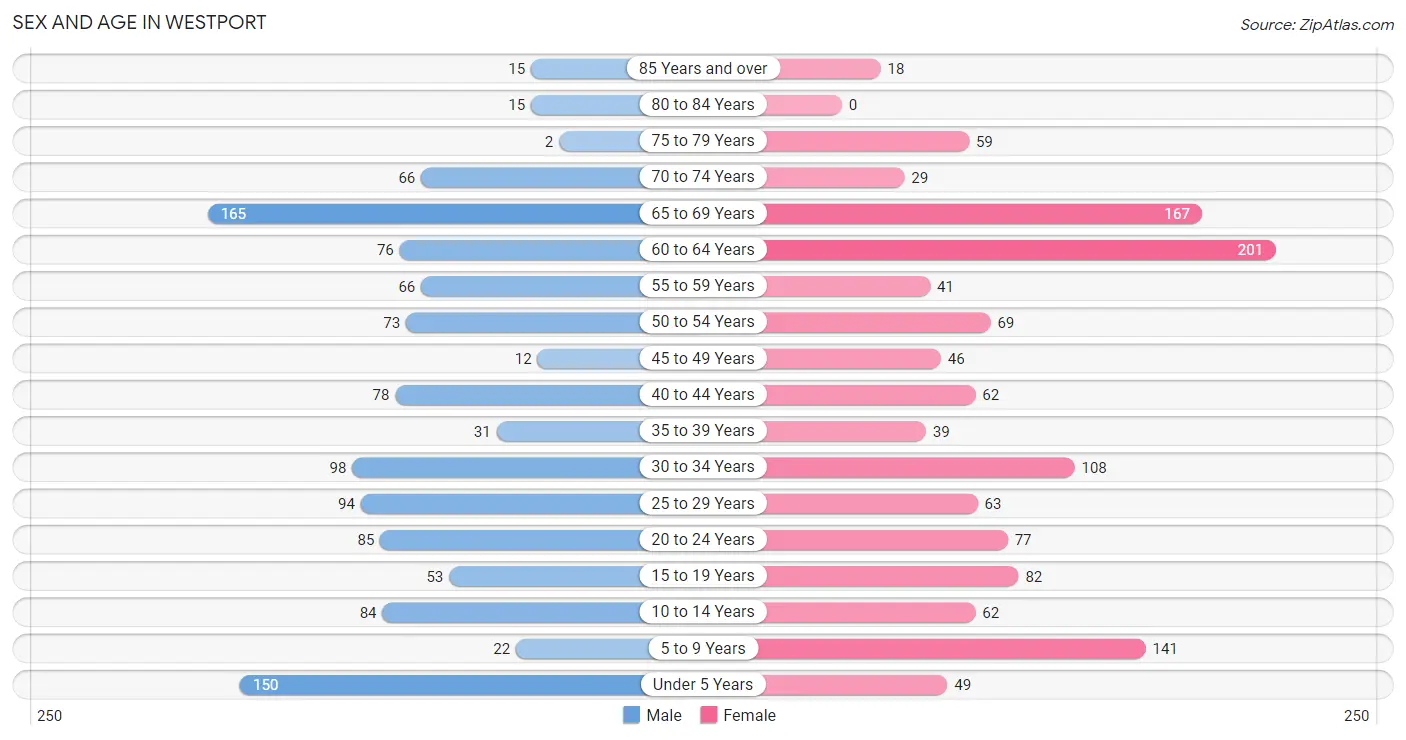
| Age Bracket | Male | Female |
| Under 5 Years | 150 (12.7%) | 49 (3.7%) |
| 5 to 9 Years | 22 (1.9%) | 141 (10.7%) |
| 10 to 14 Years | 84 (7.1%) | 62 (4.7%) |
| 15 to 19 Years | 53 (4.5%) | 82 (6.2%) |
| 20 to 24 Years | 85 (7.2%) | 77 (5.9%) |
| 25 to 29 Years | 94 (7.9%) | 63 (4.8%) |
| 30 to 34 Years | 98 (8.3%) | 108 (8.2%) |
| 35 to 39 Years | 31 (2.6%) | 39 (3.0%) |
| 40 to 44 Years | 78 (6.6%) | 62 (4.7%) |
| 45 to 49 Years | 12 (1.0%) | 46 (3.5%) |
| 50 to 54 Years | 73 (6.2%) | 69 (5.3%) |
| 55 to 59 Years | 66 (5.6%) | 41 (3.1%) |
| 60 to 64 Years | 76 (6.4%) | 201 (15.3%) |
| 65 to 69 Years | 165 (13.9%) | 167 (12.7%) |
| 70 to 74 Years | 66 (5.6%) | 29 (2.2%) |
| 75 to 79 Years | 2 (0.2%) | 59 (4.5%) |
| 80 to 84 Years | 15 (1.3%) | 0 (0.0%) |
| 85 Years and over | 15 (1.3%) | 18 (1.4%) |
| Total | 1,185 (100.0%) | 1,313 (100.0%) |
Families and Households in Westport
Median Family Size in Westport
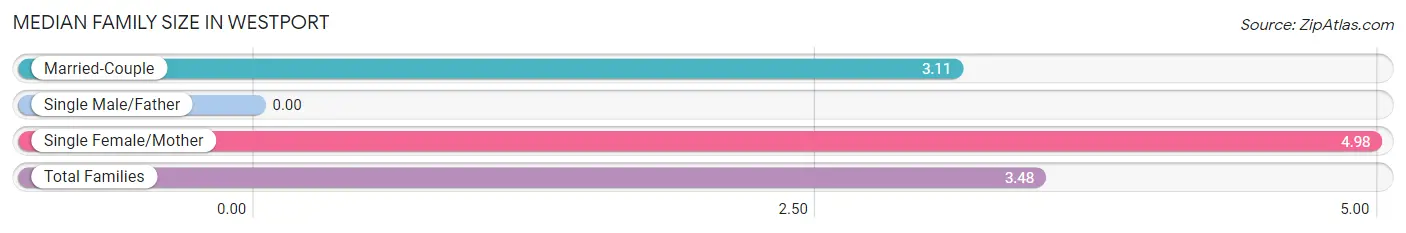
| Family Type | # Families | Family Size |
| Married-Couple | 440 (80.3%) | 3.11 |
| Single Male/Father | 0 (0.0%) | - |
| Single Female/Mother | 108 (19.7%) | 4.98 |
| Total Families | 548 (100.0%) | 3.48 |
Median Household Size in Westport
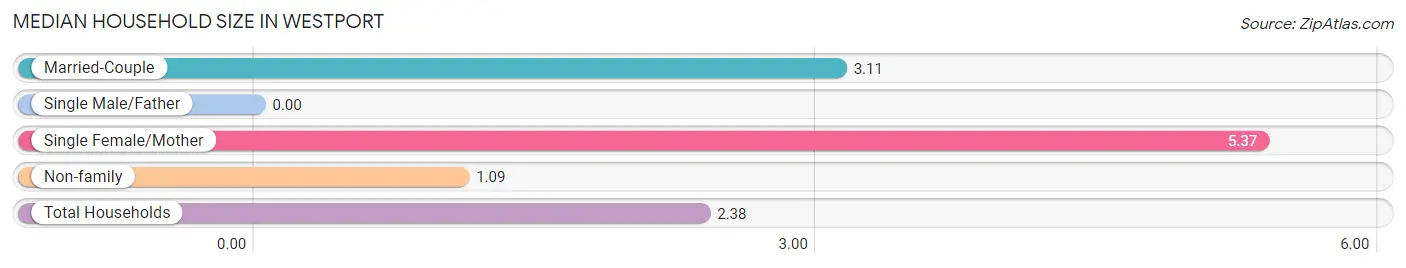
| Household Type | # Households | Household Size |
| Married-Couple | 440 (42.2%) | 3.11 |
| Single Male/Father | 0 (0.0%) | - |
| Single Female/Mother | 108 (10.4%) | 5.37 |
| Non-family | 494 (47.4%) | 1.09 |
| Total Households | 1,042 (100.0%) | 2.38 |
Household Size by Marriage Status in Westport
Out of a total of 1,042 households in Westport, 548 (52.6%) are family households, while 494 (47.4%) are nonfamily households. The most numerous type of family households are 2-person households, comprising 210, and the most common type of nonfamily households are 1-person households, comprising 456.
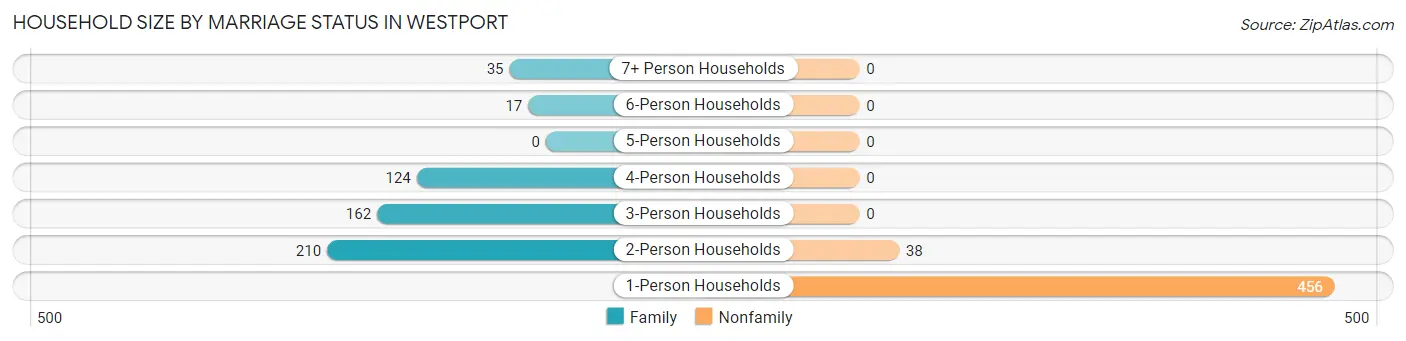
| Household Size | Family Households | Nonfamily Households |
| 1-Person Households | - | 456 (43.8%) |
| 2-Person Households | 210 (20.2%) | 38 (3.6%) |
| 3-Person Households | 162 (15.5%) | 0 (0.0%) |
| 4-Person Households | 124 (11.9%) | 0 (0.0%) |
| 5-Person Households | 0 (0.0%) | 0 (0.0%) |
| 6-Person Households | 17 (1.6%) | 0 (0.0%) |
| 7+ Person Households | 35 (3.4%) | 0 (0.0%) |
| Total | 548 (52.6%) | 494 (47.4%) |
Female Fertility in Westport
Fertility by Age in Westport
Average fertility rate in Westport is 88.0 births per 1,000 women. Women in the age bracket of 20 to 34 years have the highest fertility rate with 173.0 births per 1,000 women. Women in the age bracket of 20 to 34 years acount for 100.0% of all women with births.
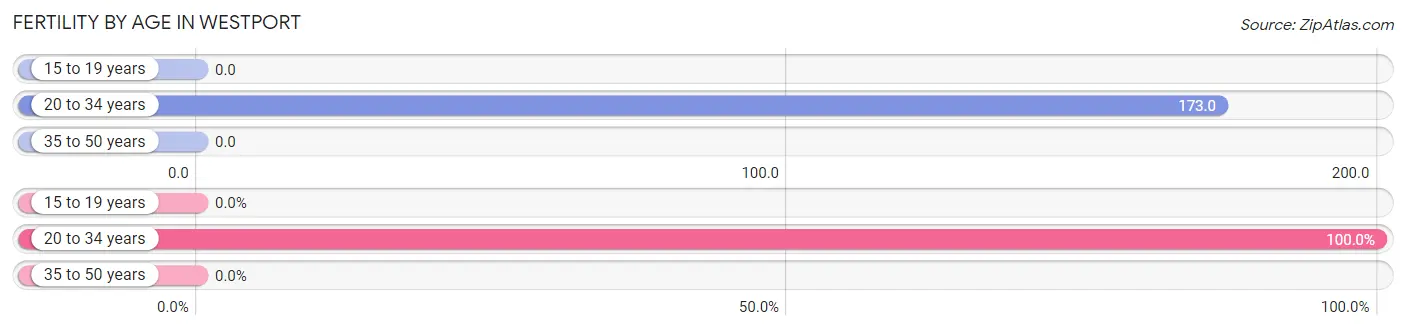
| Age Bracket | Women with Births | Births / 1,000 Women |
| 15 to 19 years | 0 (0.0%) | 0.0 |
| 20 to 34 years | 43 (100.0%) | 173.0 |
| 35 to 50 years | 0 (0.0%) | 0.0 |
| Total | 43 (100.0%) | 88.0 |
Fertility by Age by Marriage Status in Westport
53.5% of women with births (43) in Westport are married. The highest percentage of unmarried women with births falls into 20 to 34 years age bracket with 46.5% of them unmarried at the time of birth, while the lowest percentage of unmarried women with births belong to 20 to 34 years age bracket with 46.5% of them unmarried.
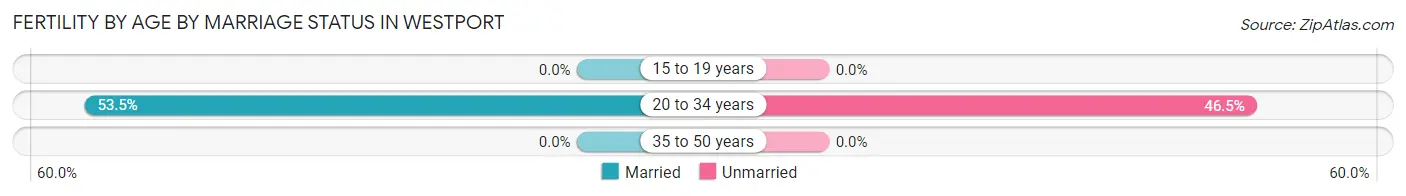
| Age Bracket | Married | Unmarried |
| 15 to 19 years | 0 (0.0%) | 0 (0.0%) |
| 20 to 34 years | 23 (53.5%) | 20 (46.5%) |
| 35 to 50 years | 0 (0.0%) | 0 (0.0%) |
| Total | 23 (53.5%) | 20 (46.5%) |
Fertility by Education in Westport
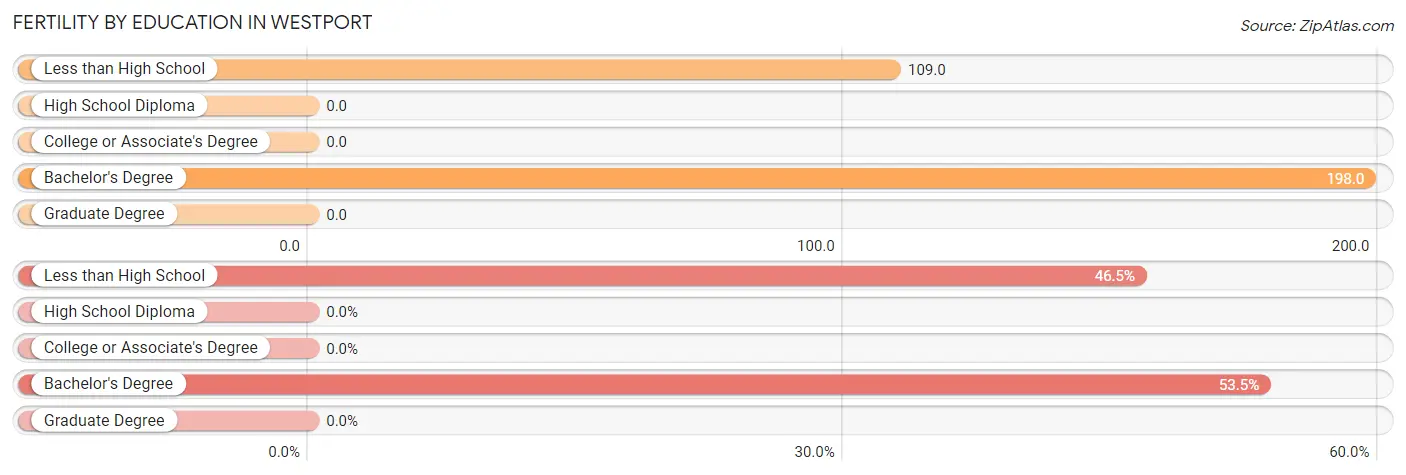
| Educational Attainment | Women with Births | Births / 1,000 Women |
| Less than High School | 20 (46.5%) | 109.0 |
| High School Diploma | 0 (0.0%) | 0.0 |
| College or Associate's Degree | 0 (0.0%) | 0.0 |
| Bachelor's Degree | 23 (53.5%) | 198.0 |
| Graduate Degree | 0 (0.0%) | 0.0 |
| Total | 43 (100.0%) | 88.0 |
Fertility by Education by Marriage Status in Westport
46.5% of women with births in Westport are unmarried. Women with the educational attainment of bachelor's degree are most likely to be married with 100.0% of them married at childbirth, while women with the educational attainment of less than high school are least likely to be married with 100.0% of them unmarried at childbirth.
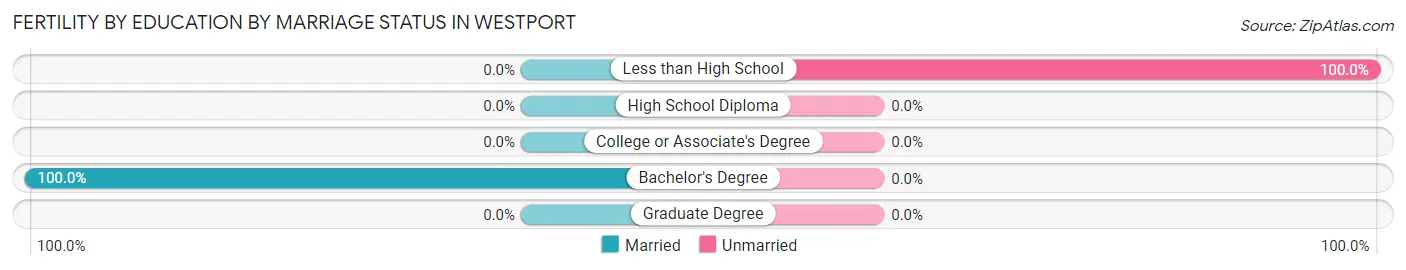
| Educational Attainment | Married | Unmarried |
| Less than High School | 0 (0.0%) | 20 (100.0%) |
| High School Diploma | 0 (0.0%) | 0 (0.0%) |
| College or Associate's Degree | 0 (0.0%) | 0 (0.0%) |
| Bachelor's Degree | 23 (100.0%) | 0 (0.0%) |
| Graduate Degree | 0 (0.0%) | 0 (0.0%) |
| Total | 23 (53.5%) | 20 (46.5%) |
Employment Characteristics in Westport
Employment by Class of Employer in Westport
Among the 898 employed individuals in Westport, private company employees (512 | 57.0%), self-employed (incorporated) (110 | 12.2%), and state government employees (87 | 9.7%) make up the most common classes of employment.
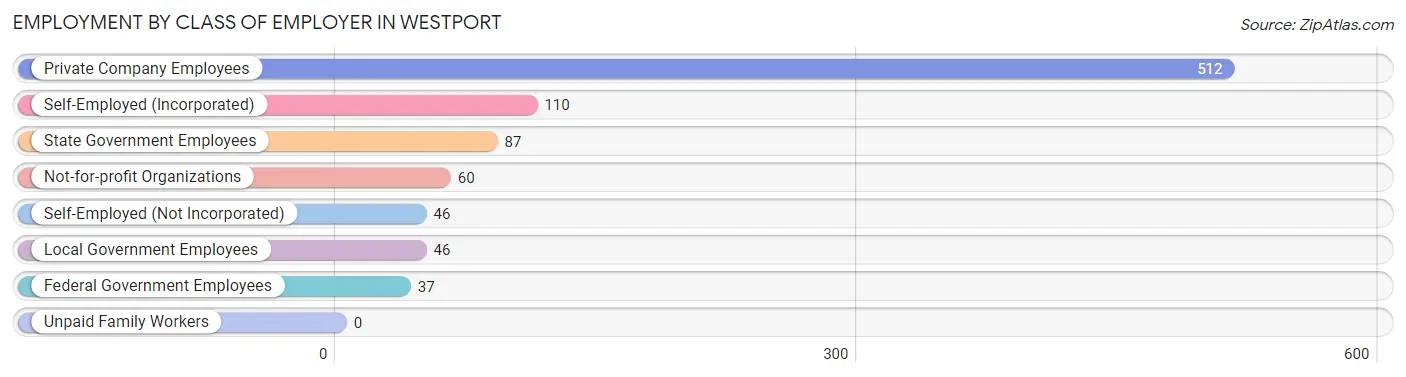
| Employer Class | # Employees | % Employees |
| Private Company Employees | 512 | 57.0% |
| Self-Employed (Incorporated) | 110 | 12.2% |
| Self-Employed (Not Incorporated) | 46 | 5.1% |
| Not-for-profit Organizations | 60 | 6.7% |
| Local Government Employees | 46 | 5.1% |
| State Government Employees | 87 | 9.7% |
| Federal Government Employees | 37 | 4.1% |
| Unpaid Family Workers | 0 | 0.0% |
| Total | 898 | 100.0% |
Employment Status by Age in Westport
According to the labor force statistics for Westport, out of the total population over 16 years of age (1,958), 49.4% or 967 individuals are in the labor force, with 2.1% or 20 of them unemployed. The age group with the highest labor force participation rate is 25 to 29 years, with 100.0% or 157 individuals in the labor force. Within the labor force, the 30 to 34 years age range has the highest percentage of unemployed individuals, with 12.1% or 20 of them being unemployed.
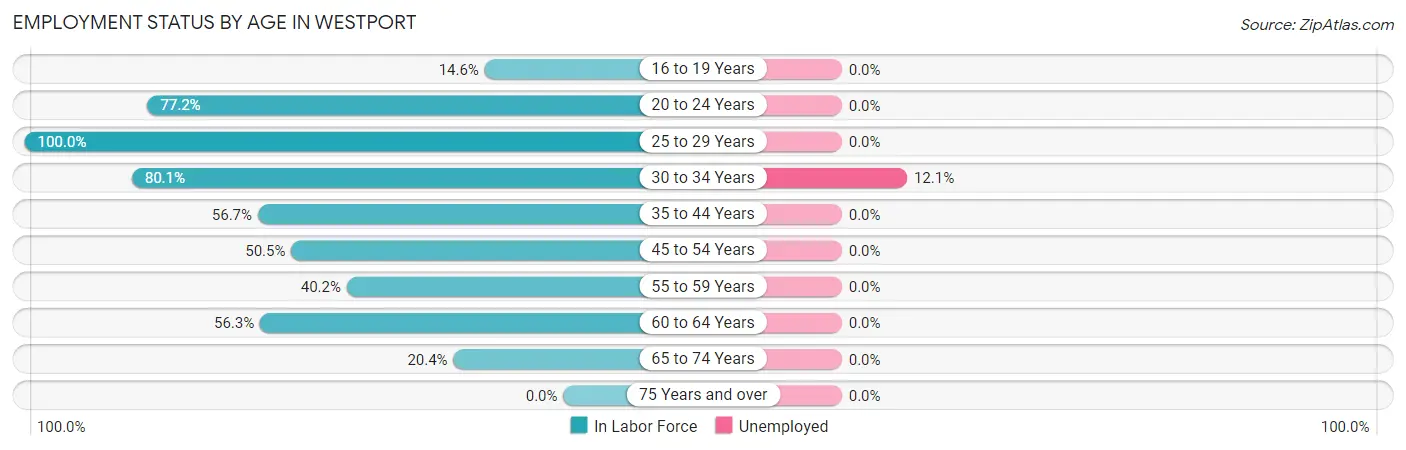
| Age Bracket | In Labor Force | Unemployed |
| 16 to 19 Years | 15 (14.6%) | 0 (0.0%) |
| 20 to 24 Years | 125 (77.2%) | 0 (0.0%) |
| 25 to 29 Years | 157 (100.0%) | 0 (0.0%) |
| 30 to 34 Years | 165 (80.1%) | 20 (12.1%) |
| 35 to 44 Years | 119 (56.7%) | 0 (0.0%) |
| 45 to 54 Years | 101 (50.5%) | 0 (0.0%) |
| 55 to 59 Years | 43 (40.2%) | 0 (0.0%) |
| 60 to 64 Years | 156 (56.3%) | 0 (0.0%) |
| 65 to 74 Years | 87 (20.4%) | 0 (0.0%) |
| 75 Years and over | 0 (0.0%) | 0 (0.0%) |
| Total | 967 (49.4%) | 20 (2.1%) |
Employment Status by Educational Attainment in Westport
According to labor force statistics for Westport, 64.0% of individuals (740) out of the total population between 25 and 64 years of age (1,157) are in the labor force, with 2.7% or 20 of them being unemployed. The group with the highest labor force participation rate are those with the educational attainment of bachelor's degree or higher, with 87.9% or 153 individuals in the labor force. Within the labor force, individuals with high school diploma education have the highest percentage of unemployment, with 8.5% or 20 of them being unemployed.
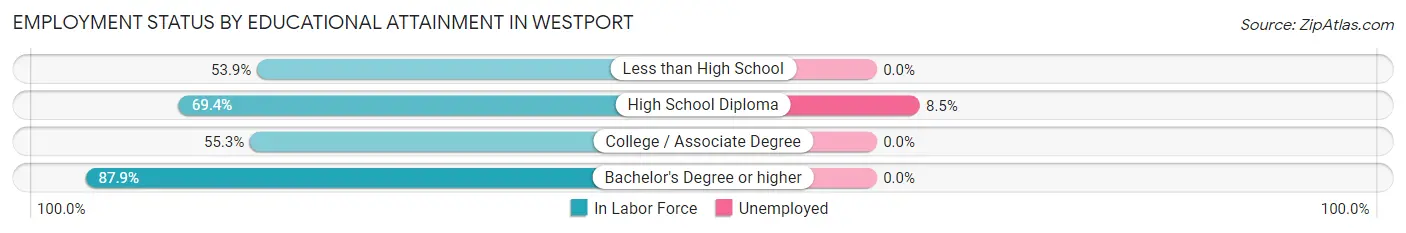
| Educational Attainment | In Labor Force | Unemployed |
| Less than High School | 125 (53.9%) | 0 (0.0%) |
| High School Diploma | 234 (69.4%) | 29 (8.5%) |
| College / Associate Degree | 229 (55.3%) | 0 (0.0%) |
| Bachelor's Degree or higher | 153 (87.9%) | 0 (0.0%) |
| Total | 740 (64.0%) | 31 (2.7%) |
Employment Occupations by Sex in Westport
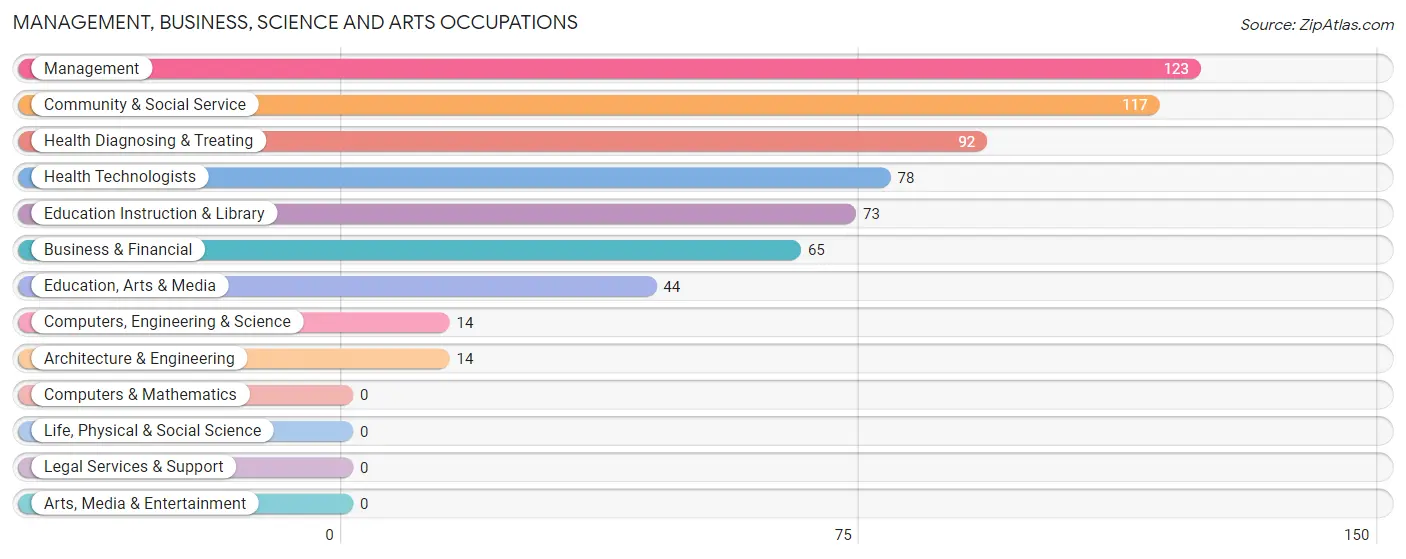
Management, Business, Science and Arts Occupations
The most common Management, Business, Science and Arts occupations in Westport are Management (123 | 13.1%), Community & Social Service (117 | 12.5%), Health Diagnosing & Treating (92 | 9.8%), Health Technologists (78 | 8.3%), and Education Instruction & Library (73 | 7.8%).
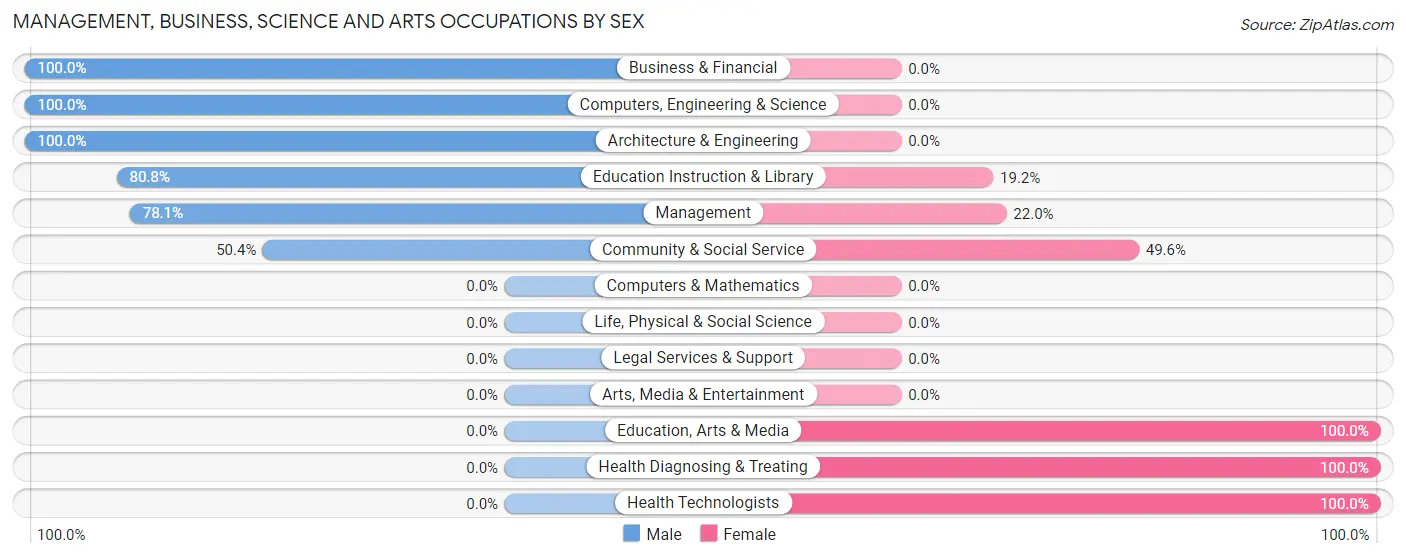
Management, Business, Science and Arts Occupations by Sex
Within the Management, Business, Science and Arts occupations in Westport, the most male-oriented occupations are Business & Financial (100.0%), Computers, Engineering & Science (100.0%), and Architecture & Engineering (100.0%), while the most female-oriented occupations are Education, Arts & Media (100.0%), Health Diagnosing & Treating (100.0%), and Health Technologists (100.0%).
| Occupation | Male | Female |
| Management | 96 (78.0%) | 27 (22.0%) |
| Business & Financial | 65 (100.0%) | 0 (0.0%) |
| Computers, Engineering & Science | 14 (100.0%) | 0 (0.0%) |
| Computers & Mathematics | 0 (0.0%) | 0 (0.0%) |
| Architecture & Engineering | 14 (100.0%) | 0 (0.0%) |
| Life, Physical & Social Science | 0 (0.0%) | 0 (0.0%) |
| Community & Social Service | 59 (50.4%) | 58 (49.6%) |
| Education, Arts & Media | 0 (0.0%) | 44 (100.0%) |
| Legal Services & Support | 0 (0.0%) | 0 (0.0%) |
| Education Instruction & Library | 59 (80.8%) | 14 (19.2%) |
| Arts, Media & Entertainment | 0 (0.0%) | 0 (0.0%) |
| Health Diagnosing & Treating | 0 (0.0%) | 92 (100.0%) |
| Health Technologists | 0 (0.0%) | 78 (100.0%) |
| Total (Category) | 234 (56.9%) | 177 (43.1%) |
| Total (Overall) | 504 (53.7%) | 435 (46.3%) |
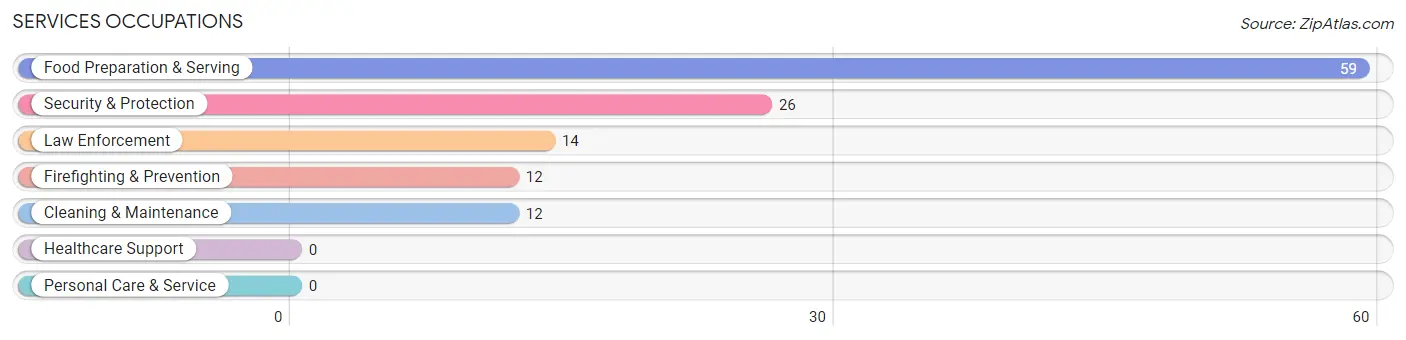
Services Occupations
The most common Services occupations in Westport are Food Preparation & Serving (59 | 6.3%), Security & Protection (26 | 2.8%), Law Enforcement (14 | 1.5%), Firefighting & Prevention (12 | 1.3%), and Cleaning & Maintenance (12 | 1.3%).
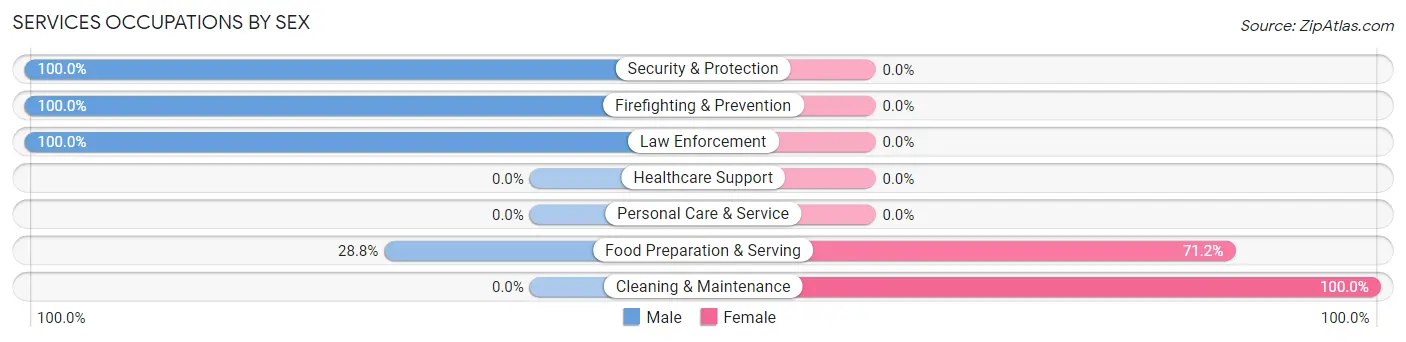
Services Occupations by Sex
Within the Services occupations in Westport, the most male-oriented occupations are Security & Protection (100.0%), Firefighting & Prevention (100.0%), and Law Enforcement (100.0%), while the most female-oriented occupations are Cleaning & Maintenance (100.0%), and Food Preparation & Serving (71.2%).
| Occupation | Male | Female |
| Healthcare Support | 0 (0.0%) | 0 (0.0%) |
| Security & Protection | 26 (100.0%) | 0 (0.0%) |
| Firefighting & Prevention | 12 (100.0%) | 0 (0.0%) |
| Law Enforcement | 14 (100.0%) | 0 (0.0%) |
| Food Preparation & Serving | 17 (28.8%) | 42 (71.2%) |
| Cleaning & Maintenance | 0 (0.0%) | 12 (100.0%) |
| Personal Care & Service | 0 (0.0%) | 0 (0.0%) |
| Total (Category) | 43 (44.3%) | 54 (55.7%) |
| Total (Overall) | 504 (53.7%) | 435 (46.3%) |
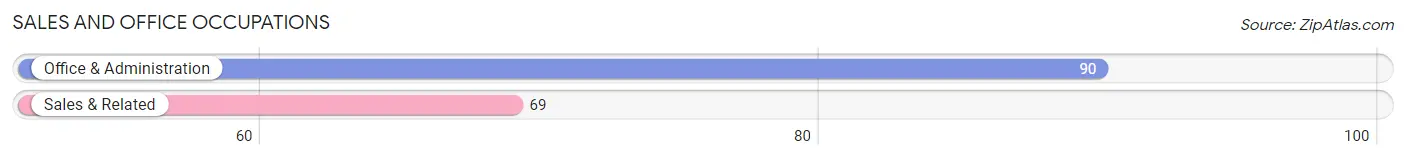
Sales and Office Occupations
The most common Sales and Office occupations in Westport are Office & Administration (90 | 9.6%), and Sales & Related (69 | 7.3%).
Sales and Office Occupations by Sex
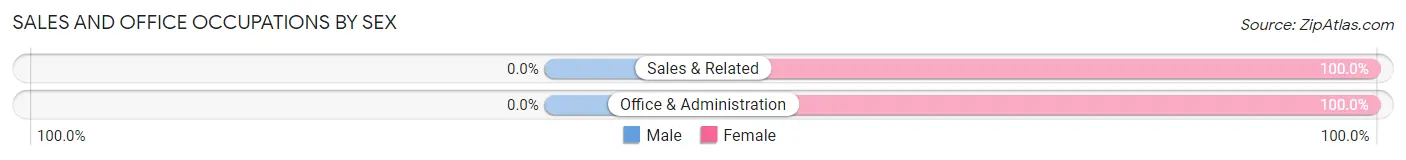
| Occupation | Male | Female |
| Sales & Related | 0 (0.0%) | 69 (100.0%) |
| Office & Administration | 0 (0.0%) | 90 (100.0%) |
| Total (Category) | 0 (0.0%) | 159 (100.0%) |
| Total (Overall) | 504 (53.7%) | 435 (46.3%) |
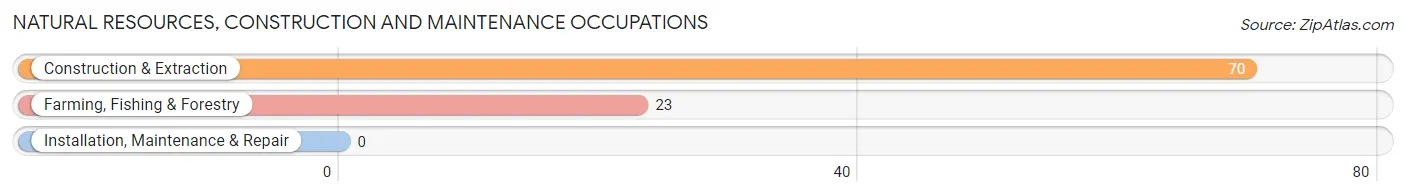
Natural Resources, Construction and Maintenance Occupations
The most common Natural Resources, Construction and Maintenance occupations in Westport are Construction & Extraction (70 | 7.4%), and Farming, Fishing & Forestry (23 | 2.5%).
Natural Resources, Construction and Maintenance Occupations by Sex
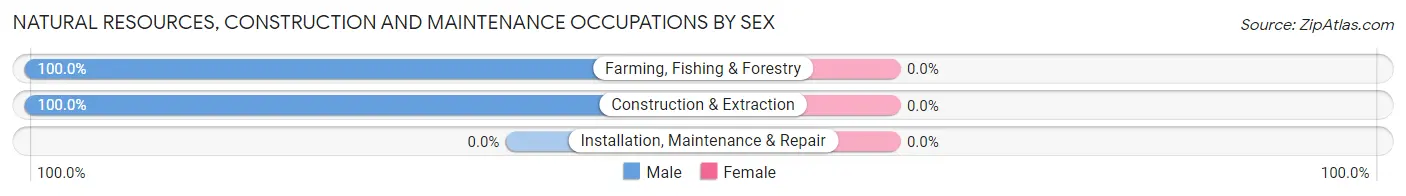
| Occupation | Male | Female |
| Farming, Fishing & Forestry | 23 (100.0%) | 0 (0.0%) |
| Construction & Extraction | 70 (100.0%) | 0 (0.0%) |
| Installation, Maintenance & Repair | 0 (0.0%) | 0 (0.0%) |
| Total (Category) | 93 (100.0%) | 0 (0.0%) |
| Total (Overall) | 504 (53.7%) | 435 (46.3%) |
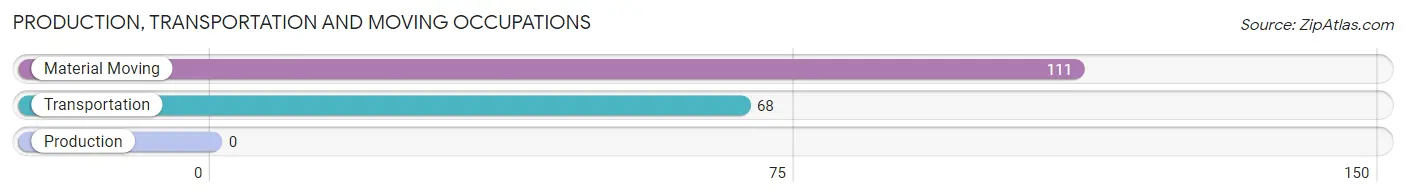
Production, Transportation and Moving Occupations
The most common Production, Transportation and Moving occupations in Westport are Material Moving (111 | 11.8%), and Transportation (68 | 7.2%).
Production, Transportation and Moving Occupations by Sex
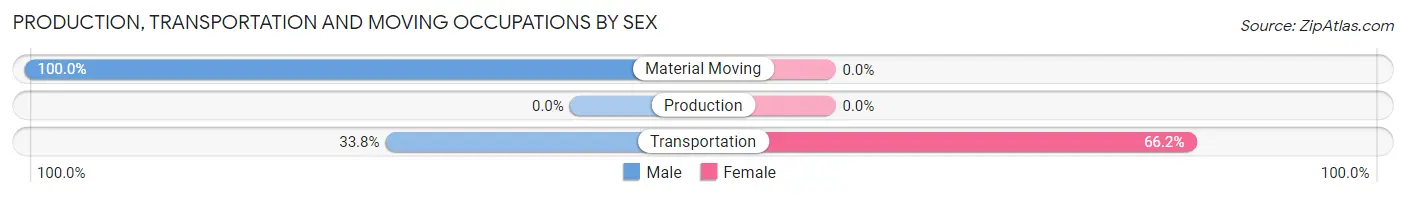
| Occupation | Male | Female |
| Production | 0 (0.0%) | 0 (0.0%) |
| Transportation | 23 (33.8%) | 45 (66.2%) |
| Material Moving | 111 (100.0%) | 0 (0.0%) |
| Total (Category) | 134 (74.9%) | 45 (25.1%) |
| Total (Overall) | 504 (53.7%) | 435 (46.3%) |
Employment Industries by Sex in Westport
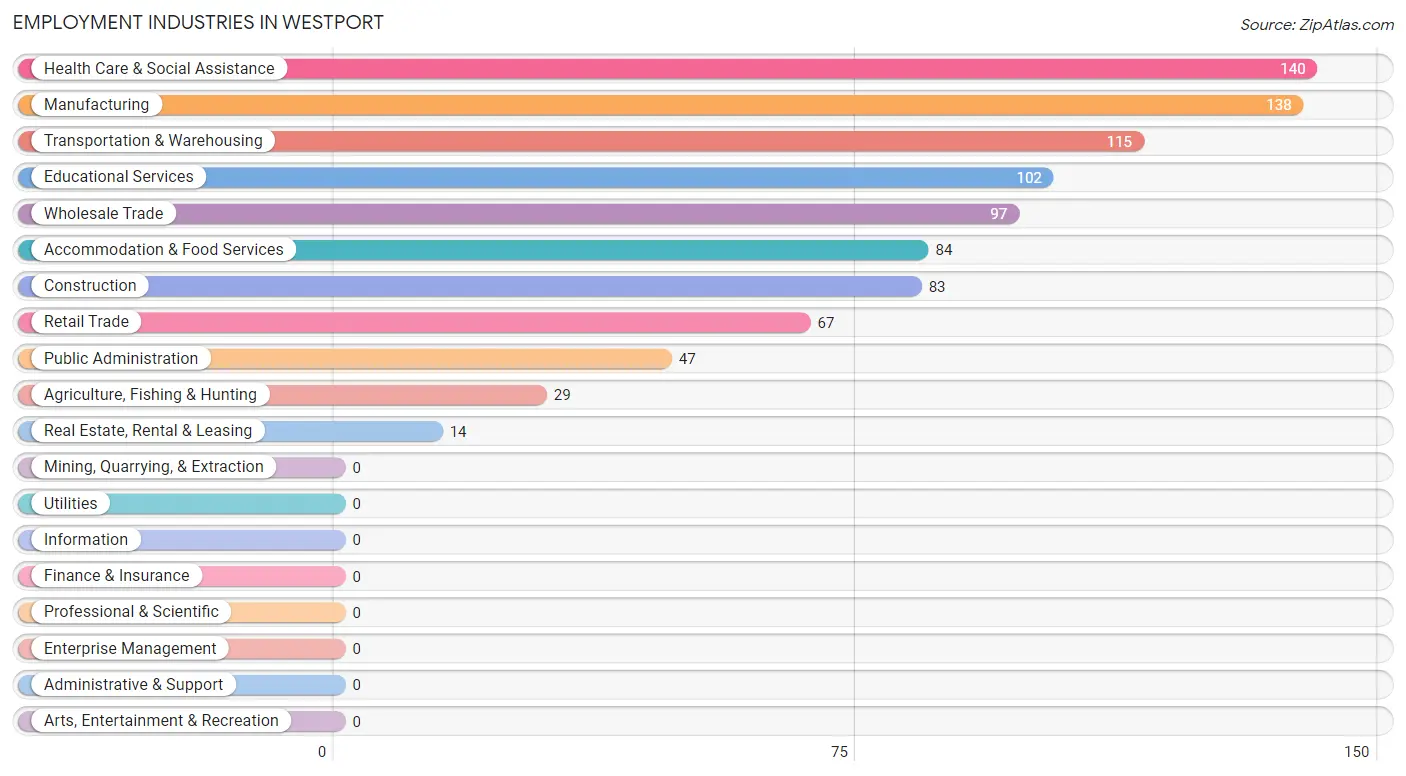
Employment Industries in Westport
The major employment industries in Westport include Health Care & Social Assistance (140 | 14.9%), Manufacturing (138 | 14.7%), Transportation & Warehousing (115 | 12.2%), Educational Services (102 | 10.9%), and Wholesale Trade (97 | 10.3%).
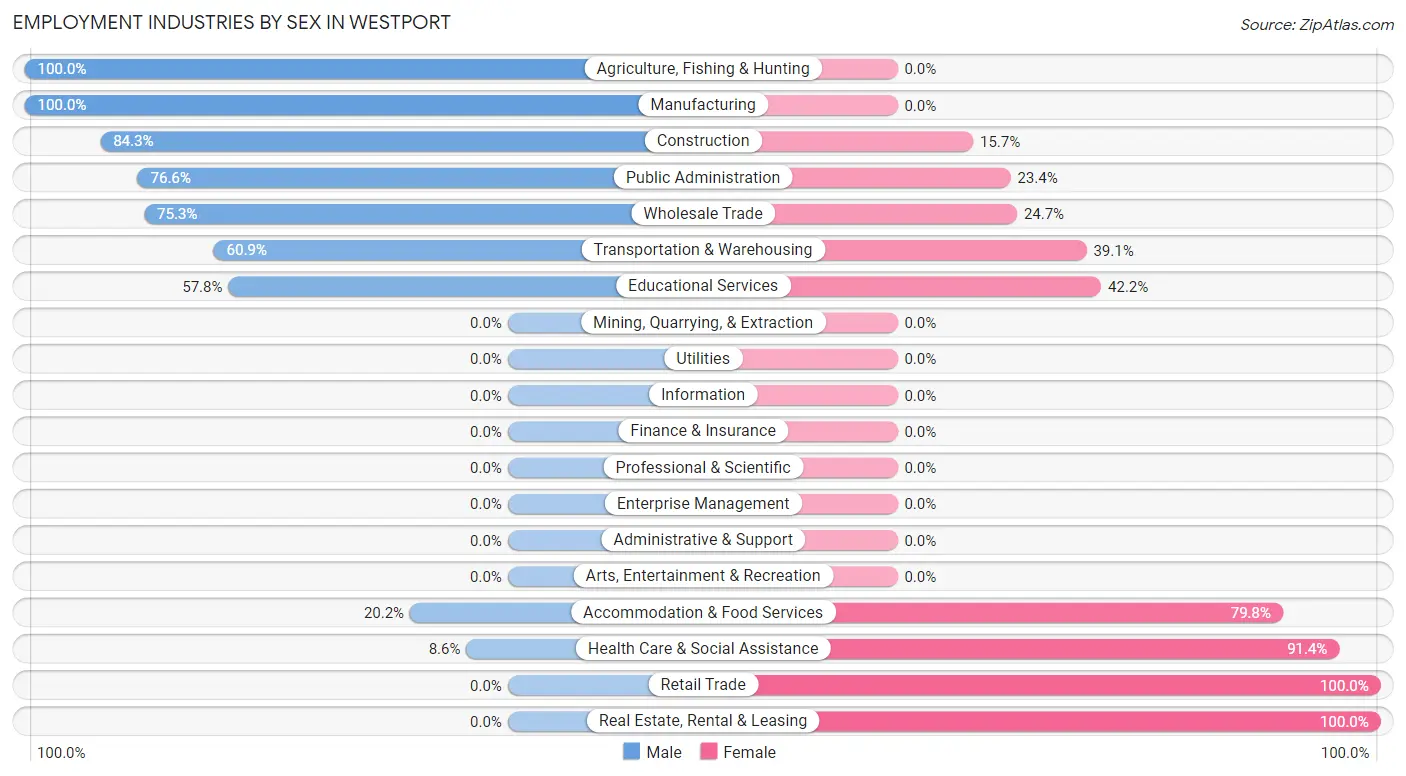
Employment Industries by Sex in Westport
The Westport industries that see more men than women are Agriculture, Fishing & Hunting (100.0%), Manufacturing (100.0%), and Construction (84.3%), whereas the industries that tend to have a higher number of women are Retail Trade (100.0%), Real Estate, Rental & Leasing (100.0%), and Health Care & Social Assistance (91.4%).
| Industry | Male | Female |
| Agriculture, Fishing & Hunting | 29 (100.0%) | 0 (0.0%) |
| Mining, Quarrying, & Extraction | 0 (0.0%) | 0 (0.0%) |
| Construction | 70 (84.3%) | 13 (15.7%) |
| Manufacturing | 138 (100.0%) | 0 (0.0%) |
| Wholesale Trade | 73 (75.3%) | 24 (24.7%) |
| Retail Trade | 0 (0.0%) | 67 (100.0%) |
| Transportation & Warehousing | 70 (60.9%) | 45 (39.1%) |
| Utilities | 0 (0.0%) | 0 (0.0%) |
| Information | 0 (0.0%) | 0 (0.0%) |
| Finance & Insurance | 0 (0.0%) | 0 (0.0%) |
| Real Estate, Rental & Leasing | 0 (0.0%) | 14 (100.0%) |
| Professional & Scientific | 0 (0.0%) | 0 (0.0%) |
| Enterprise Management | 0 (0.0%) | 0 (0.0%) |
| Administrative & Support | 0 (0.0%) | 0 (0.0%) |
| Educational Services | 59 (57.8%) | 43 (42.2%) |
| Health Care & Social Assistance | 12 (8.6%) | 128 (91.4%) |
| Arts, Entertainment & Recreation | 0 (0.0%) | 0 (0.0%) |
| Accommodation & Food Services | 17 (20.2%) | 67 (79.8%) |
| Public Administration | 36 (76.6%) | 11 (23.4%) |
| Total | 504 (53.7%) | 435 (46.3%) |
Education in Westport
School Enrollment in Westport
The most common levels of schooling among the 511 students in Westport are middle school (146 | 28.6%), high school (120 | 23.5%), and elementary school (117 | 22.9%).
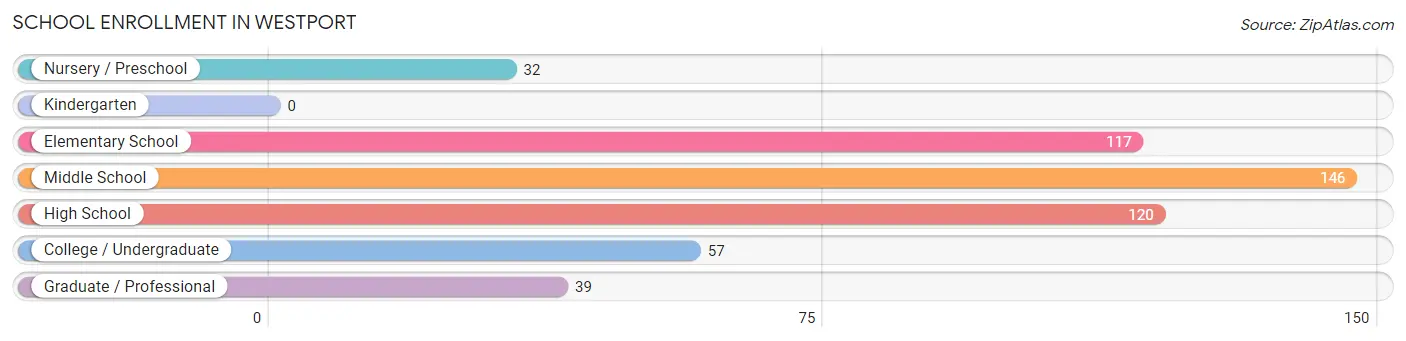
| School Level | # Students | % Students |
| Nursery / Preschool | 32 | 6.3% |
| Kindergarten | 0 | 0.0% |
| Elementary School | 117 | 22.9% |
| Middle School | 146 | 28.6% |
| High School | 120 | 23.5% |
| College / Undergraduate | 57 | 11.2% |
| Graduate / Professional | 39 | 7.6% |
| Total | 511 | 100.0% |
School Enrollment by Age by Funding Source in Westport
Out of a total of 511 students who are enrolled in schools in Westport, 47 (9.2%) attend a private institution, while the remaining 464 (90.8%) are enrolled in public schools. The age group of 25 to 34 year olds has the highest likelihood of being enrolled in private schools, with 19 (76.0% in the age bracket) enrolled. Conversely, the age group of 10 to 14 year olds has the lowest likelihood of being enrolled in a private school, with 146 (100.0% in the age bracket) attending a public institution.
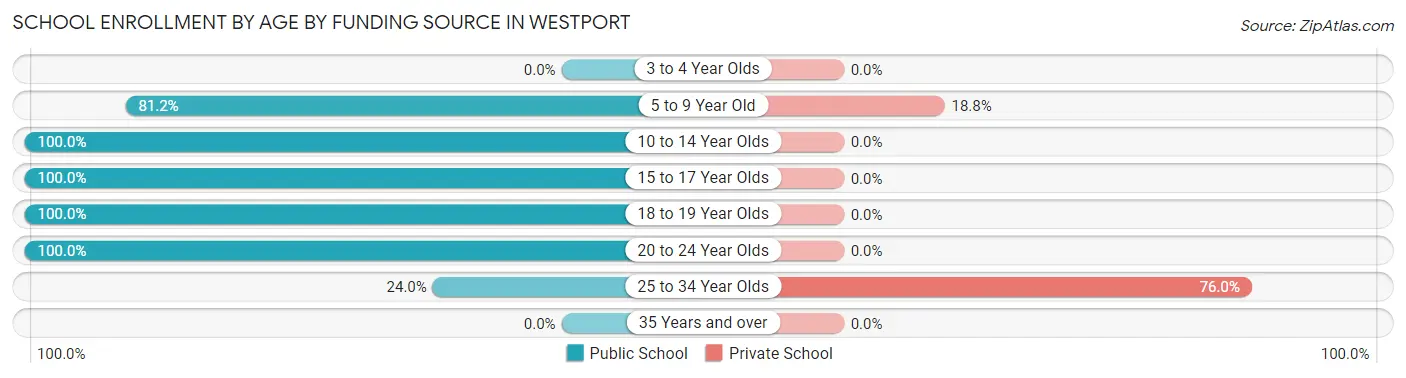
| Age Bracket | Public School | Private School |
| 3 to 4 Year Olds | 0 (0.0%) | 0 (0.0%) |
| 5 to 9 Year Old | 121 (81.2%) | 28 (18.8%) |
| 10 to 14 Year Olds | 146 (100.0%) | 0 (0.0%) |
| 15 to 17 Year Olds | 61 (100.0%) | 0 (0.0%) |
| 18 to 19 Year Olds | 74 (100.0%) | 0 (0.0%) |
| 20 to 24 Year Olds | 56 (100.0%) | 0 (0.0%) |
| 25 to 34 Year Olds | 6 (24.0%) | 19 (76.0%) |
| 35 Years and over | 0 (0.0%) | 0 (0.0%) |
| Total | 464 (90.8%) | 47 (9.2%) |
Educational Attainment by Field of Study in Westport
Science & technology (69 | 21.2%), communications (65 | 20.0%), business (36 | 11.1%), engineering (27 | 8.3%), and bio, nature & agricultural (22 | 6.8%) are the most common fields of study among 325 individuals in Westport who have obtained a bachelor's degree or higher.
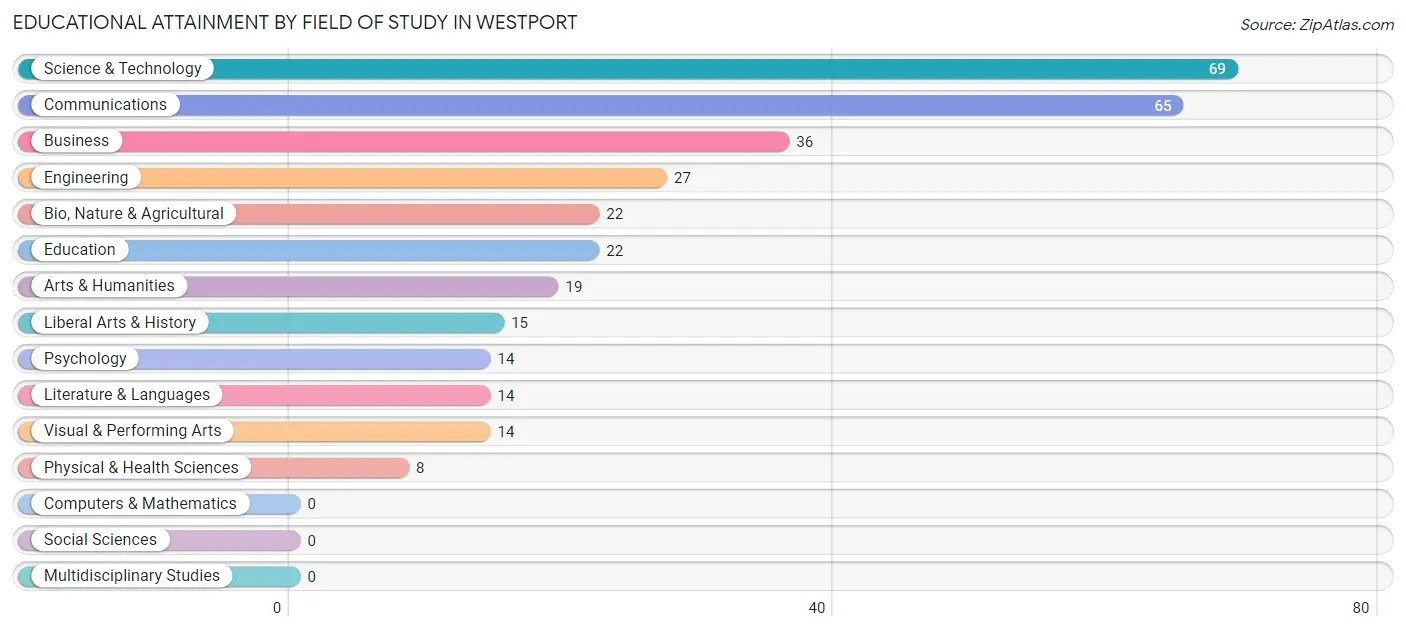
| Field of Study | # Graduates | % Graduates |
| Computers & Mathematics | 0 | 0.0% |
| Bio, Nature & Agricultural | 22 | 6.8% |
| Physical & Health Sciences | 8 | 2.5% |
| Psychology | 14 | 4.3% |
| Social Sciences | 0 | 0.0% |
| Engineering | 27 | 8.3% |
| Multidisciplinary Studies | 0 | 0.0% |
| Science & Technology | 69 | 21.2% |
| Business | 36 | 11.1% |
| Education | 22 | 6.8% |
| Literature & Languages | 14 | 4.3% |
| Liberal Arts & History | 15 | 4.6% |
| Visual & Performing Arts | 14 | 4.3% |
| Communications | 65 | 20.0% |
| Arts & Humanities | 19 | 5.9% |
| Total | 325 | 100.0% |
Transportation & Commute in Westport
Vehicle Availability by Sex in Westport
The most prevalent vehicle ownership categories in Westport are males with 3 vehicles (183, accounting for 36.3%) and females with 3 vehicles (77, making up 47.5%).
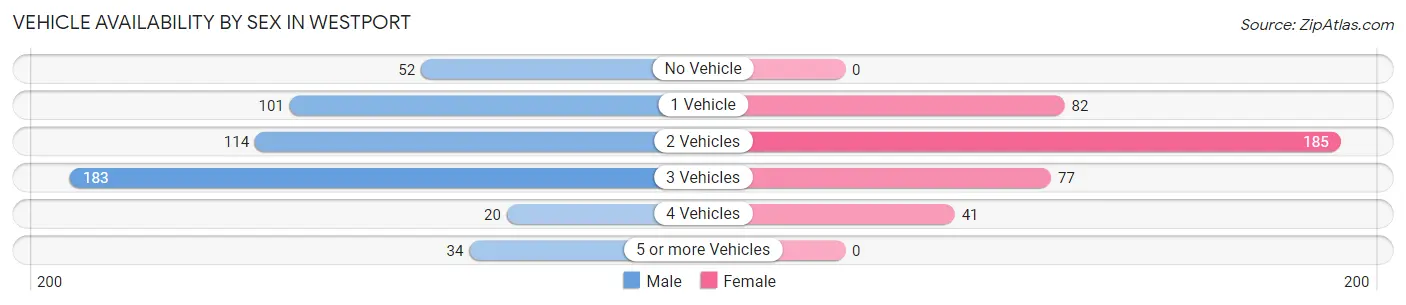
| Vehicles Available | Male | Female |
| No Vehicle | 52 (10.3%) | 0 (0.0%) |
| 1 Vehicle | 101 (20.0%) | 82 (21.3%) |
| 2 Vehicles | 114 (22.6%) | 185 (48.0%) |
| 3 Vehicles | 183 (36.3%) | 77 (20.0%) |
| 4 Vehicles | 20 (4.0%) | 41 (10.6%) |
| 5 or more Vehicles | 34 (6.8%) | 0 (0.0%) |
| Total | 504 (100.0%) | 385 (100.0%) |
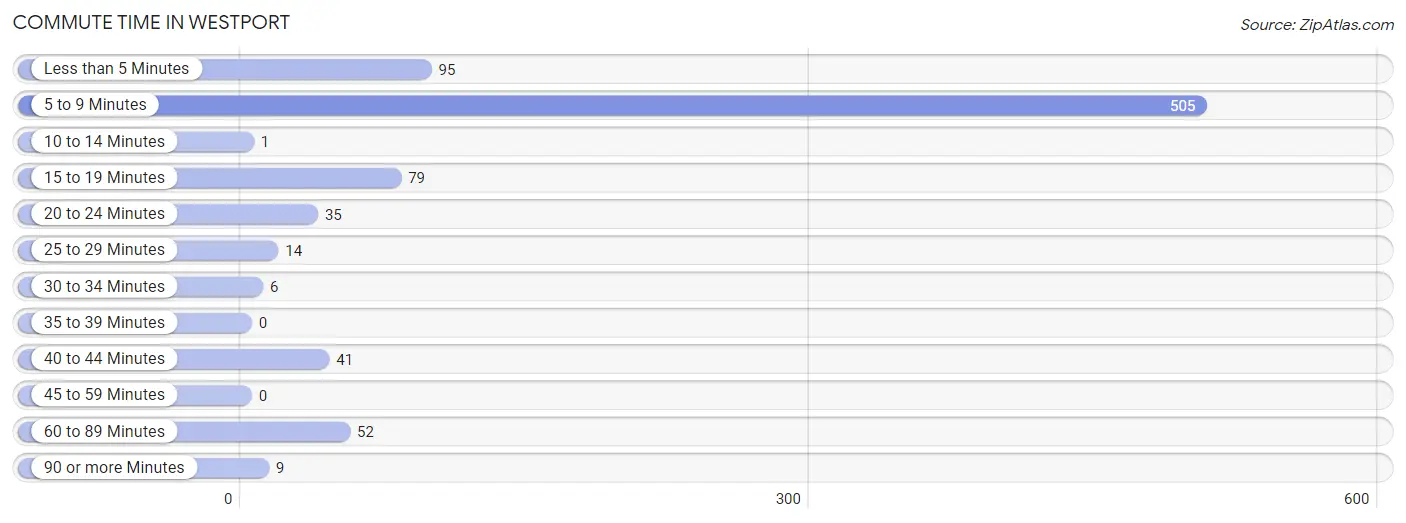
Commute Time in Westport
The most frequently occuring commute durations in Westport are 5 to 9 minutes (505 commuters, 60.3%), less than 5 minutes (95 commuters, 11.4%), and 15 to 19 minutes (79 commuters, 9.4%).
| Commute Time | # Commuters | % Commuters |
| Less than 5 Minutes | 95 | 11.4% |
| 5 to 9 Minutes | 505 | 60.3% |
| 10 to 14 Minutes | 1 | 0.1% |
| 15 to 19 Minutes | 79 | 9.4% |
| 20 to 24 Minutes | 35 | 4.2% |
| 25 to 29 Minutes | 14 | 1.7% |
| 30 to 34 Minutes | 6 | 0.7% |
| 35 to 39 Minutes | 0 | 0.0% |
| 40 to 44 Minutes | 41 | 4.9% |
| 45 to 59 Minutes | 0 | 0.0% |
| 60 to 89 Minutes | 52 | 6.2% |
| 90 or more Minutes | 9 | 1.1% |
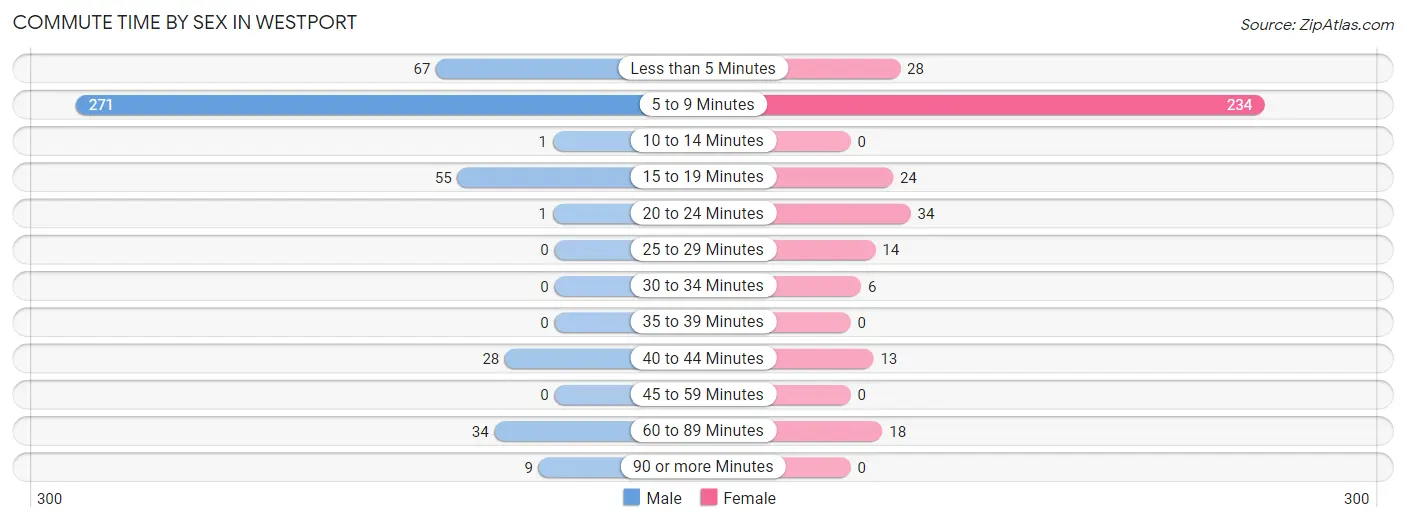
Commute Time by Sex in Westport
The most common commute times in Westport are 5 to 9 minutes (271 commuters, 58.2%) for males and 5 to 9 minutes (234 commuters, 63.1%) for females.
| Commute Time | Male | Female |
| Less than 5 Minutes | 67 (14.4%) | 28 (7.5%) |
| 5 to 9 Minutes | 271 (58.2%) | 234 (63.1%) |
| 10 to 14 Minutes | 1 (0.2%) | 0 (0.0%) |
| 15 to 19 Minutes | 55 (11.8%) | 24 (6.5%) |
| 20 to 24 Minutes | 1 (0.2%) | 34 (9.2%) |
| 25 to 29 Minutes | 0 (0.0%) | 14 (3.8%) |
| 30 to 34 Minutes | 0 (0.0%) | 6 (1.6%) |
| 35 to 39 Minutes | 0 (0.0%) | 0 (0.0%) |
| 40 to 44 Minutes | 28 (6.0%) | 13 (3.5%) |
| 45 to 59 Minutes | 0 (0.0%) | 0 (0.0%) |
| 60 to 89 Minutes | 34 (7.3%) | 18 (4.9%) |
| 90 or more Minutes | 9 (1.9%) | 0 (0.0%) |
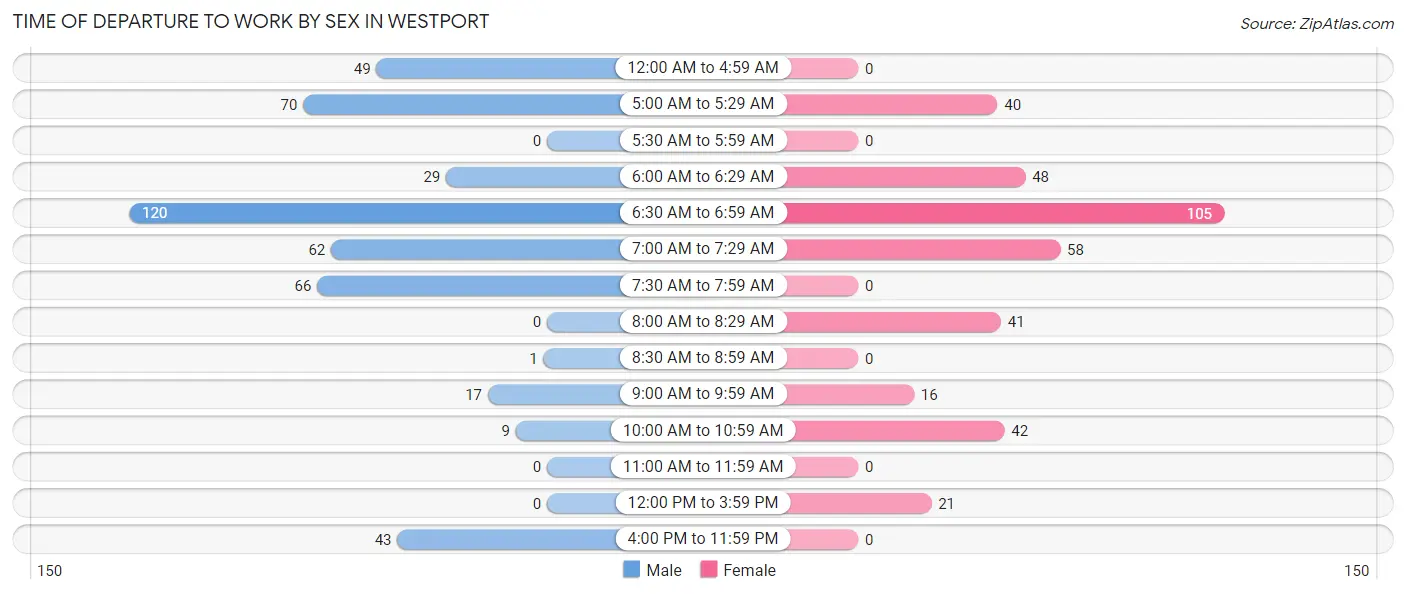
Time of Departure to Work by Sex in Westport
The most frequent times of departure to work in Westport are 6:30 AM to 6:59 AM (120, 25.8%) for males and 6:30 AM to 6:59 AM (105, 28.3%) for females.
| Time of Departure | Male | Female |
| 12:00 AM to 4:59 AM | 49 (10.5%) | 0 (0.0%) |
| 5:00 AM to 5:29 AM | 70 (15.0%) | 40 (10.8%) |
| 5:30 AM to 5:59 AM | 0 (0.0%) | 0 (0.0%) |
| 6:00 AM to 6:29 AM | 29 (6.2%) | 48 (12.9%) |
| 6:30 AM to 6:59 AM | 120 (25.8%) | 105 (28.3%) |
| 7:00 AM to 7:29 AM | 62 (13.3%) | 58 (15.6%) |
| 7:30 AM to 7:59 AM | 66 (14.2%) | 0 (0.0%) |
| 8:00 AM to 8:29 AM | 0 (0.0%) | 41 (11.1%) |
| 8:30 AM to 8:59 AM | 1 (0.2%) | 0 (0.0%) |
| 9:00 AM to 9:59 AM | 17 (3.6%) | 16 (4.3%) |
| 10:00 AM to 10:59 AM | 9 (1.9%) | 42 (11.3%) |
| 11:00 AM to 11:59 AM | 0 (0.0%) | 0 (0.0%) |
| 12:00 PM to 3:59 PM | 0 (0.0%) | 21 (5.7%) |
| 4:00 PM to 11:59 PM | 43 (9.2%) | 0 (0.0%) |
| Total | 466 (100.0%) | 371 (100.0%) |
Housing Occupancy in Westport
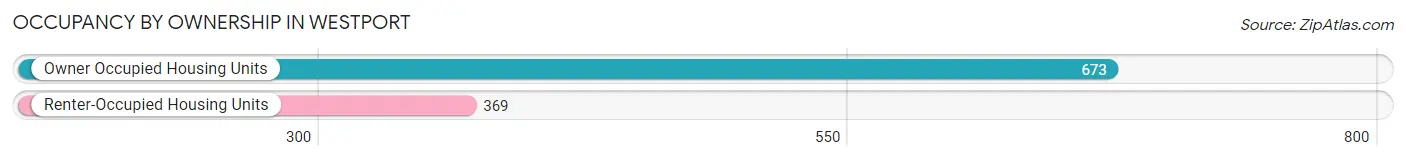
Occupancy by Ownership in Westport
Of the total 1,042 dwellings in Westport, owner-occupied units account for 673 (64.6%), while renter-occupied units make up 369 (35.4%).
| Occupancy | # Housing Units | % Housing Units |
| Owner Occupied Housing Units | 673 | 64.6% |
| Renter-Occupied Housing Units | 369 | 35.4% |
| Total Occupied Housing Units | 1,042 | 100.0% |
Occupancy by Household Size in Westport
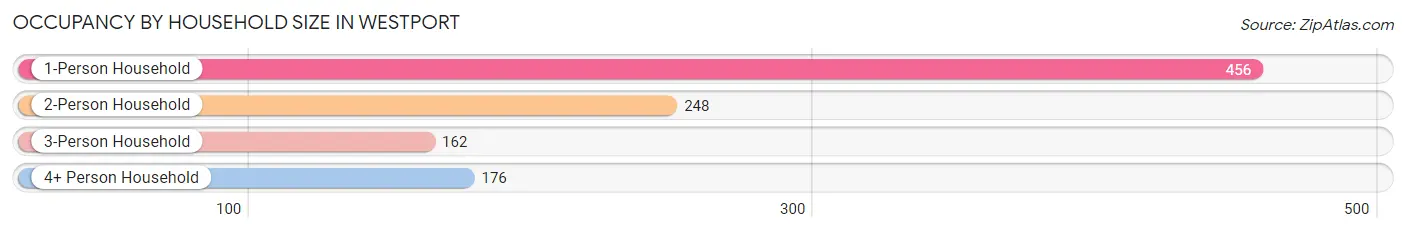
| Household Size | # Housing Units | % Housing Units |
| 1-Person Household | 456 | 43.8% |
| 2-Person Household | 248 | 23.8% |
| 3-Person Household | 162 | 15.5% |
| 4+ Person Household | 176 | 16.9% |
| Total Housing Units | 1,042 | 100.0% |
Occupancy by Ownership by Household Size in Westport
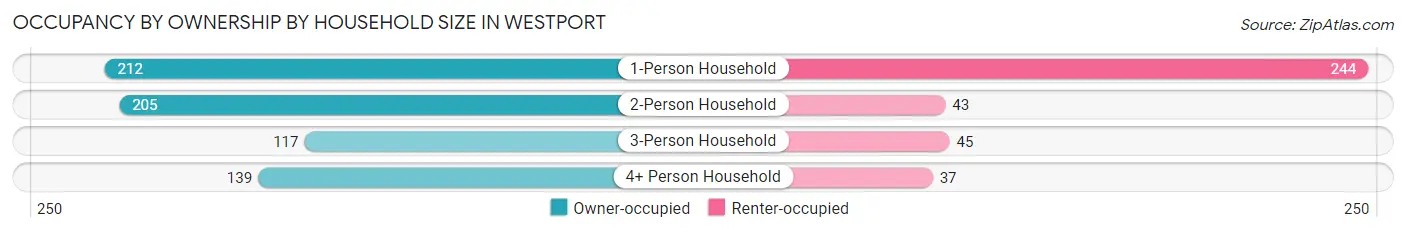
| Household Size | Owner-occupied | Renter-occupied |
| 1-Person Household | 212 (46.5%) | 244 (53.5%) |
| 2-Person Household | 205 (82.7%) | 43 (17.3%) |
| 3-Person Household | 117 (72.2%) | 45 (27.8%) |
| 4+ Person Household | 139 (79.0%) | 37 (21.0%) |
| Total Housing Units | 673 (64.6%) | 369 (35.4%) |
Occupancy by Educational Attainment in Westport
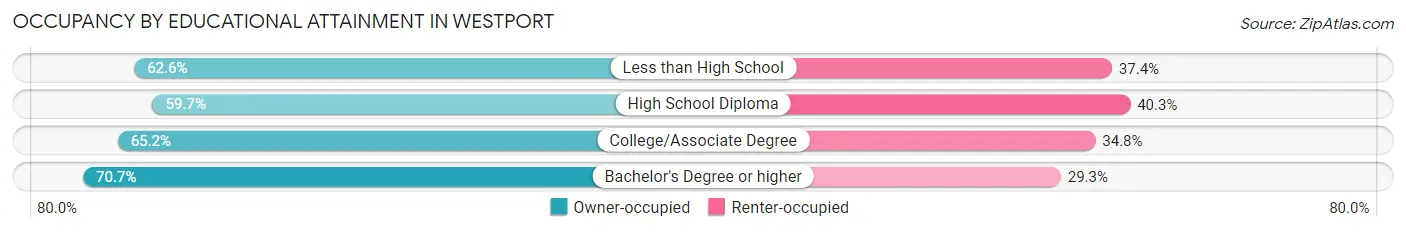
| Household Size | Owner-occupied | Renter-occupied |
| Less than High School | 72 (62.6%) | 43 (37.4%) |
| High School Diploma | 206 (59.7%) | 139 (40.3%) |
| College/Associate Degree | 197 (65.2%) | 105 (34.8%) |
| Bachelor's Degree or higher | 198 (70.7%) | 82 (29.3%) |
Occupancy by Age of Householder in Westport
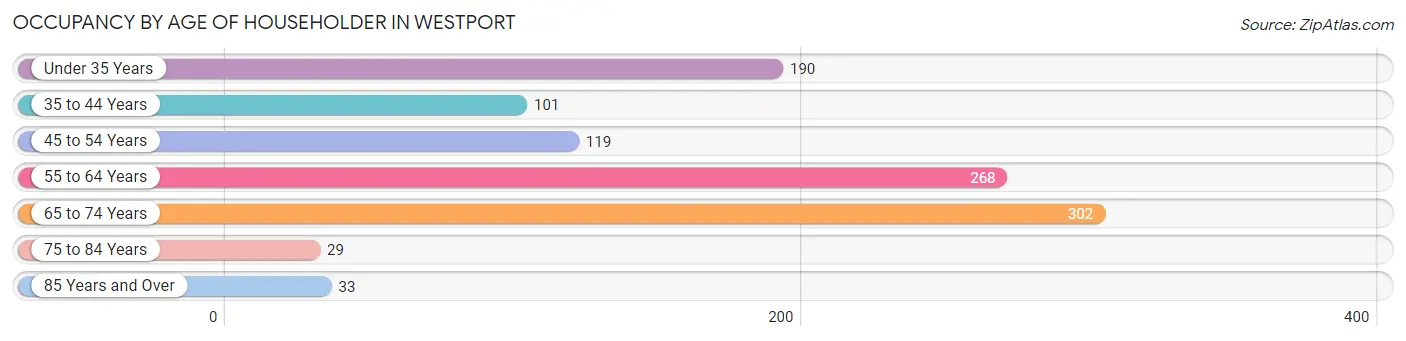
| Age Bracket | # Households | % Households |
| Under 35 Years | 190 | 18.2% |
| 35 to 44 Years | 101 | 9.7% |
| 45 to 54 Years | 119 | 11.4% |
| 55 to 64 Years | 268 | 25.7% |
| 65 to 74 Years | 302 | 29.0% |
| 75 to 84 Years | 29 | 2.8% |
| 85 Years and Over | 33 | 3.2% |
| Total | 1,042 | 100.0% |
Housing Finances in Westport
Median Income by Occupancy in Westport
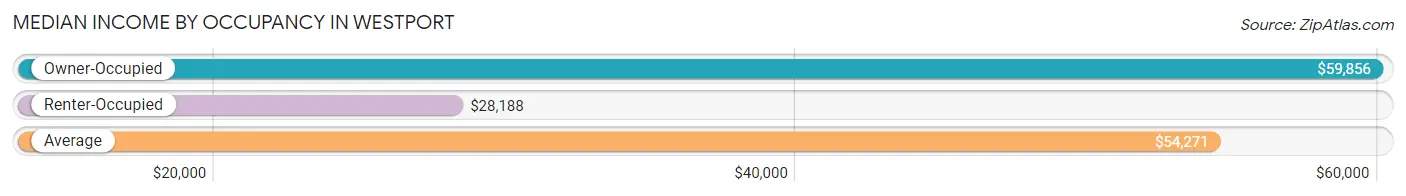
| Occupancy Type | # Households | Median Income |
| Owner-Occupied | 673 (64.6%) | $59,856 |
| Renter-Occupied | 369 (35.4%) | $28,188 |
| Average | 1,042 (100.0%) | $54,271 |
Occupancy by Householder Income Bracket in Westport
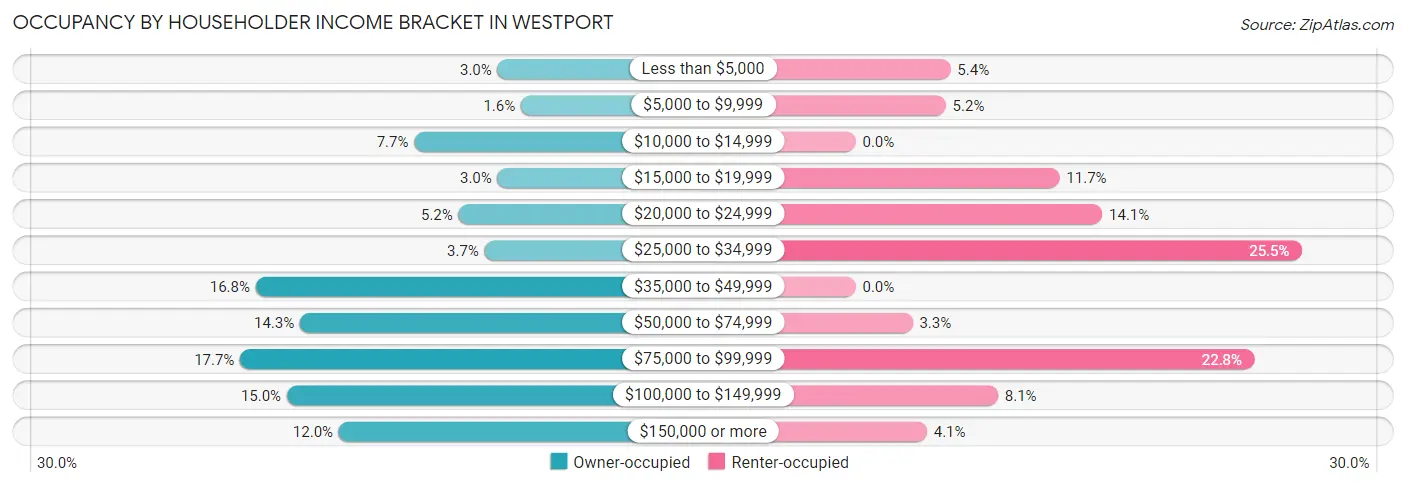
| Income Bracket | Owner-occupied | Renter-occupied |
| Less than $5,000 | 20 (3.0%) | 20 (5.4%) |
| $5,000 to $9,999 | 11 (1.6%) | 19 (5.1%) |
| $10,000 to $14,999 | 52 (7.7%) | 0 (0.0%) |
| $15,000 to $19,999 | 20 (3.0%) | 43 (11.7%) |
| $20,000 to $24,999 | 35 (5.2%) | 52 (14.1%) |
| $25,000 to $34,999 | 25 (3.7%) | 94 (25.5%) |
| $35,000 to $49,999 | 113 (16.8%) | 0 (0.0%) |
| $50,000 to $74,999 | 96 (14.3%) | 12 (3.3%) |
| $75,000 to $99,999 | 119 (17.7%) | 84 (22.8%) |
| $100,000 to $149,999 | 101 (15.0%) | 30 (8.1%) |
| $150,000 or more | 81 (12.0%) | 15 (4.1%) |
| Total | 673 (100.0%) | 369 (100.0%) |
Monthly Housing Cost Tiers in Westport
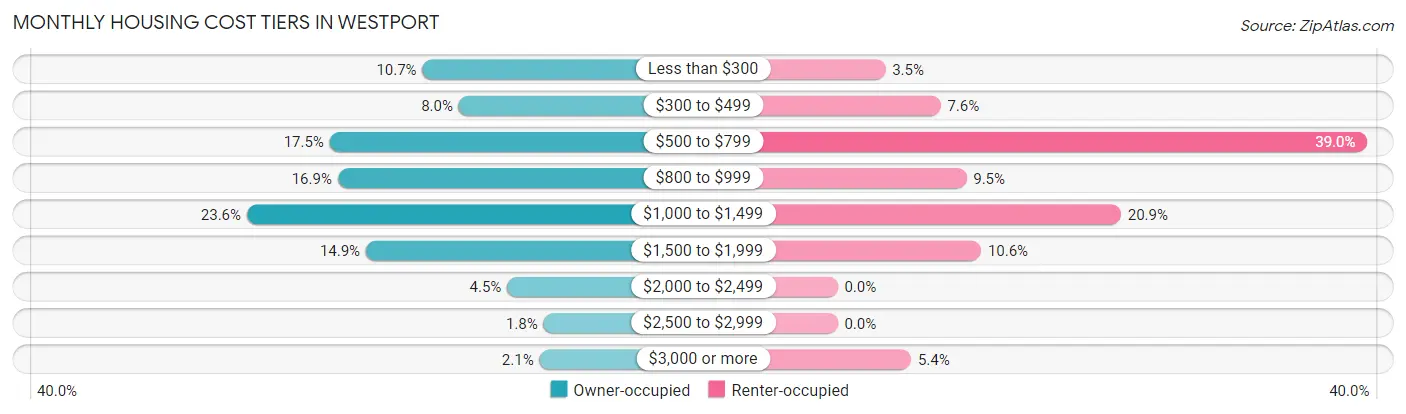
| Monthly Cost | Owner-occupied | Renter-occupied |
| Less than $300 | 72 (10.7%) | 13 (3.5%) |
| $300 to $499 | 54 (8.0%) | 28 (7.6%) |
| $500 to $799 | 118 (17.5%) | 144 (39.0%) |
| $800 to $999 | 114 (16.9%) | 35 (9.5%) |
| $1,000 to $1,499 | 159 (23.6%) | 77 (20.9%) |
| $1,500 to $1,999 | 100 (14.9%) | 39 (10.6%) |
| $2,000 to $2,499 | 30 (4.5%) | 0 (0.0%) |
| $2,500 to $2,999 | 12 (1.8%) | 0 (0.0%) |
| $3,000 or more | 14 (2.1%) | 20 (5.4%) |
| Total | 673 (100.0%) | 369 (100.0%) |
Physical Housing Characteristics in Westport
Housing Structures in Westport
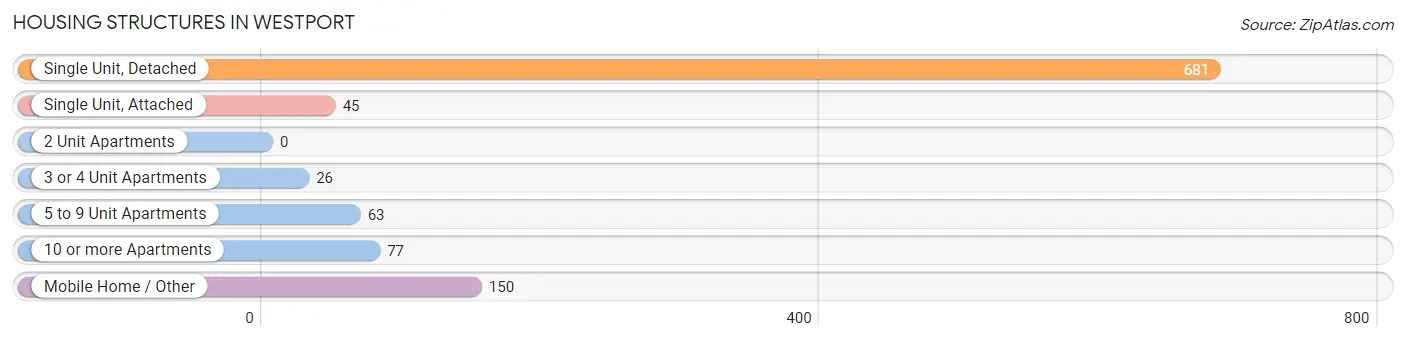
| Structure Type | # Housing Units | % Housing Units |
| Single Unit, Detached | 681 | 65.4% |
| Single Unit, Attached | 45 | 4.3% |
| 2 Unit Apartments | 0 | 0.0% |
| 3 or 4 Unit Apartments | 26 | 2.5% |
| 5 to 9 Unit Apartments | 63 | 6.0% |
| 10 or more Apartments | 77 | 7.4% |
| Mobile Home / Other | 150 | 14.4% |
| Total | 1,042 | 100.0% |
Housing Structures by Occupancy in Westport
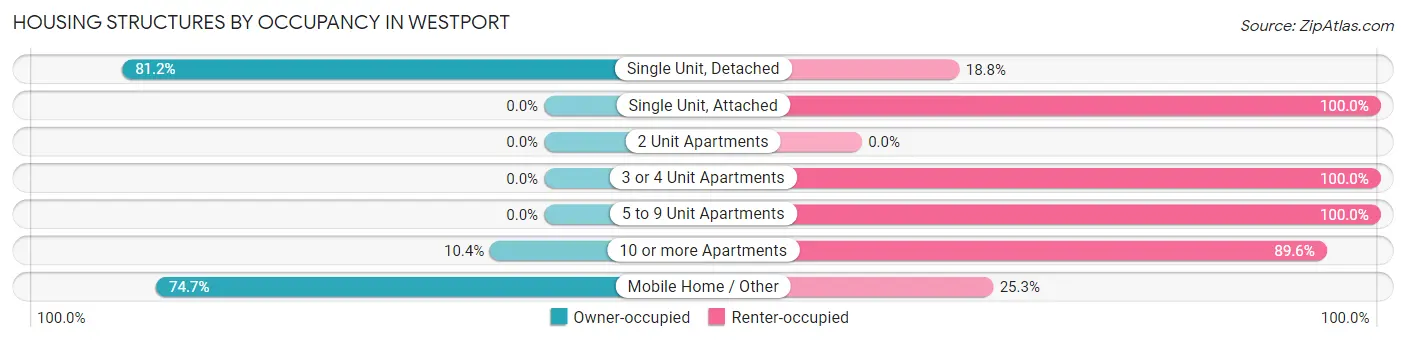
| Structure Type | Owner-occupied | Renter-occupied |
| Single Unit, Detached | 553 (81.2%) | 128 (18.8%) |
| Single Unit, Attached | 0 (0.0%) | 45 (100.0%) |
| 2 Unit Apartments | 0 (0.0%) | 0 (0.0%) |
| 3 or 4 Unit Apartments | 0 (0.0%) | 26 (100.0%) |
| 5 to 9 Unit Apartments | 0 (0.0%) | 63 (100.0%) |
| 10 or more Apartments | 8 (10.4%) | 69 (89.6%) |
| Mobile Home / Other | 112 (74.7%) | 38 (25.3%) |
| Total | 673 (64.6%) | 369 (35.4%) |
Housing Structures by Number of Rooms in Westport
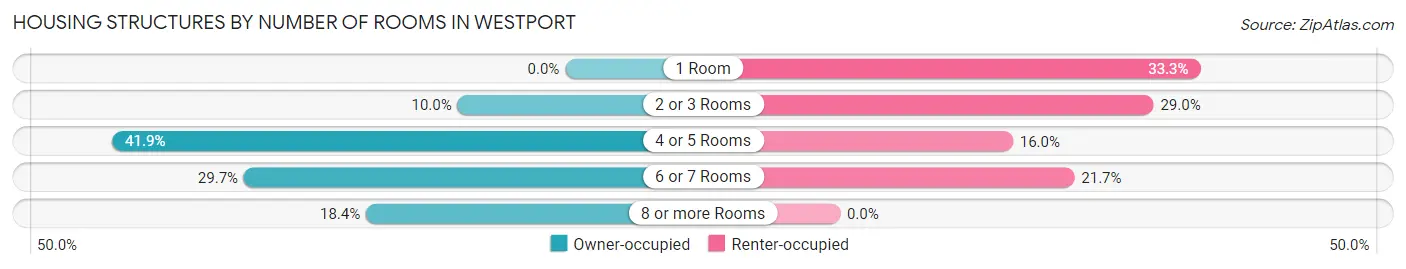
| Number of Rooms | Owner-occupied | Renter-occupied |
| 1 Room | 0 (0.0%) | 123 (33.3%) |
| 2 or 3 Rooms | 67 (10.0%) | 107 (29.0%) |
| 4 or 5 Rooms | 282 (41.9%) | 59 (16.0%) |
| 6 or 7 Rooms | 200 (29.7%) | 80 (21.7%) |
| 8 or more Rooms | 124 (18.4%) | 0 (0.0%) |
| Total | 673 (100.0%) | 369 (100.0%) |
Housing Structure by Heating Type in Westport
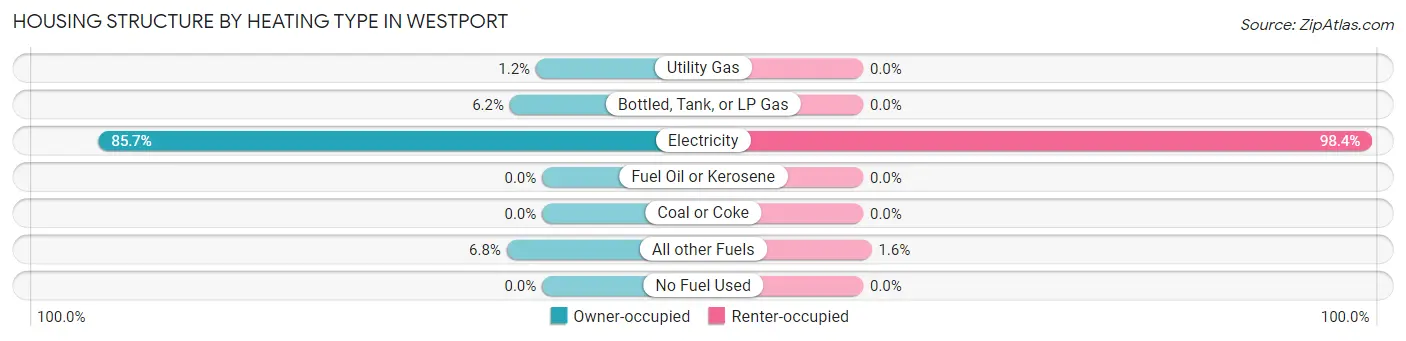
| Heating Type | Owner-occupied | Renter-occupied |
| Utility Gas | 8 (1.2%) | 0 (0.0%) |
| Bottled, Tank, or LP Gas | 42 (6.2%) | 0 (0.0%) |
| Electricity | 577 (85.7%) | 363 (98.4%) |
| Fuel Oil or Kerosene | 0 (0.0%) | 0 (0.0%) |
| Coal or Coke | 0 (0.0%) | 0 (0.0%) |
| All other Fuels | 46 (6.8%) | 6 (1.6%) |
| No Fuel Used | 0 (0.0%) | 0 (0.0%) |
| Total | 673 (100.0%) | 369 (100.0%) |
Household Vehicle Usage in Westport
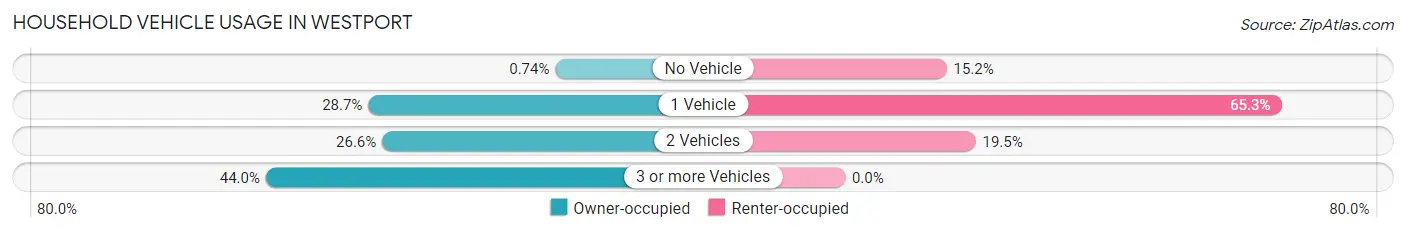
| Vehicles per Household | Owner-occupied | Renter-occupied |
| No Vehicle | 5 (0.7%) | 56 (15.2%) |
| 1 Vehicle | 193 (28.7%) | 241 (65.3%) |
| 2 Vehicles | 179 (26.6%) | 72 (19.5%) |
| 3 or more Vehicles | 296 (44.0%) | 0 (0.0%) |
| Total | 673 (100.0%) | 369 (100.0%) |
Real Estate & Mortgages in Westport
Real Estate and Mortgage Overview in Westport
| Characteristic | Without Mortgage | With Mortgage |
| Housing Units | 265 | 408 |
| Median Property Value | $170,800 | $225,000 |
| Median Household Income | $40,680 | $53 |
| Monthly Housing Costs | $535 | $14 |
| Real Estate Taxes | $2,082 | $5 |
Property Value by Mortgage Status in Westport
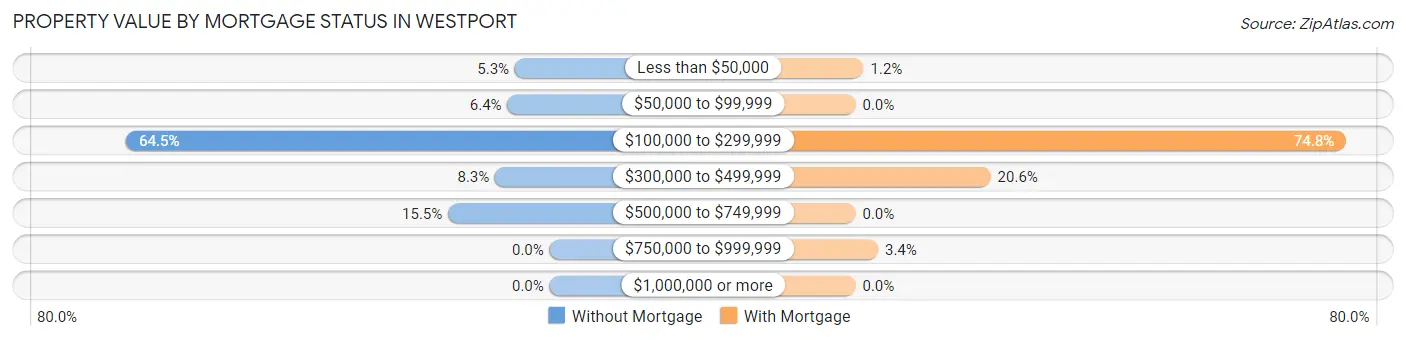
| Property Value | Without Mortgage | With Mortgage |
| Less than $50,000 | 14 (5.3%) | 5 (1.2%) |
| $50,000 to $99,999 | 17 (6.4%) | 0 (0.0%) |
| $100,000 to $299,999 | 171 (64.5%) | 305 (74.8%) |
| $300,000 to $499,999 | 22 (8.3%) | 84 (20.6%) |
| $500,000 to $749,999 | 41 (15.5%) | 0 (0.0%) |
| $750,000 to $999,999 | 0 (0.0%) | 14 (3.4%) |
| $1,000,000 or more | 0 (0.0%) | 0 (0.0%) |
| Total | 265 (100.0%) | 408 (100.0%) |
Household Income by Mortgage Status in Westport
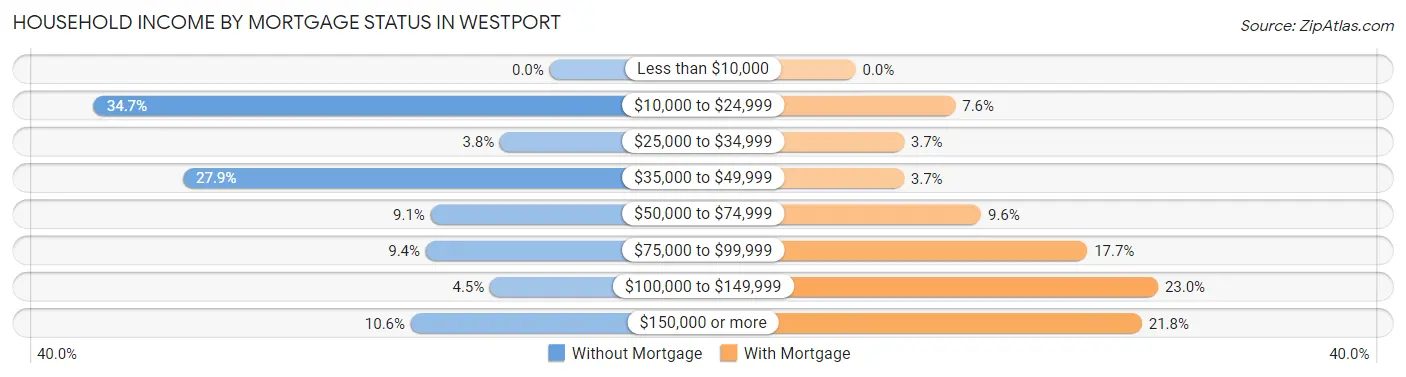
| Household Income | Without Mortgage | With Mortgage |
| Less than $10,000 | 0 (0.0%) | 0 (0.0%) |
| $10,000 to $24,999 | 92 (34.7%) | 31 (7.6%) |
| $25,000 to $34,999 | 10 (3.8%) | 15 (3.7%) |
| $35,000 to $49,999 | 74 (27.9%) | 15 (3.7%) |
| $50,000 to $74,999 | 24 (9.1%) | 39 (9.6%) |
| $75,000 to $99,999 | 25 (9.4%) | 72 (17.6%) |
| $100,000 to $149,999 | 12 (4.5%) | 94 (23.0%) |
| $150,000 or more | 28 (10.6%) | 89 (21.8%) |
| Total | 265 (100.0%) | 408 (100.0%) |
Property Value to Household Income Ratio in Westport
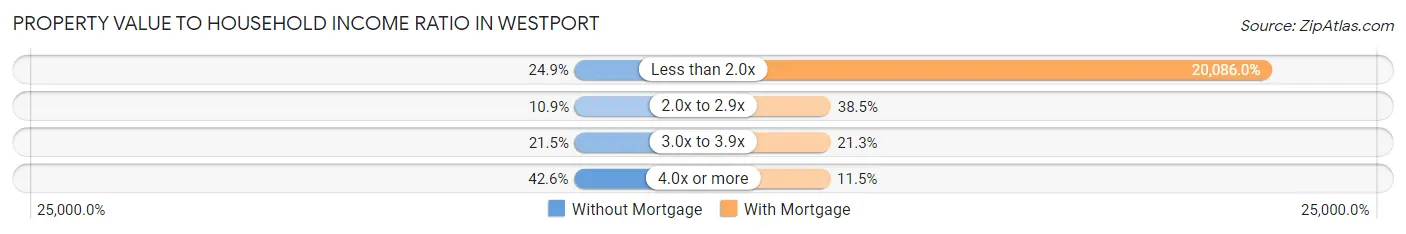
| Value-to-Income Ratio | Without Mortgage | With Mortgage |
| Less than 2.0x | 66 (24.9%) | 81,951 (20,086.0%) |
| 2.0x to 2.9x | 29 (10.9%) | 157 (38.5%) |
| 3.0x to 3.9x | 57 (21.5%) | 87 (21.3%) |
| 4.0x or more | 113 (42.6%) | 47 (11.5%) |
| Total | 265 (100.0%) | 408 (100.0%) |
Real Estate Taxes by Mortgage Status in Westport
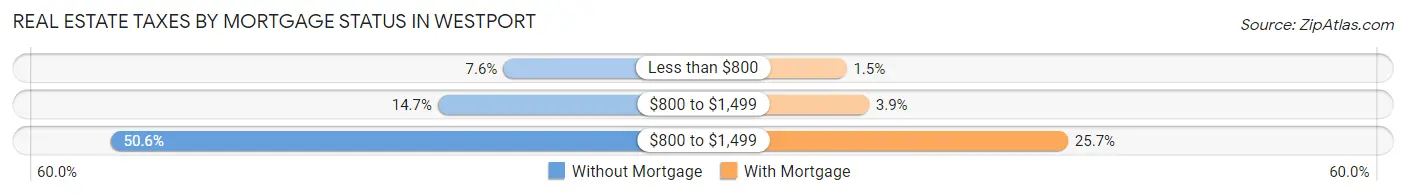
| Property Taxes | Without Mortgage | With Mortgage |
| Less than $800 | 20 (7.5%) | 6 (1.5%) |
| $800 to $1,499 | 39 (14.7%) | 16 (3.9%) |
| $800 to $1,499 | 134 (50.6%) | 105 (25.7%) |
| Total | 265 (100.0%) | 408 (100.0%) |
Health & Disability in Westport
Health Insurance Coverage by Age in Westport
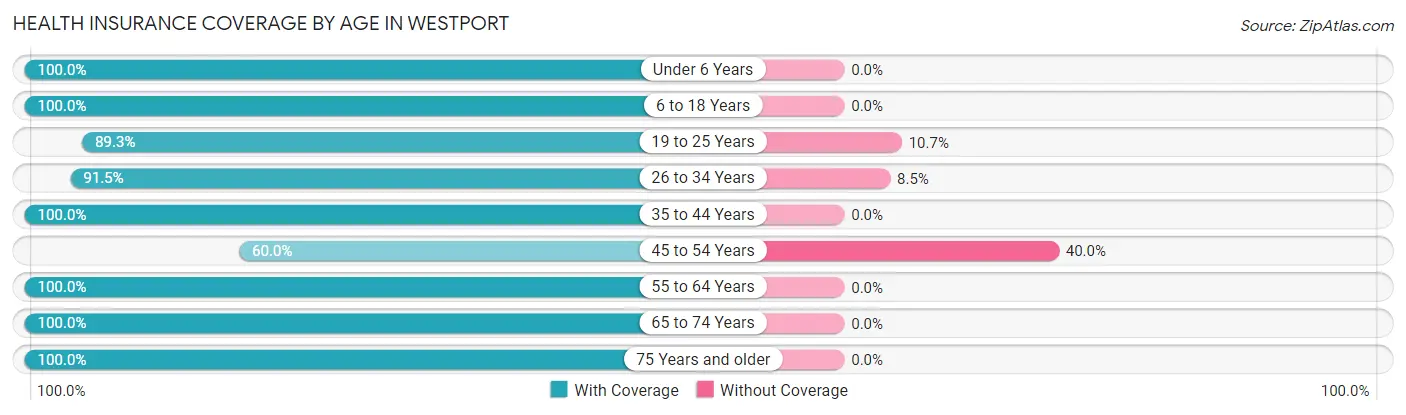
| Age Bracket | With Coverage | Without Coverage |
| Under 6 Years | 245 (100.0%) | 0 (0.0%) |
| 6 to 18 Years | 383 (100.0%) | 0 (0.0%) |
| 19 to 25 Years | 150 (89.3%) | 18 (10.7%) |
| 26 to 34 Years | 332 (91.5%) | 31 (8.5%) |
| 35 to 44 Years | 210 (100.0%) | 0 (0.0%) |
| 45 to 54 Years | 120 (60.0%) | 80 (40.0%) |
| 55 to 64 Years | 384 (100.0%) | 0 (0.0%) |
| 65 to 74 Years | 427 (100.0%) | 0 (0.0%) |
| 75 Years and older | 109 (100.0%) | 0 (0.0%) |
| Total | 2,360 (94.8%) | 129 (5.2%) |
Health Insurance Coverage by Citizenship Status in Westport
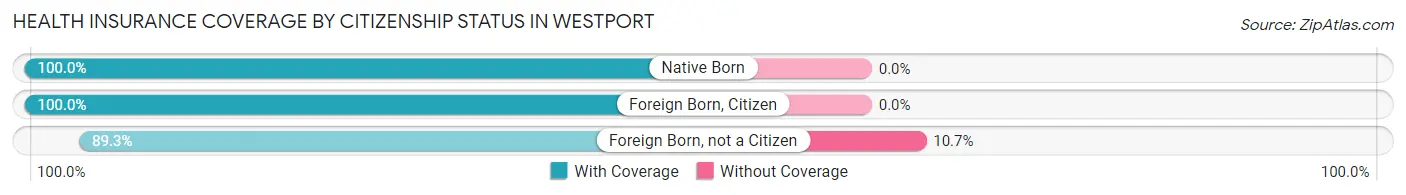
| Citizenship Status | With Coverage | Without Coverage |
| Native Born | 245 (100.0%) | 0 (0.0%) |
| Foreign Born, Citizen | 383 (100.0%) | 0 (0.0%) |
| Foreign Born, not a Citizen | 150 (89.3%) | 18 (10.7%) |
Health Insurance Coverage by Household Income in Westport
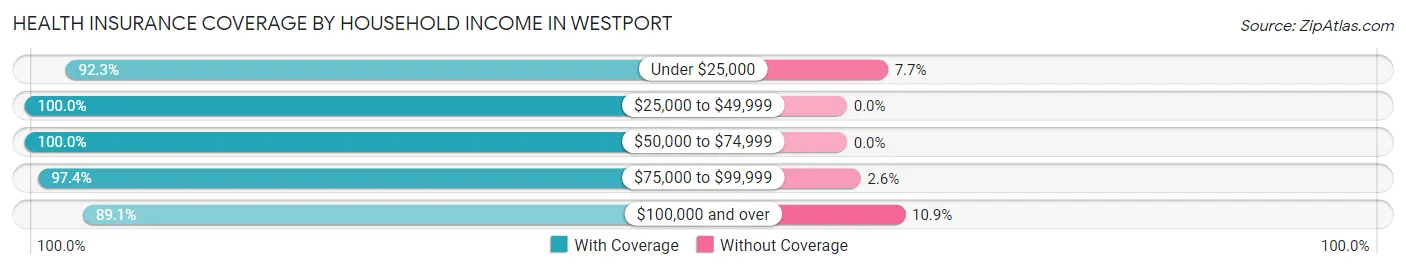
| Household Income | With Coverage | Without Coverage |
| Under $25,000 | 554 (92.3%) | 46 (7.7%) |
| $25,000 to $49,999 | 406 (100.0%) | 0 (0.0%) |
| $50,000 to $74,999 | 179 (100.0%) | 0 (0.0%) |
| $75,000 to $99,999 | 685 (97.4%) | 18 (2.6%) |
| $100,000 and over | 531 (89.1%) | 65 (10.9%) |
Public vs Private Health Insurance Coverage by Age in Westport
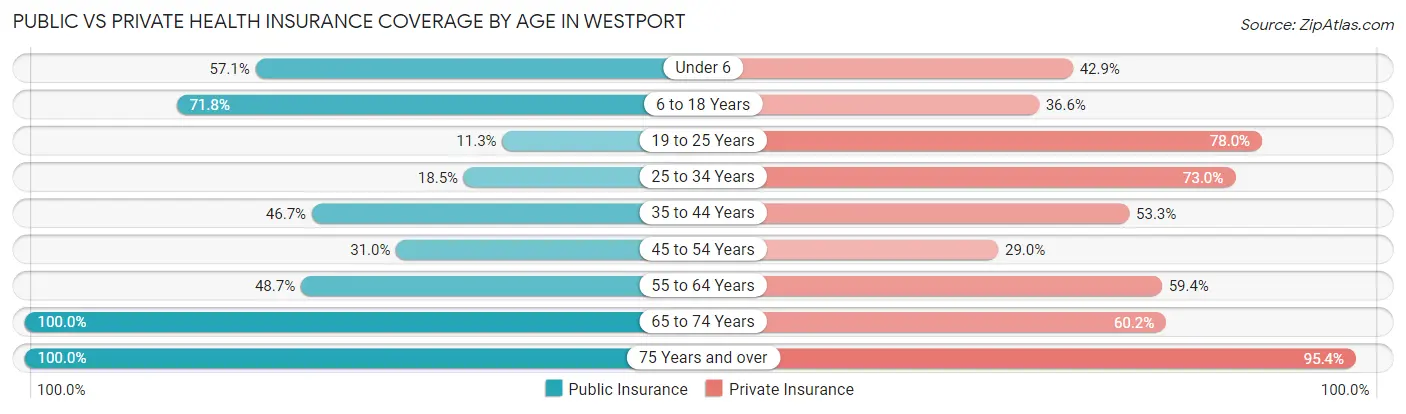
| Age Bracket | Public Insurance | Private Insurance |
| Under 6 | 140 (57.1%) | 105 (42.9%) |
| 6 to 18 Years | 275 (71.8%) | 140 (36.5%) |
| 19 to 25 Years | 19 (11.3%) | 131 (78.0%) |
| 25 to 34 Years | 67 (18.5%) | 265 (73.0%) |
| 35 to 44 Years | 98 (46.7%) | 112 (53.3%) |
| 45 to 54 Years | 62 (31.0%) | 58 (29.0%) |
| 55 to 64 Years | 187 (48.7%) | 228 (59.4%) |
| 65 to 74 Years | 427 (100.0%) | 257 (60.2%) |
| 75 Years and over | 109 (100.0%) | 104 (95.4%) |
| Total | 1,384 (55.6%) | 1,400 (56.2%) |
Disability Status by Sex by Age in Westport
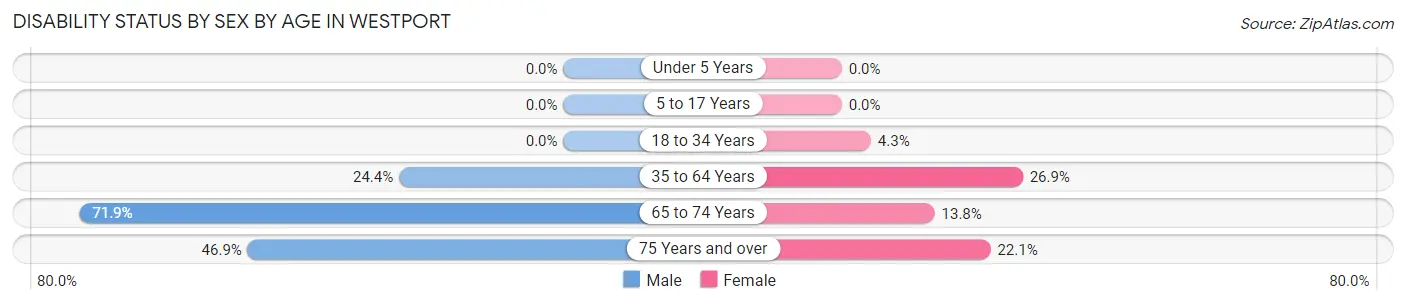
| Age Bracket | Male | Female |
| Under 5 Years | 0 (0.0%) | 0 (0.0%) |
| 5 to 17 Years | 0 (0.0%) | 0 (0.0%) |
| 18 to 34 Years | 0 (0.0%) | 13 (4.3%) |
| 35 to 64 Years | 82 (24.4%) | 123 (26.9%) |
| 65 to 74 Years | 166 (71.9%) | 27 (13.8%) |
| 75 Years and over | 15 (46.9%) | 17 (22.1%) |
Disability Class by Sex by Age in Westport
Disability Class: Hearing Difficulty
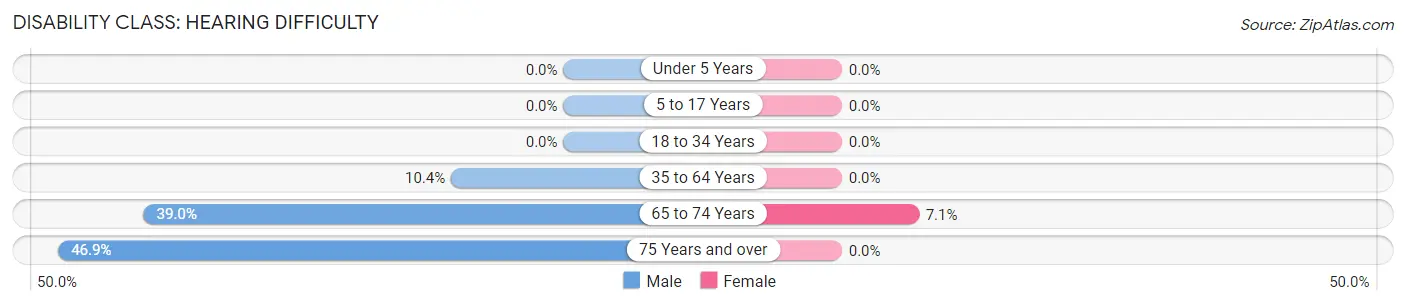
| Age Bracket | Male | Female |
| Under 5 Years | 0 (0.0%) | 0 (0.0%) |
| 5 to 17 Years | 0 (0.0%) | 0 (0.0%) |
| 18 to 34 Years | 0 (0.0%) | 0 (0.0%) |
| 35 to 64 Years | 35 (10.4%) | 0 (0.0%) |
| 65 to 74 Years | 90 (39.0%) | 14 (7.1%) |
| 75 Years and over | 15 (46.9%) | 0 (0.0%) |
Disability Class: Vision Difficulty
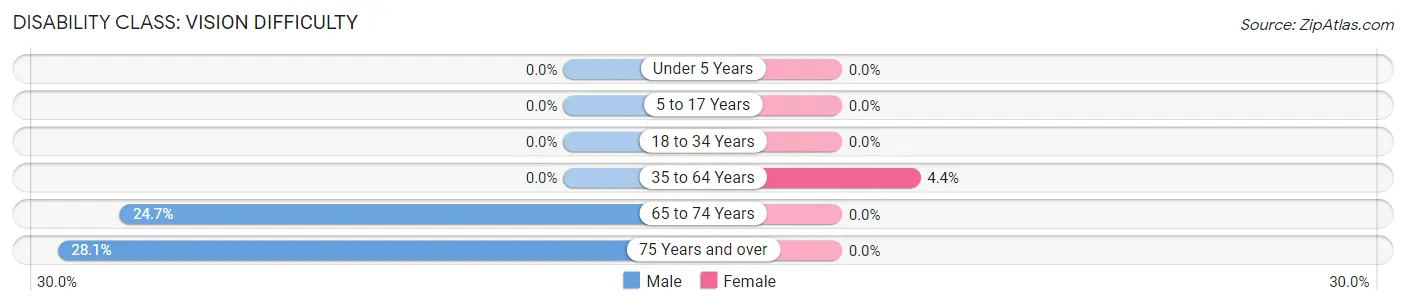
| Age Bracket | Male | Female |
| Under 5 Years | 0 (0.0%) | 0 (0.0%) |
| 5 to 17 Years | 0 (0.0%) | 0 (0.0%) |
| 18 to 34 Years | 0 (0.0%) | 0 (0.0%) |
| 35 to 64 Years | 0 (0.0%) | 20 (4.4%) |
| 65 to 74 Years | 57 (24.7%) | 0 (0.0%) |
| 75 Years and over | 9 (28.1%) | 0 (0.0%) |
Disability Class: Cognitive Difficulty
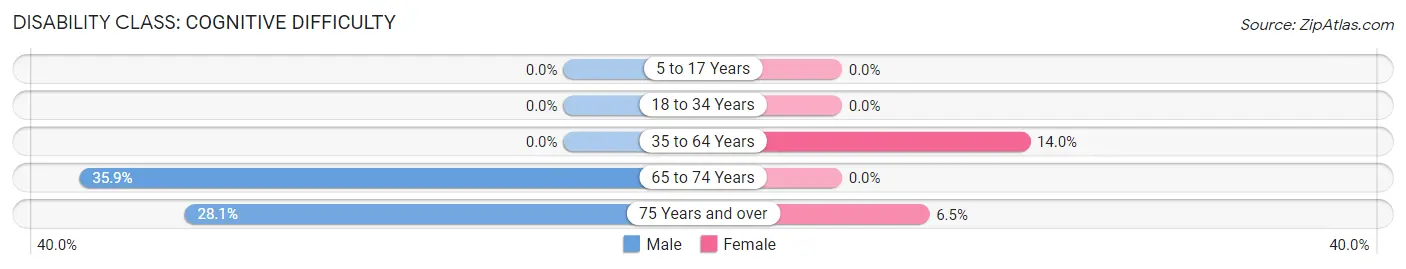
| Age Bracket | Male | Female |
| 5 to 17 Years | 0 (0.0%) | 0 (0.0%) |
| 18 to 34 Years | 0 (0.0%) | 0 (0.0%) |
| 35 to 64 Years | 0 (0.0%) | 64 (14.0%) |
| 65 to 74 Years | 83 (35.9%) | 0 (0.0%) |
| 75 Years and over | 9 (28.1%) | 5 (6.5%) |
Disability Class: Ambulatory Difficulty
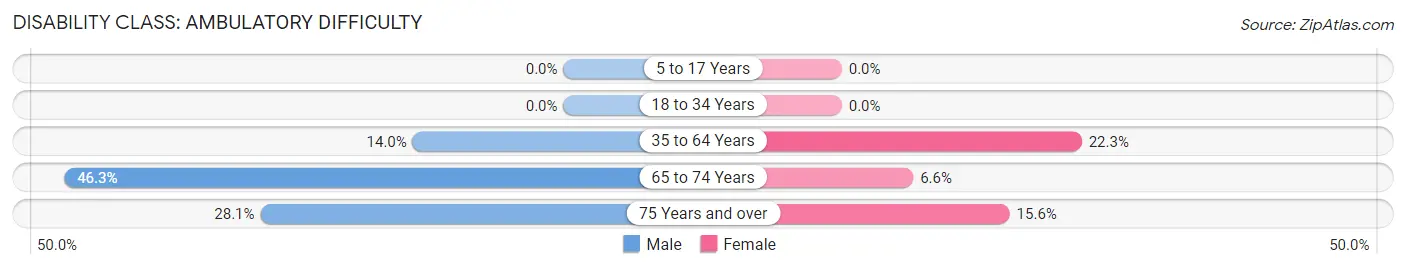
| Age Bracket | Male | Female |
| 5 to 17 Years | 0 (0.0%) | 0 (0.0%) |
| 18 to 34 Years | 0 (0.0%) | 0 (0.0%) |
| 35 to 64 Years | 47 (14.0%) | 102 (22.3%) |
| 65 to 74 Years | 107 (46.3%) | 13 (6.6%) |
| 75 Years and over | 9 (28.1%) | 12 (15.6%) |
Disability Class: Self-Care Difficulty
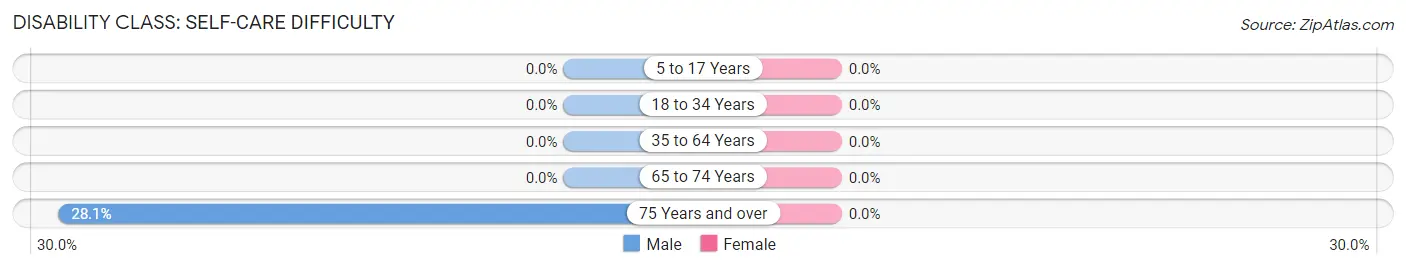
| Age Bracket | Male | Female |
| 5 to 17 Years | 0 (0.0%) | 0 (0.0%) |
| 18 to 34 Years | 0 (0.0%) | 0 (0.0%) |
| 35 to 64 Years | 0 (0.0%) | 0 (0.0%) |
| 65 to 74 Years | 0 (0.0%) | 0 (0.0%) |
| 75 Years and over | 9 (28.1%) | 0 (0.0%) |
Technology Access in Westport
Computing Device Access in Westport
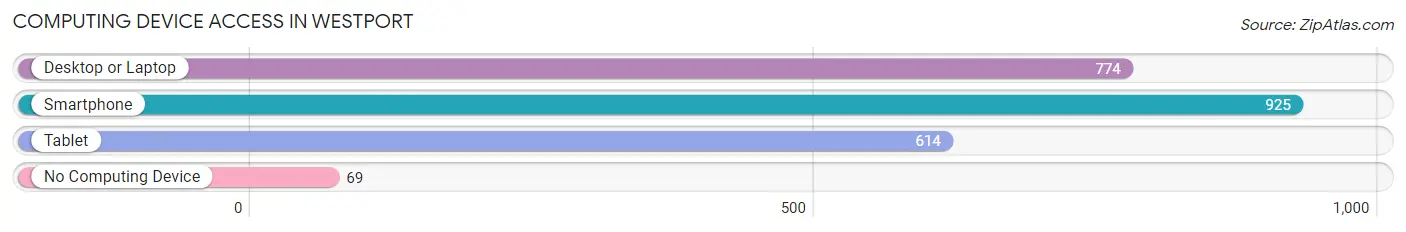
| Device Type | # Households | % Households |
| Desktop or Laptop | 774 | 74.3% |
| Smartphone | 925 | 88.8% |
| Tablet | 614 | 58.9% |
| No Computing Device | 69 | 6.6% |
| Total | 1,042 | 100.0% |
Internet Access in Westport
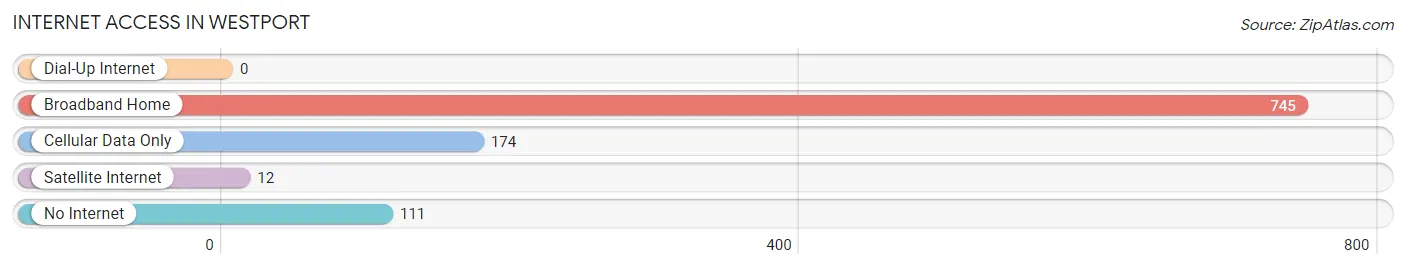
| Internet Type | # Households | % Households |
| Dial-Up Internet | 0 | 0.0% |
| Broadband Home | 745 | 71.5% |
| Cellular Data Only | 174 | 16.7% |
| Satellite Internet | 12 | 1.1% |
| No Internet | 111 | 10.6% |
| Total | 1,042 | 100.0% |
Westport Summary
Westport, Washington is a small city located in Grays Harbor County on the southwestern coast of the state. It is situated on the mouth of the Chehalis River, which empties into the Pacific Ocean. The city is known for its fishing industry, which has been a major part of the local economy since the late 19th century.
History
Westport was first settled in 1853 by a group of settlers from the Oregon Territory. The settlement was originally called New Chehalis, but was later renamed Westport in 1871. The name was chosen to reflect the city’s location on the western side of the Chehalis River.
The city was incorporated in 1891 and quickly became a major port for the lumber industry. The city’s economy was further bolstered by the arrival of the railroad in 1892, which allowed for the transport of goods and passengers to and from the city.
The fishing industry began to take off in the early 20th century, and by the 1950s, Westport had become one of the largest fishing ports on the West Coast. The city’s economy was further bolstered by the construction of a cannery in the 1960s, which allowed for the processing of fish and other seafood products.
Geography
Westport is located on the southwestern coast of Washington, on the mouth of the Chehalis River. The city is situated on a peninsula, with the Pacific Ocean to the west and Grays Harbor to the east. The city is surrounded by a number of small islands, including Grayland, Ocean Shores, and Westport Island.
The city has a total area of 4.3 square miles, of which 0.2 square miles is water. The city is located at an elevation of 16 feet above sea level.
Economy
Westport’s economy is largely based on the fishing industry. The city is home to a number of seafood processing plants, as well as a number of fishing fleets. The city is also home to a number of tourist attractions, including a marina, a lighthouse, and a number of beaches.
The city is also home to a number of retail stores, restaurants, and other businesses. The city is served by a number of transportation services, including a ferry service to nearby cities.
Demographics
As of the 2010 census, Westport had a population of 2,099. The racial makeup of the city was 92.2% White, 0.7% African American, 0.7% Native American, 0.7% Asian, 0.2% Pacific Islander, and 4.3% from other races. Hispanic or Latino of any race were 5.2% of the population.
The median income for a household in the city was $37,500, and the median income for a family was $45,000. The per capita income for the city was $20,845. About 11.2% of families and 14.2% of the population were below the poverty line, including 18.2% of those under age 18 and 8.3% of those age 65 or over.
Common Questions
What is Per Capita Income in Westport?
Per Capita income in Westport is $31,523.
What is the Median Family Income in Westport?
Median Family Income in Westport is $86,853.
What is the Median Household income in Westport?
Median Household Income in Westport is $54,271.
What is Income or Wage Gap in Westport?
Income or Wage Gap in Westport is 12.5%.
Women in Westport earn 87.5 cents for every dollar earned by a man.
What is Inequality or Gini Index in Westport?
Inequality or Gini Index in Westport is 0.45.
What is the Total Population of Westport?
Total Population of Westport is 2,498.
What is the Total Male Population of Westport?
Total Male Population of Westport is 1,185.
What is the Total Female Population of Westport?
Total Female Population of Westport is 1,313.
What is the Ratio of Males per 100 Females in Westport?
There are 90.25 Males per 100 Females in Westport.
What is the Ratio of Females per 100 Males in Westport?
There are 110.80 Females per 100 Males in Westport.
What is the Median Population Age in Westport?
Median Population Age in Westport is 40.3 Years.
What is the Average Family Size in Westport
Average Family Size in Westport is 3.5 People.
What is the Average Household Size in Westport
Average Household Size in Westport is 2.4 People.
How Large is the Labor Force in Westport?
There are 967 People in the Labor Forcein in Westport.
What is the Percentage of People in the Labor Force in Westport?
49.4% of People are in the Labor Force in Westport.
What is the Unemployment Rate in Westport?
Unemployment Rate in Westport is 2.1%.