Kelso, WA Map & Demographics
Kelso Map
Kelso Overview
$27,832
PER CAPITA INCOME
$68,160
AVG FAMILY INCOME
$59,405
AVG HOUSEHOLD INCOME
16.1%
WAGE / INCOME GAP [ % ]
83.9¢/ $1
WAGE / INCOME GAP [ $ ]
$9,592
FAMILY INCOME DEFICIT
0.39
INEQUALITY / GINI INDEX
12,661
TOTAL POPULATION
6,515
MALE POPULATION
6,146
FEMALE POPULATION
106.00
MALES / 100 FEMALES
94.34
FEMALES / 100 MALES
37.3
MEDIAN AGE
2.9
AVG FAMILY SIZE
2.4
AVG HOUSEHOLD SIZE
5,966
LABOR FORCE [ PEOPLE ]
59.4%
PERCENT IN LABOR FORCE
6.0%
UNEMPLOYMENT RATE
Kelso Zip Codes
Kelso Area Codes
Income in Kelso
Income Overview in Kelso
Per Capita Income in Kelso is $27,832, while median incomes of families and households are $68,160 and $59,405 respectively.
| Characteristic | Number | Measure |
| Per Capita Income | 12,661 | $27,832 |
| Median Family Income | 3,414 | $68,160 |
| Mean Family Income | 3,414 | $74,833 |
| Median Household Income | 5,280 | $59,405 |
| Mean Household Income | 5,280 | $66,829 |
| Income Deficit | 3,414 | $9,592 |
| Wage / Income Gap (%) | 12,661 | 16.10% |
| Wage / Income Gap ($) | 12,661 | 83.90¢ per $1 |
| Gini / Inequality Index | 12,661 | 0.39 |
Earnings by Sex in Kelso
Average Earnings in Kelso are $33,607, $37,436 for men and $31,408 for women, a difference of 16.1%.
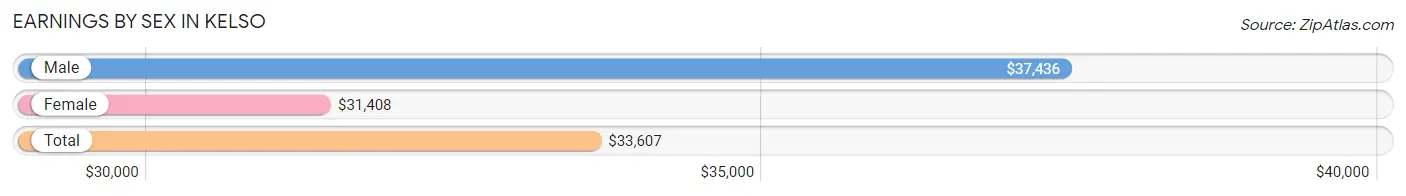
| Sex | Number | Average Earnings |
| Male | 3,265 (52.2%) | $37,436 |
| Female | 2,986 (47.8%) | $31,408 |
| Total | 6,251 (100.0%) | $33,607 |
Earnings by Sex by Income Bracket in Kelso
The most common earnings brackets in Kelso are $75,000 to $99,999 for men (377 | 11.6%) and $30,000 to $34,999 for women (484 | 16.2%).
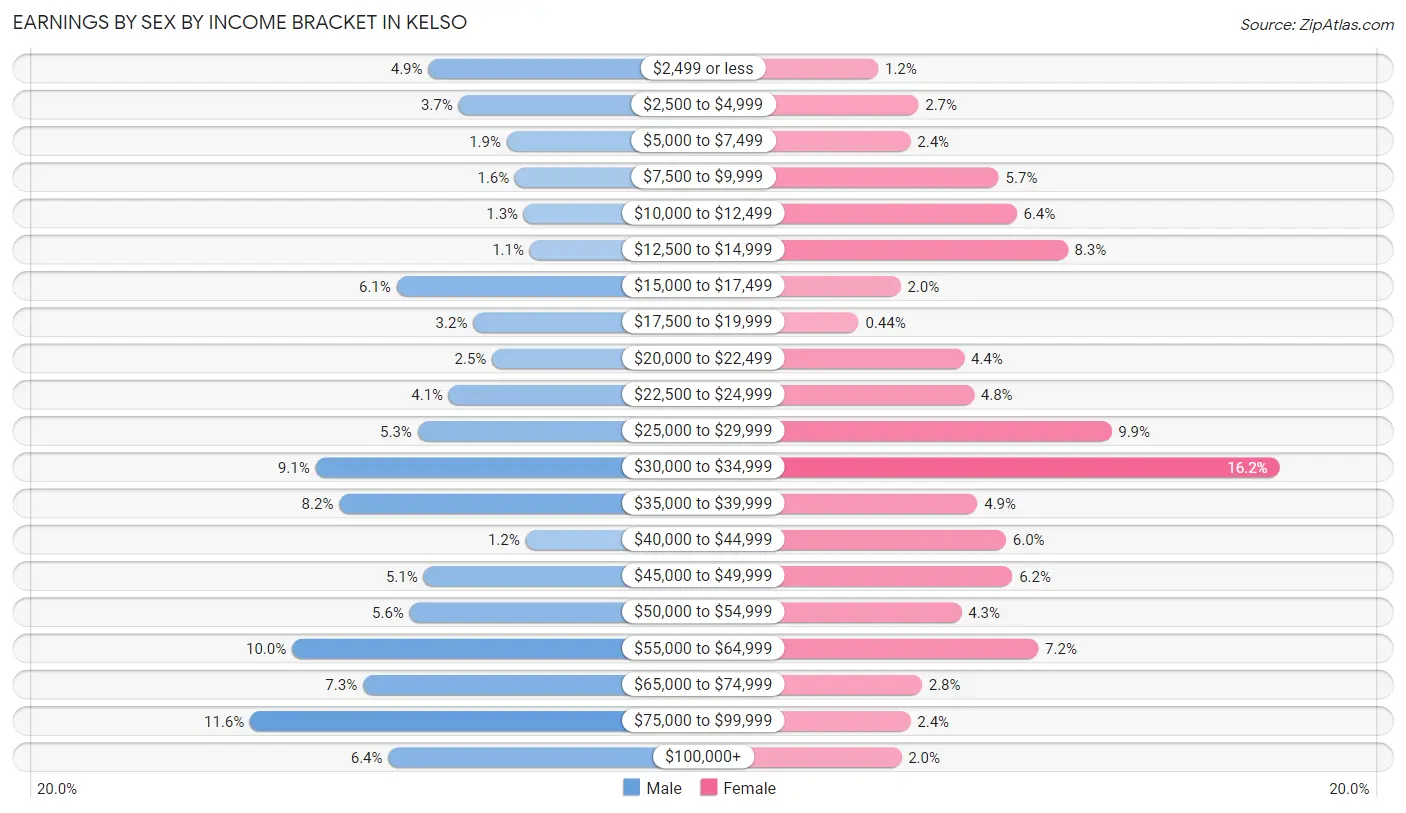
| Income | Male | Female |
| $2,499 or less | 159 (4.9%) | 35 (1.2%) |
| $2,500 to $4,999 | 122 (3.7%) | 80 (2.7%) |
| $5,000 to $7,499 | 63 (1.9%) | 71 (2.4%) |
| $7,500 to $9,999 | 53 (1.6%) | 170 (5.7%) |
| $10,000 to $12,499 | 42 (1.3%) | 190 (6.4%) |
| $12,500 to $14,999 | 35 (1.1%) | 247 (8.3%) |
| $15,000 to $17,499 | 198 (6.1%) | 60 (2.0%) |
| $17,500 to $19,999 | 104 (3.2%) | 13 (0.4%) |
| $20,000 to $22,499 | 81 (2.5%) | 131 (4.4%) |
| $22,500 to $24,999 | 134 (4.1%) | 142 (4.8%) |
| $25,000 to $29,999 | 172 (5.3%) | 296 (9.9%) |
| $30,000 to $34,999 | 297 (9.1%) | 484 (16.2%) |
| $35,000 to $39,999 | 268 (8.2%) | 146 (4.9%) |
| $40,000 to $44,999 | 40 (1.2%) | 178 (6.0%) |
| $45,000 to $49,999 | 165 (5.1%) | 185 (6.2%) |
| $50,000 to $54,999 | 182 (5.6%) | 128 (4.3%) |
| $55,000 to $64,999 | 326 (10.0%) | 214 (7.2%) |
| $65,000 to $74,999 | 239 (7.3%) | 84 (2.8%) |
| $75,000 to $99,999 | 377 (11.6%) | 71 (2.4%) |
| $100,000+ | 208 (6.4%) | 61 (2.0%) |
| Total | 3,265 (100.0%) | 2,986 (100.0%) |
Earnings by Sex by Educational Attainment in Kelso
Average earnings in Kelso are $42,798 for men and $32,933 for women, a difference of 23.1%. Men with an educational attainment of graduate degree enjoy the highest average annual earnings of $73,152, while those with high school diploma education earn the least with $35,893. Women with an educational attainment of graduate degree earn the most with the average annual earnings of $101,563, while those with high school diploma education have the smallest earnings of $30,446.
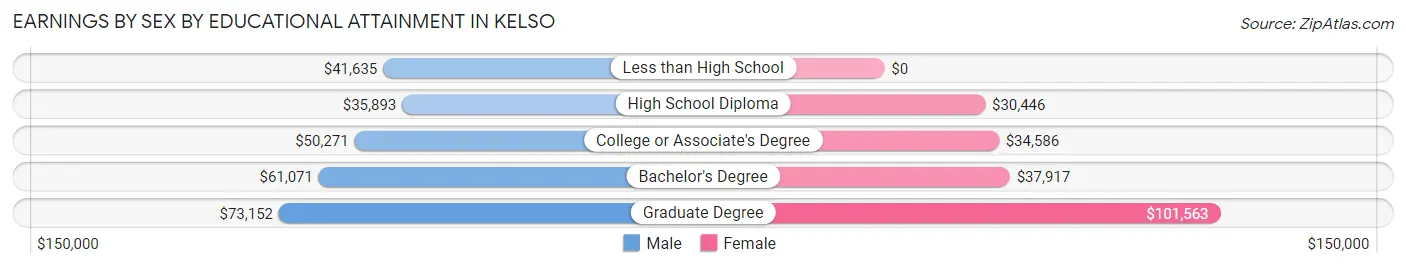
| Educational Attainment | Male Income | Female Income |
| Less than High School | $41,635 | $0 |
| High School Diploma | $35,893 | $30,446 |
| College or Associate's Degree | $50,271 | $34,586 |
| Bachelor's Degree | $61,071 | $37,917 |
| Graduate Degree | $73,152 | $101,563 |
| Total | $42,798 | $32,933 |
Family Income in Kelso
Family Income Brackets in Kelso
According to the Kelso family income data, there are 894 families falling into the $50,000 to $74,999 income range, which is the most common income bracket and makes up 26.2% of all families. Conversely, the less than $10,000 income bracket is the least frequent group with only 130 families (3.8%) belonging to this category.
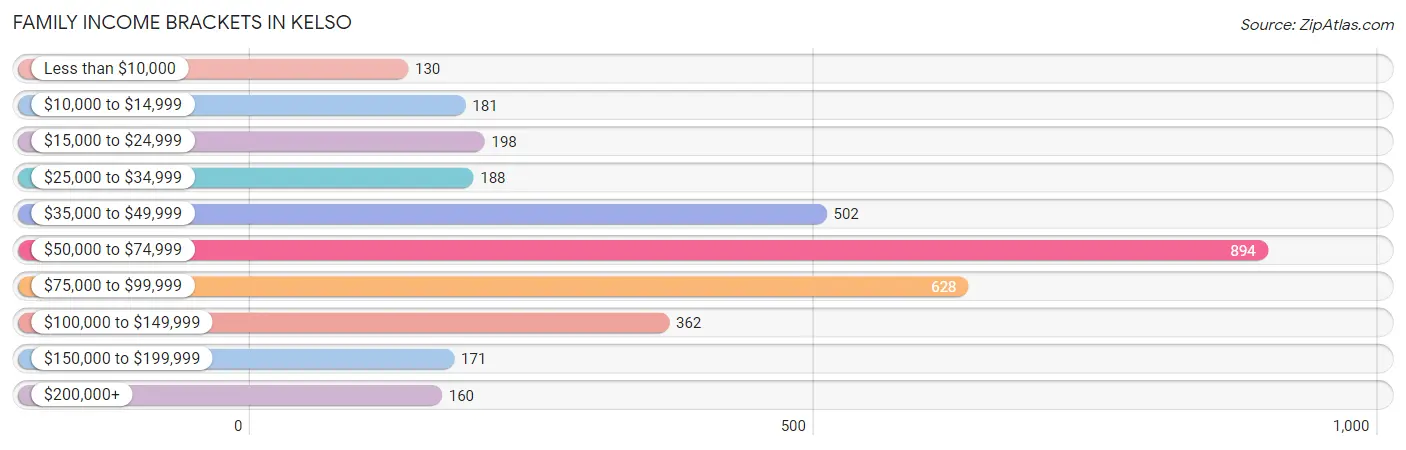
| Income Bracket | # Families | % Families |
| Less than $10,000 | 130 | 3.8% |
| $10,000 to $14,999 | 181 | 5.3% |
| $15,000 to $24,999 | 198 | 5.8% |
| $25,000 to $34,999 | 188 | 5.5% |
| $35,000 to $49,999 | 502 | 14.7% |
| $50,000 to $74,999 | 894 | 26.2% |
| $75,000 to $99,999 | 628 | 18.4% |
| $100,000 to $149,999 | 362 | 10.6% |
| $150,000 to $199,999 | 171 | 5.0% |
| $200,000+ | 160 | 4.7% |
Family Income by Famaliy Size in Kelso
7+ person families (85 | 2.5%) account for the highest median family income in Kelso with $238,438 per family, while 2-person families (1,932 | 56.6%) have the highest median income of $34,559 per family member.
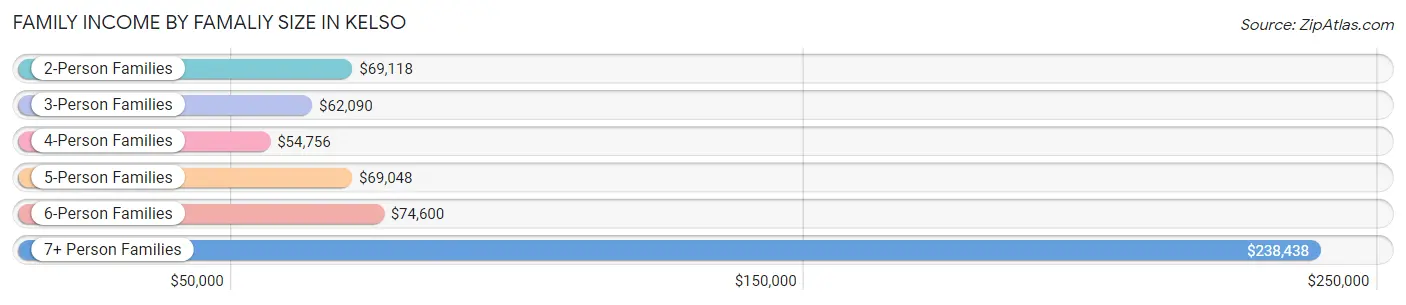
| Income Bracket | # Families | Median Income |
| 2-Person Families | 1,932 (56.6%) | $69,118 |
| 3-Person Families | 623 (18.2%) | $62,090 |
| 4-Person Families | 426 (12.5%) | $54,756 |
| 5-Person Families | 244 (7.1%) | $69,048 |
| 6-Person Families | 104 (3.0%) | $74,600 |
| 7+ Person Families | 85 (2.5%) | $238,438 |
| Total | 3,414 (100.0%) | $68,160 |
Family Income by Number of Earners in Kelso
The median family income in Kelso is $68,160, with families comprising 3+ earners (158) having the highest median family income of $174,545, while families with no earners (562) have the lowest median family income of $35,833, accounting for 4.6% and 16.5% of families, respectively.
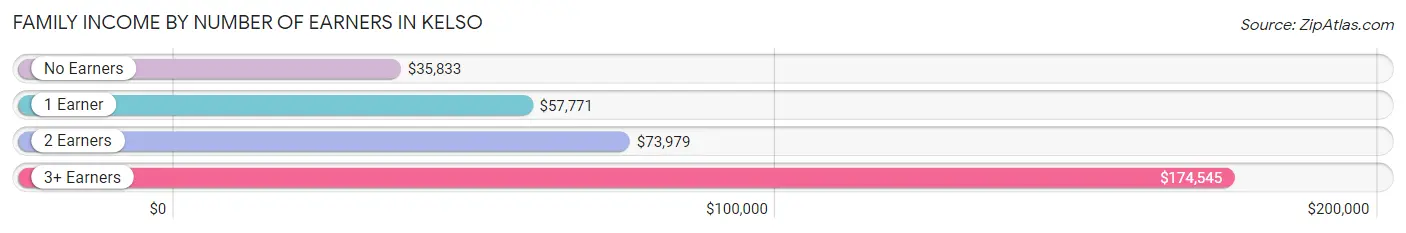
| Number of Earners | # Families | Median Income |
| No Earners | 562 (16.5%) | $35,833 |
| 1 Earner | 1,337 (39.2%) | $57,771 |
| 2 Earners | 1,357 (39.8%) | $73,979 |
| 3+ Earners | 158 (4.6%) | $174,545 |
| Total | 3,414 (100.0%) | $68,160 |
Household Income in Kelso
Household Income Brackets in Kelso
With 1,331 households falling in the category, the $50,000 to $74,999 income range is the most frequent in Kelso, accounting for 25.2% of all households. In contrast, only 121 households (2.3%) fall into the $10,000 to $14,999 income bracket, making it the least populous group.
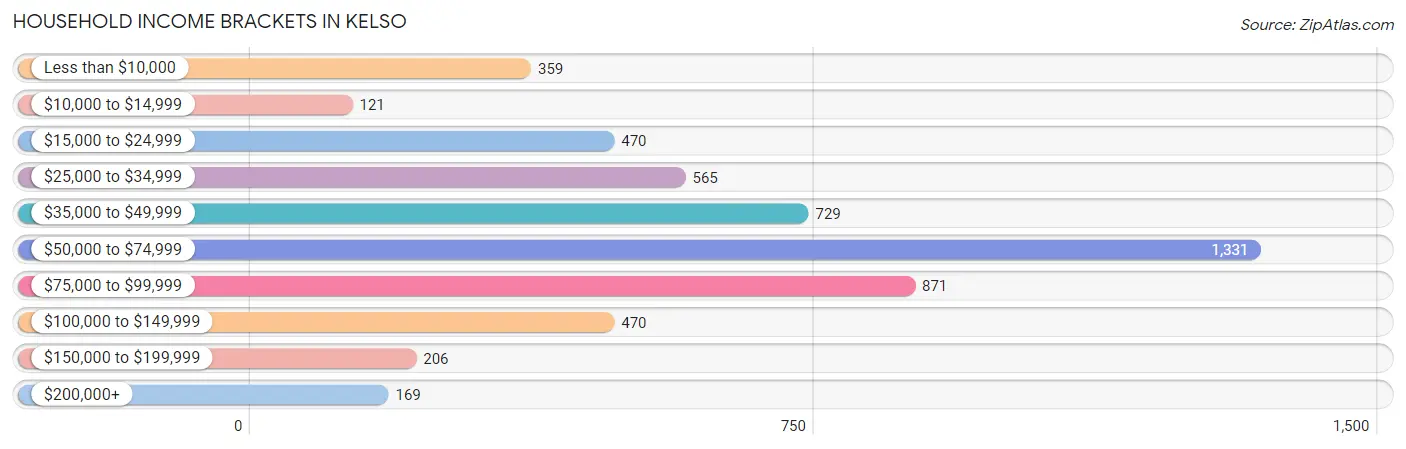
| Income Bracket | # Households | % Households |
| Less than $10,000 | 359 | 6.8% |
| $10,000 to $14,999 | 121 | 2.3% |
| $15,000 to $24,999 | 470 | 8.9% |
| $25,000 to $34,999 | 565 | 10.7% |
| $35,000 to $49,999 | 729 | 13.8% |
| $50,000 to $74,999 | 1,331 | 25.2% |
| $75,000 to $99,999 | 871 | 16.5% |
| $100,000 to $149,999 | 470 | 8.9% |
| $150,000 to $199,999 | 206 | 3.9% |
| $200,000+ | 169 | 3.2% |
Household Income by Householder Age in Kelso
The median household income in Kelso is $59,405, with the highest median household income of $66,603 found in the 15 to 24 years age bracket for the primary householder. A total of 272 households (5.1%) fall into this category. Meanwhile, the 65+ years age bracket for the primary householder has the lowest median household income of $49,141, with 1,265 households (24.0%) in this group.
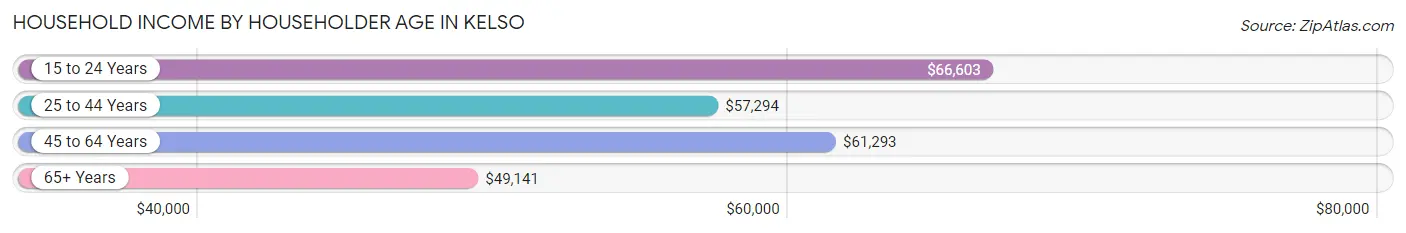
| Income Bracket | # Households | Median Income |
| 15 to 24 Years | 272 (5.1%) | $66,603 |
| 25 to 44 Years | 1,758 (33.3%) | $57,294 |
| 45 to 64 Years | 1,985 (37.6%) | $61,293 |
| 65+ Years | 1,265 (24.0%) | $49,141 |
| Total | 5,280 (100.0%) | $59,405 |
Poverty in Kelso
Income Below Poverty by Sex and Age in Kelso
With 16.8% poverty level for males and 23.4% for females among the residents of Kelso, 15 year old males and 12 to 14 year old females are the most vulnerable to poverty, with 55 males (53.9%) and 86 females (44.3%) in their respective age groups living below the poverty level.
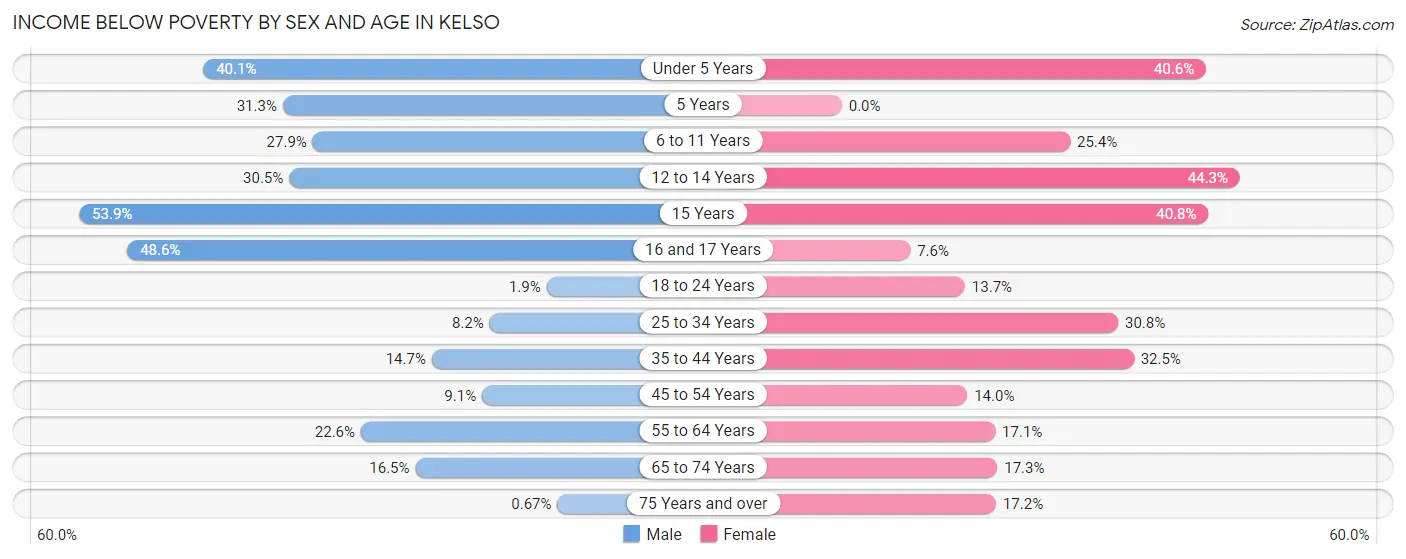
| Age Bracket | Male | Female |
| Under 5 Years | 164 (40.1%) | 159 (40.6%) |
| 5 Years | 10 (31.2%) | 0 (0.0%) |
| 6 to 11 Years | 172 (27.9%) | 107 (25.4%) |
| 12 to 14 Years | 91 (30.5%) | 86 (44.3%) |
| 15 Years | 55 (53.9%) | 20 (40.8%) |
| 16 and 17 Years | 17 (48.6%) | 8 (7.6%) |
| 18 to 24 Years | 11 (1.9%) | 71 (13.7%) |
| 25 to 34 Years | 99 (8.2%) | 284 (30.8%) |
| 35 to 44 Years | 95 (14.7%) | 262 (32.5%) |
| 45 to 54 Years | 51 (9.1%) | 115 (14.0%) |
| 55 to 64 Years | 249 (22.6%) | 151 (17.1%) |
| 65 to 74 Years | 72 (16.5%) | 79 (17.3%) |
| 75 Years and over | 3 (0.7%) | 85 (17.2%) |
| Total | 1,089 (16.8%) | 1,427 (23.4%) |
Income Above Poverty by Sex and Age in Kelso
According to the poverty statistics in Kelso, males aged 75 years and over and females aged 5 years are the age groups that are most secure financially, with 99.3% of males and 100.0% of females in these age groups living above the poverty line.
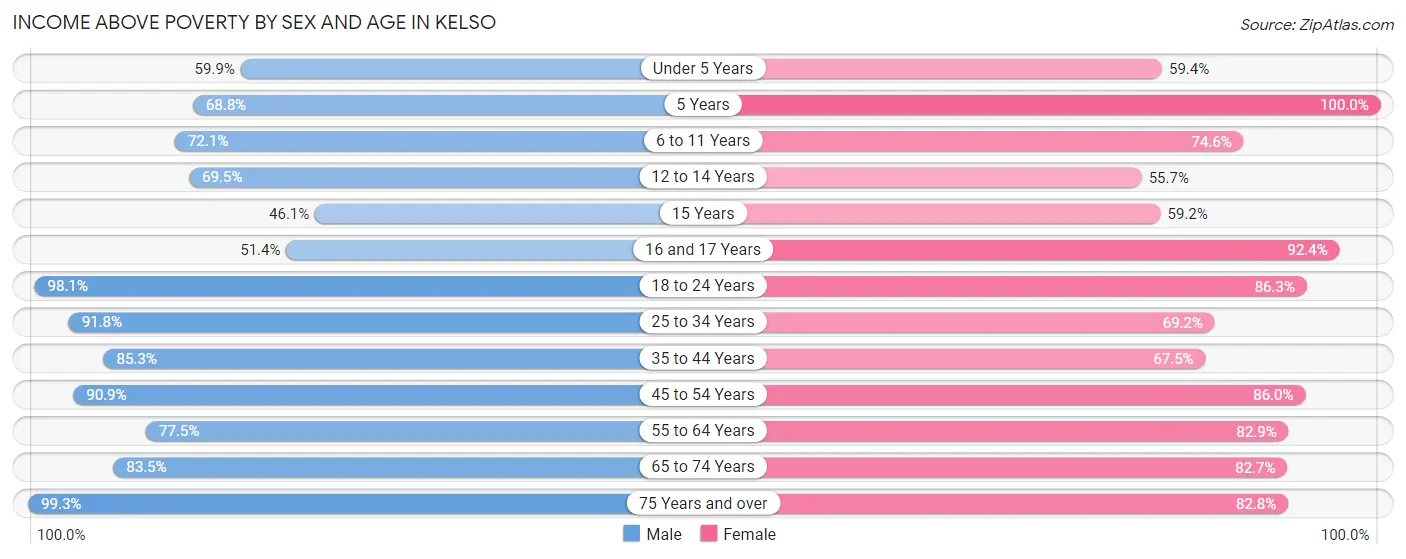
| Age Bracket | Male | Female |
| Under 5 Years | 245 (59.9%) | 233 (59.4%) |
| 5 Years | 22 (68.8%) | 24 (100.0%) |
| 6 to 11 Years | 444 (72.1%) | 314 (74.6%) |
| 12 to 14 Years | 207 (69.5%) | 108 (55.7%) |
| 15 Years | 47 (46.1%) | 29 (59.2%) |
| 16 and 17 Years | 18 (51.4%) | 97 (92.4%) |
| 18 to 24 Years | 578 (98.1%) | 447 (86.3%) |
| 25 to 34 Years | 1,107 (91.8%) | 639 (69.2%) |
| 35 to 44 Years | 553 (85.3%) | 544 (67.5%) |
| 45 to 54 Years | 512 (90.9%) | 708 (86.0%) |
| 55 to 64 Years | 855 (77.4%) | 733 (82.9%) |
| 65 to 74 Years | 365 (83.5%) | 377 (82.7%) |
| 75 Years and over | 448 (99.3%) | 410 (82.8%) |
| Total | 5,401 (83.2%) | 4,663 (76.6%) |
Income Below Poverty Among Married-Couple Families in Kelso
The poverty statistics for married-couple families in Kelso show that 3.2% or 67 of the total 2,113 families live below the poverty line. Families with 3 or 4 children have the highest poverty rate of 16.9%, comprising of 29 families. On the other hand, families with 5 or more children have the lowest poverty rate of 0.0%, which includes 0 families.
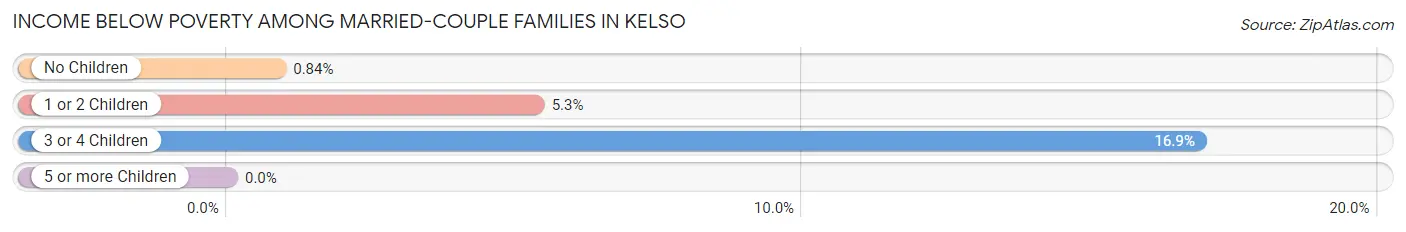
| Children | Above Poverty | Below Poverty |
| No Children | 1,420 (99.2%) | 12 (0.8%) |
| 1 or 2 Children | 461 (94.7%) | 26 (5.3%) |
| 3 or 4 Children | 143 (83.1%) | 29 (16.9%) |
| 5 or more Children | 22 (100.0%) | 0 (0.0%) |
| Total | 2,046 (96.8%) | 67 (3.2%) |
Income Below Poverty Among Single-Parent Households in Kelso
According to the poverty data in Kelso, 19.2% or 85 single-father households and 38.9% or 334 single-mother households are living below the poverty line. Among single-father households, those with no children have the highest poverty rate, with 39 households (23.1%) experiencing poverty. Likewise, among single-mother households, those with 3 or 4 children have the highest poverty rate, with 96 households (100.0%) falling below the poverty line.
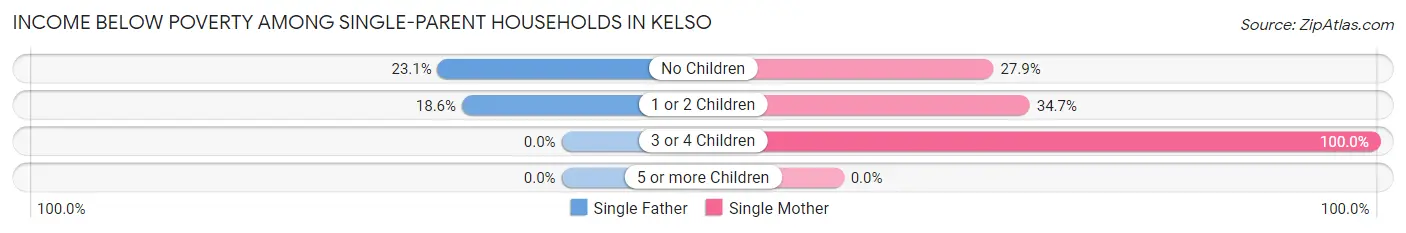
| Children | Single Father | Single Mother |
| No Children | 39 (23.1%) | 108 (27.9%) |
| 1 or 2 Children | 46 (18.5%) | 130 (34.7%) |
| 3 or 4 Children | 0 (0.0%) | 96 (100.0%) |
| 5 or more Children | 0 (0.0%) | 0 (0.0%) |
| Total | 85 (19.2%) | 334 (38.9%) |
Income Below Poverty Among Married-Couple vs Single-Parent Households in Kelso
The poverty data for Kelso shows that 67 of the married-couple family households (3.2%) and 419 of the single-parent households (32.2%) are living below the poverty level. Within the married-couple family households, those with 3 or 4 children have the highest poverty rate, with 29 households (16.9%) falling below the poverty line. Among the single-parent households, those with 3 or 4 children have the highest poverty rate, with 96 household (78.7%) living below poverty.
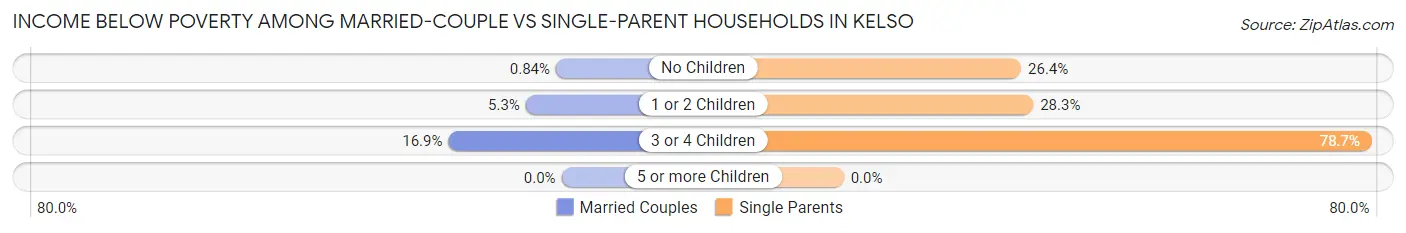
| Children | Married-Couple Families | Single-Parent Households |
| No Children | 12 (0.8%) | 147 (26.4%) |
| 1 or 2 Children | 26 (5.3%) | 176 (28.2%) |
| 3 or 4 Children | 29 (16.9%) | 96 (78.7%) |
| 5 or more Children | 0 (0.0%) | 0 (0.0%) |
| Total | 67 (3.2%) | 419 (32.2%) |
Race in Kelso
The most populous races in Kelso are White / Caucasian (10,590 | 83.6%), Hispanic or Latino (2,040 | 16.1%), and Two or more Races (1,126 | 8.9%).
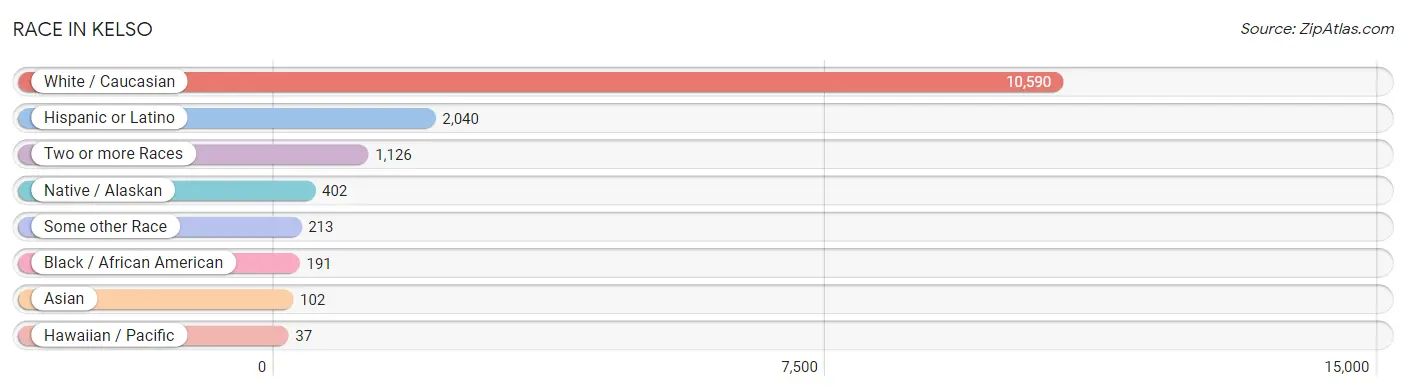
| Race | # Population | % Population |
| Asian | 102 | 0.8% |
| Black / African American | 191 | 1.5% |
| Hawaiian / Pacific | 37 | 0.3% |
| Hispanic or Latino | 2,040 | 16.1% |
| Native / Alaskan | 402 | 3.2% |
| White / Caucasian | 10,590 | 83.6% |
| Two or more Races | 1,126 | 8.9% |
| Some other Race | 213 | 1.7% |
| Total | 12,661 | 100.0% |
Ancestry in Kelso
The most populous ancestries reported in Kelso are German (2,141 | 16.9%), Irish (1,761 | 13.9%), Mexican (1,733 | 13.7%), English (1,391 | 11.0%), and Norwegian (541 | 4.3%), together accounting for 59.8% of all Kelso residents.
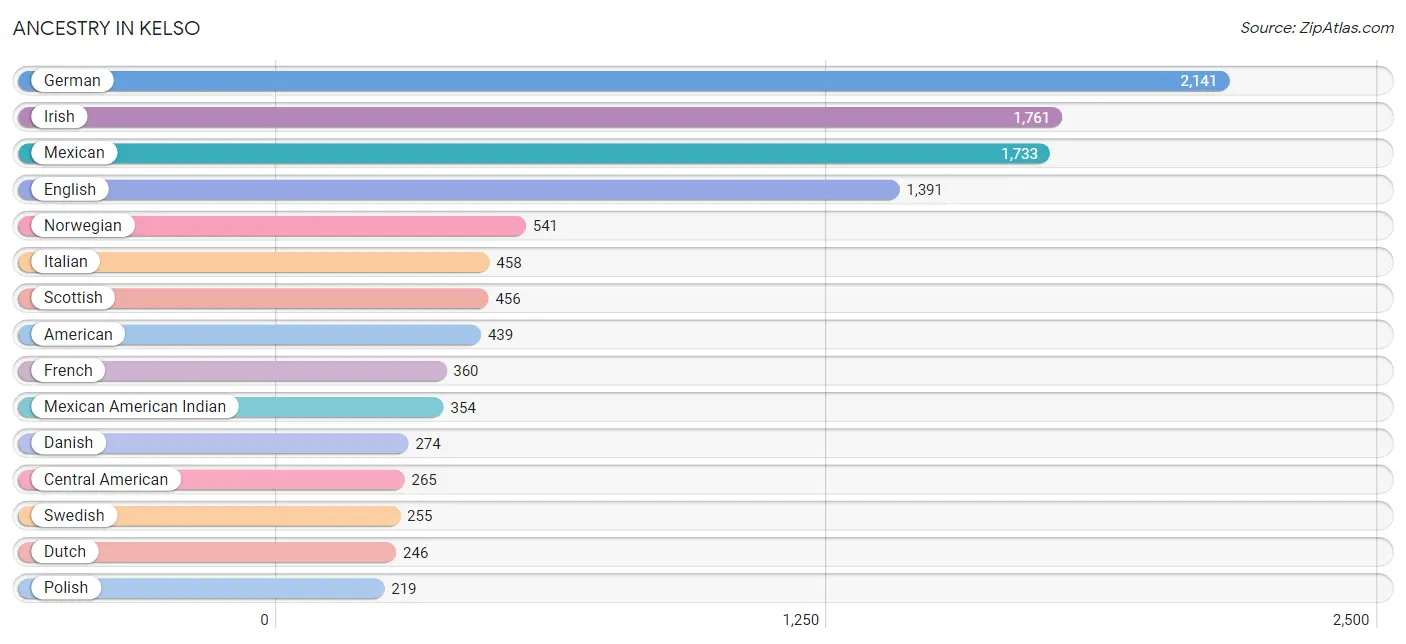
| Ancestry | # Population | % Population |
| African | 18 | 0.1% |
| Alaska Native | 21 | 0.2% |
| American | 439 | 3.5% |
| Arab | 31 | 0.2% |
| Argentinean | 11 | 0.1% |
| Austrian | 26 | 0.2% |
| Belgian | 20 | 0.2% |
| Bhutanese | 128 | 1.0% |
| Blackfeet | 16 | 0.1% |
| British | 65 | 0.5% |
| Burmese | 5 | 0.0% |
| Canadian | 20 | 0.2% |
| Celtic | 11 | 0.1% |
| Central American | 265 | 2.1% |
| Cherokee | 154 | 1.2% |
| Chippewa | 28 | 0.2% |
| Danish | 274 | 2.2% |
| Dutch | 246 | 1.9% |
| Eastern European | 13 | 0.1% |
| English | 1,391 | 11.0% |
| European | 169 | 1.3% |
| Finnish | 39 | 0.3% |
| French | 360 | 2.8% |
| French American Indian | 24 | 0.2% |
| French Canadian | 141 | 1.1% |
| German | 2,141 | 16.9% |
| Greek | 15 | 0.1% |
| Guatemalan | 209 | 1.7% |
| Honduran | 21 | 0.2% |
| Indian (Asian) | 146 | 1.1% |
| Irish | 1,761 | 13.9% |
| Italian | 458 | 3.6% |
| Korean | 40 | 0.3% |
| Lithuanian | 9 | 0.1% |
| Mexican | 1,733 | 13.7% |
| Mexican American Indian | 354 | 2.8% |
| Native Hawaiian | 34 | 0.3% |
| Nigerian | 12 | 0.1% |
| Northern European | 25 | 0.2% |
| Norwegian | 541 | 4.3% |
| Panamanian | 17 | 0.1% |
| Pennsylvania German | 4 | 0.0% |
| Polish | 219 | 1.7% |
| Portuguese | 31 | 0.2% |
| Puerto Rican | 7 | 0.1% |
| Russian | 17 | 0.1% |
| Salvadoran | 18 | 0.1% |
| Samoan | 3 | 0.0% |
| Scandinavian | 149 | 1.2% |
| Scotch-Irish | 197 | 1.6% |
| Scottish | 456 | 3.6% |
| Seminole | 5 | 0.0% |
| Sioux | 6 | 0.1% |
| South American | 11 | 0.1% |
| Sri Lankan | 2 | 0.0% |
| Subsaharan African | 30 | 0.2% |
| Swedish | 255 | 2.0% |
| Swiss | 29 | 0.2% |
| Thai | 3 | 0.0% |
| Welsh | 5 | 0.0% | View All 60 Rows |
Immigrants in Kelso
The most numerous immigrant groups reported in Kelso came from Central America (646 | 5.1%), Latin America (646 | 5.1%), Mexico (494 | 3.9%), Guatemala (124 | 1.0%), and Canada (83 | 0.7%), together accounting for 15.7% of all Kelso residents.
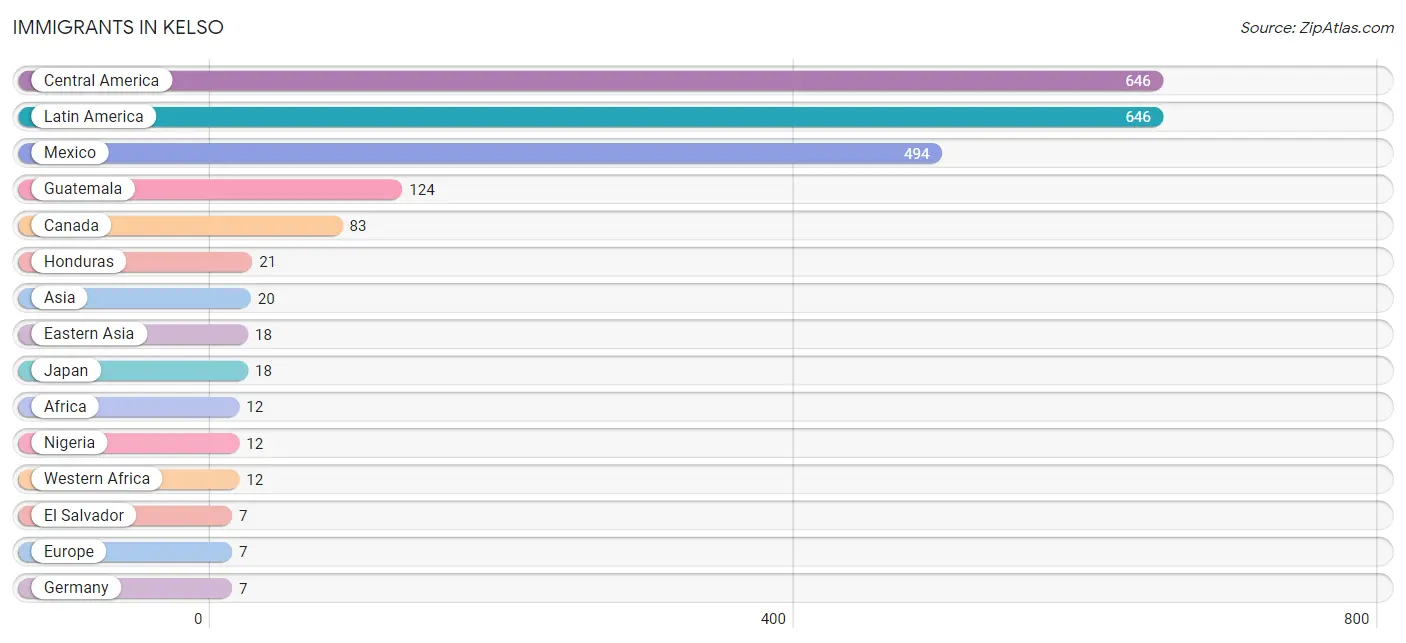
| Immigration Origin | # Population | % Population |
| Africa | 12 | 0.1% |
| Asia | 20 | 0.2% |
| Canada | 83 | 0.7% |
| Central America | 646 | 5.1% |
| Eastern Asia | 18 | 0.1% |
| El Salvador | 7 | 0.1% |
| Europe | 7 | 0.1% |
| Fiji | 3 | 0.0% |
| Germany | 7 | 0.1% |
| Guatemala | 124 | 1.0% |
| Honduras | 21 | 0.2% |
| Japan | 18 | 0.1% |
| Latin America | 646 | 5.1% |
| Mexico | 494 | 3.9% |
| Nigeria | 12 | 0.1% |
| Oceania | 3 | 0.0% |
| South Eastern Asia | 2 | 0.0% |
| Vietnam | 2 | 0.0% |
| Western Africa | 12 | 0.1% |
| Western Europe | 7 | 0.1% | View All 20 Rows |
Sex and Age in Kelso
Sex and Age in Kelso
The most populous age groups in Kelso are 55 to 59 Years (693 | 10.6%) for men and 60 to 64 Years (629 | 10.2%) for women.
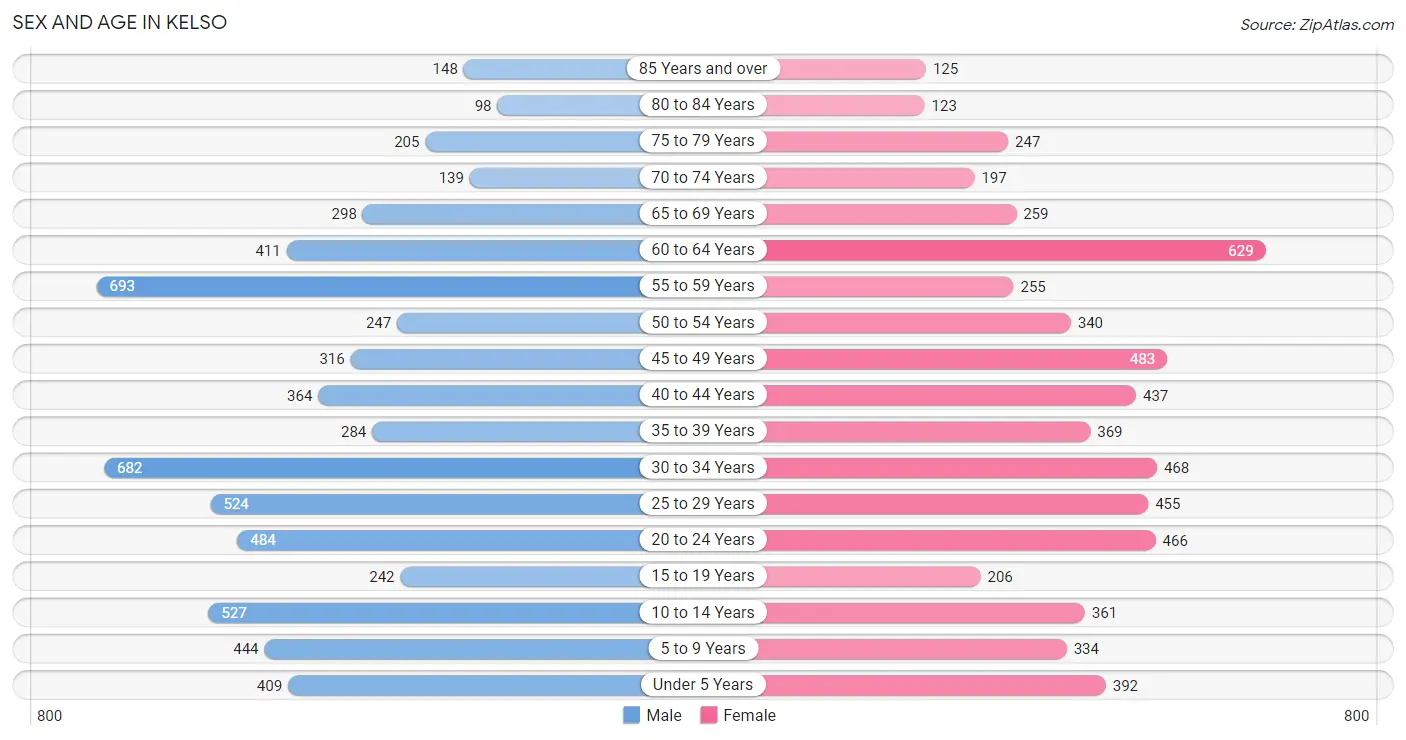
| Age Bracket | Male | Female |
| Under 5 Years | 409 (6.3%) | 392 (6.4%) |
| 5 to 9 Years | 444 (6.8%) | 334 (5.4%) |
| 10 to 14 Years | 527 (8.1%) | 361 (5.9%) |
| 15 to 19 Years | 242 (3.7%) | 206 (3.4%) |
| 20 to 24 Years | 484 (7.4%) | 466 (7.6%) |
| 25 to 29 Years | 524 (8.0%) | 455 (7.4%) |
| 30 to 34 Years | 682 (10.5%) | 468 (7.6%) |
| 35 to 39 Years | 284 (4.4%) | 369 (6.0%) |
| 40 to 44 Years | 364 (5.6%) | 437 (7.1%) |
| 45 to 49 Years | 316 (4.9%) | 483 (7.9%) |
| 50 to 54 Years | 247 (3.8%) | 340 (5.5%) |
| 55 to 59 Years | 693 (10.6%) | 255 (4.2%) |
| 60 to 64 Years | 411 (6.3%) | 629 (10.2%) |
| 65 to 69 Years | 298 (4.6%) | 259 (4.2%) |
| 70 to 74 Years | 139 (2.1%) | 197 (3.2%) |
| 75 to 79 Years | 205 (3.2%) | 247 (4.0%) |
| 80 to 84 Years | 98 (1.5%) | 123 (2.0%) |
| 85 Years and over | 148 (2.3%) | 125 (2.0%) |
| Total | 6,515 (100.0%) | 6,146 (100.0%) |
Families and Households in Kelso
Median Family Size in Kelso
The median family size in Kelso is 2.87 persons per family, with single female/mother families (858 | 25.1%) accounting for the largest median family size of 2.96 persons per family. On the other hand, single male/father families (443 | 13.0%) represent the smallest median family size with 2.55 persons per family.
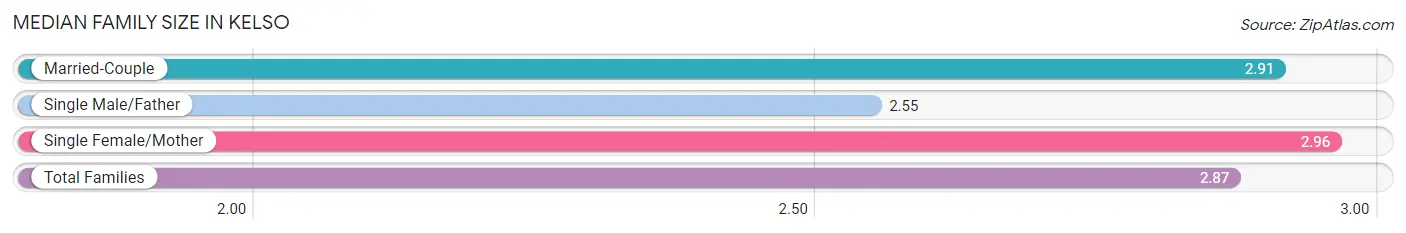
| Family Type | # Families | Family Size |
| Married-Couple | 2,113 (61.9%) | 2.91 |
| Single Male/Father | 443 (13.0%) | 2.55 |
| Single Female/Mother | 858 (25.1%) | 2.96 |
| Total Families | 3,414 (100.0%) | 2.87 |
Median Household Size in Kelso
The median household size in Kelso is 2.39 persons per household, with single female/mother households (858 | 16.3%) accounting for the largest median household size of 3.3 persons per household. non-family households (1,866 | 35.3%) represent the smallest median household size with 1.18 persons per household.
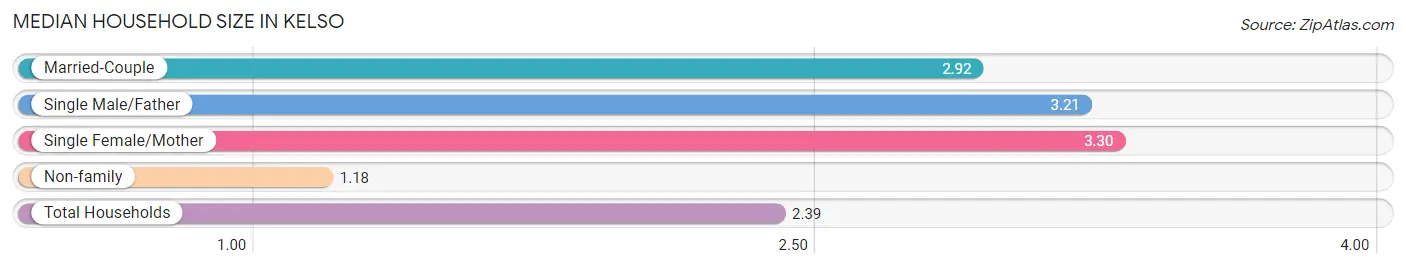
| Household Type | # Households | Household Size |
| Married-Couple | 2,113 (40.0%) | 2.92 |
| Single Male/Father | 443 (8.4%) | 3.21 |
| Single Female/Mother | 858 (16.3%) | 3.30 |
| Non-family | 1,866 (35.3%) | 1.18 |
| Total Households | 5,280 (100.0%) | 2.39 |
Household Size by Marriage Status in Kelso
Out of a total of 5,280 households in Kelso, 3,414 (64.7%) are family households, while 1,866 (35.3%) are nonfamily households. The most numerous type of family households are 2-person households, comprising 1,690, and the most common type of nonfamily households are 1-person households, comprising 1,519.
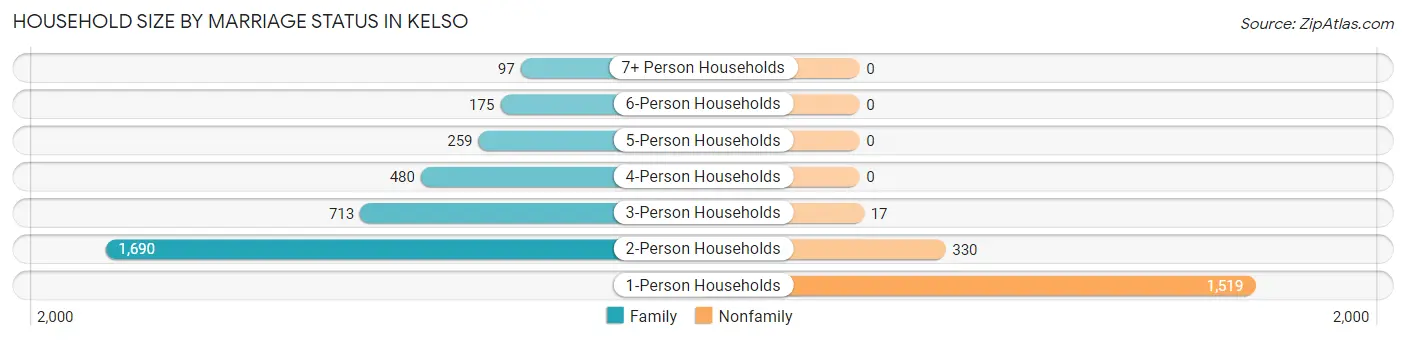
| Household Size | Family Households | Nonfamily Households |
| 1-Person Households | - | 1,519 (28.8%) |
| 2-Person Households | 1,690 (32.0%) | 330 (6.2%) |
| 3-Person Households | 713 (13.5%) | 17 (0.3%) |
| 4-Person Households | 480 (9.1%) | 0 (0.0%) |
| 5-Person Households | 259 (4.9%) | 0 (0.0%) |
| 6-Person Households | 175 (3.3%) | 0 (0.0%) |
| 7+ Person Households | 97 (1.8%) | 0 (0.0%) |
| Total | 3,414 (64.7%) | 1,866 (35.3%) |
Female Fertility in Kelso
Fertility by Age in Kelso
Average fertility rate in Kelso is 57.0 births per 1,000 women. Women in the age bracket of 20 to 34 years have the highest fertility rate with 114.0 births per 1,000 women. Women in the age bracket of 20 to 34 years acount for 93.0% of all women with births.
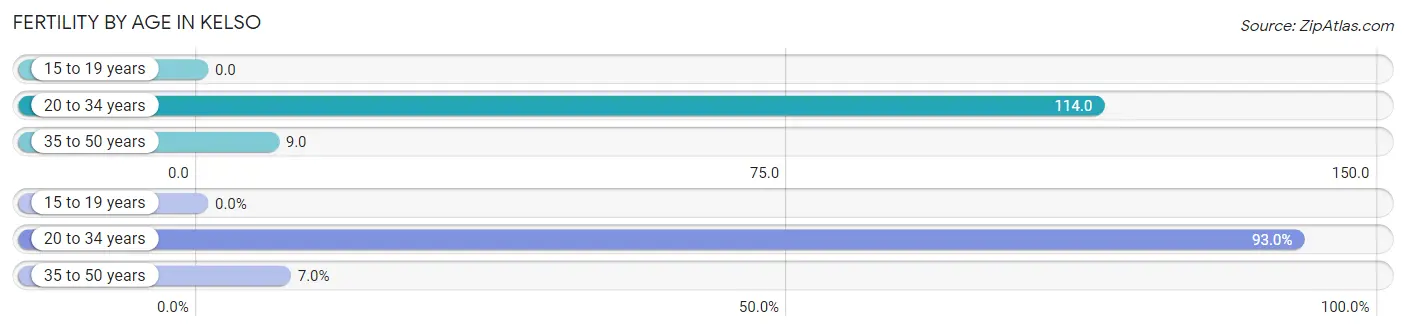
| Age Bracket | Women with Births | Births / 1,000 Women |
| 15 to 19 years | 0 (0.0%) | 0.0 |
| 20 to 34 years | 159 (93.0%) | 114.0 |
| 35 to 50 years | 12 (7.0%) | 9.0 |
| Total | 171 (100.0%) | 57.0 |
Fertility by Age by Marriage Status in Kelso
48.5% of women with births (171) in Kelso are married. The highest percentage of unmarried women with births falls into 20 to 34 years age bracket with 51.6% of them unmarried at the time of birth, while the lowest percentage of unmarried women with births belong to 35 to 50 years age bracket with 50.0% of them unmarried.
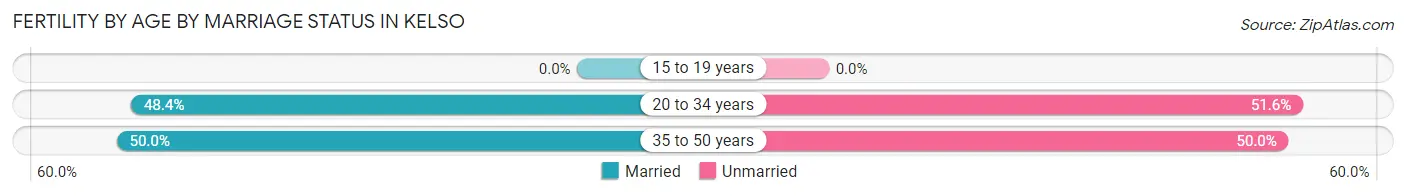
| Age Bracket | Married | Unmarried |
| 15 to 19 years | 0 (0.0%) | 0 (0.0%) |
| 20 to 34 years | 77 (48.4%) | 82 (51.6%) |
| 35 to 50 years | 6 (50.0%) | 6 (50.0%) |
| Total | 83 (48.5%) | 88 (51.5%) |
Fertility by Education in Kelso
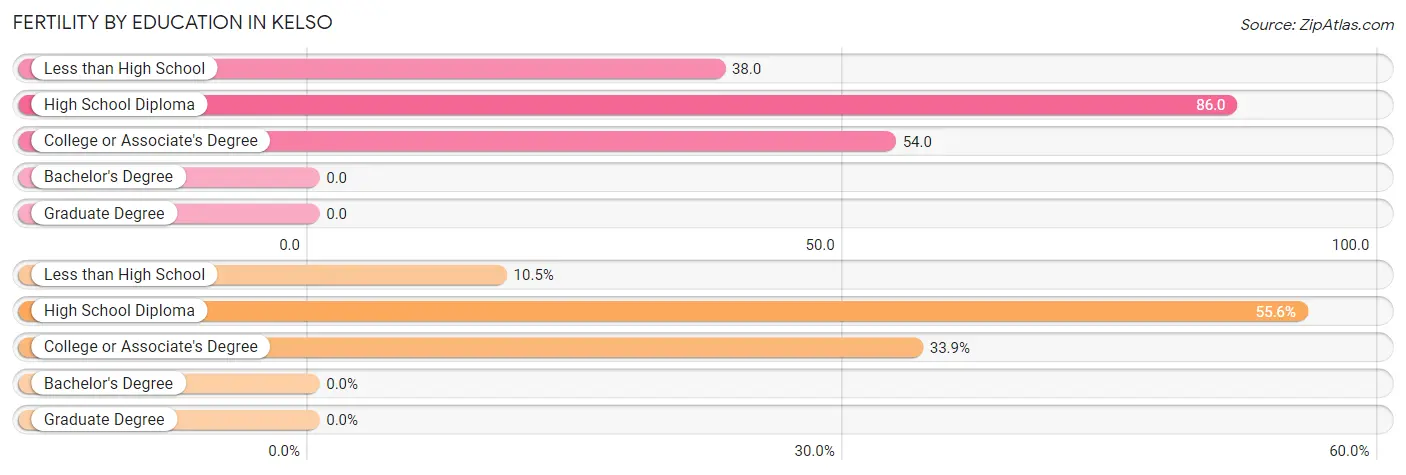
| Educational Attainment | Women with Births | Births / 1,000 Women |
| Less than High School | 18 (10.5%) | 38.0 |
| High School Diploma | 95 (55.6%) | 86.0 |
| College or Associate's Degree | 58 (33.9%) | 54.0 |
| Bachelor's Degree | 0 (0.0%) | 0.0 |
| Graduate Degree | 0 (0.0%) | 0.0 |
| Total | 171 (100.0%) | 57.0 |
Fertility by Education by Marriage Status in Kelso
51.5% of women with births in Kelso are unmarried. Women with the educational attainment of high school diploma are most likely to be married with 75.8% of them married at childbirth, while women with the educational attainment of less than high school are least likely to be married with 100.0% of them unmarried at childbirth.
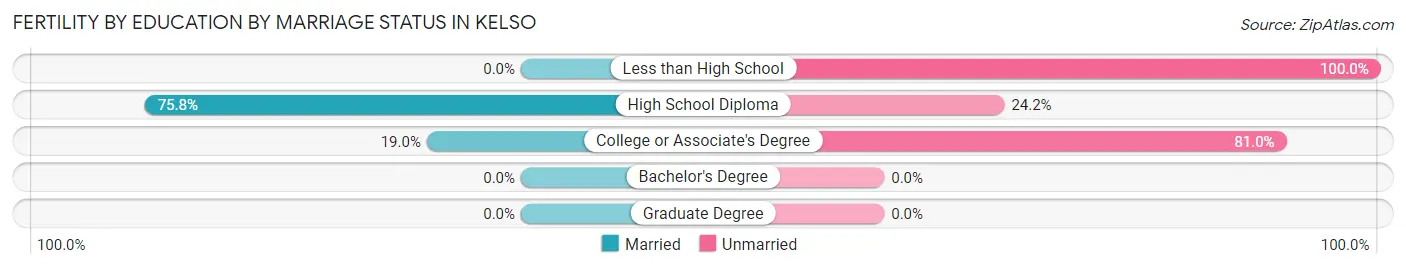
| Educational Attainment | Married | Unmarried |
| Less than High School | 0 (0.0%) | 18 (100.0%) |
| High School Diploma | 72 (75.8%) | 23 (24.2%) |
| College or Associate's Degree | 11 (19.0%) | 47 (81.0%) |
| Bachelor's Degree | 0 (0.0%) | 0 (0.0%) |
| Graduate Degree | 0 (0.0%) | 0 (0.0%) |
| Total | 83 (48.5%) | 88 (51.5%) |
Employment Characteristics in Kelso
Employment by Class of Employer in Kelso
Among the 5,494 employed individuals in Kelso, private company employees (3,897 | 70.9%), not-for-profit organizations (498 | 9.1%), and self-employed (not incorporated) (337 | 6.1%) make up the most common classes of employment.
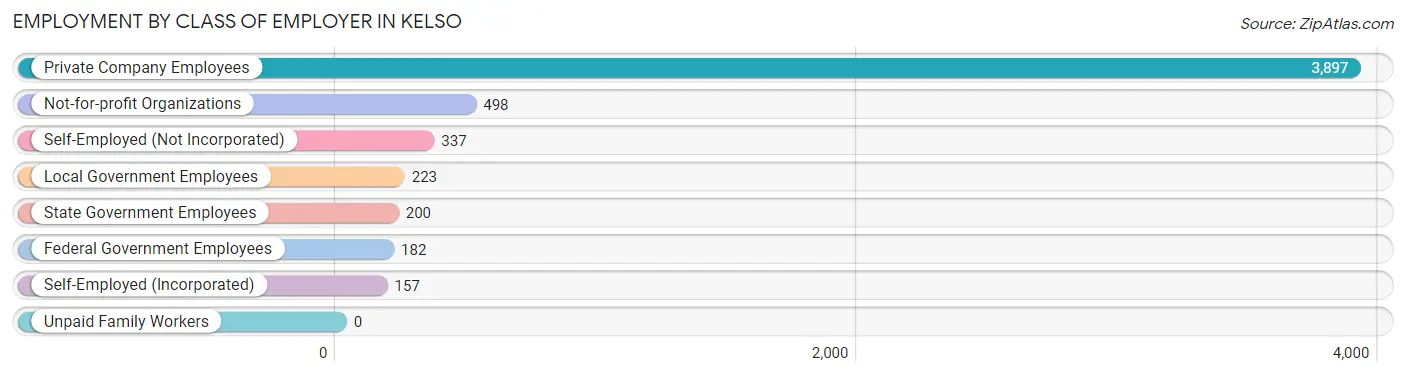
| Employer Class | # Employees | % Employees |
| Private Company Employees | 3,897 | 70.9% |
| Self-Employed (Incorporated) | 157 | 2.9% |
| Self-Employed (Not Incorporated) | 337 | 6.1% |
| Not-for-profit Organizations | 498 | 9.1% |
| Local Government Employees | 223 | 4.1% |
| State Government Employees | 200 | 3.6% |
| Federal Government Employees | 182 | 3.3% |
| Unpaid Family Workers | 0 | 0.0% |
| Total | 5,494 | 100.0% |
Employment Status by Age in Kelso
According to the labor force statistics for Kelso, out of the total population over 16 years of age (10,043), 59.4% or 5,966 individuals are in the labor force, with 6.0% or 358 of them unemployed. The age group with the highest labor force participation rate is 20 to 24 years, with 84.9% or 807 individuals in the labor force. Within the labor force, the 16 to 19 years age range has the highest percentage of unemployed individuals, with 28.8% or 60 of them being unemployed.
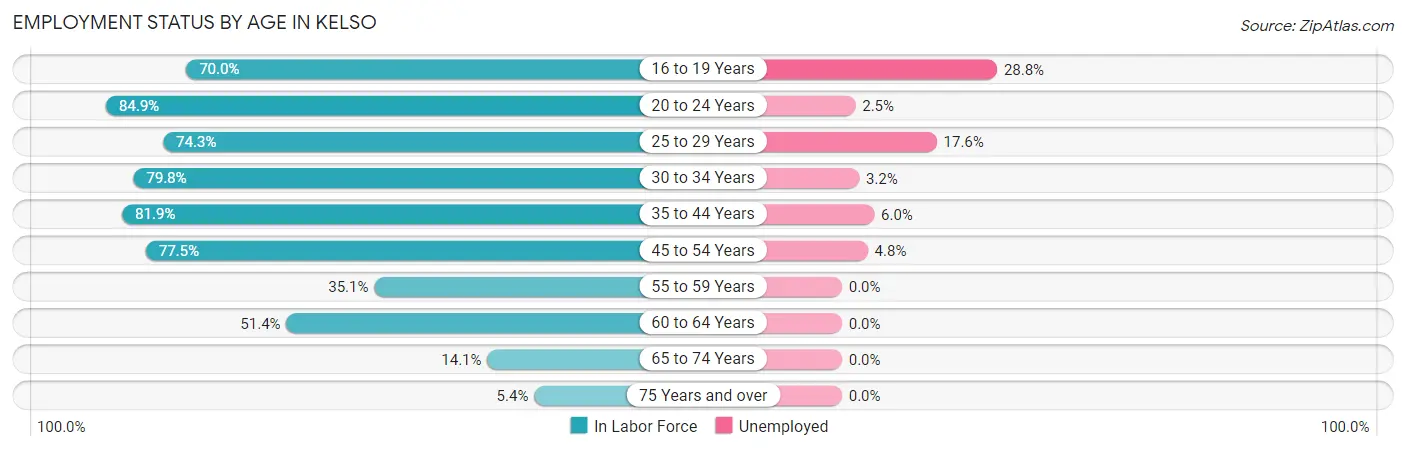
| Age Bracket | In Labor Force | Unemployed |
| 16 to 19 Years | 208 (70.0%) | 60 (28.8%) |
| 20 to 24 Years | 807 (84.9%) | 20 (2.5%) |
| 25 to 29 Years | 727 (74.3%) | 128 (17.6%) |
| 30 to 34 Years | 918 (79.8%) | 29 (3.2%) |
| 35 to 44 Years | 1,191 (81.9%) | 71 (6.0%) |
| 45 to 54 Years | 1,074 (77.5%) | 52 (4.8%) |
| 55 to 59 Years | 333 (35.1%) | 0 (0.0%) |
| 60 to 64 Years | 535 (51.4%) | 0 (0.0%) |
| 65 to 74 Years | 126 (14.1%) | 0 (0.0%) |
| 75 Years and over | 51 (5.4%) | 0 (0.0%) |
| Total | 5,966 (59.4%) | 358 (6.0%) |
Employment Status by Educational Attainment in Kelso
According to labor force statistics for Kelso, 68.7% of individuals (4,779) out of the total population between 25 and 64 years of age (6,957) are in the labor force, with 5.9% or 282 of them being unemployed. The group with the highest labor force participation rate are those with the educational attainment of college / associate degree, with 75.0% or 2,205 individuals in the labor force. Within the labor force, individuals with high school diploma education have the highest percentage of unemployment, with 9.5% or 150 of them being unemployed.
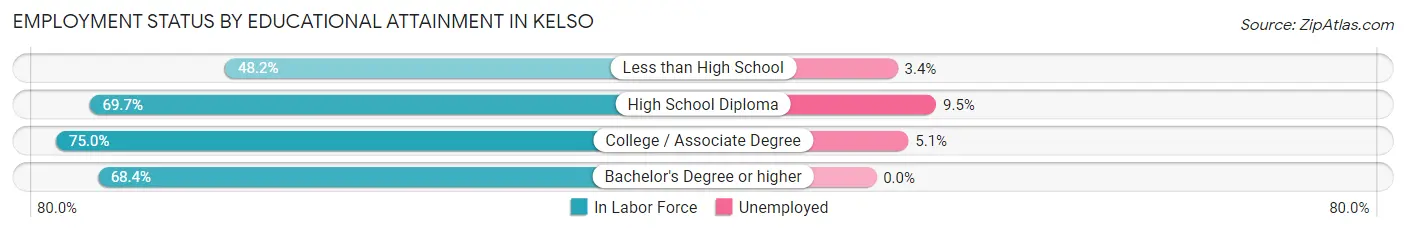
| Educational Attainment | In Labor Force | Unemployed |
| Less than High School | 493 (48.2%) | 35 (3.4%) |
| High School Diploma | 1,582 (69.7%) | 216 (9.5%) |
| College / Associate Degree | 2,205 (75.0%) | 150 (5.1%) |
| Bachelor's Degree or higher | 496 (68.4%) | 0 (0.0%) |
| Total | 4,779 (68.7%) | 410 (5.9%) |
Employment Occupations by Sex in Kelso
Management, Business, Science and Arts Occupations
The most common Management, Business, Science and Arts occupations in Kelso are Management (498 | 8.9%), Computers, Engineering & Science (276 | 4.9%), Community & Social Service (258 | 4.6%), Architecture & Engineering (193 | 3.4%), and Business & Financial (190 | 3.4%).
Management, Business, Science and Arts Occupations by Sex
Within the Management, Business, Science and Arts occupations in Kelso, the most male-oriented occupations are Architecture & Engineering (100.0%), Computers, Engineering & Science (84.8%), and Education, Arts & Media (70.5%), while the most female-oriented occupations are Legal Services & Support (100.0%), Arts, Media & Entertainment (100.0%), and Health Diagnosing & Treating (100.0%).
| Occupation | Male | Female |
| Management | 245 (49.2%) | 253 (50.8%) |
| Business & Financial | 61 (32.1%) | 129 (67.9%) |
| Computers, Engineering & Science | 234 (84.8%) | 42 (15.2%) |
| Computers & Mathematics | 30 (46.9%) | 34 (53.1%) |
| Architecture & Engineering | 193 (100.0%) | 0 (0.0%) |
| Life, Physical & Social Science | 11 (57.9%) | 8 (42.1%) |
| Community & Social Service | 79 (30.6%) | 179 (69.4%) |
| Education, Arts & Media | 55 (70.5%) | 23 (29.5%) |
| Legal Services & Support | 0 (0.0%) | 10 (100.0%) |
| Education Instruction & Library | 24 (14.7%) | 139 (85.3%) |
| Arts, Media & Entertainment | 0 (0.0%) | 7 (100.0%) |
| Health Diagnosing & Treating | 0 (0.0%) | 48 (100.0%) |
| Health Technologists | 0 (0.0%) | 8 (100.0%) |
| Total (Category) | 619 (48.7%) | 651 (51.3%) |
| Total (Overall) | 2,890 (51.5%) | 2,720 (48.5%) |
Services Occupations
The most common Services occupations in Kelso are Food Preparation & Serving (466 | 8.3%), Cleaning & Maintenance (365 | 6.5%), Healthcare Support (318 | 5.7%), Personal Care & Service (189 | 3.4%), and Security & Protection (132 | 2.4%).
Services Occupations by Sex
Within the Services occupations in Kelso, the most male-oriented occupations are Law Enforcement (100.0%), Security & Protection (95.5%), and Firefighting & Prevention (94.1%), while the most female-oriented occupations are Personal Care & Service (100.0%), Healthcare Support (75.2%), and Food Preparation & Serving (51.5%).
| Occupation | Male | Female |
| Healthcare Support | 79 (24.8%) | 239 (75.2%) |
| Security & Protection | 126 (95.5%) | 6 (4.5%) |
| Firefighting & Prevention | 96 (94.1%) | 6 (5.9%) |
| Law Enforcement | 30 (100.0%) | 0 (0.0%) |
| Food Preparation & Serving | 226 (48.5%) | 240 (51.5%) |
| Cleaning & Maintenance | 238 (65.2%) | 127 (34.8%) |
| Personal Care & Service | 0 (0.0%) | 189 (100.0%) |
| Total (Category) | 669 (45.5%) | 801 (54.5%) |
| Total (Overall) | 2,890 (51.5%) | 2,720 (48.5%) |
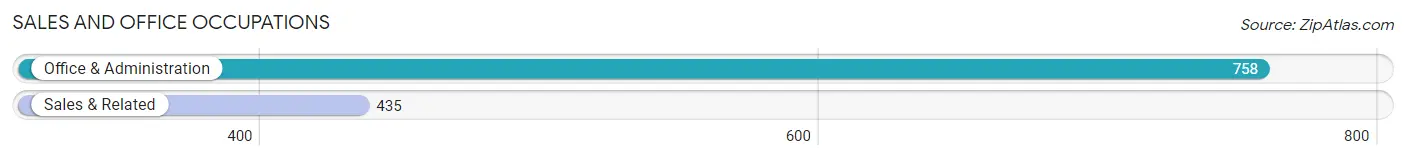
Sales and Office Occupations
The most common Sales and Office occupations in Kelso are Office & Administration (758 | 13.5%), and Sales & Related (435 | 7.7%).
Sales and Office Occupations by Sex
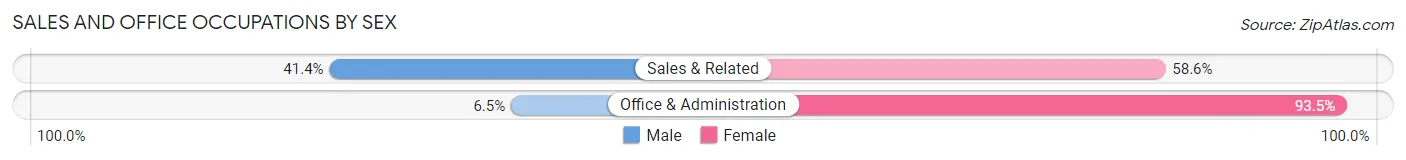
| Occupation | Male | Female |
| Sales & Related | 180 (41.4%) | 255 (58.6%) |
| Office & Administration | 49 (6.5%) | 709 (93.5%) |
| Total (Category) | 229 (19.2%) | 964 (80.8%) |
| Total (Overall) | 2,890 (51.5%) | 2,720 (48.5%) |
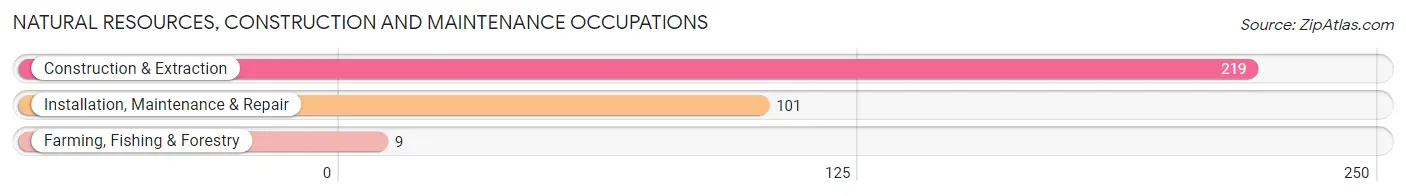
Natural Resources, Construction and Maintenance Occupations
The most common Natural Resources, Construction and Maintenance occupations in Kelso are Construction & Extraction (219 | 3.9%), Installation, Maintenance & Repair (101 | 1.8%), and Farming, Fishing & Forestry (9 | 0.2%).
Natural Resources, Construction and Maintenance Occupations by Sex
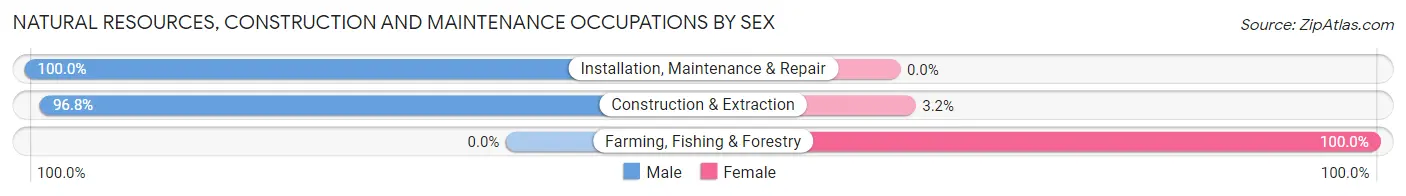
| Occupation | Male | Female |
| Farming, Fishing & Forestry | 0 (0.0%) | 9 (100.0%) |
| Construction & Extraction | 212 (96.8%) | 7 (3.2%) |
| Installation, Maintenance & Repair | 101 (100.0%) | 0 (0.0%) |
| Total (Category) | 313 (95.1%) | 16 (4.9%) |
| Total (Overall) | 2,890 (51.5%) | 2,720 (48.5%) |
Production, Transportation and Moving Occupations
The most common Production, Transportation and Moving occupations in Kelso are Production (568 | 10.1%), Material Moving (438 | 7.8%), and Transportation (342 | 6.1%).
Production, Transportation and Moving Occupations by Sex
| Occupation | Male | Female |
| Production | 502 (88.4%) | 66 (11.6%) |
| Transportation | 294 (86.0%) | 48 (14.0%) |
| Material Moving | 264 (60.3%) | 174 (39.7%) |
| Total (Category) | 1,060 (78.6%) | 288 (21.4%) |
| Total (Overall) | 2,890 (51.5%) | 2,720 (48.5%) |
Employment Industries by Sex in Kelso
Employment Industries in Kelso
The major employment industries in Kelso include Manufacturing (986 | 17.6%), Retail Trade (811 | 14.5%), Health Care & Social Assistance (768 | 13.7%), Professional & Scientific (488 | 8.7%), and Accommodation & Food Services (396 | 7.1%).
Employment Industries by Sex in Kelso
The Kelso industries that see more men than women are Wholesale Trade (100.0%), Construction (93.2%), and Agriculture, Fishing & Hunting (91.1%), whereas the industries that tend to have a higher number of women are Finance & Insurance (100.0%), Information (92.9%), and Professional & Scientific (78.9%).
| Industry | Male | Female |
| Agriculture, Fishing & Hunting | 92 (91.1%) | 9 (8.9%) |
| Mining, Quarrying, & Extraction | 0 (0.0%) | 0 (0.0%) |
| Construction | 290 (93.2%) | 21 (6.8%) |
| Manufacturing | 847 (85.9%) | 139 (14.1%) |
| Wholesale Trade | 45 (100.0%) | 0 (0.0%) |
| Retail Trade | 341 (42.0%) | 470 (58.0%) |
| Transportation & Warehousing | 190 (55.7%) | 151 (44.3%) |
| Utilities | 0 (0.0%) | 0 (0.0%) |
| Information | 3 (7.1%) | 39 (92.9%) |
| Finance & Insurance | 0 (0.0%) | 56 (100.0%) |
| Real Estate, Rental & Leasing | 48 (53.9%) | 41 (46.1%) |
| Professional & Scientific | 103 (21.1%) | 385 (78.9%) |
| Enterprise Management | 0 (0.0%) | 0 (0.0%) |
| Administrative & Support | 204 (56.8%) | 155 (43.2%) |
| Educational Services | 79 (31.7%) | 170 (68.3%) |
| Health Care & Social Assistance | 196 (25.5%) | 572 (74.5%) |
| Arts, Entertainment & Recreation | 104 (70.3%) | 44 (29.7%) |
| Accommodation & Food Services | 157 (39.7%) | 239 (60.4%) |
| Public Administration | 94 (59.5%) | 64 (40.5%) |
| Total | 2,890 (51.5%) | 2,720 (48.5%) |
Education in Kelso
School Enrollment in Kelso
The most common levels of schooling among the 2,546 students in Kelso are elementary school (753 | 29.6%), middle school (717 | 28.2%), and college / undergraduate (453 | 17.8%).
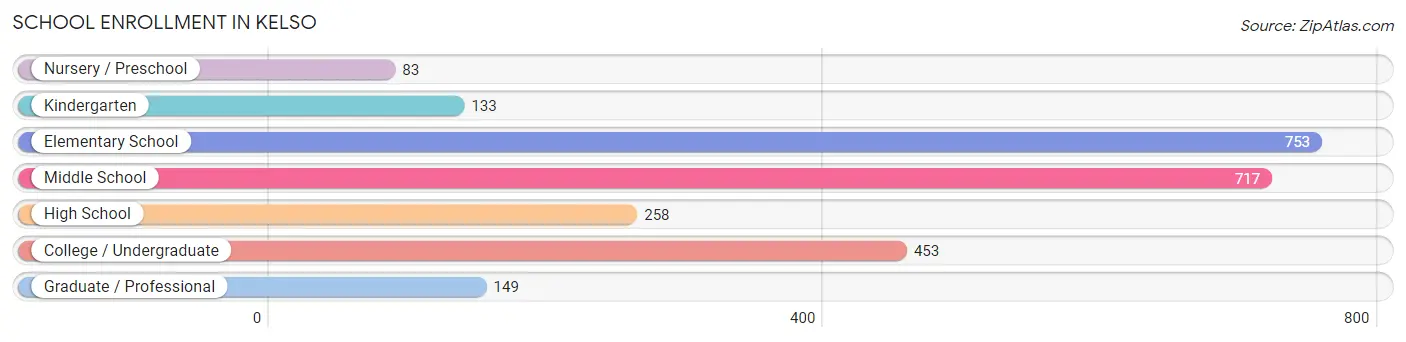
| School Level | # Students | % Students |
| Nursery / Preschool | 83 | 3.3% |
| Kindergarten | 133 | 5.2% |
| Elementary School | 753 | 29.6% |
| Middle School | 717 | 28.2% |
| High School | 258 | 10.1% |
| College / Undergraduate | 453 | 17.8% |
| Graduate / Professional | 149 | 5.9% |
| Total | 2,546 | 100.0% |
School Enrollment by Age by Funding Source in Kelso
Out of a total of 2,546 students who are enrolled in schools in Kelso, 117 (4.6%) attend a private institution, while the remaining 2,429 (95.4%) are enrolled in public schools. The age group of 35 years and over has the highest likelihood of being enrolled in private schools, with 44 (18.0% in the age bracket) enrolled. Conversely, the age group of 3 to 4 year olds has the lowest likelihood of being enrolled in a private school, with 74 (100.0% in the age bracket) attending a public institution.
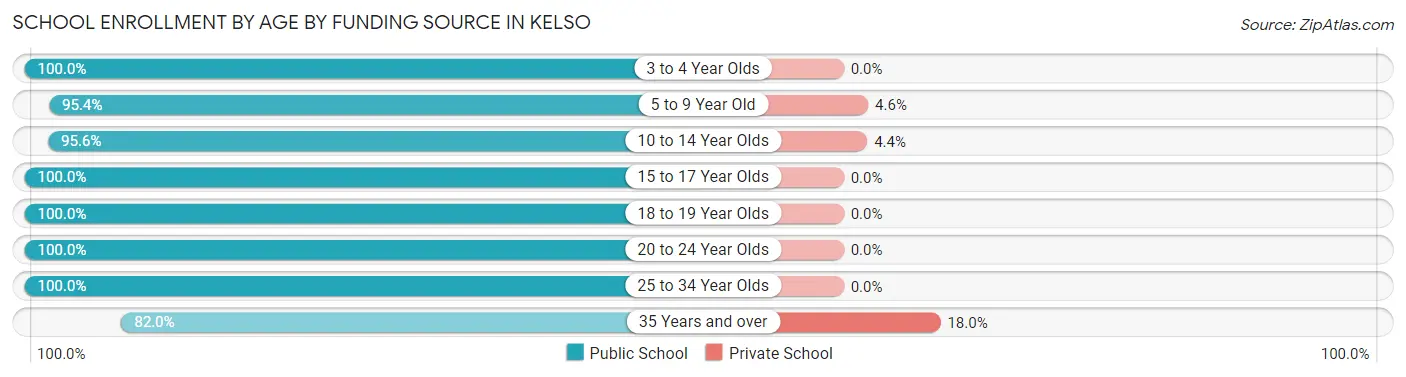
| Age Bracket | Public School | Private School |
| 3 to 4 Year Olds | 74 (100.0%) | 0 (0.0%) |
| 5 to 9 Year Old | 691 (95.4%) | 33 (4.6%) |
| 10 to 14 Year Olds | 849 (95.6%) | 39 (4.4%) |
| 15 to 17 Year Olds | 284 (100.0%) | 0 (0.0%) |
| 18 to 19 Year Olds | 43 (100.0%) | 0 (0.0%) |
| 20 to 24 Year Olds | 115 (100.0%) | 0 (0.0%) |
| 25 to 34 Year Olds | 174 (100.0%) | 0 (0.0%) |
| 35 Years and over | 200 (82.0%) | 44 (18.0%) |
| Total | 2,429 (95.4%) | 117 (4.6%) |
Educational Attainment by Field of Study in Kelso
Business (297 | 24.8%), social sciences (137 | 11.5%), education (111 | 9.3%), literature & languages (108 | 9.0%), and psychology (88 | 7.3%) are the most common fields of study among 1,197 individuals in Kelso who have obtained a bachelor's degree or higher.
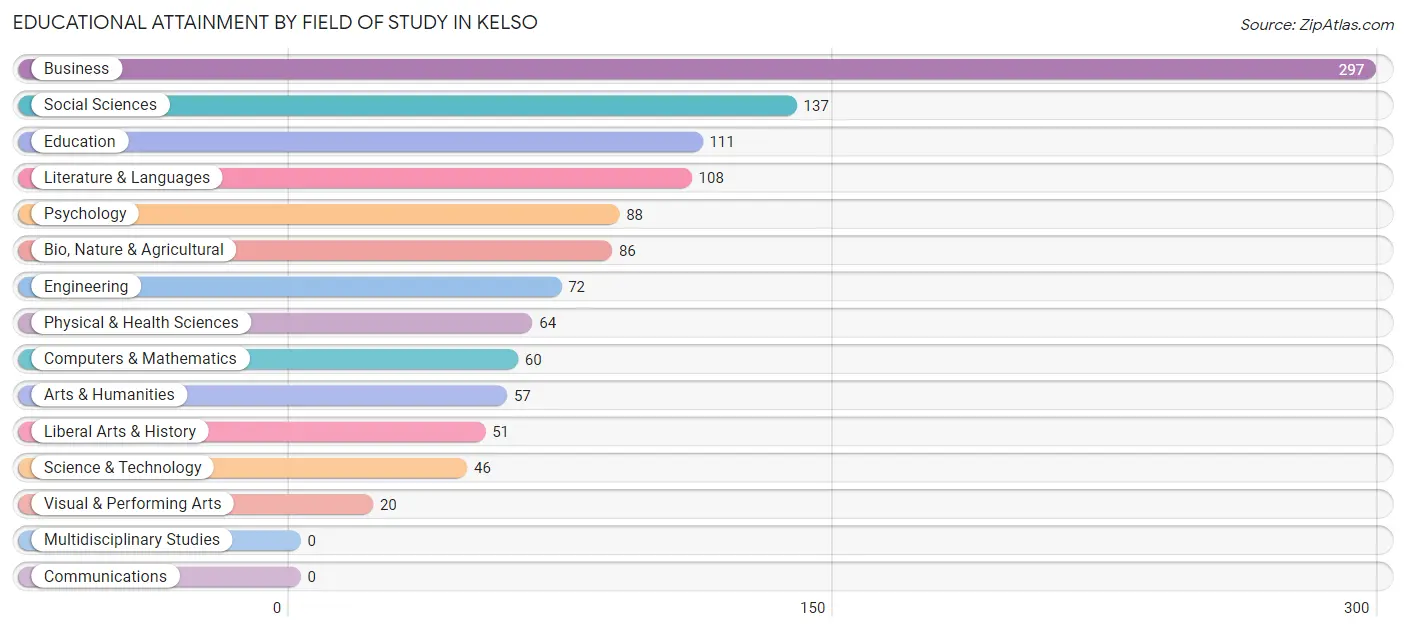
| Field of Study | # Graduates | % Graduates |
| Computers & Mathematics | 60 | 5.0% |
| Bio, Nature & Agricultural | 86 | 7.2% |
| Physical & Health Sciences | 64 | 5.3% |
| Psychology | 88 | 7.3% |
| Social Sciences | 137 | 11.5% |
| Engineering | 72 | 6.0% |
| Multidisciplinary Studies | 0 | 0.0% |
| Science & Technology | 46 | 3.8% |
| Business | 297 | 24.8% |
| Education | 111 | 9.3% |
| Literature & Languages | 108 | 9.0% |
| Liberal Arts & History | 51 | 4.3% |
| Visual & Performing Arts | 20 | 1.7% |
| Communications | 0 | 0.0% |
| Arts & Humanities | 57 | 4.8% |
| Total | 1,197 | 100.0% |
Transportation & Commute in Kelso
Vehicle Availability by Sex in Kelso
The most prevalent vehicle ownership categories in Kelso are males with 2 vehicles (944, accounting for 33.8%) and females with 2 vehicles (1,104, making up 35.0%).
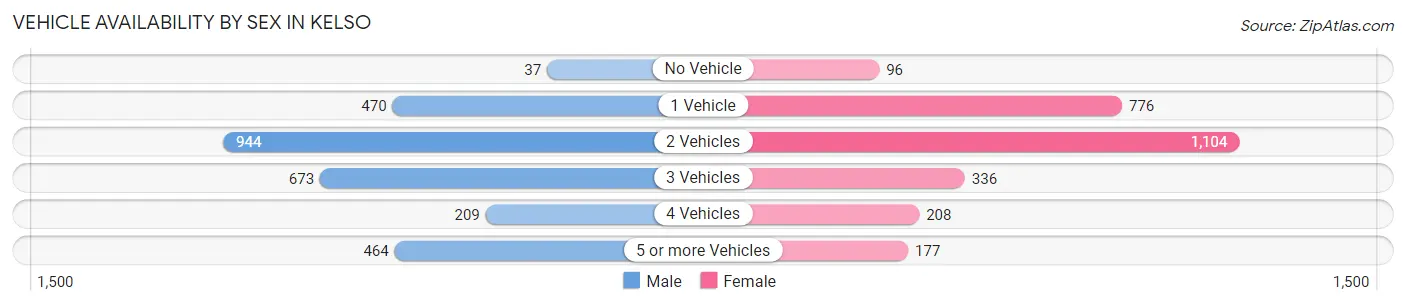
| Vehicles Available | Male | Female |
| No Vehicle | 37 (1.3%) | 96 (3.6%) |
| 1 Vehicle | 470 (16.8%) | 776 (28.8%) |
| 2 Vehicles | 944 (33.8%) | 1,104 (40.9%) |
| 3 Vehicles | 673 (24.1%) | 336 (12.5%) |
| 4 Vehicles | 209 (7.5%) | 208 (7.7%) |
| 5 or more Vehicles | 464 (16.6%) | 177 (6.6%) |
| Total | 2,797 (100.0%) | 2,697 (100.0%) |
Commute Time in Kelso
The most frequently occuring commute durations in Kelso are 10 to 14 minutes (1,293 commuters, 24.9%), 15 to 19 minutes (897 commuters, 17.2%), and 5 to 9 minutes (642 commuters, 12.3%).
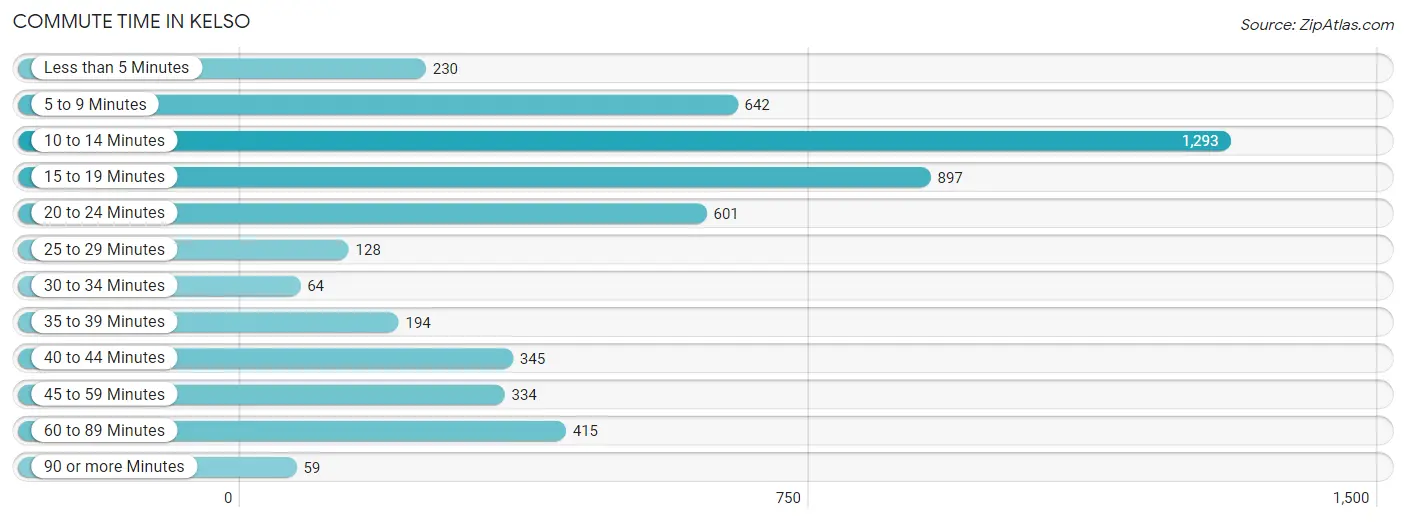
| Commute Time | # Commuters | % Commuters |
| Less than 5 Minutes | 230 | 4.4% |
| 5 to 9 Minutes | 642 | 12.3% |
| 10 to 14 Minutes | 1,293 | 24.9% |
| 15 to 19 Minutes | 897 | 17.2% |
| 20 to 24 Minutes | 601 | 11.6% |
| 25 to 29 Minutes | 128 | 2.5% |
| 30 to 34 Minutes | 64 | 1.2% |
| 35 to 39 Minutes | 194 | 3.7% |
| 40 to 44 Minutes | 345 | 6.6% |
| 45 to 59 Minutes | 334 | 6.4% |
| 60 to 89 Minutes | 415 | 8.0% |
| 90 or more Minutes | 59 | 1.1% |
Commute Time by Sex in Kelso
The most common commute times in Kelso are 10 to 14 minutes (657 commuters, 24.3%) for males and 10 to 14 minutes (636 commuters, 25.5%) for females.
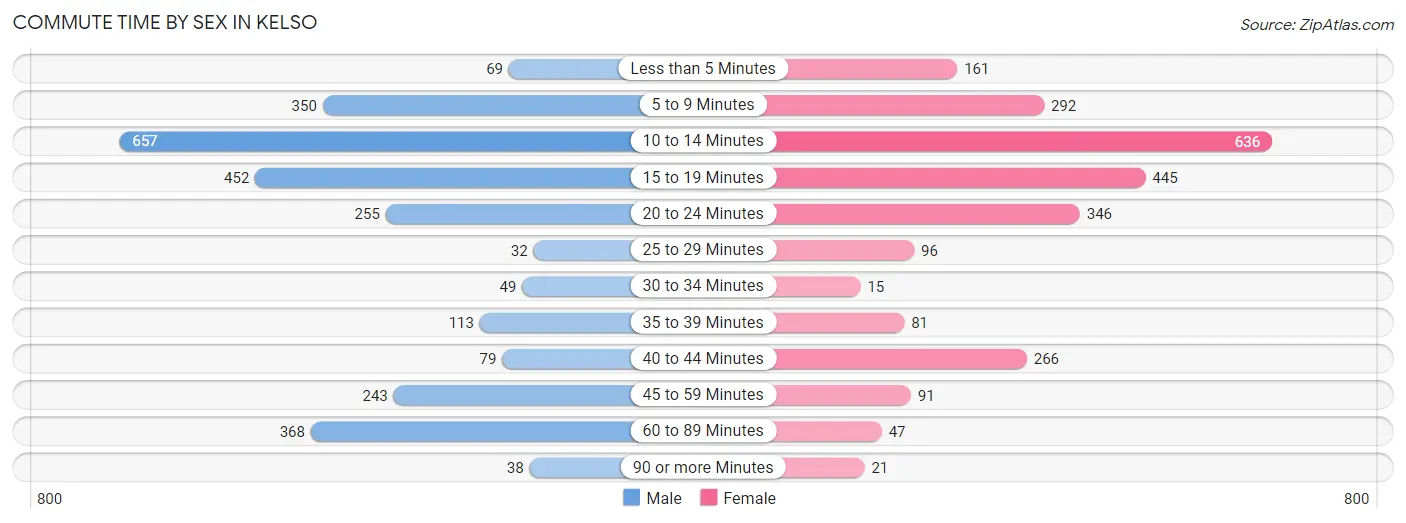
| Commute Time | Male | Female |
| Less than 5 Minutes | 69 (2.5%) | 161 (6.5%) |
| 5 to 9 Minutes | 350 (12.9%) | 292 (11.7%) |
| 10 to 14 Minutes | 657 (24.3%) | 636 (25.5%) |
| 15 to 19 Minutes | 452 (16.7%) | 445 (17.8%) |
| 20 to 24 Minutes | 255 (9.4%) | 346 (13.9%) |
| 25 to 29 Minutes | 32 (1.2%) | 96 (3.8%) |
| 30 to 34 Minutes | 49 (1.8%) | 15 (0.6%) |
| 35 to 39 Minutes | 113 (4.2%) | 81 (3.2%) |
| 40 to 44 Minutes | 79 (2.9%) | 266 (10.6%) |
| 45 to 59 Minutes | 243 (9.0%) | 91 (3.6%) |
| 60 to 89 Minutes | 368 (13.6%) | 47 (1.9%) |
| 90 or more Minutes | 38 (1.4%) | 21 (0.8%) |
Time of Departure to Work by Sex in Kelso
The most frequent times of departure to work in Kelso are 12:00 AM to 4:59 AM (440, 16.3%) for males and 7:30 AM to 7:59 AM (344, 13.8%) for females.
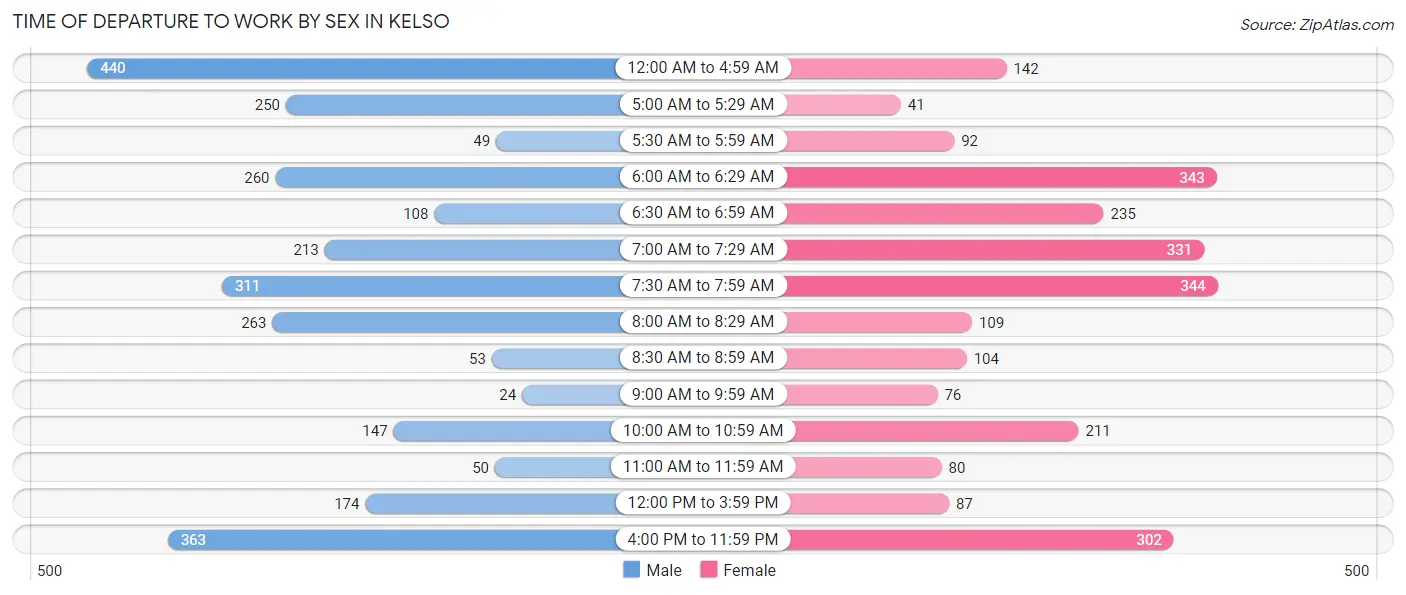
| Time of Departure | Male | Female |
| 12:00 AM to 4:59 AM | 440 (16.3%) | 142 (5.7%) |
| 5:00 AM to 5:29 AM | 250 (9.2%) | 41 (1.6%) |
| 5:30 AM to 5:59 AM | 49 (1.8%) | 92 (3.7%) |
| 6:00 AM to 6:29 AM | 260 (9.6%) | 343 (13.7%) |
| 6:30 AM to 6:59 AM | 108 (4.0%) | 235 (9.4%) |
| 7:00 AM to 7:29 AM | 213 (7.9%) | 331 (13.3%) |
| 7:30 AM to 7:59 AM | 311 (11.5%) | 344 (13.8%) |
| 8:00 AM to 8:29 AM | 263 (9.7%) | 109 (4.4%) |
| 8:30 AM to 8:59 AM | 53 (2.0%) | 104 (4.2%) |
| 9:00 AM to 9:59 AM | 24 (0.9%) | 76 (3.0%) |
| 10:00 AM to 10:59 AM | 147 (5.4%) | 211 (8.5%) |
| 11:00 AM to 11:59 AM | 50 (1.8%) | 80 (3.2%) |
| 12:00 PM to 3:59 PM | 174 (6.4%) | 87 (3.5%) |
| 4:00 PM to 11:59 PM | 363 (13.4%) | 302 (12.1%) |
| Total | 2,705 (100.0%) | 2,497 (100.0%) |
Housing Occupancy in Kelso
Occupancy by Ownership in Kelso
Of the total 5,280 dwellings in Kelso, owner-occupied units account for 3,010 (57.0%), while renter-occupied units make up 2,270 (43.0%).
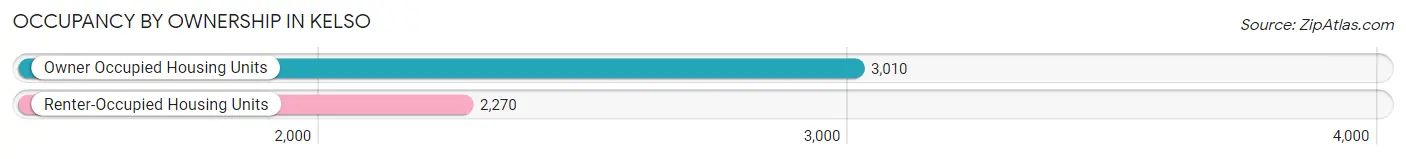
| Occupancy | # Housing Units | % Housing Units |
| Owner Occupied Housing Units | 3,010 | 57.0% |
| Renter-Occupied Housing Units | 2,270 | 43.0% |
| Total Occupied Housing Units | 5,280 | 100.0% |
Occupancy by Household Size in Kelso
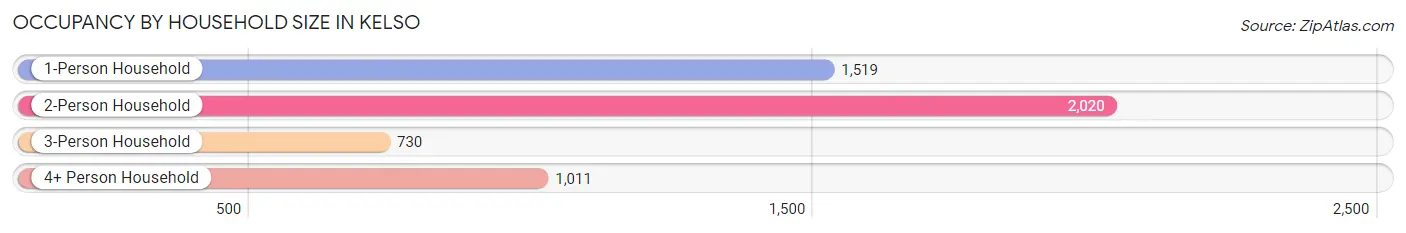
| Household Size | # Housing Units | % Housing Units |
| 1-Person Household | 1,519 | 28.8% |
| 2-Person Household | 2,020 | 38.3% |
| 3-Person Household | 730 | 13.8% |
| 4+ Person Household | 1,011 | 19.2% |
| Total Housing Units | 5,280 | 100.0% |
Occupancy by Ownership by Household Size in Kelso
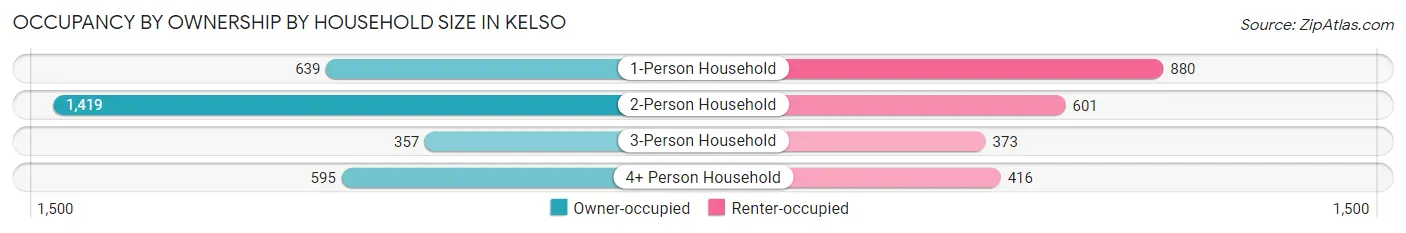
| Household Size | Owner-occupied | Renter-occupied |
| 1-Person Household | 639 (42.1%) | 880 (57.9%) |
| 2-Person Household | 1,419 (70.3%) | 601 (29.7%) |
| 3-Person Household | 357 (48.9%) | 373 (51.1%) |
| 4+ Person Household | 595 (58.9%) | 416 (41.1%) |
| Total Housing Units | 3,010 (57.0%) | 2,270 (43.0%) |
Occupancy by Educational Attainment in Kelso
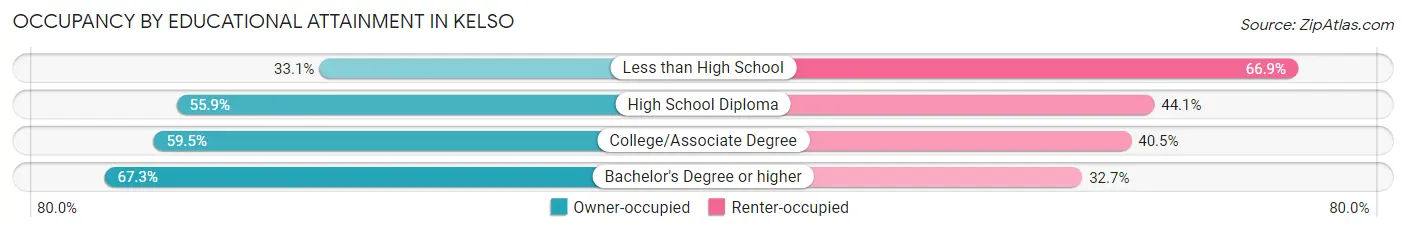
| Household Size | Owner-occupied | Renter-occupied |
| Less than High School | 158 (33.1%) | 319 (66.9%) |
| High School Diploma | 844 (55.9%) | 666 (44.1%) |
| College/Associate Degree | 1,598 (59.5%) | 1,086 (40.5%) |
| Bachelor's Degree or higher | 410 (67.3%) | 199 (32.7%) |
Occupancy by Age of Householder in Kelso
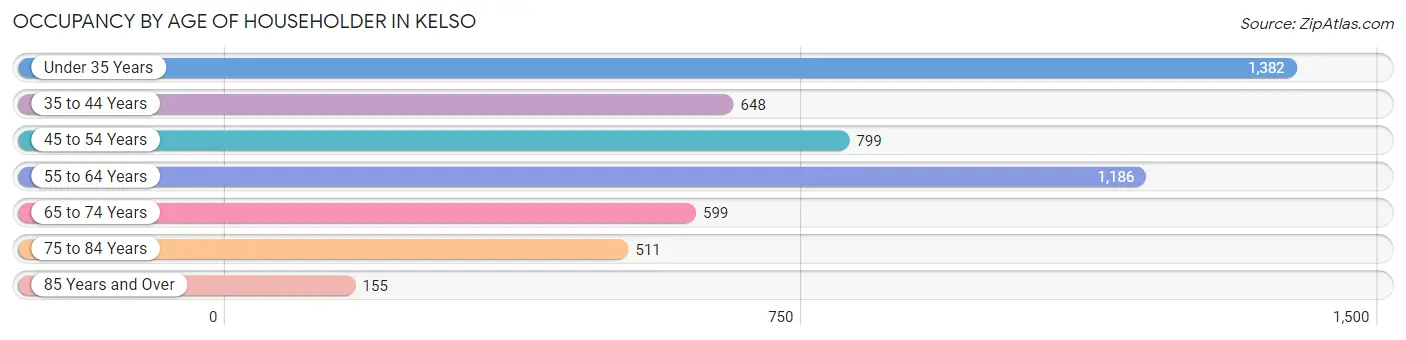
| Age Bracket | # Households | % Households |
| Under 35 Years | 1,382 | 26.2% |
| 35 to 44 Years | 648 | 12.3% |
| 45 to 54 Years | 799 | 15.1% |
| 55 to 64 Years | 1,186 | 22.5% |
| 65 to 74 Years | 599 | 11.3% |
| 75 to 84 Years | 511 | 9.7% |
| 85 Years and Over | 155 | 2.9% |
| Total | 5,280 | 100.0% |
Housing Finances in Kelso
Median Income by Occupancy in Kelso
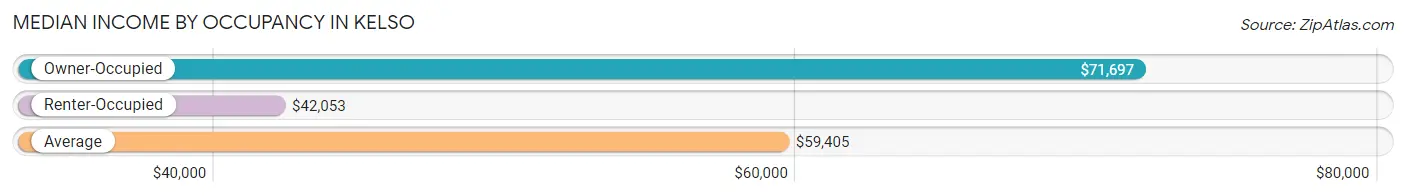
| Occupancy Type | # Households | Median Income |
| Owner-Occupied | 3,010 (57.0%) | $71,697 |
| Renter-Occupied | 2,270 (43.0%) | $42,053 |
| Average | 5,280 (100.0%) | $59,405 |
Occupancy by Householder Income Bracket in Kelso
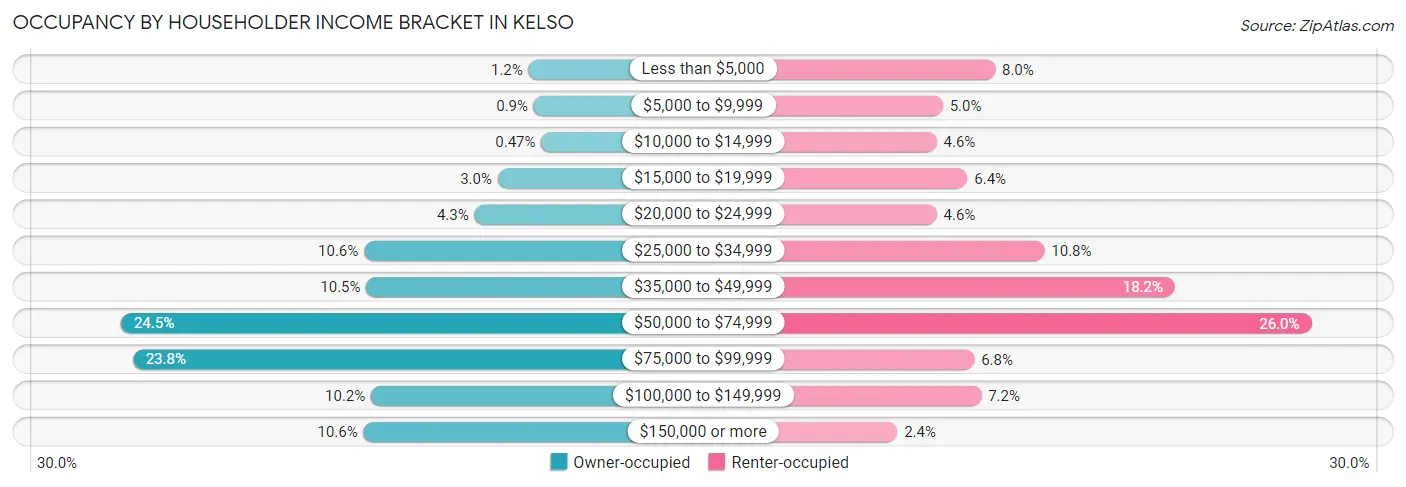
| Income Bracket | Owner-occupied | Renter-occupied |
| Less than $5,000 | 36 (1.2%) | 181 (8.0%) |
| $5,000 to $9,999 | 27 (0.9%) | 113 (5.0%) |
| $10,000 to $14,999 | 14 (0.5%) | 105 (4.6%) |
| $15,000 to $19,999 | 89 (3.0%) | 145 (6.4%) |
| $20,000 to $24,999 | 129 (4.3%) | 105 (4.6%) |
| $25,000 to $34,999 | 319 (10.6%) | 245 (10.8%) |
| $35,000 to $49,999 | 315 (10.5%) | 414 (18.2%) |
| $50,000 to $74,999 | 737 (24.5%) | 591 (26.0%) |
| $75,000 to $99,999 | 717 (23.8%) | 154 (6.8%) |
| $100,000 to $149,999 | 307 (10.2%) | 163 (7.2%) |
| $150,000 or more | 320 (10.6%) | 54 (2.4%) |
| Total | 3,010 (100.0%) | 2,270 (100.0%) |
Monthly Housing Cost Tiers in Kelso
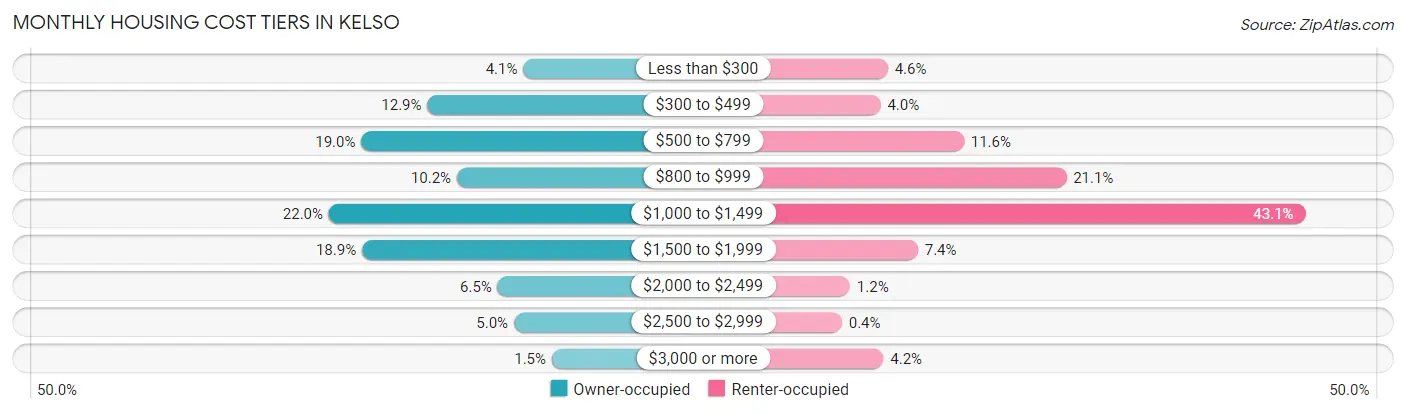
| Monthly Cost | Owner-occupied | Renter-occupied |
| Less than $300 | 123 (4.1%) | 105 (4.6%) |
| $300 to $499 | 389 (12.9%) | 90 (4.0%) |
| $500 to $799 | 572 (19.0%) | 264 (11.6%) |
| $800 to $999 | 307 (10.2%) | 478 (21.1%) |
| $1,000 to $1,499 | 662 (22.0%) | 978 (43.1%) |
| $1,500 to $1,999 | 570 (18.9%) | 168 (7.4%) |
| $2,000 to $2,499 | 194 (6.5%) | 26 (1.1%) |
| $2,500 to $2,999 | 149 (5.0%) | 9 (0.4%) |
| $3,000 or more | 44 (1.5%) | 96 (4.2%) |
| Total | 3,010 (100.0%) | 2,270 (100.0%) |
Physical Housing Characteristics in Kelso
Housing Structures in Kelso
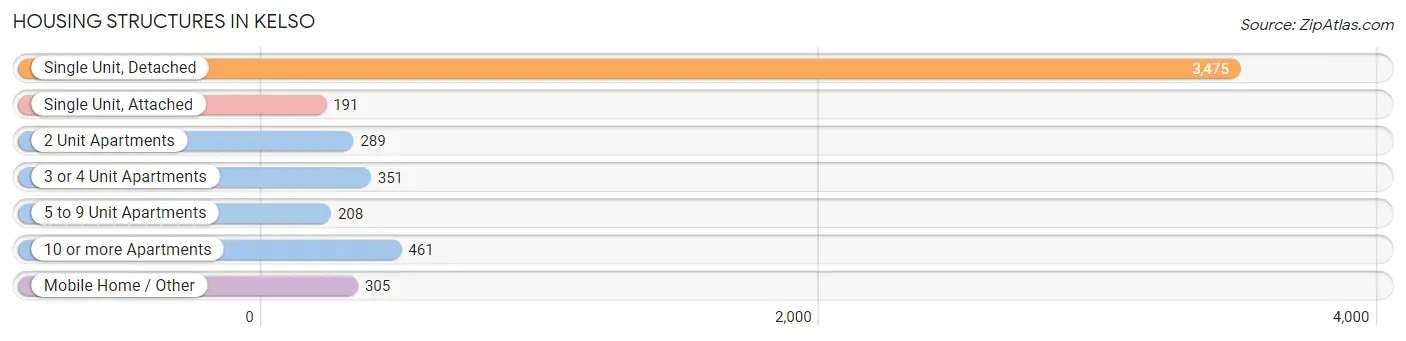
| Structure Type | # Housing Units | % Housing Units |
| Single Unit, Detached | 3,475 | 65.8% |
| Single Unit, Attached | 191 | 3.6% |
| 2 Unit Apartments | 289 | 5.5% |
| 3 or 4 Unit Apartments | 351 | 6.7% |
| 5 to 9 Unit Apartments | 208 | 3.9% |
| 10 or more Apartments | 461 | 8.7% |
| Mobile Home / Other | 305 | 5.8% |
| Total | 5,280 | 100.0% |
Housing Structures by Occupancy in Kelso
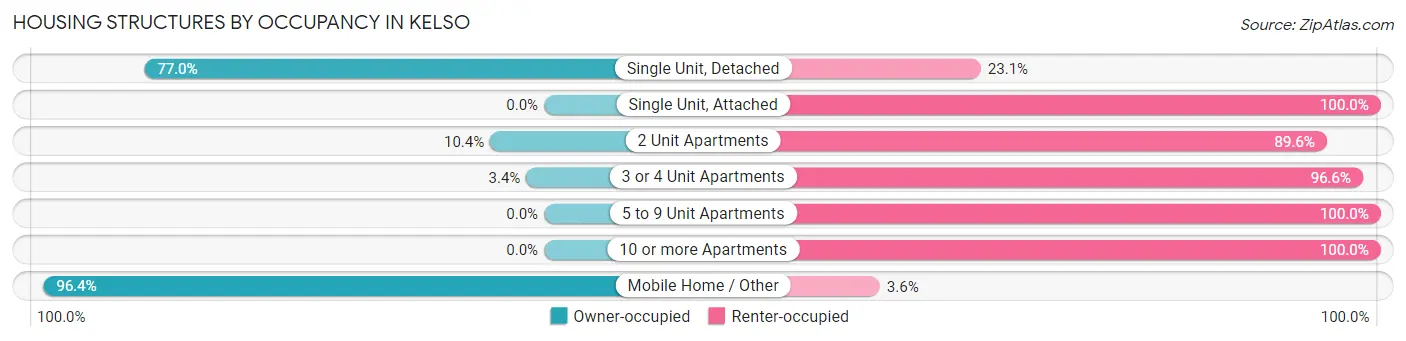
| Structure Type | Owner-occupied | Renter-occupied |
| Single Unit, Detached | 2,674 (76.9%) | 801 (23.1%) |
| Single Unit, Attached | 0 (0.0%) | 191 (100.0%) |
| 2 Unit Apartments | 30 (10.4%) | 259 (89.6%) |
| 3 or 4 Unit Apartments | 12 (3.4%) | 339 (96.6%) |
| 5 to 9 Unit Apartments | 0 (0.0%) | 208 (100.0%) |
| 10 or more Apartments | 0 (0.0%) | 461 (100.0%) |
| Mobile Home / Other | 294 (96.4%) | 11 (3.6%) |
| Total | 3,010 (57.0%) | 2,270 (43.0%) |
Housing Structures by Number of Rooms in Kelso
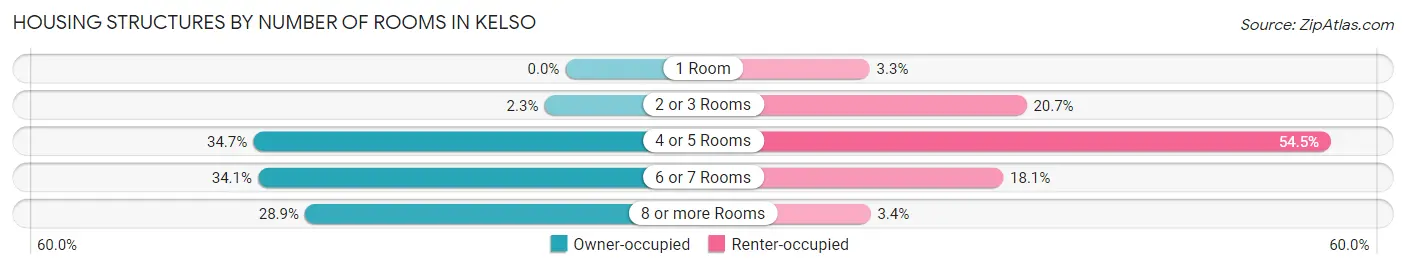
| Number of Rooms | Owner-occupied | Renter-occupied |
| 1 Room | 0 (0.0%) | 75 (3.3%) |
| 2 or 3 Rooms | 70 (2.3%) | 470 (20.7%) |
| 4 or 5 Rooms | 1,043 (34.6%) | 1,237 (54.5%) |
| 6 or 7 Rooms | 1,027 (34.1%) | 411 (18.1%) |
| 8 or more Rooms | 870 (28.9%) | 77 (3.4%) |
| Total | 3,010 (100.0%) | 2,270 (100.0%) |
Housing Structure by Heating Type in Kelso
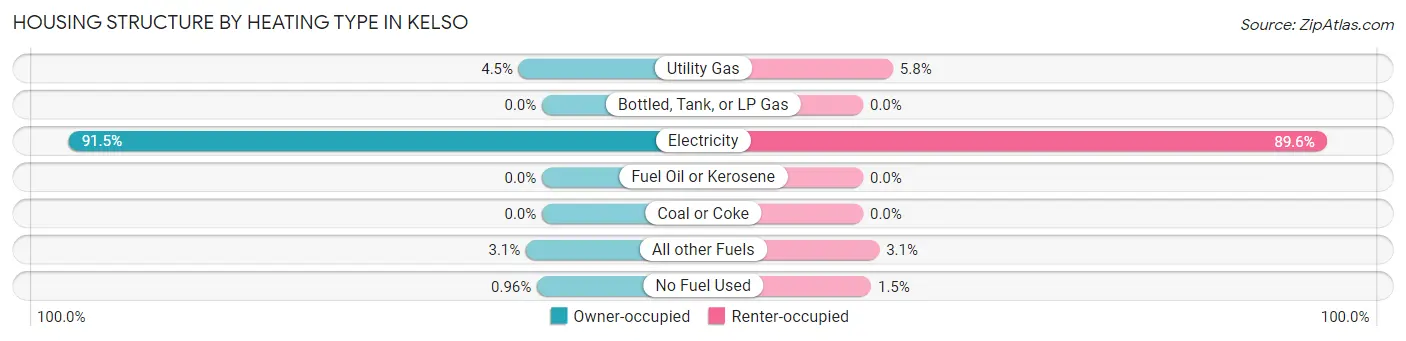
| Heating Type | Owner-occupied | Renter-occupied |
| Utility Gas | 135 (4.5%) | 131 (5.8%) |
| Bottled, Tank, or LP Gas | 0 (0.0%) | 0 (0.0%) |
| Electricity | 2,753 (91.5%) | 2,033 (89.6%) |
| Fuel Oil or Kerosene | 0 (0.0%) | 0 (0.0%) |
| Coal or Coke | 0 (0.0%) | 0 (0.0%) |
| All other Fuels | 93 (3.1%) | 71 (3.1%) |
| No Fuel Used | 29 (1.0%) | 35 (1.5%) |
| Total | 3,010 (100.0%) | 2,270 (100.0%) |
Household Vehicle Usage in Kelso
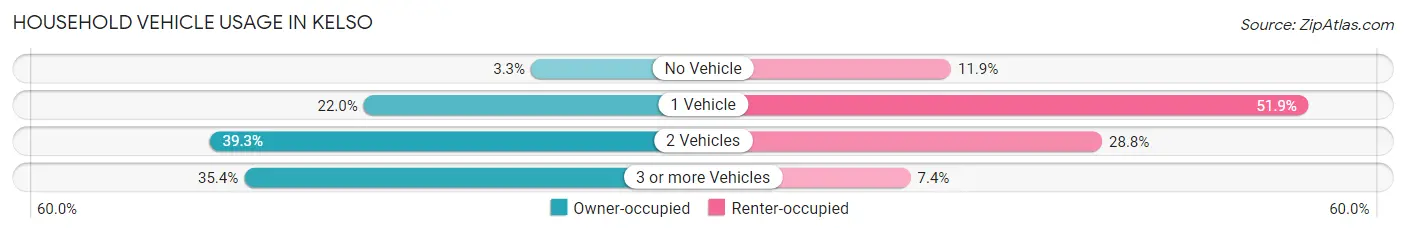
| Vehicles per Household | Owner-occupied | Renter-occupied |
| No Vehicle | 99 (3.3%) | 270 (11.9%) |
| 1 Vehicle | 663 (22.0%) | 1,179 (51.9%) |
| 2 Vehicles | 1,182 (39.3%) | 654 (28.8%) |
| 3 or more Vehicles | 1,066 (35.4%) | 167 (7.4%) |
| Total | 3,010 (100.0%) | 2,270 (100.0%) |
Real Estate & Mortgages in Kelso
Real Estate and Mortgage Overview in Kelso
| Characteristic | Without Mortgage | With Mortgage |
| Housing Units | 1,101 | 1,909 |
| Median Property Value | $214,500 | $277,600 |
| Median Household Income | $57,083 | $309 |
| Monthly Housing Costs | $527 | $44 |
| Real Estate Taxes | $1,657 | $47 |
Property Value by Mortgage Status in Kelso
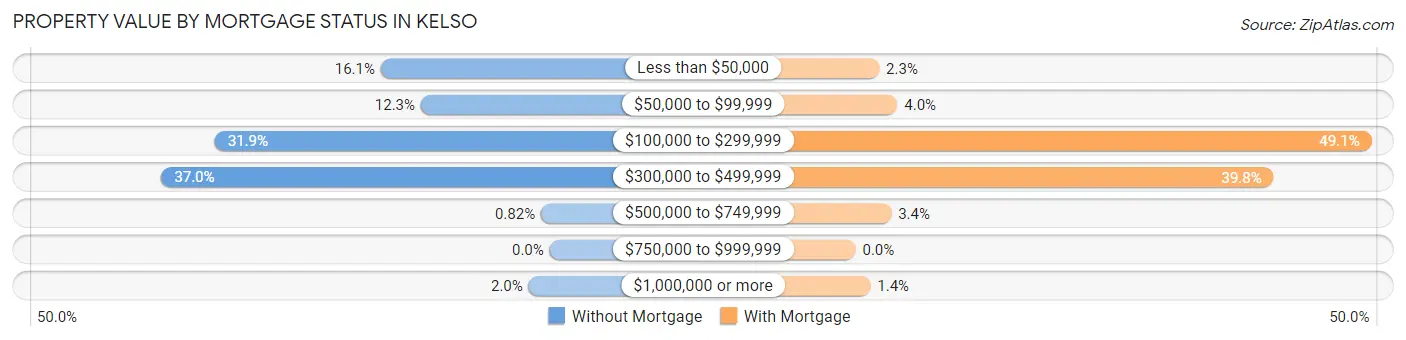
| Property Value | Without Mortgage | With Mortgage |
| Less than $50,000 | 177 (16.1%) | 43 (2.2%) |
| $50,000 to $99,999 | 135 (12.3%) | 76 (4.0%) |
| $100,000 to $299,999 | 351 (31.9%) | 938 (49.1%) |
| $300,000 to $499,999 | 407 (37.0%) | 760 (39.8%) |
| $500,000 to $749,999 | 9 (0.8%) | 65 (3.4%) |
| $750,000 to $999,999 | 0 (0.0%) | 0 (0.0%) |
| $1,000,000 or more | 22 (2.0%) | 27 (1.4%) |
| Total | 1,101 (100.0%) | 1,909 (100.0%) |
Household Income by Mortgage Status in Kelso
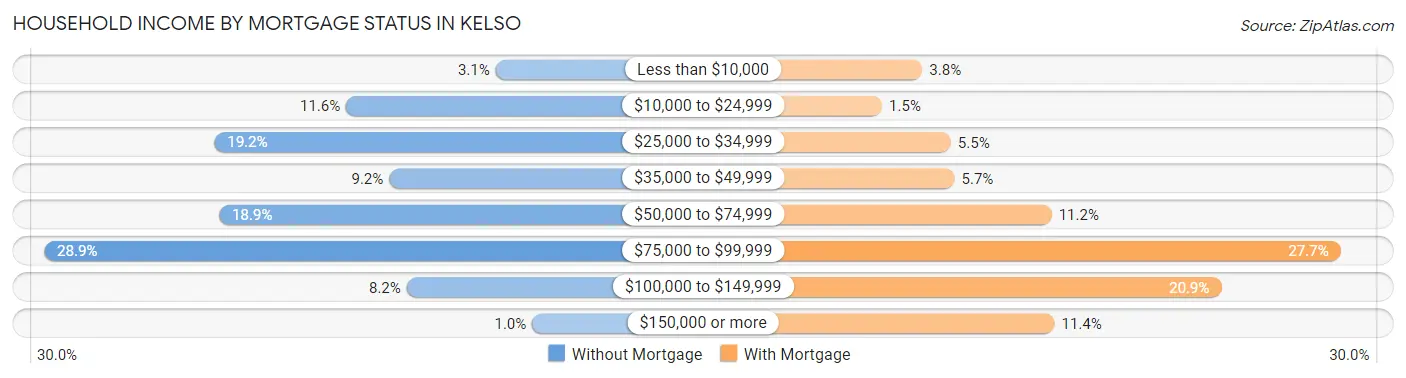
| Household Income | Without Mortgage | With Mortgage |
| Less than $10,000 | 34 (3.1%) | 73 (3.8%) |
| $10,000 to $24,999 | 128 (11.6%) | 29 (1.5%) |
| $25,000 to $34,999 | 211 (19.2%) | 104 (5.4%) |
| $35,000 to $49,999 | 101 (9.2%) | 108 (5.7%) |
| $50,000 to $74,999 | 208 (18.9%) | 214 (11.2%) |
| $75,000 to $99,999 | 318 (28.9%) | 529 (27.7%) |
| $100,000 to $149,999 | 90 (8.2%) | 399 (20.9%) |
| $150,000 or more | 11 (1.0%) | 217 (11.4%) |
| Total | 1,101 (100.0%) | 1,909 (100.0%) |
Property Value to Household Income Ratio in Kelso
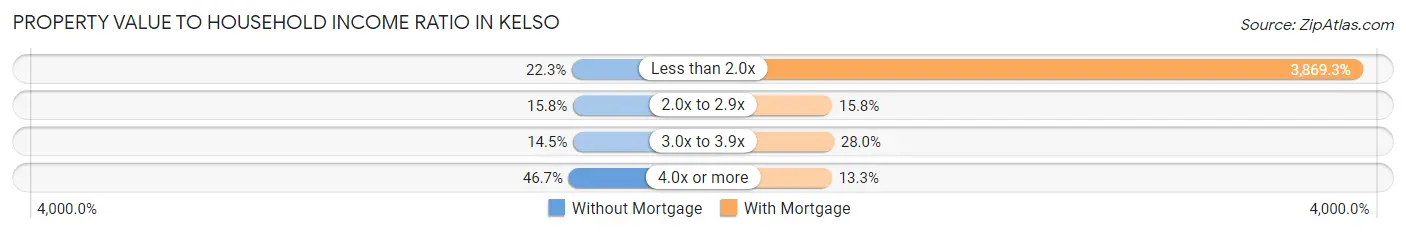
| Value-to-Income Ratio | Without Mortgage | With Mortgage |
| Less than 2.0x | 246 (22.3%) | 73,865 (3,869.3%) |
| 2.0x to 2.9x | 174 (15.8%) | 302 (15.8%) |
| 3.0x to 3.9x | 160 (14.5%) | 534 (28.0%) |
| 4.0x or more | 514 (46.7%) | 254 (13.3%) |
| Total | 1,101 (100.0%) | 1,909 (100.0%) |
Real Estate Taxes by Mortgage Status in Kelso
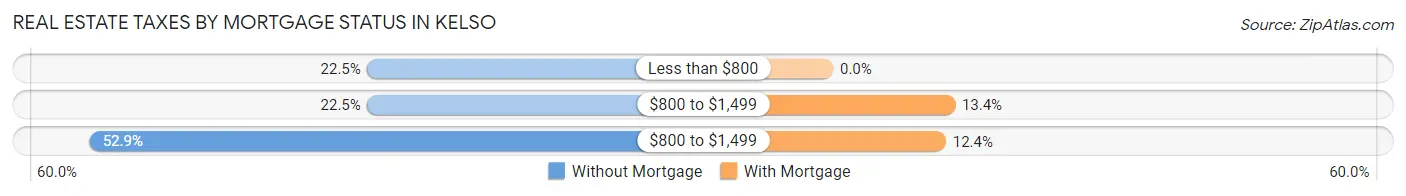
| Property Taxes | Without Mortgage | With Mortgage |
| Less than $800 | 248 (22.5%) | 0 (0.0%) |
| $800 to $1,499 | 248 (22.5%) | 255 (13.4%) |
| $800 to $1,499 | 582 (52.9%) | 236 (12.4%) |
| Total | 1,101 (100.0%) | 1,909 (100.0%) |
Health & Disability in Kelso
Health Insurance Coverage by Age in Kelso
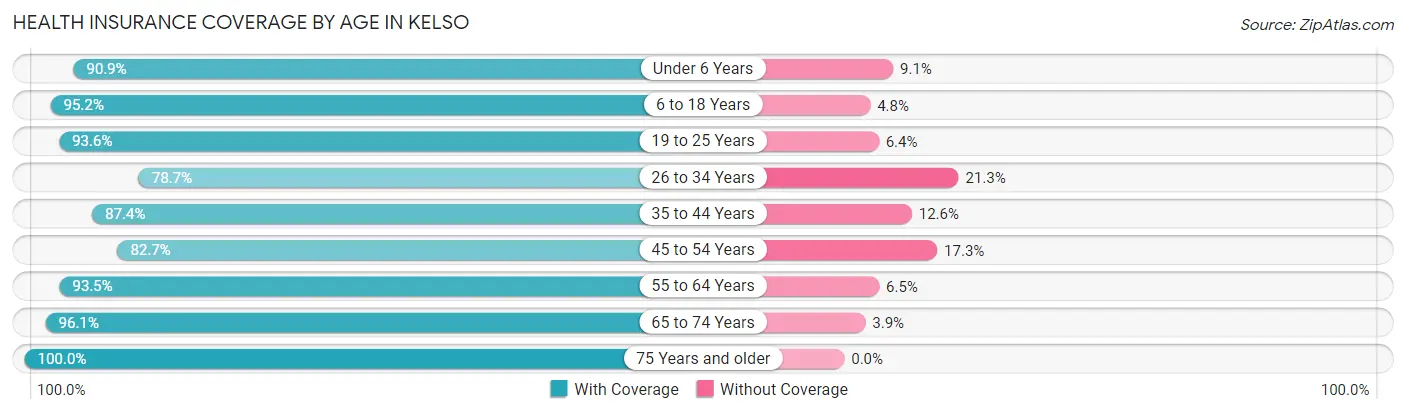
| Age Bracket | With Coverage | Without Coverage |
| Under 6 Years | 779 (90.9%) | 78 (9.1%) |
| 6 to 18 Years | 1,873 (95.2%) | 95 (4.8%) |
| 19 to 25 Years | 1,050 (93.6%) | 72 (6.4%) |
| 26 to 34 Years | 1,611 (78.7%) | 436 (21.3%) |
| 35 to 44 Years | 1,271 (87.4%) | 183 (12.6%) |
| 45 to 54 Years | 1,146 (82.7%) | 240 (17.3%) |
| 55 to 64 Years | 1,859 (93.5%) | 129 (6.5%) |
| 65 to 74 Years | 858 (96.1%) | 35 (3.9%) |
| 75 Years and older | 946 (100.0%) | 0 (0.0%) |
| Total | 11,393 (90.0%) | 1,268 (10.0%) |
Health Insurance Coverage by Citizenship Status in Kelso
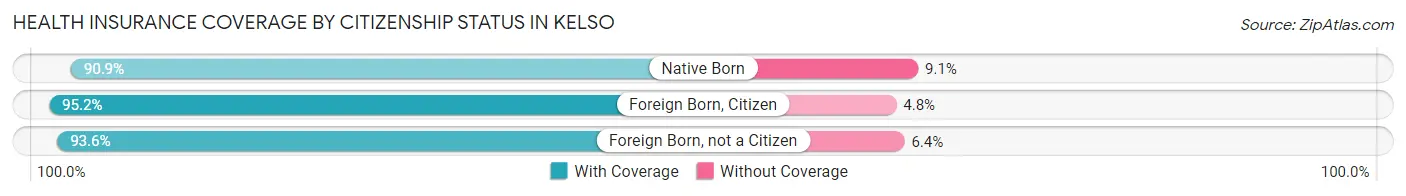
| Citizenship Status | With Coverage | Without Coverage |
| Native Born | 779 (90.9%) | 78 (9.1%) |
| Foreign Born, Citizen | 1,873 (95.2%) | 95 (4.8%) |
| Foreign Born, not a Citizen | 1,050 (93.6%) | 72 (6.4%) |
Health Insurance Coverage by Household Income in Kelso
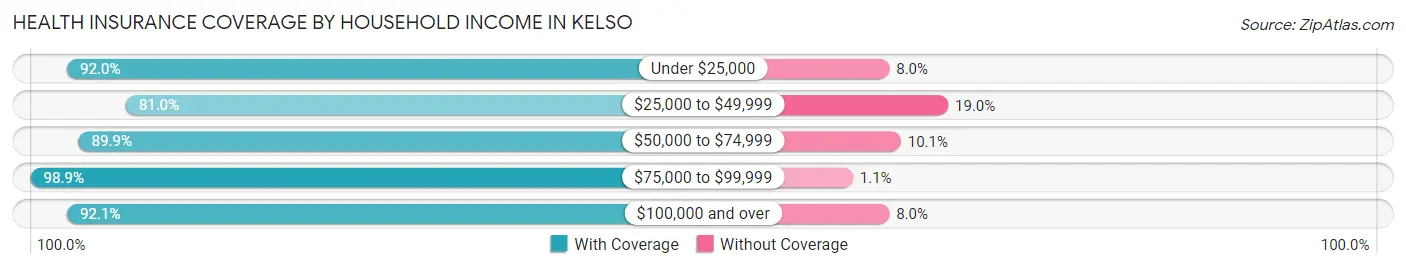
| Household Income | With Coverage | Without Coverage |
| Under $25,000 | 1,422 (92.0%) | 123 (8.0%) |
| $25,000 to $49,999 | 2,394 (81.0%) | 561 (19.0%) |
| $50,000 to $74,999 | 3,127 (89.9%) | 352 (10.1%) |
| $75,000 to $99,999 | 2,005 (98.9%) | 23 (1.1%) |
| $100,000 and over | 2,396 (92.0%) | 207 (8.0%) |
Public vs Private Health Insurance Coverage by Age in Kelso
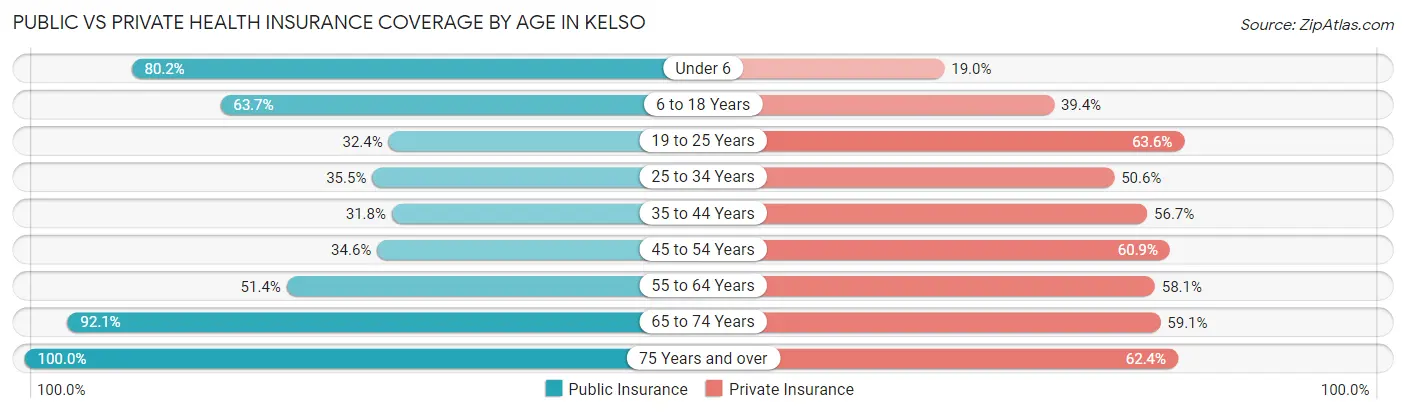
| Age Bracket | Public Insurance | Private Insurance |
| Under 6 | 687 (80.2%) | 163 (19.0%) |
| 6 to 18 Years | 1,253 (63.7%) | 775 (39.4%) |
| 19 to 25 Years | 364 (32.4%) | 713 (63.5%) |
| 25 to 34 Years | 726 (35.5%) | 1,035 (50.6%) |
| 35 to 44 Years | 463 (31.8%) | 824 (56.7%) |
| 45 to 54 Years | 479 (34.6%) | 844 (60.9%) |
| 55 to 64 Years | 1,021 (51.4%) | 1,155 (58.1%) |
| 65 to 74 Years | 822 (92.0%) | 528 (59.1%) |
| 75 Years and over | 946 (100.0%) | 590 (62.4%) |
| Total | 6,761 (53.4%) | 6,627 (52.3%) |
Disability Status by Sex by Age in Kelso
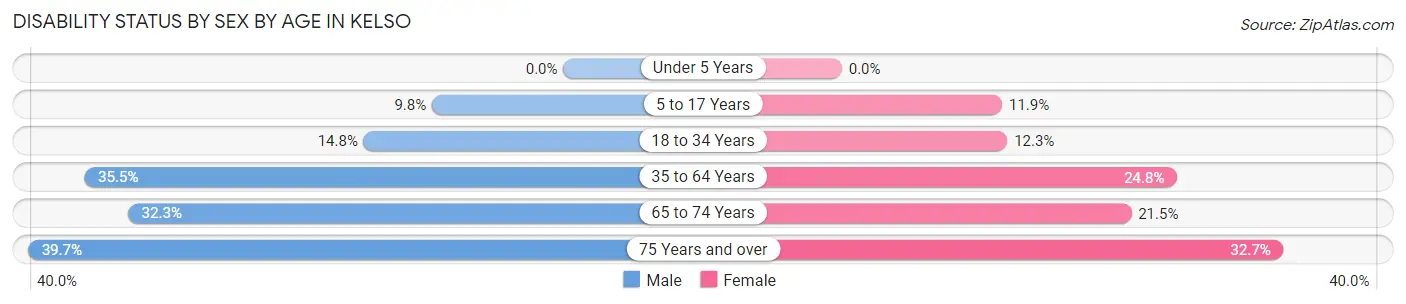
| Age Bracket | Male | Female |
| Under 5 Years | 0 (0.0%) | 0 (0.0%) |
| 5 to 17 Years | 108 (9.8%) | 101 (11.9%) |
| 18 to 34 Years | 266 (14.8%) | 177 (12.3%) |
| 35 to 64 Years | 822 (35.5%) | 624 (24.8%) |
| 65 to 74 Years | 141 (32.3%) | 98 (21.5%) |
| 75 Years and over | 179 (39.7%) | 162 (32.7%) |
Disability Class by Sex by Age in Kelso
Disability Class: Hearing Difficulty
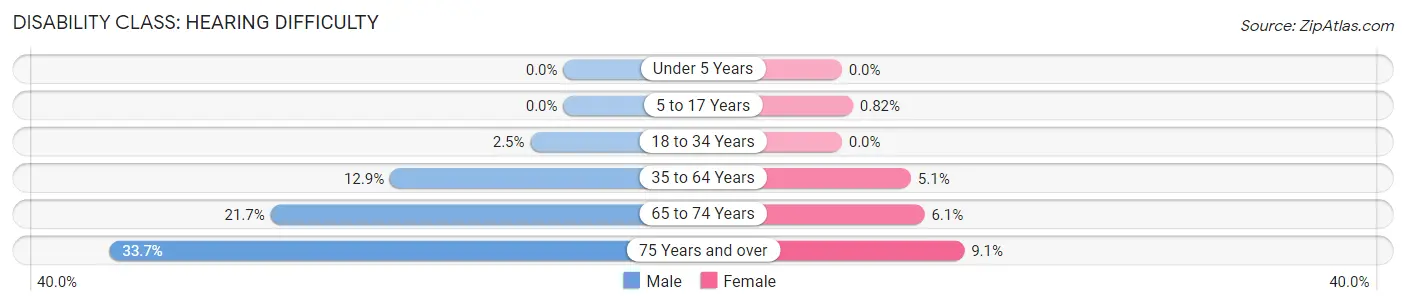
| Age Bracket | Male | Female |
| Under 5 Years | 0 (0.0%) | 0 (0.0%) |
| 5 to 17 Years | 0 (0.0%) | 7 (0.8%) |
| 18 to 34 Years | 44 (2.5%) | 0 (0.0%) |
| 35 to 64 Years | 298 (12.9%) | 129 (5.1%) |
| 65 to 74 Years | 95 (21.7%) | 28 (6.1%) |
| 75 Years and over | 152 (33.7%) | 45 (9.1%) |
Disability Class: Vision Difficulty
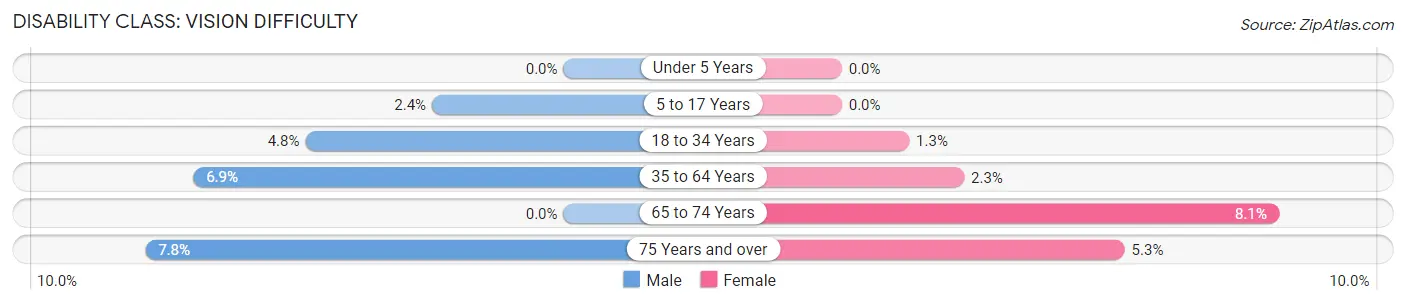
| Age Bracket | Male | Female |
| Under 5 Years | 0 (0.0%) | 0 (0.0%) |
| 5 to 17 Years | 27 (2.4%) | 0 (0.0%) |
| 18 to 34 Years | 86 (4.8%) | 18 (1.3%) |
| 35 to 64 Years | 159 (6.9%) | 57 (2.3%) |
| 65 to 74 Years | 0 (0.0%) | 37 (8.1%) |
| 75 Years and over | 35 (7.8%) | 26 (5.2%) |
Disability Class: Cognitive Difficulty
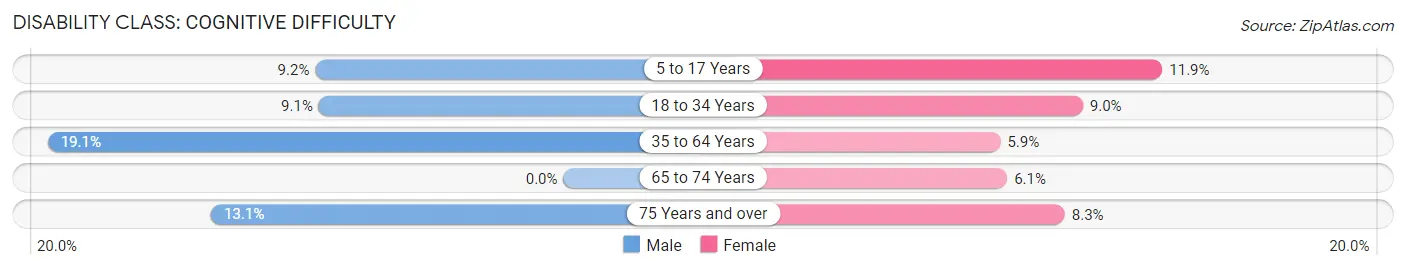
| Age Bracket | Male | Female |
| 5 to 17 Years | 102 (9.2%) | 101 (11.9%) |
| 18 to 34 Years | 163 (9.1%) | 129 (8.9%) |
| 35 to 64 Years | 443 (19.1%) | 148 (5.9%) |
| 65 to 74 Years | 0 (0.0%) | 28 (6.1%) |
| 75 Years and over | 59 (13.1%) | 41 (8.3%) |
Disability Class: Ambulatory Difficulty
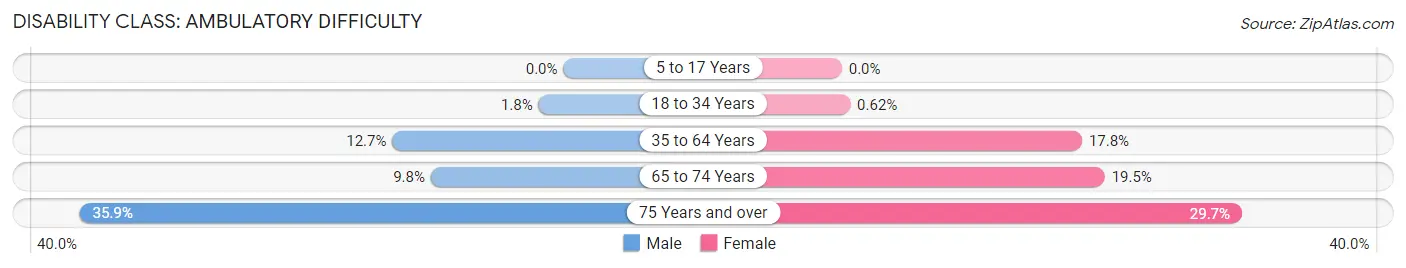
| Age Bracket | Male | Female |
| 5 to 17 Years | 0 (0.0%) | 0 (0.0%) |
| 18 to 34 Years | 33 (1.8%) | 9 (0.6%) |
| 35 to 64 Years | 294 (12.7%) | 448 (17.8%) |
| 65 to 74 Years | 43 (9.8%) | 89 (19.5%) |
| 75 Years and over | 162 (35.9%) | 147 (29.7%) |
Disability Class: Self-Care Difficulty
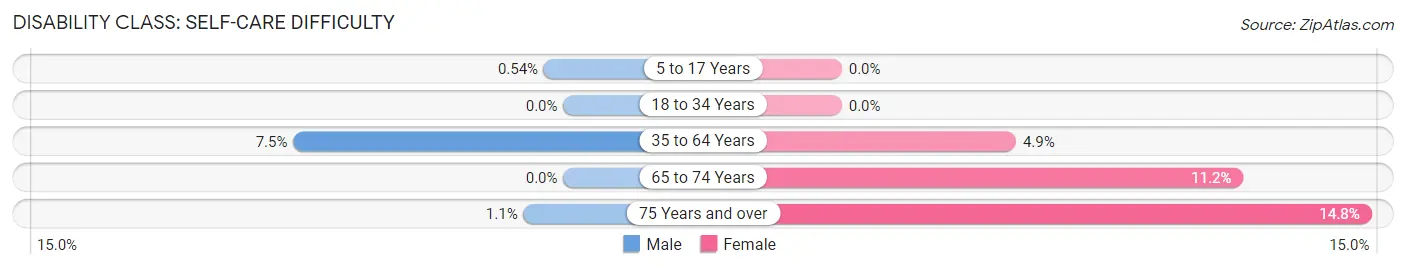
| Age Bracket | Male | Female |
| 5 to 17 Years | 6 (0.5%) | 0 (0.0%) |
| 18 to 34 Years | 0 (0.0%) | 0 (0.0%) |
| 35 to 64 Years | 174 (7.5%) | 122 (4.9%) |
| 65 to 74 Years | 0 (0.0%) | 51 (11.2%) |
| 75 Years and over | 5 (1.1%) | 73 (14.7%) |
Technology Access in Kelso
Computing Device Access in Kelso
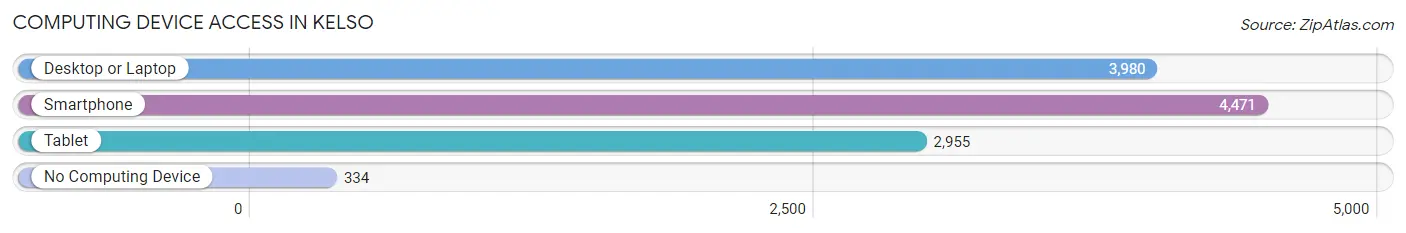
| Device Type | # Households | % Households |
| Desktop or Laptop | 3,980 | 75.4% |
| Smartphone | 4,471 | 84.7% |
| Tablet | 2,955 | 56.0% |
| No Computing Device | 334 | 6.3% |
| Total | 5,280 | 100.0% |
Internet Access in Kelso
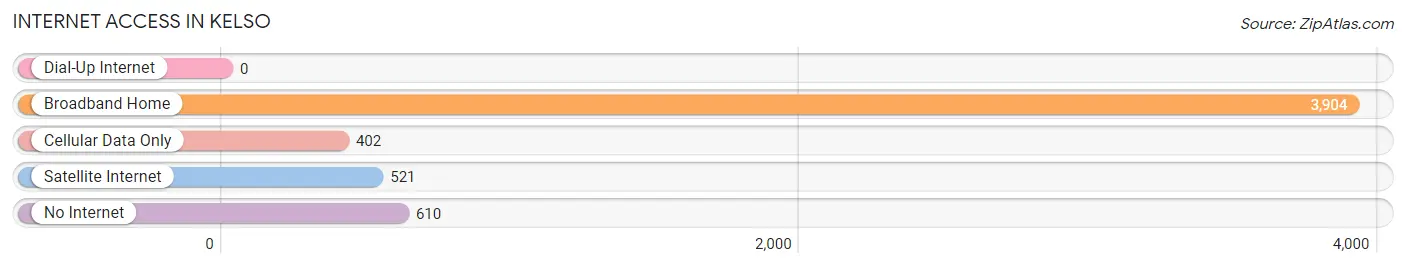
| Internet Type | # Households | % Households |
| Dial-Up Internet | 0 | 0.0% |
| Broadband Home | 3,904 | 73.9% |
| Cellular Data Only | 402 | 7.6% |
| Satellite Internet | 521 | 9.9% |
| No Internet | 610 | 11.6% |
| Total | 5,280 | 100.0% |
Kelso Summary
Kelso, Washington is a city located in Cowlitz County, Washington, United States. It is situated along the Columbia River, approximately 30 miles north of Portland, Oregon. The city is the county seat of Cowlitz County and is the largest city in the county. As of the 2010 census, the population of Kelso was 11,925.
History
Kelso was founded in 1884 by the Northern Pacific Railway. The city was named after the Scottish town of Kelso, which was the birthplace of one of the railroad's directors. The city was incorporated in 1885 and was the first city in Cowlitz County to be incorporated.
Kelso was a major lumber town in the late 19th and early 20th centuries. The city was home to several lumber mills, including the Long-Bell Lumber Company, which was the largest lumber mill in the world at the time. The city was also home to several other industries, including a brickyard, a cannery, and a shipbuilding yard.
Kelso was also the site of a major labor dispute in 1919. The Long-Bell Lumber Company attempted to reduce wages and increase working hours, leading to a strike by the workers. The strike lasted for several months and was eventually resolved in favor of the workers.
Geography
Kelso is located in southwestern Washington, approximately 30 miles north of Portland, Oregon. The city is situated along the Columbia River, which forms the border between Washington and Oregon. The city is located in the foothills of the Cascade Mountains and is surrounded by forests and rolling hills.
The climate in Kelso is mild and temperate. The average high temperature in the summer is around 80 degrees Fahrenheit, and the average low temperature in the winter is around 40 degrees Fahrenheit.
Economy
Kelso's economy is largely based on the lumber industry. The city is home to several lumber mills, including the Long-Bell Lumber Company, which is the largest lumber mill in the county. The city is also home to several other industries, including a brickyard, a cannery, and a shipbuilding yard.
Kelso is also home to several retail stores, restaurants, and other businesses. The city is also home to several medical facilities, including a hospital and several clinics.
Demographics
As of the 2010 census, the population of Kelso was 11,925. The racial makeup of the city was 87.3% White, 0.7% African American, 1.2% Native American, 0.7% Asian, 0.1% Pacific Islander, 6.3% from other races, and 3.9% from two or more races. Hispanic or Latino of any race were 11.2% of the population.
The median income for a household in Kelso was $37,945, and the median income for a family was $45,945. The per capita income for the city was $19,945. About 14.3% of families and 17.7% of the population were below the poverty line, including 25.3% of those under age 18 and 8.2% of those age 65 or over.
Common Questions
What is Per Capita Income in Kelso?
Per Capita income in Kelso is $27,832.
What is the Median Family Income in Kelso?
Median Family Income in Kelso is $68,160.
What is the Median Household income in Kelso?
Median Household Income in Kelso is $59,405.
What is Income or Wage Gap in Kelso?
Income or Wage Gap in Kelso is 16.1%.
Women in Kelso earn 83.9 cents for every dollar earned by a man.
What is Family Income Deficit in Kelso?
Family Income Deficit in Kelso is $9,592.
Families that are below poverty line in Kelso earn $9,592 less on average than the poverty threshold level.
What is Inequality or Gini Index in Kelso?
Inequality or Gini Index in Kelso is 0.39.
What is the Total Population of Kelso?
Total Population of Kelso is 12,661.
What is the Total Male Population of Kelso?
Total Male Population of Kelso is 6,515.
What is the Total Female Population of Kelso?
Total Female Population of Kelso is 6,146.
What is the Ratio of Males per 100 Females in Kelso?
There are 106.00 Males per 100 Females in Kelso.
What is the Ratio of Females per 100 Males in Kelso?
There are 94.34 Females per 100 Males in Kelso.
What is the Median Population Age in Kelso?
Median Population Age in Kelso is 37.3 Years.
What is the Average Family Size in Kelso
Average Family Size in Kelso is 2.9 People.
What is the Average Household Size in Kelso
Average Household Size in Kelso is 2.4 People.
How Large is the Labor Force in Kelso?
There are 5,966 People in the Labor Forcein in Kelso.
What is the Percentage of People in the Labor Force in Kelso?
59.4% of People are in the Labor Force in Kelso.
What is the Unemployment Rate in Kelso?
Unemployment Rate in Kelso is 6.0%.