Lind, WA Map & Demographics
Lind Map
Lind Overview
$27,602
PER CAPITA INCOME
$61,944
AVG FAMILY INCOME
$65,313
AVG HOUSEHOLD INCOME
8.4%
WAGE / INCOME GAP [ % ]
91.6¢/ $1
WAGE / INCOME GAP [ $ ]
0.31
INEQUALITY / GINI INDEX
569
TOTAL POPULATION
311
MALE POPULATION
258
FEMALE POPULATION
120.54
MALES / 100 FEMALES
82.96
FEMALES / 100 MALES
49.3
MEDIAN AGE
2.6
AVG FAMILY SIZE
2.4
AVG HOUSEHOLD SIZE
290
LABOR FORCE [ PEOPLE ]
59.9%
PERCENT IN LABOR FORCE
7.6%
UNEMPLOYMENT RATE
Lind Zip Codes
Lind Area Codes
Income in Lind
Income Overview in Lind
Per Capita Income in Lind is $27,602, while median incomes of families and households are $61,944 and $65,313 respectively.
| Characteristic | Number | Measure |
| Per Capita Income | 569 | $27,602 |
| Median Family Income | 172 | $61,944 |
| Mean Family Income | 172 | $72,542 |
| Median Household Income | 235 | $65,313 |
| Mean Household Income | 235 | $66,902 |
| Income Deficit | 172 | $0 |
| Wage / Income Gap (%) | 569 | 8.35% |
| Wage / Income Gap ($) | 569 | 91.65¢ per $1 |
| Gini / Inequality Index | 569 | 0.31 |
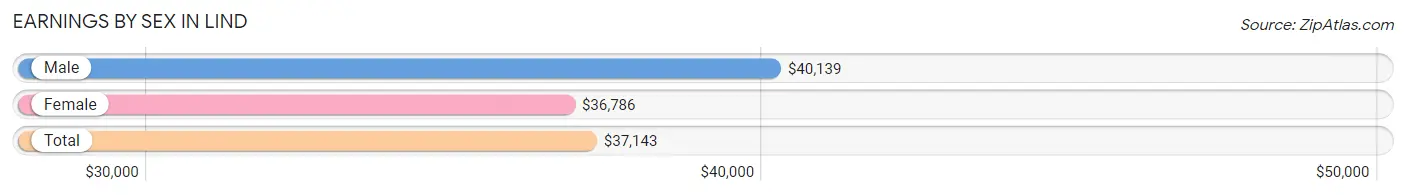
Earnings by Sex in Lind
Average Earnings in Lind are $37,143, $40,139 for men and $36,786 for women, a difference of 8.4%.
| Sex | Number | Average Earnings |
| Male | 206 (68.7%) | $40,139 |
| Female | 94 (31.3%) | $36,786 |
| Total | 300 (100.0%) | $37,143 |
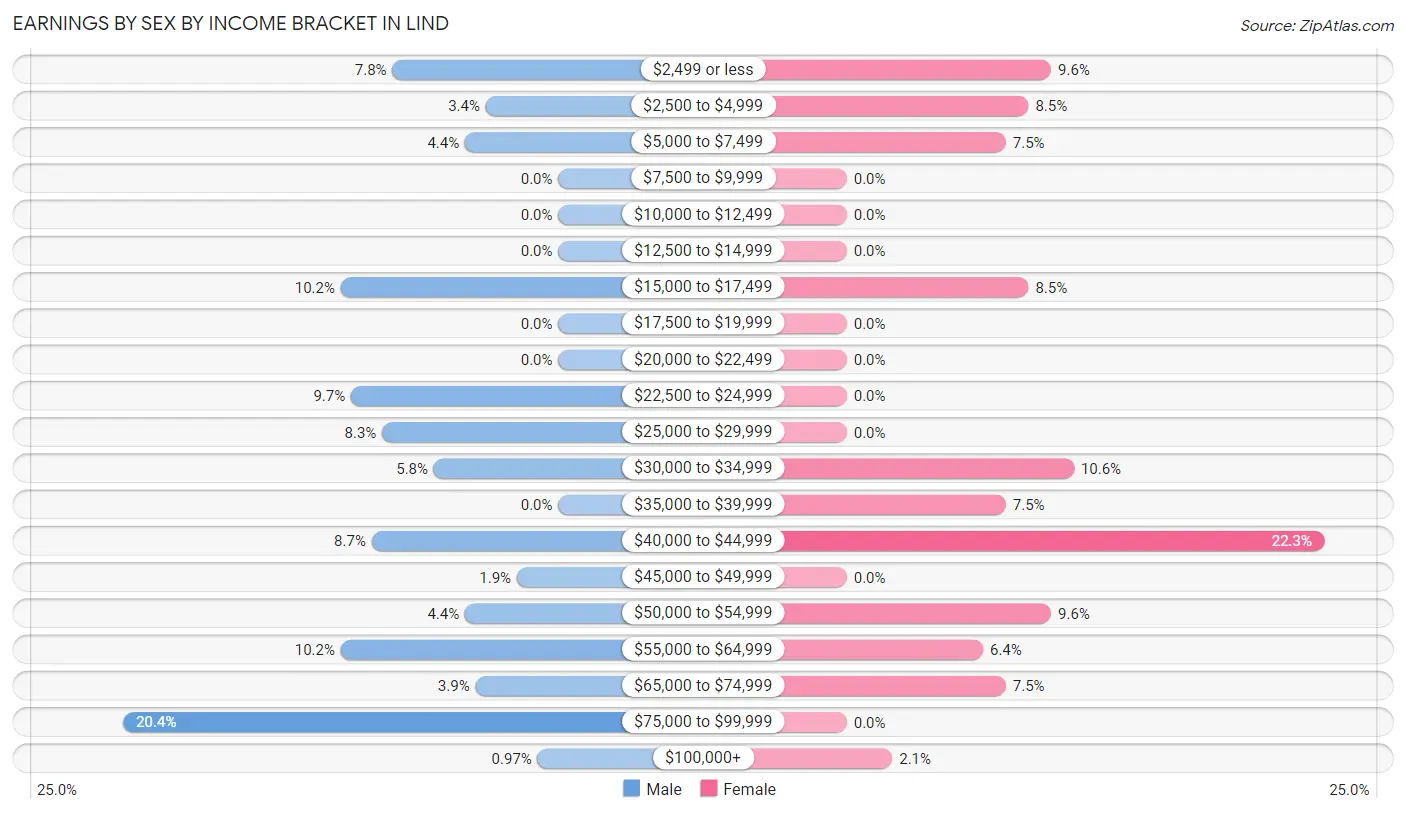
Earnings by Sex by Income Bracket in Lind
The most common earnings brackets in Lind are $75,000 to $99,999 for men (42 | 20.4%) and $40,000 to $44,999 for women (21 | 22.3%).
| Income | Male | Female |
| $2,499 or less | 16 (7.8%) | 9 (9.6%) |
| $2,500 to $4,999 | 7 (3.4%) | 8 (8.5%) |
| $5,000 to $7,499 | 9 (4.4%) | 7 (7.4%) |
| $7,500 to $9,999 | 0 (0.0%) | 0 (0.0%) |
| $10,000 to $12,499 | 0 (0.0%) | 0 (0.0%) |
| $12,500 to $14,999 | 0 (0.0%) | 0 (0.0%) |
| $15,000 to $17,499 | 21 (10.2%) | 8 (8.5%) |
| $17,500 to $19,999 | 0 (0.0%) | 0 (0.0%) |
| $20,000 to $22,499 | 0 (0.0%) | 0 (0.0%) |
| $22,500 to $24,999 | 20 (9.7%) | 0 (0.0%) |
| $25,000 to $29,999 | 17 (8.3%) | 0 (0.0%) |
| $30,000 to $34,999 | 12 (5.8%) | 10 (10.6%) |
| $35,000 to $39,999 | 0 (0.0%) | 7 (7.4%) |
| $40,000 to $44,999 | 18 (8.7%) | 21 (22.3%) |
| $45,000 to $49,999 | 4 (1.9%) | 0 (0.0%) |
| $50,000 to $54,999 | 9 (4.4%) | 9 (9.6%) |
| $55,000 to $64,999 | 21 (10.2%) | 6 (6.4%) |
| $65,000 to $74,999 | 8 (3.9%) | 7 (7.4%) |
| $75,000 to $99,999 | 42 (20.4%) | 0 (0.0%) |
| $100,000+ | 2 (1.0%) | 2 (2.1%) |
| Total | 206 (100.0%) | 94 (100.0%) |
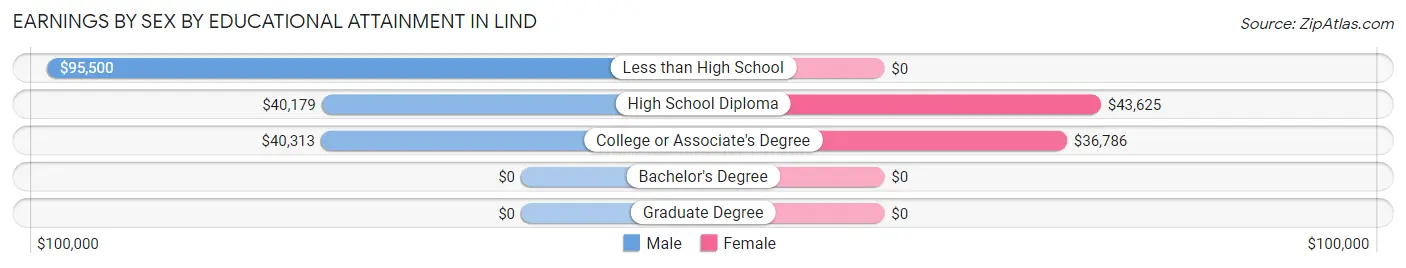
Earnings by Sex by Educational Attainment in Lind
Average earnings in Lind are $42,361 for men and $43,155 for women, a difference of 1.8%. Men with an educational attainment of less than high school enjoy the highest average annual earnings of $95,500, while those with high school diploma education earn the least with $40,179. Women with an educational attainment of high school diploma earn the most with the average annual earnings of $43,625, while those with college or associate's degree education have the smallest earnings of $36,786.
| Educational Attainment | Male Income | Female Income |
| Less than High School | $95,500 | $0 |
| High School Diploma | $40,179 | $43,625 |
| College or Associate's Degree | $40,313 | $36,786 |
| Bachelor's Degree | - | - |
| Graduate Degree | - | - |
| Total | $42,361 | $43,155 |
Family Income in Lind
Family Income Brackets in Lind
According to the Lind family income data, there are 57 families falling into the $50,000 to $74,999 income range, which is the most common income bracket and makes up 33.1% of all families.
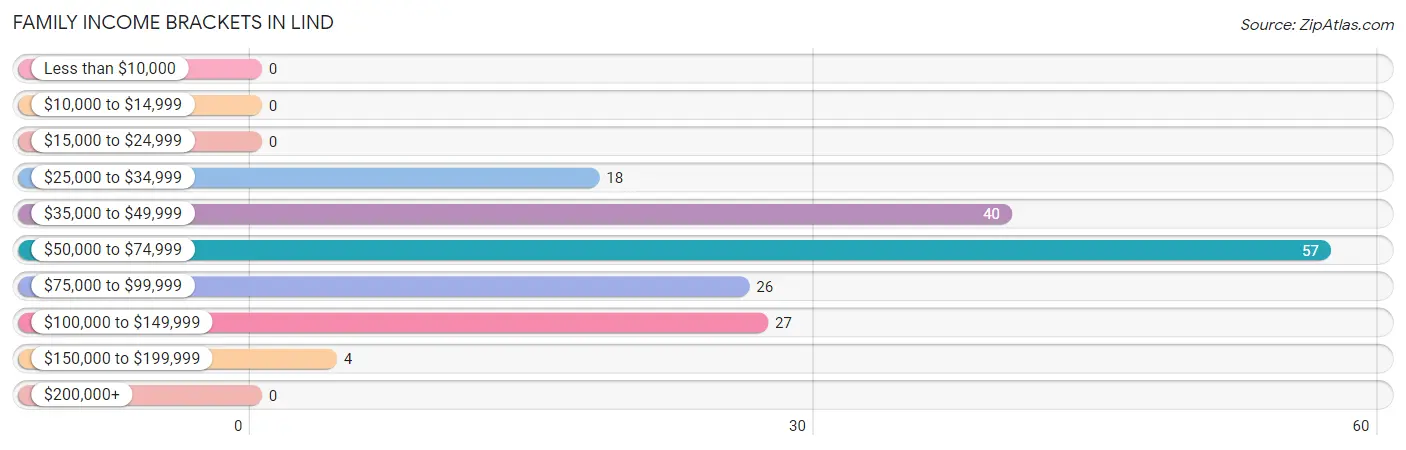
| Income Bracket | # Families | % Families |
| Less than $10,000 | 0 | 0.0% |
| $10,000 to $14,999 | 0 | 0.0% |
| $15,000 to $24,999 | 0 | 0.0% |
| $25,000 to $34,999 | 18 | 10.5% |
| $35,000 to $49,999 | 40 | 23.3% |
| $50,000 to $74,999 | 57 | 33.1% |
| $75,000 to $99,999 | 26 | 15.1% |
| $100,000 to $149,999 | 27 | 15.7% |
| $150,000 to $199,999 | 4 | 2.3% |
| $200,000+ | 0 | 0.0% |
Family Income by Famaliy Size in Lind
3-person families (10 | 5.8%) account for the highest median family income in Lind with $118,929 per family, while 3-person families (10 | 5.8%) have the highest median income of $39,643 per family member.
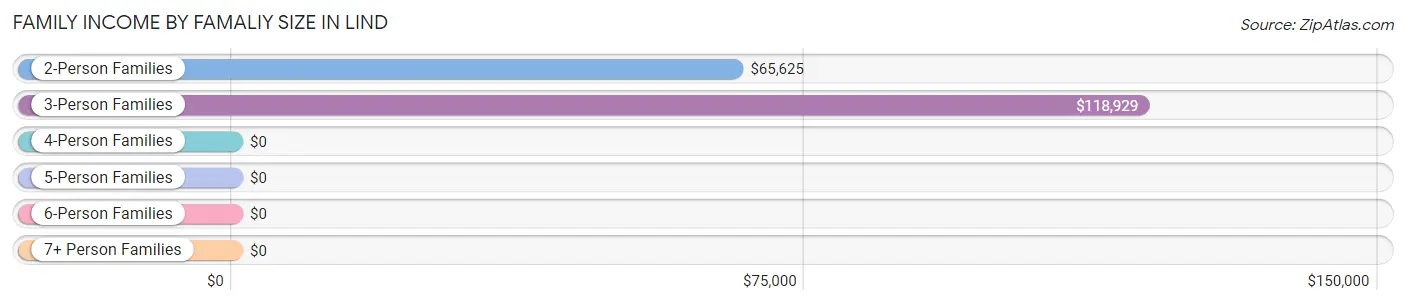
| Income Bracket | # Families | Median Income |
| 2-Person Families | 120 (69.8%) | $65,625 |
| 3-Person Families | 10 (5.8%) | $118,929 |
| 4-Person Families | 14 (8.1%) | $0 |
| 5-Person Families | 4 (2.3%) | $0 |
| 6-Person Families | 17 (9.9%) | $0 |
| 7+ Person Families | 7 (4.1%) | $0 |
| Total | 172 (100.0%) | $61,944 |
Family Income by Number of Earners in Lind
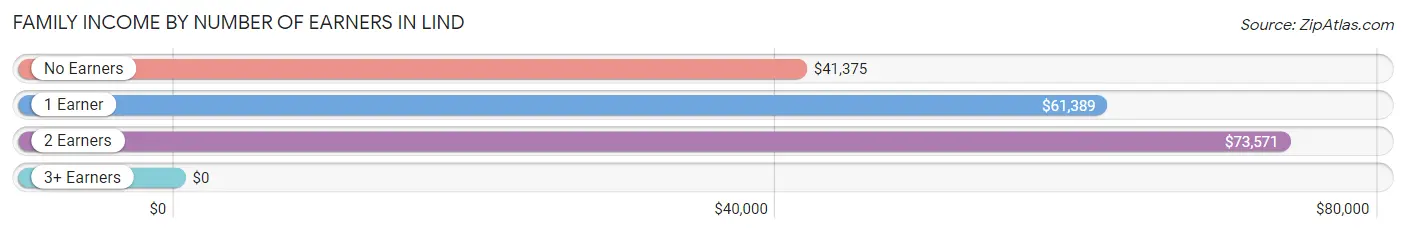
| Number of Earners | # Families | Median Income |
| No Earners | 23 (13.4%) | $41,375 |
| 1 Earner | 68 (39.5%) | $61,389 |
| 2 Earners | 74 (43.0%) | $73,571 |
| 3+ Earners | 7 (4.1%) | $0 |
| Total | 172 (100.0%) | $61,944 |
Household Income in Lind
Household Income Brackets in Lind
With 62 households falling in the category, the $50,000 to $74,999 income range is the most frequent in Lind, accounting for 26.4% of all households.
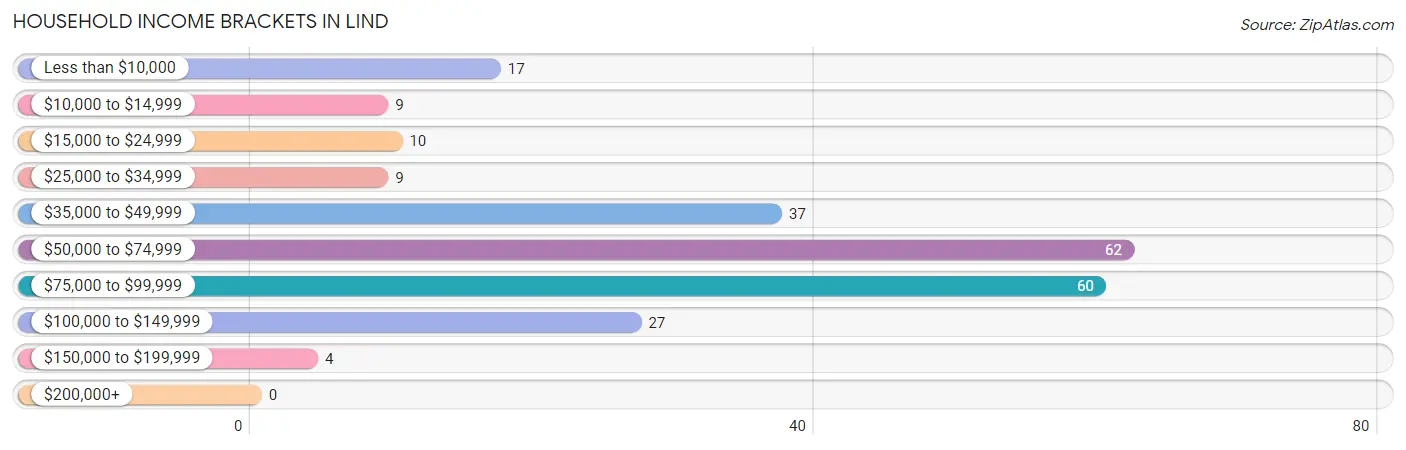
| Income Bracket | # Households | % Households |
| Less than $10,000 | 17 | 7.2% |
| $10,000 to $14,999 | 9 | 3.8% |
| $15,000 to $24,999 | 10 | 4.3% |
| $25,000 to $34,999 | 9 | 3.8% |
| $35,000 to $49,999 | 37 | 15.7% |
| $50,000 to $74,999 | 62 | 26.4% |
| $75,000 to $99,999 | 60 | 25.5% |
| $100,000 to $149,999 | 27 | 11.5% |
| $150,000 to $199,999 | 4 | 1.7% |
| $200,000+ | 0 | 0.0% |
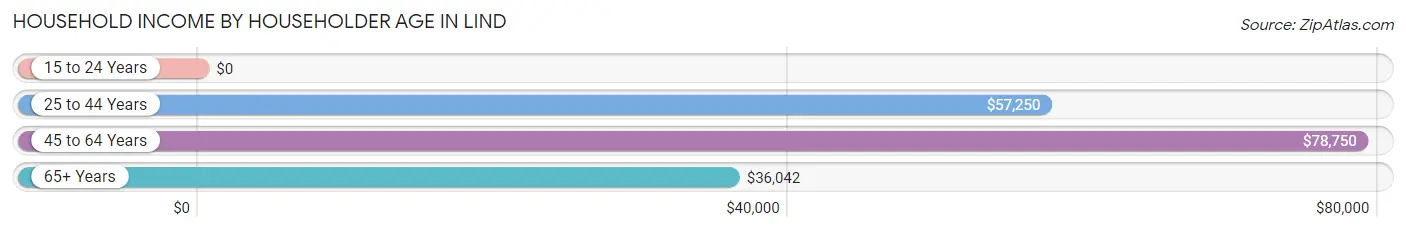
Household Income by Householder Age in Lind
The median household income in Lind is $65,313, with the highest median household income of $78,750 found in the 45 to 64 years age bracket for the primary householder. A total of 104 households (44.3%) fall into this category. Meanwhile, the 15 to 24 years age bracket for the primary householder has the lowest median household income of $0, with 9 households (3.8%) in this group.
| Income Bracket | # Households | Median Income |
| 15 to 24 Years | 9 (3.8%) | $0 |
| 25 to 44 Years | 53 (22.6%) | $57,250 |
| 45 to 64 Years | 104 (44.3%) | $78,750 |
| 65+ Years | 69 (29.4%) | $36,042 |
| Total | 235 (100.0%) | $65,313 |
Poverty in Lind
Income Below Poverty by Sex and Age in Lind
With 19.3% poverty level for males and 19.0% for females among the residents of Lind, 25 to 34 year old males and 18 to 24 year old females are the most vulnerable to poverty, with 29 males (74.4%) and 16 females (51.6%) in their respective age groups living below the poverty level.
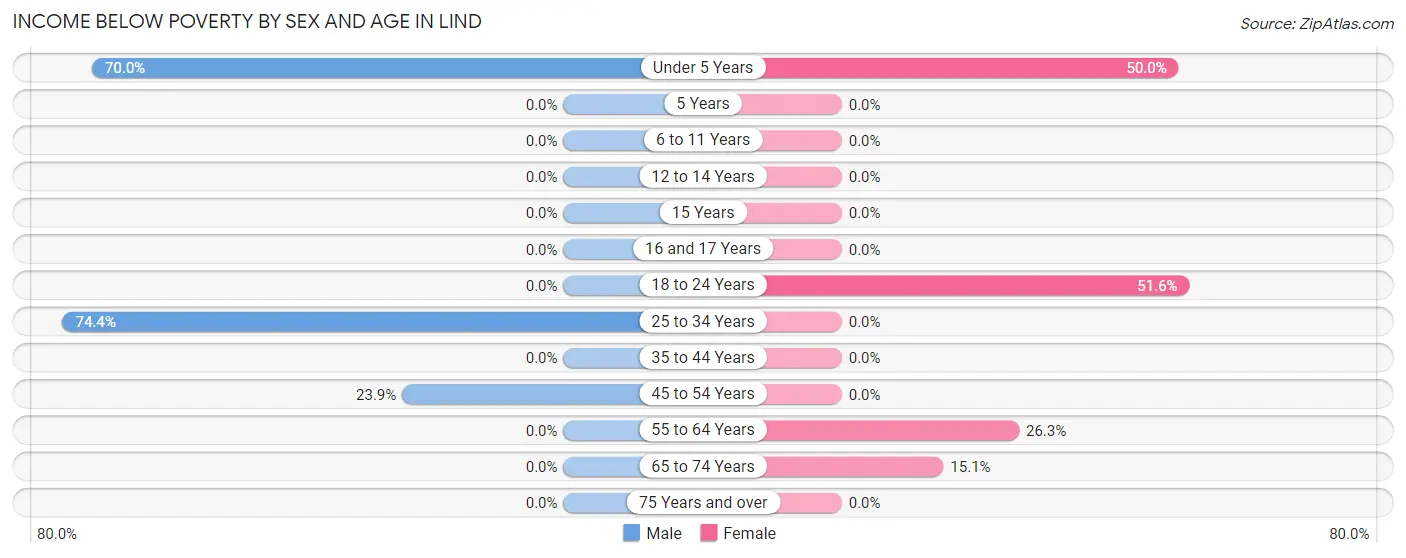
| Age Bracket | Male | Female |
| Under 5 Years | 14 (70.0%) | 10 (50.0%) |
| 5 Years | 0 (0.0%) | 0 (0.0%) |
| 6 to 11 Years | 0 (0.0%) | 0 (0.0%) |
| 12 to 14 Years | 0 (0.0%) | 0 (0.0%) |
| 15 Years | 0 (0.0%) | 0 (0.0%) |
| 16 and 17 Years | 0 (0.0%) | 0 (0.0%) |
| 18 to 24 Years | 0 (0.0%) | 16 (51.6%) |
| 25 to 34 Years | 29 (74.4%) | 0 (0.0%) |
| 35 to 44 Years | 0 (0.0%) | 0 (0.0%) |
| 45 to 54 Years | 17 (23.9%) | 0 (0.0%) |
| 55 to 64 Years | 0 (0.0%) | 15 (26.3%) |
| 65 to 74 Years | 0 (0.0%) | 8 (15.1%) |
| 75 Years and over | 0 (0.0%) | 0 (0.0%) |
| Total | 60 (19.3%) | 49 (19.0%) |
Income Above Poverty by Sex and Age in Lind
According to the poverty statistics in Lind, males aged 6 to 11 years and females aged 6 to 11 years are the age groups that are most secure financially, with 100.0% of males and 100.0% of females in these age groups living above the poverty line.
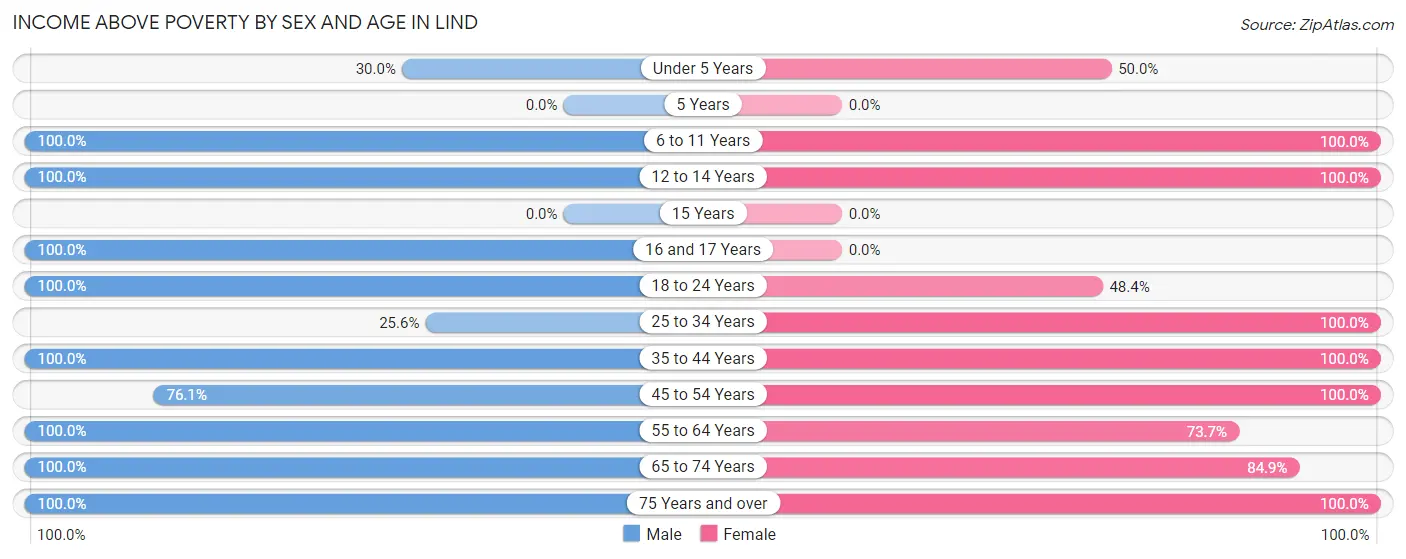
| Age Bracket | Male | Female |
| Under 5 Years | 6 (30.0%) | 10 (50.0%) |
| 5 Years | 0 (0.0%) | 0 (0.0%) |
| 6 to 11 Years | 17 (100.0%) | 16 (100.0%) |
| 12 to 14 Years | 9 (100.0%) | 3 (100.0%) |
| 15 Years | 0 (0.0%) | 0 (0.0%) |
| 16 and 17 Years | 9 (100.0%) | 0 (0.0%) |
| 18 to 24 Years | 41 (100.0%) | 15 (48.4%) |
| 25 to 34 Years | 10 (25.6%) | 35 (100.0%) |
| 35 to 44 Years | 12 (100.0%) | 19 (100.0%) |
| 45 to 54 Years | 54 (76.1%) | 14 (100.0%) |
| 55 to 64 Years | 57 (100.0%) | 42 (73.7%) |
| 65 to 74 Years | 33 (100.0%) | 45 (84.9%) |
| 75 Years and over | 3 (100.0%) | 10 (100.0%) |
| Total | 251 (80.7%) | 209 (81.0%) |
Income Below Poverty Among Married-Couple Families in Lind
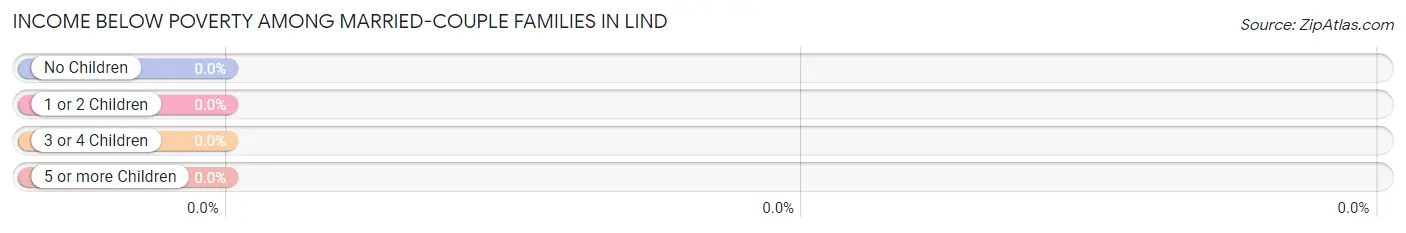
| Children | Above Poverty | Below Poverty |
| No Children | 77 (100.0%) | 0 (0.0%) |
| 1 or 2 Children | 16 (100.0%) | 0 (0.0%) |
| 3 or 4 Children | 11 (100.0%) | 0 (0.0%) |
| 5 or more Children | 0 (0.0%) | 0 (0.0%) |
| Total | 104 (100.0%) | 0 (0.0%) |
Income Below Poverty Among Single-Parent Households in Lind
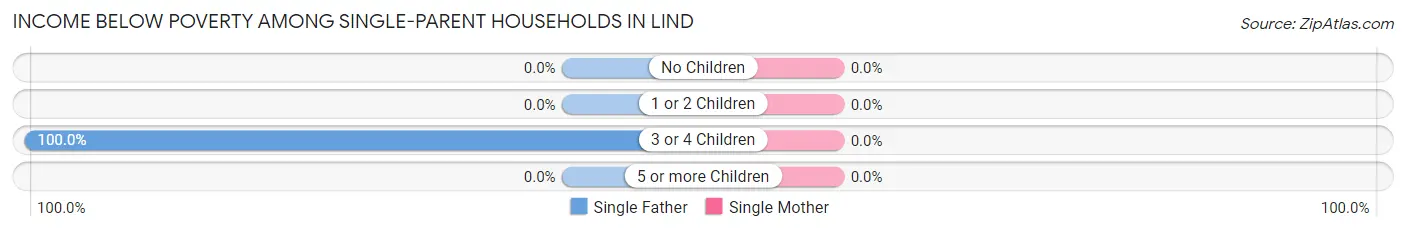
| Children | Single Father | Single Mother |
| No Children | 0 (0.0%) | 0 (0.0%) |
| 1 or 2 Children | 0 (0.0%) | 0 (0.0%) |
| 3 or 4 Children | 17 (100.0%) | 0 (0.0%) |
| 5 or more Children | 0 (0.0%) | 0 (0.0%) |
| Total | 17 (27.9%) | 0 (0.0%) |
Income Below Poverty Among Married-Couple vs Single-Parent Households in Lind
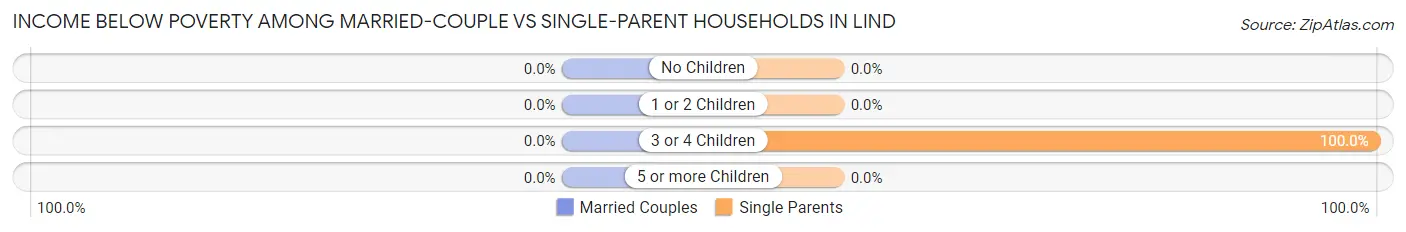
| Children | Married-Couple Families | Single-Parent Households |
| No Children | 0 (0.0%) | 0 (0.0%) |
| 1 or 2 Children | 0 (0.0%) | 0 (0.0%) |
| 3 or 4 Children | 0 (0.0%) | 17 (100.0%) |
| 5 or more Children | 0 (0.0%) | 0 (0.0%) |
| Total | 0 (0.0%) | 17 (25.0%) |
Race in Lind
The most populous races in Lind are White / Caucasian (409 | 71.9%), Two or more Races (105 | 18.4%), and Some other Race (55 | 9.7%).
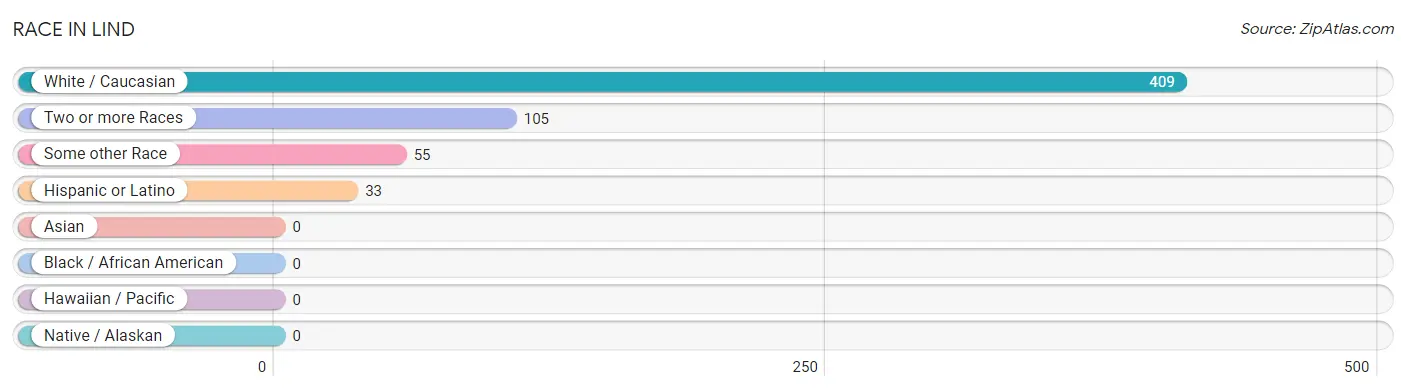
| Race | # Population | % Population |
| Asian | 0 | 0.0% |
| Black / African American | 0 | 0.0% |
| Hawaiian / Pacific | 0 | 0.0% |
| Hispanic or Latino | 33 | 5.8% |
| Native / Alaskan | 0 | 0.0% |
| White / Caucasian | 409 | 71.9% |
| Two or more Races | 105 | 18.4% |
| Some other Race | 55 | 9.7% |
| Total | 569 | 100.0% |
Ancestry in Lind
The most populous ancestries reported in Lind are German (101 | 17.7%), English (45 | 7.9%), Irish (45 | 7.9%), Dutch (35 | 6.1%), and Mexican (28 | 4.9%), together accounting for 44.6% of all Lind residents.
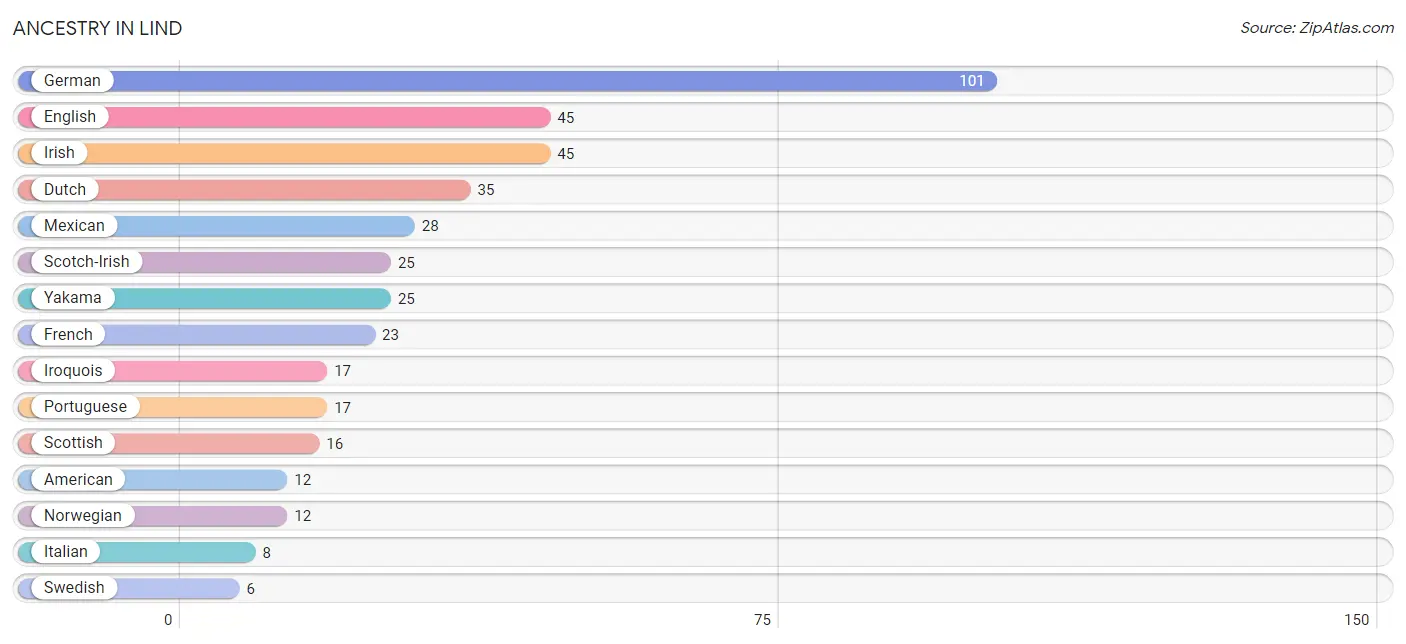
| Ancestry | # Population | % Population |
| American | 12 | 2.1% |
| Dutch | 35 | 6.1% |
| English | 45 | 7.9% |
| French | 23 | 4.0% |
| German | 101 | 17.7% |
| Irish | 45 | 7.9% |
| Iroquois | 17 | 3.0% |
| Italian | 8 | 1.4% |
| Mexican | 28 | 4.9% |
| Norwegian | 12 | 2.1% |
| Portuguese | 17 | 3.0% |
| Scotch-Irish | 25 | 4.4% |
| Scottish | 16 | 2.8% |
| Swedish | 6 | 1.1% |
| Yakama | 25 | 4.4% | View All 15 Rows |
Immigrants in Lind
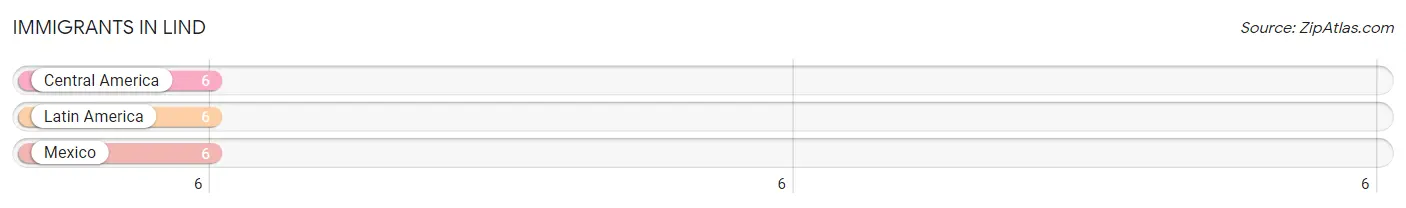
The most numerous immigrant groups reported in Lind came from Central America (6 | 1.1%), Latin America (6 | 1.1%), and Mexico (6 | 1.1%), together accounting for 3.2% of all Lind residents.
| Immigration Origin | # Population | % Population |
| Central America | 6 | 1.1% |
| Latin America | 6 | 1.1% |
| Mexico | 6 | 1.1% | View All 3 Rows |
Sex and Age in Lind
Sex and Age in Lind
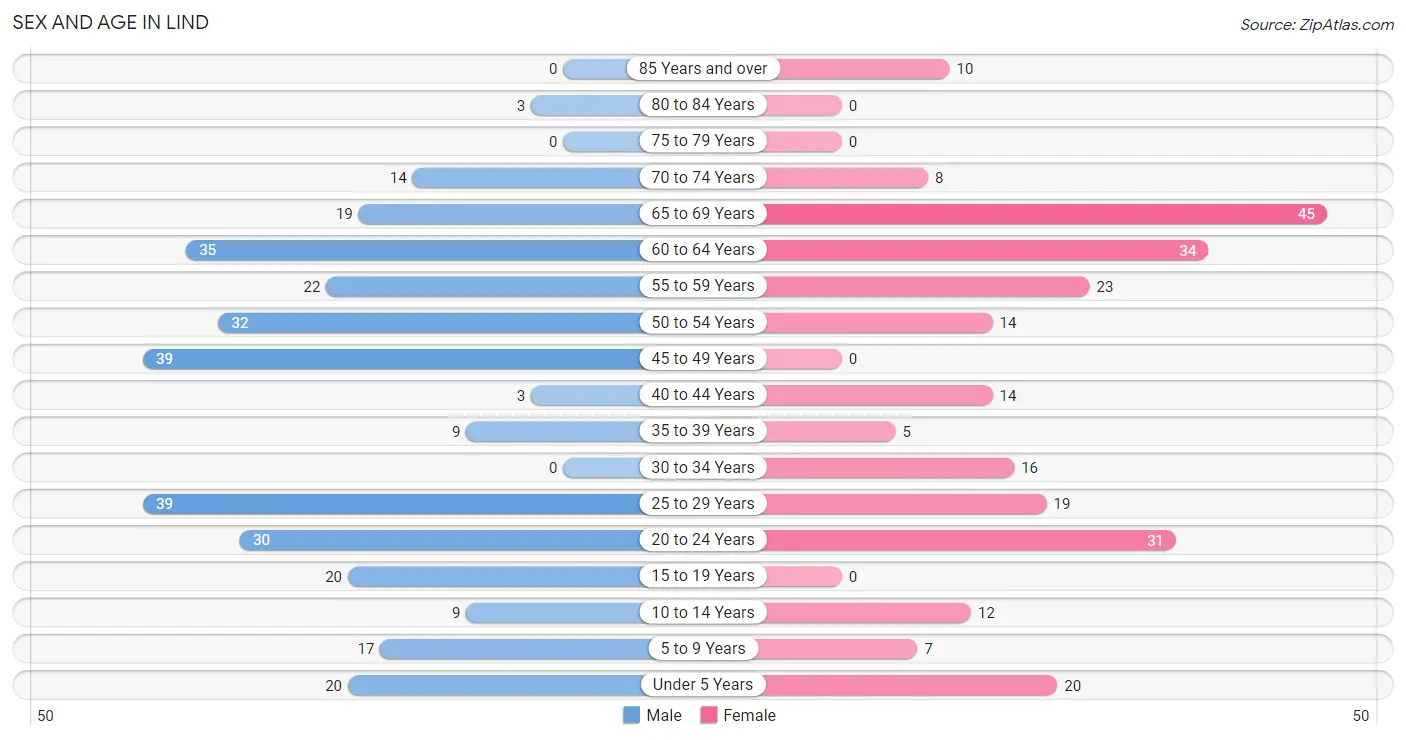
The most populous age groups in Lind are 25 to 29 Years (39 | 12.5%) for men and 65 to 69 Years (45 | 17.4%) for women.
| Age Bracket | Male | Female |
| Under 5 Years | 20 (6.4%) | 20 (7.7%) |
| 5 to 9 Years | 17 (5.5%) | 7 (2.7%) |
| 10 to 14 Years | 9 (2.9%) | 12 (4.6%) |
| 15 to 19 Years | 20 (6.4%) | 0 (0.0%) |
| 20 to 24 Years | 30 (9.7%) | 31 (12.0%) |
| 25 to 29 Years | 39 (12.5%) | 19 (7.4%) |
| 30 to 34 Years | 0 (0.0%) | 16 (6.2%) |
| 35 to 39 Years | 9 (2.9%) | 5 (1.9%) |
| 40 to 44 Years | 3 (1.0%) | 14 (5.4%) |
| 45 to 49 Years | 39 (12.5%) | 0 (0.0%) |
| 50 to 54 Years | 32 (10.3%) | 14 (5.4%) |
| 55 to 59 Years | 22 (7.1%) | 23 (8.9%) |
| 60 to 64 Years | 35 (11.3%) | 34 (13.2%) |
| 65 to 69 Years | 19 (6.1%) | 45 (17.4%) |
| 70 to 74 Years | 14 (4.5%) | 8 (3.1%) |
| 75 to 79 Years | 0 (0.0%) | 0 (0.0%) |
| 80 to 84 Years | 3 (1.0%) | 0 (0.0%) |
| 85 Years and over | 0 (0.0%) | 10 (3.9%) |
| Total | 311 (100.0%) | 258 (100.0%) |
Families and Households in Lind
Median Family Size in Lind
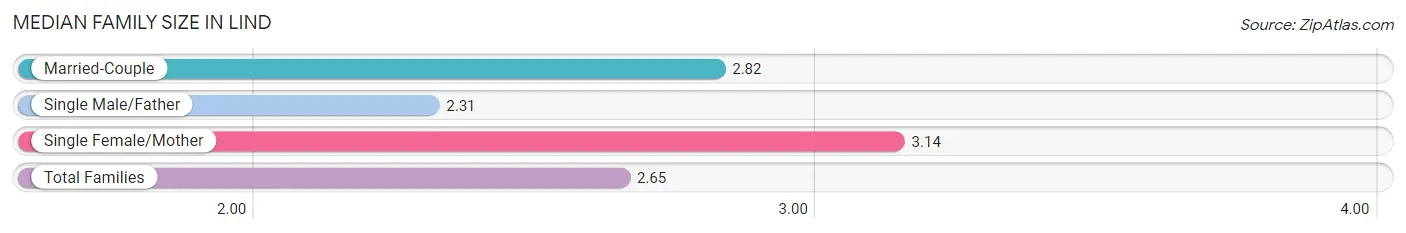
The median family size in Lind is 2.65 persons per family, with single female/mother families (7 | 4.1%) accounting for the largest median family size of 3.14 persons per family. On the other hand, single male/father families (61 | 35.5%) represent the smallest median family size with 2.31 persons per family.
| Family Type | # Families | Family Size |
| Married-Couple | 104 (60.5%) | 2.82 |
| Single Male/Father | 61 (35.5%) | 2.31 |
| Single Female/Mother | 7 (4.1%) | 3.14 |
| Total Families | 172 (100.0%) | 2.65 |
Median Household Size in Lind
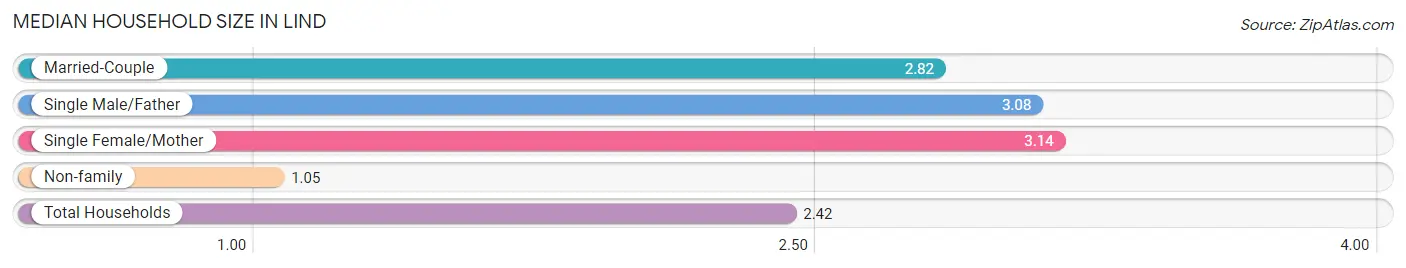
The median household size in Lind is 2.42 persons per household, with single female/mother households (7 | 3.0%) accounting for the largest median household size of 3.14 persons per household. non-family households (63 | 26.8%) represent the smallest median household size with 1.05 persons per household.
| Household Type | # Households | Household Size |
| Married-Couple | 104 (44.3%) | 2.82 |
| Single Male/Father | 61 (26.0%) | 3.08 |
| Single Female/Mother | 7 (3.0%) | 3.14 |
| Non-family | 63 (26.8%) | 1.05 |
| Total Households | 235 (100.0%) | 2.42 |
Household Size by Marriage Status in Lind
Out of a total of 235 households in Lind, 172 (73.2%) are family households, while 63 (26.8%) are nonfamily households. The most numerous type of family households are 2-person households, comprising 91, and the most common type of nonfamily households are 1-person households, comprising 60.
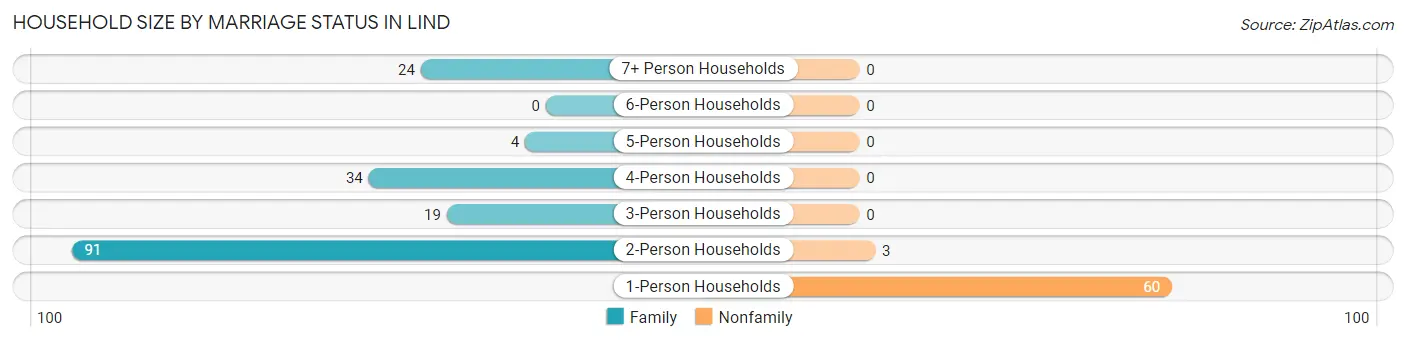
| Household Size | Family Households | Nonfamily Households |
| 1-Person Households | - | 60 (25.5%) |
| 2-Person Households | 91 (38.7%) | 3 (1.3%) |
| 3-Person Households | 19 (8.1%) | 0 (0.0%) |
| 4-Person Households | 34 (14.5%) | 0 (0.0%) |
| 5-Person Households | 4 (1.7%) | 0 (0.0%) |
| 6-Person Households | 0 (0.0%) | 0 (0.0%) |
| 7+ Person Households | 24 (10.2%) | 0 (0.0%) |
| Total | 172 (73.2%) | 63 (26.8%) |
Female Fertility in Lind
Fertility by Age in Lind
Average fertility rate in Lind is 188.0 births per 1,000 women. Women in the age bracket of 20 to 34 years have the highest fertility rate with 242.0 births per 1,000 women. Women in the age bracket of 20 to 34 years acount for 100.0% of all women with births.
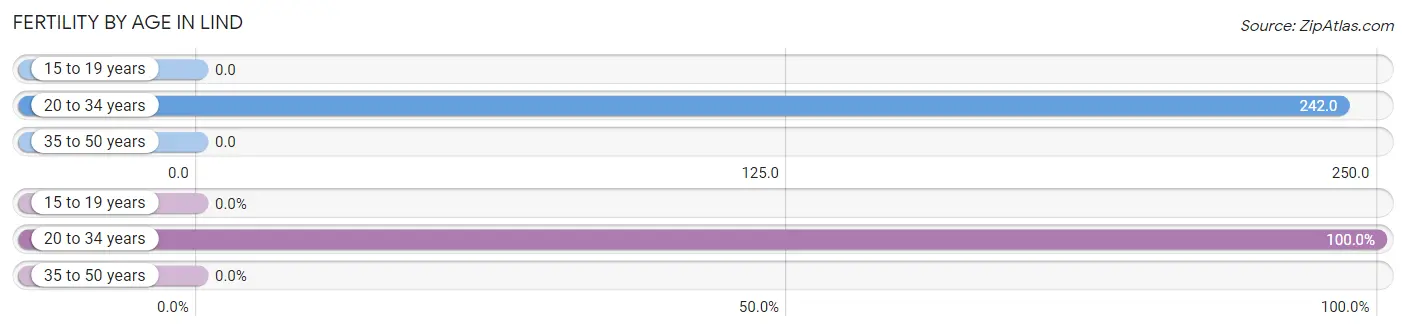
| Age Bracket | Women with Births | Births / 1,000 Women |
| 15 to 19 years | 0 (0.0%) | 0.0 |
| 20 to 34 years | 16 (100.0%) | 242.0 |
| 35 to 50 years | 0 (0.0%) | 0.0 |
| Total | 16 (100.0%) | 188.0 |
Fertility by Age by Marriage Status in Lind
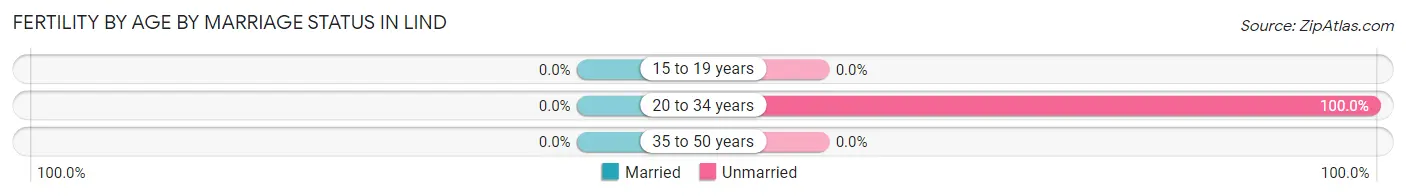
| Age Bracket | Married | Unmarried |
| 15 to 19 years | 0 (0.0%) | 0 (0.0%) |
| 20 to 34 years | 0 (0.0%) | 16 (100.0%) |
| 35 to 50 years | 0 (0.0%) | 0 (0.0%) |
| Total | 0 (0.0%) | 16 (100.0%) |
Fertility by Education in Lind
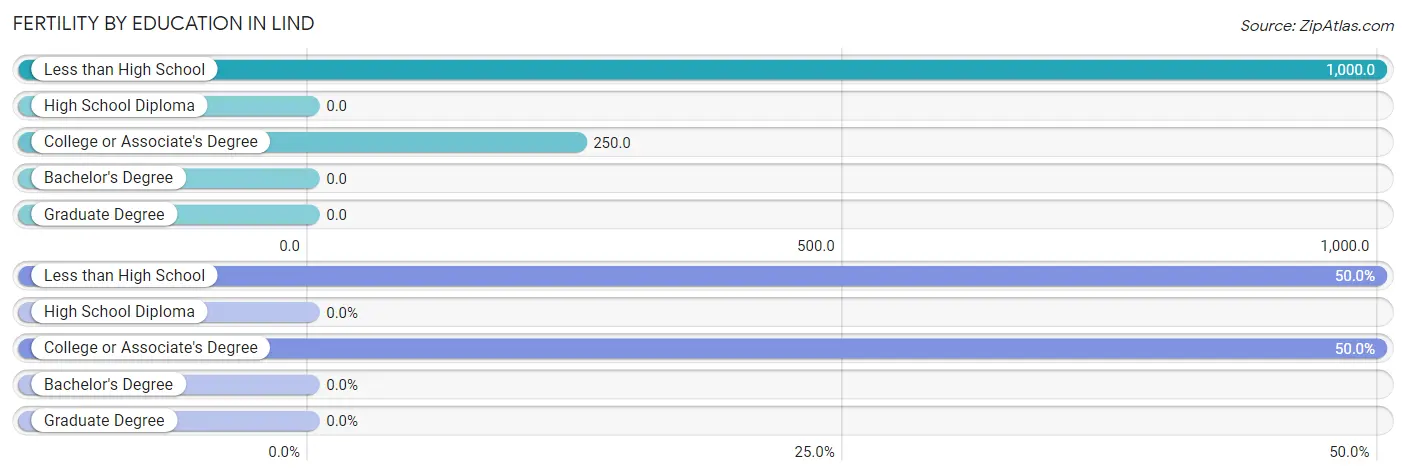
| Educational Attainment | Women with Births | Births / 1,000 Women |
| Less than High School | 8 (50.0%) | 1,000.0 |
| High School Diploma | 0 (0.0%) | 0.0 |
| College or Associate's Degree | 8 (50.0%) | 250.0 |
| Bachelor's Degree | 0 (0.0%) | 0.0 |
| Graduate Degree | 0 (0.0%) | 0.0 |
| Total | 16 (100.0%) | 188.0 |
Fertility by Education by Marriage Status in Lind
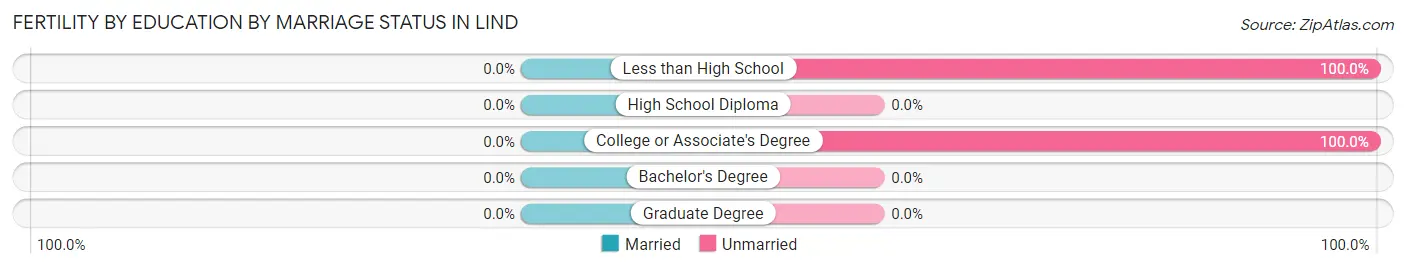
| Educational Attainment | Married | Unmarried |
| Less than High School | 0 (0.0%) | 8 (100.0%) |
| High School Diploma | 0 (0.0%) | 0 (0.0%) |
| College or Associate's Degree | 0 (0.0%) | 8 (100.0%) |
| Bachelor's Degree | 0 (0.0%) | 0 (0.0%) |
| Graduate Degree | 0 (0.0%) | 0 (0.0%) |
| Total | 0 (0.0%) | 16 (100.0%) |
Employment Characteristics in Lind
Employment by Class of Employer in Lind
Among the 268 employed individuals in Lind, private company employees (174 | 64.9%), state government employees (50 | 18.7%), and local government employees (39 | 14.5%) make up the most common classes of employment.
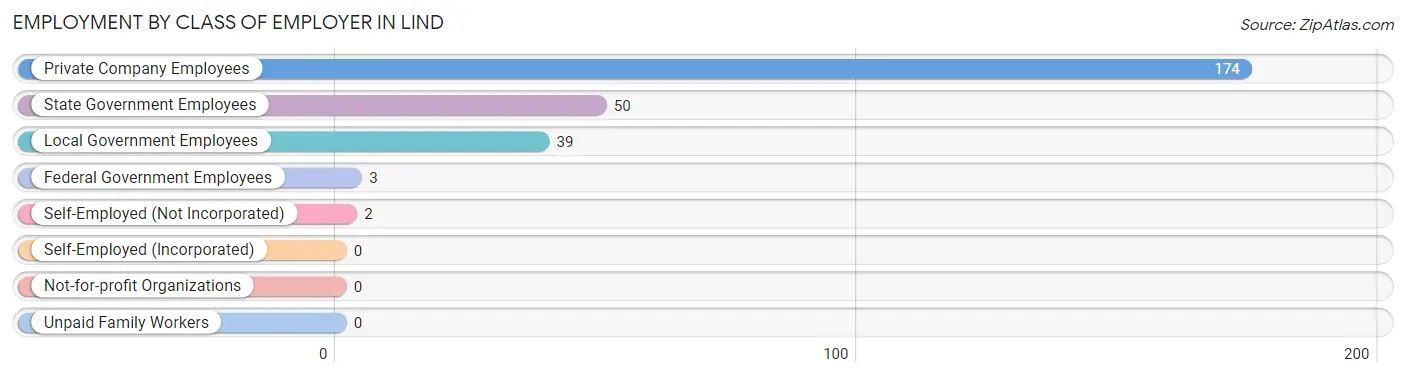
| Employer Class | # Employees | % Employees |
| Private Company Employees | 174 | 64.9% |
| Self-Employed (Incorporated) | 0 | 0.0% |
| Self-Employed (Not Incorporated) | 2 | 0.7% |
| Not-for-profit Organizations | 0 | 0.0% |
| Local Government Employees | 39 | 14.5% |
| State Government Employees | 50 | 18.7% |
| Federal Government Employees | 3 | 1.1% |
| Unpaid Family Workers | 0 | 0.0% |
| Total | 268 | 100.0% |
Employment Status by Age in Lind
According to the labor force statistics for Lind, out of the total population over 16 years of age (484), 59.9% or 290 individuals are in the labor force, with 7.6% or 22 of them unemployed. The age group with the highest labor force participation rate is 16 to 19 years, with 100.0% or 20 individuals in the labor force. Within the labor force, the 25 to 29 years age range has the highest percentage of unemployed individuals, with 37.0% or 17 of them being unemployed.
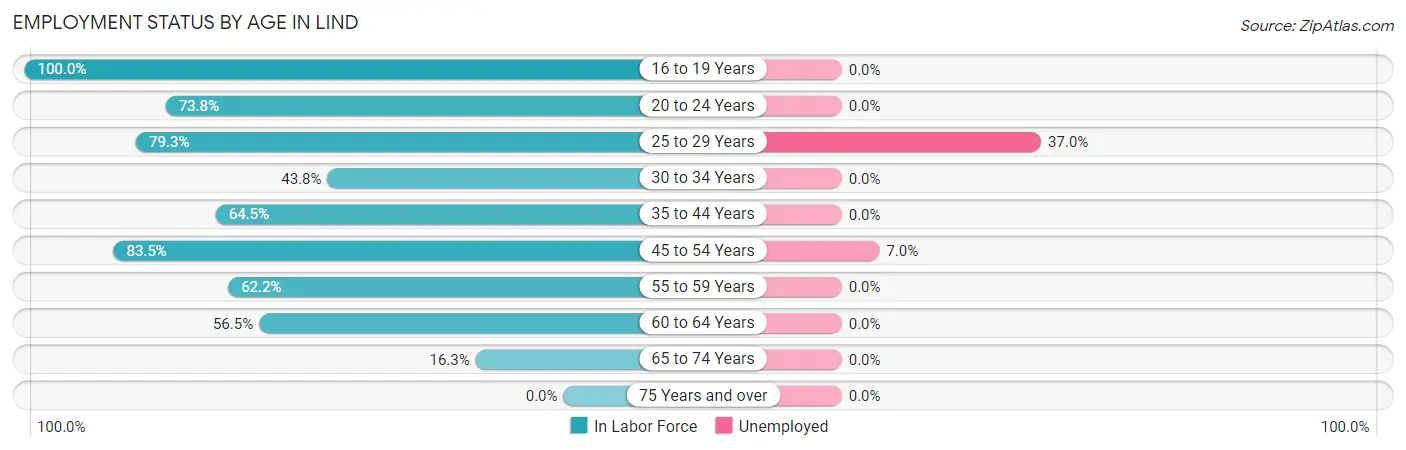
| Age Bracket | In Labor Force | Unemployed |
| 16 to 19 Years | 20 (100.0%) | 0 (0.0%) |
| 20 to 24 Years | 45 (73.8%) | 0 (0.0%) |
| 25 to 29 Years | 46 (79.3%) | 17 (37.0%) |
| 30 to 34 Years | 7 (43.8%) | 0 (0.0%) |
| 35 to 44 Years | 20 (64.5%) | 0 (0.0%) |
| 45 to 54 Years | 71 (83.5%) | 5 (7.0%) |
| 55 to 59 Years | 28 (62.2%) | 0 (0.0%) |
| 60 to 64 Years | 39 (56.5%) | 0 (0.0%) |
| 65 to 74 Years | 14 (16.3%) | 0 (0.0%) |
| 75 Years and over | 0 (0.0%) | 0 (0.0%) |
| Total | 290 (59.9%) | 22 (7.6%) |
Employment Status by Educational Attainment in Lind
According to labor force statistics for Lind, 69.4% of individuals (211) out of the total population between 25 and 64 years of age (304) are in the labor force, with 10.4% or 22 of them being unemployed. The group with the highest labor force participation rate are those with the educational attainment of less than high school, with 100.0% or 33 individuals in the labor force. Within the labor force, individuals with less than high school education have the highest percentage of unemployment, with 51.5% or 17 of them being unemployed.
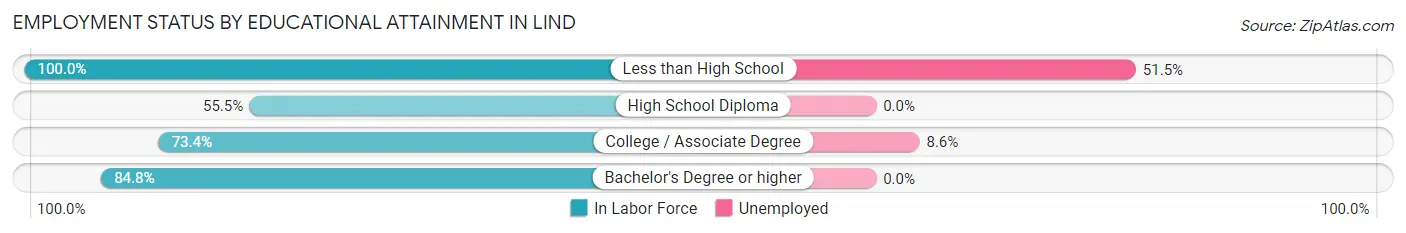
| Educational Attainment | In Labor Force | Unemployed |
| Less than High School | 33 (100.0%) | 17 (51.5%) |
| High School Diploma | 81 (55.5%) | 0 (0.0%) |
| College / Associate Degree | 58 (73.4%) | 7 (8.6%) |
| Bachelor's Degree or higher | 39 (84.8%) | 0 (0.0%) |
| Total | 211 (69.4%) | 32 (10.4%) |
Employment Occupations by Sex in Lind
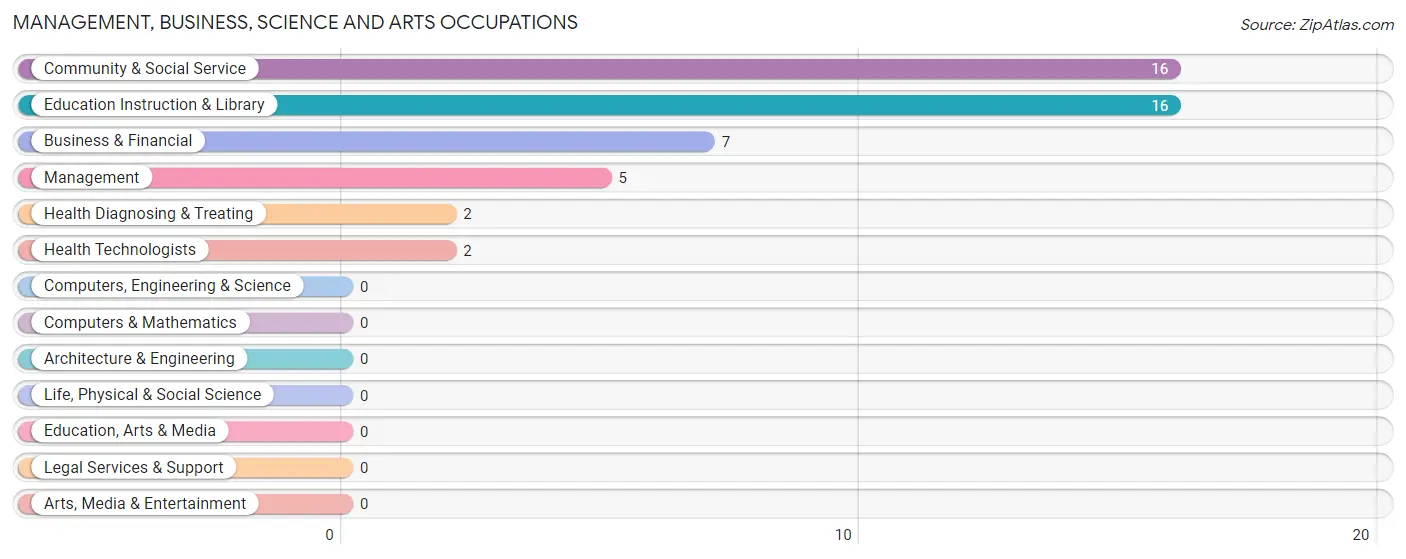
Management, Business, Science and Arts Occupations
The most common Management, Business, Science and Arts occupations in Lind are Community & Social Service (16 | 6.0%), Education Instruction & Library (16 | 6.0%), Business & Financial (7 | 2.6%), Management (5 | 1.9%), and Health Diagnosing & Treating (2 | 0.7%).
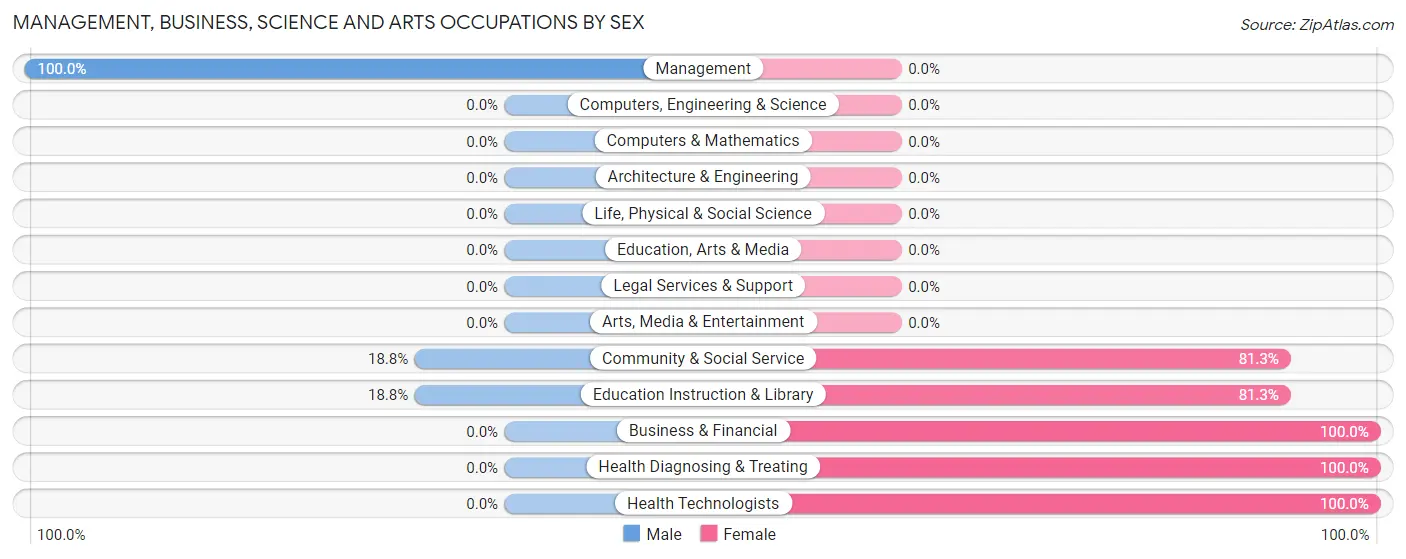
Management, Business, Science and Arts Occupations by Sex
Within the Management, Business, Science and Arts occupations in Lind, the most male-oriented occupations are Management (100.0%), Community & Social Service (18.8%), and Education Instruction & Library (18.8%), while the most female-oriented occupations are Business & Financial (100.0%), Health Diagnosing & Treating (100.0%), and Health Technologists (100.0%).
| Occupation | Male | Female |
| Management | 5 (100.0%) | 0 (0.0%) |
| Business & Financial | 0 (0.0%) | 7 (100.0%) |
| Computers, Engineering & Science | 0 (0.0%) | 0 (0.0%) |
| Computers & Mathematics | 0 (0.0%) | 0 (0.0%) |
| Architecture & Engineering | 0 (0.0%) | 0 (0.0%) |
| Life, Physical & Social Science | 0 (0.0%) | 0 (0.0%) |
| Community & Social Service | 3 (18.8%) | 13 (81.2%) |
| Education, Arts & Media | 0 (0.0%) | 0 (0.0%) |
| Legal Services & Support | 0 (0.0%) | 0 (0.0%) |
| Education Instruction & Library | 3 (18.8%) | 13 (81.2%) |
| Arts, Media & Entertainment | 0 (0.0%) | 0 (0.0%) |
| Health Diagnosing & Treating | 0 (0.0%) | 2 (100.0%) |
| Health Technologists | 0 (0.0%) | 2 (100.0%) |
| Total (Category) | 8 (26.7%) | 22 (73.3%) |
| Total (Overall) | 181 (67.5%) | 87 (32.5%) |
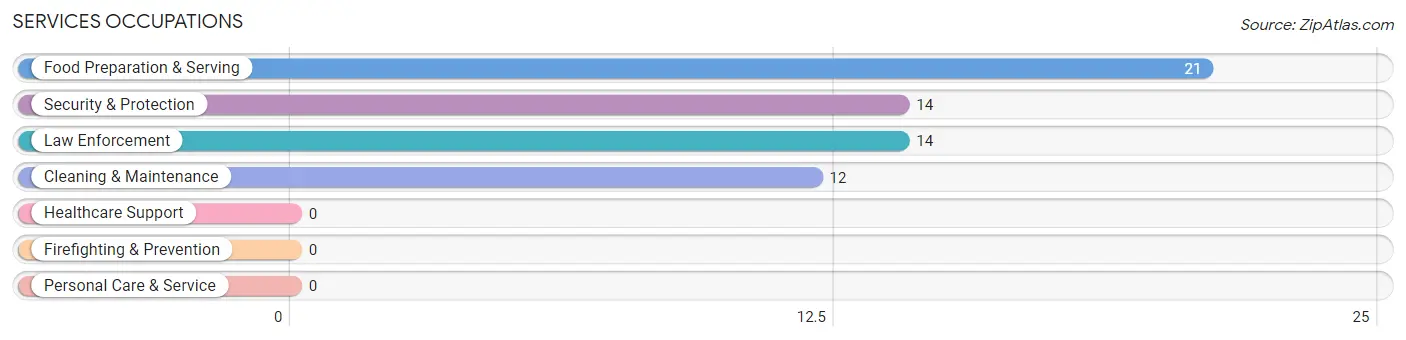
Services Occupations
The most common Services occupations in Lind are Food Preparation & Serving (21 | 7.8%), Security & Protection (14 | 5.2%), Law Enforcement (14 | 5.2%), and Cleaning & Maintenance (12 | 4.5%).
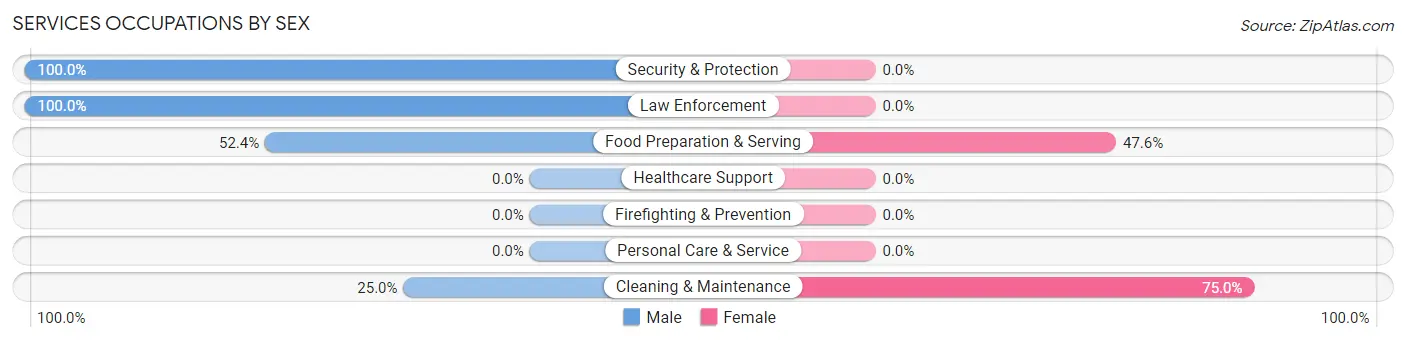
Services Occupations by Sex
Within the Services occupations in Lind, the most male-oriented occupations are Security & Protection (100.0%), Law Enforcement (100.0%), and Food Preparation & Serving (52.4%), while the most female-oriented occupations are Cleaning & Maintenance (75.0%), and Food Preparation & Serving (47.6%).
| Occupation | Male | Female |
| Healthcare Support | 0 (0.0%) | 0 (0.0%) |
| Security & Protection | 14 (100.0%) | 0 (0.0%) |
| Firefighting & Prevention | 0 (0.0%) | 0 (0.0%) |
| Law Enforcement | 14 (100.0%) | 0 (0.0%) |
| Food Preparation & Serving | 11 (52.4%) | 10 (47.6%) |
| Cleaning & Maintenance | 3 (25.0%) | 9 (75.0%) |
| Personal Care & Service | 0 (0.0%) | 0 (0.0%) |
| Total (Category) | 28 (59.6%) | 19 (40.4%) |
| Total (Overall) | 181 (67.5%) | 87 (32.5%) |
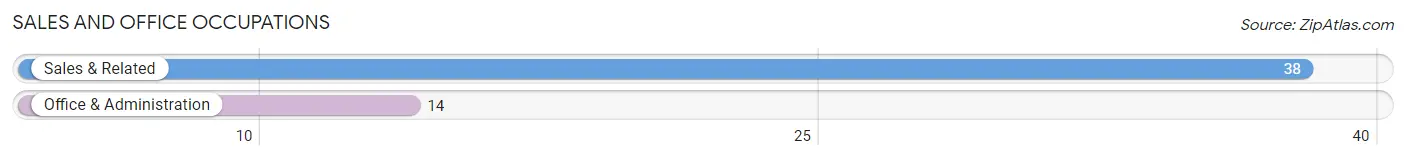
Sales and Office Occupations
The most common Sales and Office occupations in Lind are Sales & Related (38 | 14.2%), and Office & Administration (14 | 5.2%).
Sales and Office Occupations by Sex
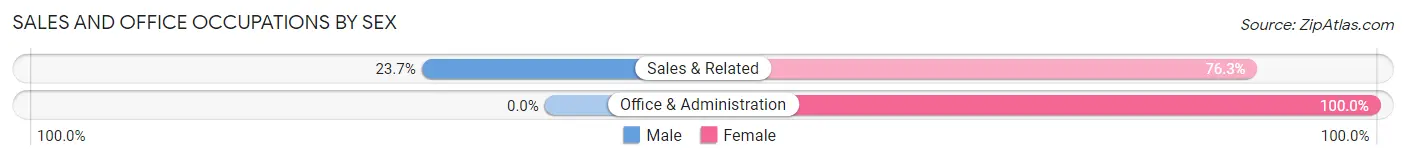
| Occupation | Male | Female |
| Sales & Related | 9 (23.7%) | 29 (76.3%) |
| Office & Administration | 0 (0.0%) | 14 (100.0%) |
| Total (Category) | 9 (17.3%) | 43 (82.7%) |
| Total (Overall) | 181 (67.5%) | 87 (32.5%) |
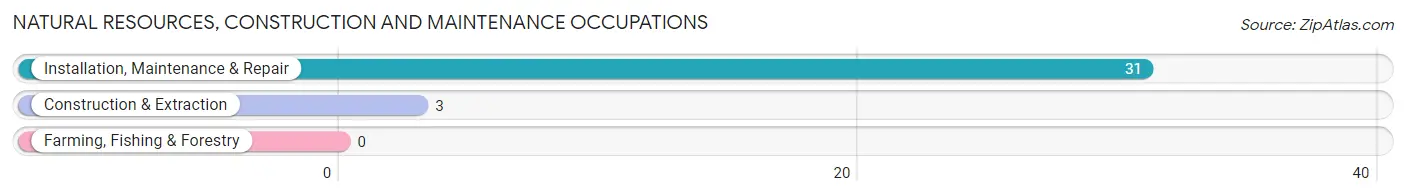
Natural Resources, Construction and Maintenance Occupations
The most common Natural Resources, Construction and Maintenance occupations in Lind are Installation, Maintenance & Repair (31 | 11.6%), and Construction & Extraction (3 | 1.1%).
Natural Resources, Construction and Maintenance Occupations by Sex
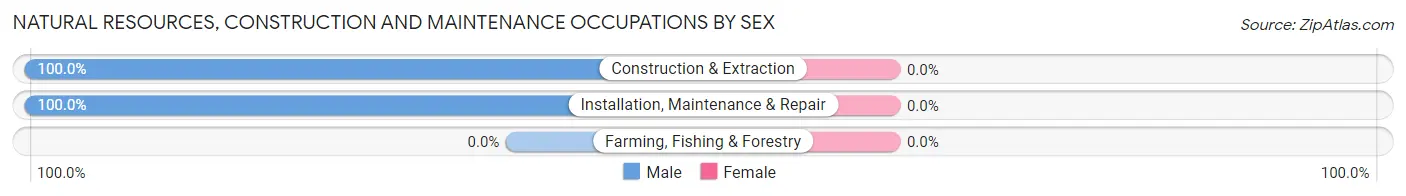
| Occupation | Male | Female |
| Farming, Fishing & Forestry | 0 (0.0%) | 0 (0.0%) |
| Construction & Extraction | 3 (100.0%) | 0 (0.0%) |
| Installation, Maintenance & Repair | 31 (100.0%) | 0 (0.0%) |
| Total (Category) | 34 (100.0%) | 0 (0.0%) |
| Total (Overall) | 181 (67.5%) | 87 (32.5%) |
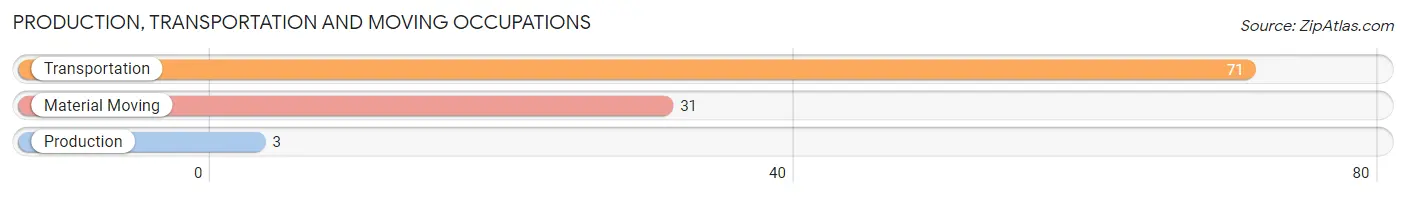
Production, Transportation and Moving Occupations
The most common Production, Transportation and Moving occupations in Lind are Transportation (71 | 26.5%), Material Moving (31 | 11.6%), and Production (3 | 1.1%).
Production, Transportation and Moving Occupations by Sex
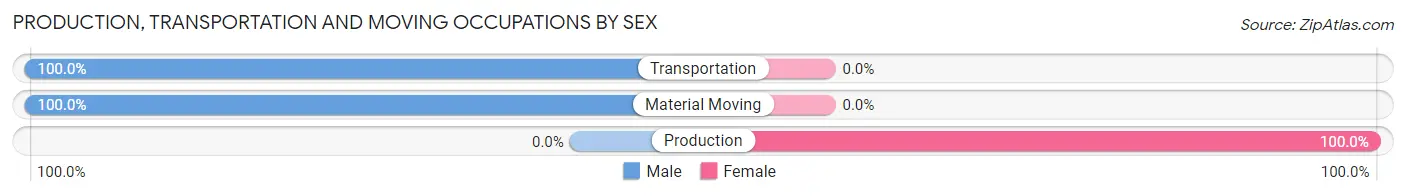
| Occupation | Male | Female |
| Production | 0 (0.0%) | 3 (100.0%) |
| Transportation | 71 (100.0%) | 0 (0.0%) |
| Material Moving | 31 (100.0%) | 0 (0.0%) |
| Total (Category) | 102 (97.1%) | 3 (2.9%) |
| Total (Overall) | 181 (67.5%) | 87 (32.5%) |
Employment Industries by Sex in Lind
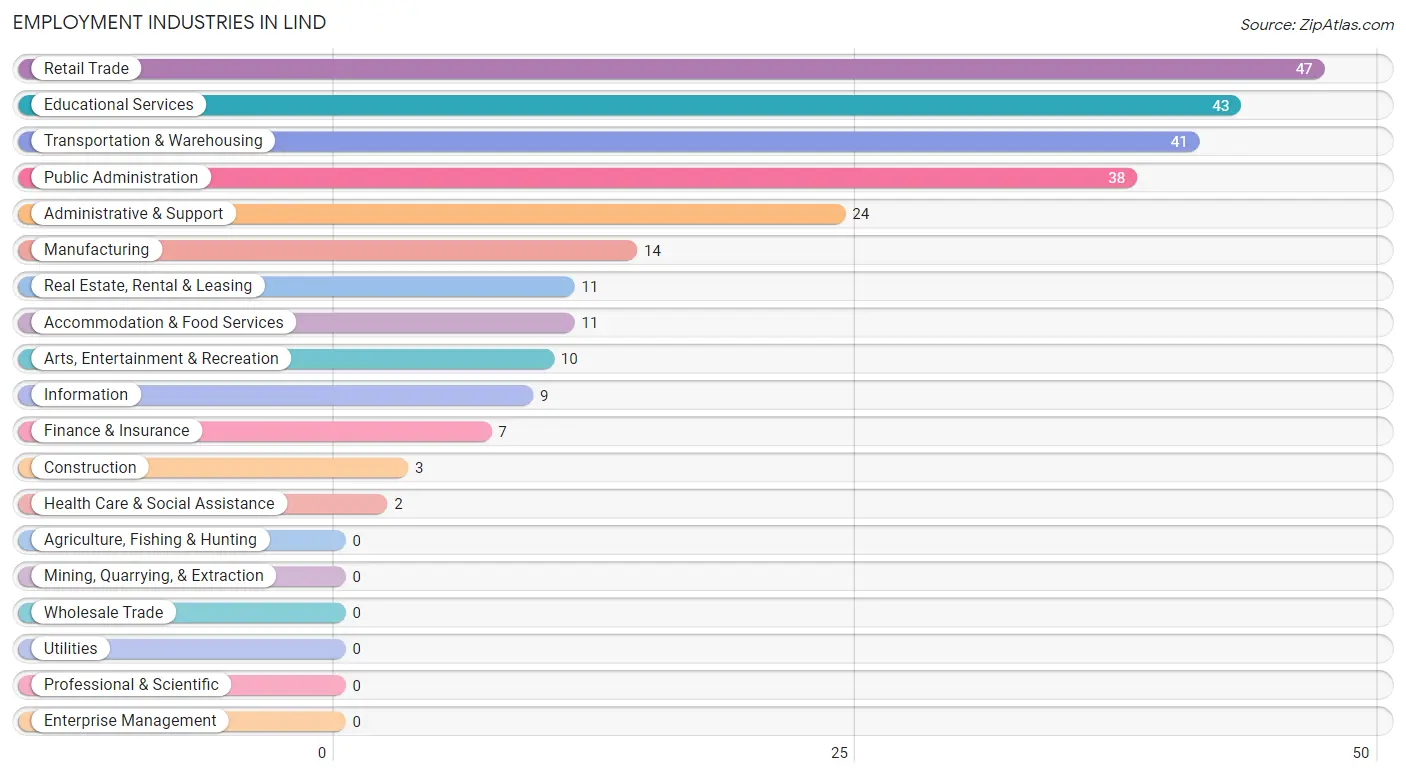
Employment Industries in Lind
The major employment industries in Lind include Retail Trade (47 | 17.5%), Educational Services (43 | 16.0%), Transportation & Warehousing (41 | 15.3%), Public Administration (38 | 14.2%), and Administrative & Support (24 | 9.0%).
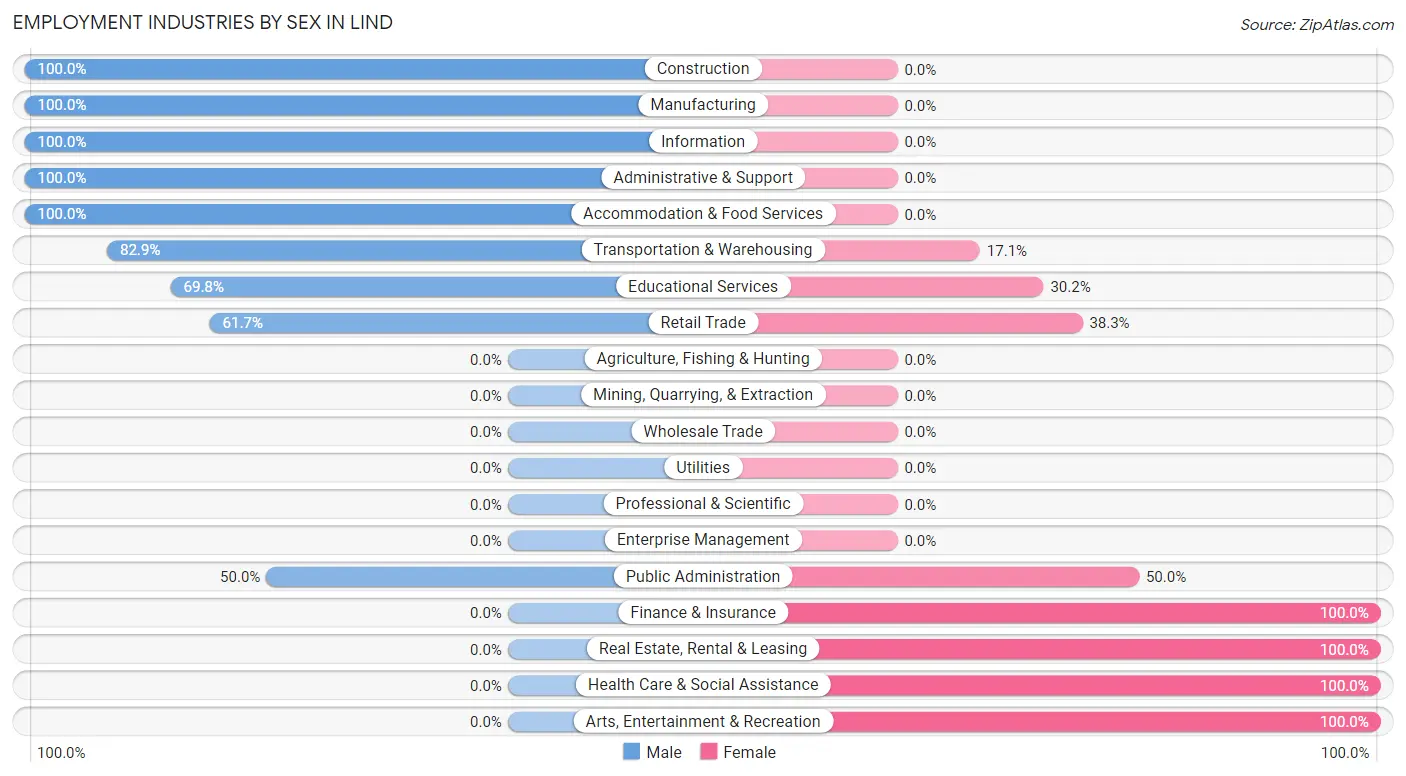
Employment Industries by Sex in Lind
The Lind industries that see more men than women are Construction (100.0%), Manufacturing (100.0%), and Information (100.0%), whereas the industries that tend to have a higher number of women are Finance & Insurance (100.0%), Real Estate, Rental & Leasing (100.0%), and Health Care & Social Assistance (100.0%).
| Industry | Male | Female |
| Agriculture, Fishing & Hunting | 0 (0.0%) | 0 (0.0%) |
| Mining, Quarrying, & Extraction | 0 (0.0%) | 0 (0.0%) |
| Construction | 3 (100.0%) | 0 (0.0%) |
| Manufacturing | 14 (100.0%) | 0 (0.0%) |
| Wholesale Trade | 0 (0.0%) | 0 (0.0%) |
| Retail Trade | 29 (61.7%) | 18 (38.3%) |
| Transportation & Warehousing | 34 (82.9%) | 7 (17.1%) |
| Utilities | 0 (0.0%) | 0 (0.0%) |
| Information | 9 (100.0%) | 0 (0.0%) |
| Finance & Insurance | 0 (0.0%) | 7 (100.0%) |
| Real Estate, Rental & Leasing | 0 (0.0%) | 11 (100.0%) |
| Professional & Scientific | 0 (0.0%) | 0 (0.0%) |
| Enterprise Management | 0 (0.0%) | 0 (0.0%) |
| Administrative & Support | 24 (100.0%) | 0 (0.0%) |
| Educational Services | 30 (69.8%) | 13 (30.2%) |
| Health Care & Social Assistance | 0 (0.0%) | 2 (100.0%) |
| Arts, Entertainment & Recreation | 0 (0.0%) | 10 (100.0%) |
| Accommodation & Food Services | 11 (100.0%) | 0 (0.0%) |
| Public Administration | 19 (50.0%) | 19 (50.0%) |
| Total | 181 (67.5%) | 87 (32.5%) |
Education in Lind
School Enrollment in Lind
The most common levels of schooling among the 92 students in Lind are elementary school (24 | 26.1%), high school (24 | 26.1%), and college / undergraduate (22 | 23.9%).
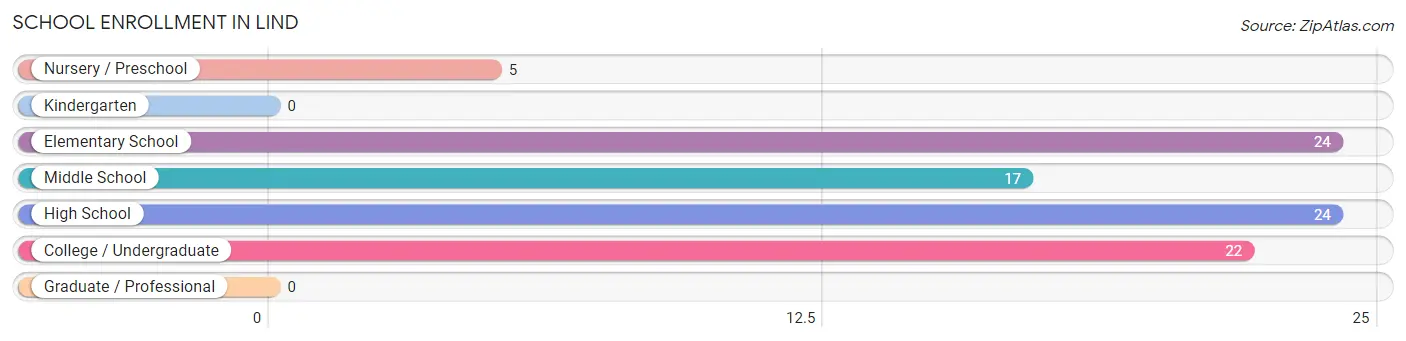
| School Level | # Students | % Students |
| Nursery / Preschool | 5 | 5.4% |
| Kindergarten | 0 | 0.0% |
| Elementary School | 24 | 26.1% |
| Middle School | 17 | 18.5% |
| High School | 24 | 26.1% |
| College / Undergraduate | 22 | 23.9% |
| Graduate / Professional | 0 | 0.0% |
| Total | 92 | 100.0% |
School Enrollment by Age by Funding Source in Lind
Out of a total of 92 students who are enrolled in schools in Lind, 23 (25.0%) attend a private institution, while the remaining 69 (75.0%) are enrolled in public schools. The age group of 20 to 24 year olds has the highest likelihood of being enrolled in private schools, with 8 (100.0% in the age bracket) enrolled. Conversely, the age group of 3 to 4 year olds has the lowest likelihood of being enrolled in a private school, with 5 (100.0% in the age bracket) attending a public institution.
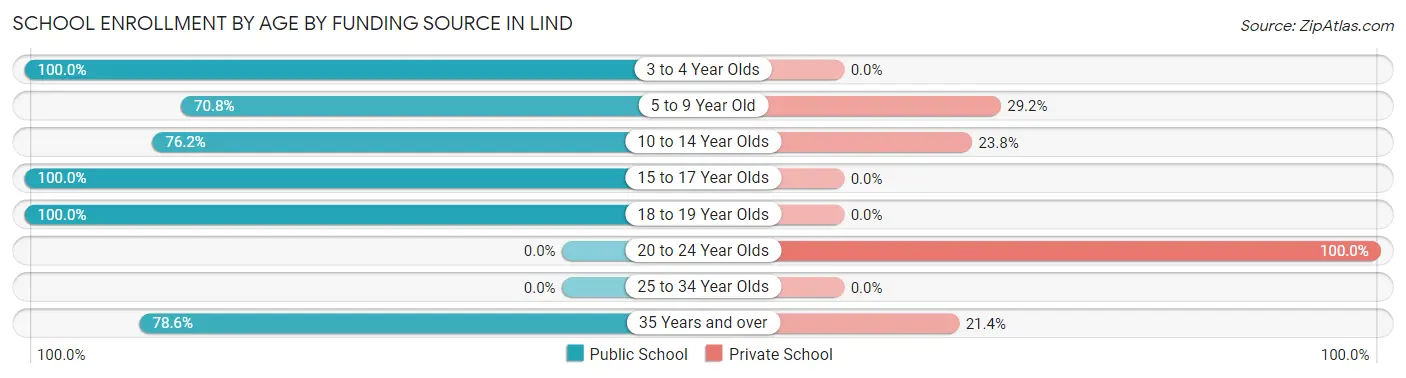
| Age Bracket | Public School | Private School |
| 3 to 4 Year Olds | 5 (100.0%) | 0 (0.0%) |
| 5 to 9 Year Old | 17 (70.8%) | 7 (29.2%) |
| 10 to 14 Year Olds | 16 (76.2%) | 5 (23.8%) |
| 15 to 17 Year Olds | 9 (100.0%) | 0 (0.0%) |
| 18 to 19 Year Olds | 11 (100.0%) | 0 (0.0%) |
| 20 to 24 Year Olds | 0 (0.0%) | 8 (100.0%) |
| 25 to 34 Year Olds | 0 (0.0%) | 0 (0.0%) |
| 35 Years and over | 11 (78.6%) | 3 (21.4%) |
| Total | 69 (75.0%) | 23 (25.0%) |
Educational Attainment by Field of Study in Lind
Business (24 | 25.0%), psychology (20 | 20.8%), arts & humanities (19 | 19.8%), liberal arts & history (14 | 14.6%), and education (12 | 12.5%) are the most common fields of study among 96 individuals in Lind who have obtained a bachelor's degree or higher.
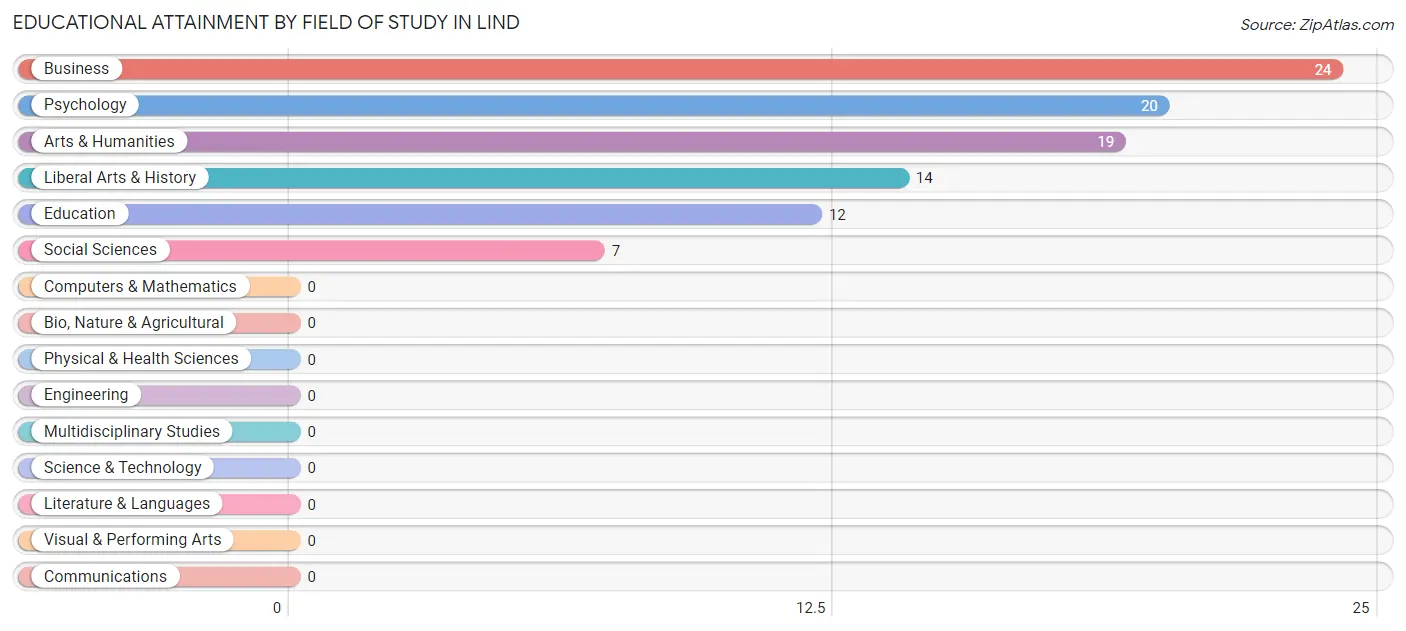
| Field of Study | # Graduates | % Graduates |
| Computers & Mathematics | 0 | 0.0% |
| Bio, Nature & Agricultural | 0 | 0.0% |
| Physical & Health Sciences | 0 | 0.0% |
| Psychology | 20 | 20.8% |
| Social Sciences | 7 | 7.3% |
| Engineering | 0 | 0.0% |
| Multidisciplinary Studies | 0 | 0.0% |
| Science & Technology | 0 | 0.0% |
| Business | 24 | 25.0% |
| Education | 12 | 12.5% |
| Literature & Languages | 0 | 0.0% |
| Liberal Arts & History | 14 | 14.6% |
| Visual & Performing Arts | 0 | 0.0% |
| Communications | 0 | 0.0% |
| Arts & Humanities | 19 | 19.8% |
| Total | 96 | 100.0% |
Transportation & Commute in Lind
Vehicle Availability by Sex in Lind
The most prevalent vehicle ownership categories in Lind are males with 4 vehicles (59, accounting for 32.6%) and females with 4 vehicles (45, making up 67.8%).
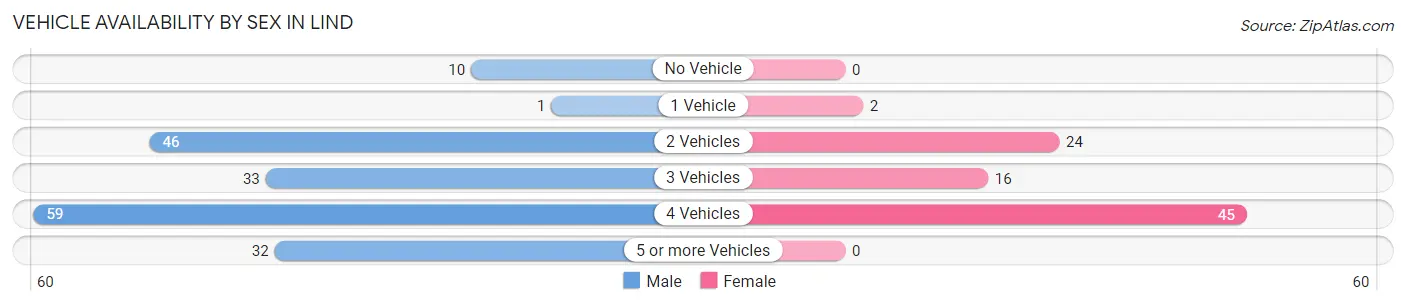
| Vehicles Available | Male | Female |
| No Vehicle | 10 (5.5%) | 0 (0.0%) |
| 1 Vehicle | 1 (0.5%) | 2 (2.3%) |
| 2 Vehicles | 46 (25.4%) | 24 (27.6%) |
| 3 Vehicles | 33 (18.2%) | 16 (18.4%) |
| 4 Vehicles | 59 (32.6%) | 45 (51.7%) |
| 5 or more Vehicles | 32 (17.7%) | 0 (0.0%) |
| Total | 181 (100.0%) | 87 (100.0%) |
Commute Time in Lind
The most frequently occuring commute durations in Lind are 60 to 89 minutes (57 commuters, 21.3%), less than 5 minutes (44 commuters, 16.4%), and 45 to 59 minutes (42 commuters, 15.7%).
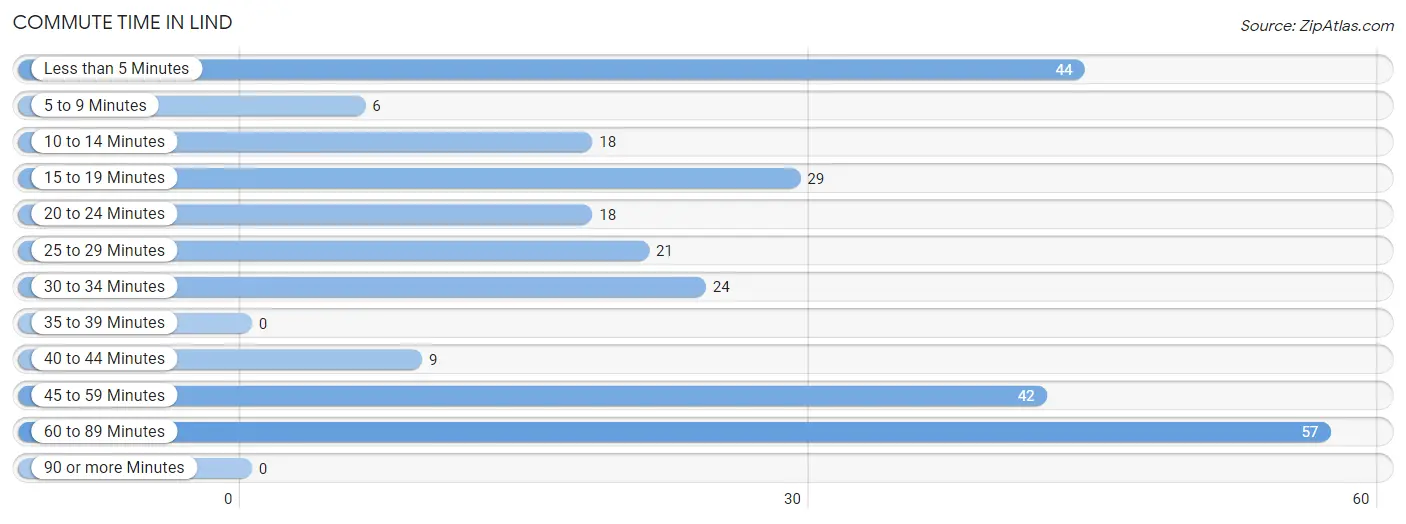
| Commute Time | # Commuters | % Commuters |
| Less than 5 Minutes | 44 | 16.4% |
| 5 to 9 Minutes | 6 | 2.2% |
| 10 to 14 Minutes | 18 | 6.7% |
| 15 to 19 Minutes | 29 | 10.8% |
| 20 to 24 Minutes | 18 | 6.7% |
| 25 to 29 Minutes | 21 | 7.8% |
| 30 to 34 Minutes | 24 | 9.0% |
| 35 to 39 Minutes | 0 | 0.0% |
| 40 to 44 Minutes | 9 | 3.4% |
| 45 to 59 Minutes | 42 | 15.7% |
| 60 to 89 Minutes | 57 | 21.3% |
| 90 or more Minutes | 0 | 0.0% |
Commute Time by Sex in Lind
The most common commute times in Lind are less than 5 minutes (37 commuters, 20.4%) for males and 60 to 89 minutes (26 commuters, 29.9%) for females.
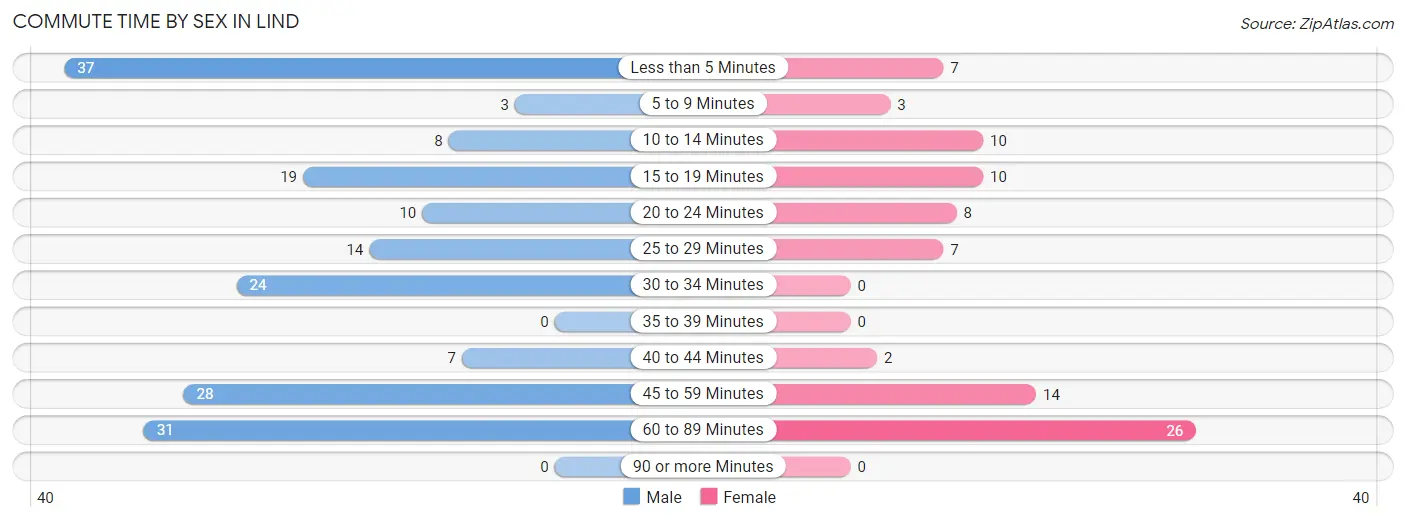
| Commute Time | Male | Female |
| Less than 5 Minutes | 37 (20.4%) | 7 (8.1%) |
| 5 to 9 Minutes | 3 (1.7%) | 3 (3.5%) |
| 10 to 14 Minutes | 8 (4.4%) | 10 (11.5%) |
| 15 to 19 Minutes | 19 (10.5%) | 10 (11.5%) |
| 20 to 24 Minutes | 10 (5.5%) | 8 (9.2%) |
| 25 to 29 Minutes | 14 (7.7%) | 7 (8.1%) |
| 30 to 34 Minutes | 24 (13.3%) | 0 (0.0%) |
| 35 to 39 Minutes | 0 (0.0%) | 0 (0.0%) |
| 40 to 44 Minutes | 7 (3.9%) | 2 (2.3%) |
| 45 to 59 Minutes | 28 (15.5%) | 14 (16.1%) |
| 60 to 89 Minutes | 31 (17.1%) | 26 (29.9%) |
| 90 or more Minutes | 0 (0.0%) | 0 (0.0%) |
Time of Departure to Work by Sex in Lind
The most frequent times of departure to work in Lind are 7:00 AM to 7:29 AM (57, 31.5%) for males and 12:00 PM to 3:59 PM (18, 20.7%) for females.
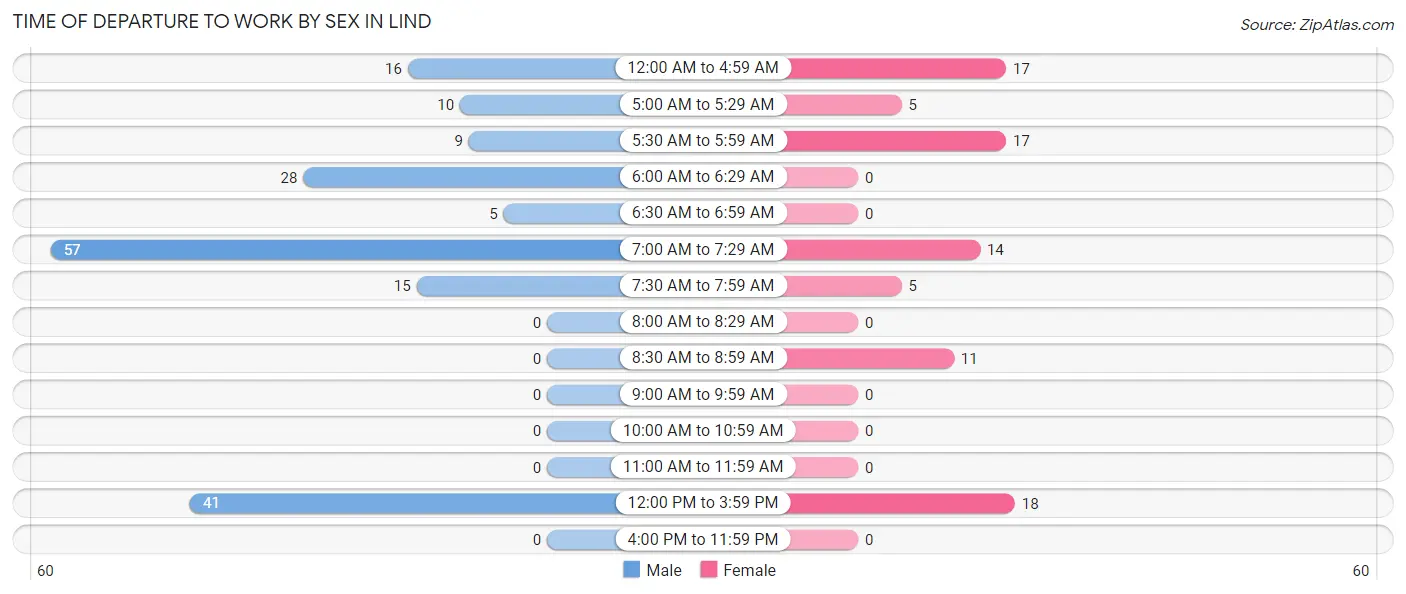
| Time of Departure | Male | Female |
| 12:00 AM to 4:59 AM | 16 (8.8%) | 17 (19.5%) |
| 5:00 AM to 5:29 AM | 10 (5.5%) | 5 (5.8%) |
| 5:30 AM to 5:59 AM | 9 (5.0%) | 17 (19.5%) |
| 6:00 AM to 6:29 AM | 28 (15.5%) | 0 (0.0%) |
| 6:30 AM to 6:59 AM | 5 (2.8%) | 0 (0.0%) |
| 7:00 AM to 7:29 AM | 57 (31.5%) | 14 (16.1%) |
| 7:30 AM to 7:59 AM | 15 (8.3%) | 5 (5.8%) |
| 8:00 AM to 8:29 AM | 0 (0.0%) | 0 (0.0%) |
| 8:30 AM to 8:59 AM | 0 (0.0%) | 11 (12.6%) |
| 9:00 AM to 9:59 AM | 0 (0.0%) | 0 (0.0%) |
| 10:00 AM to 10:59 AM | 0 (0.0%) | 0 (0.0%) |
| 11:00 AM to 11:59 AM | 0 (0.0%) | 0 (0.0%) |
| 12:00 PM to 3:59 PM | 41 (22.7%) | 18 (20.7%) |
| 4:00 PM to 11:59 PM | 0 (0.0%) | 0 (0.0%) |
| Total | 181 (100.0%) | 87 (100.0%) |
Housing Occupancy in Lind
Occupancy by Ownership in Lind
Of the total 235 dwellings in Lind, owner-occupied units account for 180 (76.6%), while renter-occupied units make up 55 (23.4%).
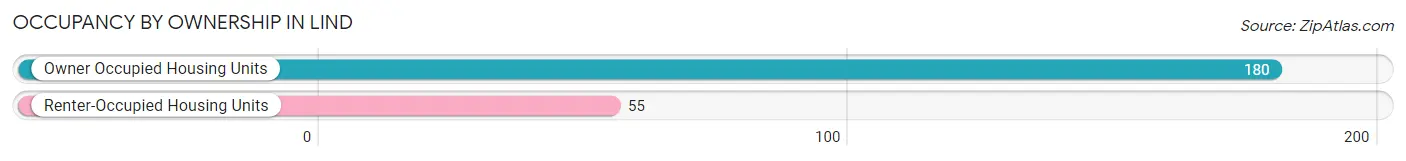
| Occupancy | # Housing Units | % Housing Units |
| Owner Occupied Housing Units | 180 | 76.6% |
| Renter-Occupied Housing Units | 55 | 23.4% |
| Total Occupied Housing Units | 235 | 100.0% |
Occupancy by Household Size in Lind
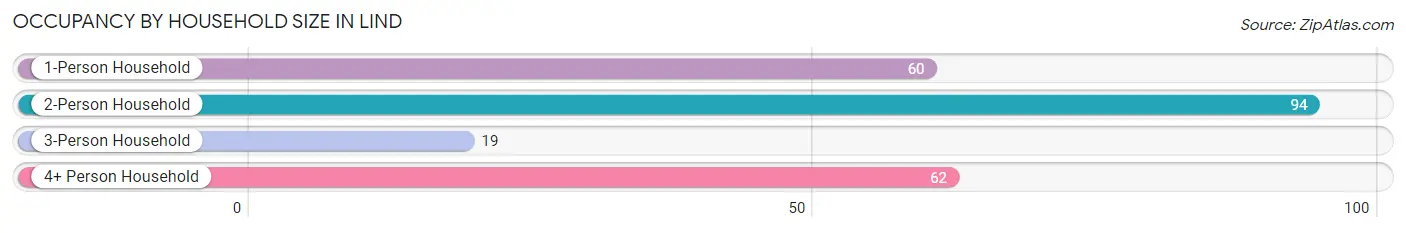
| Household Size | # Housing Units | % Housing Units |
| 1-Person Household | 60 | 25.5% |
| 2-Person Household | 94 | 40.0% |
| 3-Person Household | 19 | 8.1% |
| 4+ Person Household | 62 | 26.4% |
| Total Housing Units | 235 | 100.0% |
Occupancy by Ownership by Household Size in Lind
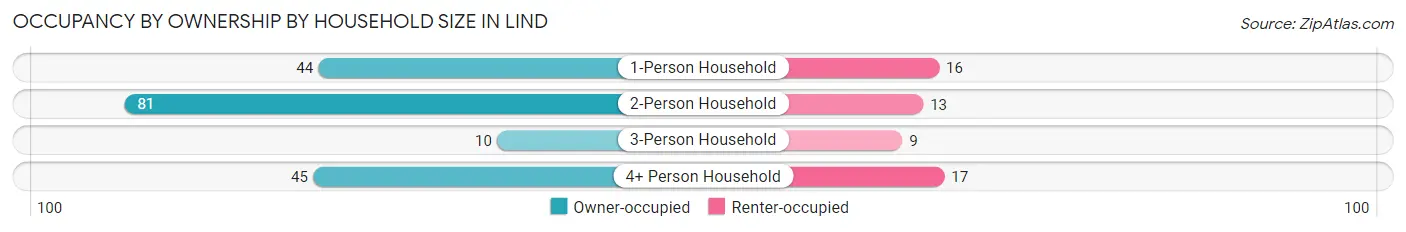
| Household Size | Owner-occupied | Renter-occupied |
| 1-Person Household | 44 (73.3%) | 16 (26.7%) |
| 2-Person Household | 81 (86.2%) | 13 (13.8%) |
| 3-Person Household | 10 (52.6%) | 9 (47.4%) |
| 4+ Person Household | 45 (72.6%) | 17 (27.4%) |
| Total Housing Units | 180 (76.6%) | 55 (23.4%) |
Occupancy by Educational Attainment in Lind
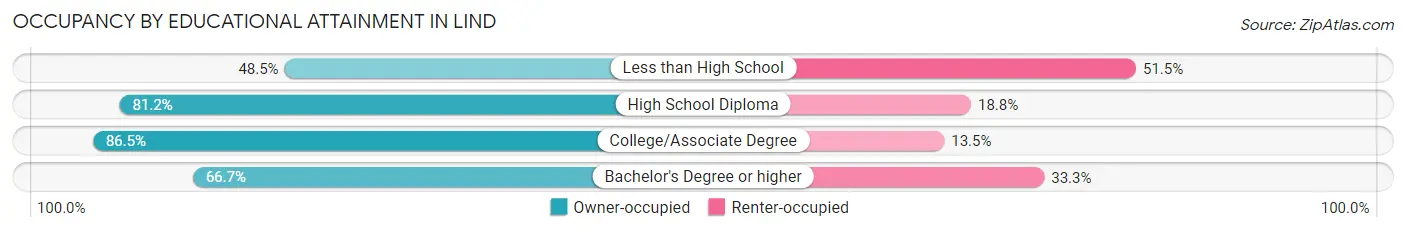
| Household Size | Owner-occupied | Renter-occupied |
| Less than High School | 16 (48.5%) | 17 (51.5%) |
| High School Diploma | 82 (81.2%) | 19 (18.8%) |
| College/Associate Degree | 64 (86.5%) | 10 (13.5%) |
| Bachelor's Degree or higher | 18 (66.7%) | 9 (33.3%) |
Occupancy by Age of Householder in Lind

| Age Bracket | # Households | % Households |
| Under 35 Years | 41 | 17.4% |
| 35 to 44 Years | 21 | 8.9% |
| 45 to 54 Years | 46 | 19.6% |
| 55 to 64 Years | 58 | 24.7% |
| 65 to 74 Years | 56 | 23.8% |
| 75 to 84 Years | 3 | 1.3% |
| 85 Years and Over | 10 | 4.3% |
| Total | 235 | 100.0% |
Housing Finances in Lind
Median Income by Occupancy in Lind
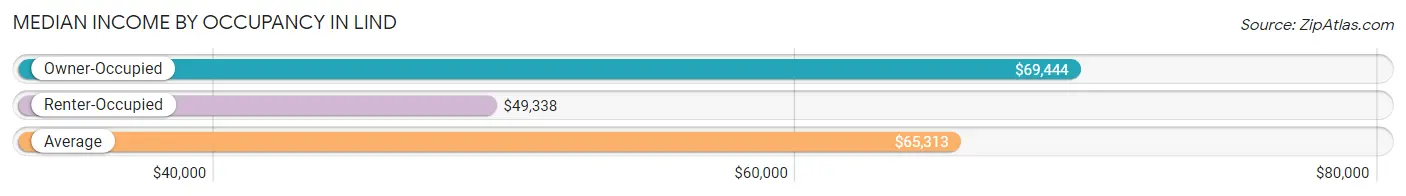
| Occupancy Type | # Households | Median Income |
| Owner-Occupied | 180 (76.6%) | $69,444 |
| Renter-Occupied | 55 (23.4%) | $49,338 |
| Average | 235 (100.0%) | $65,313 |
Occupancy by Householder Income Bracket in Lind
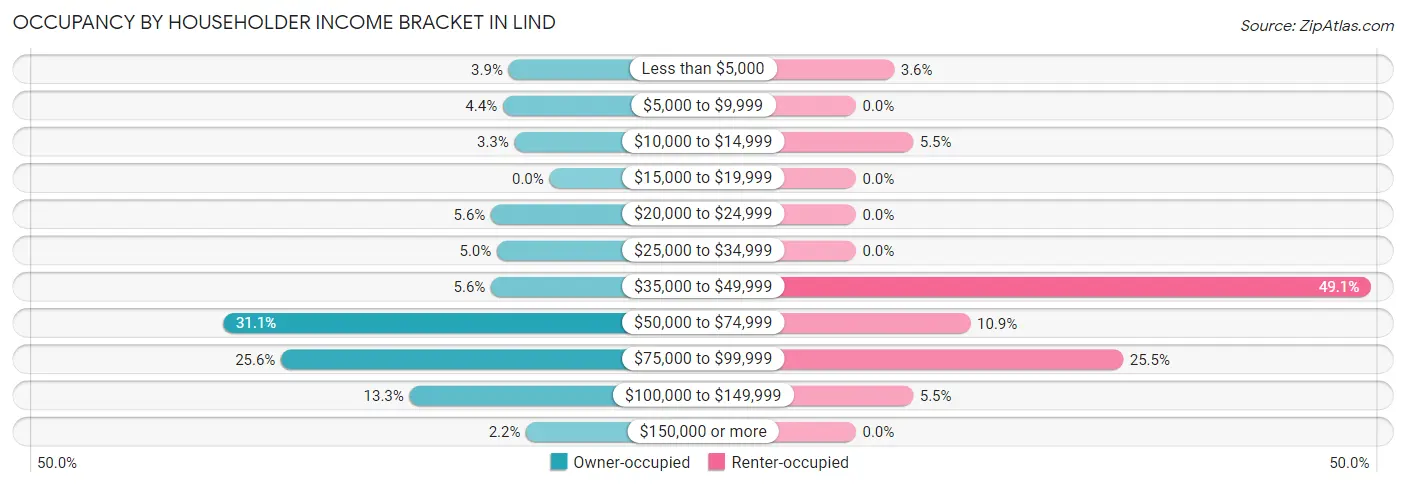
| Income Bracket | Owner-occupied | Renter-occupied |
| Less than $5,000 | 7 (3.9%) | 2 (3.6%) |
| $5,000 to $9,999 | 8 (4.4%) | 0 (0.0%) |
| $10,000 to $14,999 | 6 (3.3%) | 3 (5.4%) |
| $15,000 to $19,999 | 0 (0.0%) | 0 (0.0%) |
| $20,000 to $24,999 | 10 (5.6%) | 0 (0.0%) |
| $25,000 to $34,999 | 9 (5.0%) | 0 (0.0%) |
| $35,000 to $49,999 | 10 (5.6%) | 27 (49.1%) |
| $50,000 to $74,999 | 56 (31.1%) | 6 (10.9%) |
| $75,000 to $99,999 | 46 (25.6%) | 14 (25.5%) |
| $100,000 to $149,999 | 24 (13.3%) | 3 (5.4%) |
| $150,000 or more | 4 (2.2%) | 0 (0.0%) |
| Total | 180 (100.0%) | 55 (100.0%) |
Monthly Housing Cost Tiers in Lind
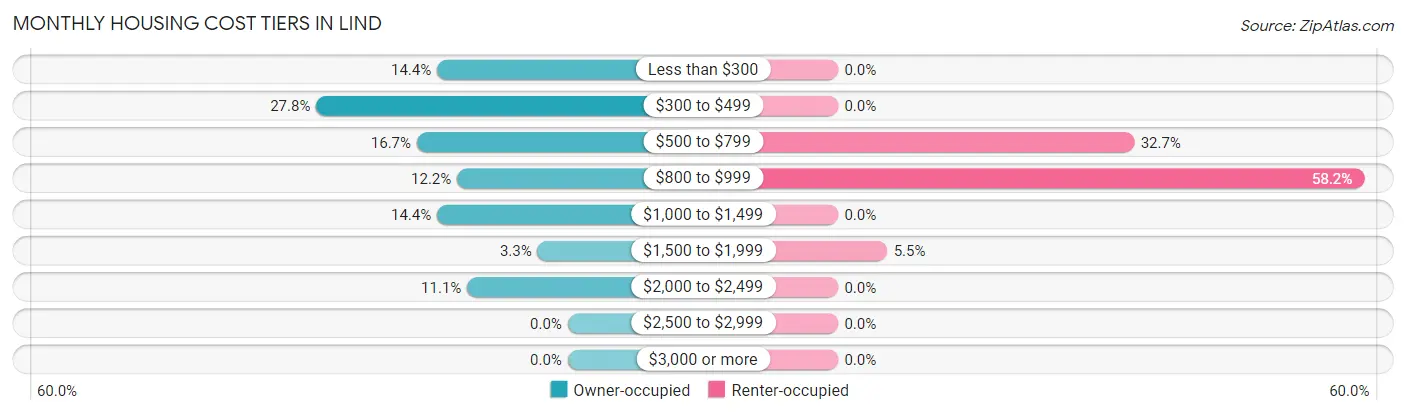
| Monthly Cost | Owner-occupied | Renter-occupied |
| Less than $300 | 26 (14.4%) | 0 (0.0%) |
| $300 to $499 | 50 (27.8%) | 0 (0.0%) |
| $500 to $799 | 30 (16.7%) | 18 (32.7%) |
| $800 to $999 | 22 (12.2%) | 32 (58.2%) |
| $1,000 to $1,499 | 26 (14.4%) | 0 (0.0%) |
| $1,500 to $1,999 | 6 (3.3%) | 3 (5.4%) |
| $2,000 to $2,499 | 20 (11.1%) | 0 (0.0%) |
| $2,500 to $2,999 | 0 (0.0%) | 0 (0.0%) |
| $3,000 or more | 0 (0.0%) | 0 (0.0%) |
| Total | 180 (100.0%) | 55 (100.0%) |
Physical Housing Characteristics in Lind
Housing Structures in Lind
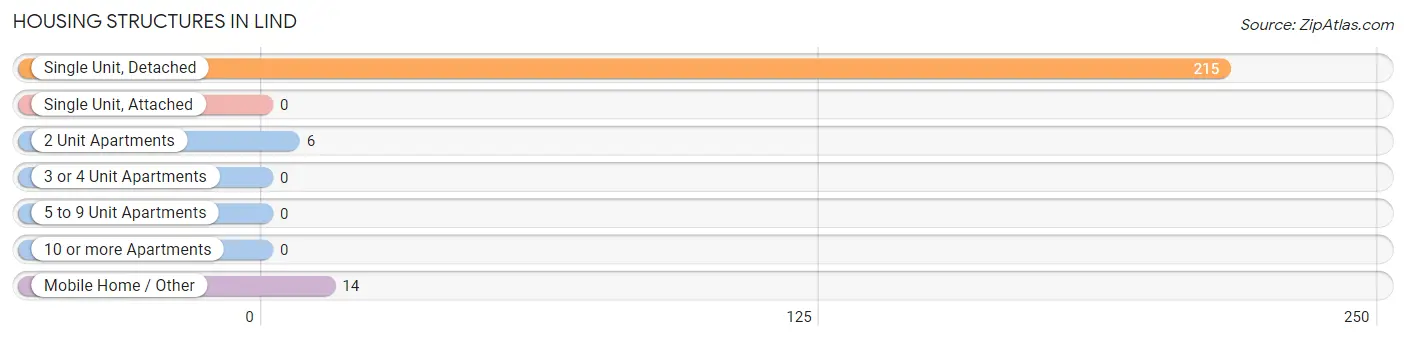
| Structure Type | # Housing Units | % Housing Units |
| Single Unit, Detached | 215 | 91.5% |
| Single Unit, Attached | 0 | 0.0% |
| 2 Unit Apartments | 6 | 2.5% |
| 3 or 4 Unit Apartments | 0 | 0.0% |
| 5 to 9 Unit Apartments | 0 | 0.0% |
| 10 or more Apartments | 0 | 0.0% |
| Mobile Home / Other | 14 | 6.0% |
| Total | 235 | 100.0% |
Housing Structures by Occupancy in Lind
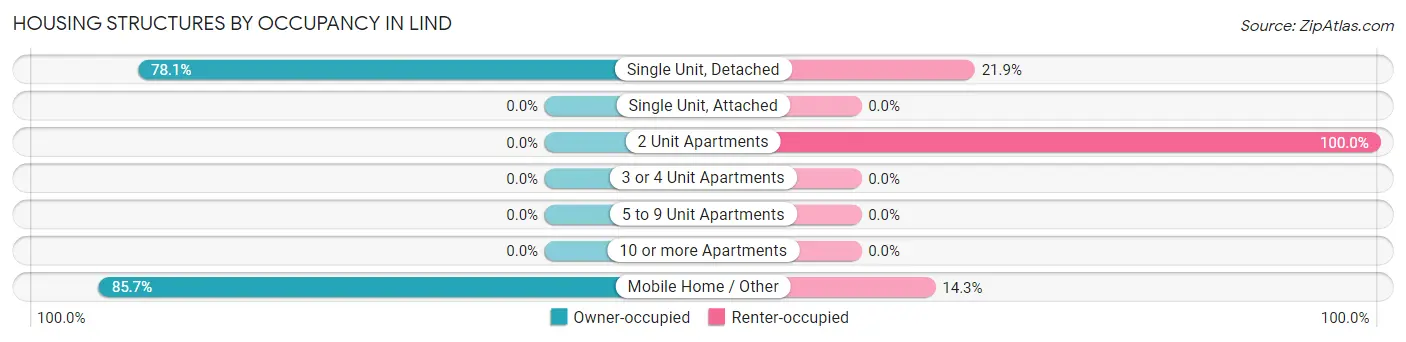
| Structure Type | Owner-occupied | Renter-occupied |
| Single Unit, Detached | 168 (78.1%) | 47 (21.9%) |
| Single Unit, Attached | 0 (0.0%) | 0 (0.0%) |
| 2 Unit Apartments | 0 (0.0%) | 6 (100.0%) |
| 3 or 4 Unit Apartments | 0 (0.0%) | 0 (0.0%) |
| 5 to 9 Unit Apartments | 0 (0.0%) | 0 (0.0%) |
| 10 or more Apartments | 0 (0.0%) | 0 (0.0%) |
| Mobile Home / Other | 12 (85.7%) | 2 (14.3%) |
| Total | 180 (76.6%) | 55 (23.4%) |
Housing Structures by Number of Rooms in Lind
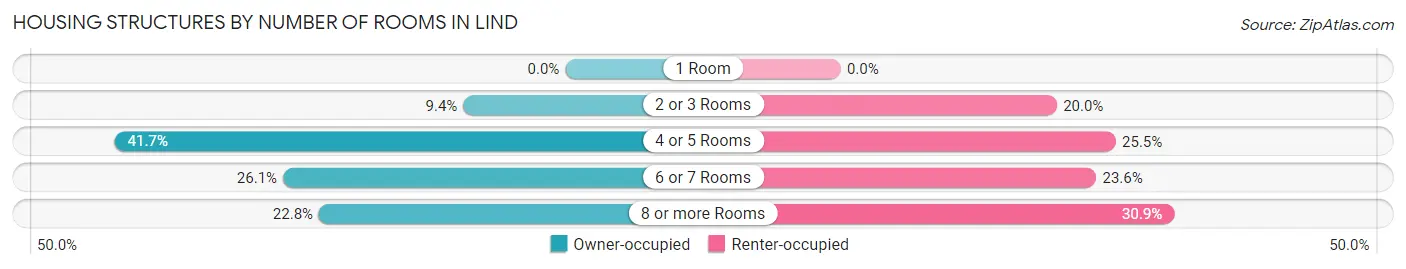
| Number of Rooms | Owner-occupied | Renter-occupied |
| 1 Room | 0 (0.0%) | 0 (0.0%) |
| 2 or 3 Rooms | 17 (9.4%) | 11 (20.0%) |
| 4 or 5 Rooms | 75 (41.7%) | 14 (25.5%) |
| 6 or 7 Rooms | 47 (26.1%) | 13 (23.6%) |
| 8 or more Rooms | 41 (22.8%) | 17 (30.9%) |
| Total | 180 (100.0%) | 55 (100.0%) |
Housing Structure by Heating Type in Lind
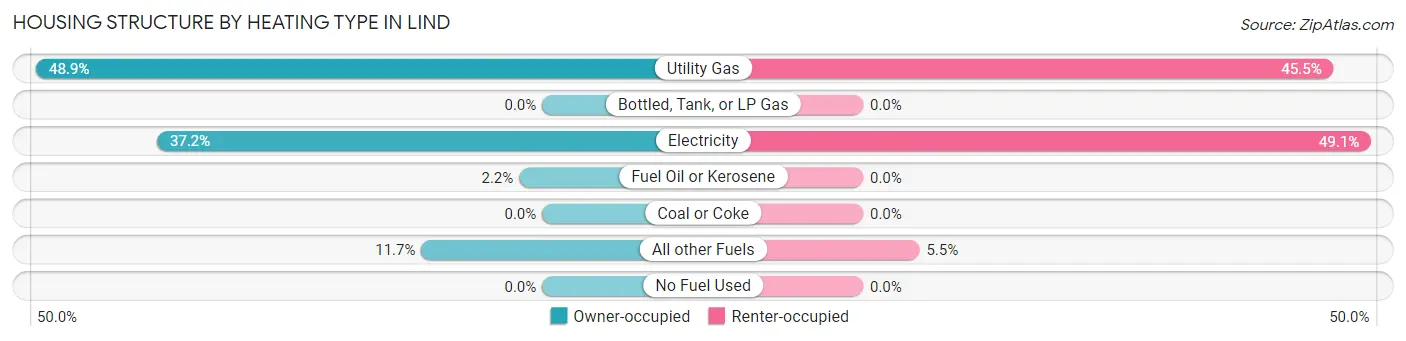
| Heating Type | Owner-occupied | Renter-occupied |
| Utility Gas | 88 (48.9%) | 25 (45.5%) |
| Bottled, Tank, or LP Gas | 0 (0.0%) | 0 (0.0%) |
| Electricity | 67 (37.2%) | 27 (49.1%) |
| Fuel Oil or Kerosene | 4 (2.2%) | 0 (0.0%) |
| Coal or Coke | 0 (0.0%) | 0 (0.0%) |
| All other Fuels | 21 (11.7%) | 3 (5.4%) |
| No Fuel Used | 0 (0.0%) | 0 (0.0%) |
| Total | 180 (100.0%) | 55 (100.0%) |
Household Vehicle Usage in Lind
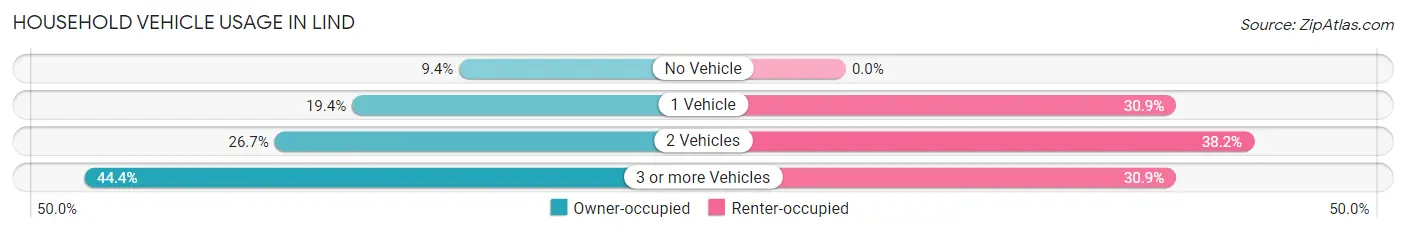
| Vehicles per Household | Owner-occupied | Renter-occupied |
| No Vehicle | 17 (9.4%) | 0 (0.0%) |
| 1 Vehicle | 35 (19.4%) | 17 (30.9%) |
| 2 Vehicles | 48 (26.7%) | 21 (38.2%) |
| 3 or more Vehicles | 80 (44.4%) | 17 (30.9%) |
| Total | 180 (100.0%) | 55 (100.0%) |
Real Estate & Mortgages in Lind
Real Estate and Mortgage Overview in Lind
| Characteristic | Without Mortgage | With Mortgage |
| Housing Units | 109 | 71 |
| Median Property Value | $169,200 | $0 |
| Median Household Income | $54,464 | $4 |
| Monthly Housing Costs | $443 | $0 |
| Real Estate Taxes | $752 | $0 |
Property Value by Mortgage Status in Lind
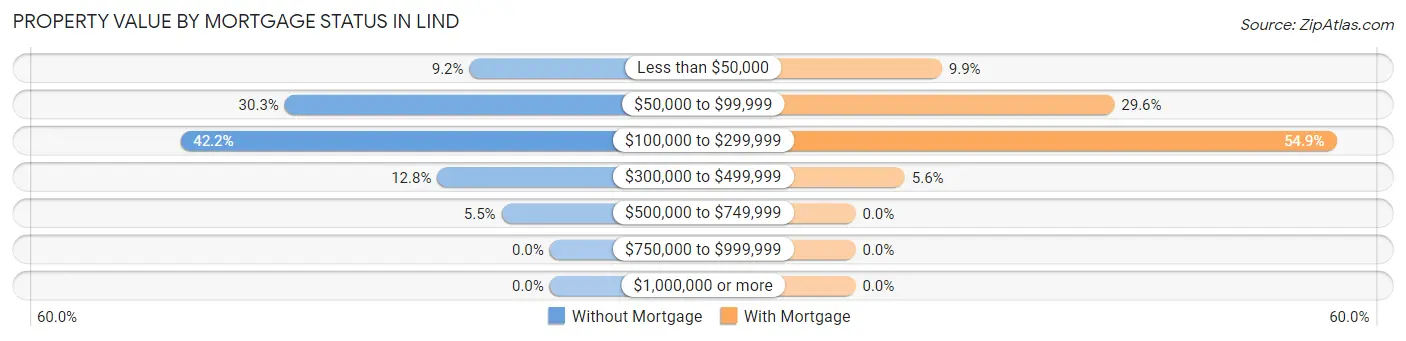
| Property Value | Without Mortgage | With Mortgage |
| Less than $50,000 | 10 (9.2%) | 7 (9.9%) |
| $50,000 to $99,999 | 33 (30.3%) | 21 (29.6%) |
| $100,000 to $299,999 | 46 (42.2%) | 39 (54.9%) |
| $300,000 to $499,999 | 14 (12.8%) | 4 (5.6%) |
| $500,000 to $749,999 | 6 (5.5%) | 0 (0.0%) |
| $750,000 to $999,999 | 0 (0.0%) | 0 (0.0%) |
| $1,000,000 or more | 0 (0.0%) | 0 (0.0%) |
| Total | 109 (100.0%) | 71 (100.0%) |
Household Income by Mortgage Status in Lind
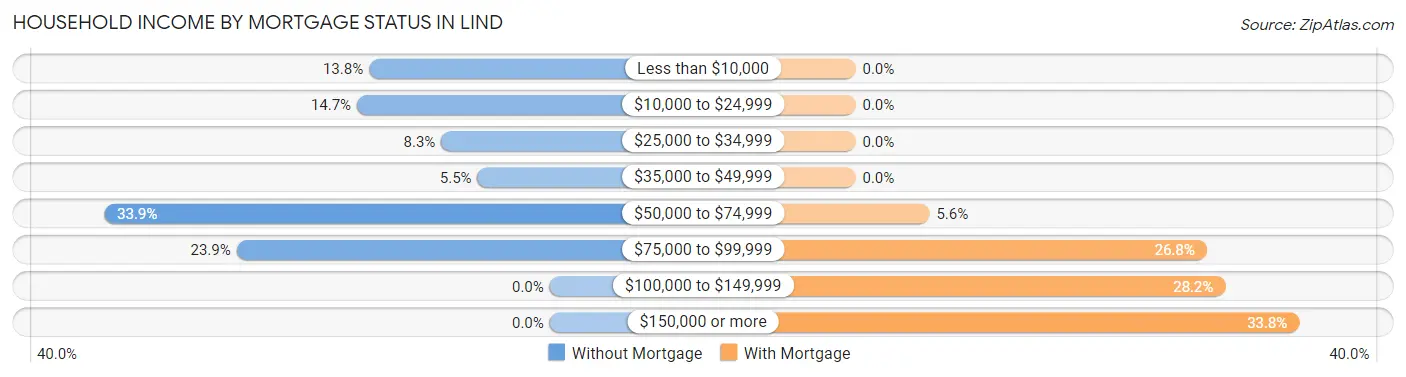
| Household Income | Without Mortgage | With Mortgage |
| Less than $10,000 | 15 (13.8%) | 0 (0.0%) |
| $10,000 to $24,999 | 16 (14.7%) | 0 (0.0%) |
| $25,000 to $34,999 | 9 (8.3%) | 0 (0.0%) |
| $35,000 to $49,999 | 6 (5.5%) | 0 (0.0%) |
| $50,000 to $74,999 | 37 (33.9%) | 4 (5.6%) |
| $75,000 to $99,999 | 26 (23.8%) | 19 (26.8%) |
| $100,000 to $149,999 | 0 (0.0%) | 20 (28.2%) |
| $150,000 or more | 0 (0.0%) | 24 (33.8%) |
| Total | 109 (100.0%) | 71 (100.0%) |
Property Value to Household Income Ratio in Lind
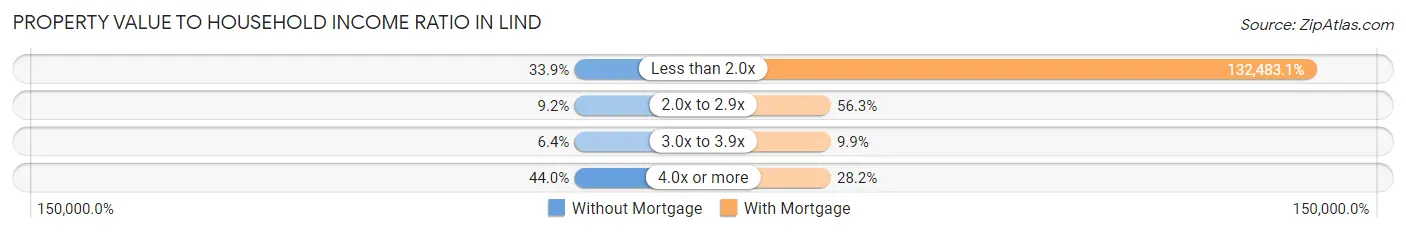
| Value-to-Income Ratio | Without Mortgage | With Mortgage |
| Less than 2.0x | 37 (33.9%) | 94,063 (132,483.1%) |
| 2.0x to 2.9x | 10 (9.2%) | 40 (56.3%) |
| 3.0x to 3.9x | 7 (6.4%) | 7 (9.9%) |
| 4.0x or more | 48 (44.0%) | 20 (28.2%) |
| Total | 109 (100.0%) | 71 (100.0%) |
Real Estate Taxes by Mortgage Status in Lind
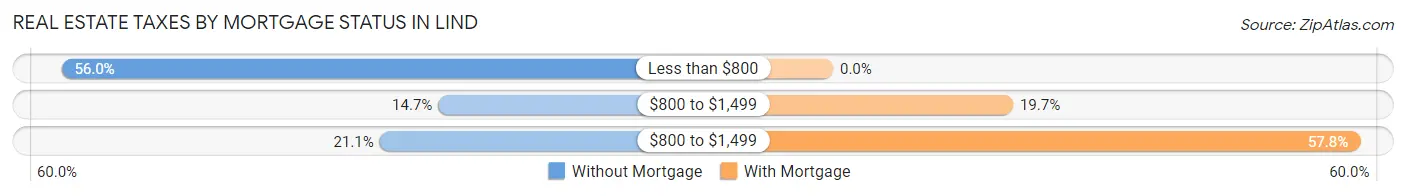
| Property Taxes | Without Mortgage | With Mortgage |
| Less than $800 | 61 (56.0%) | 0 (0.0%) |
| $800 to $1,499 | 16 (14.7%) | 14 (19.7%) |
| $800 to $1,499 | 23 (21.1%) | 41 (57.8%) |
| Total | 109 (100.0%) | 71 (100.0%) |
Health & Disability in Lind
Health Insurance Coverage by Age in Lind
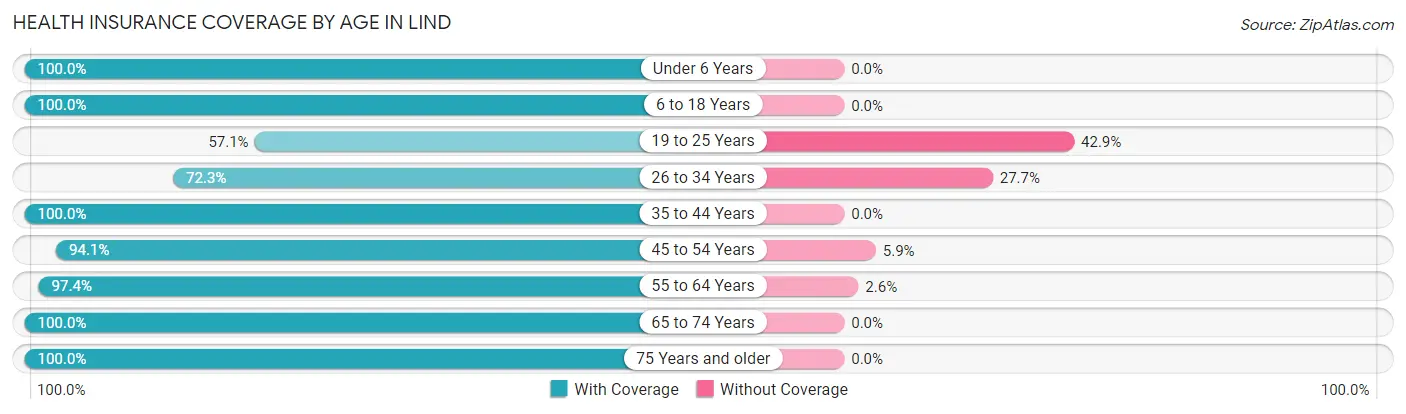
| Age Bracket | With Coverage | Without Coverage |
| Under 6 Years | 40 (100.0%) | 0 (0.0%) |
| 6 to 18 Years | 65 (100.0%) | 0 (0.0%) |
| 19 to 25 Years | 40 (57.1%) | 30 (42.9%) |
| 26 to 34 Years | 47 (72.3%) | 18 (27.7%) |
| 35 to 44 Years | 31 (100.0%) | 0 (0.0%) |
| 45 to 54 Years | 80 (94.1%) | 5 (5.9%) |
| 55 to 64 Years | 111 (97.4%) | 3 (2.6%) |
| 65 to 74 Years | 86 (100.0%) | 0 (0.0%) |
| 75 Years and older | 13 (100.0%) | 0 (0.0%) |
| Total | 513 (90.2%) | 56 (9.8%) |
Health Insurance Coverage by Citizenship Status in Lind
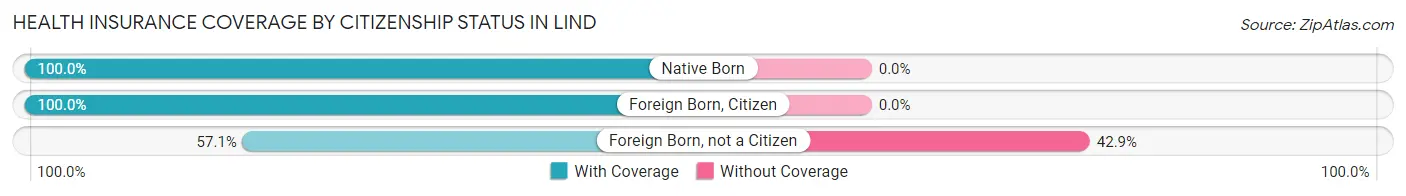
| Citizenship Status | With Coverage | Without Coverage |
| Native Born | 40 (100.0%) | 0 (0.0%) |
| Foreign Born, Citizen | 65 (100.0%) | 0 (0.0%) |
| Foreign Born, not a Citizen | 40 (57.1%) | 30 (42.9%) |
Health Insurance Coverage by Household Income in Lind
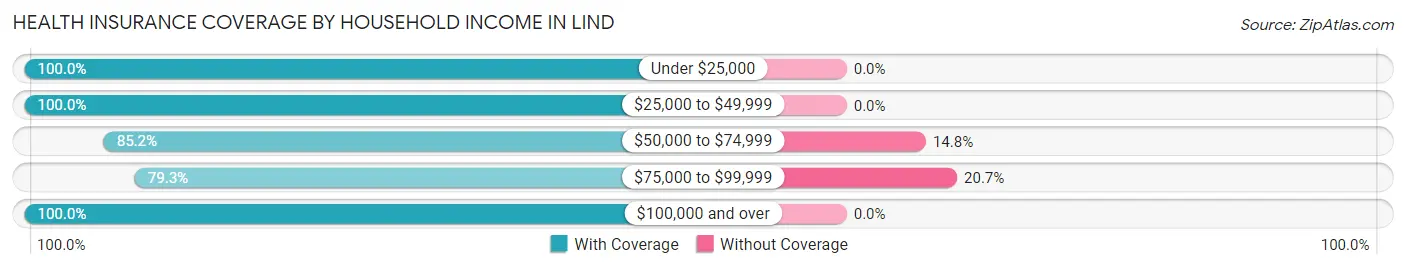
| Household Income | With Coverage | Without Coverage |
| Under $25,000 | 36 (100.0%) | 0 (0.0%) |
| $25,000 to $49,999 | 135 (100.0%) | 0 (0.0%) |
| $50,000 to $74,999 | 109 (85.2%) | 19 (14.8%) |
| $75,000 to $99,999 | 142 (79.3%) | 37 (20.7%) |
| $100,000 and over | 91 (100.0%) | 0 (0.0%) |
Public vs Private Health Insurance Coverage by Age in Lind
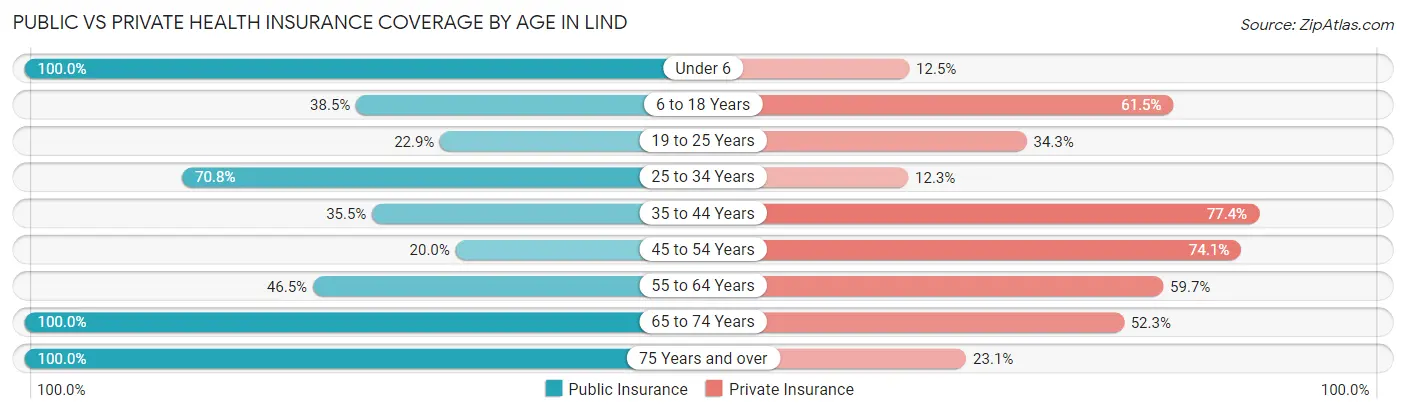
| Age Bracket | Public Insurance | Private Insurance |
| Under 6 | 40 (100.0%) | 5 (12.5%) |
| 6 to 18 Years | 25 (38.5%) | 40 (61.5%) |
| 19 to 25 Years | 16 (22.9%) | 24 (34.3%) |
| 25 to 34 Years | 46 (70.8%) | 8 (12.3%) |
| 35 to 44 Years | 11 (35.5%) | 24 (77.4%) |
| 45 to 54 Years | 17 (20.0%) | 63 (74.1%) |
| 55 to 64 Years | 53 (46.5%) | 68 (59.7%) |
| 65 to 74 Years | 86 (100.0%) | 45 (52.3%) |
| 75 Years and over | 13 (100.0%) | 3 (23.1%) |
| Total | 307 (53.9%) | 280 (49.2%) |
Disability Status by Sex by Age in Lind
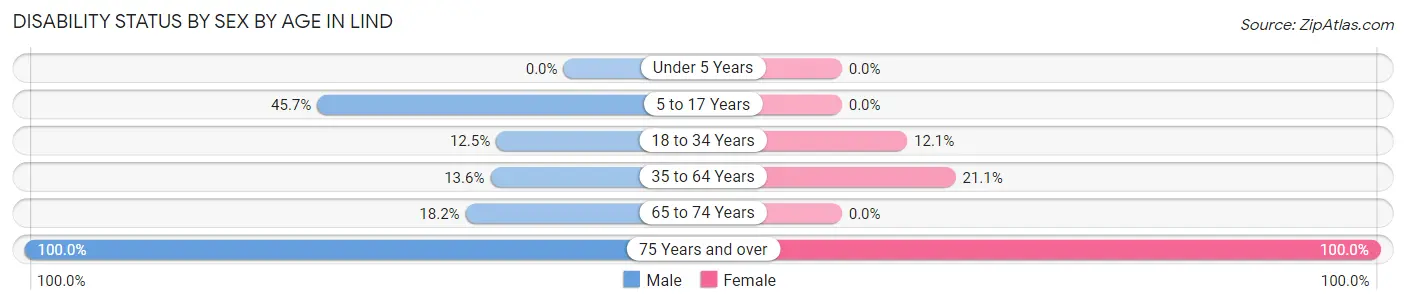
| Age Bracket | Male | Female |
| Under 5 Years | 0 (0.0%) | 0 (0.0%) |
| 5 to 17 Years | 16 (45.7%) | 0 (0.0%) |
| 18 to 34 Years | 10 (12.5%) | 8 (12.1%) |
| 35 to 64 Years | 19 (13.6%) | 19 (21.1%) |
| 65 to 74 Years | 6 (18.2%) | 0 (0.0%) |
| 75 Years and over | 3 (100.0%) | 10 (100.0%) |
Disability Class by Sex by Age in Lind
Disability Class: Hearing Difficulty
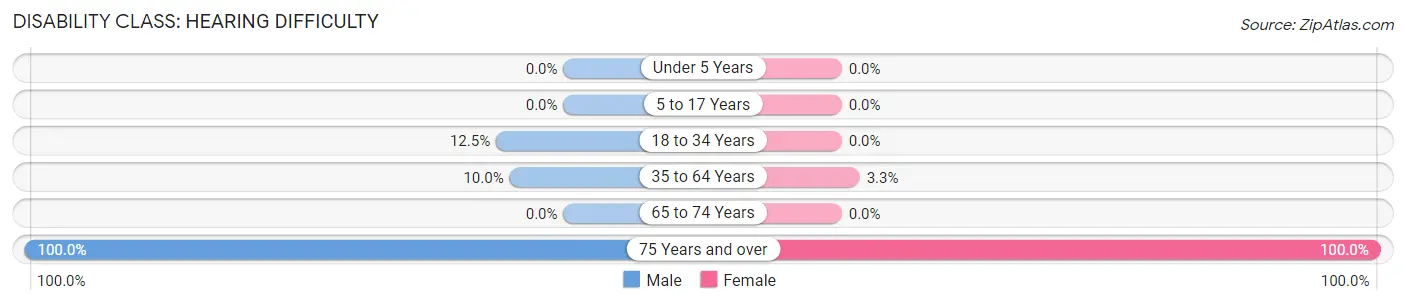
| Age Bracket | Male | Female |
| Under 5 Years | 0 (0.0%) | 0 (0.0%) |
| 5 to 17 Years | 0 (0.0%) | 0 (0.0%) |
| 18 to 34 Years | 10 (12.5%) | 0 (0.0%) |
| 35 to 64 Years | 14 (10.0%) | 3 (3.3%) |
| 65 to 74 Years | 0 (0.0%) | 0 (0.0%) |
| 75 Years and over | 3 (100.0%) | 10 (100.0%) |
Disability Class: Vision Difficulty
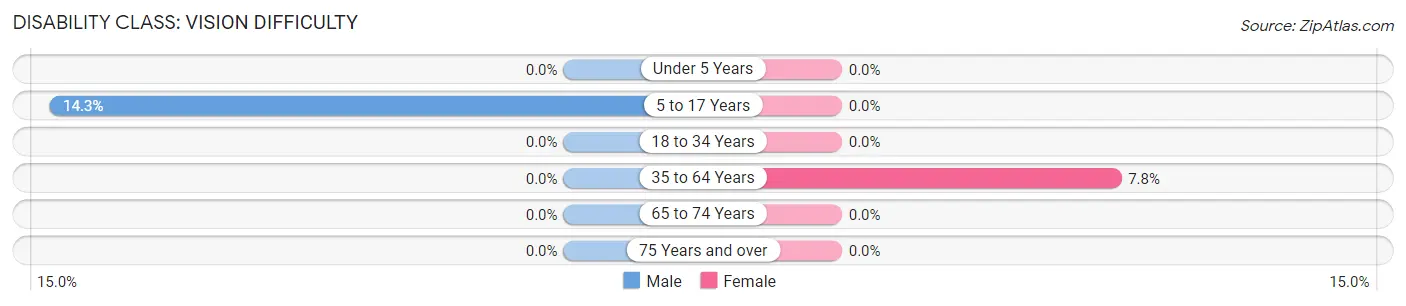
| Age Bracket | Male | Female |
| Under 5 Years | 0 (0.0%) | 0 (0.0%) |
| 5 to 17 Years | 5 (14.3%) | 0 (0.0%) |
| 18 to 34 Years | 0 (0.0%) | 0 (0.0%) |
| 35 to 64 Years | 0 (0.0%) | 7 (7.8%) |
| 65 to 74 Years | 0 (0.0%) | 0 (0.0%) |
| 75 Years and over | 0 (0.0%) | 0 (0.0%) |
Disability Class: Cognitive Difficulty
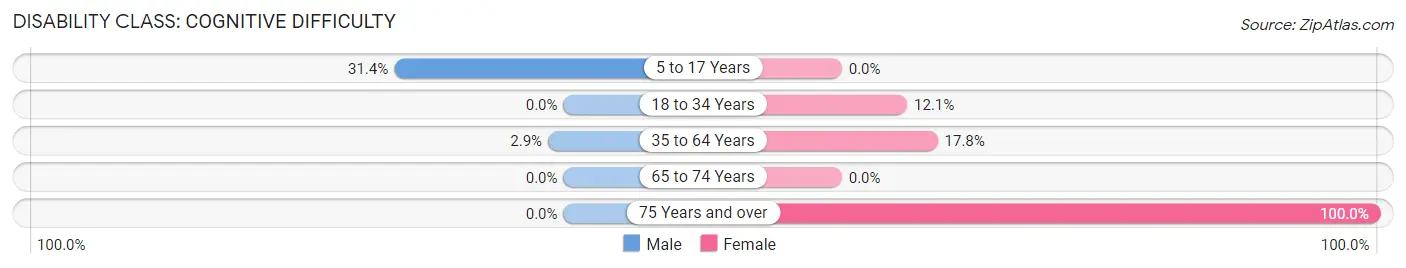
| Age Bracket | Male | Female |
| 5 to 17 Years | 11 (31.4%) | 0 (0.0%) |
| 18 to 34 Years | 0 (0.0%) | 8 (12.1%) |
| 35 to 64 Years | 4 (2.9%) | 16 (17.8%) |
| 65 to 74 Years | 0 (0.0%) | 0 (0.0%) |
| 75 Years and over | 0 (0.0%) | 10 (100.0%) |
Disability Class: Ambulatory Difficulty
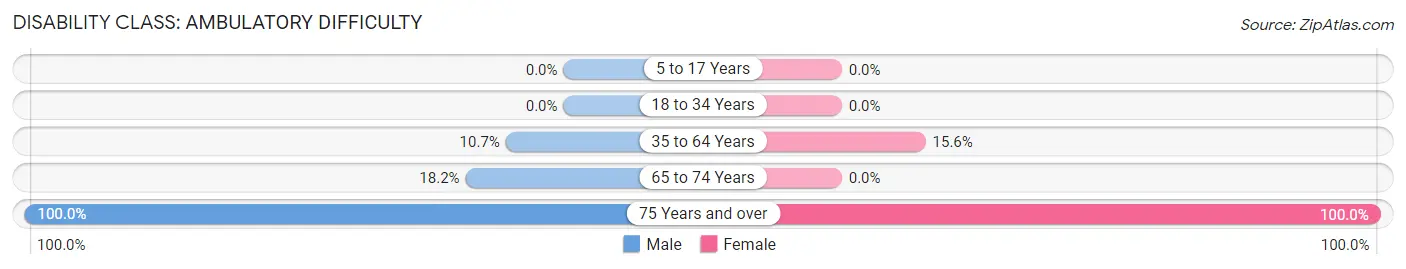
| Age Bracket | Male | Female |
| 5 to 17 Years | 0 (0.0%) | 0 (0.0%) |
| 18 to 34 Years | 0 (0.0%) | 0 (0.0%) |
| 35 to 64 Years | 15 (10.7%) | 14 (15.6%) |
| 65 to 74 Years | 6 (18.2%) | 0 (0.0%) |
| 75 Years and over | 3 (100.0%) | 10 (100.0%) |
Disability Class: Self-Care Difficulty
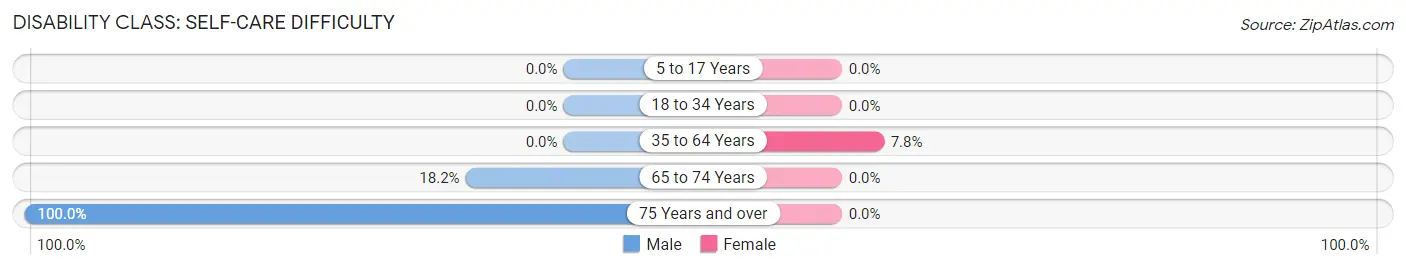
| Age Bracket | Male | Female |
| 5 to 17 Years | 0 (0.0%) | 0 (0.0%) |
| 18 to 34 Years | 0 (0.0%) | 0 (0.0%) |
| 35 to 64 Years | 0 (0.0%) | 7 (7.8%) |
| 65 to 74 Years | 6 (18.2%) | 0 (0.0%) |
| 75 Years and over | 3 (100.0%) | 0 (0.0%) |
Technology Access in Lind
Computing Device Access in Lind
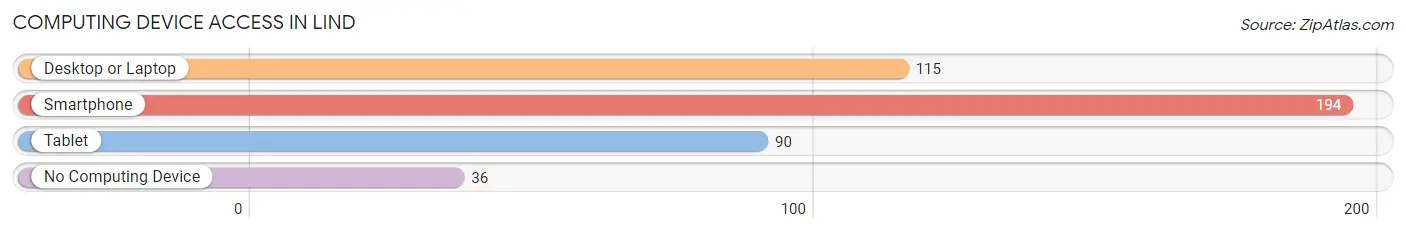
| Device Type | # Households | % Households |
| Desktop or Laptop | 115 | 48.9% |
| Smartphone | 194 | 82.6% |
| Tablet | 90 | 38.3% |
| No Computing Device | 36 | 15.3% |
| Total | 235 | 100.0% |
Internet Access in Lind
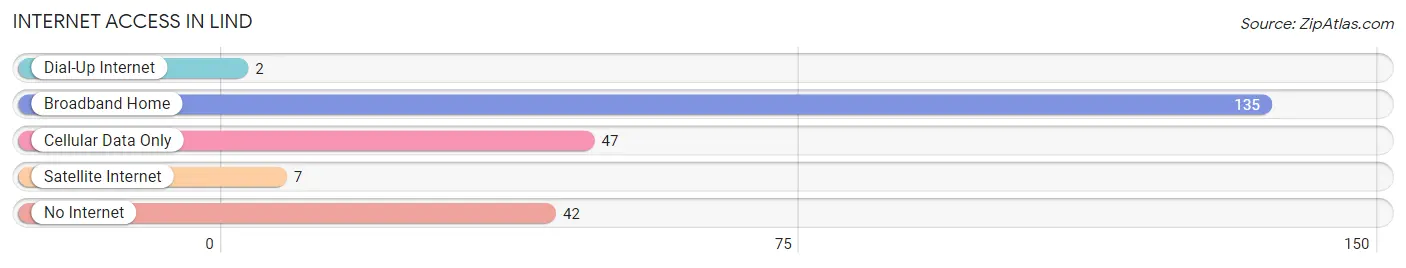
| Internet Type | # Households | % Households |
| Dial-Up Internet | 2 | 0.9% |
| Broadband Home | 135 | 57.5% |
| Cellular Data Only | 47 | 20.0% |
| Satellite Internet | 7 | 3.0% |
| No Internet | 42 | 17.9% |
| Total | 235 | 100.0% |
Lind Summary
Lind is a small town located in the state of Washington, United States. It is situated in the county of Adams and is part of the Moses Lake Metropolitan Statistical Area. The town has a population of 1,093 as of the 2010 census.
History
Lind was founded in 1892 by a group of settlers from Minnesota. The town was named after a local farmer, John Lind, who had donated the land for the town. The first post office was established in 1894.
In the early 1900s, the town was a major center for wheat farming and the local economy was largely based on agriculture. The town also had a number of businesses, including a bank, a hotel, a general store, and a blacksmith shop.
In the 1920s, the town began to experience a decline in population as many of the farmers moved away in search of better opportunities. The Great Depression of the 1930s further exacerbated the situation and the town’s population dropped to just over 500 by 1940.
In the 1950s, the town began to experience a resurgence as the local economy shifted to focus on the production of alfalfa and other crops. The town also began to attract new businesses, including a grain elevator, a feed mill, and a lumber mill.
Geography
Lind is located in the Columbia Plateau region of Washington. The town is situated at an elevation of 1,717 feet and is located at the intersection of State Route 17 and State Route 21.
The town is located in a semi-arid climate zone and experiences hot summers and cold winters. The average annual temperature is around 50 degrees Fahrenheit and the average annual precipitation is around 10 inches.
Economy
The economy of Lind is largely based on agriculture. The town is home to a number of farms that produce alfalfa, wheat, and other crops. The town also has a number of businesses, including a grain elevator, a feed mill, and a lumber mill.
The town is also home to a number of small businesses, including restaurants, retail stores, and service providers. The town also has a number of recreational activities, including camping, fishing, and hunting.
Demographics
As of the 2010 census, the population of Lind was 1,093. The racial makeup of the town was 94.3% White, 0.7% African American, 0.7% Native American, 0.7% Asian, 0.1% Pacific Islander, and 2.7% from other races.
The median household income in Lind was $37,500 and the median family income was $41,250. The per capita income was $17,845. The town had a poverty rate of 16.3%.
Conclusion
Lind is a small town located in the state of Washington, United States. It is situated in the county of Adams and is part of the Moses Lake Metropolitan Statistical Area. The town has a population of 1,093 as of the 2010 census. The economy of Lind is largely based on agriculture and the town is home to a number of small businesses. The town also has a number of recreational activities, including camping, fishing, and hunting.
Common Questions
What is Per Capita Income in Lind?
Per Capita income in Lind is $27,602.
What is the Median Family Income in Lind?
Median Family Income in Lind is $61,944.
What is the Median Household income in Lind?
Median Household Income in Lind is $65,313.
What is Income or Wage Gap in Lind?
Income or Wage Gap in Lind is 8.4%.
Women in Lind earn 91.6 cents for every dollar earned by a man.
What is Inequality or Gini Index in Lind?
Inequality or Gini Index in Lind is 0.31.
What is the Total Population of Lind?
Total Population of Lind is 569.
What is the Total Male Population of Lind?
Total Male Population of Lind is 311.
What is the Total Female Population of Lind?
Total Female Population of Lind is 258.
What is the Ratio of Males per 100 Females in Lind?
There are 120.54 Males per 100 Females in Lind.
What is the Ratio of Females per 100 Males in Lind?
There are 82.96 Females per 100 Males in Lind.
What is the Median Population Age in Lind?
Median Population Age in Lind is 49.3 Years.
What is the Average Family Size in Lind
Average Family Size in Lind is 2.6 People.
What is the Average Household Size in Lind
Average Household Size in Lind is 2.4 People.
How Large is the Labor Force in Lind?
There are 290 People in the Labor Forcein in Lind.
What is the Percentage of People in the Labor Force in Lind?
59.9% of People are in the Labor Force in Lind.
What is the Unemployment Rate in Lind?
Unemployment Rate in Lind is 7.6%.