Bucoda, WA Map & Demographics
Bucoda Map
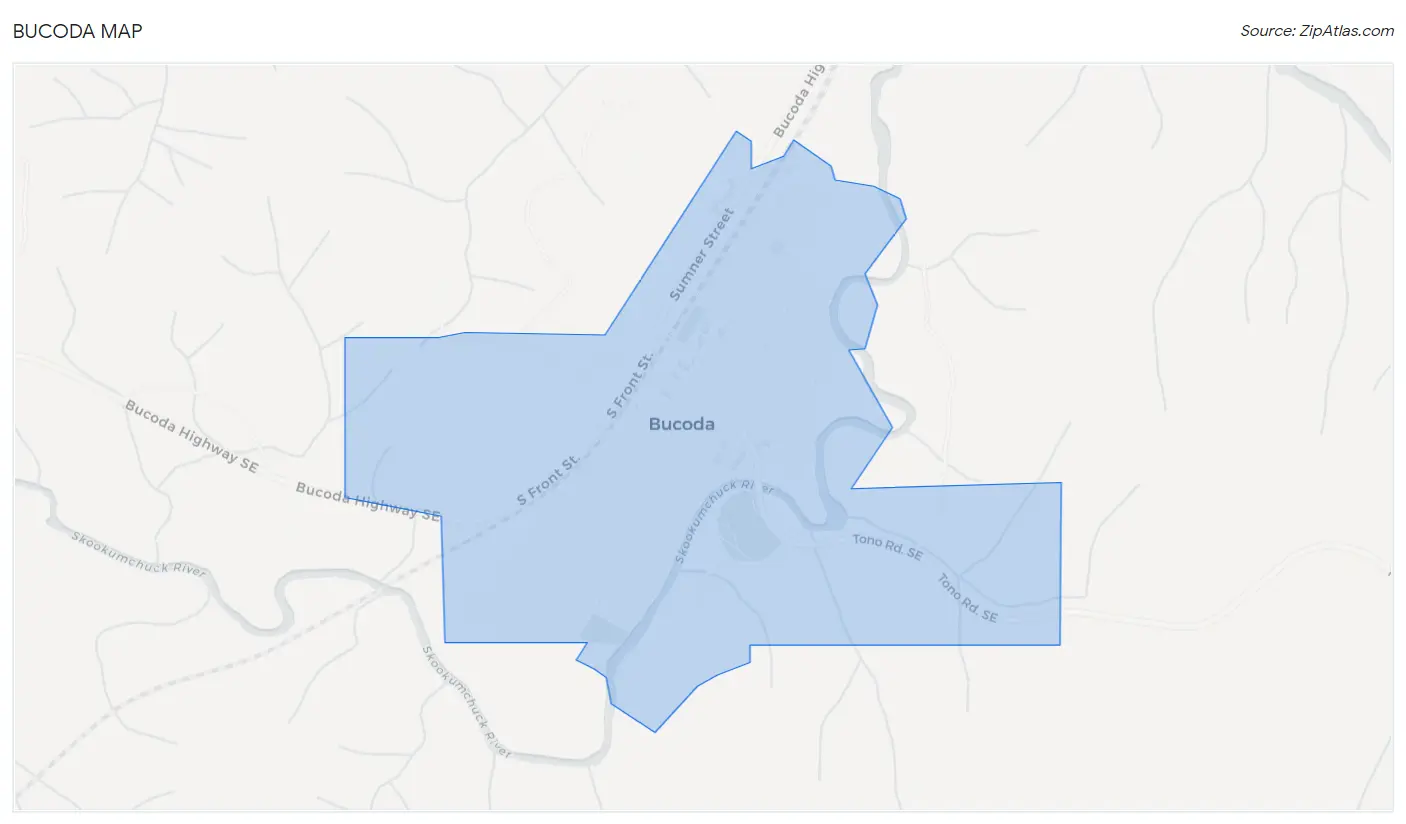
Bucoda Overview
$22,461
PER CAPITA INCOME
$61,406
AVG FAMILY INCOME
$62,188
AVG HOUSEHOLD INCOME
2.8%
WAGE / INCOME GAP [ % ]
97.2¢/ $1
WAGE / INCOME GAP [ $ ]
0.32
INEQUALITY / GINI INDEX
564
TOTAL POPULATION
274
MALE POPULATION
290
FEMALE POPULATION
94.48
MALES / 100 FEMALES
105.84
FEMALES / 100 MALES
36.0
MEDIAN AGE
2.8
AVG FAMILY SIZE
3.0
AVG HOUSEHOLD SIZE
233
LABOR FORCE [ PEOPLE ]
56.0%
PERCENT IN LABOR FORCE
10.3%
UNEMPLOYMENT RATE
Bucoda Zip Codes
Bucoda Area Codes
Income in Bucoda
Income Overview in Bucoda
Per Capita Income in Bucoda is $22,461, while median incomes of families and households are $61,406 and $62,188 respectively.
| Characteristic | Number | Measure |
| Per Capita Income | 564 | $22,461 |
| Median Family Income | 147 | $61,406 |
| Mean Family Income | 147 | $63,793 |
| Median Household Income | 186 | $62,188 |
| Mean Household Income | 186 | $67,533 |
| Income Deficit | 147 | $0 |
| Wage / Income Gap (%) | 564 | 2.82% |
| Wage / Income Gap ($) | 564 | 97.18¢ per $1 |
| Gini / Inequality Index | 564 | 0.32 |
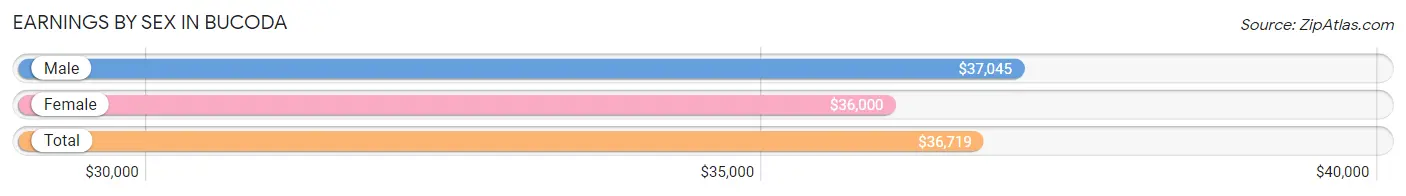
Earnings by Sex in Bucoda
Average Earnings in Bucoda are $36,719, $37,045 for men and $36,000 for women, a difference of 2.8%.
| Sex | Number | Average Earnings |
| Male | 120 (53.1%) | $37,045 |
| Female | 106 (46.9%) | $36,000 |
| Total | 226 (100.0%) | $36,719 |
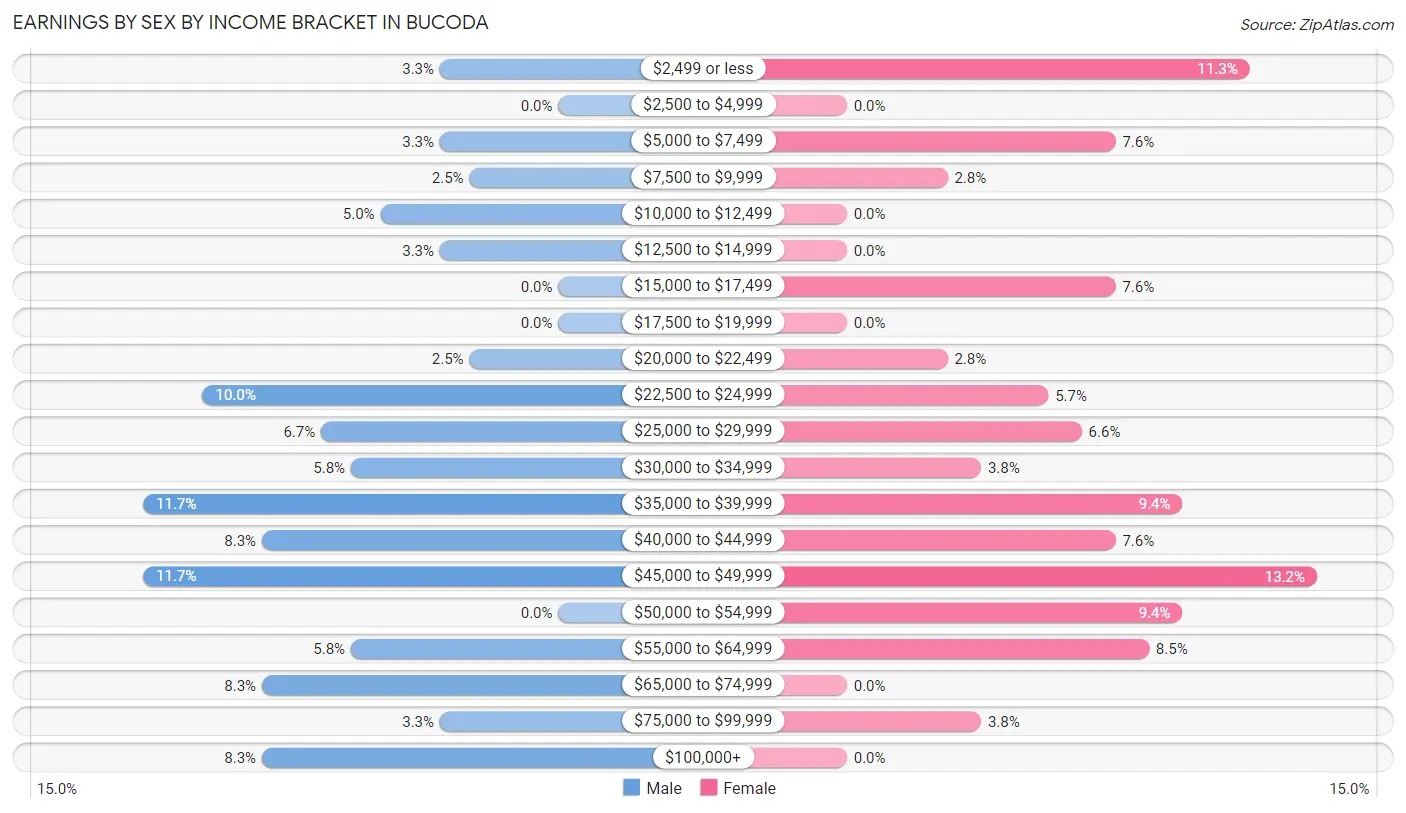
Earnings by Sex by Income Bracket in Bucoda
The most common earnings brackets in Bucoda are $35,000 to $39,999 for men (14 | 11.7%) and $45,000 to $49,999 for women (14 | 13.2%).
| Income | Male | Female |
| $2,499 or less | 4 (3.3%) | 12 (11.3%) |
| $2,500 to $4,999 | 0 (0.0%) | 0 (0.0%) |
| $5,000 to $7,499 | 4 (3.3%) | 8 (7.5%) |
| $7,500 to $9,999 | 3 (2.5%) | 3 (2.8%) |
| $10,000 to $12,499 | 6 (5.0%) | 0 (0.0%) |
| $12,500 to $14,999 | 4 (3.3%) | 0 (0.0%) |
| $15,000 to $17,499 | 0 (0.0%) | 8 (7.5%) |
| $17,500 to $19,999 | 0 (0.0%) | 0 (0.0%) |
| $20,000 to $22,499 | 3 (2.5%) | 3 (2.8%) |
| $22,500 to $24,999 | 12 (10.0%) | 6 (5.7%) |
| $25,000 to $29,999 | 8 (6.7%) | 7 (6.6%) |
| $30,000 to $34,999 | 7 (5.8%) | 4 (3.8%) |
| $35,000 to $39,999 | 14 (11.7%) | 10 (9.4%) |
| $40,000 to $44,999 | 10 (8.3%) | 8 (7.5%) |
| $45,000 to $49,999 | 14 (11.7%) | 14 (13.2%) |
| $50,000 to $54,999 | 0 (0.0%) | 10 (9.4%) |
| $55,000 to $64,999 | 7 (5.8%) | 9 (8.5%) |
| $65,000 to $74,999 | 10 (8.3%) | 0 (0.0%) |
| $75,000 to $99,999 | 4 (3.3%) | 4 (3.8%) |
| $100,000+ | 10 (8.3%) | 0 (0.0%) |
| Total | 120 (100.0%) | 106 (100.0%) |
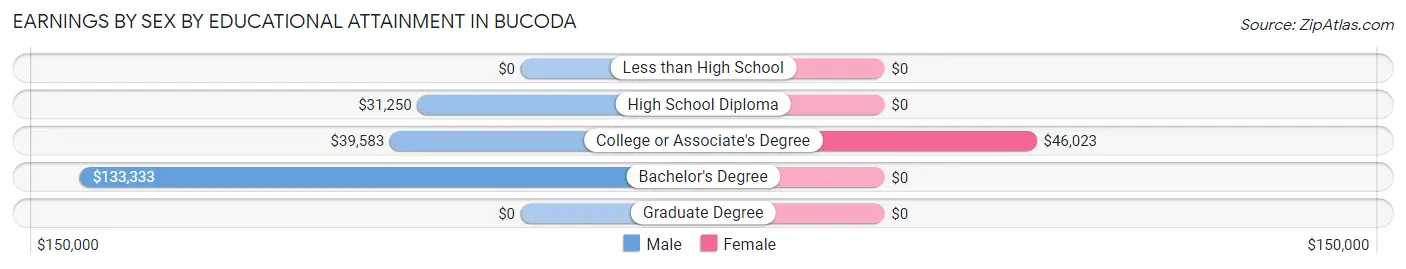
Earnings by Sex by Educational Attainment in Bucoda
Average earnings in Bucoda are $38,750 for men and $38,250 for women, a difference of 1.3%. Men with an educational attainment of bachelor's degree enjoy the highest average annual earnings of $133,333, while those with high school diploma education earn the least with $31,250. Women with an educational attainment of college or associate's degree earn the most with the average annual earnings of $46,023, while those with college or associate's degree education have the smallest earnings of $46,023.
| Educational Attainment | Male Income | Female Income |
| Less than High School | - | - |
| High School Diploma | $31,250 | $0 |
| College or Associate's Degree | $39,583 | $46,023 |
| Bachelor's Degree | $133,333 | $0 |
| Graduate Degree | - | - |
| Total | $38,750 | $38,250 |
Family Income in Bucoda
Family Income Brackets in Bucoda
According to the Bucoda family income data, there are 40 families falling into the $15,000 to $24,999 income range, which is the most common income bracket and makes up 27.2% of all families. Conversely, the $35,000 to $49,999 income bracket is the least frequent group with only 3 families (2.0%) belonging to this category.
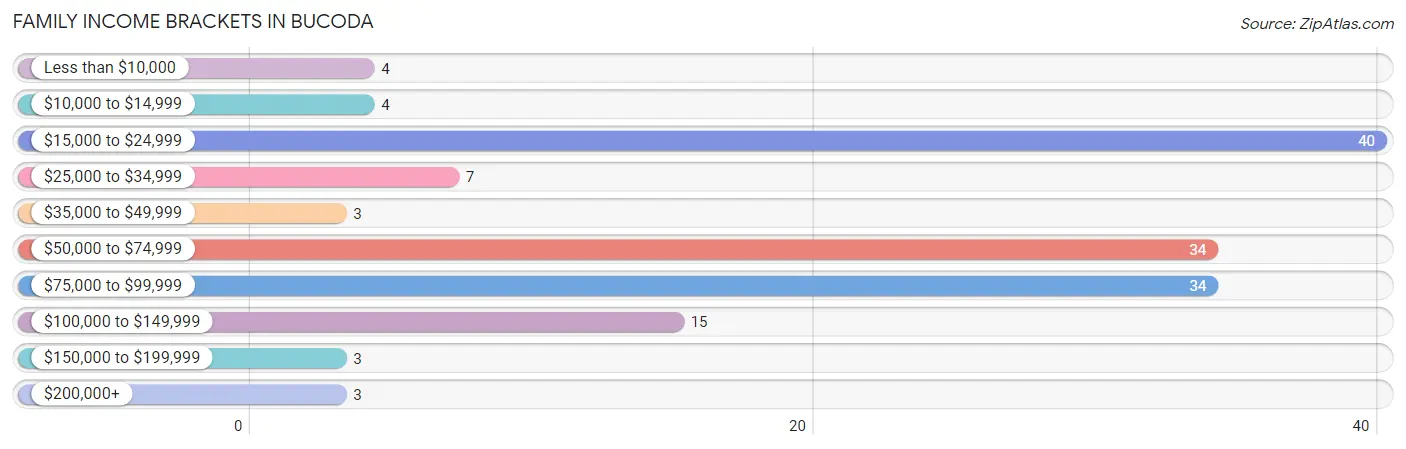
| Income Bracket | # Families | % Families |
| Less than $10,000 | 4 | 2.7% |
| $10,000 to $14,999 | 4 | 2.7% |
| $15,000 to $24,999 | 40 | 27.2% |
| $25,000 to $34,999 | 7 | 4.8% |
| $35,000 to $49,999 | 3 | 2.0% |
| $50,000 to $74,999 | 34 | 23.1% |
| $75,000 to $99,999 | 34 | 23.1% |
| $100,000 to $149,999 | 15 | 10.2% |
| $150,000 to $199,999 | 3 | 2.0% |
| $200,000+ | 3 | 2.0% |
Family Income by Famaliy Size in Bucoda
4-person families (22 | 15.0%) account for the highest median family income in Bucoda with $88,000 per family, while 2-person families (75 | 51.0%) have the highest median income of $35,625 per family member.
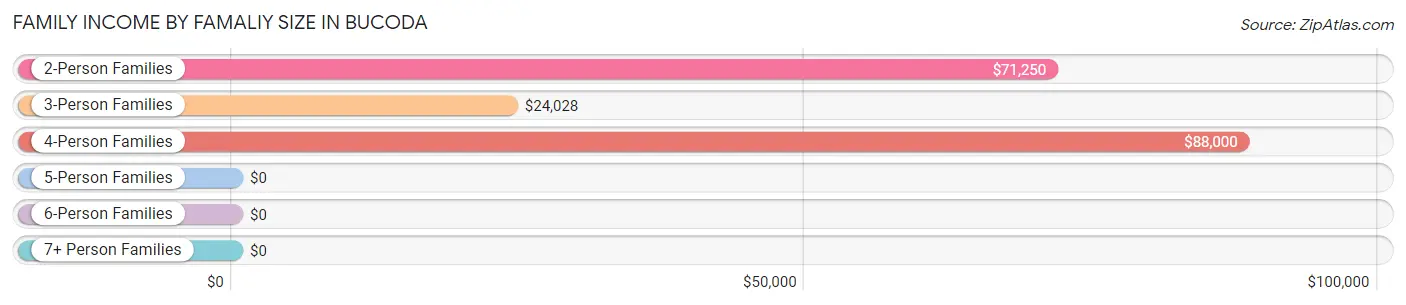
| Income Bracket | # Families | Median Income |
| 2-Person Families | 75 (51.0%) | $71,250 |
| 3-Person Families | 37 (25.2%) | $24,028 |
| 4-Person Families | 22 (15.0%) | $88,000 |
| 5-Person Families | 7 (4.8%) | $0 |
| 6-Person Families | 6 (4.1%) | $0 |
| 7+ Person Families | 0 (0.0%) | $0 |
| Total | 147 (100.0%) | $61,406 |
Family Income by Number of Earners in Bucoda
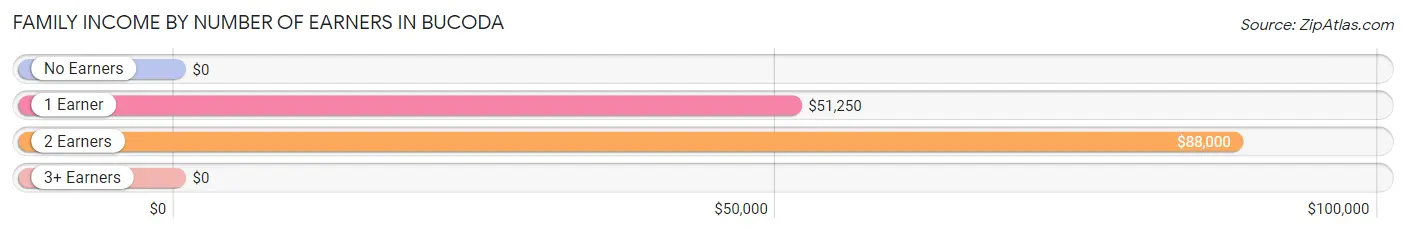
| Number of Earners | # Families | Median Income |
| No Earners | 35 (23.8%) | $0 |
| 1 Earner | 70 (47.6%) | $51,250 |
| 2 Earners | 42 (28.6%) | $88,000 |
| 3+ Earners | 0 (0.0%) | $0 |
| Total | 147 (100.0%) | $61,406 |
Household Income in Bucoda
Household Income Brackets in Bucoda
With 48 households falling in the category, the $50,000 to $74,999 income range is the most frequent in Bucoda, accounting for 25.8% of all households.
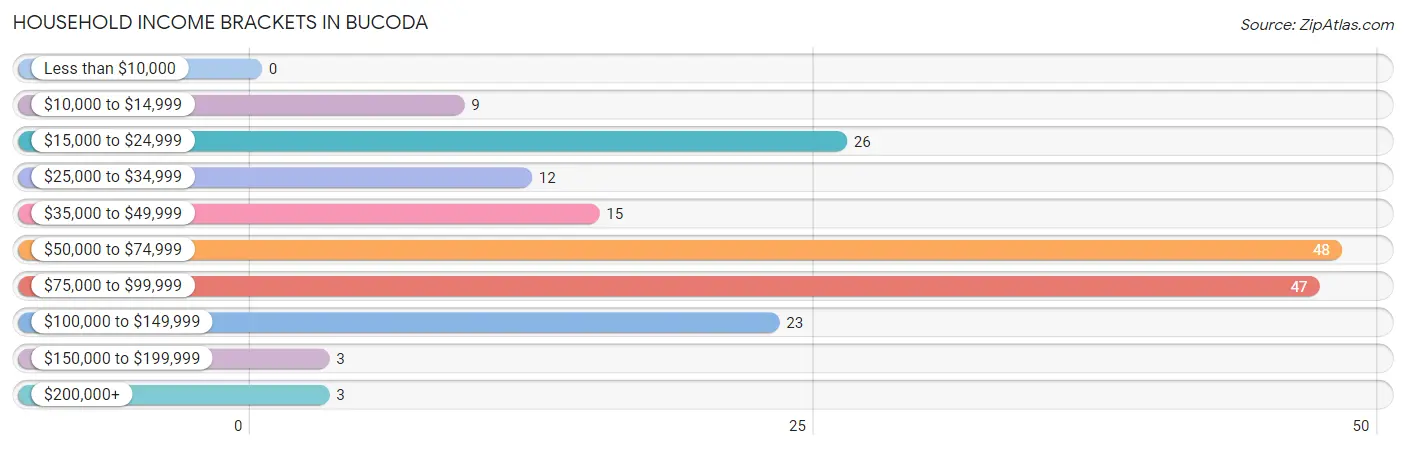
| Income Bracket | # Households | % Households |
| Less than $10,000 | 0 | 0.0% |
| $10,000 to $14,999 | 9 | 4.8% |
| $15,000 to $24,999 | 26 | 14.0% |
| $25,000 to $34,999 | 12 | 6.5% |
| $35,000 to $49,999 | 15 | 8.1% |
| $50,000 to $74,999 | 48 | 25.8% |
| $75,000 to $99,999 | 47 | 25.3% |
| $100,000 to $149,999 | 23 | 12.4% |
| $150,000 to $199,999 | 3 | 1.6% |
| $200,000+ | 3 | 1.6% |
Household Income by Householder Age in Bucoda
The median household income in Bucoda is $62,188, with the highest median household income of $73,438 found in the 25 to 44 years age bracket for the primary householder. A total of 69 households (37.1%) fall into this category. Meanwhile, the 15 to 24 years age bracket for the primary householder has the lowest median household income of $0, with 4 households (2.1%) in this group.
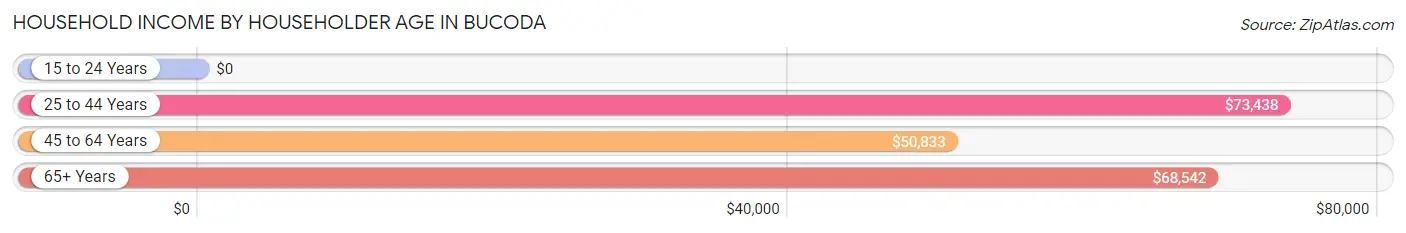
| Income Bracket | # Households | Median Income |
| 15 to 24 Years | 4 (2.1%) | $0 |
| 25 to 44 Years | 69 (37.1%) | $73,438 |
| 45 to 64 Years | 62 (33.3%) | $50,833 |
| 65+ Years | 51 (27.4%) | $68,542 |
| Total | 186 (100.0%) | $62,188 |
Poverty in Bucoda
Income Below Poverty by Sex and Age in Bucoda
With 25.4% poverty level for males and 40.0% for females among the residents of Bucoda, 5 year old males and 12 to 14 year old females are the most vulnerable to poverty, with 3 males (100.0%) and 7 females (100.0%) in their respective age groups living below the poverty level.
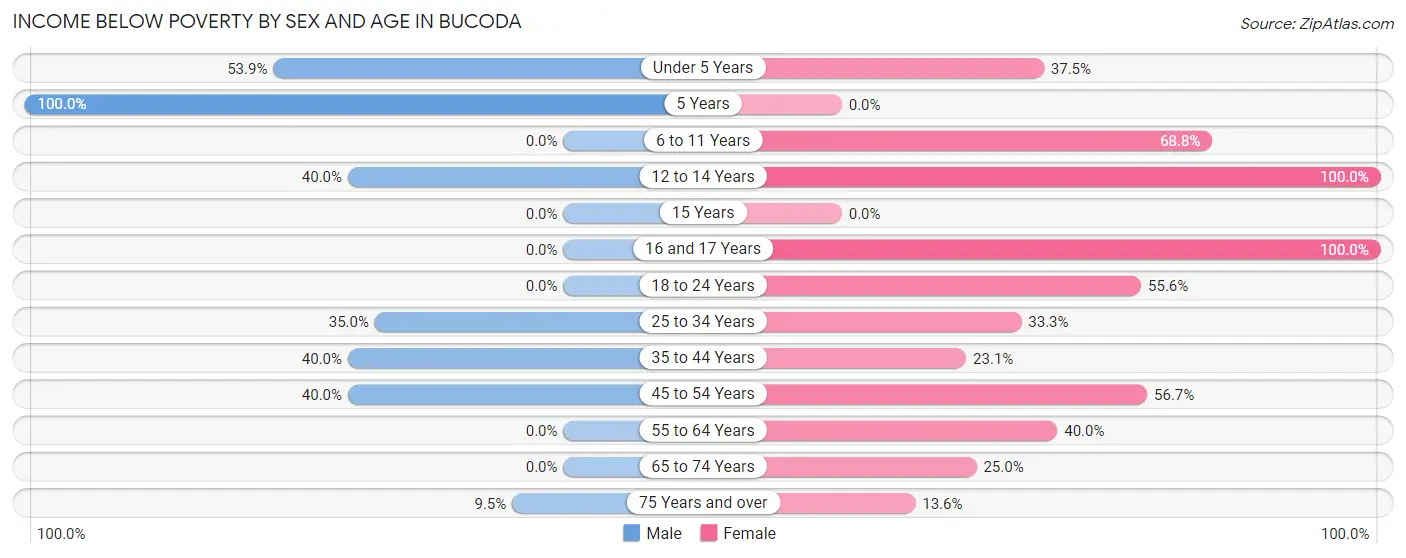
| Age Bracket | Male | Female |
| Under 5 Years | 7 (53.8%) | 9 (37.5%) |
| 5 Years | 3 (100.0%) | 0 (0.0%) |
| 6 to 11 Years | 0 (0.0%) | 22 (68.8%) |
| 12 to 14 Years | 8 (40.0%) | 7 (100.0%) |
| 15 Years | 0 (0.0%) | 0 (0.0%) |
| 16 and 17 Years | 0 (0.0%) | 3 (100.0%) |
| 18 to 24 Years | 0 (0.0%) | 5 (55.6%) |
| 25 to 34 Years | 14 (35.0%) | 19 (33.3%) |
| 35 to 44 Years | 24 (40.0%) | 9 (23.1%) |
| 45 to 54 Years | 8 (40.0%) | 17 (56.7%) |
| 55 to 64 Years | 0 (0.0%) | 12 (40.0%) |
| 65 to 74 Years | 0 (0.0%) | 6 (25.0%) |
| 75 Years and over | 2 (9.5%) | 3 (13.6%) |
| Total | 66 (25.4%) | 112 (40.0%) |
Income Above Poverty by Sex and Age in Bucoda
According to the poverty statistics in Bucoda, males aged 6 to 11 years and females aged 15 years are the age groups that are most secure financially, with 100.0% of males and 100.0% of females in these age groups living above the poverty line.
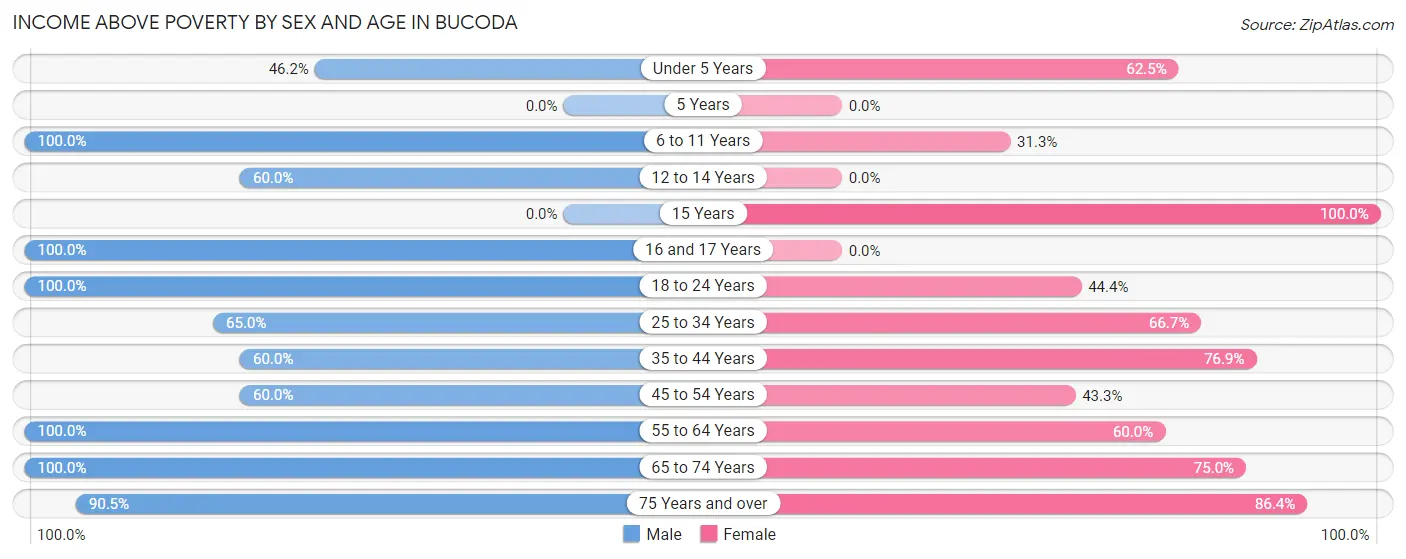
| Age Bracket | Male | Female |
| Under 5 Years | 6 (46.2%) | 15 (62.5%) |
| 5 Years | 0 (0.0%) | 0 (0.0%) |
| 6 to 11 Years | 22 (100.0%) | 10 (31.2%) |
| 12 to 14 Years | 12 (60.0%) | 0 (0.0%) |
| 15 Years | 0 (0.0%) | 3 (100.0%) |
| 16 and 17 Years | 7 (100.0%) | 0 (0.0%) |
| 18 to 24 Years | 13 (100.0%) | 4 (44.4%) |
| 25 to 34 Years | 26 (65.0%) | 38 (66.7%) |
| 35 to 44 Years | 36 (60.0%) | 30 (76.9%) |
| 45 to 54 Years | 12 (60.0%) | 13 (43.3%) |
| 55 to 64 Years | 23 (100.0%) | 18 (60.0%) |
| 65 to 74 Years | 18 (100.0%) | 18 (75.0%) |
| 75 Years and over | 19 (90.5%) | 19 (86.4%) |
| Total | 194 (74.6%) | 168 (60.0%) |
Income Below Poverty Among Married-Couple Families in Bucoda
The poverty statistics for married-couple families in Bucoda show that 12.5% or 11 of the total 88 families live below the poverty line. Families with 1 or 2 children have the highest poverty rate of 20.0%, comprising of 4 families. On the other hand, families with 3 or 4 children have the lowest poverty rate of 0.0%, which includes 0 families.
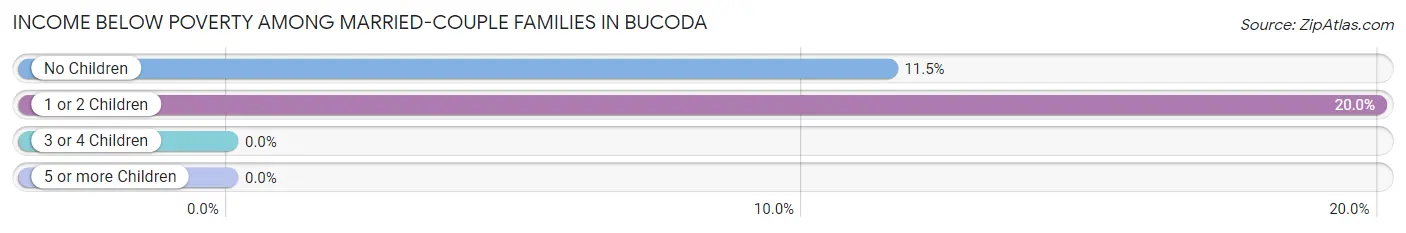
| Children | Above Poverty | Below Poverty |
| No Children | 54 (88.5%) | 7 (11.5%) |
| 1 or 2 Children | 16 (80.0%) | 4 (20.0%) |
| 3 or 4 Children | 7 (100.0%) | 0 (0.0%) |
| 5 or more Children | 0 (0.0%) | 0 (0.0%) |
| Total | 77 (87.5%) | 11 (12.5%) |
Income Below Poverty Among Single-Parent Households in Bucoda
According to the poverty data in Bucoda, 40.0% or 6 single-father households and 61.4% or 27 single-mother households are living below the poverty line. Among single-father households, those with 1 or 2 children have the highest poverty rate, with 6 households (50.0%) experiencing poverty. Likewise, among single-mother households, those with 3 or 4 children have the highest poverty rate, with 3 households (100.0%) falling below the poverty line.
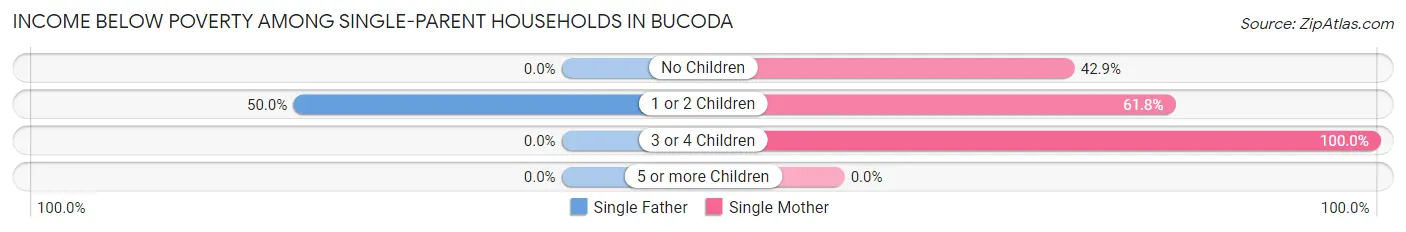
| Children | Single Father | Single Mother |
| No Children | 0 (0.0%) | 3 (42.9%) |
| 1 or 2 Children | 6 (50.0%) | 21 (61.8%) |
| 3 or 4 Children | 0 (0.0%) | 3 (100.0%) |
| 5 or more Children | 0 (0.0%) | 0 (0.0%) |
| Total | 6 (40.0%) | 27 (61.4%) |
Income Below Poverty Among Married-Couple vs Single-Parent Households in Bucoda
The poverty data for Bucoda shows that 11 of the married-couple family households (12.5%) and 33 of the single-parent households (55.9%) are living below the poverty level. Within the married-couple family households, those with 1 or 2 children have the highest poverty rate, with 4 households (20.0%) falling below the poverty line. Among the single-parent households, those with 3 or 4 children have the highest poverty rate, with 3 household (100.0%) living below poverty.
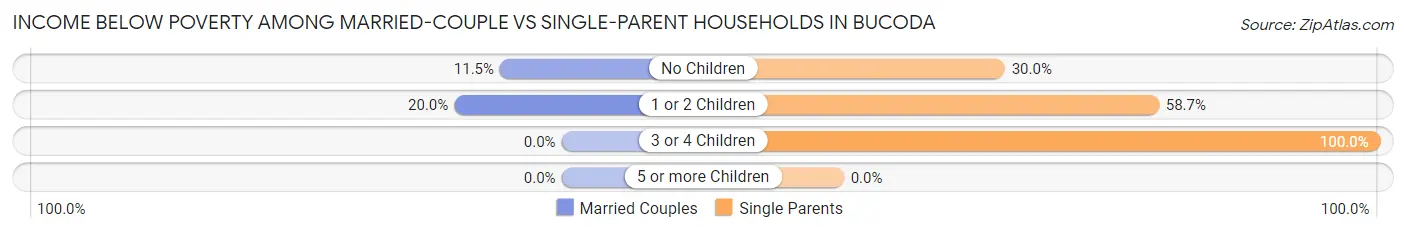
| Children | Married-Couple Families | Single-Parent Households |
| No Children | 7 (11.5%) | 3 (30.0%) |
| 1 or 2 Children | 4 (20.0%) | 27 (58.7%) |
| 3 or 4 Children | 0 (0.0%) | 3 (100.0%) |
| 5 or more Children | 0 (0.0%) | 0 (0.0%) |
| Total | 11 (12.5%) | 33 (55.9%) |
Race in Bucoda
The most populous races in Bucoda are White / Caucasian (521 | 92.4%), Two or more Races (38 | 6.7%), and Hispanic or Latino (18 | 3.2%).
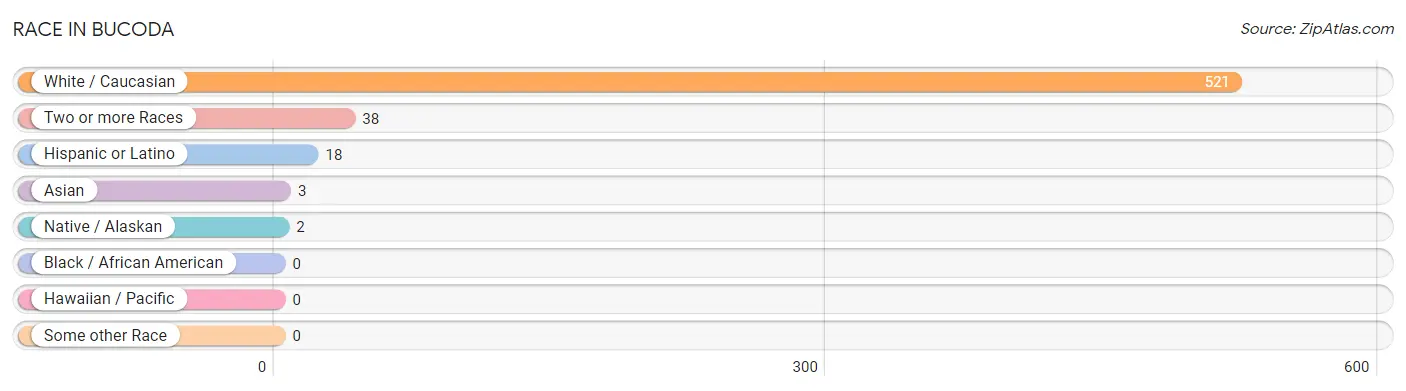
| Race | # Population | % Population |
| Asian | 3 | 0.5% |
| Black / African American | 0 | 0.0% |
| Hawaiian / Pacific | 0 | 0.0% |
| Hispanic or Latino | 18 | 3.2% |
| Native / Alaskan | 2 | 0.4% |
| White / Caucasian | 521 | 92.4% |
| Two or more Races | 38 | 6.7% |
| Some other Race | 0 | 0.0% |
| Total | 564 | 100.0% |
Ancestry in Bucoda
The most populous ancestries reported in Bucoda are Irish (140 | 24.8%), English (105 | 18.6%), German (74 | 13.1%), Norwegian (29 | 5.1%), and Dutch (25 | 4.4%), together accounting for 66.1% of all Bucoda residents.
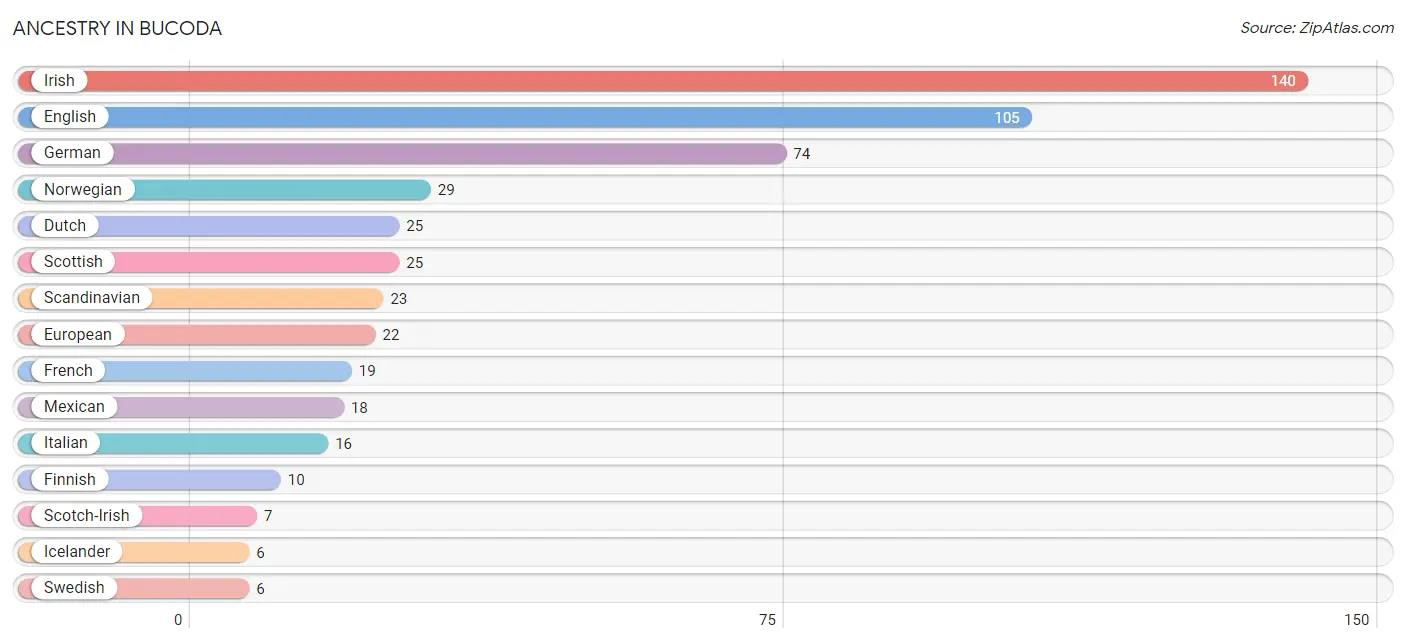
| Ancestry | # Population | % Population |
| British | 3 | 0.5% |
| Burmese | 3 | 0.5% |
| Canadian | 4 | 0.7% |
| Cherokee | 5 | 0.9% |
| Colville | 2 | 0.4% |
| Danish | 4 | 0.7% |
| Dutch | 25 | 4.4% |
| English | 105 | 18.6% |
| European | 22 | 3.9% |
| Finnish | 10 | 1.8% |
| French | 19 | 3.4% |
| German | 74 | 13.1% |
| Icelander | 6 | 1.1% |
| Irish | 140 | 24.8% |
| Italian | 16 | 2.8% |
| Mexican | 18 | 3.2% |
| Norwegian | 29 | 5.1% |
| Russian | 4 | 0.7% |
| Scandinavian | 23 | 4.1% |
| Scotch-Irish | 7 | 1.2% |
| Scottish | 25 | 4.4% |
| Sioux | 5 | 0.9% |
| Swedish | 6 | 1.1% | View All 23 Rows |
Immigrants in Bucoda
The most numerous immigrant groups reported in Bucoda came from Canada (6 | 1.1%), Central America (3 | 0.5%), Latin America (3 | 0.5%), and Mexico (3 | 0.5%), together accounting for 2.6% of all Bucoda residents.
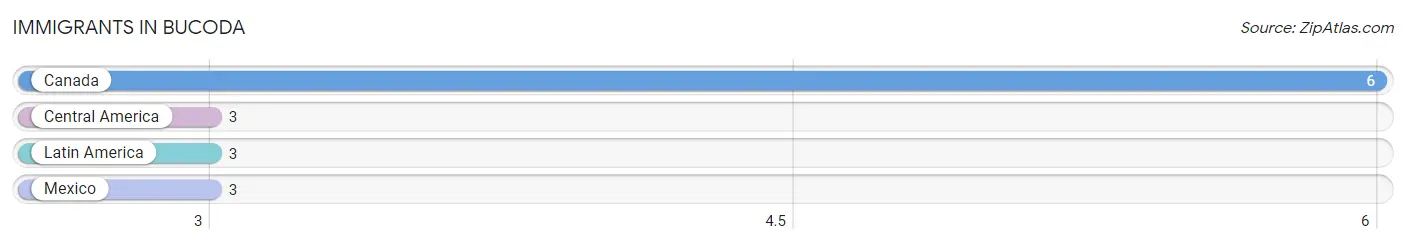
| Immigration Origin | # Population | % Population |
| Canada | 6 | 1.1% |
| Central America | 3 | 0.5% |
| Latin America | 3 | 0.5% |
| Mexico | 3 | 0.5% | View All 4 Rows |
Sex and Age in Bucoda
Sex and Age in Bucoda
The most populous age groups in Bucoda are 10 to 14 Years (33 | 12.0%) for men and Under 5 Years (34 | 11.7%) for women.
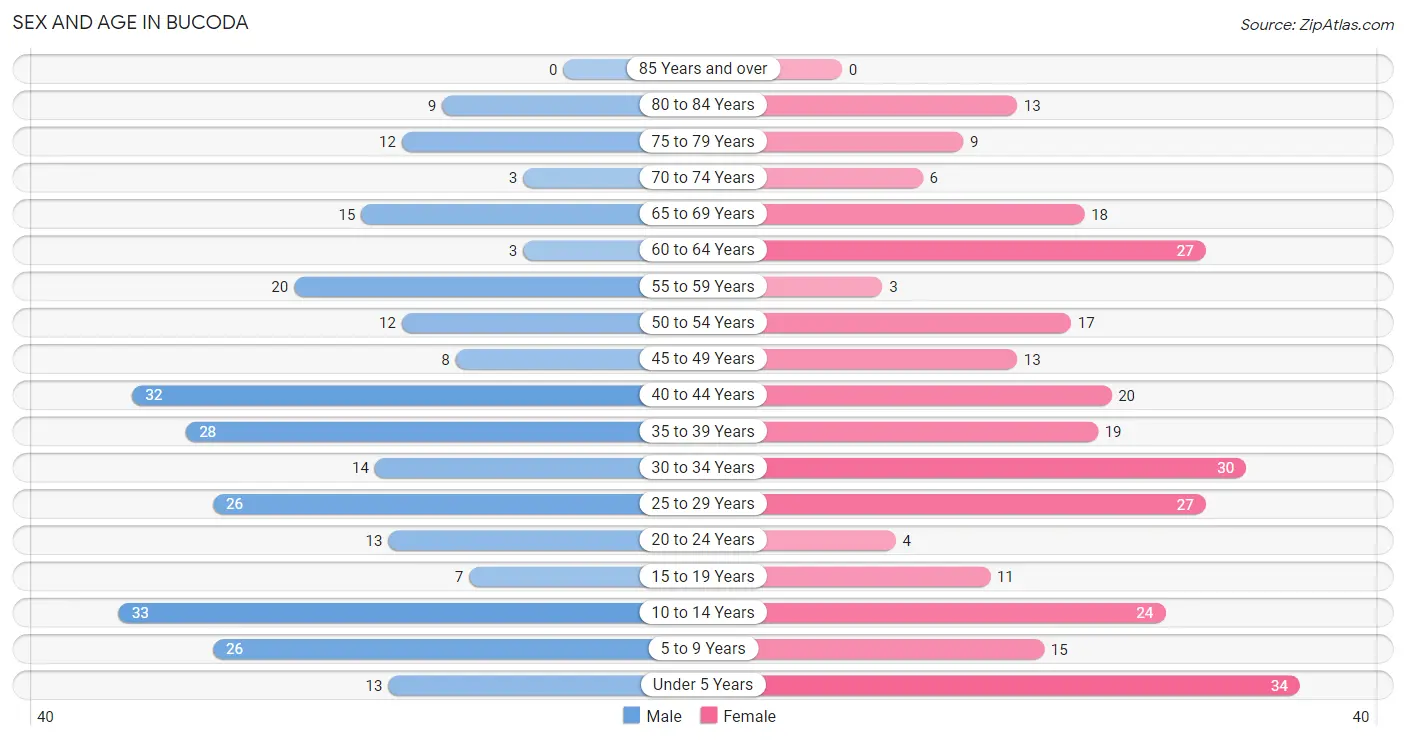
| Age Bracket | Male | Female |
| Under 5 Years | 13 (4.7%) | 34 (11.7%) |
| 5 to 9 Years | 26 (9.5%) | 15 (5.2%) |
| 10 to 14 Years | 33 (12.0%) | 24 (8.3%) |
| 15 to 19 Years | 7 (2.5%) | 11 (3.8%) |
| 20 to 24 Years | 13 (4.7%) | 4 (1.4%) |
| 25 to 29 Years | 26 (9.5%) | 27 (9.3%) |
| 30 to 34 Years | 14 (5.1%) | 30 (10.3%) |
| 35 to 39 Years | 28 (10.2%) | 19 (6.6%) |
| 40 to 44 Years | 32 (11.7%) | 20 (6.9%) |
| 45 to 49 Years | 8 (2.9%) | 13 (4.5%) |
| 50 to 54 Years | 12 (4.4%) | 17 (5.9%) |
| 55 to 59 Years | 20 (7.3%) | 3 (1.0%) |
| 60 to 64 Years | 3 (1.1%) | 27 (9.3%) |
| 65 to 69 Years | 15 (5.5%) | 18 (6.2%) |
| 70 to 74 Years | 3 (1.1%) | 6 (2.1%) |
| 75 to 79 Years | 12 (4.4%) | 9 (3.1%) |
| 80 to 84 Years | 9 (3.3%) | 13 (4.5%) |
| 85 Years and over | 0 (0.0%) | 0 (0.0%) |
| Total | 274 (100.0%) | 290 (100.0%) |
Families and Households in Bucoda
Median Family Size in Bucoda
The median family size in Bucoda is 2.83 persons per family, with single male/father families (15 | 10.2%) accounting for the largest median family size of 3.2 persons per family. On the other hand, married-couple families (88 | 59.9%) represent the smallest median family size with 2.65 persons per family.
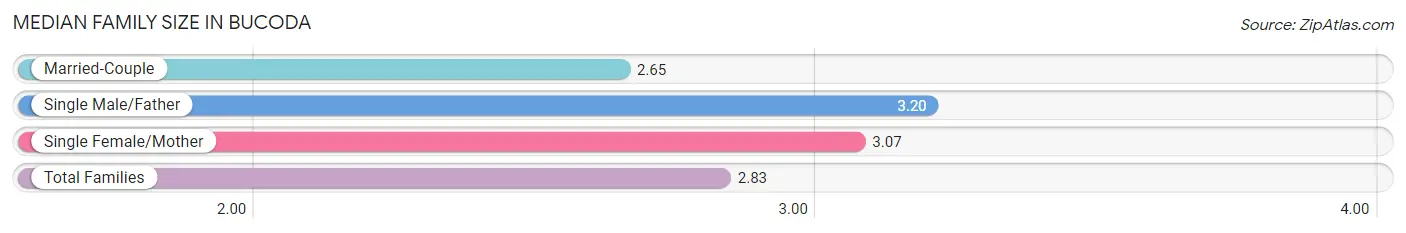
| Family Type | # Families | Family Size |
| Married-Couple | 88 (59.9%) | 2.65 |
| Single Male/Father | 15 (10.2%) | 3.20 |
| Single Female/Mother | 44 (29.9%) | 3.07 |
| Total Families | 147 (100.0%) | 2.83 |
Median Household Size in Bucoda
The median household size in Bucoda is 3.03 persons per household, with single male/father households (15 | 8.1%) accounting for the largest median household size of 7.07 persons per household. non-family households (39 | 21.0%) represent the smallest median household size with 1.82 persons per household.
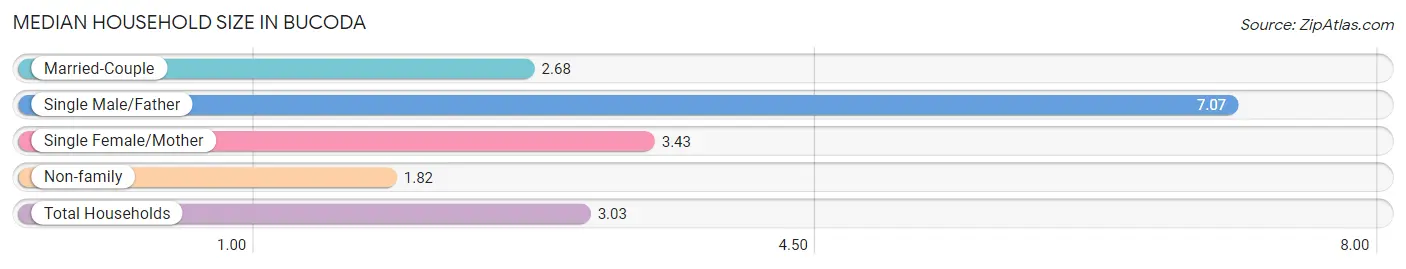
| Household Type | # Households | Household Size |
| Married-Couple | 88 (47.3%) | 2.68 |
| Single Male/Father | 15 (8.1%) | 7.07 |
| Single Female/Mother | 44 (23.7%) | 3.43 |
| Non-family | 39 (21.0%) | 1.82 |
| Total Households | 186 (100.0%) | 3.03 |
Household Size by Marriage Status in Bucoda
Out of a total of 186 households in Bucoda, 147 (79.0%) are family households, while 39 (21.0%) are nonfamily households. The most numerous type of family households are 2-person households, comprising 64, and the most common type of nonfamily households are 1-person households, comprising 20.
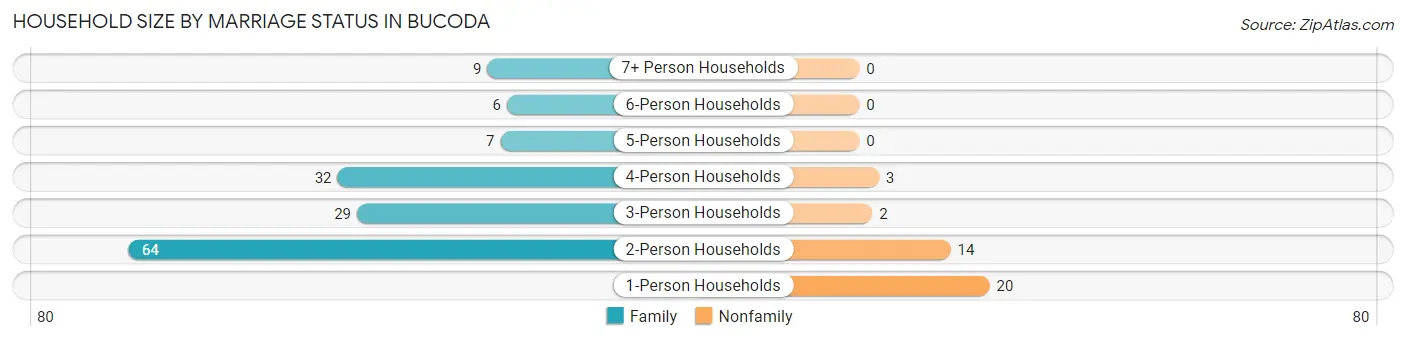
| Household Size | Family Households | Nonfamily Households |
| 1-Person Households | - | 20 (10.7%) |
| 2-Person Households | 64 (34.4%) | 14 (7.5%) |
| 3-Person Households | 29 (15.6%) | 2 (1.1%) |
| 4-Person Households | 32 (17.2%) | 3 (1.6%) |
| 5-Person Households | 7 (3.8%) | 0 (0.0%) |
| 6-Person Households | 6 (3.2%) | 0 (0.0%) |
| 7+ Person Households | 9 (4.8%) | 0 (0.0%) |
| Total | 147 (79.0%) | 39 (21.0%) |
Female Fertility in Bucoda
Fertility by Age in Bucoda
Average fertility rate in Bucoda is 95.0 births per 1,000 women. Women in the age bracket of 15 to 19 years have the highest fertility rate with 455.0 births per 1,000 women. Women in the age bracket of 20 to 34 years acount for 58.3% of all women with births.
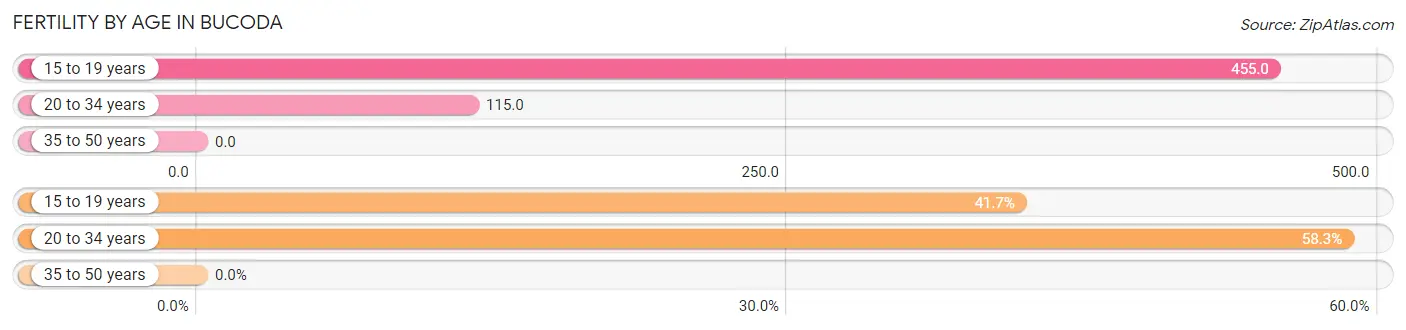
| Age Bracket | Women with Births | Births / 1,000 Women |
| 15 to 19 years | 5 (41.7%) | 455.0 |
| 20 to 34 years | 7 (58.3%) | 115.0 |
| 35 to 50 years | 0 (0.0%) | 0.0 |
| Total | 12 (100.0%) | 95.0 |
Fertility by Age by Marriage Status in Bucoda
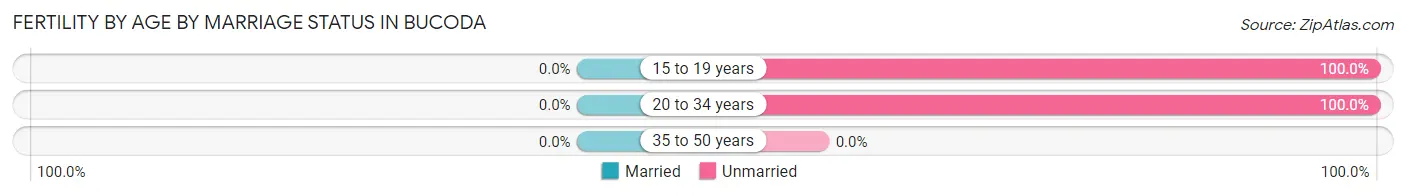
| Age Bracket | Married | Unmarried |
| 15 to 19 years | 0 (0.0%) | 5 (100.0%) |
| 20 to 34 years | 0 (0.0%) | 7 (100.0%) |
| 35 to 50 years | 0 (0.0%) | 0 (0.0%) |
| Total | 0 (0.0%) | 12 (100.0%) |
Fertility by Education in Bucoda
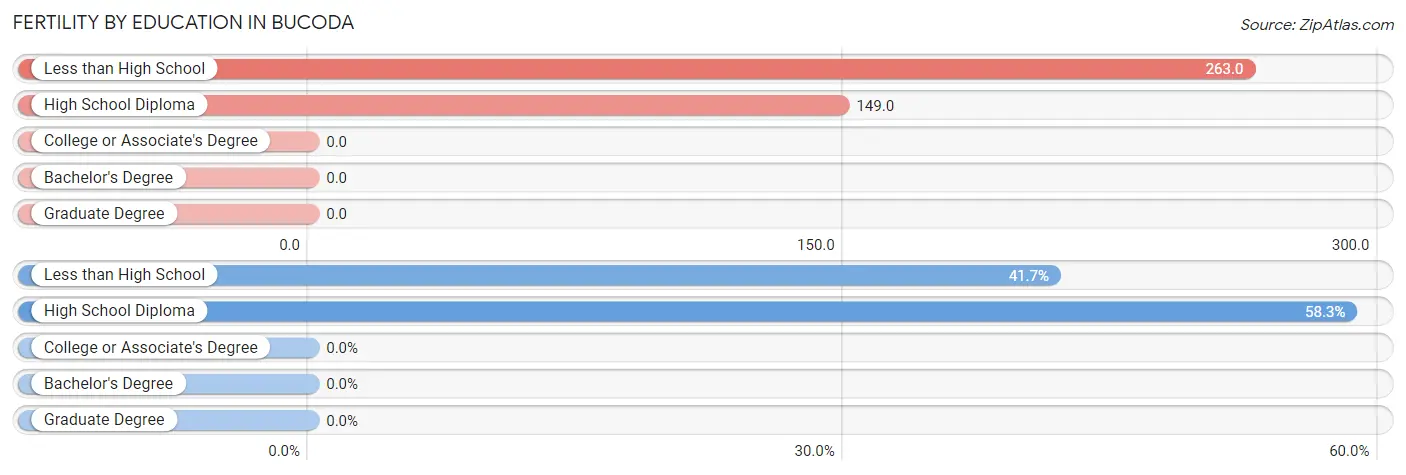
| Educational Attainment | Women with Births | Births / 1,000 Women |
| Less than High School | 5 (41.7%) | 263.0 |
| High School Diploma | 7 (58.3%) | 149.0 |
| College or Associate's Degree | 0 (0.0%) | 0.0 |
| Bachelor's Degree | 0 (0.0%) | 0.0 |
| Graduate Degree | 0 (0.0%) | 0.0 |
| Total | 12 (100.0%) | 95.0 |
Fertility by Education by Marriage Status in Bucoda
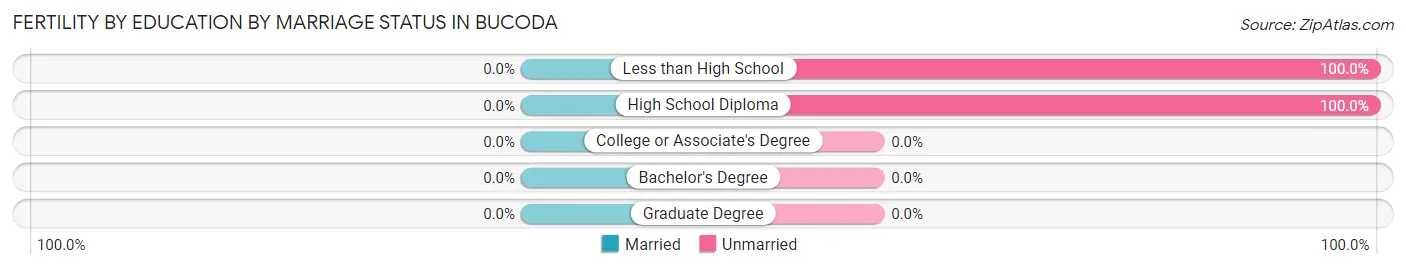
| Educational Attainment | Married | Unmarried |
| Less than High School | 0 (0.0%) | 5 (100.0%) |
| High School Diploma | 0 (0.0%) | 7 (100.0%) |
| College or Associate's Degree | 0 (0.0%) | 0 (0.0%) |
| Bachelor's Degree | 0 (0.0%) | 0 (0.0%) |
| Graduate Degree | 0 (0.0%) | 0 (0.0%) |
| Total | 0 (0.0%) | 12 (100.0%) |
Employment Characteristics in Bucoda
Employment by Class of Employer in Bucoda
Among the 209 employed individuals in Bucoda, private company employees (121 | 57.9%), state government employees (28 | 13.4%), and local government employees (18 | 8.6%) make up the most common classes of employment.
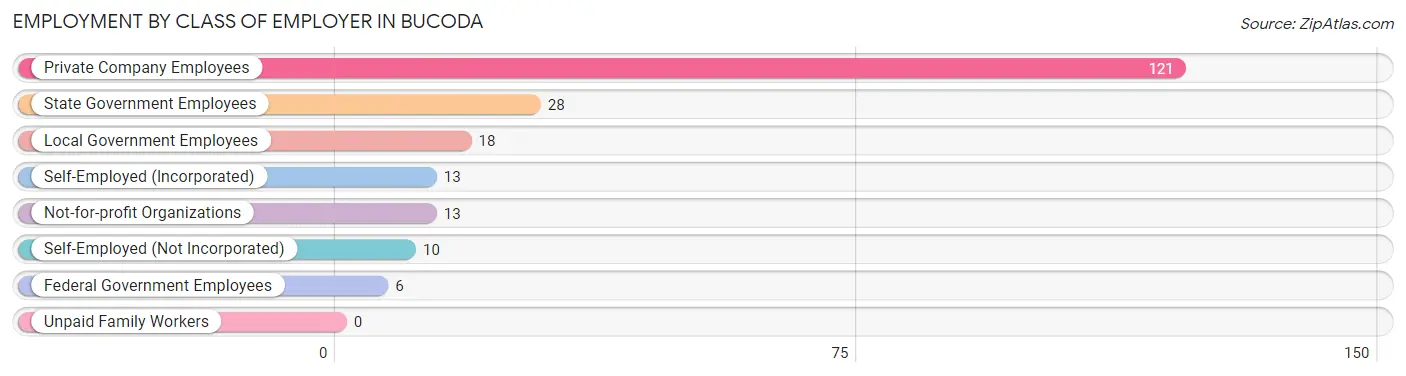
| Employer Class | # Employees | % Employees |
| Private Company Employees | 121 | 57.9% |
| Self-Employed (Incorporated) | 13 | 6.2% |
| Self-Employed (Not Incorporated) | 10 | 4.8% |
| Not-for-profit Organizations | 13 | 6.2% |
| Local Government Employees | 18 | 8.6% |
| State Government Employees | 28 | 13.4% |
| Federal Government Employees | 6 | 2.9% |
| Unpaid Family Workers | 0 | 0.0% |
| Total | 209 | 100.0% |
Employment Status by Age in Bucoda
According to the labor force statistics for Bucoda, out of the total population over 16 years of age (416), 56.0% or 233 individuals are in the labor force, with 10.3% or 24 of them unemployed. The age group with the highest labor force participation rate is 20 to 24 years, with 100.0% or 17 individuals in the labor force. Within the labor force, the 25 to 29 years age range has the highest percentage of unemployed individuals, with 47.2% or 17 of them being unemployed.
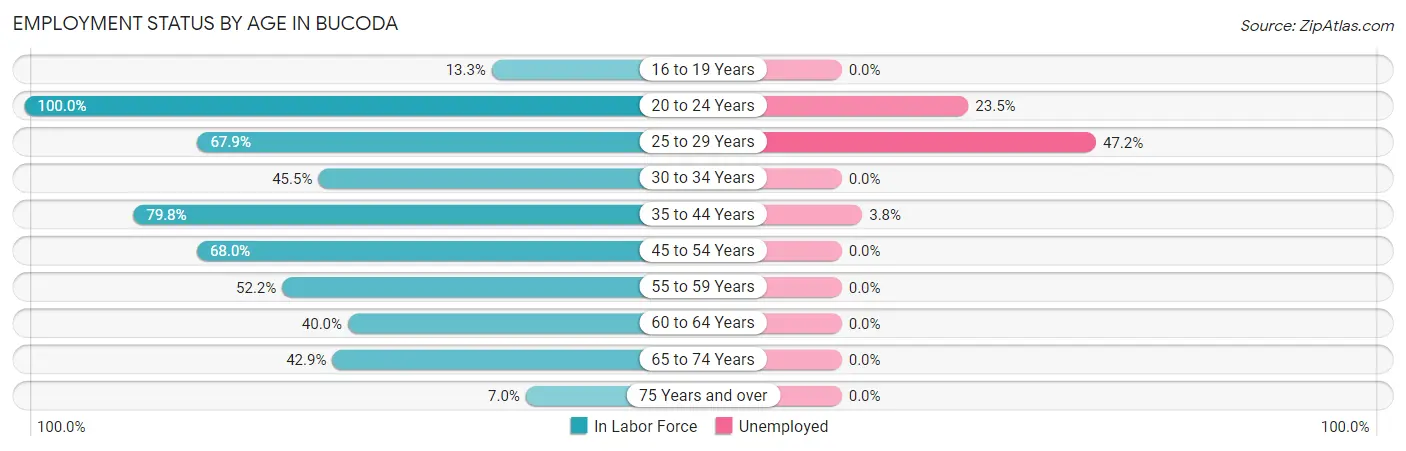
| Age Bracket | In Labor Force | Unemployed |
| 16 to 19 Years | 2 (13.3%) | 0 (0.0%) |
| 20 to 24 Years | 17 (100.0%) | 4 (23.5%) |
| 25 to 29 Years | 36 (67.9%) | 17 (47.2%) |
| 30 to 34 Years | 20 (45.5%) | 0 (0.0%) |
| 35 to 44 Years | 79 (79.8%) | 3 (3.8%) |
| 45 to 54 Years | 34 (68.0%) | 0 (0.0%) |
| 55 to 59 Years | 12 (52.2%) | 0 (0.0%) |
| 60 to 64 Years | 12 (40.0%) | 0 (0.0%) |
| 65 to 74 Years | 18 (42.9%) | 0 (0.0%) |
| 75 Years and over | 3 (7.0%) | 0 (0.0%) |
| Total | 233 (56.0%) | 24 (10.3%) |
Employment Status by Educational Attainment in Bucoda
According to labor force statistics for Bucoda, 64.5% of individuals (193) out of the total population between 25 and 64 years of age (299) are in the labor force, with 10.4% or 20 of them being unemployed. The group with the highest labor force participation rate are those with the educational attainment of bachelor's degree or higher, with 79.2% or 19 individuals in the labor force. Within the labor force, individuals with less than high school education have the highest percentage of unemployment, with 41.2% or 7 of them being unemployed.
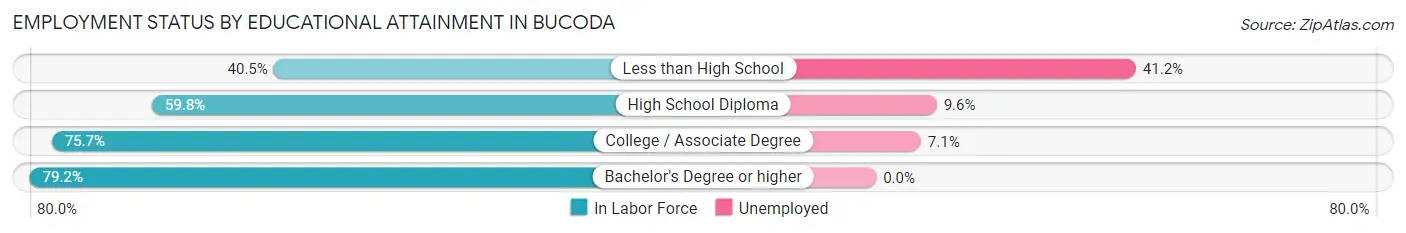
| Educational Attainment | In Labor Force | Unemployed |
| Less than High School | 17 (40.5%) | 17 (41.2%) |
| High School Diploma | 73 (59.8%) | 12 (9.6%) |
| College / Associate Degree | 84 (75.7%) | 8 (7.1%) |
| Bachelor's Degree or higher | 19 (79.2%) | 0 (0.0%) |
| Total | 193 (64.5%) | 31 (10.4%) |
Employment Occupations by Sex in Bucoda
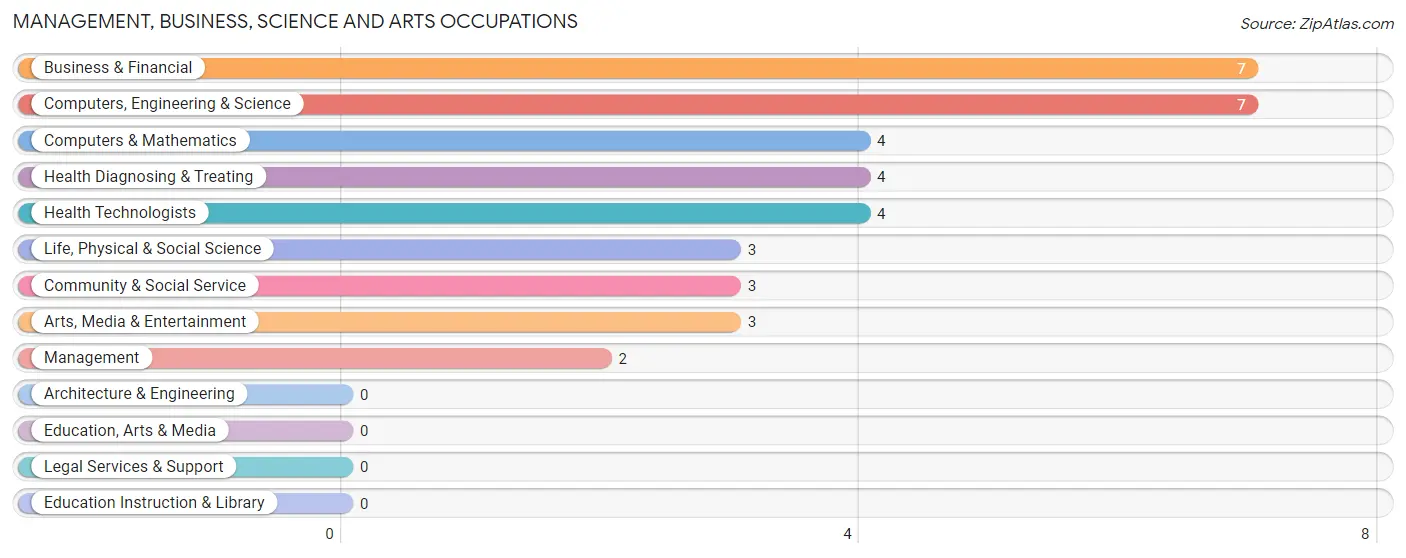
Management, Business, Science and Arts Occupations
The most common Management, Business, Science and Arts occupations in Bucoda are Business & Financial (7 | 3.4%), Computers, Engineering & Science (7 | 3.4%), Computers & Mathematics (4 | 1.9%), Health Diagnosing & Treating (4 | 1.9%), and Health Technologists (4 | 1.9%).
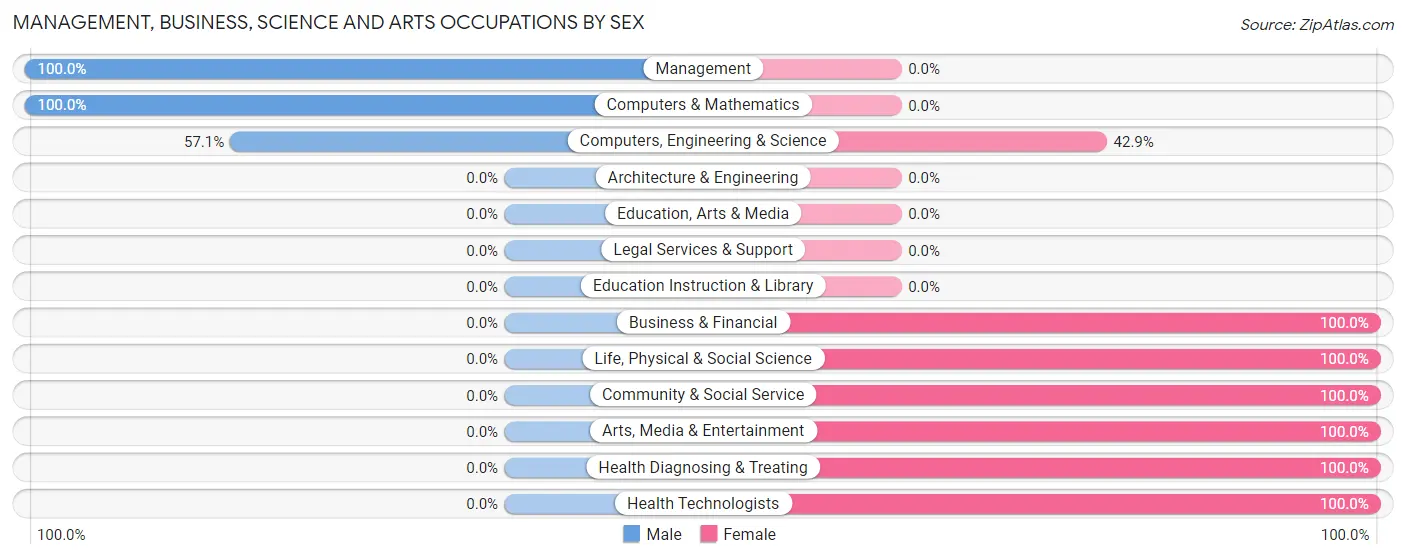
Management, Business, Science and Arts Occupations by Sex
Within the Management, Business, Science and Arts occupations in Bucoda, the most male-oriented occupations are Management (100.0%), Computers & Mathematics (100.0%), and Computers, Engineering & Science (57.1%), while the most female-oriented occupations are Business & Financial (100.0%), Life, Physical & Social Science (100.0%), and Community & Social Service (100.0%).
| Occupation | Male | Female |
| Management | 2 (100.0%) | 0 (0.0%) |
| Business & Financial | 0 (0.0%) | 7 (100.0%) |
| Computers, Engineering & Science | 4 (57.1%) | 3 (42.9%) |
| Computers & Mathematics | 4 (100.0%) | 0 (0.0%) |
| Architecture & Engineering | 0 (0.0%) | 0 (0.0%) |
| Life, Physical & Social Science | 0 (0.0%) | 3 (100.0%) |
| Community & Social Service | 0 (0.0%) | 3 (100.0%) |
| Education, Arts & Media | 0 (0.0%) | 0 (0.0%) |
| Legal Services & Support | 0 (0.0%) | 0 (0.0%) |
| Education Instruction & Library | 0 (0.0%) | 0 (0.0%) |
| Arts, Media & Entertainment | 0 (0.0%) | 3 (100.0%) |
| Health Diagnosing & Treating | 0 (0.0%) | 4 (100.0%) |
| Health Technologists | 0 (0.0%) | 4 (100.0%) |
| Total (Category) | 6 (26.1%) | 17 (73.9%) |
| Total (Overall) | 117 (56.0%) | 92 (44.0%) |
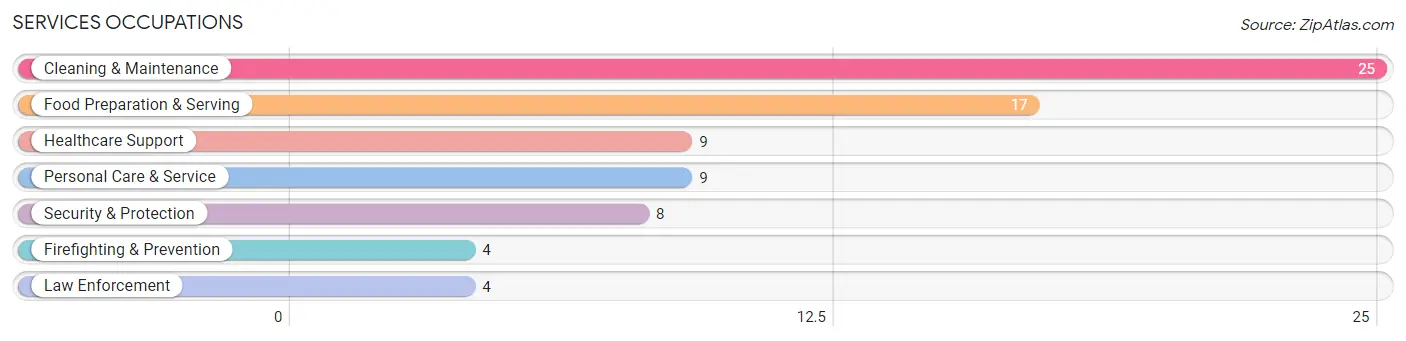
Services Occupations
The most common Services occupations in Bucoda are Cleaning & Maintenance (25 | 12.0%), Food Preparation & Serving (17 | 8.1%), Healthcare Support (9 | 4.3%), Personal Care & Service (9 | 4.3%), and Security & Protection (8 | 3.8%).
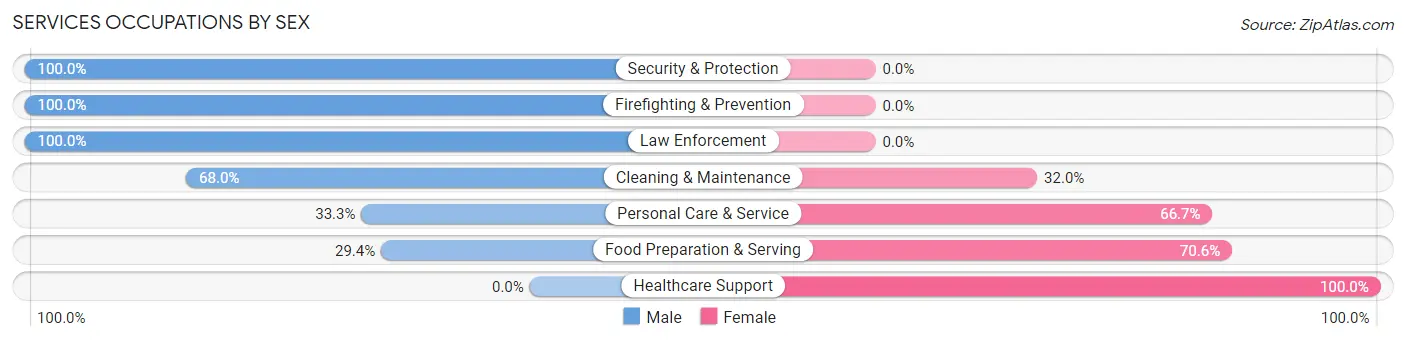
Services Occupations by Sex
Within the Services occupations in Bucoda, the most male-oriented occupations are Security & Protection (100.0%), Firefighting & Prevention (100.0%), and Law Enforcement (100.0%), while the most female-oriented occupations are Healthcare Support (100.0%), Food Preparation & Serving (70.6%), and Personal Care & Service (66.7%).
| Occupation | Male | Female |
| Healthcare Support | 0 (0.0%) | 9 (100.0%) |
| Security & Protection | 8 (100.0%) | 0 (0.0%) |
| Firefighting & Prevention | 4 (100.0%) | 0 (0.0%) |
| Law Enforcement | 4 (100.0%) | 0 (0.0%) |
| Food Preparation & Serving | 5 (29.4%) | 12 (70.6%) |
| Cleaning & Maintenance | 17 (68.0%) | 8 (32.0%) |
| Personal Care & Service | 3 (33.3%) | 6 (66.7%) |
| Total (Category) | 33 (48.5%) | 35 (51.5%) |
| Total (Overall) | 117 (56.0%) | 92 (44.0%) |
Sales and Office Occupations
The most common Sales and Office occupations in Bucoda are Office & Administration (23 | 11.0%), and Sales & Related (13 | 6.2%).

Sales and Office Occupations by Sex
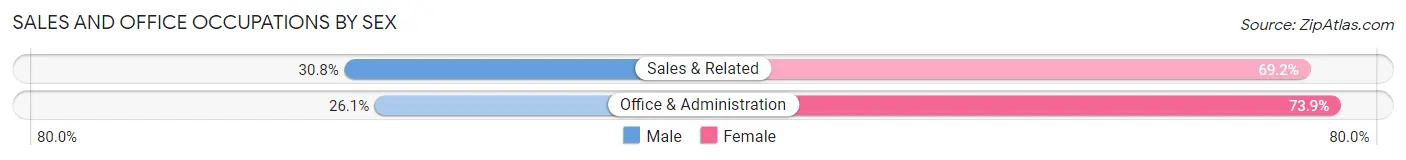
| Occupation | Male | Female |
| Sales & Related | 4 (30.8%) | 9 (69.2%) |
| Office & Administration | 6 (26.1%) | 17 (73.9%) |
| Total (Category) | 10 (27.8%) | 26 (72.2%) |
| Total (Overall) | 117 (56.0%) | 92 (44.0%) |
Natural Resources, Construction and Maintenance Occupations
The most common Natural Resources, Construction and Maintenance occupations in Bucoda are Construction & Extraction (20 | 9.6%), and Installation, Maintenance & Repair (11 | 5.3%).
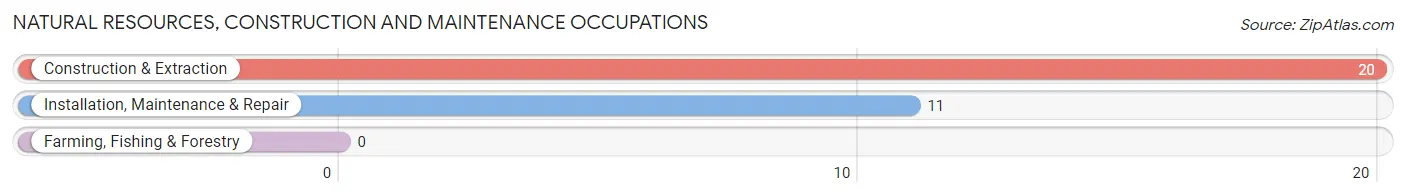
Natural Resources, Construction and Maintenance Occupations by Sex

| Occupation | Male | Female |
| Farming, Fishing & Forestry | 0 (0.0%) | 0 (0.0%) |
| Construction & Extraction | 20 (100.0%) | 0 (0.0%) |
| Installation, Maintenance & Repair | 11 (100.0%) | 0 (0.0%) |
| Total (Category) | 31 (100.0%) | 0 (0.0%) |
| Total (Overall) | 117 (56.0%) | 92 (44.0%) |
Production, Transportation and Moving Occupations
The most common Production, Transportation and Moving occupations in Bucoda are Material Moving (22 | 10.5%), Transportation (15 | 7.2%), and Production (14 | 6.7%).
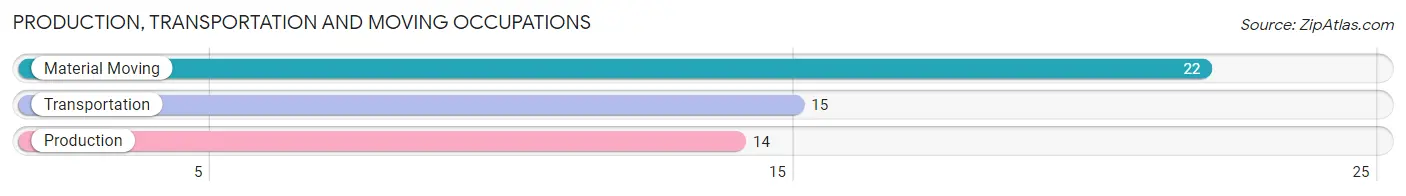
Production, Transportation and Moving Occupations by Sex
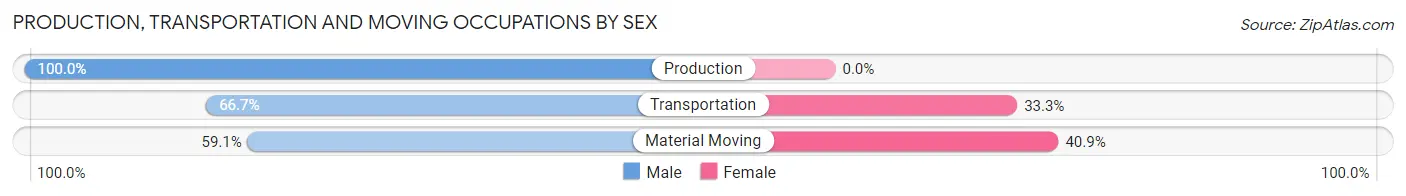
| Occupation | Male | Female |
| Production | 14 (100.0%) | 0 (0.0%) |
| Transportation | 10 (66.7%) | 5 (33.3%) |
| Material Moving | 13 (59.1%) | 9 (40.9%) |
| Total (Category) | 37 (72.6%) | 14 (27.5%) |
| Total (Overall) | 117 (56.0%) | 92 (44.0%) |
Employment Industries by Sex in Bucoda
Employment Industries in Bucoda
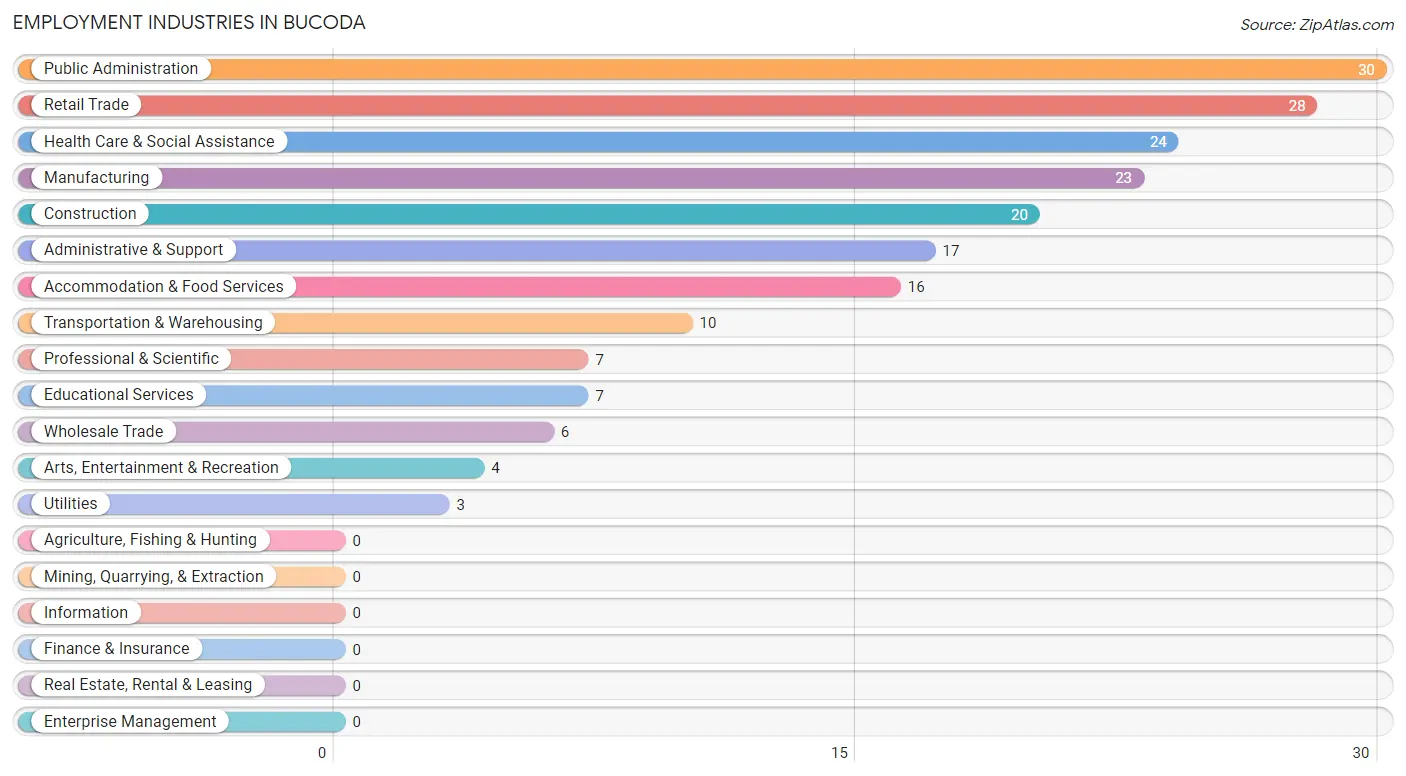
The major employment industries in Bucoda include Public Administration (30 | 14.3%), Retail Trade (28 | 13.4%), Health Care & Social Assistance (24 | 11.5%), Manufacturing (23 | 11.0%), and Construction (20 | 9.6%).
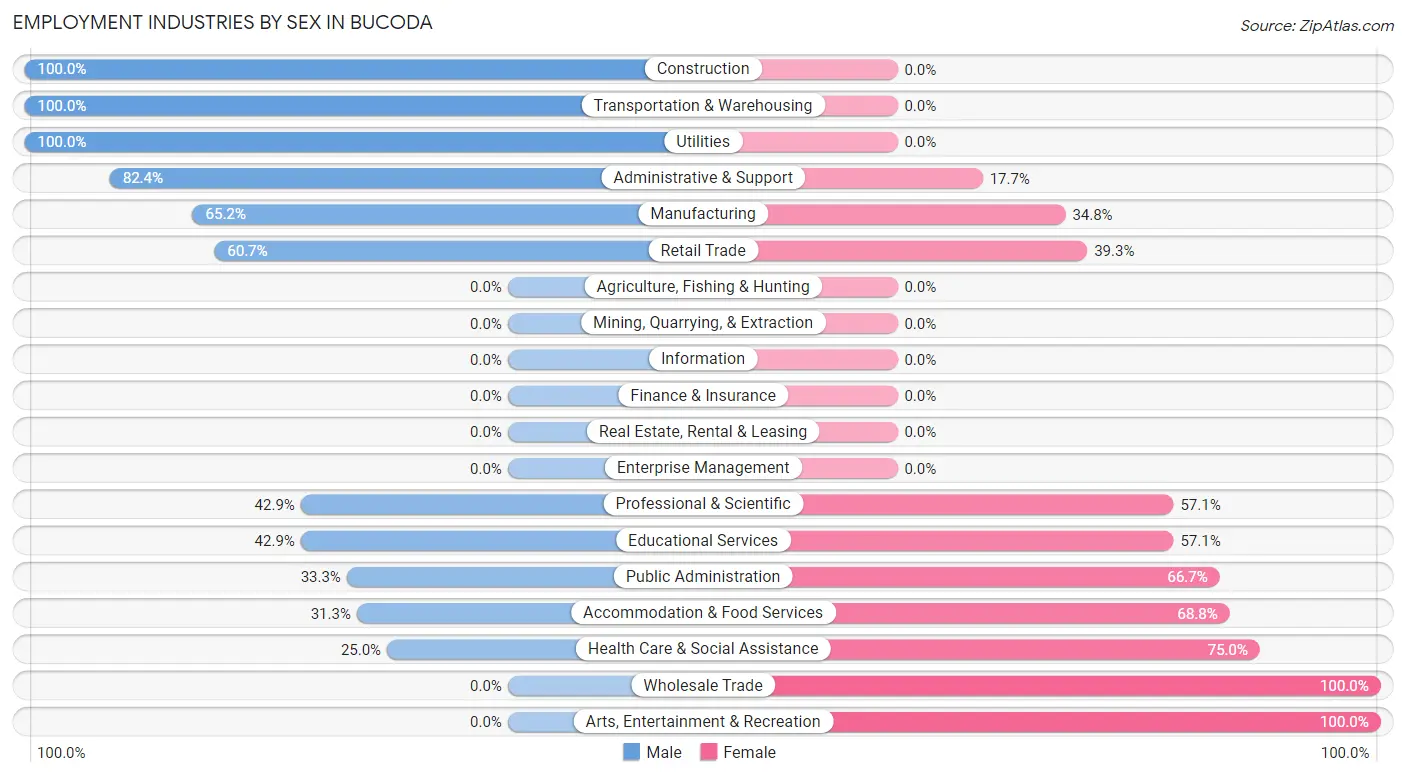
Employment Industries by Sex in Bucoda
The Bucoda industries that see more men than women are Construction (100.0%), Transportation & Warehousing (100.0%), and Utilities (100.0%), whereas the industries that tend to have a higher number of women are Wholesale Trade (100.0%), Arts, Entertainment & Recreation (100.0%), and Health Care & Social Assistance (75.0%).
| Industry | Male | Female |
| Agriculture, Fishing & Hunting | 0 (0.0%) | 0 (0.0%) |
| Mining, Quarrying, & Extraction | 0 (0.0%) | 0 (0.0%) |
| Construction | 20 (100.0%) | 0 (0.0%) |
| Manufacturing | 15 (65.2%) | 8 (34.8%) |
| Wholesale Trade | 0 (0.0%) | 6 (100.0%) |
| Retail Trade | 17 (60.7%) | 11 (39.3%) |
| Transportation & Warehousing | 10 (100.0%) | 0 (0.0%) |
| Utilities | 3 (100.0%) | 0 (0.0%) |
| Information | 0 (0.0%) | 0 (0.0%) |
| Finance & Insurance | 0 (0.0%) | 0 (0.0%) |
| Real Estate, Rental & Leasing | 0 (0.0%) | 0 (0.0%) |
| Professional & Scientific | 3 (42.9%) | 4 (57.1%) |
| Enterprise Management | 0 (0.0%) | 0 (0.0%) |
| Administrative & Support | 14 (82.4%) | 3 (17.6%) |
| Educational Services | 3 (42.9%) | 4 (57.1%) |
| Health Care & Social Assistance | 6 (25.0%) | 18 (75.0%) |
| Arts, Entertainment & Recreation | 0 (0.0%) | 4 (100.0%) |
| Accommodation & Food Services | 5 (31.2%) | 11 (68.8%) |
| Public Administration | 10 (33.3%) | 20 (66.7%) |
| Total | 117 (56.0%) | 92 (44.0%) |
Education in Bucoda
School Enrollment in Bucoda
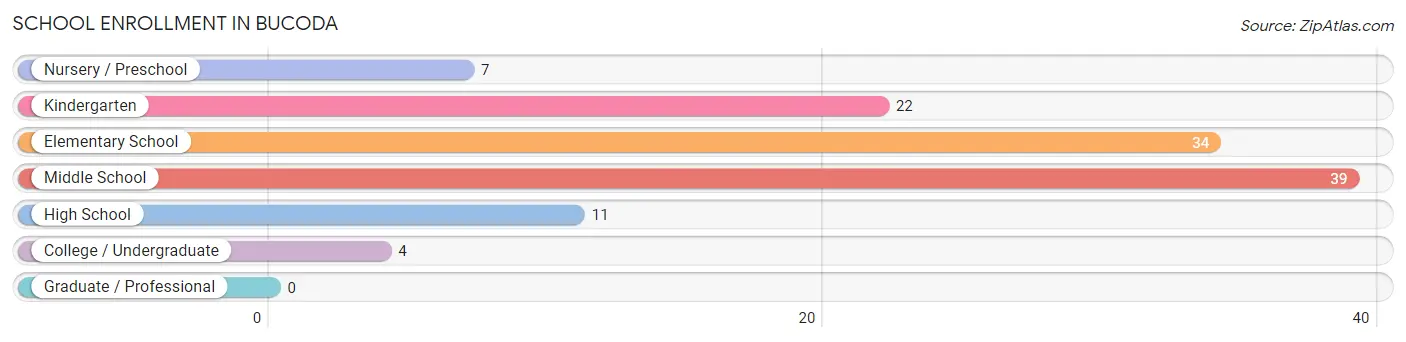
The most common levels of schooling among the 117 students in Bucoda are middle school (39 | 33.3%), elementary school (34 | 29.1%), and kindergarten (22 | 18.8%).
| School Level | # Students | % Students |
| Nursery / Preschool | 7 | 6.0% |
| Kindergarten | 22 | 18.8% |
| Elementary School | 34 | 29.1% |
| Middle School | 39 | 33.3% |
| High School | 11 | 9.4% |
| College / Undergraduate | 4 | 3.4% |
| Graduate / Professional | 0 | 0.0% |
| Total | 117 | 100.0% |
School Enrollment by Age by Funding Source in Bucoda
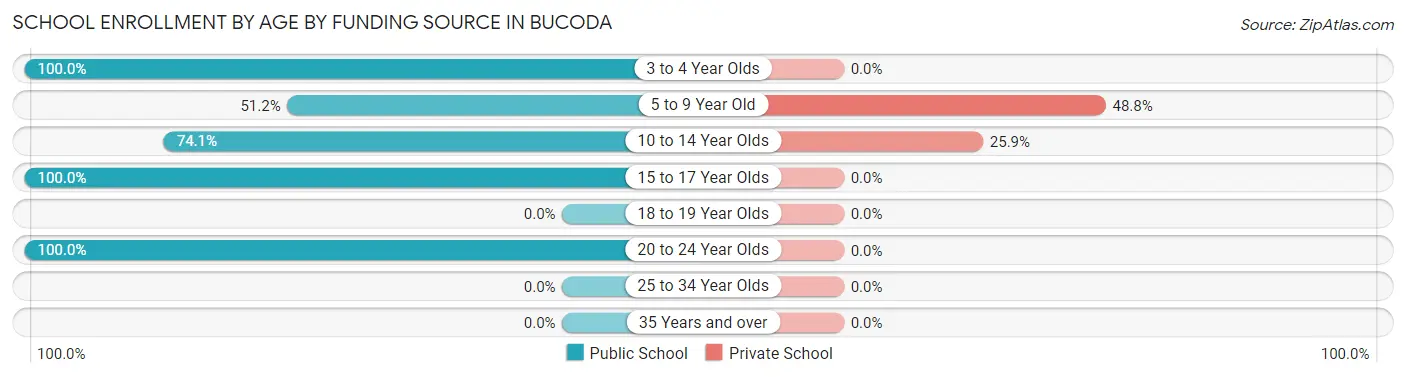
Out of a total of 117 students who are enrolled in schools in Bucoda, 34 (29.1%) attend a private institution, while the remaining 83 (70.9%) are enrolled in public schools. The age group of 5 to 9 year old has the highest likelihood of being enrolled in private schools, with 20 (48.8% in the age bracket) enrolled. Conversely, the age group of 3 to 4 year olds has the lowest likelihood of being enrolled in a private school, with 7 (100.0% in the age bracket) attending a public institution.
| Age Bracket | Public School | Private School |
| 3 to 4 Year Olds | 7 (100.0%) | 0 (0.0%) |
| 5 to 9 Year Old | 21 (51.2%) | 20 (48.8%) |
| 10 to 14 Year Olds | 40 (74.1%) | 14 (25.9%) |
| 15 to 17 Year Olds | 11 (100.0%) | 0 (0.0%) |
| 18 to 19 Year Olds | 0 (0.0%) | 0 (0.0%) |
| 20 to 24 Year Olds | 4 (100.0%) | 0 (0.0%) |
| 25 to 34 Year Olds | 0 (0.0%) | 0 (0.0%) |
| 35 Years and over | 0 (0.0%) | 0 (0.0%) |
| Total | 83 (70.9%) | 34 (29.1%) |
Educational Attainment by Field of Study in Bucoda
Computers & mathematics (10 | 23.3%), business (6 | 14.0%), education (6 | 14.0%), social sciences (5 | 11.6%), and arts & humanities (4 | 9.3%) are the most common fields of study among 43 individuals in Bucoda who have obtained a bachelor's degree or higher.
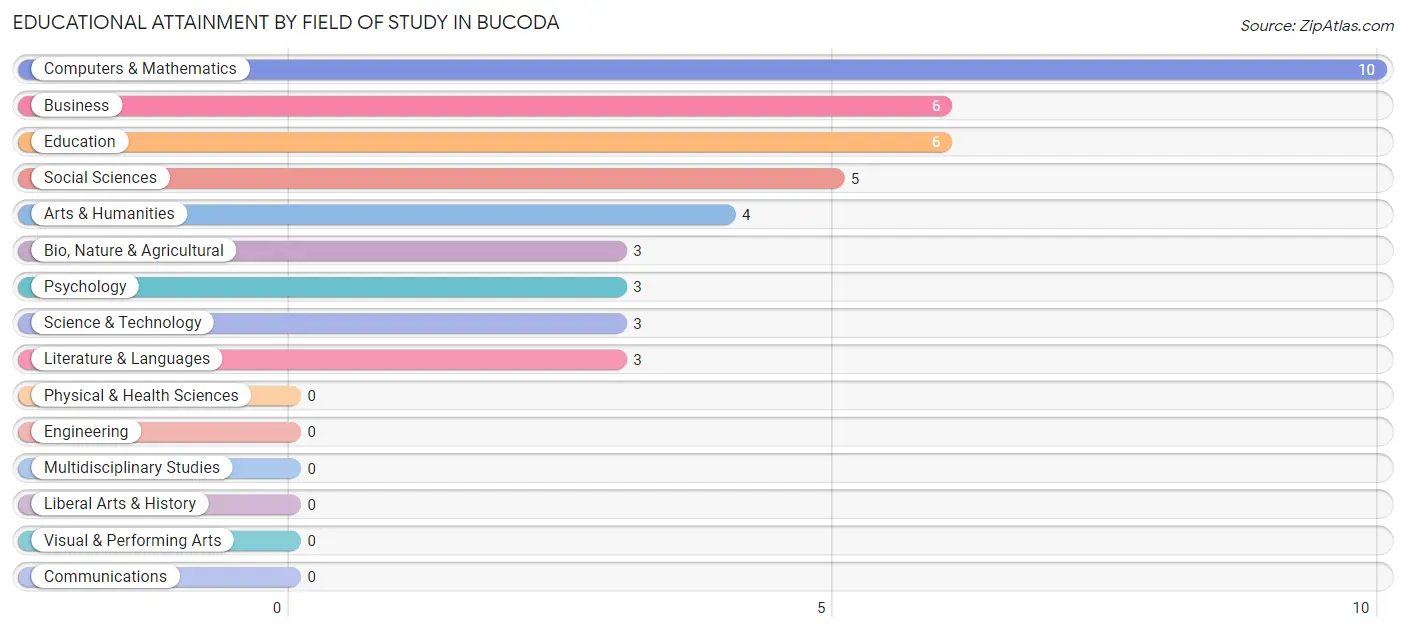
| Field of Study | # Graduates | % Graduates |
| Computers & Mathematics | 10 | 23.3% |
| Bio, Nature & Agricultural | 3 | 7.0% |
| Physical & Health Sciences | 0 | 0.0% |
| Psychology | 3 | 7.0% |
| Social Sciences | 5 | 11.6% |
| Engineering | 0 | 0.0% |
| Multidisciplinary Studies | 0 | 0.0% |
| Science & Technology | 3 | 7.0% |
| Business | 6 | 14.0% |
| Education | 6 | 14.0% |
| Literature & Languages | 3 | 7.0% |
| Liberal Arts & History | 0 | 0.0% |
| Visual & Performing Arts | 0 | 0.0% |
| Communications | 0 | 0.0% |
| Arts & Humanities | 4 | 9.3% |
| Total | 43 | 100.0% |
Transportation & Commute in Bucoda
Vehicle Availability by Sex in Bucoda
The most prevalent vehicle ownership categories in Bucoda are males with 2 vehicles (44, accounting for 37.6%) and females with 2 vehicles (35, making up 47.8%).
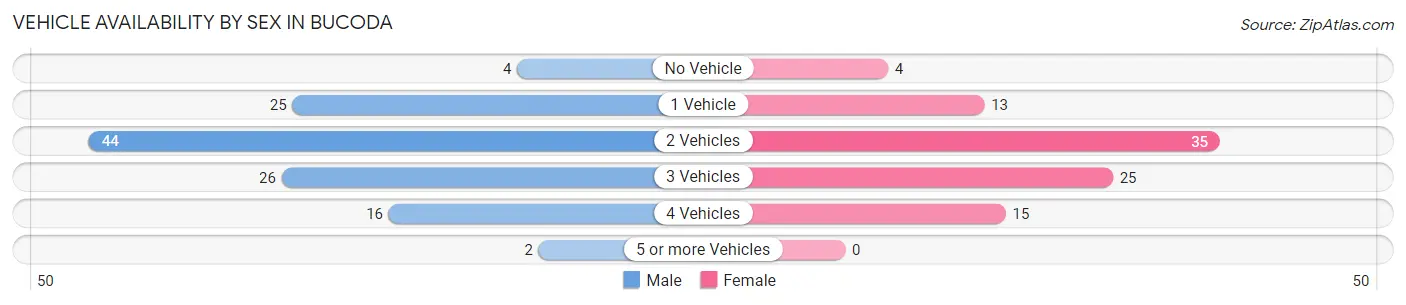
| Vehicles Available | Male | Female |
| No Vehicle | 4 (3.4%) | 4 (4.3%) |
| 1 Vehicle | 25 (21.4%) | 13 (14.1%) |
| 2 Vehicles | 44 (37.6%) | 35 (38.0%) |
| 3 Vehicles | 26 (22.2%) | 25 (27.2%) |
| 4 Vehicles | 16 (13.7%) | 15 (16.3%) |
| 5 or more Vehicles | 2 (1.7%) | 0 (0.0%) |
| Total | 117 (100.0%) | 92 (100.0%) |
Commute Time in Bucoda
The most frequently occuring commute durations in Bucoda are 30 to 34 minutes (51 commuters, 25.5%), 20 to 24 minutes (27 commuters, 13.5%), and 45 to 59 minutes (24 commuters, 12.0%).
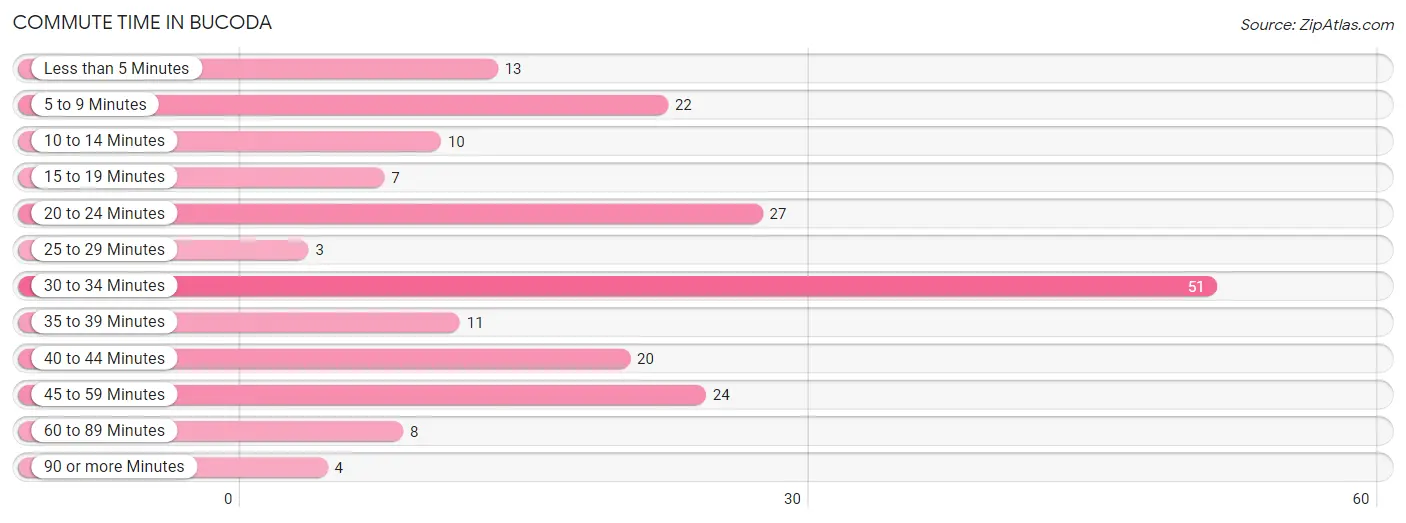
| Commute Time | # Commuters | % Commuters |
| Less than 5 Minutes | 13 | 6.5% |
| 5 to 9 Minutes | 22 | 11.0% |
| 10 to 14 Minutes | 10 | 5.0% |
| 15 to 19 Minutes | 7 | 3.5% |
| 20 to 24 Minutes | 27 | 13.5% |
| 25 to 29 Minutes | 3 | 1.5% |
| 30 to 34 Minutes | 51 | 25.5% |
| 35 to 39 Minutes | 11 | 5.5% |
| 40 to 44 Minutes | 20 | 10.0% |
| 45 to 59 Minutes | 24 | 12.0% |
| 60 to 89 Minutes | 8 | 4.0% |
| 90 or more Minutes | 4 | 2.0% |
Commute Time by Sex in Bucoda
The most common commute times in Bucoda are 30 to 34 minutes (27 commuters, 24.5%) for males and 30 to 34 minutes (24 commuters, 26.7%) for females.
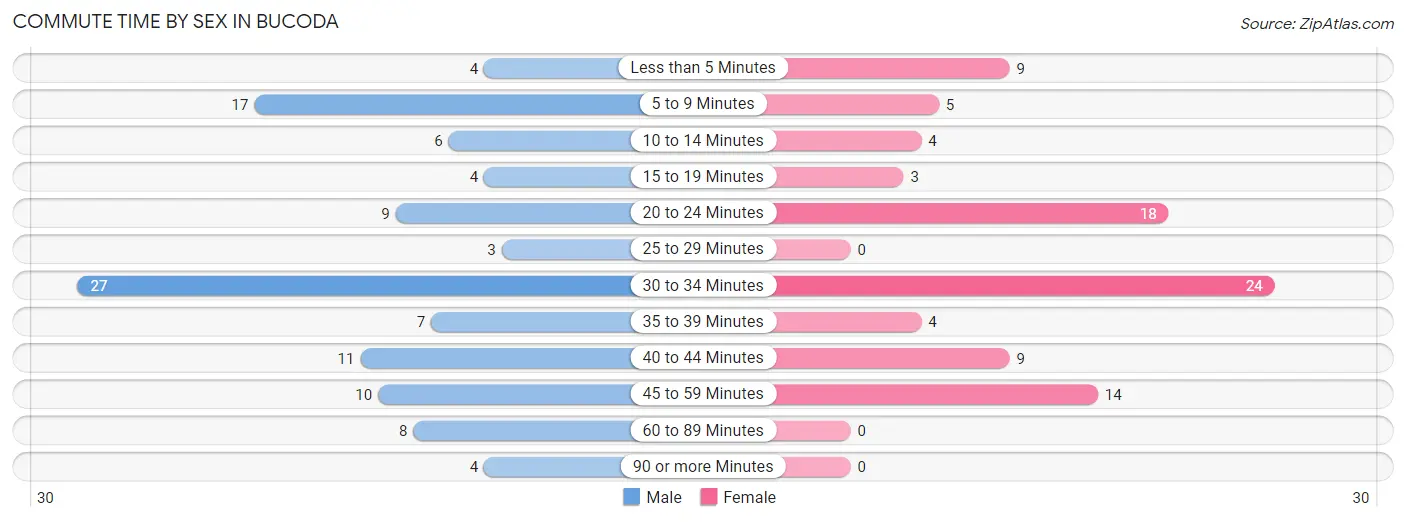
| Commute Time | Male | Female |
| Less than 5 Minutes | 4 (3.6%) | 9 (10.0%) |
| 5 to 9 Minutes | 17 (15.4%) | 5 (5.6%) |
| 10 to 14 Minutes | 6 (5.4%) | 4 (4.4%) |
| 15 to 19 Minutes | 4 (3.6%) | 3 (3.3%) |
| 20 to 24 Minutes | 9 (8.2%) | 18 (20.0%) |
| 25 to 29 Minutes | 3 (2.7%) | 0 (0.0%) |
| 30 to 34 Minutes | 27 (24.5%) | 24 (26.7%) |
| 35 to 39 Minutes | 7 (6.4%) | 4 (4.4%) |
| 40 to 44 Minutes | 11 (10.0%) | 9 (10.0%) |
| 45 to 59 Minutes | 10 (9.1%) | 14 (15.6%) |
| 60 to 89 Minutes | 8 (7.3%) | 0 (0.0%) |
| 90 or more Minutes | 4 (3.6%) | 0 (0.0%) |
Time of Departure to Work by Sex in Bucoda
The most frequent times of departure to work in Bucoda are 12:00 PM to 3:59 PM (18, 16.4%) for males and 6:00 AM to 6:29 AM (22, 24.4%) for females.
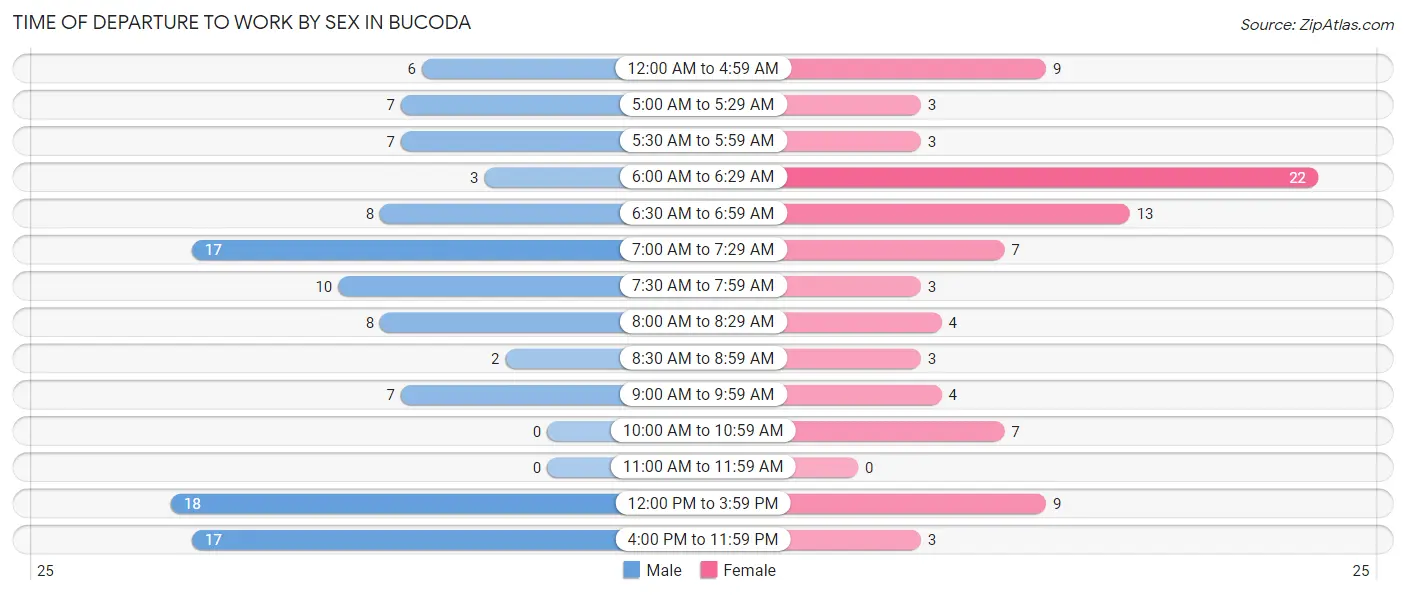
| Time of Departure | Male | Female |
| 12:00 AM to 4:59 AM | 6 (5.4%) | 9 (10.0%) |
| 5:00 AM to 5:29 AM | 7 (6.4%) | 3 (3.3%) |
| 5:30 AM to 5:59 AM | 7 (6.4%) | 3 (3.3%) |
| 6:00 AM to 6:29 AM | 3 (2.7%) | 22 (24.4%) |
| 6:30 AM to 6:59 AM | 8 (7.3%) | 13 (14.4%) |
| 7:00 AM to 7:29 AM | 17 (15.4%) | 7 (7.8%) |
| 7:30 AM to 7:59 AM | 10 (9.1%) | 3 (3.3%) |
| 8:00 AM to 8:29 AM | 8 (7.3%) | 4 (4.4%) |
| 8:30 AM to 8:59 AM | 2 (1.8%) | 3 (3.3%) |
| 9:00 AM to 9:59 AM | 7 (6.4%) | 4 (4.4%) |
| 10:00 AM to 10:59 AM | 0 (0.0%) | 7 (7.8%) |
| 11:00 AM to 11:59 AM | 0 (0.0%) | 0 (0.0%) |
| 12:00 PM to 3:59 PM | 18 (16.4%) | 9 (10.0%) |
| 4:00 PM to 11:59 PM | 17 (15.4%) | 3 (3.3%) |
| Total | 110 (100.0%) | 90 (100.0%) |
Housing Occupancy in Bucoda
Occupancy by Ownership in Bucoda
Of the total 186 dwellings in Bucoda, owner-occupied units account for 123 (66.1%), while renter-occupied units make up 63 (33.9%).
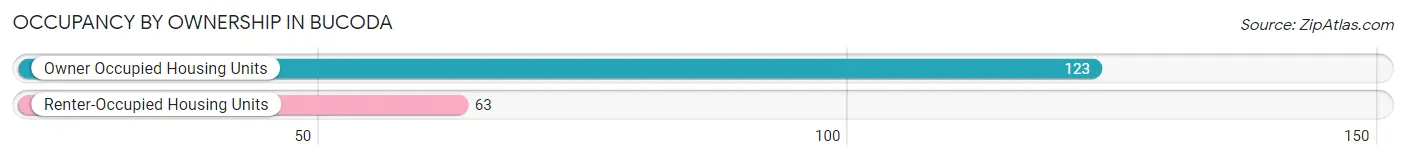
| Occupancy | # Housing Units | % Housing Units |
| Owner Occupied Housing Units | 123 | 66.1% |
| Renter-Occupied Housing Units | 63 | 33.9% |
| Total Occupied Housing Units | 186 | 100.0% |
Occupancy by Household Size in Bucoda
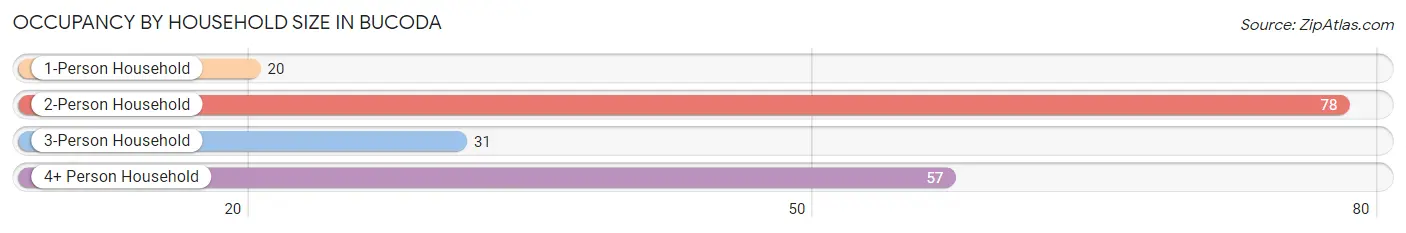
| Household Size | # Housing Units | % Housing Units |
| 1-Person Household | 20 | 10.7% |
| 2-Person Household | 78 | 41.9% |
| 3-Person Household | 31 | 16.7% |
| 4+ Person Household | 57 | 30.6% |
| Total Housing Units | 186 | 100.0% |
Occupancy by Ownership by Household Size in Bucoda
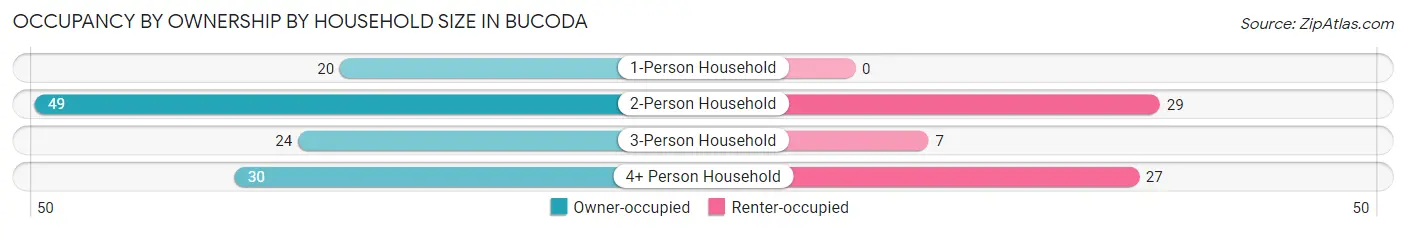
| Household Size | Owner-occupied | Renter-occupied |
| 1-Person Household | 20 (100.0%) | 0 (0.0%) |
| 2-Person Household | 49 (62.8%) | 29 (37.2%) |
| 3-Person Household | 24 (77.4%) | 7 (22.6%) |
| 4+ Person Household | 30 (52.6%) | 27 (47.4%) |
| Total Housing Units | 123 (66.1%) | 63 (33.9%) |
Occupancy by Educational Attainment in Bucoda
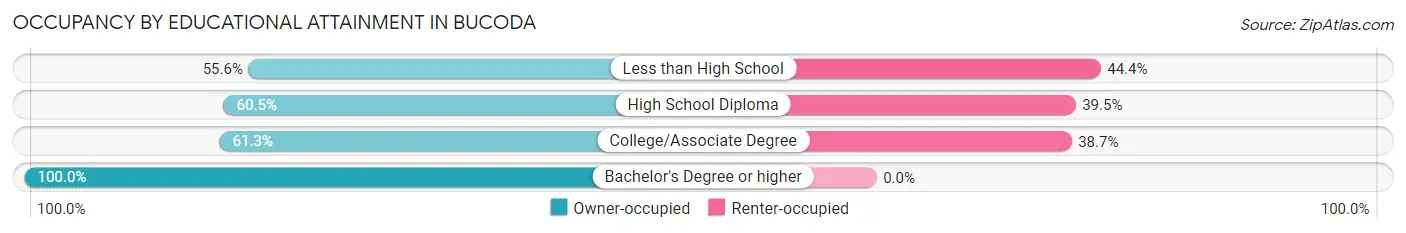
| Household Size | Owner-occupied | Renter-occupied |
| Less than High School | 5 (55.6%) | 4 (44.4%) |
| High School Diploma | 46 (60.5%) | 30 (39.5%) |
| College/Associate Degree | 46 (61.3%) | 29 (38.7%) |
| Bachelor's Degree or higher | 26 (100.0%) | 0 (0.0%) |
Occupancy by Age of Householder in Bucoda
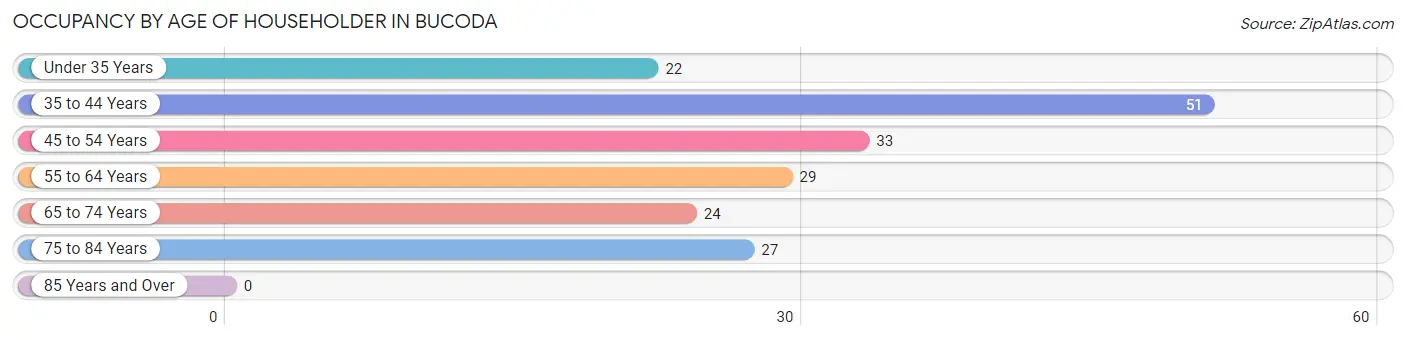
| Age Bracket | # Households | % Households |
| Under 35 Years | 22 | 11.8% |
| 35 to 44 Years | 51 | 27.4% |
| 45 to 54 Years | 33 | 17.7% |
| 55 to 64 Years | 29 | 15.6% |
| 65 to 74 Years | 24 | 12.9% |
| 75 to 84 Years | 27 | 14.5% |
| 85 Years and Over | 0 | 0.0% |
| Total | 186 | 100.0% |
Housing Finances in Bucoda
Median Income by Occupancy in Bucoda
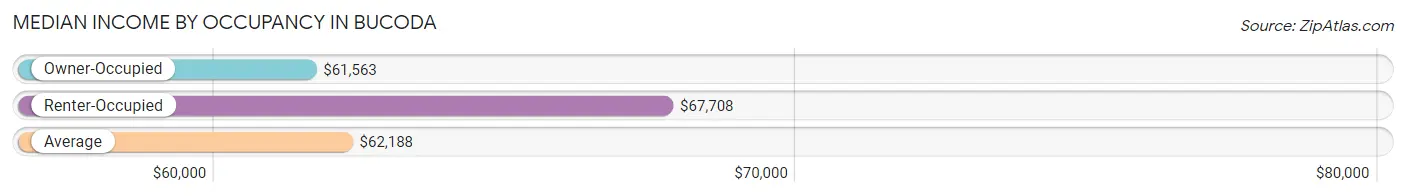
| Occupancy Type | # Households | Median Income |
| Owner-Occupied | 123 (66.1%) | $61,563 |
| Renter-Occupied | 63 (33.9%) | $67,708 |
| Average | 186 (100.0%) | $62,188 |
Occupancy by Householder Income Bracket in Bucoda
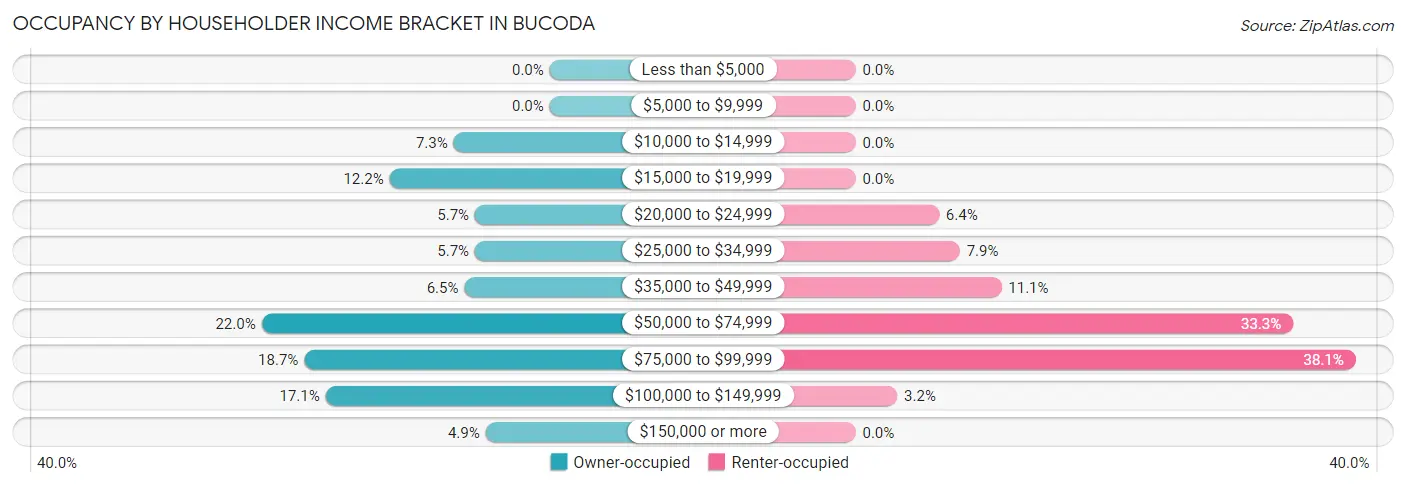
| Income Bracket | Owner-occupied | Renter-occupied |
| Less than $5,000 | 0 (0.0%) | 0 (0.0%) |
| $5,000 to $9,999 | 0 (0.0%) | 0 (0.0%) |
| $10,000 to $14,999 | 9 (7.3%) | 0 (0.0%) |
| $15,000 to $19,999 | 15 (12.2%) | 0 (0.0%) |
| $20,000 to $24,999 | 7 (5.7%) | 4 (6.4%) |
| $25,000 to $34,999 | 7 (5.7%) | 5 (7.9%) |
| $35,000 to $49,999 | 8 (6.5%) | 7 (11.1%) |
| $50,000 to $74,999 | 27 (22.0%) | 21 (33.3%) |
| $75,000 to $99,999 | 23 (18.7%) | 24 (38.1%) |
| $100,000 to $149,999 | 21 (17.1%) | 2 (3.2%) |
| $150,000 or more | 6 (4.9%) | 0 (0.0%) |
| Total | 123 (100.0%) | 63 (100.0%) |
Monthly Housing Cost Tiers in Bucoda
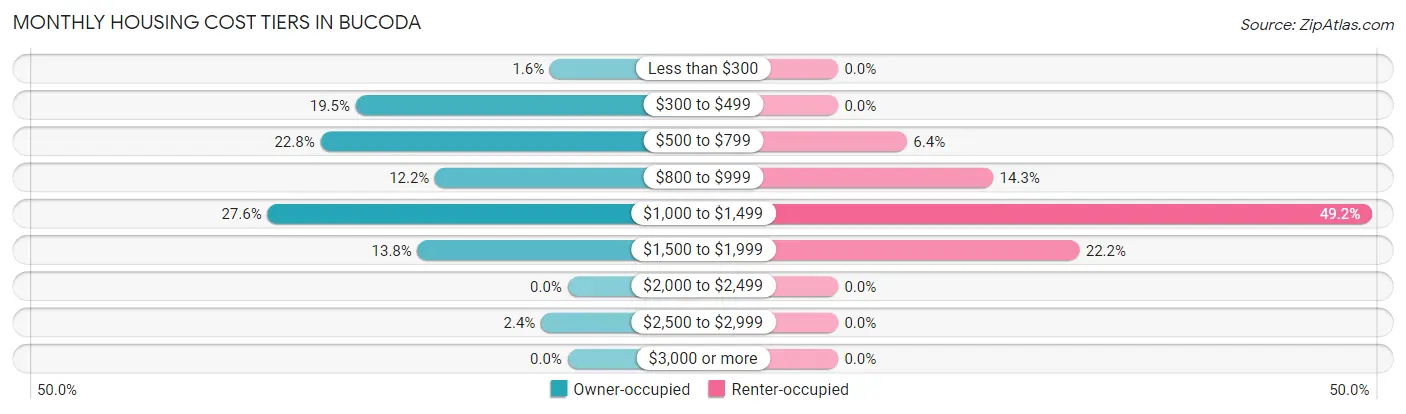
| Monthly Cost | Owner-occupied | Renter-occupied |
| Less than $300 | 2 (1.6%) | 0 (0.0%) |
| $300 to $499 | 24 (19.5%) | 0 (0.0%) |
| $500 to $799 | 28 (22.8%) | 4 (6.4%) |
| $800 to $999 | 15 (12.2%) | 9 (14.3%) |
| $1,000 to $1,499 | 34 (27.6%) | 31 (49.2%) |
| $1,500 to $1,999 | 17 (13.8%) | 14 (22.2%) |
| $2,000 to $2,499 | 0 (0.0%) | 0 (0.0%) |
| $2,500 to $2,999 | 3 (2.4%) | 0 (0.0%) |
| $3,000 or more | 0 (0.0%) | 0 (0.0%) |
| Total | 123 (100.0%) | 63 (100.0%) |
Physical Housing Characteristics in Bucoda
Housing Structures in Bucoda
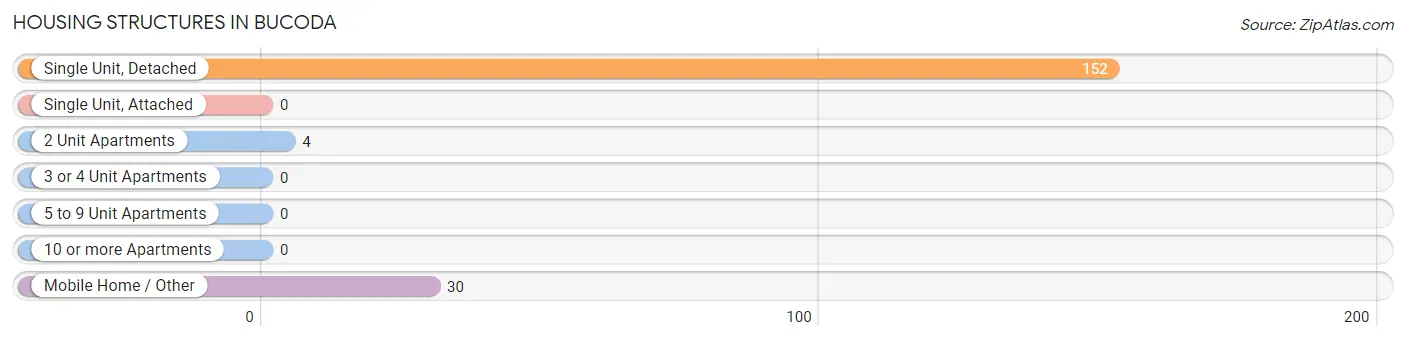
| Structure Type | # Housing Units | % Housing Units |
| Single Unit, Detached | 152 | 81.7% |
| Single Unit, Attached | 0 | 0.0% |
| 2 Unit Apartments | 4 | 2.1% |
| 3 or 4 Unit Apartments | 0 | 0.0% |
| 5 to 9 Unit Apartments | 0 | 0.0% |
| 10 or more Apartments | 0 | 0.0% |
| Mobile Home / Other | 30 | 16.1% |
| Total | 186 | 100.0% |
Housing Structures by Occupancy in Bucoda
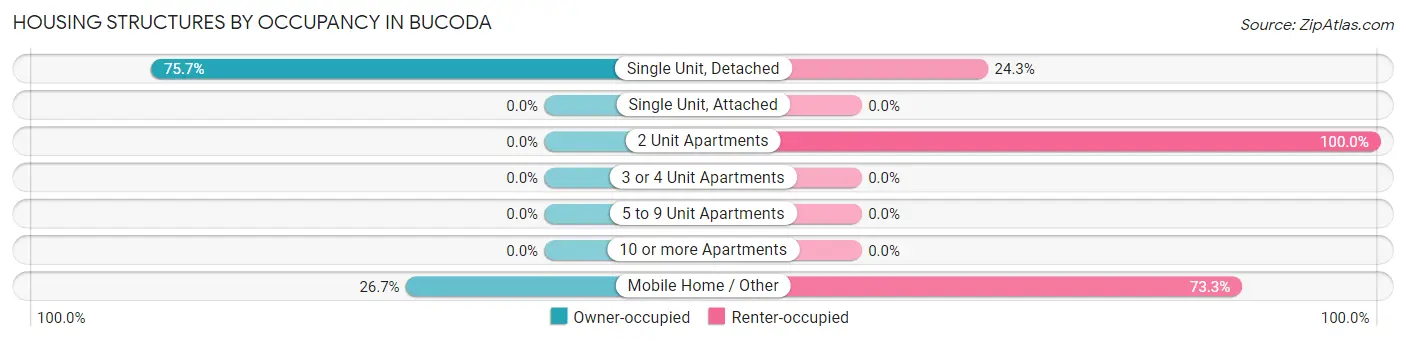
| Structure Type | Owner-occupied | Renter-occupied |
| Single Unit, Detached | 115 (75.7%) | 37 (24.3%) |
| Single Unit, Attached | 0 (0.0%) | 0 (0.0%) |
| 2 Unit Apartments | 0 (0.0%) | 4 (100.0%) |
| 3 or 4 Unit Apartments | 0 (0.0%) | 0 (0.0%) |
| 5 to 9 Unit Apartments | 0 (0.0%) | 0 (0.0%) |
| 10 or more Apartments | 0 (0.0%) | 0 (0.0%) |
| Mobile Home / Other | 8 (26.7%) | 22 (73.3%) |
| Total | 123 (66.1%) | 63 (33.9%) |
Housing Structures by Number of Rooms in Bucoda
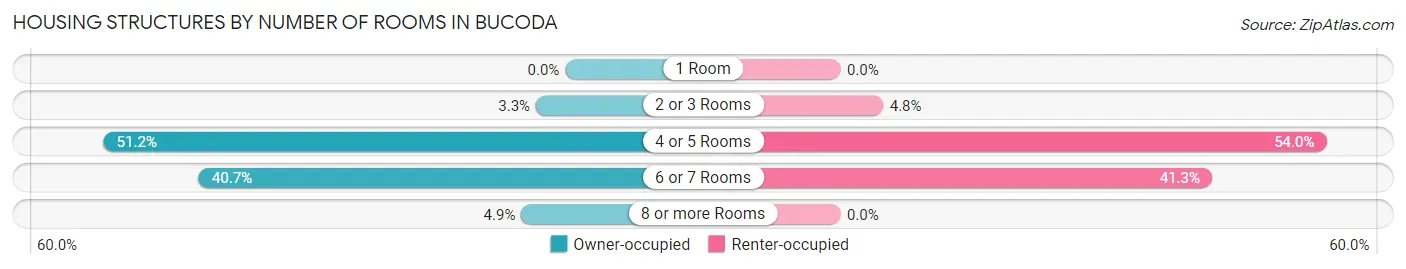
| Number of Rooms | Owner-occupied | Renter-occupied |
| 1 Room | 0 (0.0%) | 0 (0.0%) |
| 2 or 3 Rooms | 4 (3.3%) | 3 (4.8%) |
| 4 or 5 Rooms | 63 (51.2%) | 34 (54.0%) |
| 6 or 7 Rooms | 50 (40.6%) | 26 (41.3%) |
| 8 or more Rooms | 6 (4.9%) | 0 (0.0%) |
| Total | 123 (100.0%) | 63 (100.0%) |
Housing Structure by Heating Type in Bucoda
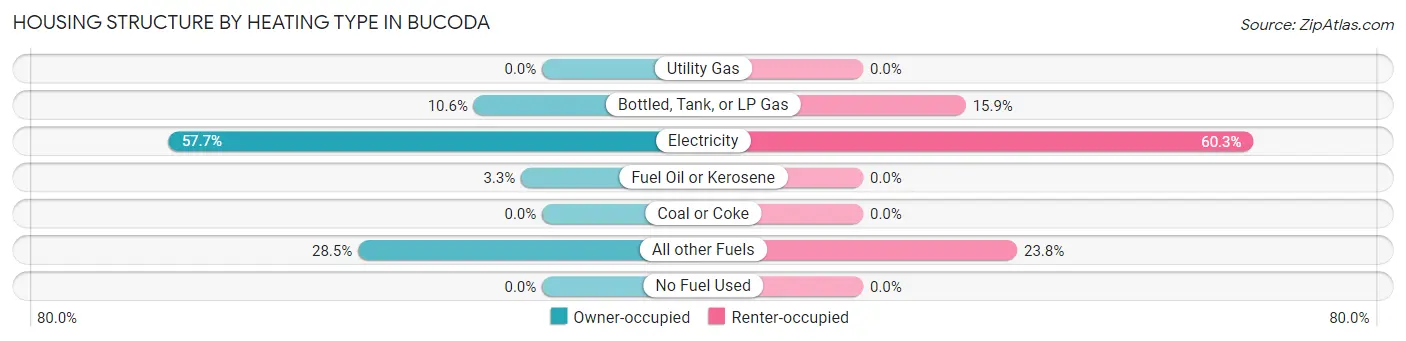
| Heating Type | Owner-occupied | Renter-occupied |
| Utility Gas | 0 (0.0%) | 0 (0.0%) |
| Bottled, Tank, or LP Gas | 13 (10.6%) | 10 (15.9%) |
| Electricity | 71 (57.7%) | 38 (60.3%) |
| Fuel Oil or Kerosene | 4 (3.3%) | 0 (0.0%) |
| Coal or Coke | 0 (0.0%) | 0 (0.0%) |
| All other Fuels | 35 (28.5%) | 15 (23.8%) |
| No Fuel Used | 0 (0.0%) | 0 (0.0%) |
| Total | 123 (100.0%) | 63 (100.0%) |
Household Vehicle Usage in Bucoda
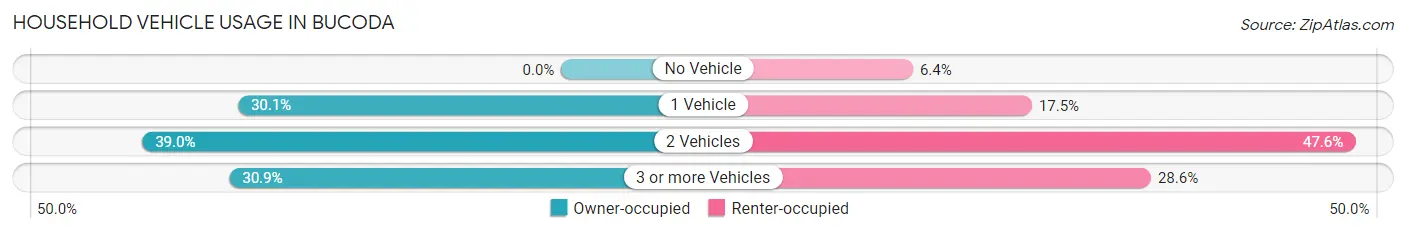
| Vehicles per Household | Owner-occupied | Renter-occupied |
| No Vehicle | 0 (0.0%) | 4 (6.4%) |
| 1 Vehicle | 37 (30.1%) | 11 (17.5%) |
| 2 Vehicles | 48 (39.0%) | 30 (47.6%) |
| 3 or more Vehicles | 38 (30.9%) | 18 (28.6%) |
| Total | 123 (100.0%) | 63 (100.0%) |
Real Estate & Mortgages in Bucoda
Real Estate and Mortgage Overview in Bucoda
| Characteristic | Without Mortgage | With Mortgage |
| Housing Units | 53 | 70 |
| Median Property Value | $238,600 | $179,200 |
| Median Household Income | $50,625 | $3 |
| Monthly Housing Costs | $510 | $0 |
| Real Estate Taxes | $1,417 | $0 |
Property Value by Mortgage Status in Bucoda
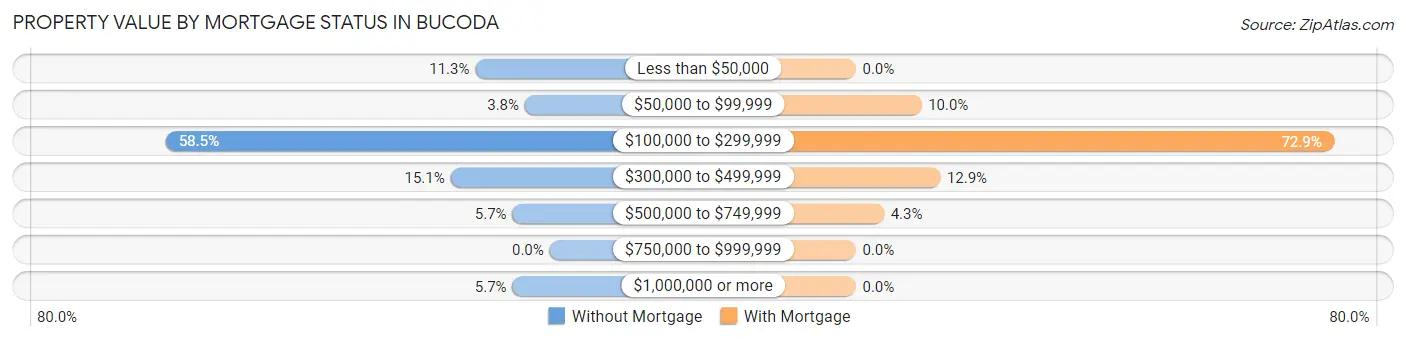
| Property Value | Without Mortgage | With Mortgage |
| Less than $50,000 | 6 (11.3%) | 0 (0.0%) |
| $50,000 to $99,999 | 2 (3.8%) | 7 (10.0%) |
| $100,000 to $299,999 | 31 (58.5%) | 51 (72.9%) |
| $300,000 to $499,999 | 8 (15.1%) | 9 (12.9%) |
| $500,000 to $749,999 | 3 (5.7%) | 3 (4.3%) |
| $750,000 to $999,999 | 0 (0.0%) | 0 (0.0%) |
| $1,000,000 or more | 3 (5.7%) | 0 (0.0%) |
| Total | 53 (100.0%) | 70 (100.0%) |
Household Income by Mortgage Status in Bucoda
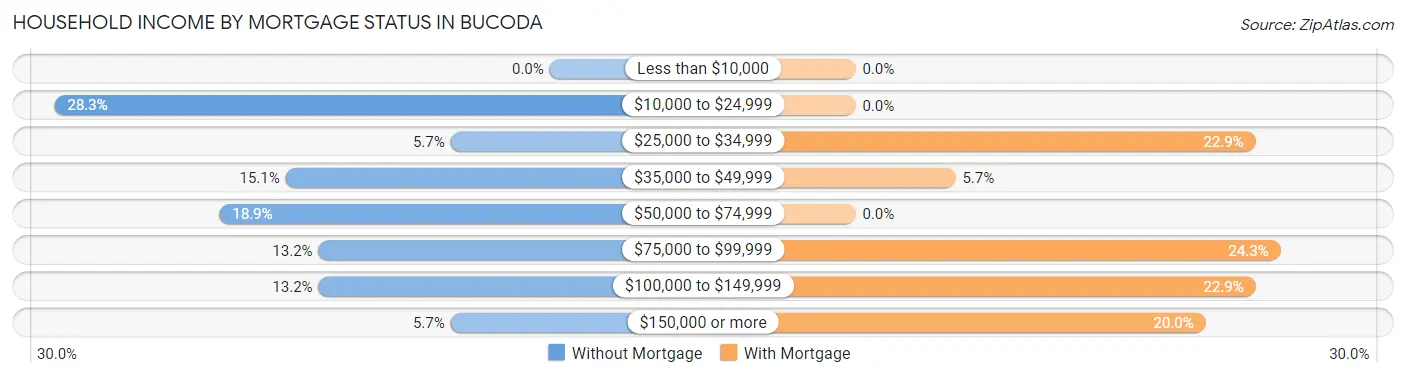
| Household Income | Without Mortgage | With Mortgage |
| Less than $10,000 | 0 (0.0%) | 0 (0.0%) |
| $10,000 to $24,999 | 15 (28.3%) | 0 (0.0%) |
| $25,000 to $34,999 | 3 (5.7%) | 16 (22.9%) |
| $35,000 to $49,999 | 8 (15.1%) | 4 (5.7%) |
| $50,000 to $74,999 | 10 (18.9%) | 0 (0.0%) |
| $75,000 to $99,999 | 7 (13.2%) | 17 (24.3%) |
| $100,000 to $149,999 | 7 (13.2%) | 16 (22.9%) |
| $150,000 or more | 3 (5.7%) | 14 (20.0%) |
| Total | 53 (100.0%) | 70 (100.0%) |
Property Value to Household Income Ratio in Bucoda
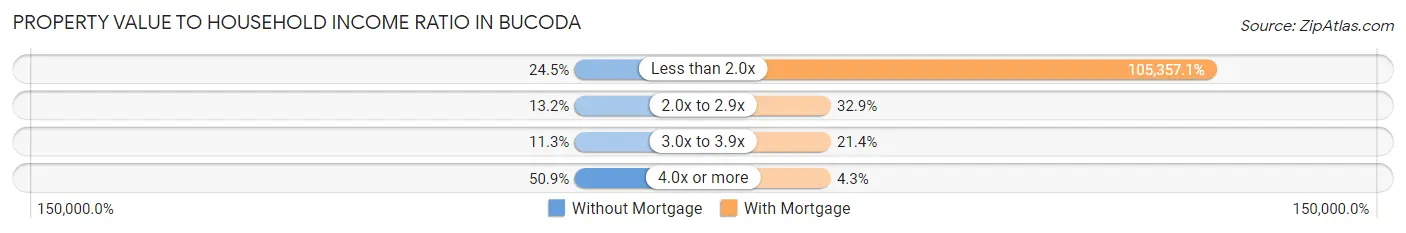
| Value-to-Income Ratio | Without Mortgage | With Mortgage |
| Less than 2.0x | 13 (24.5%) | 73,750 (105,357.1%) |
| 2.0x to 2.9x | 7 (13.2%) | 23 (32.9%) |
| 3.0x to 3.9x | 6 (11.3%) | 15 (21.4%) |
| 4.0x or more | 27 (50.9%) | 3 (4.3%) |
| Total | 53 (100.0%) | 70 (100.0%) |
Real Estate Taxes by Mortgage Status in Bucoda
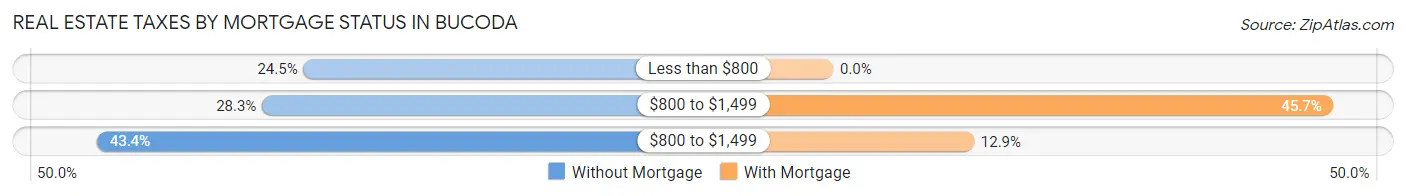
| Property Taxes | Without Mortgage | With Mortgage |
| Less than $800 | 13 (24.5%) | 0 (0.0%) |
| $800 to $1,499 | 15 (28.3%) | 32 (45.7%) |
| $800 to $1,499 | 23 (43.4%) | 9 (12.9%) |
| Total | 53 (100.0%) | 70 (100.0%) |
Health & Disability in Bucoda
Health Insurance Coverage by Age in Bucoda
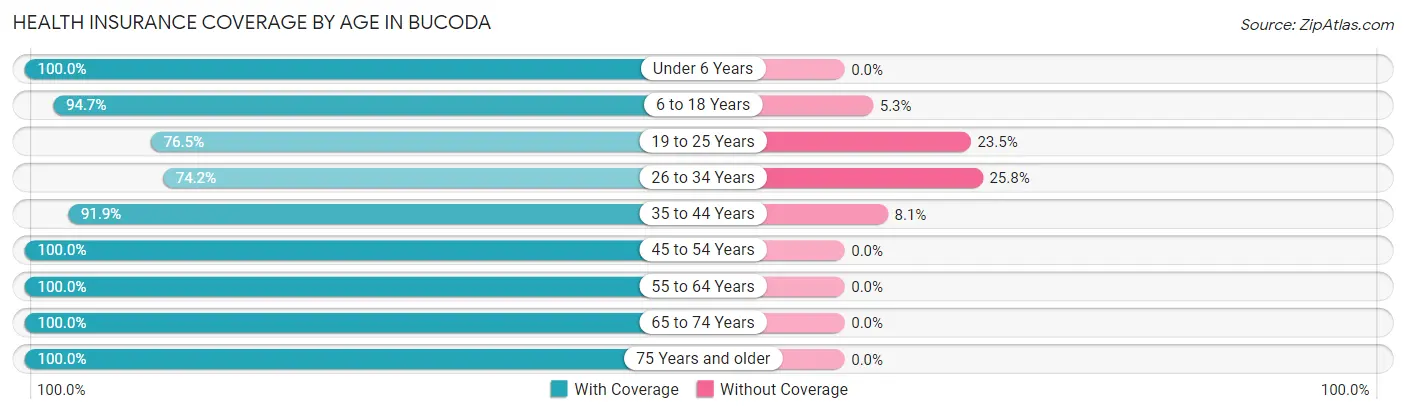
| Age Bracket | With Coverage | Without Coverage |
| Under 6 Years | 50 (100.0%) | 0 (0.0%) |
| 6 to 18 Years | 107 (94.7%) | 6 (5.3%) |
| 19 to 25 Years | 13 (76.5%) | 4 (23.5%) |
| 26 to 34 Years | 72 (74.2%) | 25 (25.8%) |
| 35 to 44 Years | 91 (91.9%) | 8 (8.1%) |
| 45 to 54 Years | 50 (100.0%) | 0 (0.0%) |
| 55 to 64 Years | 53 (100.0%) | 0 (0.0%) |
| 65 to 74 Years | 42 (100.0%) | 0 (0.0%) |
| 75 Years and older | 43 (100.0%) | 0 (0.0%) |
| Total | 521 (92.4%) | 43 (7.6%) |
Health Insurance Coverage by Citizenship Status in Bucoda
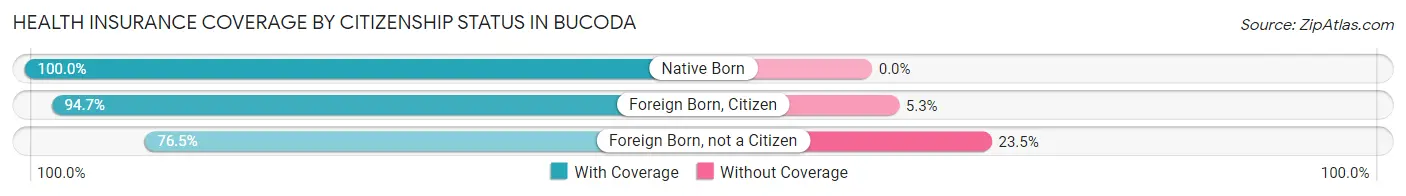
| Citizenship Status | With Coverage | Without Coverage |
| Native Born | 50 (100.0%) | 0 (0.0%) |
| Foreign Born, Citizen | 107 (94.7%) | 6 (5.3%) |
| Foreign Born, not a Citizen | 13 (76.5%) | 4 (23.5%) |
Health Insurance Coverage by Household Income in Bucoda
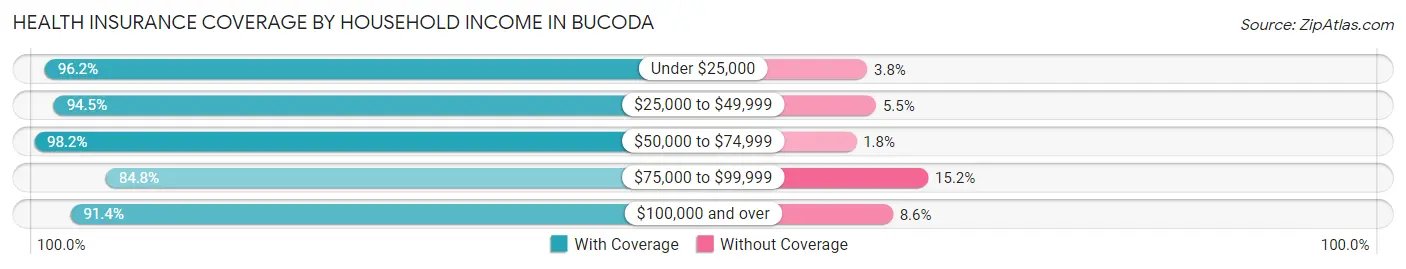
| Household Income | With Coverage | Without Coverage |
| Under $25,000 | 76 (96.2%) | 3 (3.8%) |
| $25,000 to $49,999 | 121 (94.5%) | 7 (5.5%) |
| $50,000 to $74,999 | 111 (98.2%) | 2 (1.8%) |
| $75,000 to $99,999 | 128 (84.8%) | 23 (15.2%) |
| $100,000 and over | 85 (91.4%) | 8 (8.6%) |
Public vs Private Health Insurance Coverage by Age in Bucoda
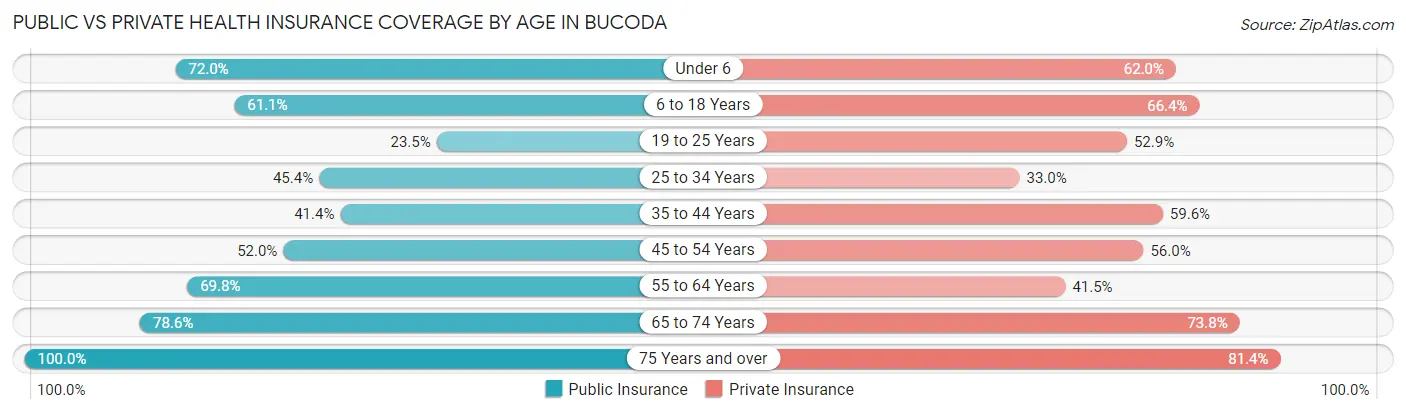
| Age Bracket | Public Insurance | Private Insurance |
| Under 6 | 36 (72.0%) | 31 (62.0%) |
| 6 to 18 Years | 69 (61.1%) | 75 (66.4%) |
| 19 to 25 Years | 4 (23.5%) | 9 (52.9%) |
| 25 to 34 Years | 44 (45.4%) | 32 (33.0%) |
| 35 to 44 Years | 41 (41.4%) | 59 (59.6%) |
| 45 to 54 Years | 26 (52.0%) | 28 (56.0%) |
| 55 to 64 Years | 37 (69.8%) | 22 (41.5%) |
| 65 to 74 Years | 33 (78.6%) | 31 (73.8%) |
| 75 Years and over | 43 (100.0%) | 35 (81.4%) |
| Total | 333 (59.0%) | 322 (57.1%) |
Disability Status by Sex by Age in Bucoda
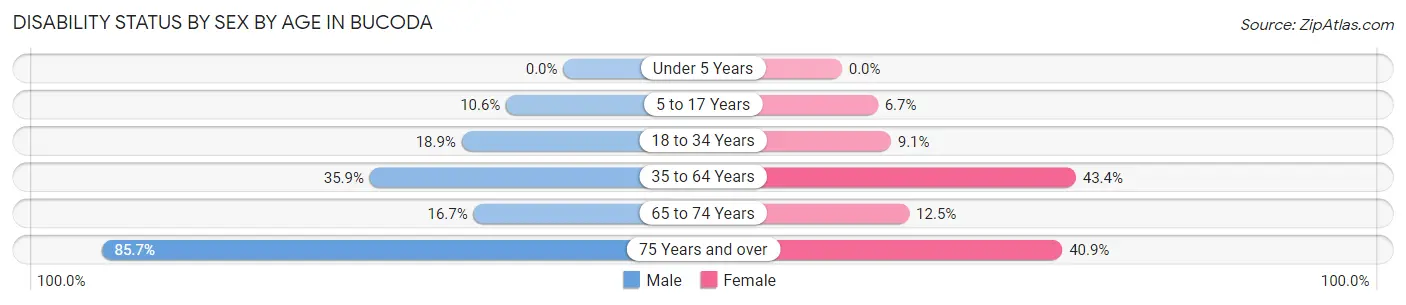
| Age Bracket | Male | Female |
| Under 5 Years | 0 (0.0%) | 0 (0.0%) |
| 5 to 17 Years | 7 (10.6%) | 3 (6.7%) |
| 18 to 34 Years | 10 (18.9%) | 6 (9.1%) |
| 35 to 64 Years | 37 (35.9%) | 43 (43.4%) |
| 65 to 74 Years | 3 (16.7%) | 3 (12.5%) |
| 75 Years and over | 18 (85.7%) | 9 (40.9%) |
Disability Class by Sex by Age in Bucoda
Disability Class: Hearing Difficulty
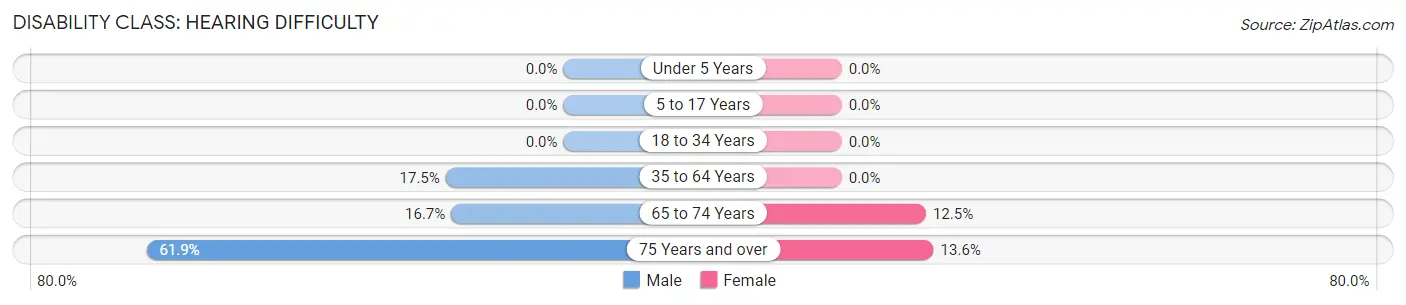
| Age Bracket | Male | Female |
| Under 5 Years | 0 (0.0%) | 0 (0.0%) |
| 5 to 17 Years | 0 (0.0%) | 0 (0.0%) |
| 18 to 34 Years | 0 (0.0%) | 0 (0.0%) |
| 35 to 64 Years | 18 (17.5%) | 0 (0.0%) |
| 65 to 74 Years | 3 (16.7%) | 3 (12.5%) |
| 75 Years and over | 13 (61.9%) | 3 (13.6%) |
Disability Class: Vision Difficulty
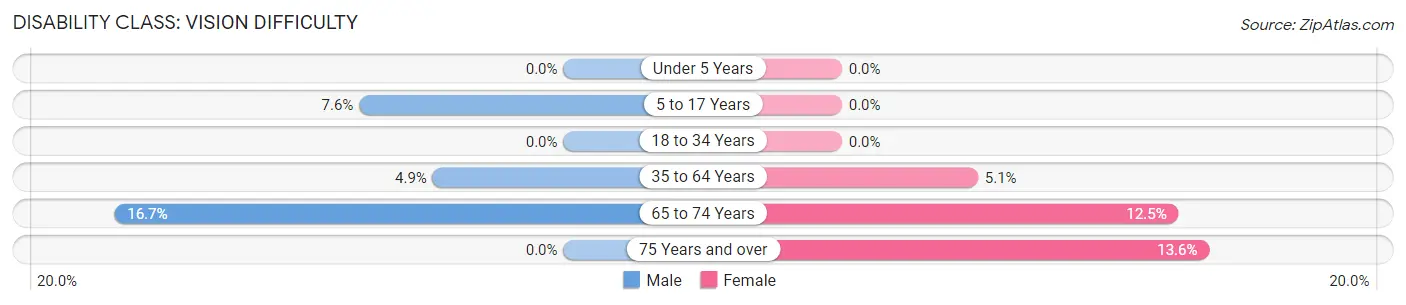
| Age Bracket | Male | Female |
| Under 5 Years | 0 (0.0%) | 0 (0.0%) |
| 5 to 17 Years | 5 (7.6%) | 0 (0.0%) |
| 18 to 34 Years | 0 (0.0%) | 0 (0.0%) |
| 35 to 64 Years | 5 (4.9%) | 5 (5.1%) |
| 65 to 74 Years | 3 (16.7%) | 3 (12.5%) |
| 75 Years and over | 0 (0.0%) | 3 (13.6%) |
Disability Class: Cognitive Difficulty
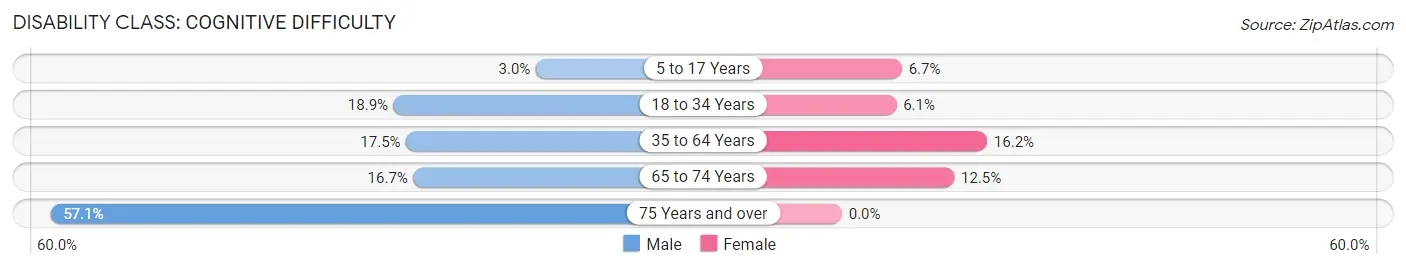
| Age Bracket | Male | Female |
| 5 to 17 Years | 2 (3.0%) | 3 (6.7%) |
| 18 to 34 Years | 10 (18.9%) | 4 (6.1%) |
| 35 to 64 Years | 18 (17.5%) | 16 (16.2%) |
| 65 to 74 Years | 3 (16.7%) | 3 (12.5%) |
| 75 Years and over | 12 (57.1%) | 0 (0.0%) |
Disability Class: Ambulatory Difficulty
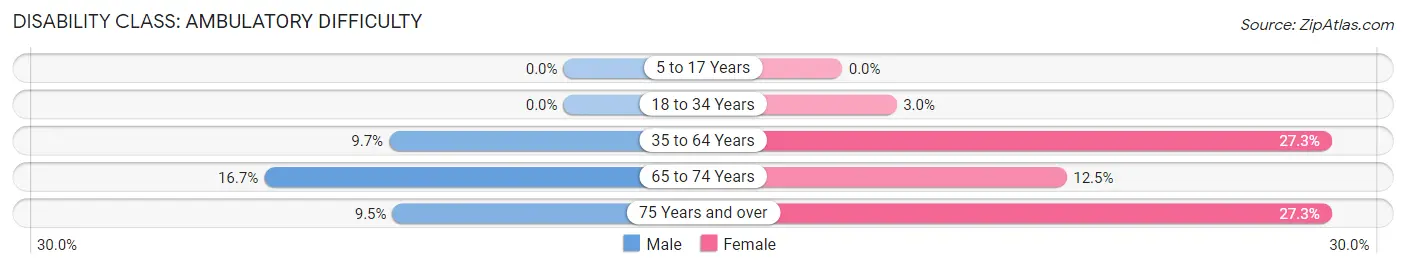
| Age Bracket | Male | Female |
| 5 to 17 Years | 0 (0.0%) | 0 (0.0%) |
| 18 to 34 Years | 0 (0.0%) | 2 (3.0%) |
| 35 to 64 Years | 10 (9.7%) | 27 (27.3%) |
| 65 to 74 Years | 3 (16.7%) | 3 (12.5%) |
| 75 Years and over | 2 (9.5%) | 6 (27.3%) |
Disability Class: Self-Care Difficulty
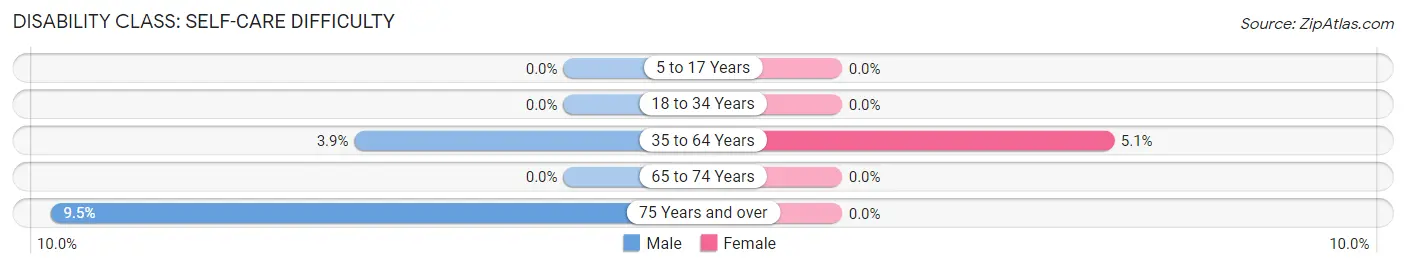
| Age Bracket | Male | Female |
| 5 to 17 Years | 0 (0.0%) | 0 (0.0%) |
| 18 to 34 Years | 0 (0.0%) | 0 (0.0%) |
| 35 to 64 Years | 4 (3.9%) | 5 (5.1%) |
| 65 to 74 Years | 0 (0.0%) | 0 (0.0%) |
| 75 Years and over | 2 (9.5%) | 0 (0.0%) |
Technology Access in Bucoda
Computing Device Access in Bucoda
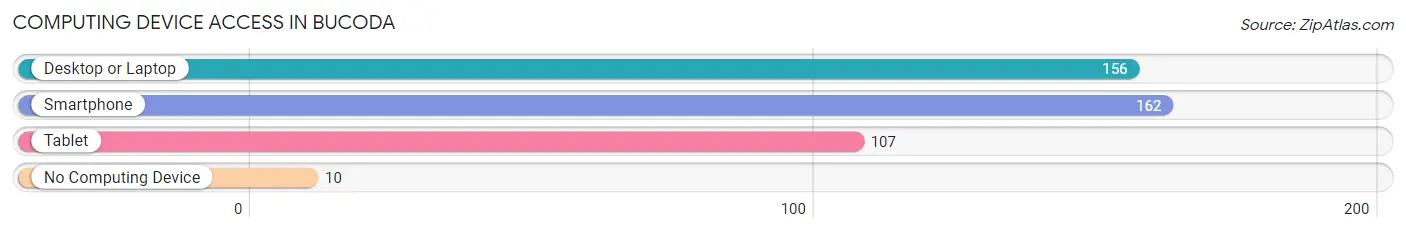
| Device Type | # Households | % Households |
| Desktop or Laptop | 156 | 83.9% |
| Smartphone | 162 | 87.1% |
| Tablet | 107 | 57.5% |
| No Computing Device | 10 | 5.4% |
| Total | 186 | 100.0% |
Internet Access in Bucoda
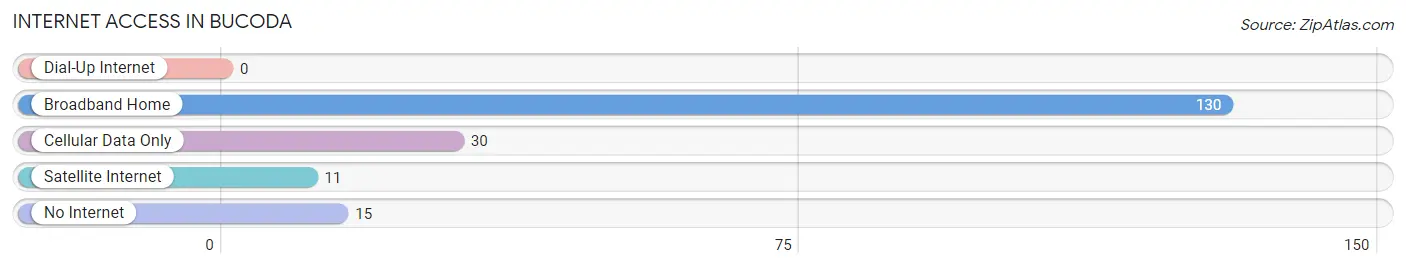
| Internet Type | # Households | % Households |
| Dial-Up Internet | 0 | 0.0% |
| Broadband Home | 130 | 69.9% |
| Cellular Data Only | 30 | 16.1% |
| Satellite Internet | 11 | 5.9% |
| No Internet | 15 | 8.1% |
| Total | 186 | 100.0% |
Bucoda Summary
Bucoda is a small town located in Thurston County, Washington, United States. It is situated in the foothills of the Cascade Mountains, approximately 10 miles south of Olympia. The population of Bucoda was estimated to be 545 in the year 2000.
History
The area that is now Bucoda was first settled in the late 1800s by a group of settlers from Ohio. The town was originally known as “Bucoda Station” and was a stop on the Northern Pacific Railroad. The name “Bucoda” is derived from the Native American word “bukwud”, which means “place of the wild geese”.
In the early 1900s, the town was a thriving logging and farming community. The town was incorporated in 1909 and the first mayor was elected in 1910. The town was home to several businesses, including a sawmill, a general store, a hotel, and a blacksmith shop.
In the 1950s, the town began to decline as the logging industry moved away from the area. The population of Bucoda decreased from a peak of 1,000 in the 1950s to just 545 in the year 2000.
Geography
Bucoda is located in the foothills of the Cascade Mountains, approximately 10 miles south of Olympia. The town is situated on the banks of the Deschutes River, which flows through the town. The town is surrounded by forests and is home to several small lakes.
The climate in Bucoda is mild and temperate. The average temperature in the summer is around 70 degrees Fahrenheit and the average temperature in the winter is around 40 degrees Fahrenheit.
Economy
The economy of Bucoda is largely based on agriculture and forestry. The town is home to several small farms and ranches, as well as a few logging companies. The town is also home to several small businesses, including a grocery store, a hardware store, and a restaurant.
Demographics
The population of Bucoda was estimated to be 545 in the year 2000. The racial makeup of the town was 94.3% White, 0.7% African American, 0.4% Native American, 0.4% Asian, 0.2% Pacific Islander, and 3.9% from other races. The median household income in Bucoda was $37,500 in the year 2000.
Conclusion
Bucoda is a small town located in Thurston County, Washington, United States. It is situated in the foothills of the Cascade Mountains, approximately 10 miles south of Olympia. The population of Bucoda was estimated to be 545 in the year 2000. The economy of Bucoda is largely based on agriculture and forestry, and the town is home to several small businesses. The racial makeup of the town was 94.3% White, 0.7% African American, 0.4% Native American, 0.4% Asian, 0.2% Pacific Islander, and 3.9% from other races. The median household income in Bucoda was $37,500 in the year 2000.
Common Questions
What is Per Capita Income in Bucoda?
Per Capita income in Bucoda is $22,461.
What is the Median Family Income in Bucoda?
Median Family Income in Bucoda is $61,406.
What is the Median Household income in Bucoda?
Median Household Income in Bucoda is $62,188.
What is Income or Wage Gap in Bucoda?
Income or Wage Gap in Bucoda is 2.8%.
Women in Bucoda earn 97.2 cents for every dollar earned by a man.
What is Inequality or Gini Index in Bucoda?
Inequality or Gini Index in Bucoda is 0.32.
What is the Total Population of Bucoda?
Total Population of Bucoda is 564.
What is the Total Male Population of Bucoda?
Total Male Population of Bucoda is 274.
What is the Total Female Population of Bucoda?
Total Female Population of Bucoda is 290.
What is the Ratio of Males per 100 Females in Bucoda?
There are 94.48 Males per 100 Females in Bucoda.
What is the Ratio of Females per 100 Males in Bucoda?
There are 105.84 Females per 100 Males in Bucoda.
What is the Median Population Age in Bucoda?
Median Population Age in Bucoda is 36.0 Years.
What is the Average Family Size in Bucoda
Average Family Size in Bucoda is 2.8 People.
What is the Average Household Size in Bucoda
Average Household Size in Bucoda is 3.0 People.
How Large is the Labor Force in Bucoda?
There are 233 People in the Labor Forcein in Bucoda.
What is the Percentage of People in the Labor Force in Bucoda?
56.0% of People are in the Labor Force in Bucoda.
What is the Unemployment Rate in Bucoda?
Unemployment Rate in Bucoda is 10.3%.