Woodruff, UT Map & Demographics
Woodruff Map
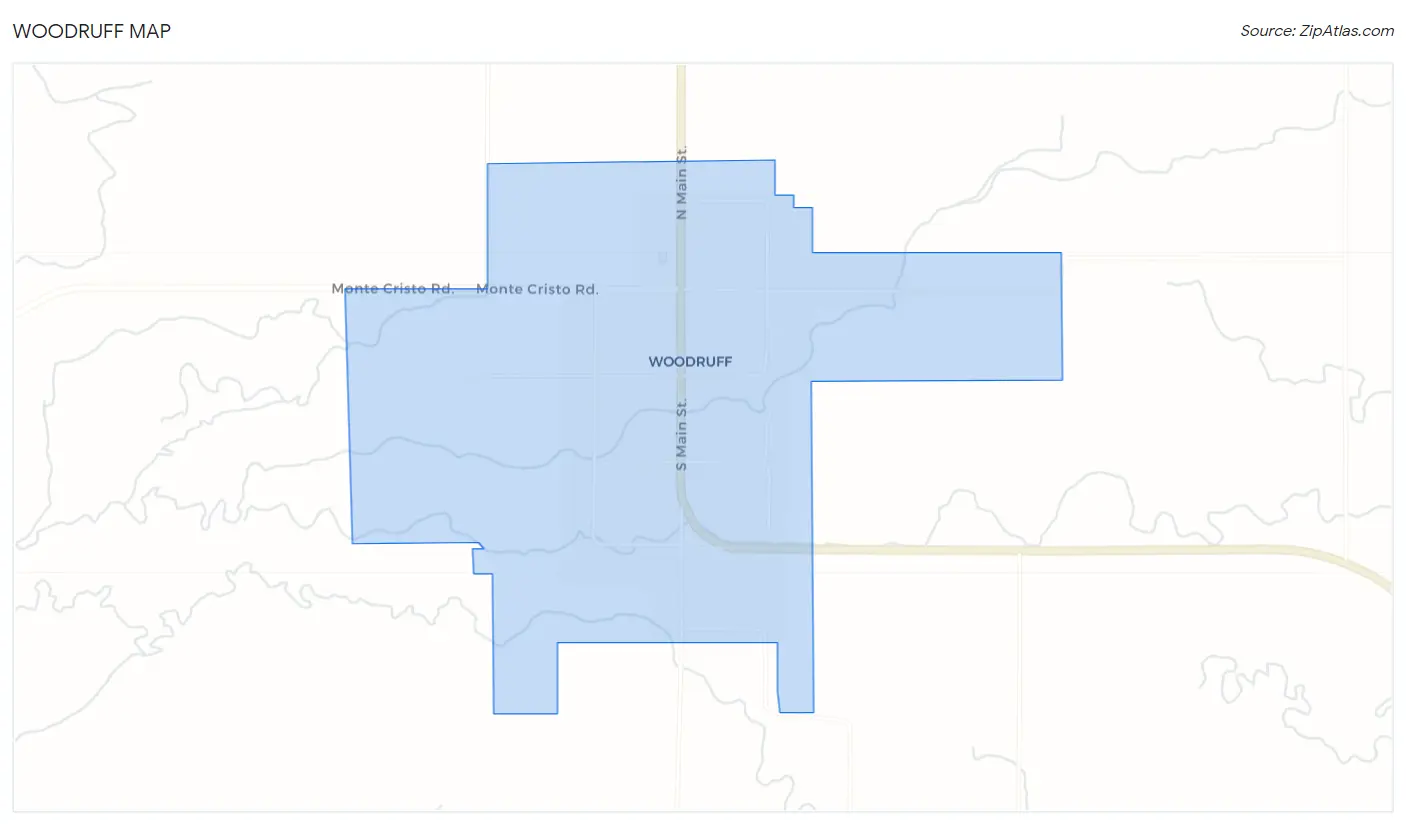
Woodruff Overview
$32,942
PER CAPITA INCOME
$138,295
AVG FAMILY INCOME
0.35
INEQUALITY / GINI INDEX
262
TOTAL POPULATION
151
MALE POPULATION
111
FEMALE POPULATION
136.04
MALES / 100 FEMALES
73.51
FEMALES / 100 MALES
31.5
MEDIAN AGE
3.5
AVG FAMILY SIZE
3.0
AVG HOUSEHOLD SIZE
88
LABOR FORCE [ PEOPLE ]
55.3%
PERCENT IN LABOR FORCE
Woodruff Zip Codes
Woodruff Area Codes
Income in Woodruff
Income Overview in Woodruff
| Characteristic | Number | Measure |
| Per Capita Income | 262 | $32,942 |
| Median Family Income | 71 | $138,295 |
| Mean Family Income | 71 | $119,106 |
| Median Household Income | 88 | $0 |
| Mean Household Income | 88 | $106,116 |
| Income Deficit | 71 | $0 |
| Wage / Income Gap (%) | 262 | 0.00% |
| Wage / Income Gap ($) | 262 | 100.00¢ per $1 |
| Gini / Inequality Index | 262 | 0.35 |
Earnings by Sex in Woodruff
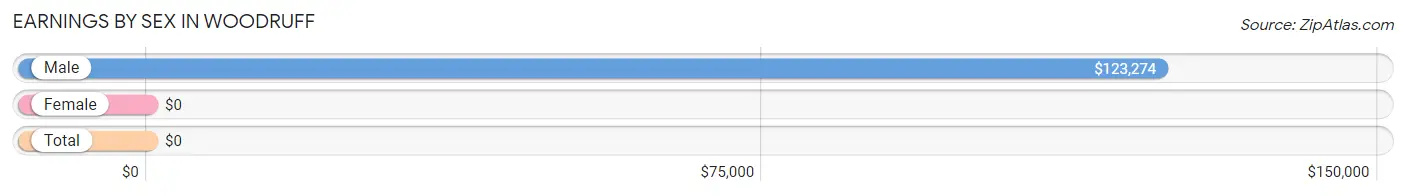
| Sex | Number | Average Earnings |
| Male | 63 (71.6%) | $123,274 |
| Female | 25 (28.4%) | $0 |
| Total | 88 (100.0%) | $0 |
Earnings by Sex by Income Bracket in Woodruff
The most common earnings brackets in Woodruff are $100,000+ for men (38 | 60.3%) and $2,499 or less for women (9 | 36.0%).
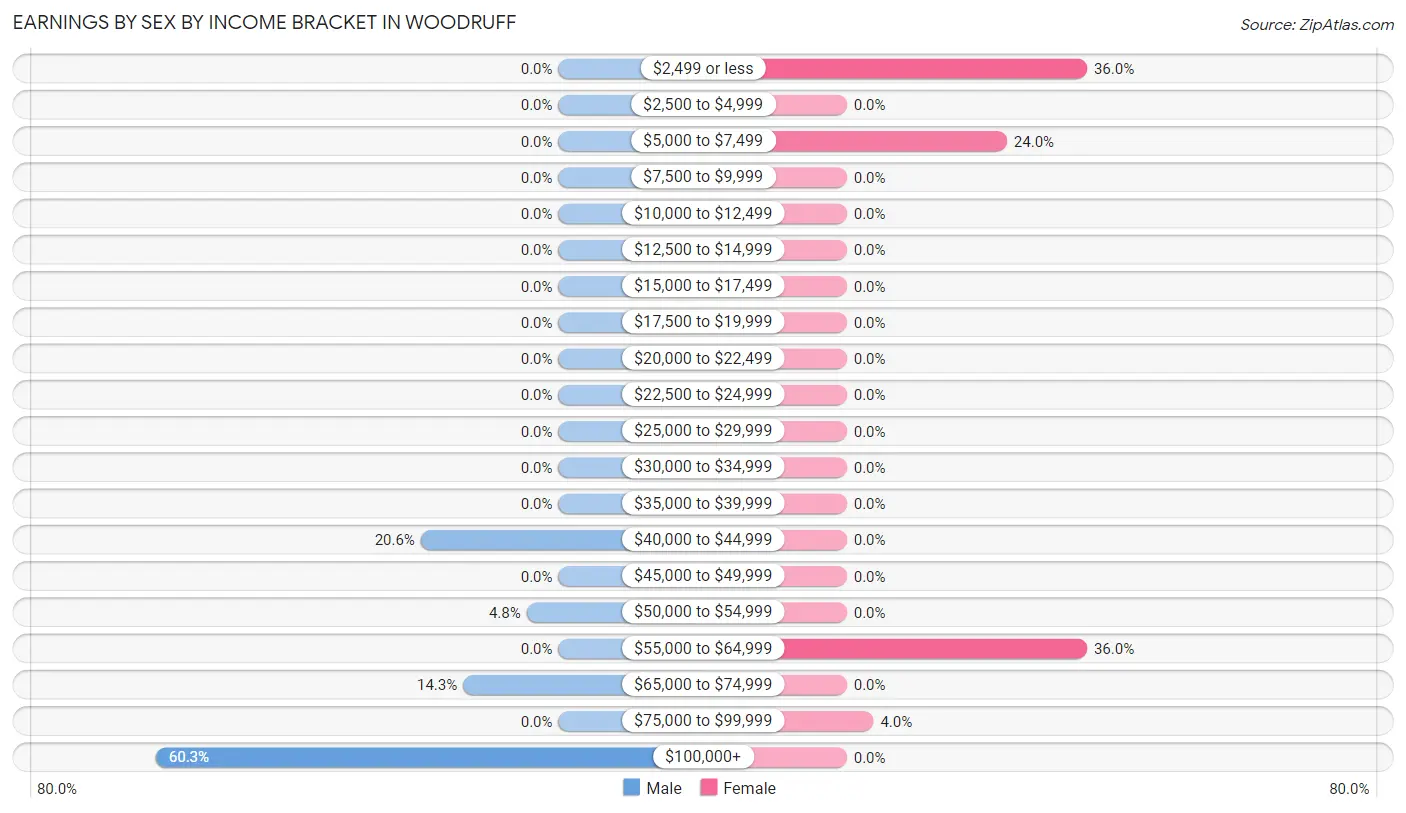
| Income | Male | Female |
| $2,499 or less | 0 (0.0%) | 9 (36.0%) |
| $2,500 to $4,999 | 0 (0.0%) | 0 (0.0%) |
| $5,000 to $7,499 | 0 (0.0%) | 6 (24.0%) |
| $7,500 to $9,999 | 0 (0.0%) | 0 (0.0%) |
| $10,000 to $12,499 | 0 (0.0%) | 0 (0.0%) |
| $12,500 to $14,999 | 0 (0.0%) | 0 (0.0%) |
| $15,000 to $17,499 | 0 (0.0%) | 0 (0.0%) |
| $17,500 to $19,999 | 0 (0.0%) | 0 (0.0%) |
| $20,000 to $22,499 | 0 (0.0%) | 0 (0.0%) |
| $22,500 to $24,999 | 0 (0.0%) | 0 (0.0%) |
| $25,000 to $29,999 | 0 (0.0%) | 0 (0.0%) |
| $30,000 to $34,999 | 0 (0.0%) | 0 (0.0%) |
| $35,000 to $39,999 | 0 (0.0%) | 0 (0.0%) |
| $40,000 to $44,999 | 13 (20.6%) | 0 (0.0%) |
| $45,000 to $49,999 | 0 (0.0%) | 0 (0.0%) |
| $50,000 to $54,999 | 3 (4.8%) | 0 (0.0%) |
| $55,000 to $64,999 | 0 (0.0%) | 9 (36.0%) |
| $65,000 to $74,999 | 9 (14.3%) | 0 (0.0%) |
| $75,000 to $99,999 | 0 (0.0%) | 1 (4.0%) |
| $100,000+ | 38 (60.3%) | 0 (0.0%) |
| Total | 63 (100.0%) | 25 (100.0%) |
Earnings by Sex by Educational Attainment in Woodruff
| Educational Attainment | Male Income | Female Income |
| Less than High School | - | - |
| High School Diploma | - | - |
| College or Associate's Degree | - | - |
| Bachelor's Degree | - | - |
| Graduate Degree | - | - |
| Total | $123,631 | $0 |
Family Income in Woodruff
Family Income Brackets in Woodruff
According to the Woodruff family income data, there are 20 families falling into the $100,000 to $149,999 income range, which is the most common income bracket and makes up 28.2% of all families.
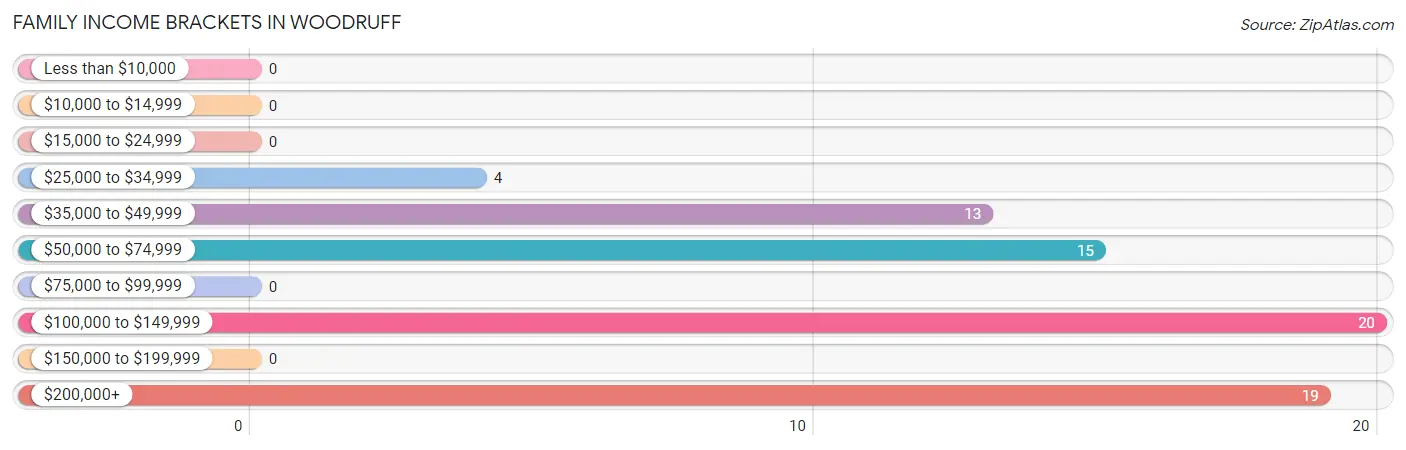
| Income Bracket | # Families | % Families |
| Less than $10,000 | 0 | 0.0% |
| $10,000 to $14,999 | 0 | 0.0% |
| $15,000 to $24,999 | 0 | 0.0% |
| $25,000 to $34,999 | 4 | 5.6% |
| $35,000 to $49,999 | 13 | 18.3% |
| $50,000 to $74,999 | 15 | 21.1% |
| $75,000 to $99,999 | 0 | 0.0% |
| $100,000 to $149,999 | 20 | 28.2% |
| $150,000 to $199,999 | 0 | 0.0% |
| $200,000+ | 19 | 26.8% |
Family Income by Famaliy Size in Woodruff
3-person families (25 | 35.2%) account for the highest median family income in Woodruff with $208,403 per family, while 3-person families (25 | 35.2%) have the highest median income of $69,468 per family member.
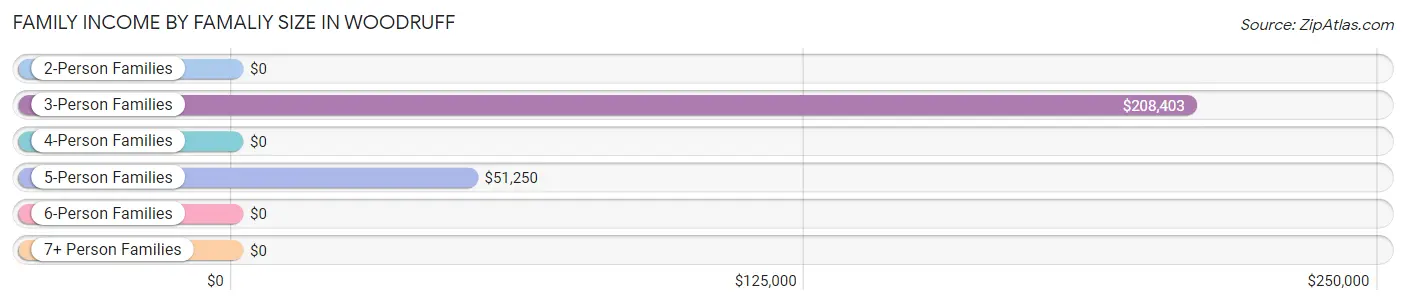
| Income Bracket | # Families | Median Income |
| 2-Person Families | 20 (28.2%) | $0 |
| 3-Person Families | 25 (35.2%) | $208,403 |
| 4-Person Families | 9 (12.7%) | $0 |
| 5-Person Families | 17 (23.9%) | $51,250 |
| 6-Person Families | 0 (0.0%) | $0 |
| 7+ Person Families | 0 (0.0%) | $0 |
| Total | 71 (100.0%) | $138,295 |
Family Income by Number of Earners in Woodruff
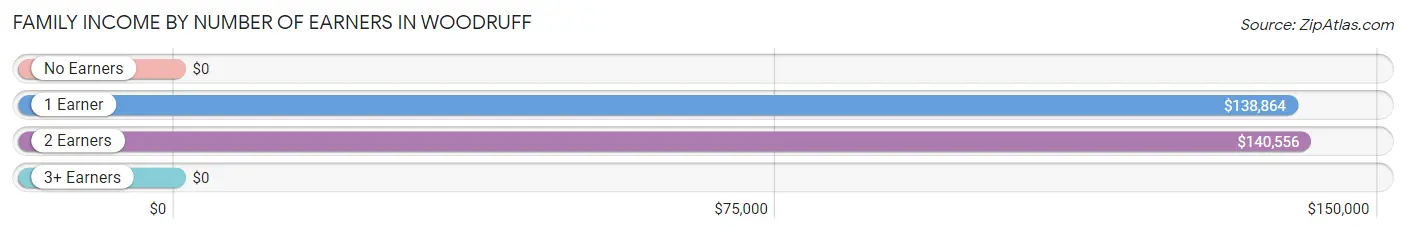
| Number of Earners | # Families | Median Income |
| No Earners | 9 (12.7%) | $0 |
| 1 Earner | 46 (64.8%) | $138,864 |
| 2 Earners | 16 (22.5%) | $140,556 |
| 3+ Earners | 0 (0.0%) | $0 |
| Total | 71 (100.0%) | $138,295 |
Household Income in Woodruff
Household Income Brackets in Woodruff
With 28 households falling in the category, the $50,000 to $74,999 income range is the most frequent in Woodruff, accounting for 31.8% of all households.
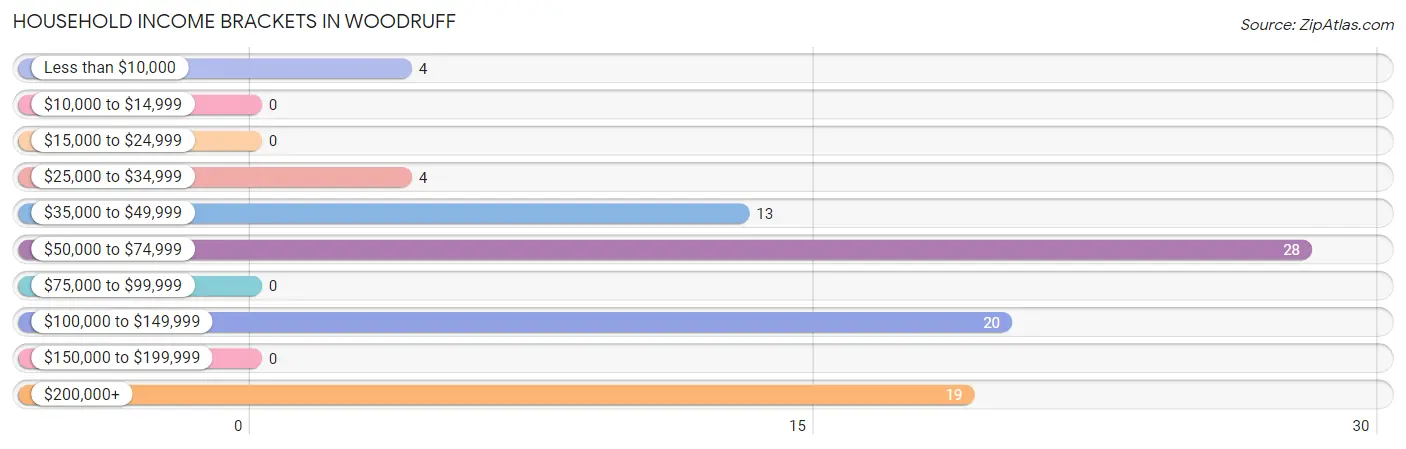
| Income Bracket | # Households | % Households |
| Less than $10,000 | 4 | 4.5% |
| $10,000 to $14,999 | 0 | 0.0% |
| $15,000 to $24,999 | 0 | 0.0% |
| $25,000 to $34,999 | 4 | 4.5% |
| $35,000 to $49,999 | 13 | 14.8% |
| $50,000 to $74,999 | 28 | 31.8% |
| $75,000 to $99,999 | 0 | 0.0% |
| $100,000 to $149,999 | 20 | 22.7% |
| $150,000 to $199,999 | 0 | 0.0% |
| $200,000+ | 19 | 21.6% |
Household Income by Householder Age in Woodruff
The median household income in Woodruff is $0, with the highest median household income of $139,205 found in the 45 to 64 years age bracket for the primary householder. A total of 45 households (51.1%) fall into this category. Meanwhile, the 15 to 24 years age bracket for the primary householder has the lowest median household income of $0, with 6 households (6.8%) in this group.
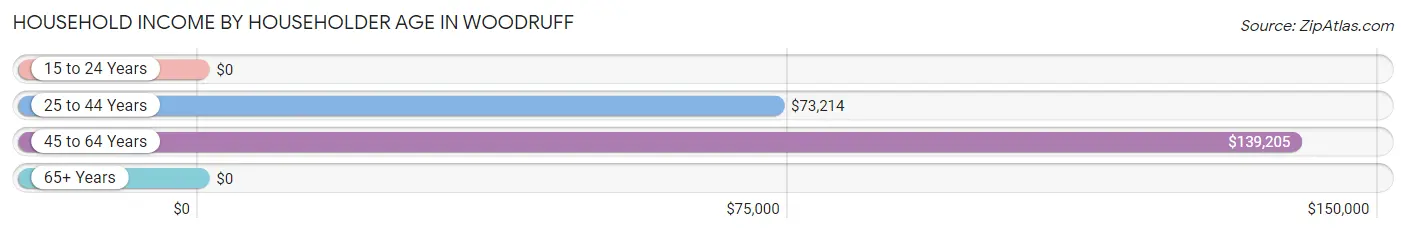
| Income Bracket | # Households | Median Income |
| 15 to 24 Years | 6 (6.8%) | $0 |
| 25 to 44 Years | 28 (31.8%) | $73,214 |
| 45 to 64 Years | 45 (51.1%) | $139,205 |
| 65+ Years | 9 (10.2%) | $0 |
| Total | 88 (100.0%) | $0 |
Poverty in Woodruff
Income Below Poverty by Sex and Age in Woodruff
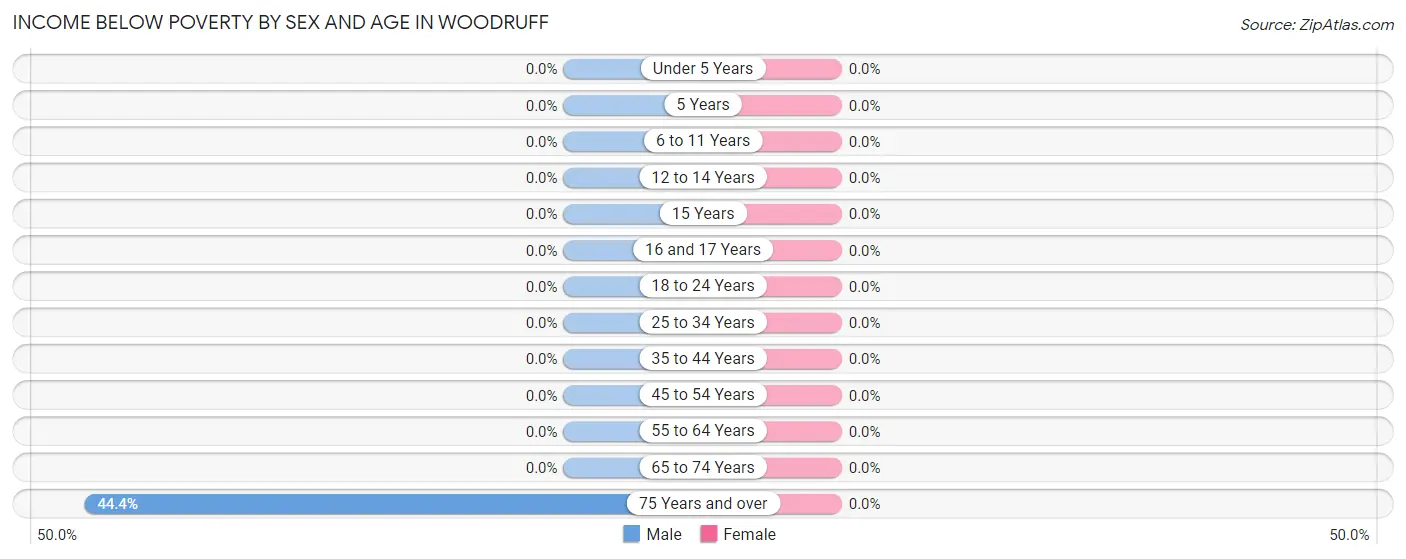
| Age Bracket | Male | Female |
| Under 5 Years | 0 (0.0%) | 0 (0.0%) |
| 5 Years | 0 (0.0%) | 0 (0.0%) |
| 6 to 11 Years | 0 (0.0%) | 0 (0.0%) |
| 12 to 14 Years | 0 (0.0%) | 0 (0.0%) |
| 15 Years | 0 (0.0%) | 0 (0.0%) |
| 16 and 17 Years | 0 (0.0%) | 0 (0.0%) |
| 18 to 24 Years | 0 (0.0%) | 0 (0.0%) |
| 25 to 34 Years | 0 (0.0%) | 0 (0.0%) |
| 35 to 44 Years | 0 (0.0%) | 0 (0.0%) |
| 45 to 54 Years | 0 (0.0%) | 0 (0.0%) |
| 55 to 64 Years | 0 (0.0%) | 0 (0.0%) |
| 65 to 74 Years | 0 (0.0%) | 0 (0.0%) |
| 75 Years and over | 4 (44.4%) | 0 (0.0%) |
| Total | 4 (2.6%) | 0 (0.0%) |
Income Above Poverty by Sex and Age in Woodruff
According to the poverty statistics in Woodruff, males aged under 5 years and females aged under 5 years are the age groups that are most secure financially, with 100.0% of males and 100.0% of females in these age groups living above the poverty line.
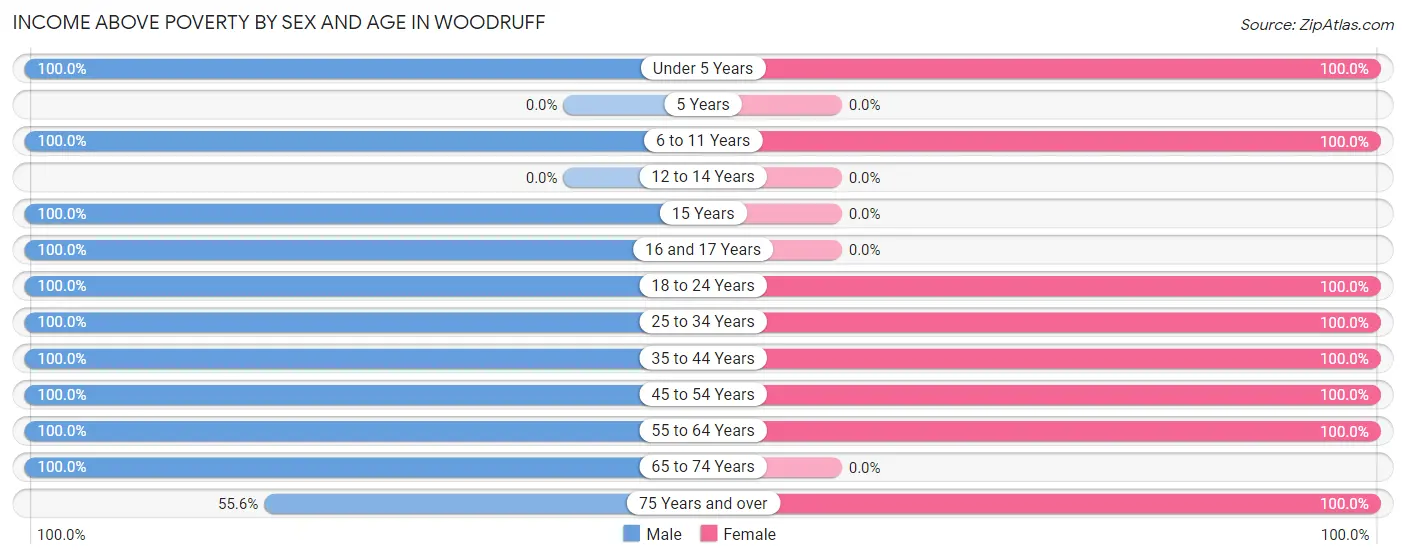
| Age Bracket | Male | Female |
| Under 5 Years | 15 (100.0%) | 8 (100.0%) |
| 5 Years | 0 (0.0%) | 0 (0.0%) |
| 6 to 11 Years | 29 (100.0%) | 24 (100.0%) |
| 12 to 14 Years | 0 (0.0%) | 0 (0.0%) |
| 15 Years | 27 (100.0%) | 0 (0.0%) |
| 16 and 17 Years | 3 (100.0%) | 0 (0.0%) |
| 18 to 24 Years | 6 (100.0%) | 6 (100.0%) |
| 25 to 34 Years | 10 (100.0%) | 27 (100.0%) |
| 35 to 44 Years | 3 (100.0%) | 7 (100.0%) |
| 45 to 54 Years | 19 (100.0%) | 30 (100.0%) |
| 55 to 64 Years | 4 (100.0%) | 4 (100.0%) |
| 65 to 74 Years | 26 (100.0%) | 0 (0.0%) |
| 75 Years and over | 5 (55.6%) | 5 (100.0%) |
| Total | 147 (97.4%) | 111 (100.0%) |
Income Below Poverty Among Married-Couple Families in Woodruff
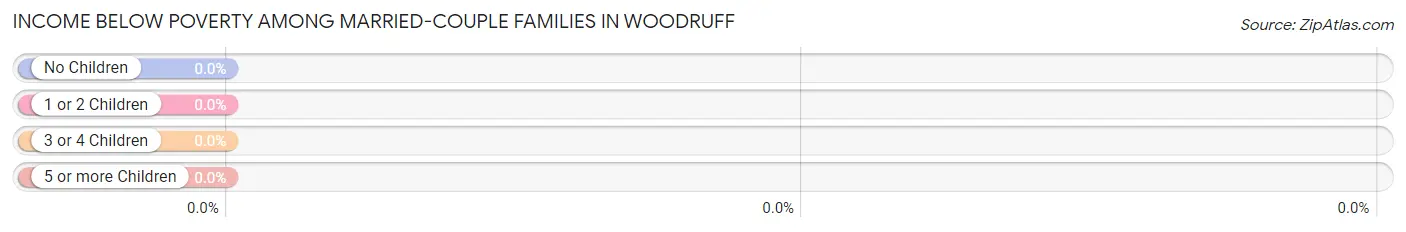
| Children | Above Poverty | Below Poverty |
| No Children | 20 (100.0%) | 0 (0.0%) |
| 1 or 2 Children | 34 (100.0%) | 0 (0.0%) |
| 3 or 4 Children | 17 (100.0%) | 0 (0.0%) |
| 5 or more Children | 0 (0.0%) | 0 (0.0%) |
| Total | 71 (100.0%) | 0 (0.0%) |
Income Below Poverty Among Single-Parent Households in Woodruff
| Children | Single Father | Single Mother |
| No Children | 0 (0.0%) | 0 (0.0%) |
| 1 or 2 Children | 0 (0.0%) | 0 (0.0%) |
| 3 or 4 Children | 0 (0.0%) | 0 (0.0%) |
| 5 or more Children | 0 (0.0%) | 0 (0.0%) |
| Total | 0 (0.0%) | 0 (0.0%) |
Income Below Poverty Among Married-Couple vs Single-Parent Households in Woodruff
| Children | Married-Couple Families | Single-Parent Households |
| No Children | 0 (0.0%) | 0 (0.0%) |
| 1 or 2 Children | 0 (0.0%) | 0 (0.0%) |
| 3 or 4 Children | 0 (0.0%) | 0 (0.0%) |
| 5 or more Children | 0 (0.0%) | 0 (0.0%) |
| Total | 0 (0.0%) | 0 (0.0%) |
Race in Woodruff
The most populous races in Woodruff are White / Caucasian (243 | 92.7%), Hispanic or Latino (19 | 7.2%), and Two or more Races (19 | 7.2%).
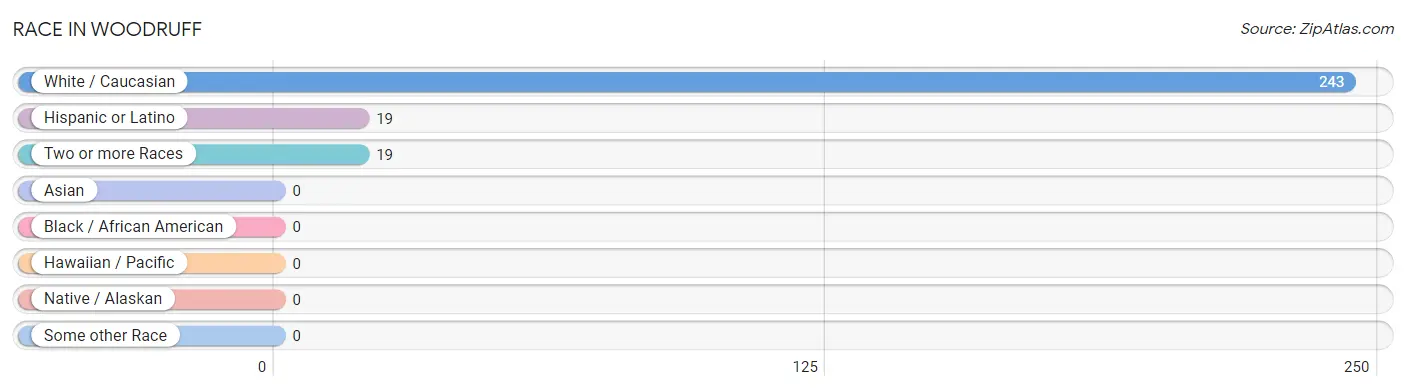
| Race | # Population | % Population |
| Asian | 0 | 0.0% |
| Black / African American | 0 | 0.0% |
| Hawaiian / Pacific | 0 | 0.0% |
| Hispanic or Latino | 19 | 7.2% |
| Native / Alaskan | 0 | 0.0% |
| White / Caucasian | 243 | 92.7% |
| Two or more Races | 19 | 7.2% |
| Some other Race | 0 | 0.0% |
| Total | 262 | 100.0% |
Ancestry in Woodruff
The most populous ancestries reported in Woodruff are English (163 | 62.2%), Danish (66 | 25.2%), Italian (48 | 18.3%), German (41 | 15.7%), and European (27 | 10.3%), together accounting for 131.7% of all Woodruff residents.
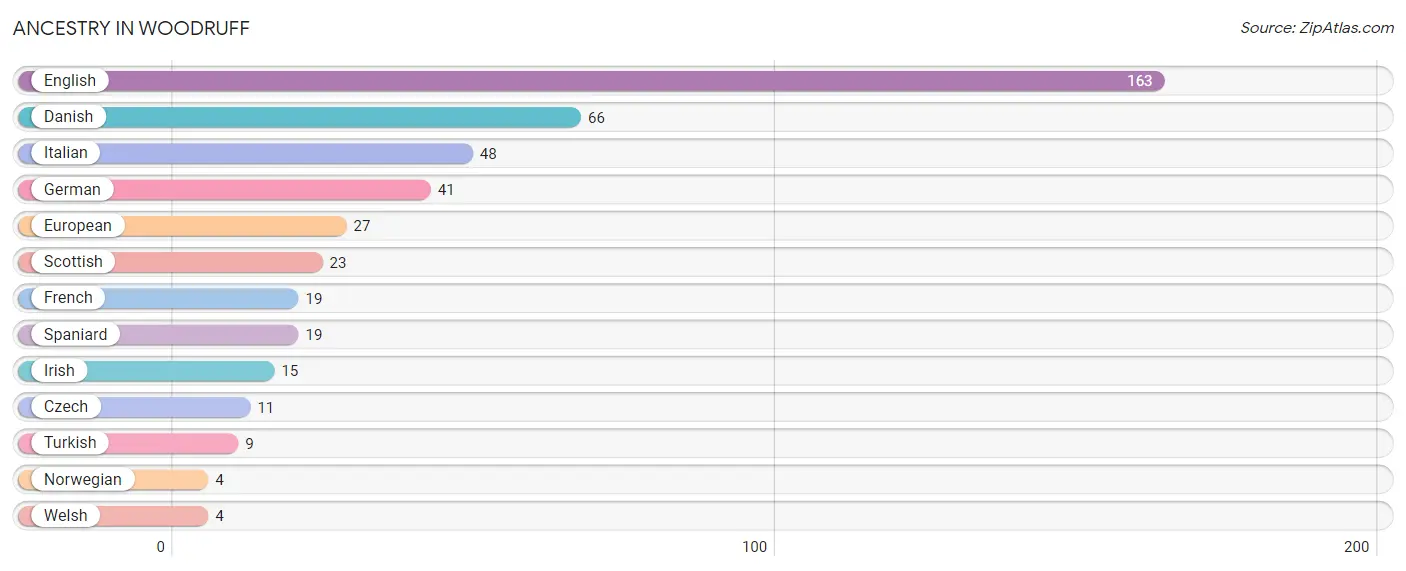
| Ancestry | # Population | % Population |
| Czech | 11 | 4.2% |
| Danish | 66 | 25.2% |
| English | 163 | 62.2% |
| European | 27 | 10.3% |
| French | 19 | 7.2% |
| German | 41 | 15.7% |
| Irish | 15 | 5.7% |
| Italian | 48 | 18.3% |
| Norwegian | 4 | 1.5% |
| Scottish | 23 | 8.8% |
| Spaniard | 19 | 7.2% |
| Turkish | 9 | 3.4% |
| Welsh | 4 | 1.5% | View All 13 Rows |
Immigrants in Woodruff

| Immigration Origin | # Population | % Population | View All 0 Rows |
Sex and Age in Woodruff
Sex and Age in Woodruff
The most populous age groups in Woodruff are 15 to 19 Years (30 | 19.9%) for men and 50 to 54 Years (29 | 26.1%) for women.
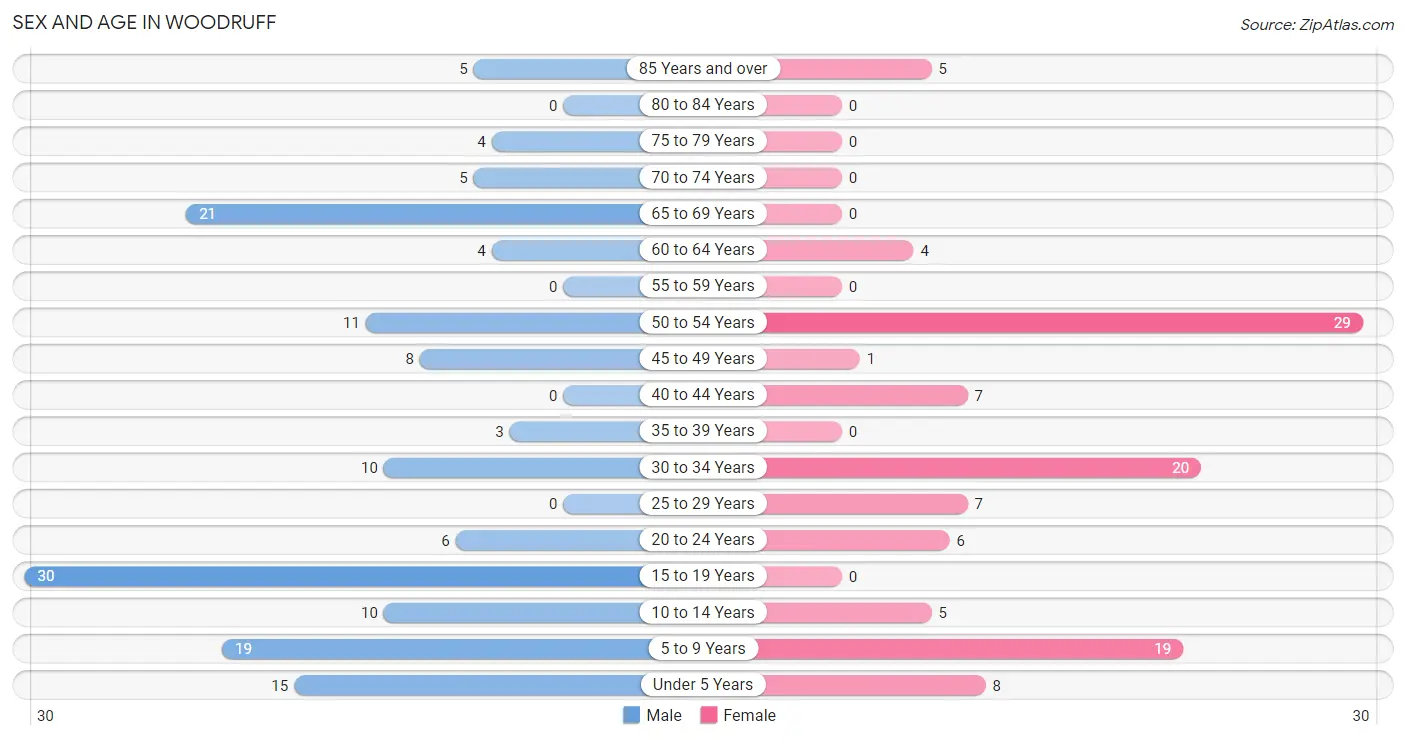
| Age Bracket | Male | Female |
| Under 5 Years | 15 (9.9%) | 8 (7.2%) |
| 5 to 9 Years | 19 (12.6%) | 19 (17.1%) |
| 10 to 14 Years | 10 (6.6%) | 5 (4.5%) |
| 15 to 19 Years | 30 (19.9%) | 0 (0.0%) |
| 20 to 24 Years | 6 (4.0%) | 6 (5.4%) |
| 25 to 29 Years | 0 (0.0%) | 7 (6.3%) |
| 30 to 34 Years | 10 (6.6%) | 20 (18.0%) |
| 35 to 39 Years | 3 (2.0%) | 0 (0.0%) |
| 40 to 44 Years | 0 (0.0%) | 7 (6.3%) |
| 45 to 49 Years | 8 (5.3%) | 1 (0.9%) |
| 50 to 54 Years | 11 (7.3%) | 29 (26.1%) |
| 55 to 59 Years | 0 (0.0%) | 0 (0.0%) |
| 60 to 64 Years | 4 (2.6%) | 4 (3.6%) |
| 65 to 69 Years | 21 (13.9%) | 0 (0.0%) |
| 70 to 74 Years | 5 (3.3%) | 0 (0.0%) |
| 75 to 79 Years | 4 (2.6%) | 0 (0.0%) |
| 80 to 84 Years | 0 (0.0%) | 0 (0.0%) |
| 85 Years and over | 5 (3.3%) | 5 (4.5%) |
| Total | 151 (100.0%) | 111 (100.0%) |
Families and Households in Woodruff
Median Family Size in Woodruff
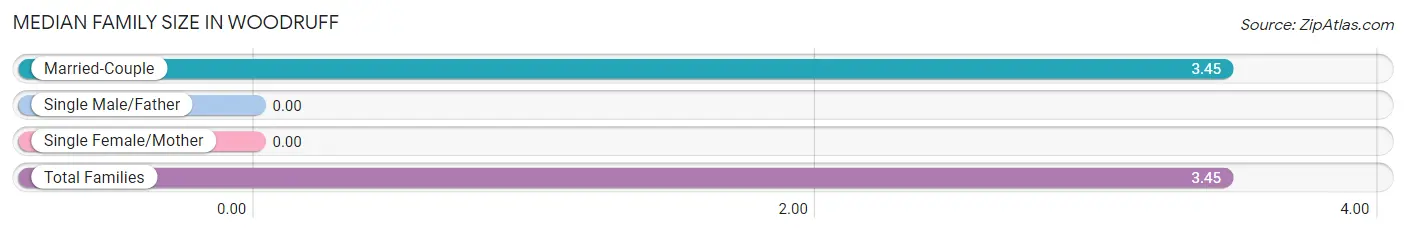
| Family Type | # Families | Family Size |
| Married-Couple | 71 (100.0%) | 3.45 |
| Single Male/Father | 0 (0.0%) | - |
| Single Female/Mother | 0 (0.0%) | - |
| Total Families | 71 (100.0%) | 3.45 |
Median Household Size in Woodruff
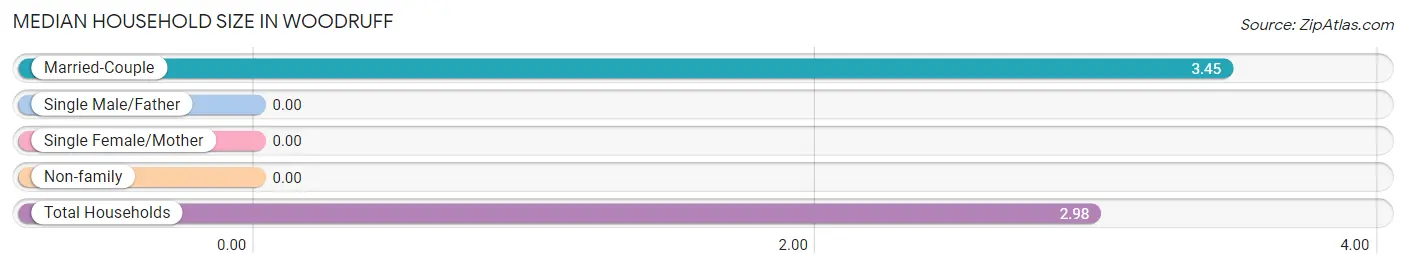
| Household Type | # Households | Household Size |
| Married-Couple | 71 (80.7%) | 3.45 |
| Single Male/Father | 0 (0.0%) | - |
| Single Female/Mother | 0 (0.0%) | - |
| Non-family | 17 (19.3%) | - |
| Total Households | 88 (100.0%) | 2.98 |
Household Size by Marriage Status in Woodruff
Out of a total of 88 households in Woodruff, 71 (80.7%) are family households, while 17 (19.3%) are nonfamily households. The most numerous type of family households are 3-person households, comprising 25, and the most common type of nonfamily households are 1-person households, comprising 17.
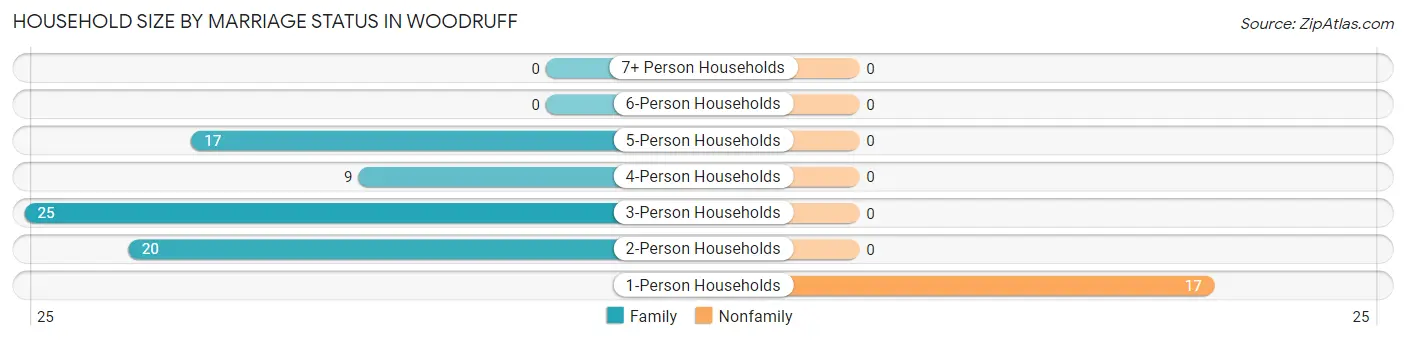
| Household Size | Family Households | Nonfamily Households |
| 1-Person Households | - | 17 (19.3%) |
| 2-Person Households | 20 (22.7%) | 0 (0.0%) |
| 3-Person Households | 25 (28.4%) | 0 (0.0%) |
| 4-Person Households | 9 (10.2%) | 0 (0.0%) |
| 5-Person Households | 17 (19.3%) | 0 (0.0%) |
| 6-Person Households | 0 (0.0%) | 0 (0.0%) |
| 7+ Person Households | 0 (0.0%) | 0 (0.0%) |
| Total | 71 (80.7%) | 17 (19.3%) |
Female Fertility in Woodruff
Fertility by Age in Woodruff
| Age Bracket | Women with Births | Births / 1,000 Women |
| 15 to 19 years | 0 (0.0%) | 0.0 |
| 20 to 34 years | 0 (0.0%) | 0.0 |
| 35 to 50 years | 0 (0.0%) | 0.0 |
| Total | 0 (0.0%) | 0.0 |
Fertility by Age by Marriage Status in Woodruff
| Age Bracket | Married | Unmarried |
| 15 to 19 years | 0 (0.0%) | 0 (0.0%) |
| 20 to 34 years | 0 (0.0%) | 0 (0.0%) |
| 35 to 50 years | 0 (0.0%) | 0 (0.0%) |
| Total | 0 (0.0%) | 0 (0.0%) |
Fertility by Education in Woodruff
| Educational Attainment | Women with Births | Births / 1,000 Women |
| Less than High School | 0 (0.0%) | 0.0 |
| High School Diploma | 0 (0.0%) | 0.0 |
| College or Associate's Degree | 0 (0.0%) | 0.0 |
| Bachelor's Degree | 0 (0.0%) | 0.0 |
| Graduate Degree | 0 (0.0%) | 0.0 |
| Total | 0 (0.0%) | 0.0 |
Fertility by Education by Marriage Status in Woodruff
| Educational Attainment | Married | Unmarried |
| Less than High School | 0 (0.0%) | 0 (0.0%) |
| High School Diploma | 0 (0.0%) | 0 (0.0%) |
| College or Associate's Degree | 0 (0.0%) | 0 (0.0%) |
| Bachelor's Degree | 0 (0.0%) | 0 (0.0%) |
| Graduate Degree | 0 (0.0%) | 0 (0.0%) |
| Total | 0 (0.0%) | 0 (0.0%) |
Employment Characteristics in Woodruff
Employment by Class of Employer in Woodruff
Among the 88 employed individuals in Woodruff, private company employees (76 | 86.4%), state government employees (11 | 12.5%), and self-employed (incorporated) (1 | 1.1%) make up the most common classes of employment.
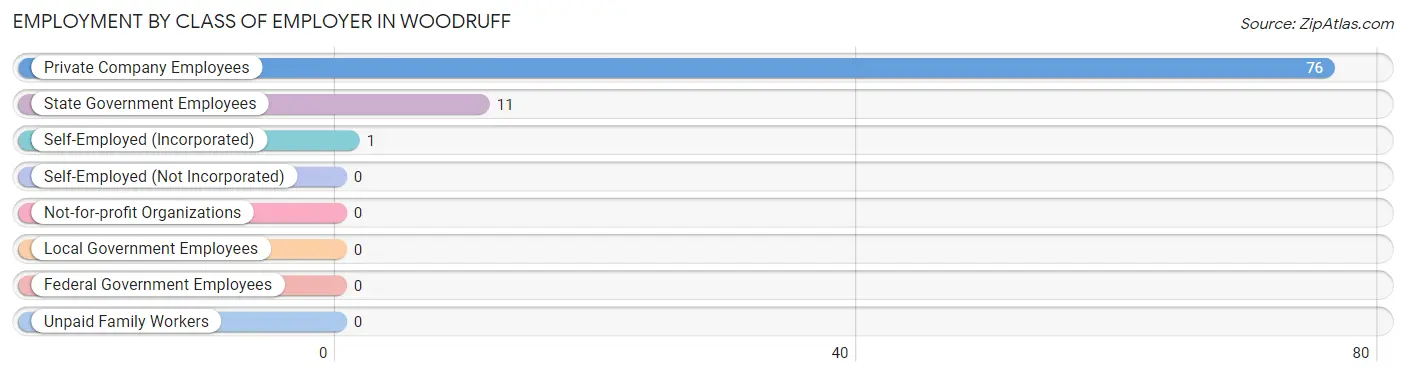
| Employer Class | # Employees | % Employees |
| Private Company Employees | 76 | 86.4% |
| Self-Employed (Incorporated) | 1 | 1.1% |
| Self-Employed (Not Incorporated) | 0 | 0.0% |
| Not-for-profit Organizations | 0 | 0.0% |
| Local Government Employees | 0 | 0.0% |
| State Government Employees | 11 | 12.5% |
| Federal Government Employees | 0 | 0.0% |
| Unpaid Family Workers | 0 | 0.0% |
| Total | 88 | 100.0% |
Employment Status by Age in Woodruff
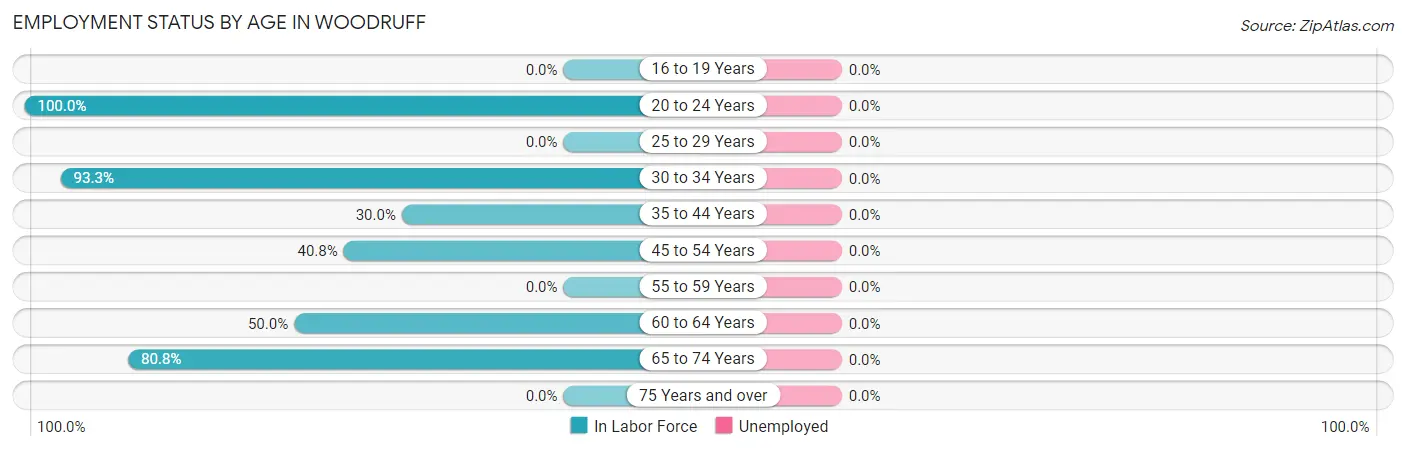
| Age Bracket | In Labor Force | Unemployed |
| 16 to 19 Years | 0 (0.0%) | 0 (0.0%) |
| 20 to 24 Years | 12 (100.0%) | 0 (0.0%) |
| 25 to 29 Years | 0 (0.0%) | 0 (0.0%) |
| 30 to 34 Years | 28 (93.3%) | 0 (0.0%) |
| 35 to 44 Years | 3 (30.0%) | 0 (0.0%) |
| 45 to 54 Years | 20 (40.8%) | 0 (0.0%) |
| 55 to 59 Years | 0 (0.0%) | 0 (0.0%) |
| 60 to 64 Years | 4 (50.0%) | 0 (0.0%) |
| 65 to 74 Years | 21 (80.8%) | 0 (0.0%) |
| 75 Years and over | 0 (0.0%) | 0 (0.0%) |
| Total | 88 (55.3%) | 0 (0.0%) |
Employment Status by Educational Attainment in Woodruff
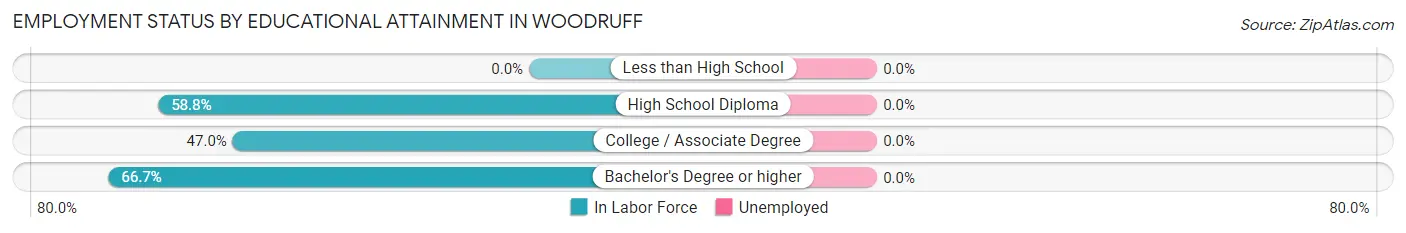
| Educational Attainment | In Labor Force | Unemployed |
| Less than High School | 0 (0.0%) | 0 (0.0%) |
| High School Diploma | 10 (58.8%) | 0 (0.0%) |
| College / Associate Degree | 31 (47.0%) | 0 (0.0%) |
| Bachelor's Degree or higher | 14 (66.7%) | 0 (0.0%) |
| Total | 55 (52.9%) | 0 (0.0%) |
Employment Occupations by Sex in Woodruff
Management, Business, Science and Arts Occupations
The most common Management, Business, Science and Arts occupations in Woodruff are Computers, Engineering & Science (21 | 23.9%), Architecture & Engineering (21 | 23.9%), Health Diagnosing & Treating (9 | 10.2%), Health Technologists (9 | 10.2%), and Community & Social Service (7 | 8.0%).
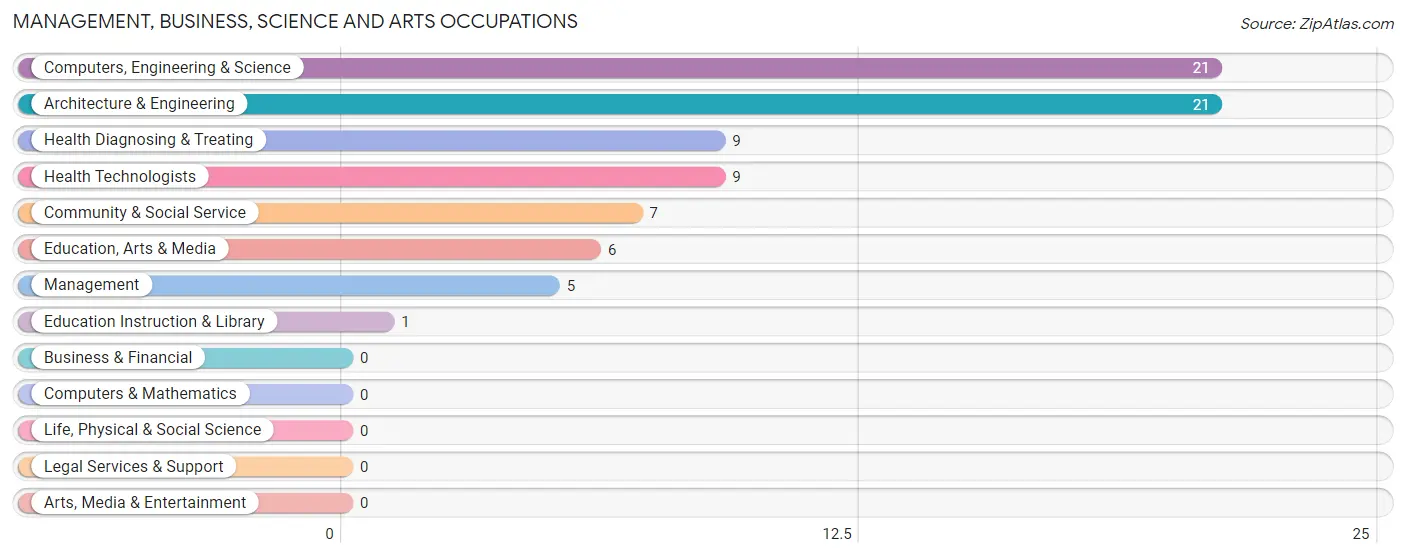
Management, Business, Science and Arts Occupations by Sex
Within the Management, Business, Science and Arts occupations in Woodruff, the most male-oriented occupations are Computers, Engineering & Science (100.0%), Architecture & Engineering (100.0%), and Community & Social Service (100.0%), while the most female-oriented occupations are Health Diagnosing & Treating (100.0%), Health Technologists (100.0%), and Management (20.0%).
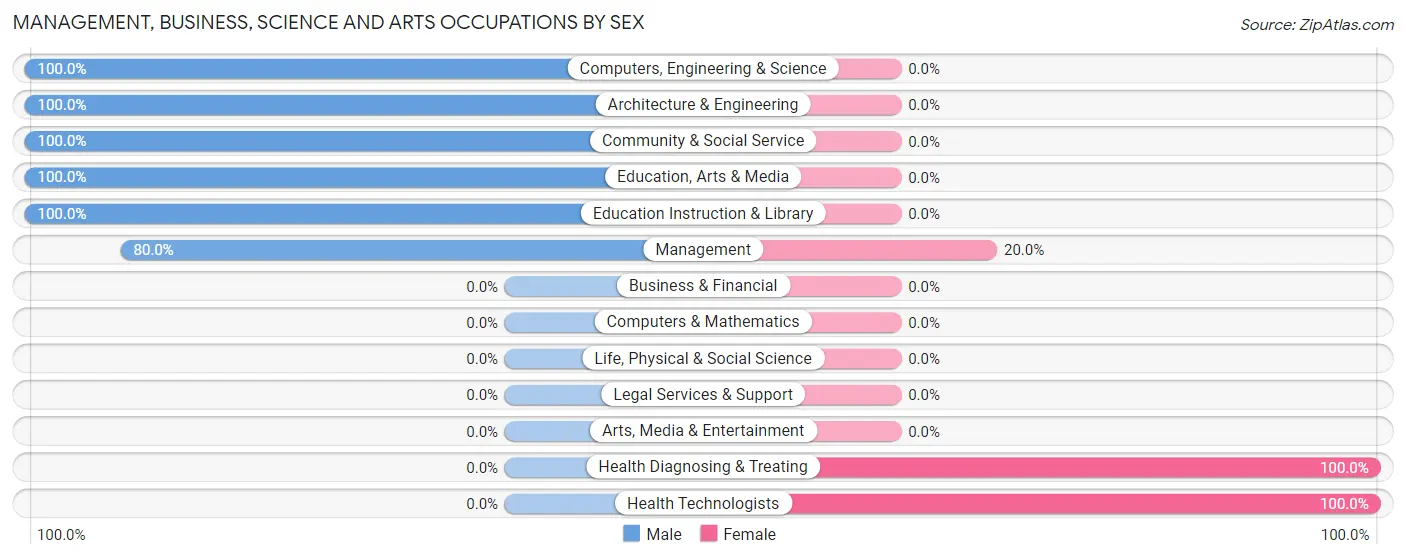
| Occupation | Male | Female |
| Management | 4 (80.0%) | 1 (20.0%) |
| Business & Financial | 0 (0.0%) | 0 (0.0%) |
| Computers, Engineering & Science | 21 (100.0%) | 0 (0.0%) |
| Computers & Mathematics | 0 (0.0%) | 0 (0.0%) |
| Architecture & Engineering | 21 (100.0%) | 0 (0.0%) |
| Life, Physical & Social Science | 0 (0.0%) | 0 (0.0%) |
| Community & Social Service | 7 (100.0%) | 0 (0.0%) |
| Education, Arts & Media | 6 (100.0%) | 0 (0.0%) |
| Legal Services & Support | 0 (0.0%) | 0 (0.0%) |
| Education Instruction & Library | 1 (100.0%) | 0 (0.0%) |
| Arts, Media & Entertainment | 0 (0.0%) | 0 (0.0%) |
| Health Diagnosing & Treating | 0 (0.0%) | 9 (100.0%) |
| Health Technologists | 0 (0.0%) | 9 (100.0%) |
| Total (Category) | 32 (76.2%) | 10 (23.8%) |
| Total (Overall) | 63 (71.6%) | 25 (28.4%) |
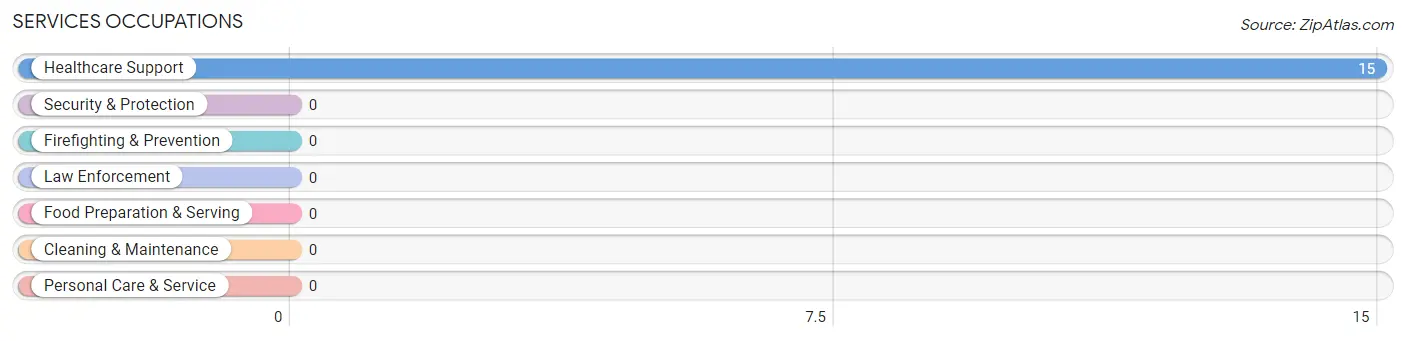
Services Occupations
The most common Services occupations in Woodruff are , and Healthcare Support (15 | 17.1%).
Services Occupations by Sex
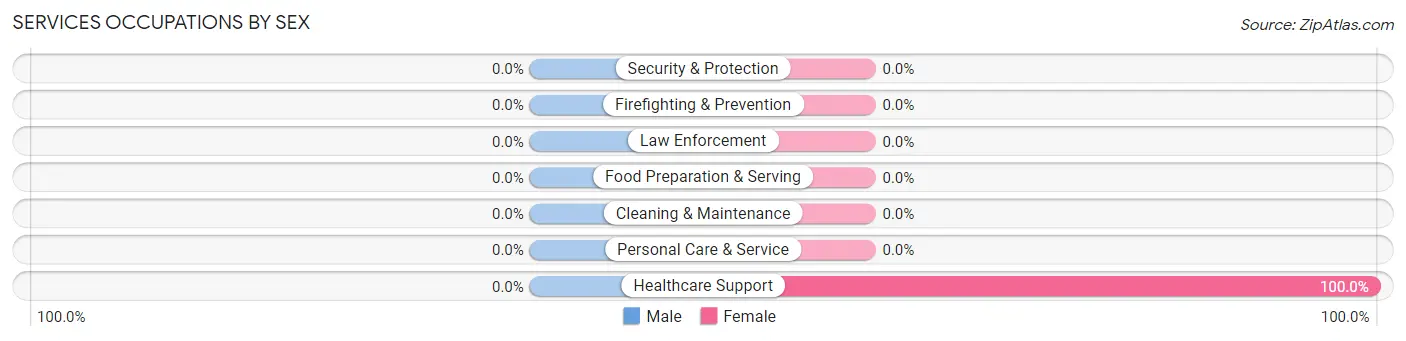
| Occupation | Male | Female |
| Healthcare Support | 0 (0.0%) | 15 (100.0%) |
| Security & Protection | 0 (0.0%) | 0 (0.0%) |
| Firefighting & Prevention | 0 (0.0%) | 0 (0.0%) |
| Law Enforcement | 0 (0.0%) | 0 (0.0%) |
| Food Preparation & Serving | 0 (0.0%) | 0 (0.0%) |
| Cleaning & Maintenance | 0 (0.0%) | 0 (0.0%) |
| Personal Care & Service | 0 (0.0%) | 0 (0.0%) |
| Total (Category) | 0 (0.0%) | 15 (100.0%) |
| Total (Overall) | 63 (71.6%) | 25 (28.4%) |
Sales and Office Occupations
The most common Sales and Office occupations in Woodruff are , and Sales & Related (3 | 3.4%).
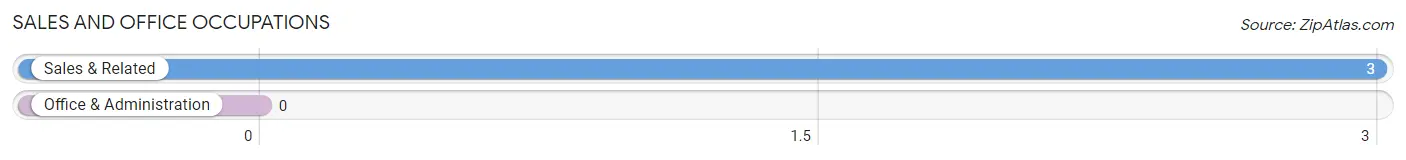
Sales and Office Occupations by Sex
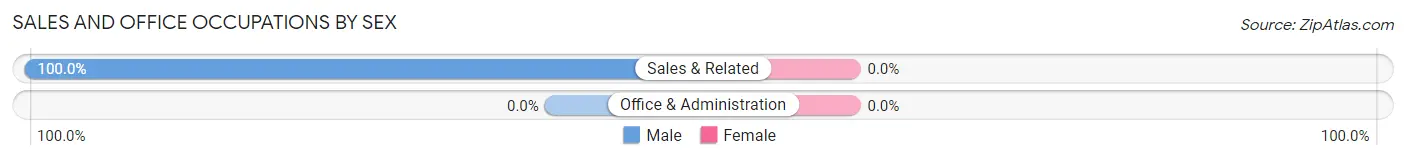
| Occupation | Male | Female |
| Sales & Related | 3 (100.0%) | 0 (0.0%) |
| Office & Administration | 0 (0.0%) | 0 (0.0%) |
| Total (Category) | 3 (100.0%) | 0 (0.0%) |
| Total (Overall) | 63 (71.6%) | 25 (28.4%) |
Natural Resources, Construction and Maintenance Occupations
The most common Natural Resources, Construction and Maintenance occupations in Woodruff are Farming, Fishing & Forestry (7 | 8.0%), and Installation, Maintenance & Repair (5 | 5.7%).
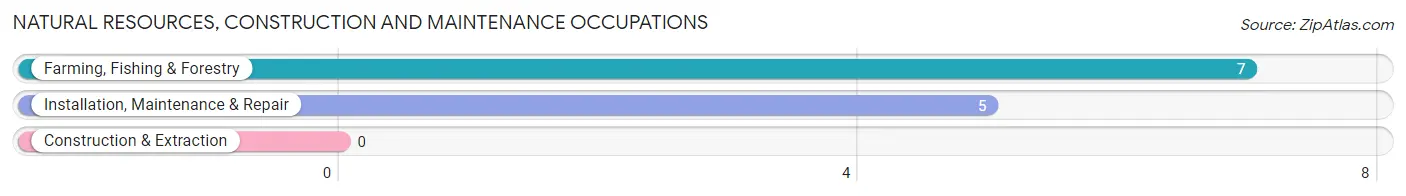
Natural Resources, Construction and Maintenance Occupations by Sex
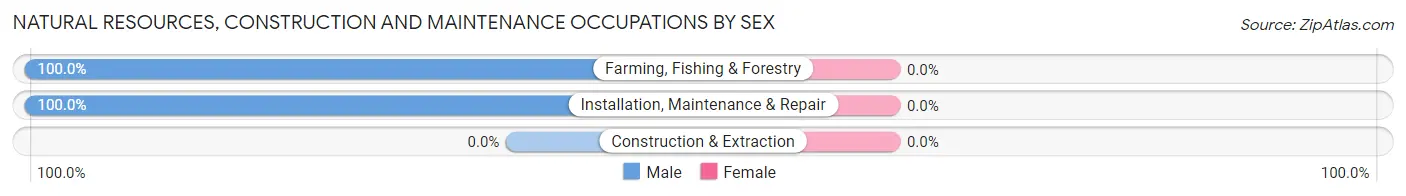
| Occupation | Male | Female |
| Farming, Fishing & Forestry | 7 (100.0%) | 0 (0.0%) |
| Construction & Extraction | 0 (0.0%) | 0 (0.0%) |
| Installation, Maintenance & Repair | 5 (100.0%) | 0 (0.0%) |
| Total (Category) | 12 (100.0%) | 0 (0.0%) |
| Total (Overall) | 63 (71.6%) | 25 (28.4%) |
Production, Transportation and Moving Occupations
The most common Production, Transportation and Moving occupations in Woodruff are , and Production (16 | 18.2%).
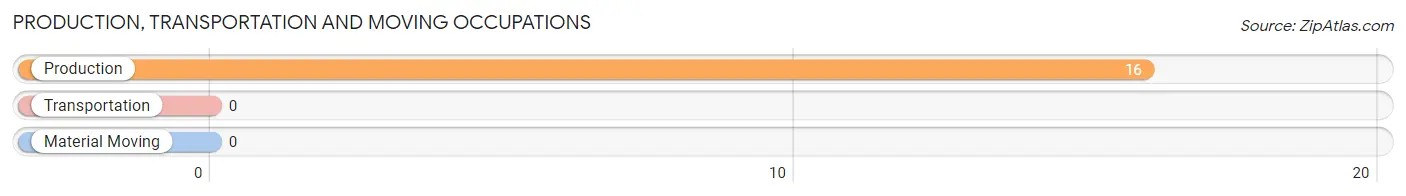
Production, Transportation and Moving Occupations by Sex
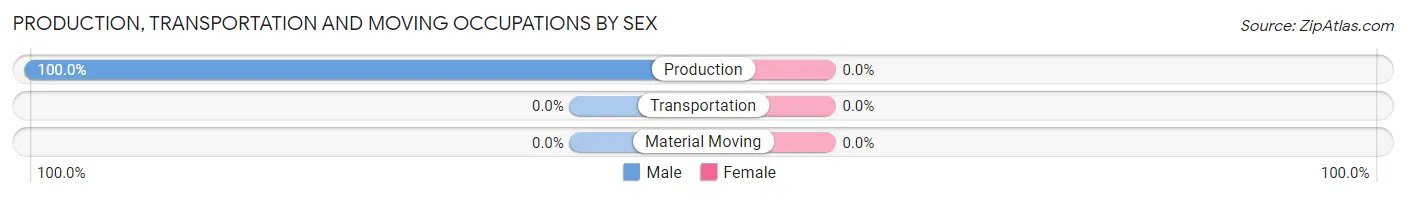
| Occupation | Male | Female |
| Production | 16 (100.0%) | 0 (0.0%) |
| Transportation | 0 (0.0%) | 0 (0.0%) |
| Material Moving | 0 (0.0%) | 0 (0.0%) |
| Total (Category) | 16 (100.0%) | 0 (0.0%) |
| Total (Overall) | 63 (71.6%) | 25 (28.4%) |
Employment Industries by Sex in Woodruff
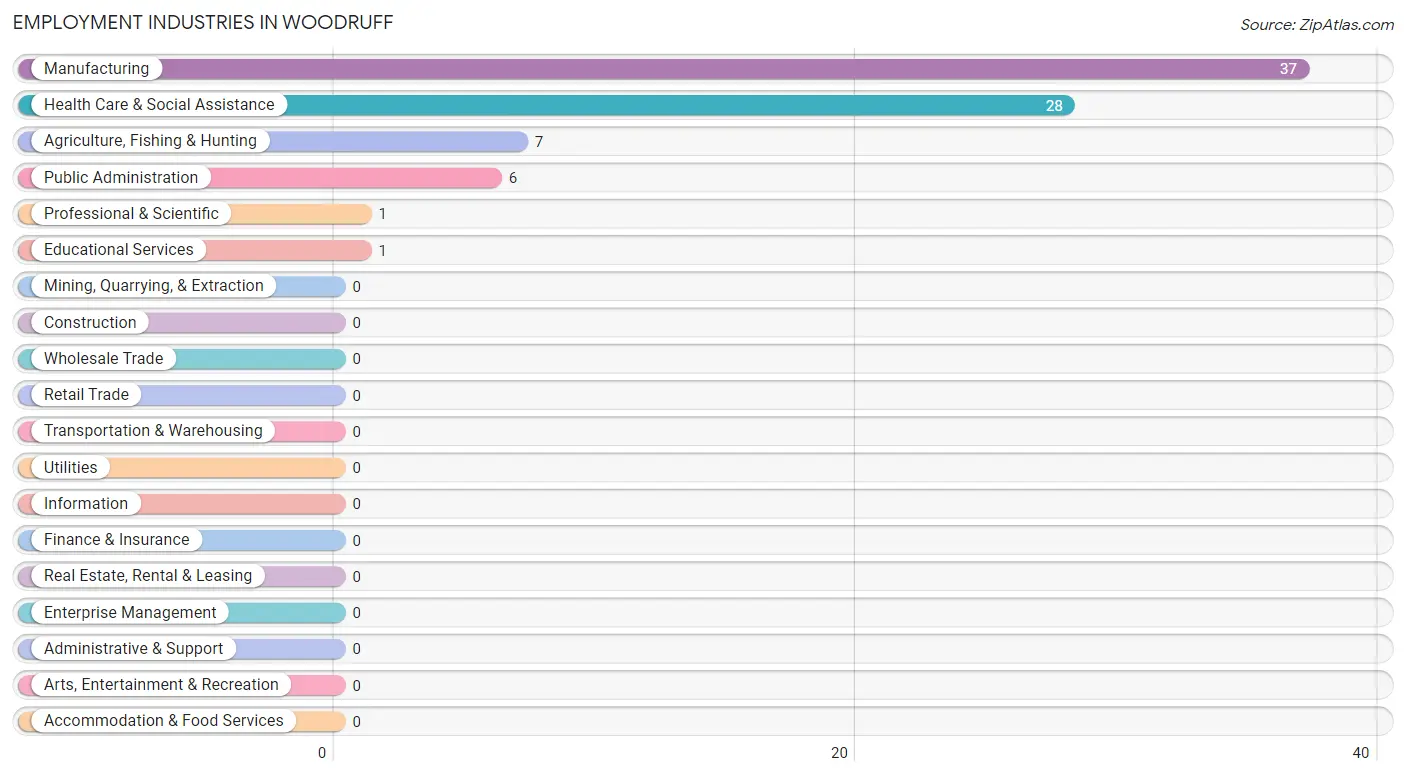
Employment Industries in Woodruff
The major employment industries in Woodruff include Manufacturing (37 | 42.0%), Health Care & Social Assistance (28 | 31.8%), Agriculture, Fishing & Hunting (7 | 8.0%), Public Administration (6 | 6.8%), and Professional & Scientific (1 | 1.1%).
Employment Industries by Sex in Woodruff
The Woodruff industries that see more men than women are Agriculture, Fishing & Hunting (100.0%), Manufacturing (100.0%), and Educational Services (100.0%), whereas the industries that tend to have a higher number of women are Professional & Scientific (100.0%), and Health Care & Social Assistance (85.7%).
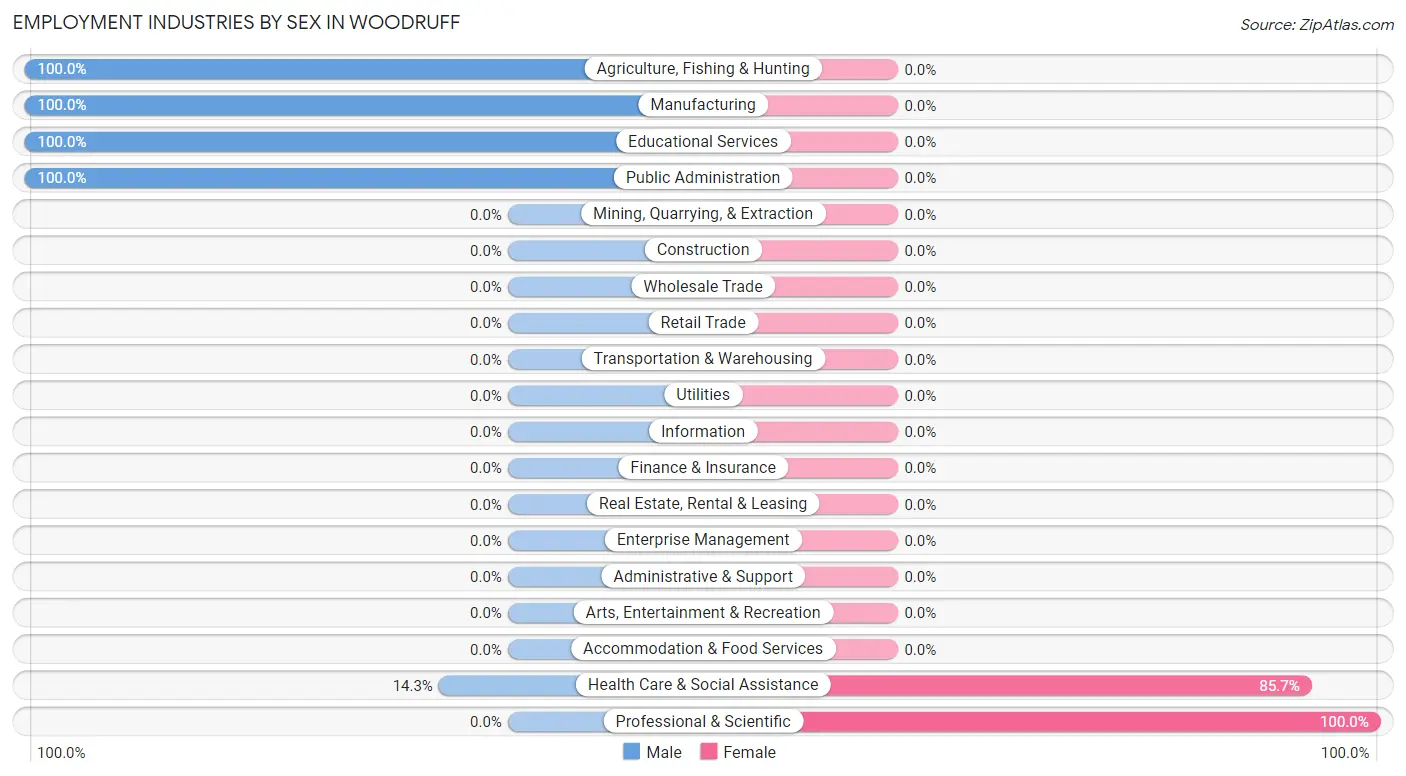
| Industry | Male | Female |
| Agriculture, Fishing & Hunting | 7 (100.0%) | 0 (0.0%) |
| Mining, Quarrying, & Extraction | 0 (0.0%) | 0 (0.0%) |
| Construction | 0 (0.0%) | 0 (0.0%) |
| Manufacturing | 37 (100.0%) | 0 (0.0%) |
| Wholesale Trade | 0 (0.0%) | 0 (0.0%) |
| Retail Trade | 0 (0.0%) | 0 (0.0%) |
| Transportation & Warehousing | 0 (0.0%) | 0 (0.0%) |
| Utilities | 0 (0.0%) | 0 (0.0%) |
| Information | 0 (0.0%) | 0 (0.0%) |
| Finance & Insurance | 0 (0.0%) | 0 (0.0%) |
| Real Estate, Rental & Leasing | 0 (0.0%) | 0 (0.0%) |
| Professional & Scientific | 0 (0.0%) | 1 (100.0%) |
| Enterprise Management | 0 (0.0%) | 0 (0.0%) |
| Administrative & Support | 0 (0.0%) | 0 (0.0%) |
| Educational Services | 1 (100.0%) | 0 (0.0%) |
| Health Care & Social Assistance | 4 (14.3%) | 24 (85.7%) |
| Arts, Entertainment & Recreation | 0 (0.0%) | 0 (0.0%) |
| Accommodation & Food Services | 0 (0.0%) | 0 (0.0%) |
| Public Administration | 6 (100.0%) | 0 (0.0%) |
| Total | 63 (71.6%) | 25 (28.4%) |
Education in Woodruff
School Enrollment in Woodruff
The most common levels of schooling among the 76 students in Woodruff are high school (30 | 39.5%), elementary school (19 | 25.0%), and middle school (18 | 23.7%).
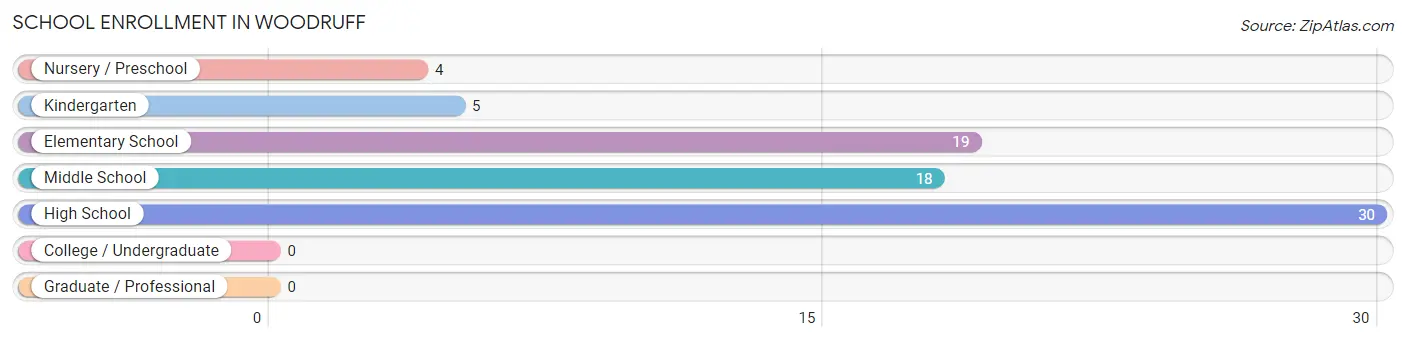
| School Level | # Students | % Students |
| Nursery / Preschool | 4 | 5.3% |
| Kindergarten | 5 | 6.6% |
| Elementary School | 19 | 25.0% |
| Middle School | 18 | 23.7% |
| High School | 30 | 39.5% |
| College / Undergraduate | 0 | 0.0% |
| Graduate / Professional | 0 | 0.0% |
| Total | 76 | 100.0% |
School Enrollment by Age by Funding Source in Woodruff
Out of a total of 76 students who are enrolled in schools in Woodruff, 16 (21.1%) attend a private institution, while the remaining 60 (78.9%) are enrolled in public schools. The age group of 5 to 9 year old has the highest likelihood of being enrolled in private schools, with 11 (40.7% in the age bracket) enrolled. Conversely, the age group of 3 to 4 year olds has the lowest likelihood of being enrolled in a private school, with 4 (100.0% in the age bracket) attending a public institution.
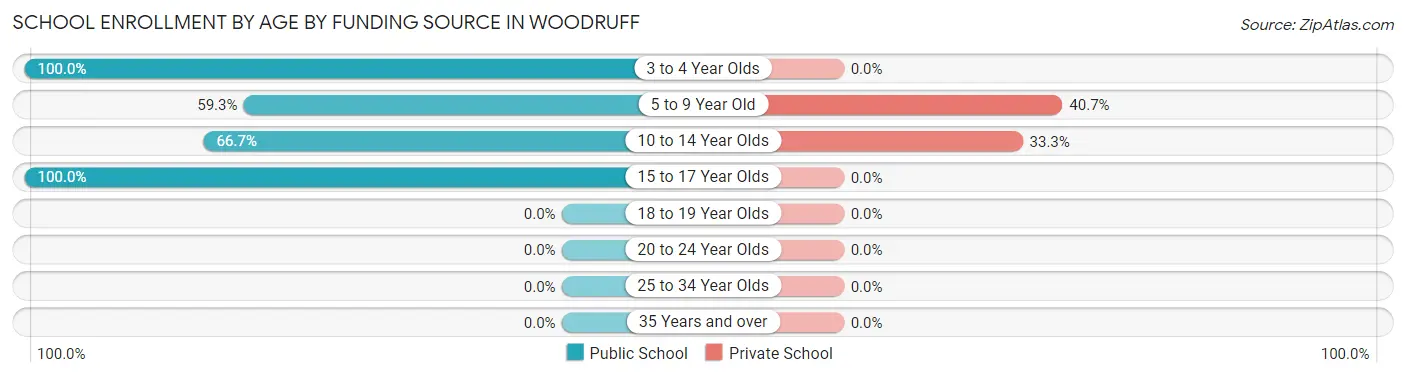
| Age Bracket | Public School | Private School |
| 3 to 4 Year Olds | 4 (100.0%) | 0 (0.0%) |
| 5 to 9 Year Old | 16 (59.3%) | 11 (40.7%) |
| 10 to 14 Year Olds | 10 (66.7%) | 5 (33.3%) |
| 15 to 17 Year Olds | 30 (100.0%) | 0 (0.0%) |
| 18 to 19 Year Olds | 0 (0.0%) | 0 (0.0%) |
| 20 to 24 Year Olds | 0 (0.0%) | 0 (0.0%) |
| 25 to 34 Year Olds | 0 (0.0%) | 0 (0.0%) |
| 35 Years and over | 0 (0.0%) | 0 (0.0%) |
| Total | 60 (78.9%) | 16 (21.1%) |
Educational Attainment by Field of Study in Woodruff
Physical & health sciences (21 | 45.7%), multidisciplinary studies (9 | 19.6%), bio, nature & agricultural (7 | 15.2%), science & technology (4 | 8.7%), and business (4 | 8.7%) are the most common fields of study among 46 individuals in Woodruff who have obtained a bachelor's degree or higher.
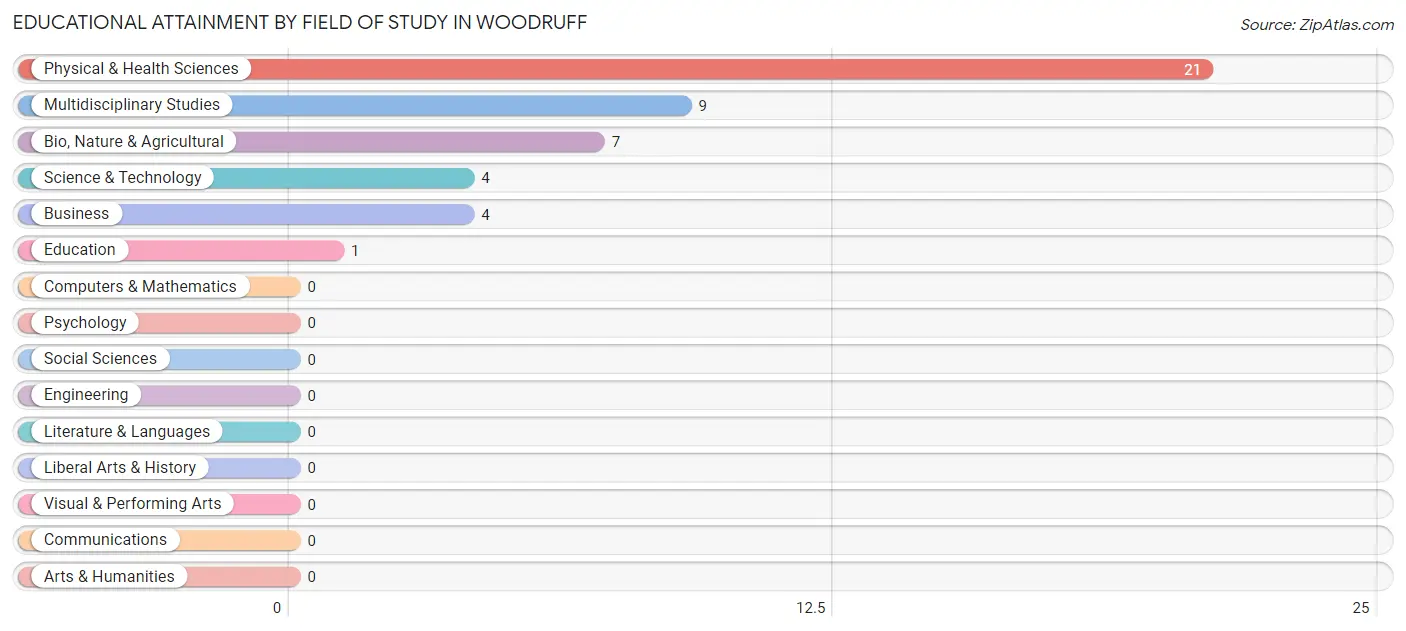
| Field of Study | # Graduates | % Graduates |
| Computers & Mathematics | 0 | 0.0% |
| Bio, Nature & Agricultural | 7 | 15.2% |
| Physical & Health Sciences | 21 | 45.7% |
| Psychology | 0 | 0.0% |
| Social Sciences | 0 | 0.0% |
| Engineering | 0 | 0.0% |
| Multidisciplinary Studies | 9 | 19.6% |
| Science & Technology | 4 | 8.7% |
| Business | 4 | 8.7% |
| Education | 1 | 2.2% |
| Literature & Languages | 0 | 0.0% |
| Liberal Arts & History | 0 | 0.0% |
| Visual & Performing Arts | 0 | 0.0% |
| Communications | 0 | 0.0% |
| Arts & Humanities | 0 | 0.0% |
| Total | 46 | 100.0% |
Transportation & Commute in Woodruff
Vehicle Availability by Sex in Woodruff
The most prevalent vehicle ownership categories in Woodruff are males with 2 vehicles (35, accounting for 55.6%) and females with 2 vehicles (15, making up 140.0%).
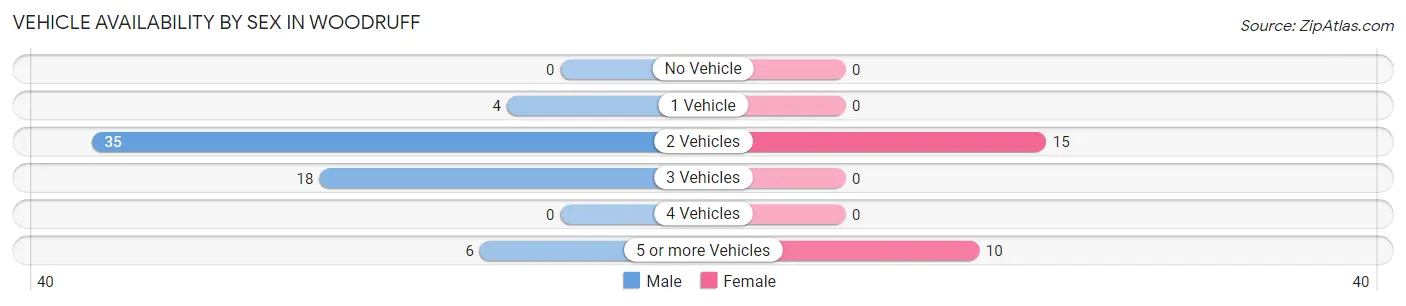
| Vehicles Available | Male | Female |
| No Vehicle | 0 (0.0%) | 0 (0.0%) |
| 1 Vehicle | 4 (6.4%) | 0 (0.0%) |
| 2 Vehicles | 35 (55.6%) | 15 (60.0%) |
| 3 Vehicles | 18 (28.6%) | 0 (0.0%) |
| 4 Vehicles | 0 (0.0%) | 0 (0.0%) |
| 5 or more Vehicles | 6 (9.5%) | 10 (40.0%) |
| Total | 63 (100.0%) | 25 (100.0%) |
Commute Time in Woodruff
The most frequently occuring commute durations in Woodruff are 30 to 34 minutes (25 commuters, 28.7%), 15 to 19 minutes (21 commuters, 24.1%), and 40 to 44 minutes (15 commuters, 17.2%).
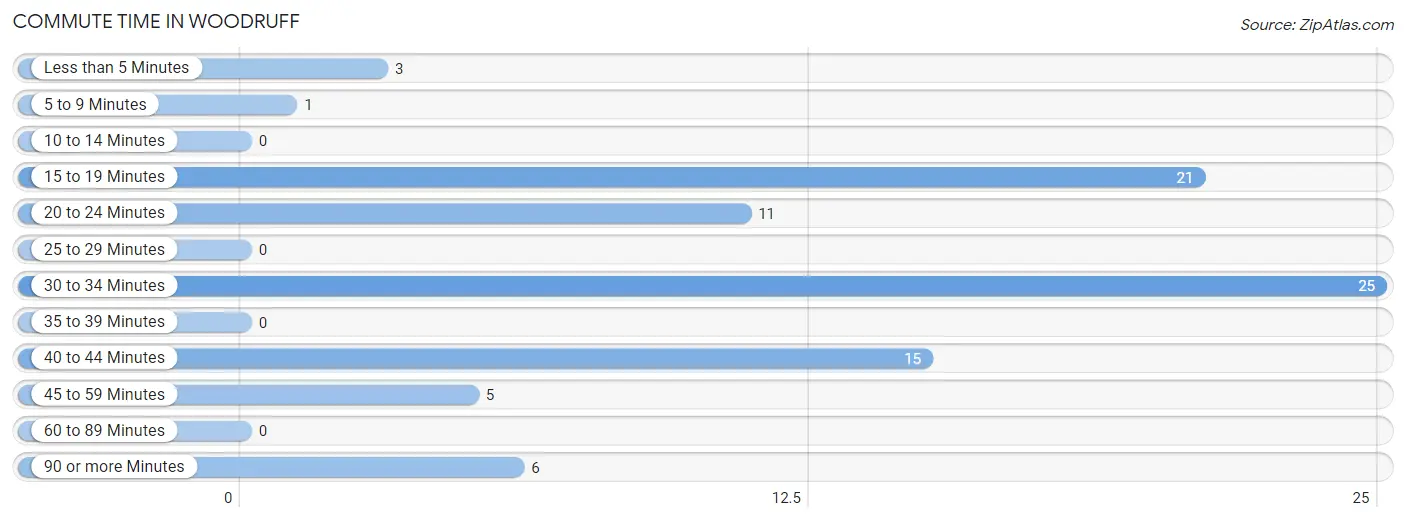
| Commute Time | # Commuters | % Commuters |
| Less than 5 Minutes | 3 | 3.5% |
| 5 to 9 Minutes | 1 | 1.1% |
| 10 to 14 Minutes | 0 | 0.0% |
| 15 to 19 Minutes | 21 | 24.1% |
| 20 to 24 Minutes | 11 | 12.6% |
| 25 to 29 Minutes | 0 | 0.0% |
| 30 to 34 Minutes | 25 | 28.7% |
| 35 to 39 Minutes | 0 | 0.0% |
| 40 to 44 Minutes | 15 | 17.2% |
| 45 to 59 Minutes | 5 | 5.8% |
| 60 to 89 Minutes | 0 | 0.0% |
| 90 or more Minutes | 6 | 6.9% |
Commute Time by Sex in Woodruff
The most common commute times in Woodruff are 15 to 19 minutes (21 commuters, 33.3%) for males and 40 to 44 minutes (15 commuters, 62.5%) for females.
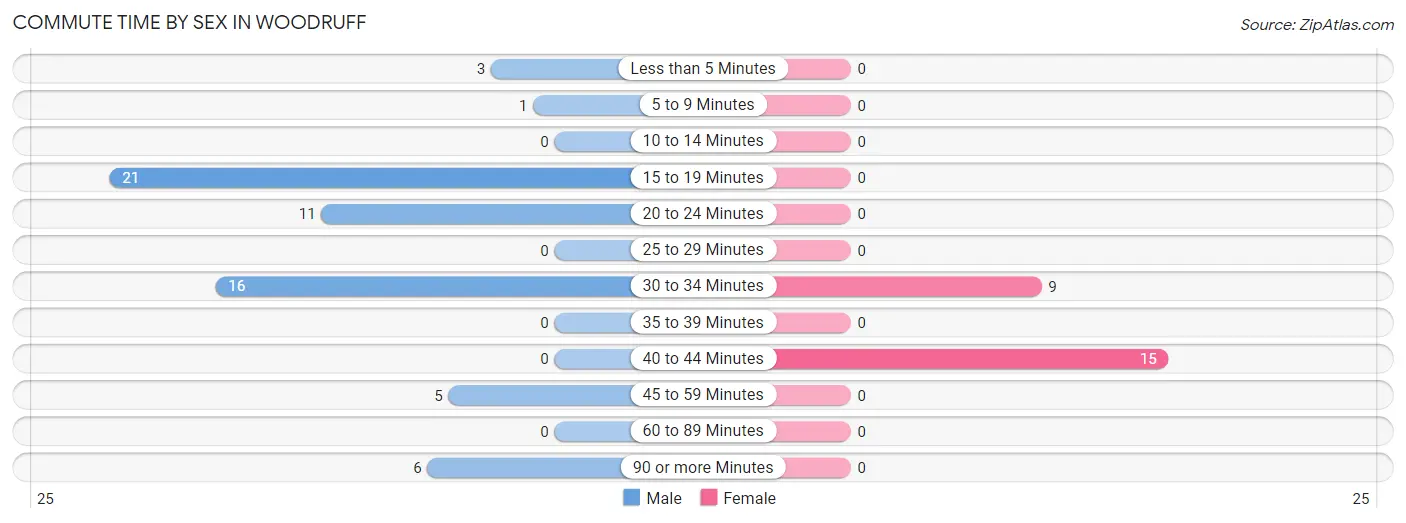
| Commute Time | Male | Female |
| Less than 5 Minutes | 3 (4.8%) | 0 (0.0%) |
| 5 to 9 Minutes | 1 (1.6%) | 0 (0.0%) |
| 10 to 14 Minutes | 0 (0.0%) | 0 (0.0%) |
| 15 to 19 Minutes | 21 (33.3%) | 0 (0.0%) |
| 20 to 24 Minutes | 11 (17.5%) | 0 (0.0%) |
| 25 to 29 Minutes | 0 (0.0%) | 0 (0.0%) |
| 30 to 34 Minutes | 16 (25.4%) | 9 (37.5%) |
| 35 to 39 Minutes | 0 (0.0%) | 0 (0.0%) |
| 40 to 44 Minutes | 0 (0.0%) | 15 (62.5%) |
| 45 to 59 Minutes | 5 (7.9%) | 0 (0.0%) |
| 60 to 89 Minutes | 0 (0.0%) | 0 (0.0%) |
| 90 or more Minutes | 6 (9.5%) | 0 (0.0%) |
Time of Departure to Work by Sex in Woodruff
The most frequent times of departure to work in Woodruff are 6:30 AM to 6:59 AM (40, 63.5%) for males and 4:00 PM to 11:59 PM (15, 62.5%) for females.
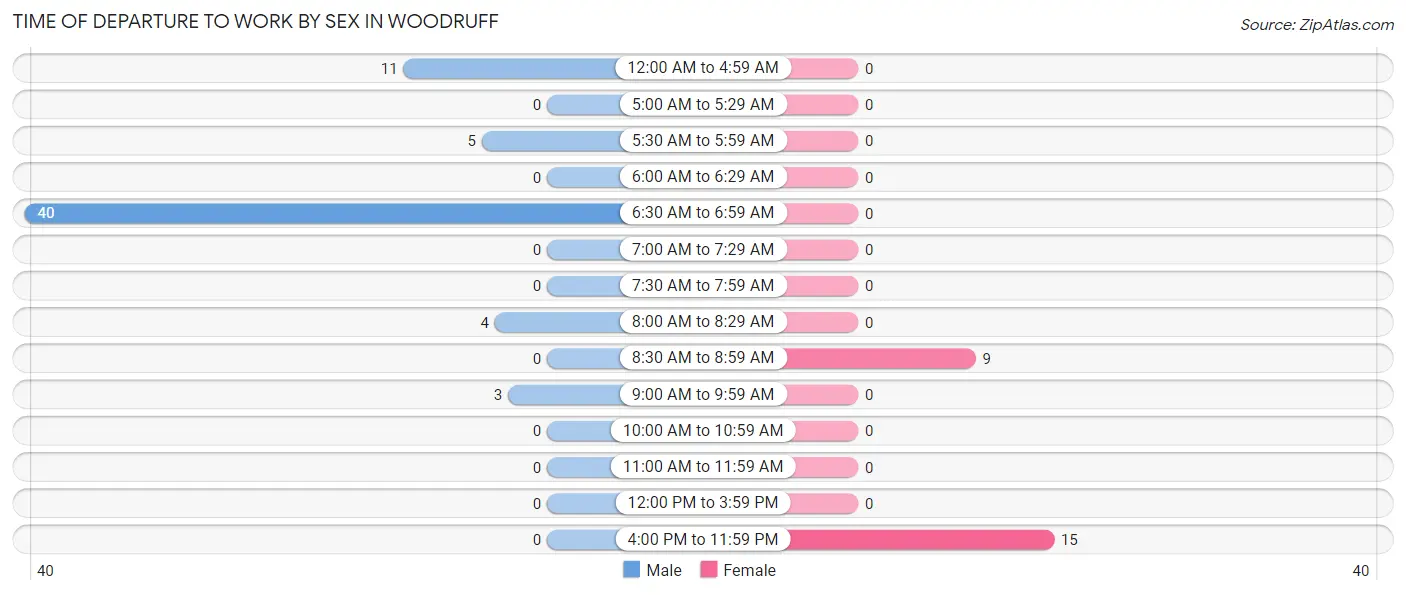
| Time of Departure | Male | Female |
| 12:00 AM to 4:59 AM | 11 (17.5%) | 0 (0.0%) |
| 5:00 AM to 5:29 AM | 0 (0.0%) | 0 (0.0%) |
| 5:30 AM to 5:59 AM | 5 (7.9%) | 0 (0.0%) |
| 6:00 AM to 6:29 AM | 0 (0.0%) | 0 (0.0%) |
| 6:30 AM to 6:59 AM | 40 (63.5%) | 0 (0.0%) |
| 7:00 AM to 7:29 AM | 0 (0.0%) | 0 (0.0%) |
| 7:30 AM to 7:59 AM | 0 (0.0%) | 0 (0.0%) |
| 8:00 AM to 8:29 AM | 4 (6.4%) | 0 (0.0%) |
| 8:30 AM to 8:59 AM | 0 (0.0%) | 9 (37.5%) |
| 9:00 AM to 9:59 AM | 3 (4.8%) | 0 (0.0%) |
| 10:00 AM to 10:59 AM | 0 (0.0%) | 0 (0.0%) |
| 11:00 AM to 11:59 AM | 0 (0.0%) | 0 (0.0%) |
| 12:00 PM to 3:59 PM | 0 (0.0%) | 0 (0.0%) |
| 4:00 PM to 11:59 PM | 0 (0.0%) | 15 (62.5%) |
| Total | 63 (100.0%) | 24 (100.0%) |
Housing Occupancy in Woodruff
Occupancy by Ownership in Woodruff
Of the total 88 dwellings in Woodruff, owner-occupied units account for 75 (85.2%), while renter-occupied units make up 13 (14.8%).
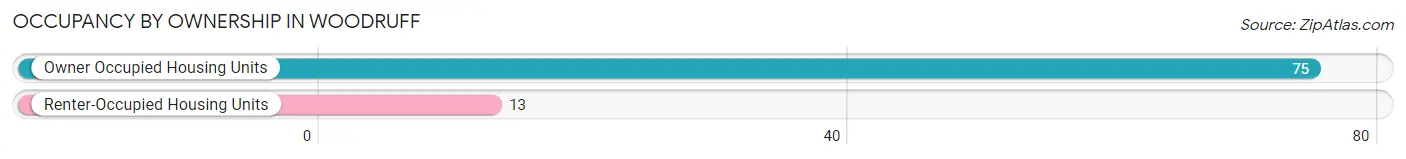
| Occupancy | # Housing Units | % Housing Units |
| Owner Occupied Housing Units | 75 | 85.2% |
| Renter-Occupied Housing Units | 13 | 14.8% |
| Total Occupied Housing Units | 88 | 100.0% |
Occupancy by Household Size in Woodruff
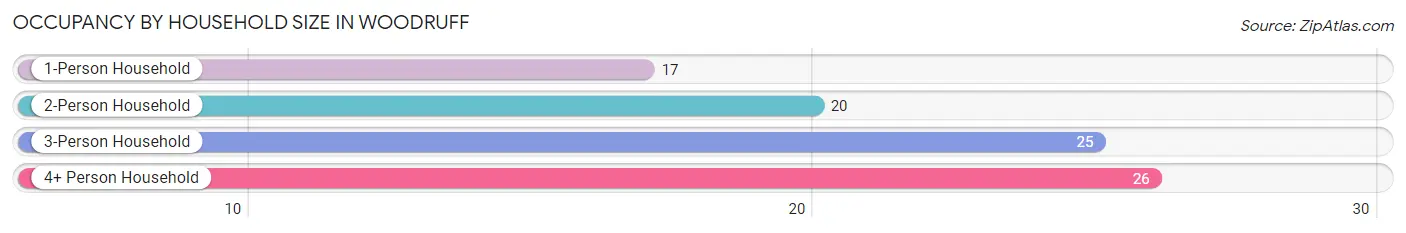
| Household Size | # Housing Units | % Housing Units |
| 1-Person Household | 17 | 19.3% |
| 2-Person Household | 20 | 22.7% |
| 3-Person Household | 25 | 28.4% |
| 4+ Person Household | 26 | 29.5% |
| Total Housing Units | 88 | 100.0% |
Occupancy by Ownership by Household Size in Woodruff
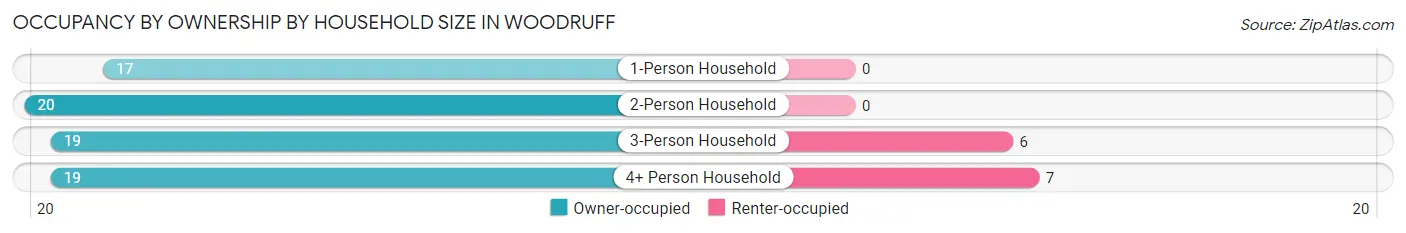
| Household Size | Owner-occupied | Renter-occupied |
| 1-Person Household | 17 (100.0%) | 0 (0.0%) |
| 2-Person Household | 20 (100.0%) | 0 (0.0%) |
| 3-Person Household | 19 (76.0%) | 6 (24.0%) |
| 4+ Person Household | 19 (73.1%) | 7 (26.9%) |
| Total Housing Units | 75 (85.2%) | 13 (14.8%) |
Occupancy by Educational Attainment in Woodruff
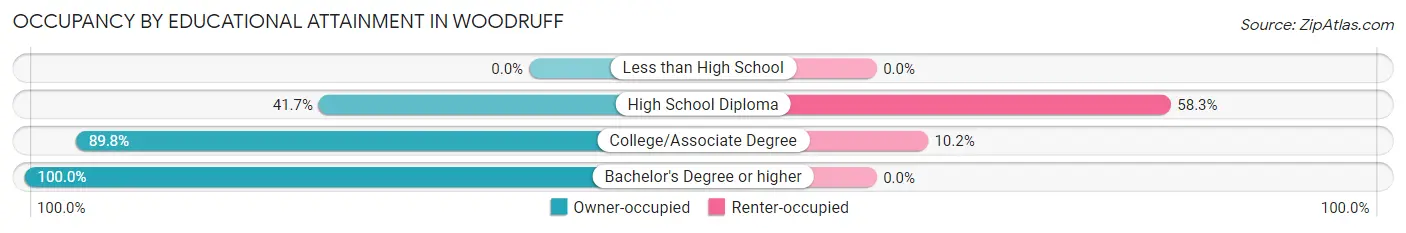
| Household Size | Owner-occupied | Renter-occupied |
| Less than High School | 0 (0.0%) | 0 (0.0%) |
| High School Diploma | 5 (41.7%) | 7 (58.3%) |
| College/Associate Degree | 53 (89.8%) | 6 (10.2%) |
| Bachelor's Degree or higher | 17 (100.0%) | 0 (0.0%) |
Occupancy by Age of Householder in Woodruff
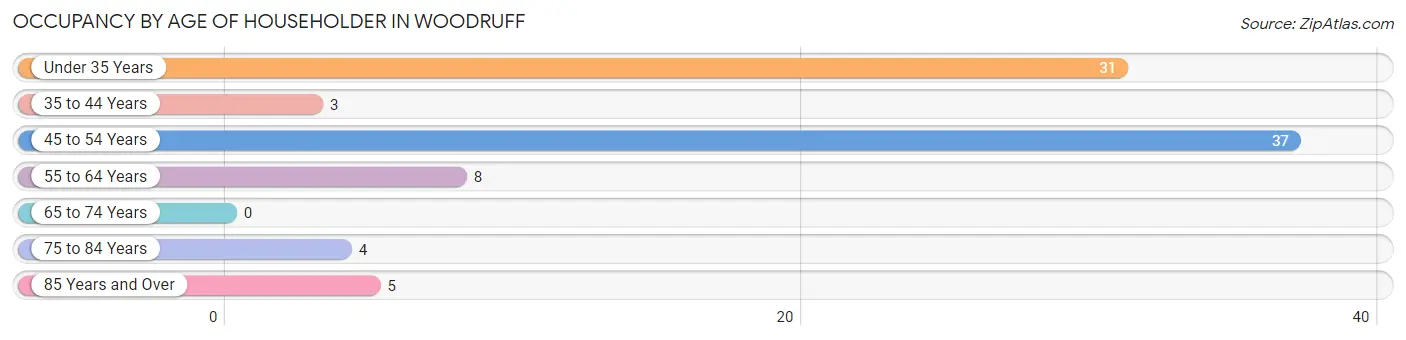
| Age Bracket | # Households | % Households |
| Under 35 Years | 31 | 35.2% |
| 35 to 44 Years | 3 | 3.4% |
| 45 to 54 Years | 37 | 42.0% |
| 55 to 64 Years | 8 | 9.1% |
| 65 to 74 Years | 0 | 0.0% |
| 75 to 84 Years | 4 | 4.5% |
| 85 Years and Over | 5 | 5.7% |
| Total | 88 | 100.0% |
Housing Finances in Woodruff
Median Income by Occupancy in Woodruff
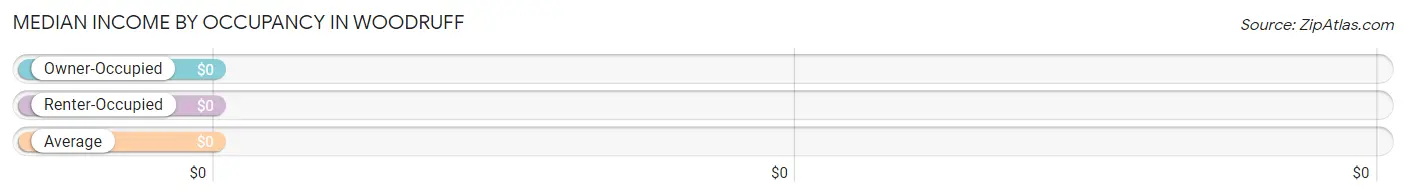
| Occupancy Type | # Households | Median Income |
| Owner-Occupied | 75 (85.2%) | $0 |
| Renter-Occupied | 13 (14.8%) | $0 |
| Average | 88 (100.0%) | $0 |
Occupancy by Householder Income Bracket in Woodruff
| Income Bracket | Owner-occupied | Renter-occupied |
| Less than $5,000 | 0 (0.0%) | 0 (0.0%) |
| $5,000 to $9,999 | 4 (5.3%) | 0 (0.0%) |
| $10,000 to $14,999 | 0 (0.0%) | 0 (0.0%) |
| $15,000 to $19,999 | 0 (0.0%) | 0 (0.0%) |
| $20,000 to $24,999 | 0 (0.0%) | 0 (0.0%) |
| $25,000 to $34,999 | 4 (5.3%) | 0 (0.0%) |
| $35,000 to $49,999 | 7 (9.3%) | 6 (46.2%) |
| $50,000 to $74,999 | 21 (28.0%) | 7 (53.8%) |
| $75,000 to $99,999 | 0 (0.0%) | 0 (0.0%) |
| $100,000 to $149,999 | 20 (26.7%) | 0 (0.0%) |
| $150,000 or more | 19 (25.3%) | 0 (0.0%) |
| Total | 75 (100.0%) | 13 (100.0%) |
Monthly Housing Cost Tiers in Woodruff
| Monthly Cost | Owner-occupied | Renter-occupied |
| Less than $300 | 18 (24.0%) | 0 (0.0%) |
| $300 to $499 | 20 (26.7%) | 0 (0.0%) |
| $500 to $799 | 21 (28.0%) | 0 (0.0%) |
| $800 to $999 | 3 (4.0%) | 0 (0.0%) |
| $1,000 to $1,499 | 13 (17.3%) | 7 (53.8%) |
| $1,500 to $1,999 | 0 (0.0%) | 0 (0.0%) |
| $2,000 to $2,499 | 0 (0.0%) | 0 (0.0%) |
| $2,500 to $2,999 | 0 (0.0%) | 0 (0.0%) |
| $3,000 or more | 0 (0.0%) | 0 (0.0%) |
| Total | 75 (100.0%) | 13 (100.0%) |
Physical Housing Characteristics in Woodruff
Housing Structures in Woodruff
| Structure Type | # Housing Units | % Housing Units |
| Single Unit, Detached | 88 | 100.0% |
| Single Unit, Attached | 0 | 0.0% |
| 2 Unit Apartments | 0 | 0.0% |
| 3 or 4 Unit Apartments | 0 | 0.0% |
| 5 to 9 Unit Apartments | 0 | 0.0% |
| 10 or more Apartments | 0 | 0.0% |
| Mobile Home / Other | 0 | 0.0% |
| Total | 88 | 100.0% |
Housing Structures by Occupancy in Woodruff
| Structure Type | Owner-occupied | Renter-occupied |
| Single Unit, Detached | 75 (85.2%) | 13 (14.8%) |
| Single Unit, Attached | 0 (0.0%) | 0 (0.0%) |
| 2 Unit Apartments | 0 (0.0%) | 0 (0.0%) |
| 3 or 4 Unit Apartments | 0 (0.0%) | 0 (0.0%) |
| 5 to 9 Unit Apartments | 0 (0.0%) | 0 (0.0%) |
| 10 or more Apartments | 0 (0.0%) | 0 (0.0%) |
| Mobile Home / Other | 0 (0.0%) | 0 (0.0%) |
| Total | 75 (85.2%) | 13 (14.8%) |
Housing Structures by Number of Rooms in Woodruff
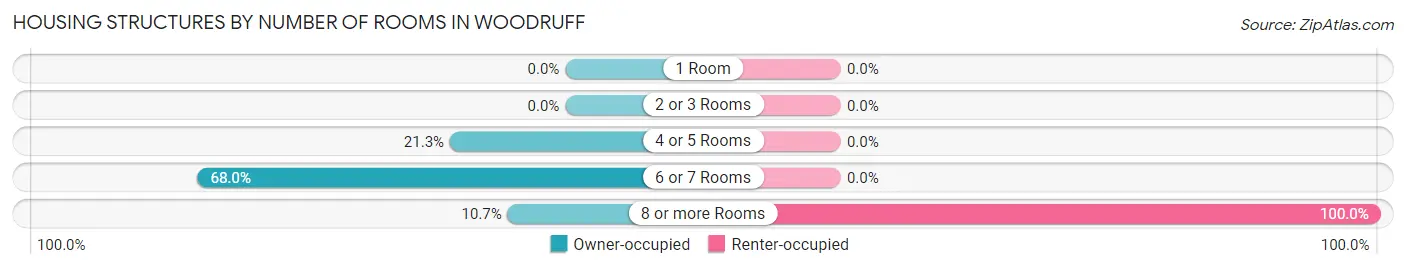
| Number of Rooms | Owner-occupied | Renter-occupied |
| 1 Room | 0 (0.0%) | 0 (0.0%) |
| 2 or 3 Rooms | 0 (0.0%) | 0 (0.0%) |
| 4 or 5 Rooms | 16 (21.3%) | 0 (0.0%) |
| 6 or 7 Rooms | 51 (68.0%) | 0 (0.0%) |
| 8 or more Rooms | 8 (10.7%) | 13 (100.0%) |
| Total | 75 (100.0%) | 13 (100.0%) |
Housing Structure by Heating Type in Woodruff
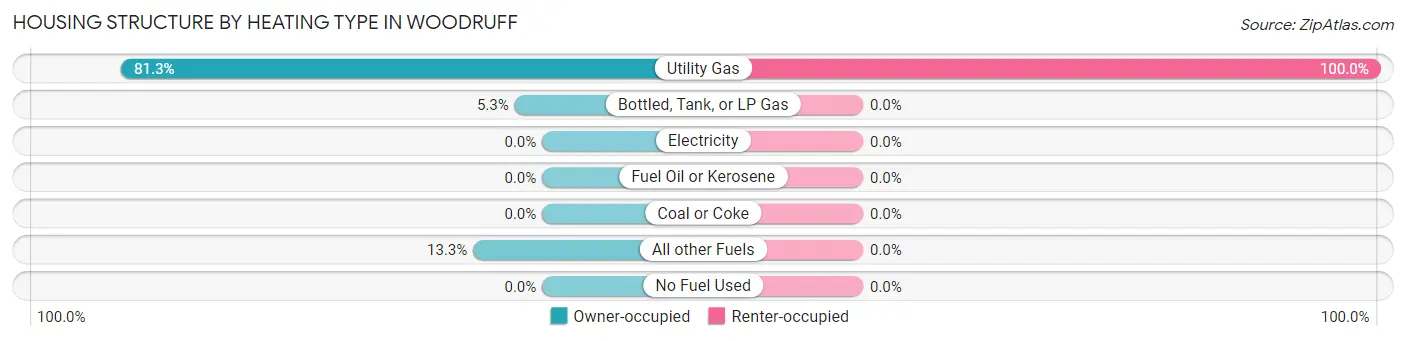
| Heating Type | Owner-occupied | Renter-occupied |
| Utility Gas | 61 (81.3%) | 13 (100.0%) |
| Bottled, Tank, or LP Gas | 4 (5.3%) | 0 (0.0%) |
| Electricity | 0 (0.0%) | 0 (0.0%) |
| Fuel Oil or Kerosene | 0 (0.0%) | 0 (0.0%) |
| Coal or Coke | 0 (0.0%) | 0 (0.0%) |
| All other Fuels | 10 (13.3%) | 0 (0.0%) |
| No Fuel Used | 0 (0.0%) | 0 (0.0%) |
| Total | 75 (100.0%) | 13 (100.0%) |
Household Vehicle Usage in Woodruff
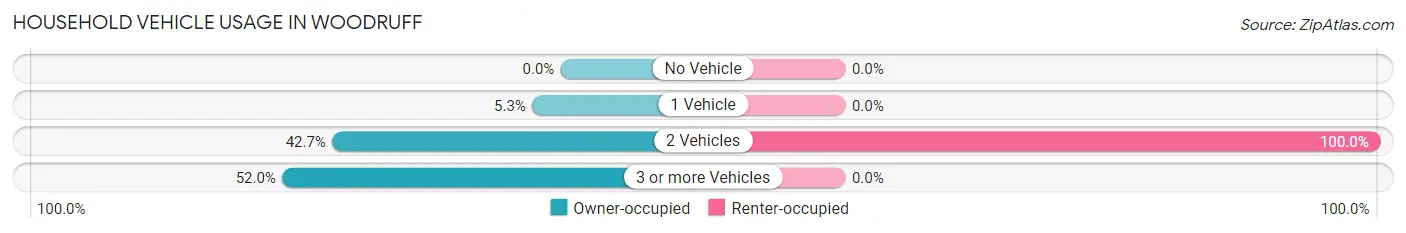
| Vehicles per Household | Owner-occupied | Renter-occupied |
| No Vehicle | 0 (0.0%) | 0 (0.0%) |
| 1 Vehicle | 4 (5.3%) | 0 (0.0%) |
| 2 Vehicles | 32 (42.7%) | 13 (100.0%) |
| 3 or more Vehicles | 39 (52.0%) | 0 (0.0%) |
| Total | 75 (100.0%) | 13 (100.0%) |
Real Estate & Mortgages in Woodruff
Real Estate and Mortgage Overview in Woodruff
| Characteristic | Without Mortgage | With Mortgage |
| Housing Units | 39 | 36 |
| Median Property Value | $81,900 | $233,300 |
| Median Household Income | - | - |
| Monthly Housing Costs | $308 | $0 |
| Real Estate Taxes | - | - |
Property Value by Mortgage Status in Woodruff
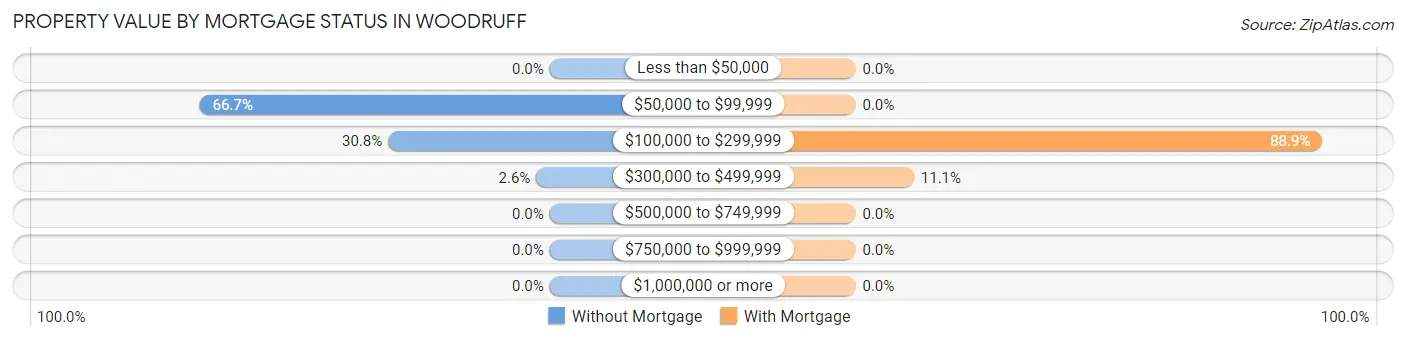
| Property Value | Without Mortgage | With Mortgage |
| Less than $50,000 | 0 (0.0%) | 0 (0.0%) |
| $50,000 to $99,999 | 26 (66.7%) | 0 (0.0%) |
| $100,000 to $299,999 | 12 (30.8%) | 32 (88.9%) |
| $300,000 to $499,999 | 1 (2.6%) | 4 (11.1%) |
| $500,000 to $749,999 | 0 (0.0%) | 0 (0.0%) |
| $750,000 to $999,999 | 0 (0.0%) | 0 (0.0%) |
| $1,000,000 or more | 0 (0.0%) | 0 (0.0%) |
| Total | 39 (100.0%) | 36 (100.0%) |
Household Income by Mortgage Status in Woodruff
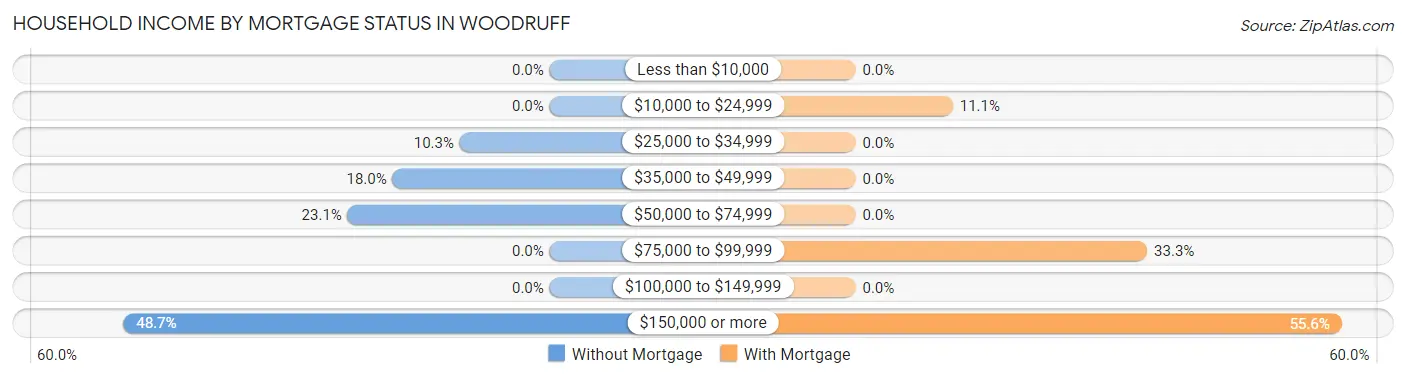
| Household Income | Without Mortgage | With Mortgage |
| Less than $10,000 | 0 (0.0%) | 0 (0.0%) |
| $10,000 to $24,999 | 0 (0.0%) | 4 (11.1%) |
| $25,000 to $34,999 | 4 (10.3%) | 0 (0.0%) |
| $35,000 to $49,999 | 7 (17.9%) | 0 (0.0%) |
| $50,000 to $74,999 | 9 (23.1%) | 0 (0.0%) |
| $75,000 to $99,999 | 0 (0.0%) | 12 (33.3%) |
| $100,000 to $149,999 | 0 (0.0%) | 0 (0.0%) |
| $150,000 or more | 19 (48.7%) | 20 (55.6%) |
| Total | 39 (100.0%) | 36 (100.0%) |
Property Value to Household Income Ratio in Woodruff
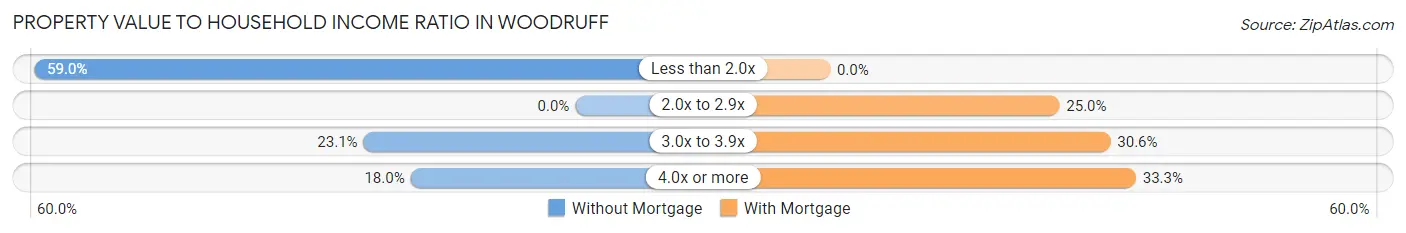
| Value-to-Income Ratio | Without Mortgage | With Mortgage |
| Less than 2.0x | 23 (59.0%) | 0 (0.0%) |
| 2.0x to 2.9x | 0 (0.0%) | 9 (25.0%) |
| 3.0x to 3.9x | 9 (23.1%) | 11 (30.6%) |
| 4.0x or more | 7 (17.9%) | 12 (33.3%) |
| Total | 39 (100.0%) | 36 (100.0%) |
Real Estate Taxes by Mortgage Status in Woodruff
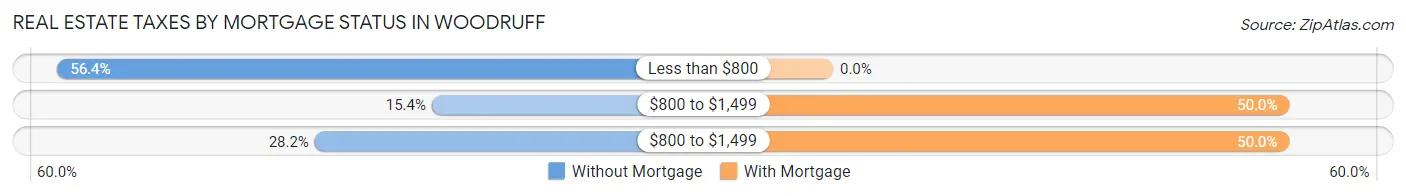
| Property Taxes | Without Mortgage | With Mortgage |
| Less than $800 | 22 (56.4%) | 0 (0.0%) |
| $800 to $1,499 | 6 (15.4%) | 18 (50.0%) |
| $800 to $1,499 | 11 (28.2%) | 18 (50.0%) |
| Total | 39 (100.0%) | 36 (100.0%) |
Health & Disability in Woodruff
Health Insurance Coverage by Age in Woodruff
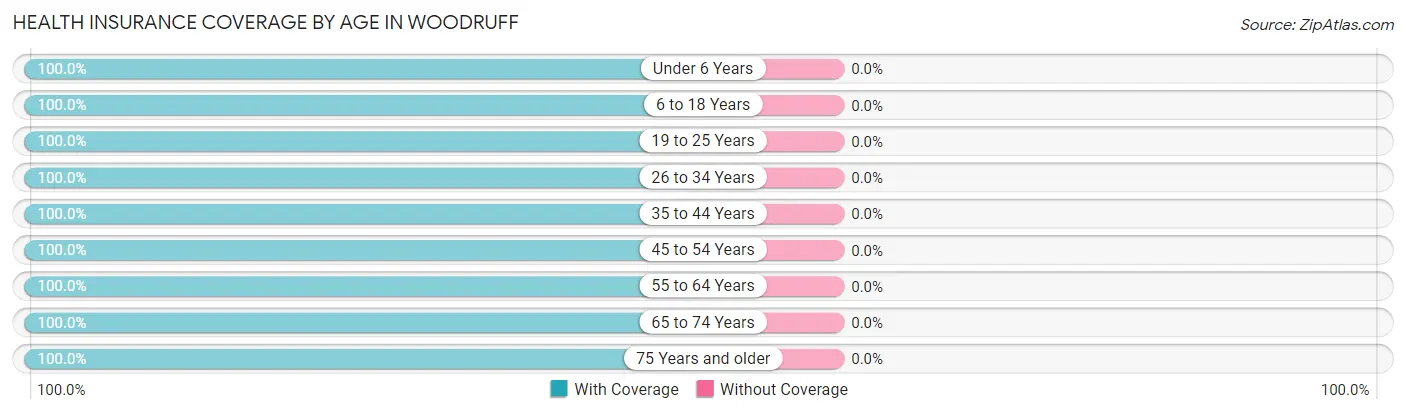
| Age Bracket | With Coverage | Without Coverage |
| Under 6 Years | 23 (100.0%) | 0 (0.0%) |
| 6 to 18 Years | 83 (100.0%) | 0 (0.0%) |
| 19 to 25 Years | 12 (100.0%) | 0 (0.0%) |
| 26 to 34 Years | 37 (100.0%) | 0 (0.0%) |
| 35 to 44 Years | 10 (100.0%) | 0 (0.0%) |
| 45 to 54 Years | 49 (100.0%) | 0 (0.0%) |
| 55 to 64 Years | 8 (100.0%) | 0 (0.0%) |
| 65 to 74 Years | 26 (100.0%) | 0 (0.0%) |
| 75 Years and older | 14 (100.0%) | 0 (0.0%) |
| Total | 262 (100.0%) | 0 (0.0%) |
Health Insurance Coverage by Citizenship Status in Woodruff
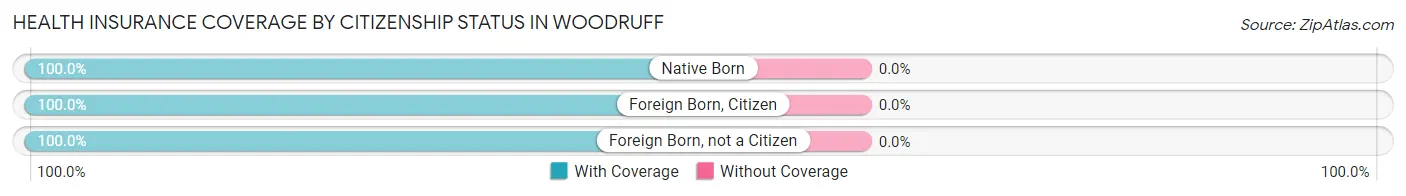
| Citizenship Status | With Coverage | Without Coverage |
| Native Born | 23 (100.0%) | 0 (0.0%) |
| Foreign Born, Citizen | 83 (100.0%) | 0 (0.0%) |
| Foreign Born, not a Citizen | 12 (100.0%) | 0 (0.0%) |
Health Insurance Coverage by Household Income in Woodruff
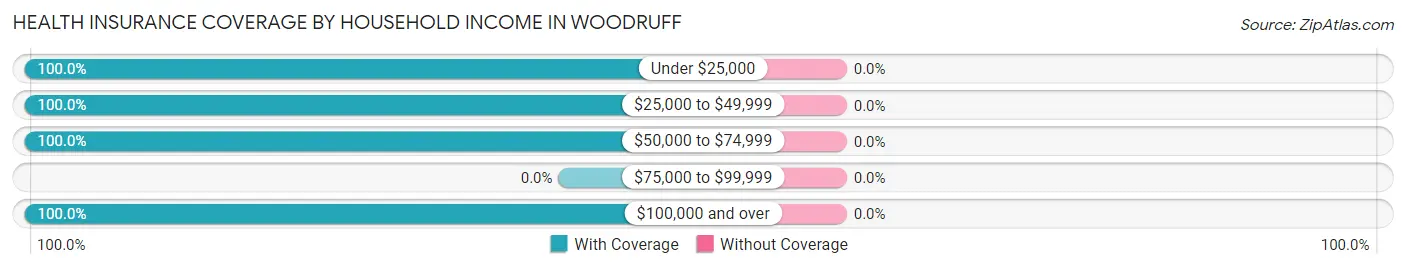
| Household Income | With Coverage | Without Coverage |
| Under $25,000 | 4 (100.0%) | 0 (0.0%) |
| $25,000 to $49,999 | 66 (100.0%) | 0 (0.0%) |
| $50,000 to $74,999 | 64 (100.0%) | 0 (0.0%) |
| $75,000 to $99,999 | 0 (0.0%) | 0 (0.0%) |
| $100,000 and over | 128 (100.0%) | 0 (0.0%) |
Public vs Private Health Insurance Coverage by Age in Woodruff
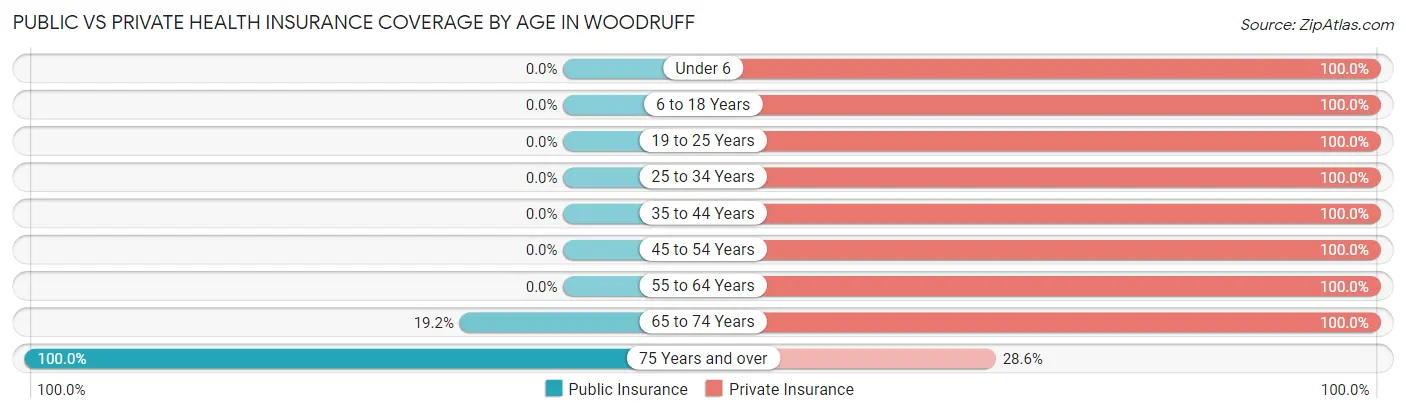
| Age Bracket | Public Insurance | Private Insurance |
| Under 6 | 0 (0.0%) | 23 (100.0%) |
| 6 to 18 Years | 0 (0.0%) | 83 (100.0%) |
| 19 to 25 Years | 0 (0.0%) | 12 (100.0%) |
| 25 to 34 Years | 0 (0.0%) | 37 (100.0%) |
| 35 to 44 Years | 0 (0.0%) | 10 (100.0%) |
| 45 to 54 Years | 0 (0.0%) | 49 (100.0%) |
| 55 to 64 Years | 0 (0.0%) | 8 (100.0%) |
| 65 to 74 Years | 5 (19.2%) | 26 (100.0%) |
| 75 Years and over | 14 (100.0%) | 4 (28.6%) |
| Total | 19 (7.2%) | 252 (96.2%) |
Disability Status by Sex by Age in Woodruff
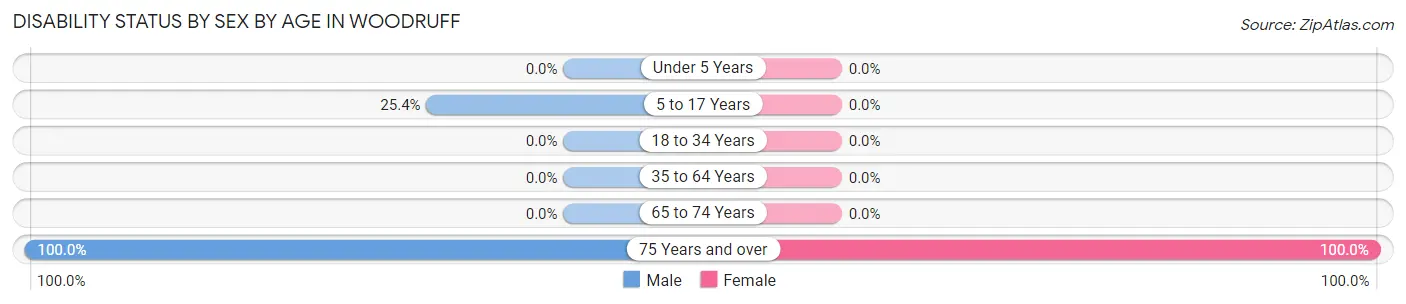
| Age Bracket | Male | Female |
| Under 5 Years | 0 (0.0%) | 0 (0.0%) |
| 5 to 17 Years | 15 (25.4%) | 0 (0.0%) |
| 18 to 34 Years | 0 (0.0%) | 0 (0.0%) |
| 35 to 64 Years | 0 (0.0%) | 0 (0.0%) |
| 65 to 74 Years | 0 (0.0%) | 0 (0.0%) |
| 75 Years and over | 9 (100.0%) | 5 (100.0%) |
Disability Class by Sex by Age in Woodruff
Disability Class: Hearing Difficulty
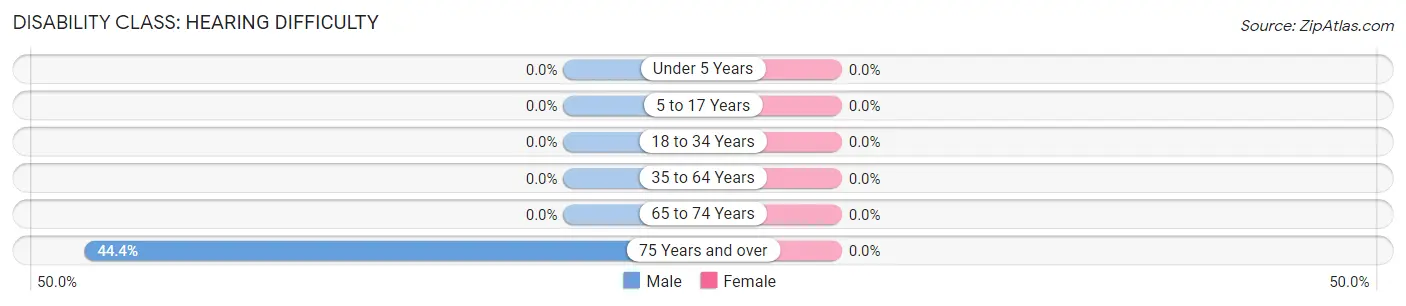
| Age Bracket | Male | Female |
| Under 5 Years | 0 (0.0%) | 0 (0.0%) |
| 5 to 17 Years | 0 (0.0%) | 0 (0.0%) |
| 18 to 34 Years | 0 (0.0%) | 0 (0.0%) |
| 35 to 64 Years | 0 (0.0%) | 0 (0.0%) |
| 65 to 74 Years | 0 (0.0%) | 0 (0.0%) |
| 75 Years and over | 4 (44.4%) | 0 (0.0%) |
Disability Class: Vision Difficulty
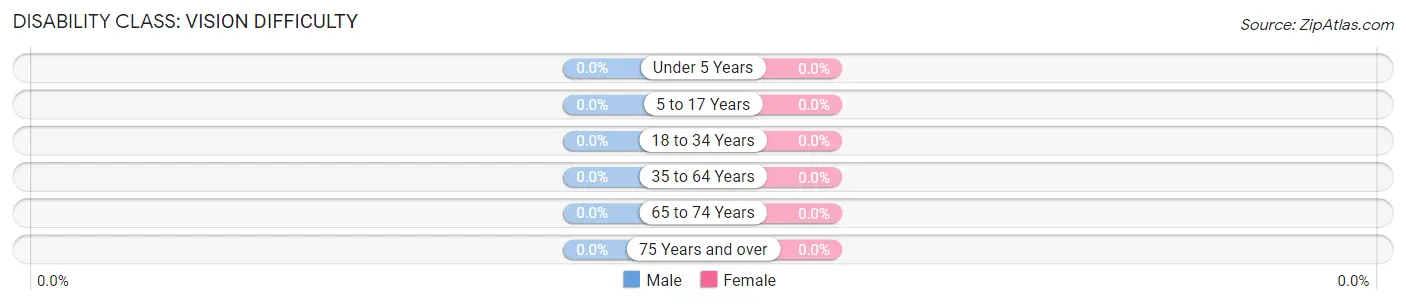
| Age Bracket | Male | Female |
| Under 5 Years | 0 (0.0%) | 0 (0.0%) |
| 5 to 17 Years | 0 (0.0%) | 0 (0.0%) |
| 18 to 34 Years | 0 (0.0%) | 0 (0.0%) |
| 35 to 64 Years | 0 (0.0%) | 0 (0.0%) |
| 65 to 74 Years | 0 (0.0%) | 0 (0.0%) |
| 75 Years and over | 0 (0.0%) | 0 (0.0%) |
Disability Class: Cognitive Difficulty
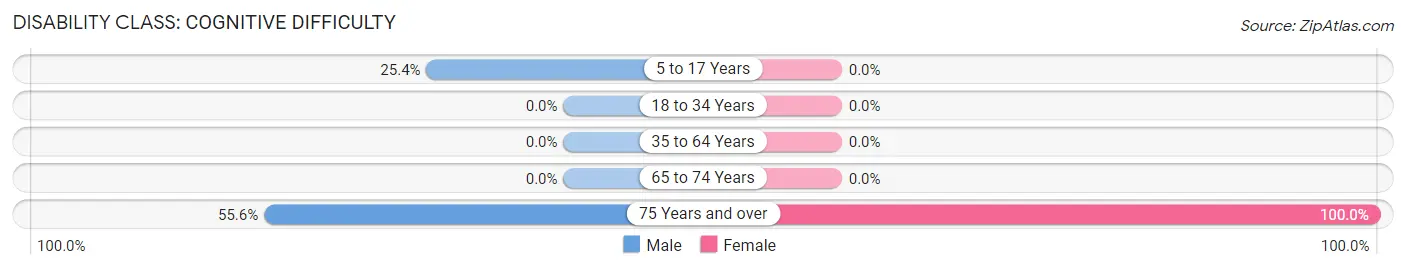
| Age Bracket | Male | Female |
| 5 to 17 Years | 15 (25.4%) | 0 (0.0%) |
| 18 to 34 Years | 0 (0.0%) | 0 (0.0%) |
| 35 to 64 Years | 0 (0.0%) | 0 (0.0%) |
| 65 to 74 Years | 0 (0.0%) | 0 (0.0%) |
| 75 Years and over | 5 (55.6%) | 5 (100.0%) |
Disability Class: Ambulatory Difficulty
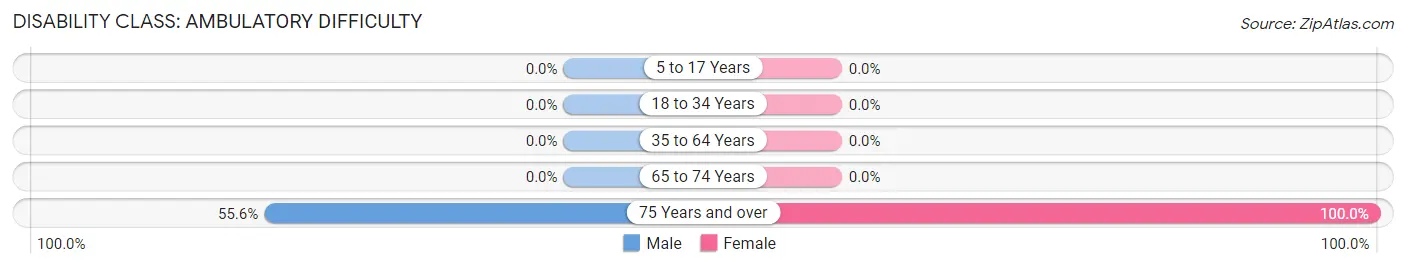
| Age Bracket | Male | Female |
| 5 to 17 Years | 0 (0.0%) | 0 (0.0%) |
| 18 to 34 Years | 0 (0.0%) | 0 (0.0%) |
| 35 to 64 Years | 0 (0.0%) | 0 (0.0%) |
| 65 to 74 Years | 0 (0.0%) | 0 (0.0%) |
| 75 Years and over | 5 (55.6%) | 5 (100.0%) |
Disability Class: Self-Care Difficulty

| Age Bracket | Male | Female |
| 5 to 17 Years | 0 (0.0%) | 0 (0.0%) |
| 18 to 34 Years | 0 (0.0%) | 0 (0.0%) |
| 35 to 64 Years | 0 (0.0%) | 0 (0.0%) |
| 65 to 74 Years | 0 (0.0%) | 0 (0.0%) |
| 75 Years and over | 5 (55.6%) | 5 (100.0%) |
Technology Access in Woodruff
Computing Device Access in Woodruff
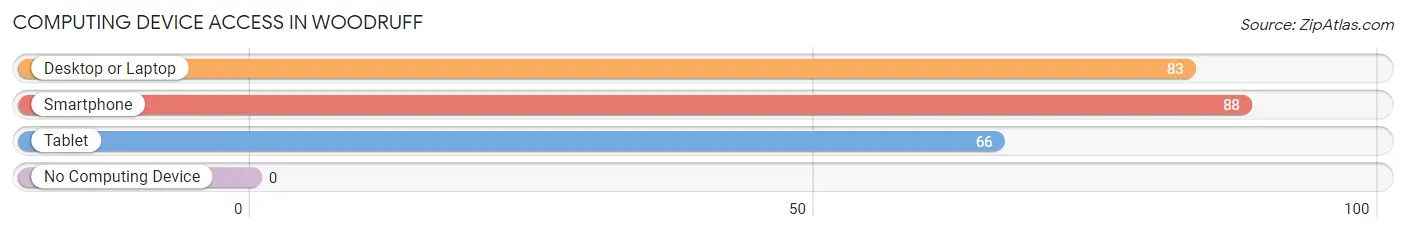
| Device Type | # Households | % Households |
| Desktop or Laptop | 83 | 94.3% |
| Smartphone | 88 | 100.0% |
| Tablet | 66 | 75.0% |
| No Computing Device | 0 | 0.0% |
| Total | 88 | 100.0% |
Internet Access in Woodruff
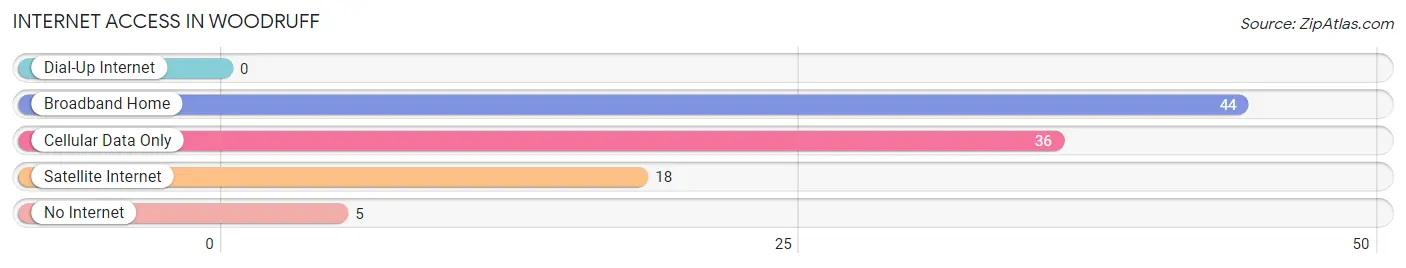
| Internet Type | # Households | % Households |
| Dial-Up Internet | 0 | 0.0% |
| Broadband Home | 44 | 50.0% |
| Cellular Data Only | 36 | 40.9% |
| Satellite Internet | 18 | 20.4% |
| No Internet | 5 | 5.7% |
| Total | 88 | 100.0% |
Woodruff Summary
History
The small town of Woodruff, Utah is located in the northeastern corner of the state, near the Wyoming border. It was first settled in 1876 by a group of Mormon pioneers led by John Woodruff. The town was originally called Woodruffville, but the name was changed to Woodruff in 1882.
The town was initially a farming community, but it soon became a center for the timber industry. The first sawmill was built in 1883, and the town quickly became a hub for the lumber industry. The town also had a thriving dairy industry, and the first cheese factory was built in 1887.
The town was incorporated in 1895, and the population grew steadily over the next few decades. By the 1930s, the town had a population of over 1,000 people.
The timber industry continued to be the main source of income for the town until the 1950s, when the industry began to decline. The town then shifted its focus to tourism, and the nearby Uinta National Forest became a popular destination for outdoor recreation.
The town has remained relatively small with a population of just over 1 000 people in 2020
Geography
Woodruff is located in the northeastern corner of Utah, near the Wyoming border. It is situated in the Uinta Mountains, at an elevation of 6,400 feet. The town is surrounded by the Uinta National Forest, which provides a variety of outdoor recreational opportunities.
The climate in Woodruff is semi-arid, with hot summers and cold winters. The average annual temperature is around 45 degrees Fahrenheit, and the average annual precipitation is around 15 inches.
Economy
The economy of Woodruff is largely based on tourism. The nearby Uinta National Forest provides a variety of outdoor recreational activities, such as camping, fishing, hiking, and hunting. The town also has a few small businesses, such as restaurants, shops, and a gas station.
The town is also home to a few small manufacturing companies, such as a furniture factory and a woodworking shop.
Demographics
As of the 2020 census, the population of Woodruff was 1,072. The racial makeup of the town was 95.2% White, 0.7% Native American, 0.3% Asian, 0.2% African American, and 3.6% from other races.
The median household income in Woodruff was $41,250, and the median home value was $150,000. The town has a poverty rate of 11.2%, and the unemployment rate was 4.2%.
Conclusion
Woodruff, Utah is a small town located in the northeastern corner of the state, near the Wyoming border. It was first settled in 1876 by a group of Mormon pioneers, and the town has remained relatively small, with a population of just over 1,000 people in 2020. The economy of Woodruff is largely based on tourism, and the nearby Uinta National Forest provides a variety of outdoor recreational activities. The town also has a few small businesses, such as restaurants, shops, and a gas station. The racial makeup of the town is 95.2% White, 0.7% Native American, 0.3% Asian, 0.2% African American, and 3.6% from other races. The median household income in Woodruff was $41,250, and the median home value was $150,000.
Common Questions
What is Per Capita Income in Woodruff?
Per Capita income in Woodruff is $32,942.
What is the Median Family Income in Woodruff?
Median Family Income in Woodruff is $138,295.
What is Inequality or Gini Index in Woodruff?
Inequality or Gini Index in Woodruff is 0.35.
What is the Total Population of Woodruff?
Total Population of Woodruff is 262.
What is the Total Male Population of Woodruff?
Total Male Population of Woodruff is 151.
What is the Total Female Population of Woodruff?
Total Female Population of Woodruff is 111.
What is the Ratio of Males per 100 Females in Woodruff?
There are 136.04 Males per 100 Females in Woodruff.
What is the Ratio of Females per 100 Males in Woodruff?
There are 73.51 Females per 100 Males in Woodruff.
What is the Median Population Age in Woodruff?
Median Population Age in Woodruff is 31.5 Years.
What is the Average Family Size in Woodruff
Average Family Size in Woodruff is 3.5 People.
What is the Average Household Size in Woodruff
Average Household Size in Woodruff is 3.0 People.
How Large is the Labor Force in Woodruff?
There are 88 People in the Labor Forcein in Woodruff.
What is the Percentage of People in the Labor Force in Woodruff?
55.3% of People are in the Labor Force in Woodruff.