Leamington, UT Map & Demographics
Leamington Map
Leamington Overview
$27,842
PER CAPITA INCOME
$59,500
AVG FAMILY INCOME
$59,000
AVG HOUSEHOLD INCOME
0.36
INEQUALITY / GINI INDEX
303
TOTAL POPULATION
139
MALE POPULATION
164
FEMALE POPULATION
84.76
MALES / 100 FEMALES
117.99
FEMALES / 100 MALES
25.9
MEDIAN AGE
3.5
AVG FAMILY SIZE
3.4
AVG HOUSEHOLD SIZE
130
LABOR FORCE [ PEOPLE ]
65.0%
PERCENT IN LABOR FORCE
3.1%
UNEMPLOYMENT RATE
Leamington Zip Codes
Leamington Area Codes
Income in Leamington
Income Overview in Leamington
Per Capita Income in Leamington is $27,842, while median incomes of families and households are $59,500 and $59,000 respectively.
| Characteristic | Number | Measure |
| Per Capita Income | 303 | $27,842 |
| Median Family Income | 86 | $59,500 |
| Mean Family Income | 86 | $81,183 |
| Median Household Income | 90 | $59,000 |
| Mean Household Income | 90 | $80,273 |
| Income Deficit | 86 | $0 |
| Wage / Income Gap (%) | 303 | 0.00% |
| Wage / Income Gap ($) | 303 | 100.00¢ per $1 |
| Gini / Inequality Index | 303 | 0.36 |
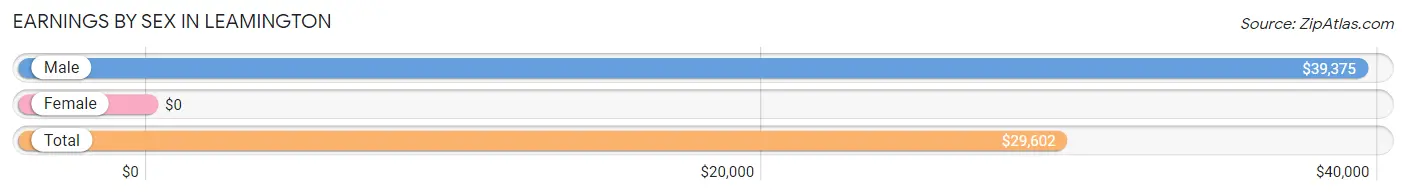
Earnings by Sex in Leamington
| Sex | Number | Average Earnings |
| Male | 63 (45.3%) | $39,375 |
| Female | 76 (54.7%) | $0 |
| Total | 139 (100.0%) | $29,602 |
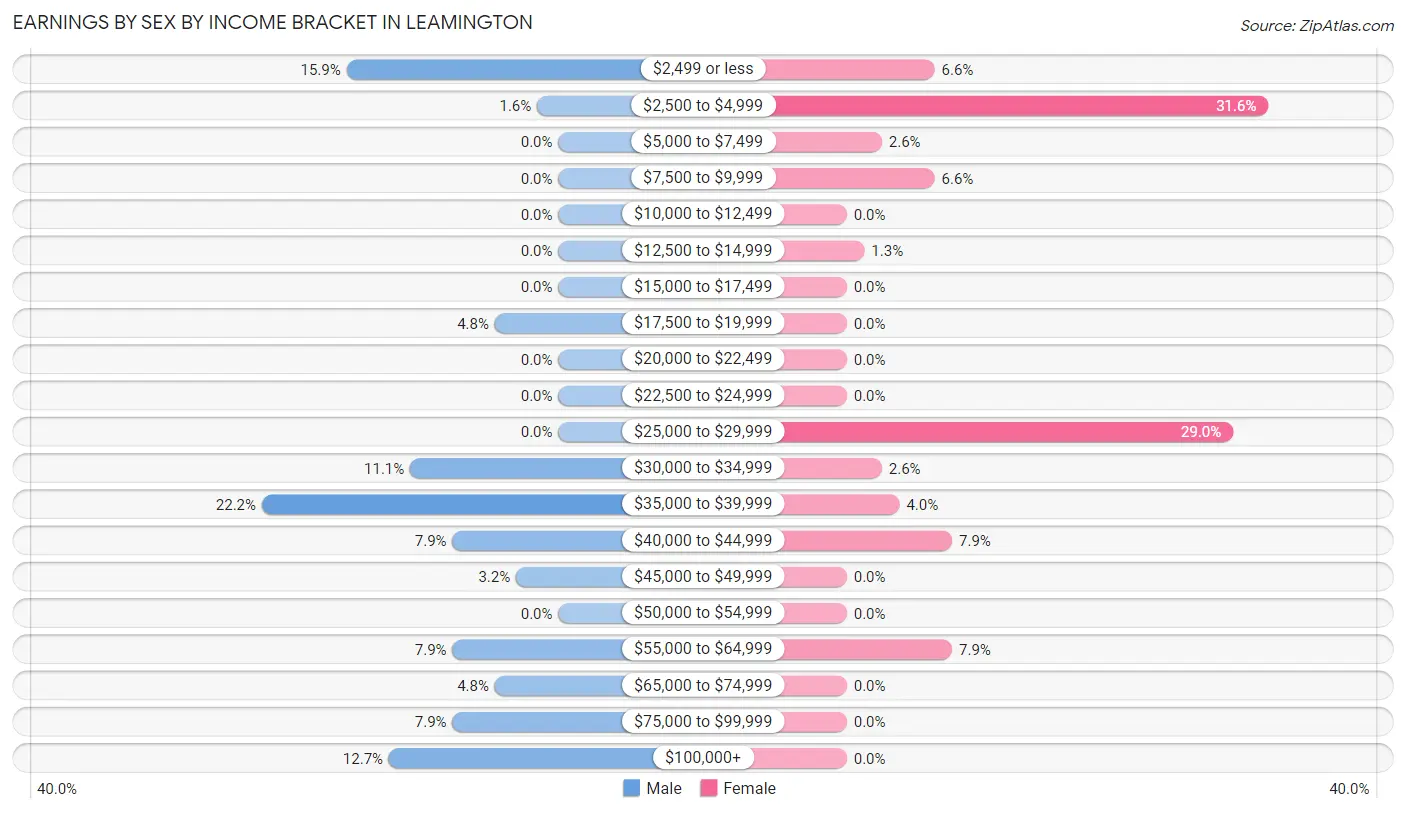
Earnings by Sex by Income Bracket in Leamington
The most common earnings brackets in Leamington are $35,000 to $39,999 for men (14 | 22.2%) and $2,500 to $4,999 for women (24 | 31.6%).
| Income | Male | Female |
| $2,499 or less | 10 (15.9%) | 5 (6.6%) |
| $2,500 to $4,999 | 1 (1.6%) | 24 (31.6%) |
| $5,000 to $7,499 | 0 (0.0%) | 2 (2.6%) |
| $7,500 to $9,999 | 0 (0.0%) | 5 (6.6%) |
| $10,000 to $12,499 | 0 (0.0%) | 0 (0.0%) |
| $12,500 to $14,999 | 0 (0.0%) | 1 (1.3%) |
| $15,000 to $17,499 | 0 (0.0%) | 0 (0.0%) |
| $17,500 to $19,999 | 3 (4.8%) | 0 (0.0%) |
| $20,000 to $22,499 | 0 (0.0%) | 0 (0.0%) |
| $22,500 to $24,999 | 0 (0.0%) | 0 (0.0%) |
| $25,000 to $29,999 | 0 (0.0%) | 22 (28.9%) |
| $30,000 to $34,999 | 7 (11.1%) | 2 (2.6%) |
| $35,000 to $39,999 | 14 (22.2%) | 3 (4.0%) |
| $40,000 to $44,999 | 5 (7.9%) | 6 (7.9%) |
| $45,000 to $49,999 | 2 (3.2%) | 0 (0.0%) |
| $50,000 to $54,999 | 0 (0.0%) | 0 (0.0%) |
| $55,000 to $64,999 | 5 (7.9%) | 6 (7.9%) |
| $65,000 to $74,999 | 3 (4.8%) | 0 (0.0%) |
| $75,000 to $99,999 | 5 (7.9%) | 0 (0.0%) |
| $100,000+ | 8 (12.7%) | 0 (0.0%) |
| Total | 63 (100.0%) | 76 (100.0%) |
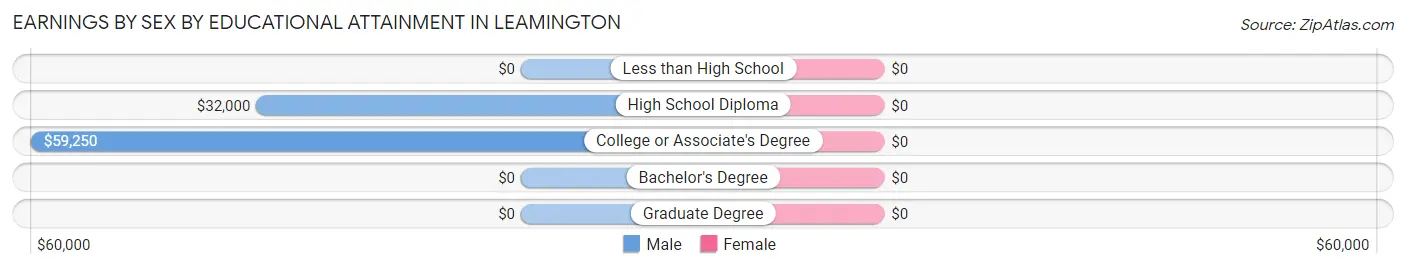
Earnings by Sex by Educational Attainment in Leamington
| Educational Attainment | Male Income | Female Income |
| Less than High School | - | - |
| High School Diploma | $32,000 | $0 |
| College or Associate's Degree | $59,250 | $0 |
| Bachelor's Degree | - | - |
| Graduate Degree | - | - |
| Total | $39,464 | $0 |
Family Income in Leamington
Family Income Brackets in Leamington
According to the Leamington family income data, there are 21 families falling into the $50,000 to $74,999 income range, which is the most common income bracket and makes up 24.4% of all families.
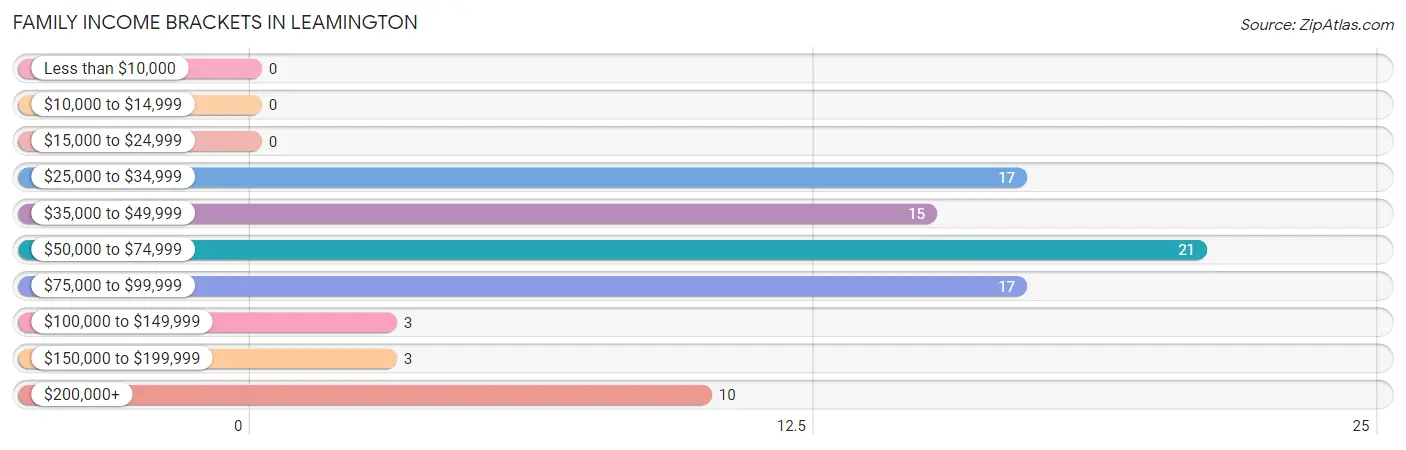
| Income Bracket | # Families | % Families |
| Less than $10,000 | 0 | 0.0% |
| $10,000 to $14,999 | 0 | 0.0% |
| $15,000 to $24,999 | 0 | 0.0% |
| $25,000 to $34,999 | 17 | 19.8% |
| $35,000 to $49,999 | 15 | 17.4% |
| $50,000 to $74,999 | 21 | 24.4% |
| $75,000 to $99,999 | 17 | 19.8% |
| $100,000 to $149,999 | 3 | 3.5% |
| $150,000 to $199,999 | 3 | 3.5% |
| $200,000+ | 10 | 11.6% |
Family Income by Famaliy Size in Leamington
5-person families (5 | 5.8%) account for the highest median family income in Leamington with $88,125 per family, while 2-person families (35 | 40.7%) have the highest median income of $40,104 per family member.
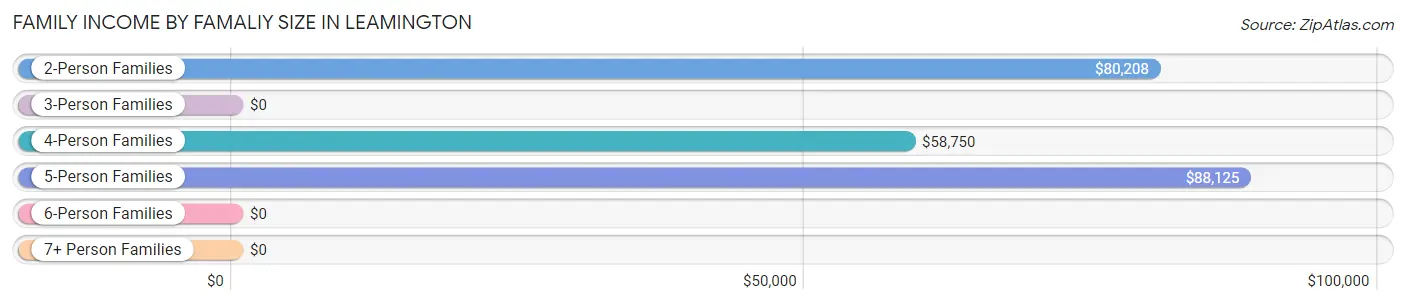
| Income Bracket | # Families | Median Income |
| 2-Person Families | 35 (40.7%) | $80,208 |
| 3-Person Families | 16 (18.6%) | $0 |
| 4-Person Families | 9 (10.5%) | $58,750 |
| 5-Person Families | 5 (5.8%) | $88,125 |
| 6-Person Families | 21 (24.4%) | $0 |
| 7+ Person Families | 0 (0.0%) | $0 |
| Total | 86 (100.0%) | $59,500 |
Family Income by Number of Earners in Leamington
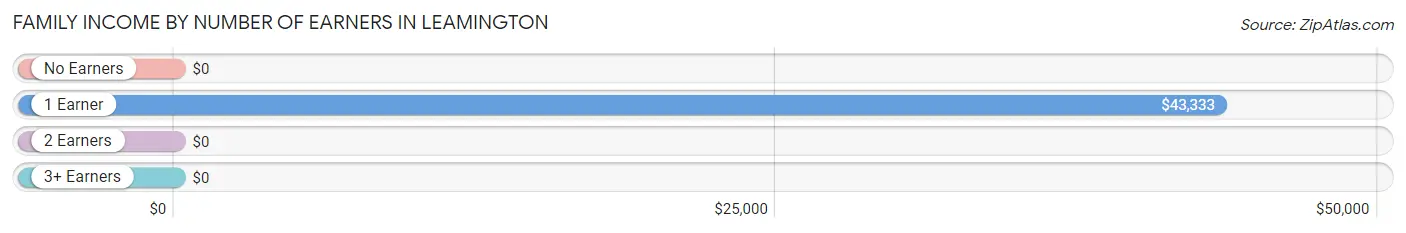
| Number of Earners | # Families | Median Income |
| No Earners | 12 (14.0%) | $0 |
| 1 Earner | 36 (41.9%) | $43,333 |
| 2 Earners | 19 (22.1%) | $0 |
| 3+ Earners | 19 (22.1%) | $0 |
| Total | 86 (100.0%) | $59,500 |
Household Income in Leamington
Household Income Brackets in Leamington
With 21 households falling in the category, the $50,000 to $74,999 income range is the most frequent in Leamington, accounting for 23.3% of all households.
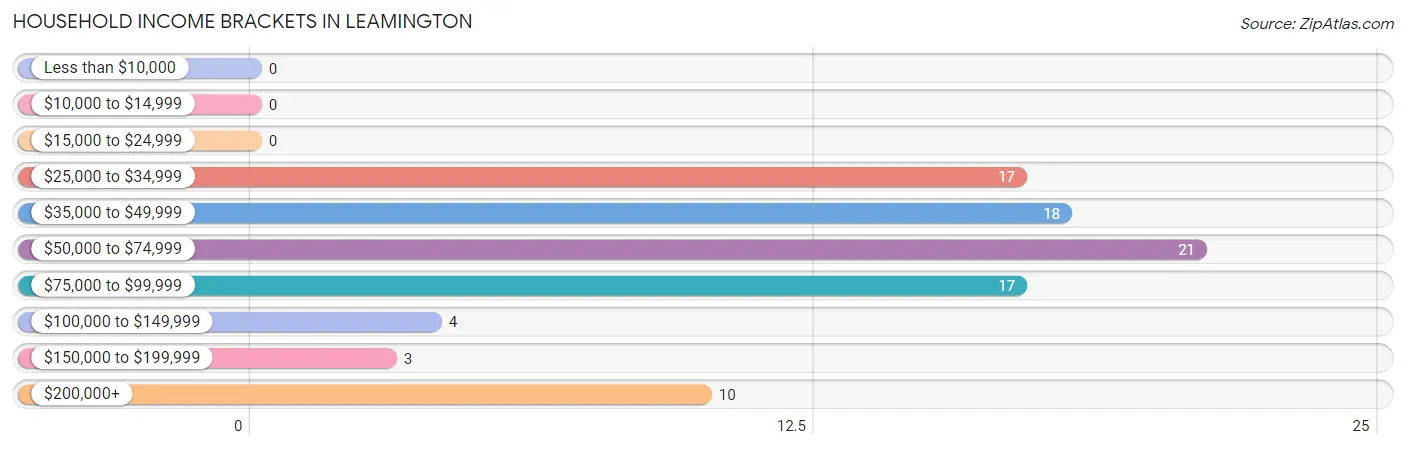
| Income Bracket | # Households | % Households |
| Less than $10,000 | 0 | 0.0% |
| $10,000 to $14,999 | 0 | 0.0% |
| $15,000 to $24,999 | 0 | 0.0% |
| $25,000 to $34,999 | 17 | 18.9% |
| $35,000 to $49,999 | 18 | 20.0% |
| $50,000 to $74,999 | 21 | 23.3% |
| $75,000 to $99,999 | 17 | 18.9% |
| $100,000 to $149,999 | 4 | 4.4% |
| $150,000 to $199,999 | 3 | 3.3% |
| $200,000+ | 10 | 11.1% |
Household Income by Householder Age in Leamington
The median household income in Leamington is $59,000, with the highest median household income of $81,042 found in the 65+ years age bracket for the primary householder. A total of 29 households (32.2%) fall into this category. Meanwhile, the 15 to 24 years age bracket for the primary householder has the lowest median household income of $0, with 15 households (16.7%) in this group.
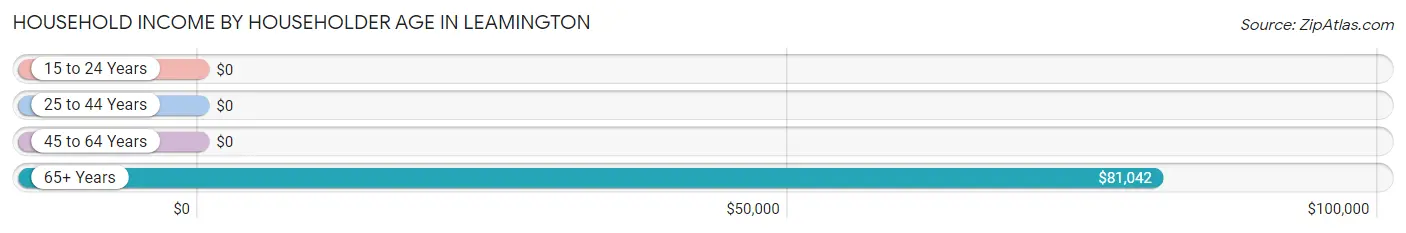
| Income Bracket | # Households | Median Income |
| 15 to 24 Years | 15 (16.7%) | $0 |
| 25 to 44 Years | 21 (23.3%) | $0 |
| 45 to 64 Years | 25 (27.8%) | $0 |
| 65+ Years | 29 (32.2%) | $81,042 |
| Total | 90 (100.0%) | $59,000 |
Poverty in Leamington
Income Below Poverty by Sex and Age in Leamington
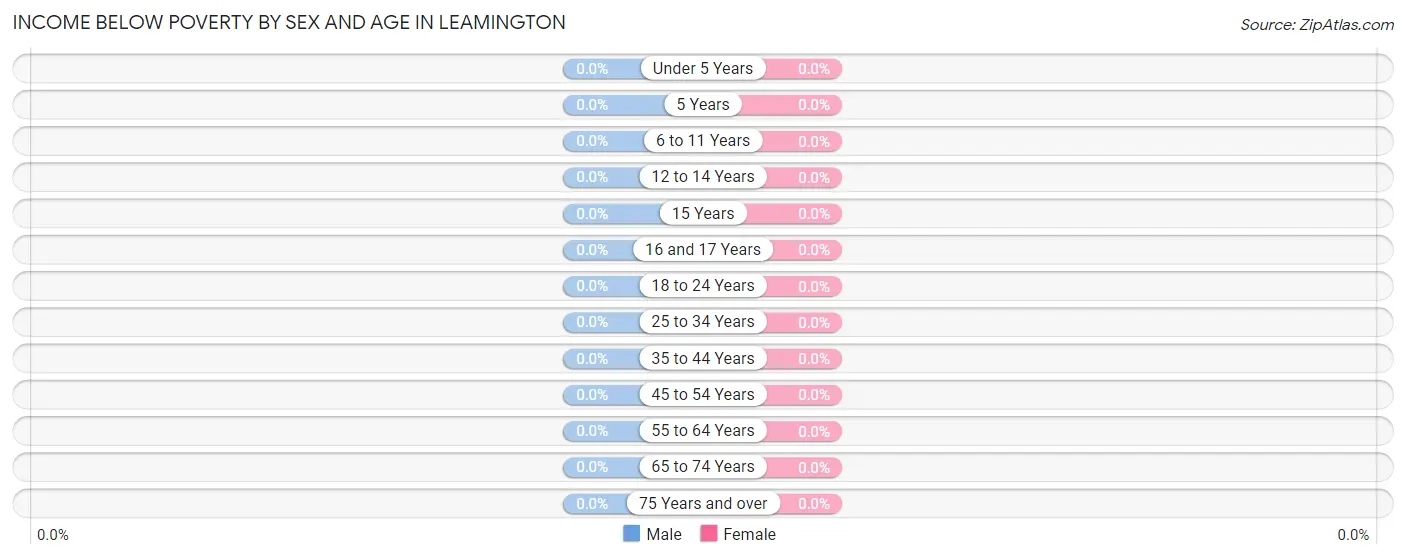
| Age Bracket | Male | Female |
| Under 5 Years | 0 (0.0%) | 0 (0.0%) |
| 5 Years | 0 (0.0%) | 0 (0.0%) |
| 6 to 11 Years | 0 (0.0%) | 0 (0.0%) |
| 12 to 14 Years | 0 (0.0%) | 0 (0.0%) |
| 15 Years | 0 (0.0%) | 0 (0.0%) |
| 16 and 17 Years | 0 (0.0%) | 0 (0.0%) |
| 18 to 24 Years | 0 (0.0%) | 0 (0.0%) |
| 25 to 34 Years | 0 (0.0%) | 0 (0.0%) |
| 35 to 44 Years | 0 (0.0%) | 0 (0.0%) |
| 45 to 54 Years | 0 (0.0%) | 0 (0.0%) |
| 55 to 64 Years | 0 (0.0%) | 0 (0.0%) |
| 65 to 74 Years | 0 (0.0%) | 0 (0.0%) |
| 75 Years and over | 0 (0.0%) | 0 (0.0%) |
| Total | 0 (0.0%) | 0 (0.0%) |
Income Above Poverty by Sex and Age in Leamington
According to the poverty statistics in Leamington, males aged under 5 years and females aged under 5 years are the age groups that are most secure financially, with 100.0% of males and 100.0% of females in these age groups living above the poverty line.
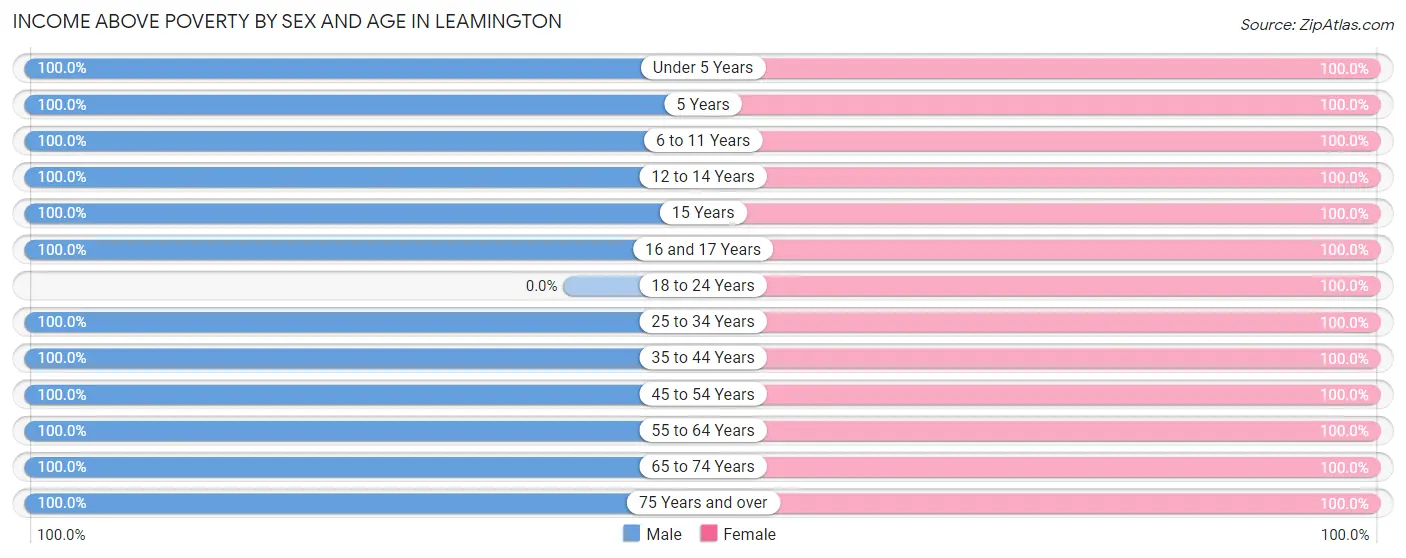
| Age Bracket | Male | Female |
| Under 5 Years | 9 (100.0%) | 26 (100.0%) |
| 5 Years | 13 (100.0%) | 6 (100.0%) |
| 6 to 11 Years | 17 (100.0%) | 16 (100.0%) |
| 12 to 14 Years | 12 (100.0%) | 2 (100.0%) |
| 15 Years | 1 (100.0%) | 1 (100.0%) |
| 16 and 17 Years | 1 (100.0%) | 9 (100.0%) |
| 18 to 24 Years | 0 (0.0%) | 25 (100.0%) |
| 25 to 34 Years | 10 (100.0%) | 10 (100.0%) |
| 35 to 44 Years | 15 (100.0%) | 16 (100.0%) |
| 45 to 54 Years | 9 (100.0%) | 17 (100.0%) |
| 55 to 64 Years | 18 (100.0%) | 4 (100.0%) |
| 65 to 74 Years | 21 (100.0%) | 22 (100.0%) |
| 75 Years and over | 13 (100.0%) | 10 (100.0%) |
| Total | 139 (100.0%) | 164 (100.0%) |
Income Below Poverty Among Married-Couple Families in Leamington
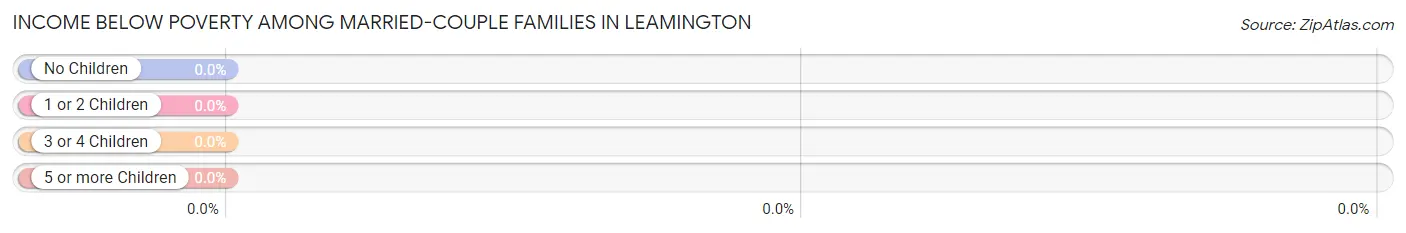
| Children | Above Poverty | Below Poverty |
| No Children | 32 (100.0%) | 0 (0.0%) |
| 1 or 2 Children | 12 (100.0%) | 0 (0.0%) |
| 3 or 4 Children | 24 (100.0%) | 0 (0.0%) |
| 5 or more Children | 0 (0.0%) | 0 (0.0%) |
| Total | 68 (100.0%) | 0 (0.0%) |
Income Below Poverty Among Single-Parent Households in Leamington
| Children | Single Father | Single Mother |
| No Children | 0 (0.0%) | 0 (0.0%) |
| 1 or 2 Children | 0 (0.0%) | 0 (0.0%) |
| 3 or 4 Children | 0 (0.0%) | 0 (0.0%) |
| 5 or more Children | 0 (0.0%) | 0 (0.0%) |
| Total | 0 (0.0%) | 0 (0.0%) |
Income Below Poverty Among Married-Couple vs Single-Parent Households in Leamington
| Children | Married-Couple Families | Single-Parent Households |
| No Children | 0 (0.0%) | 0 (0.0%) |
| 1 or 2 Children | 0 (0.0%) | 0 (0.0%) |
| 3 or 4 Children | 0 (0.0%) | 0 (0.0%) |
| 5 or more Children | 0 (0.0%) | 0 (0.0%) |
| Total | 0 (0.0%) | 0 (0.0%) |
Race in Leamington
The most populous races in Leamington are White / Caucasian (268 | 88.4%), Hispanic or Latino (33 | 10.9%), and Two or more Races (33 | 10.9%).
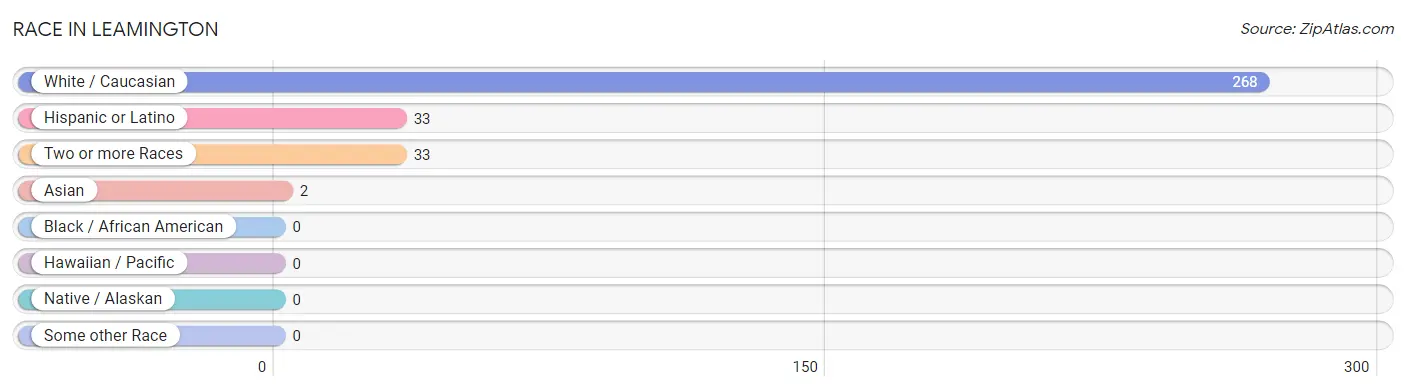
| Race | # Population | % Population |
| Asian | 2 | 0.7% |
| Black / African American | 0 | 0.0% |
| Hawaiian / Pacific | 0 | 0.0% |
| Hispanic or Latino | 33 | 10.9% |
| Native / Alaskan | 0 | 0.0% |
| White / Caucasian | 268 | 88.4% |
| Two or more Races | 33 | 10.9% |
| Some other Race | 0 | 0.0% |
| Total | 303 | 100.0% |
Ancestry in Leamington
The most populous ancestries reported in Leamington are English (113 | 37.3%), American (59 | 19.5%), Danish (35 | 11.6%), Central American (33 | 10.9%), and Guatemalan (33 | 10.9%), together accounting for 90.1% of all Leamington residents.
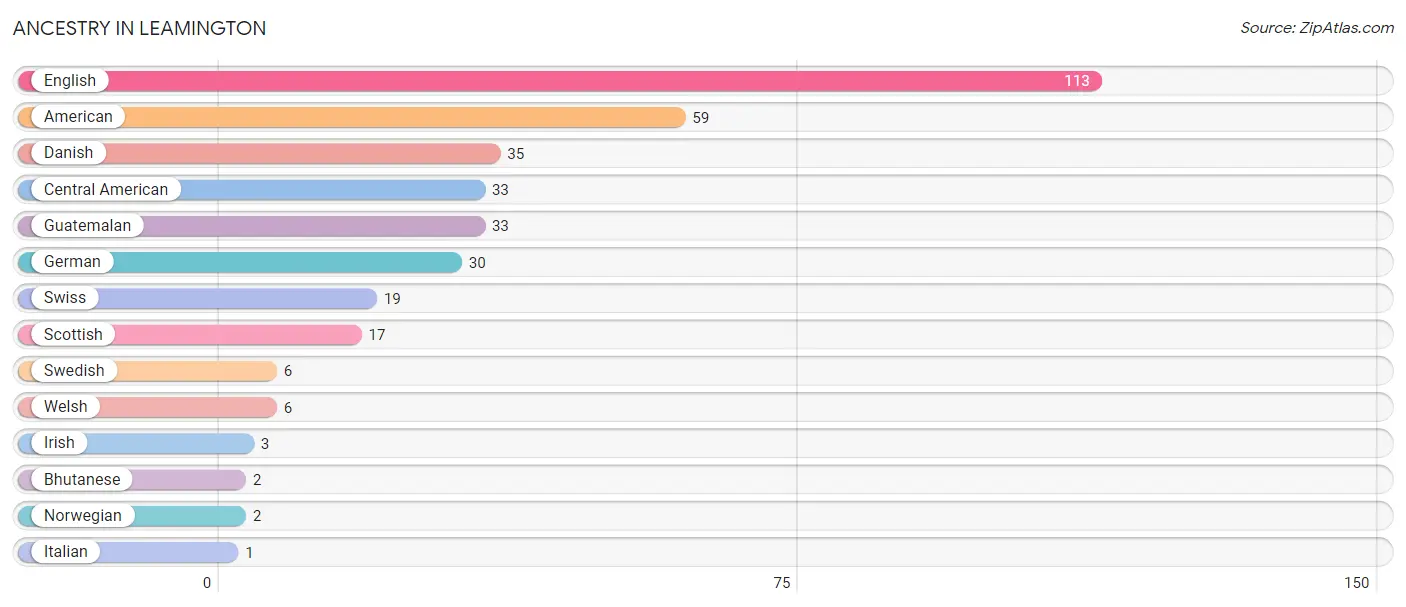
| Ancestry | # Population | % Population |
| American | 59 | 19.5% |
| Bhutanese | 2 | 0.7% |
| Central American | 33 | 10.9% |
| Danish | 35 | 11.6% |
| English | 113 | 37.3% |
| German | 30 | 9.9% |
| Guatemalan | 33 | 10.9% |
| Irish | 3 | 1.0% |
| Italian | 1 | 0.3% |
| Norwegian | 2 | 0.7% |
| Scottish | 17 | 5.6% |
| Swedish | 6 | 2.0% |
| Swiss | 19 | 6.3% |
| Welsh | 6 | 2.0% | View All 14 Rows |
Immigrants in Leamington
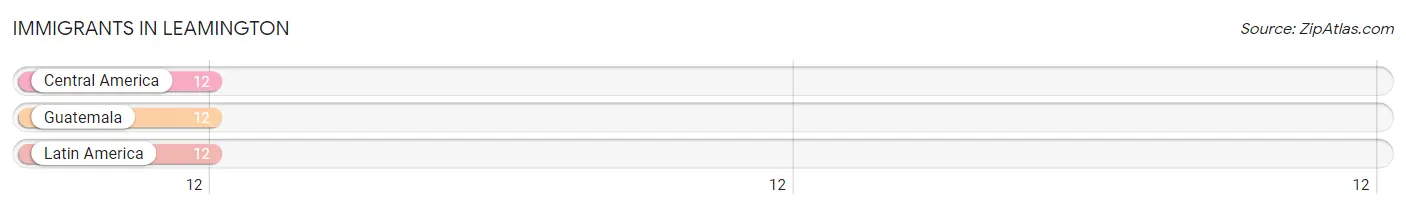
The most numerous immigrant groups reported in Leamington came from Central America (12 | 4.0%), Guatemala (12 | 4.0%), and Latin America (12 | 4.0%), together accounting for 11.9% of all Leamington residents.
| Immigration Origin | # Population | % Population |
| Central America | 12 | 4.0% |
| Guatemala | 12 | 4.0% |
| Latin America | 12 | 4.0% | View All 3 Rows |
Sex and Age in Leamington
Sex and Age in Leamington
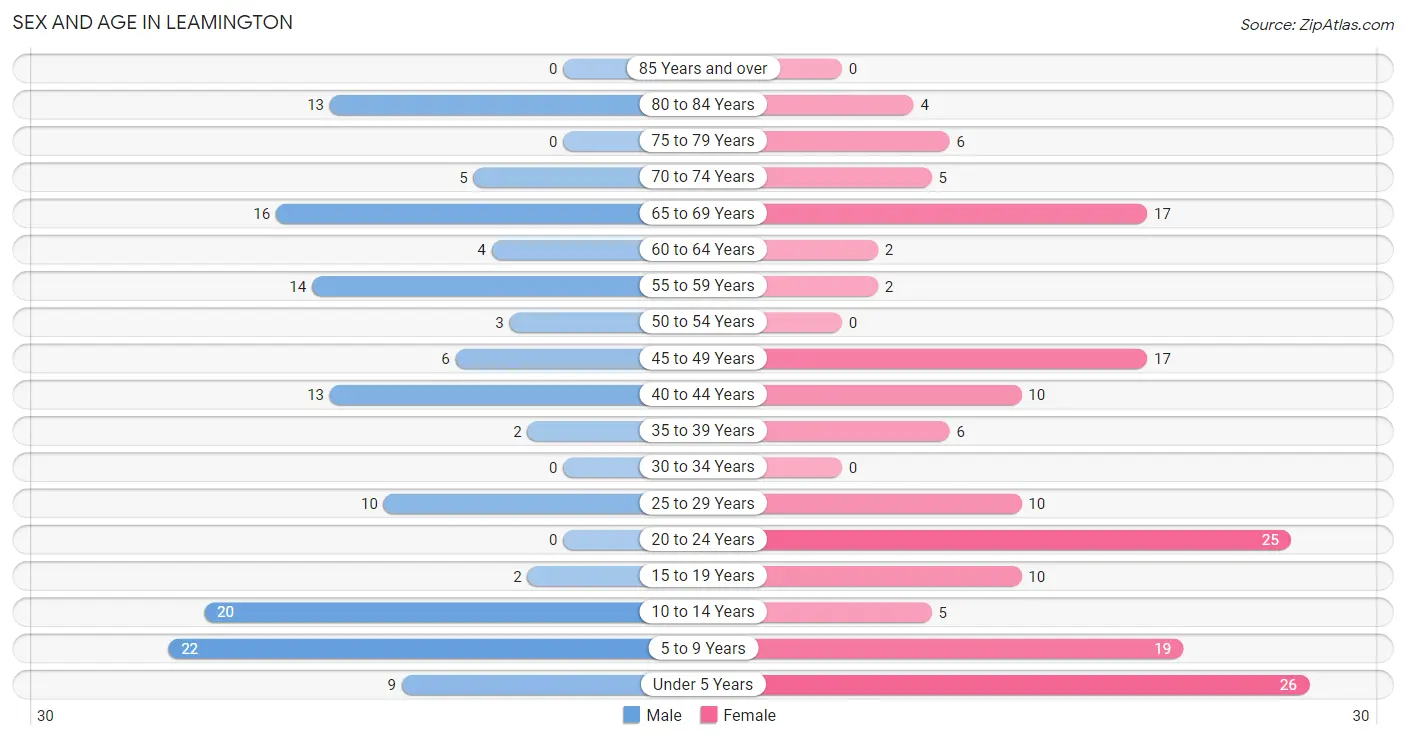
The most populous age groups in Leamington are 5 to 9 Years (22 | 15.8%) for men and Under 5 Years (26 | 15.9%) for women.
| Age Bracket | Male | Female |
| Under 5 Years | 9 (6.5%) | 26 (15.9%) |
| 5 to 9 Years | 22 (15.8%) | 19 (11.6%) |
| 10 to 14 Years | 20 (14.4%) | 5 (3.0%) |
| 15 to 19 Years | 2 (1.4%) | 10 (6.1%) |
| 20 to 24 Years | 0 (0.0%) | 25 (15.2%) |
| 25 to 29 Years | 10 (7.2%) | 10 (6.1%) |
| 30 to 34 Years | 0 (0.0%) | 0 (0.0%) |
| 35 to 39 Years | 2 (1.4%) | 6 (3.7%) |
| 40 to 44 Years | 13 (9.3%) | 10 (6.1%) |
| 45 to 49 Years | 6 (4.3%) | 17 (10.4%) |
| 50 to 54 Years | 3 (2.2%) | 0 (0.0%) |
| 55 to 59 Years | 14 (10.1%) | 2 (1.2%) |
| 60 to 64 Years | 4 (2.9%) | 2 (1.2%) |
| 65 to 69 Years | 16 (11.5%) | 17 (10.4%) |
| 70 to 74 Years | 5 (3.6%) | 5 (3.0%) |
| 75 to 79 Years | 0 (0.0%) | 6 (3.7%) |
| 80 to 84 Years | 13 (9.3%) | 4 (2.4%) |
| 85 Years and over | 0 (0.0%) | 0 (0.0%) |
| Total | 139 (100.0%) | 164 (100.0%) |
Families and Households in Leamington
Median Family Size in Leamington
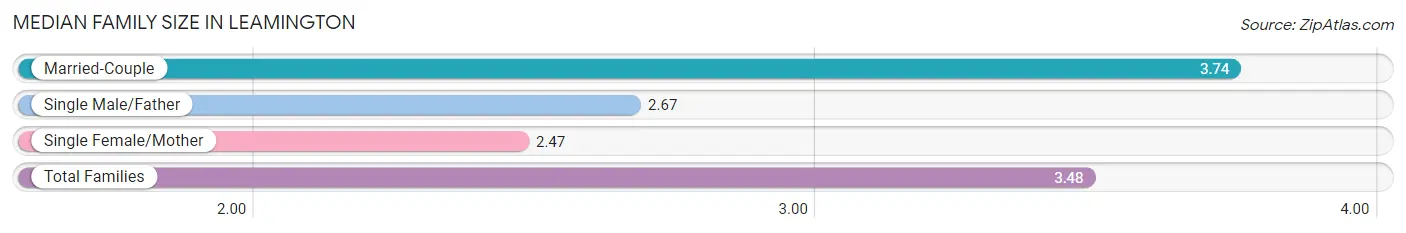
The median family size in Leamington is 3.48 persons per family, with married-couple families (68 | 79.1%) accounting for the largest median family size of 3.74 persons per family. On the other hand, single female/mother families (15 | 17.4%) represent the smallest median family size with 2.47 persons per family.
| Family Type | # Families | Family Size |
| Married-Couple | 68 (79.1%) | 3.74 |
| Single Male/Father | 3 (3.5%) | 2.67 |
| Single Female/Mother | 15 (17.4%) | 2.47 |
| Total Families | 86 (100.0%) | 3.48 |
Median Household Size in Leamington
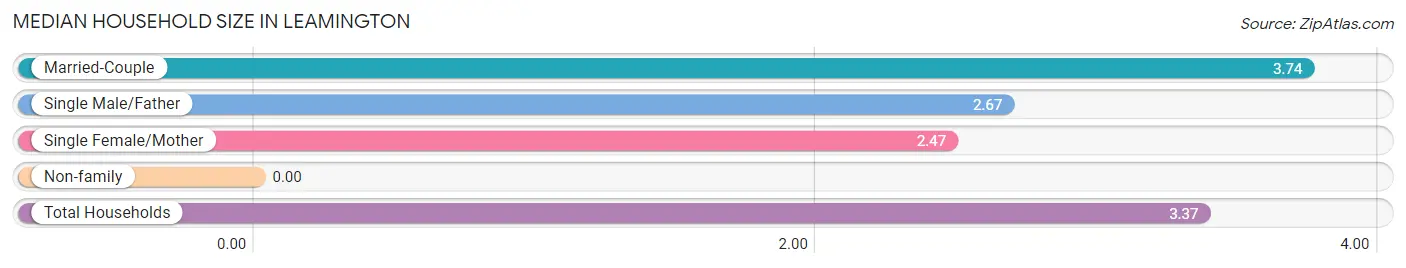
| Household Type | # Households | Household Size |
| Married-Couple | 68 (75.6%) | 3.74 |
| Single Male/Father | 3 (3.3%) | 2.67 |
| Single Female/Mother | 15 (16.7%) | 2.47 |
| Non-family | 4 (4.4%) | - |
| Total Households | 90 (100.0%) | 3.37 |
Household Size by Marriage Status in Leamington
Out of a total of 90 households in Leamington, 86 (95.6%) are family households, while 4 (4.4%) are nonfamily households. The most numerous type of family households are 2-person households, comprising 35, and the most common type of nonfamily households are 1-person households, comprising 4.
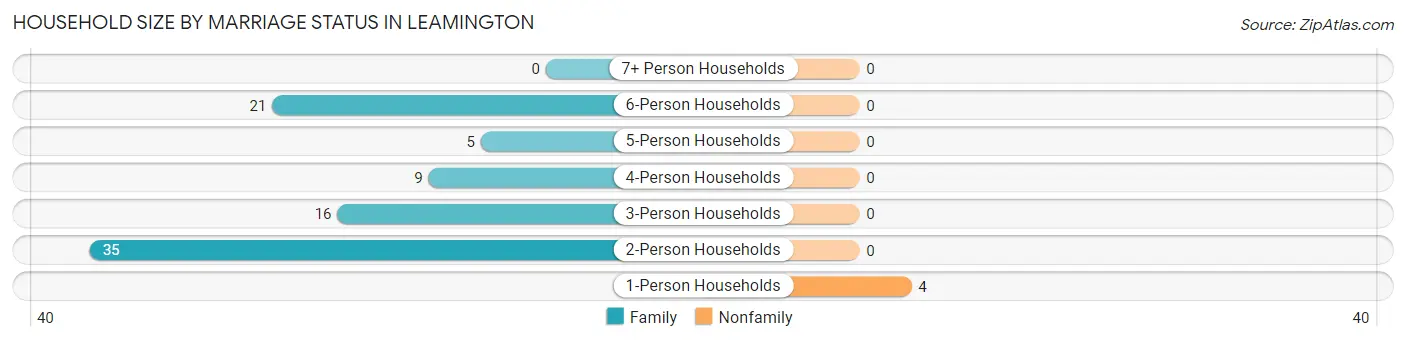
| Household Size | Family Households | Nonfamily Households |
| 1-Person Households | - | 4 (4.4%) |
| 2-Person Households | 35 (38.9%) | 0 (0.0%) |
| 3-Person Households | 16 (17.8%) | 0 (0.0%) |
| 4-Person Households | 9 (10.0%) | 0 (0.0%) |
| 5-Person Households | 5 (5.6%) | 0 (0.0%) |
| 6-Person Households | 21 (23.3%) | 0 (0.0%) |
| 7+ Person Households | 0 (0.0%) | 0 (0.0%) |
| Total | 86 (95.6%) | 4 (4.4%) |
Female Fertility in Leamington
Fertility by Age in Leamington
Average fertility rate in Leamington is 128.0 births per 1,000 women. Women in the age bracket of 20 to 34 years have the highest fertility rate with 286.0 births per 1,000 women. Women in the age bracket of 20 to 34 years acount for 100.0% of all women with births.
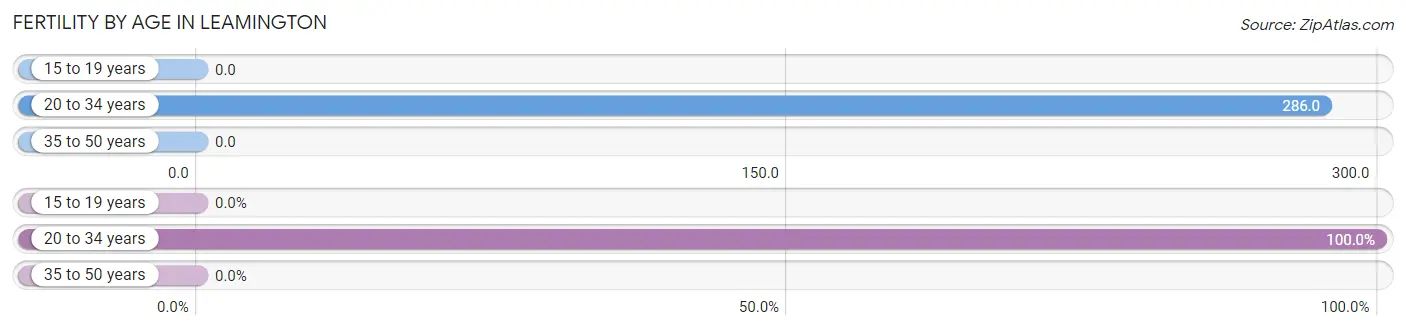
| Age Bracket | Women with Births | Births / 1,000 Women |
| 15 to 19 years | 0 (0.0%) | 0.0 |
| 20 to 34 years | 10 (100.0%) | 286.0 |
| 35 to 50 years | 0 (0.0%) | 0.0 |
| Total | 10 (100.0%) | 128.0 |
Fertility by Age by Marriage Status in Leamington
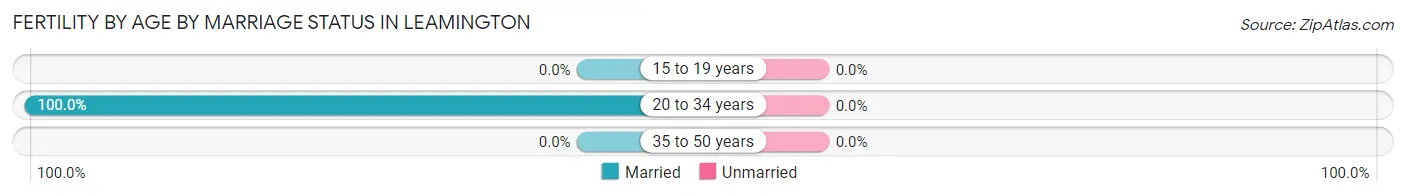
| Age Bracket | Married | Unmarried |
| 15 to 19 years | 0 (0.0%) | 0 (0.0%) |
| 20 to 34 years | 10 (100.0%) | 0 (0.0%) |
| 35 to 50 years | 0 (0.0%) | 0 (0.0%) |
| Total | 10 (100.0%) | 0 (0.0%) |
Fertility by Education in Leamington
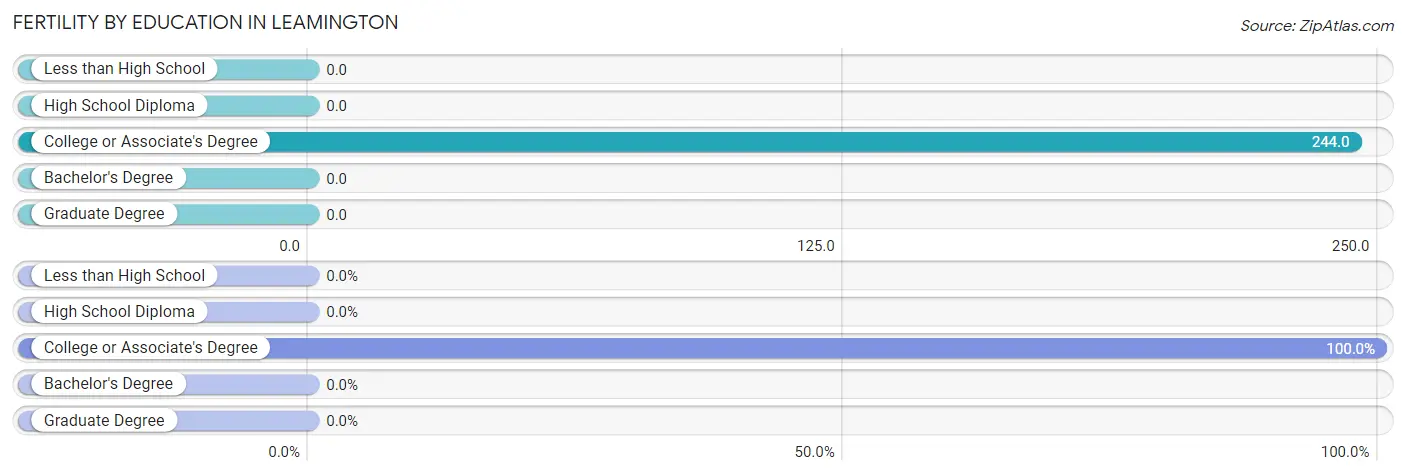
| Educational Attainment | Women with Births | Births / 1,000 Women |
| Less than High School | 0 (0.0%) | 0.0 |
| High School Diploma | 0 (0.0%) | 0.0 |
| College or Associate's Degree | 10 (100.0%) | 244.0 |
| Bachelor's Degree | 0 (0.0%) | 0.0 |
| Graduate Degree | 0 (0.0%) | 0.0 |
| Total | 10 (100.0%) | 128.0 |
Fertility by Education by Marriage Status in Leamington
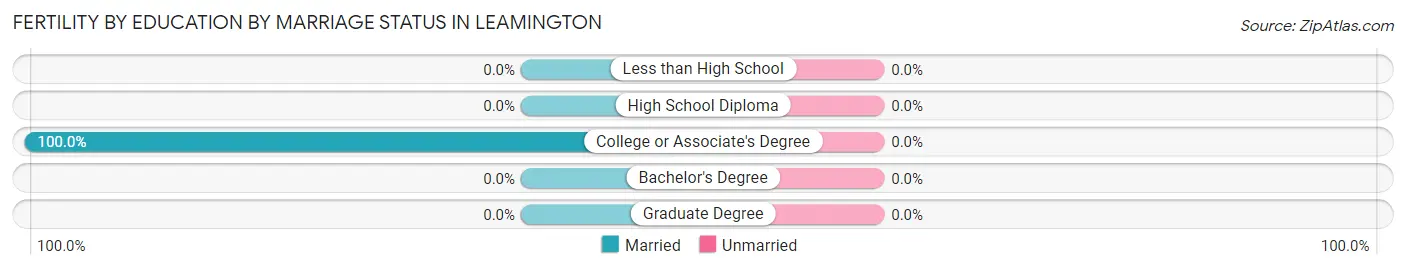
| Educational Attainment | Married | Unmarried |
| Less than High School | 0 (0.0%) | 0 (0.0%) |
| High School Diploma | 0 (0.0%) | 0 (0.0%) |
| College or Associate's Degree | 10 (100.0%) | 0 (0.0%) |
| Bachelor's Degree | 0 (0.0%) | 0 (0.0%) |
| Graduate Degree | 0 (0.0%) | 0 (0.0%) |
| Total | 10 (100.0%) | 0 (0.0%) |
Employment Characteristics in Leamington
Employment by Class of Employer in Leamington
Among the 126 employed individuals in Leamington, private company employees (78 | 61.9%), local government employees (22 | 17.5%), and state government employees (13 | 10.3%) make up the most common classes of employment.
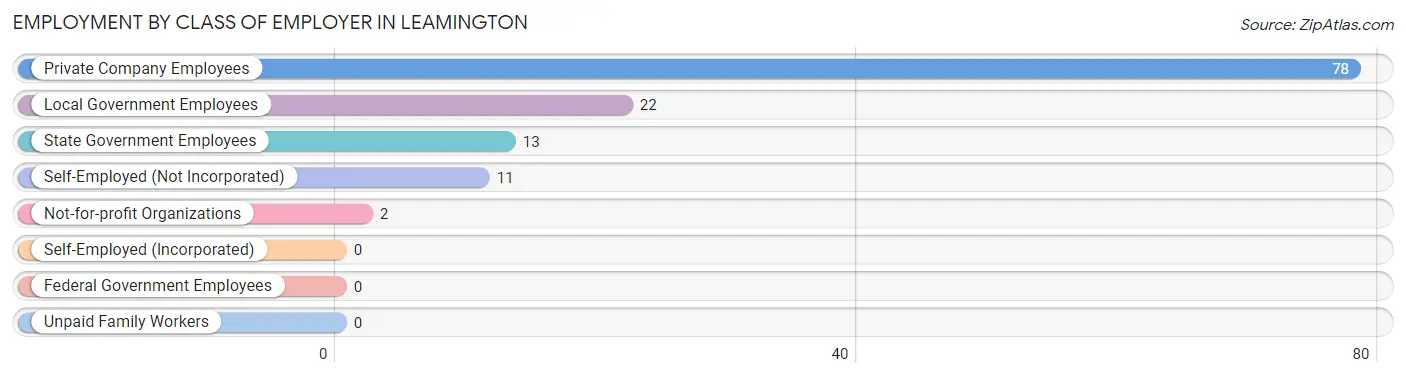
| Employer Class | # Employees | % Employees |
| Private Company Employees | 78 | 61.9% |
| Self-Employed (Incorporated) | 0 | 0.0% |
| Self-Employed (Not Incorporated) | 11 | 8.7% |
| Not-for-profit Organizations | 2 | 1.6% |
| Local Government Employees | 22 | 17.5% |
| State Government Employees | 13 | 10.3% |
| Federal Government Employees | 0 | 0.0% |
| Unpaid Family Workers | 0 | 0.0% |
| Total | 126 | 100.0% |
Employment Status by Age in Leamington
According to the labor force statistics for Leamington, out of the total population over 16 years of age (200), 65.0% or 130 individuals are in the labor force, with 3.1% or 4 of them unemployed. The age group with the highest labor force participation rate is 45 to 54 years, with 100.0% or 26 individuals in the labor force. Within the labor force, the 16 to 19 years age range has the highest percentage of unemployed individuals, with 66.7% or 4 of them being unemployed.
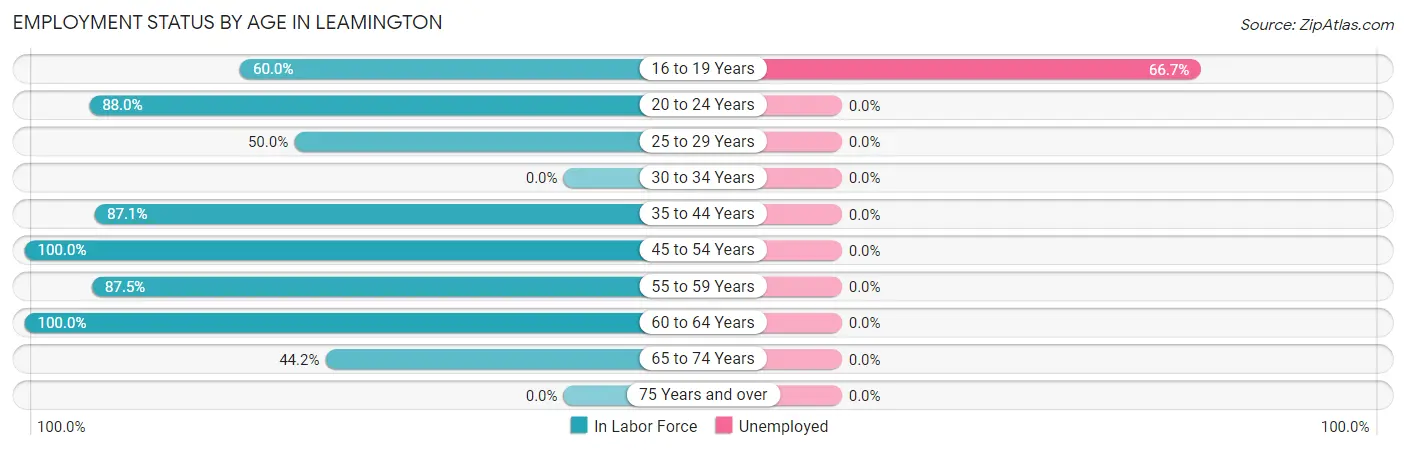
| Age Bracket | In Labor Force | Unemployed |
| 16 to 19 Years | 6 (60.0%) | 4 (66.7%) |
| 20 to 24 Years | 22 (88.0%) | 0 (0.0%) |
| 25 to 29 Years | 10 (50.0%) | 0 (0.0%) |
| 30 to 34 Years | 0 (0.0%) | 0 (0.0%) |
| 35 to 44 Years | 27 (87.1%) | 0 (0.0%) |
| 45 to 54 Years | 26 (100.0%) | 0 (0.0%) |
| 55 to 59 Years | 14 (87.5%) | 0 (0.0%) |
| 60 to 64 Years | 6 (100.0%) | 0 (0.0%) |
| 65 to 74 Years | 19 (44.2%) | 0 (0.0%) |
| 75 Years and over | 0 (0.0%) | 0 (0.0%) |
| Total | 130 (65.0%) | 4 (3.1%) |
Employment Status by Educational Attainment in Leamington
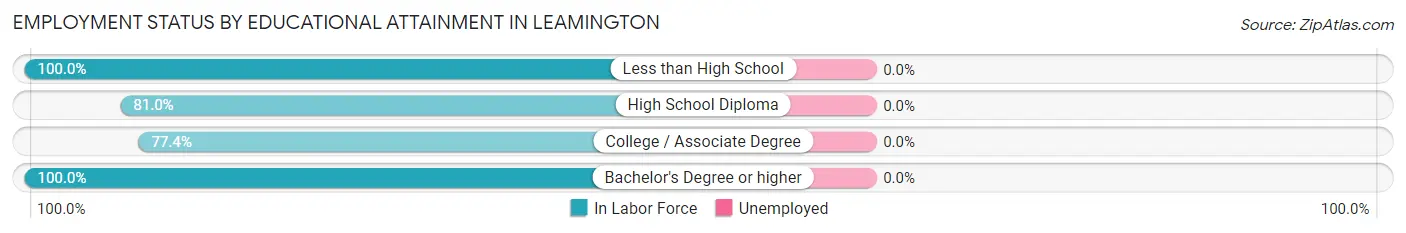
| Educational Attainment | In Labor Force | Unemployed |
| Less than High School | 2 (100.0%) | 0 (0.0%) |
| High School Diploma | 17 (81.0%) | 0 (0.0%) |
| College / Associate Degree | 41 (77.4%) | 0 (0.0%) |
| Bachelor's Degree or higher | 23 (100.0%) | 0 (0.0%) |
| Total | 83 (83.8%) | 0 (0.0%) |
Employment Occupations by Sex in Leamington
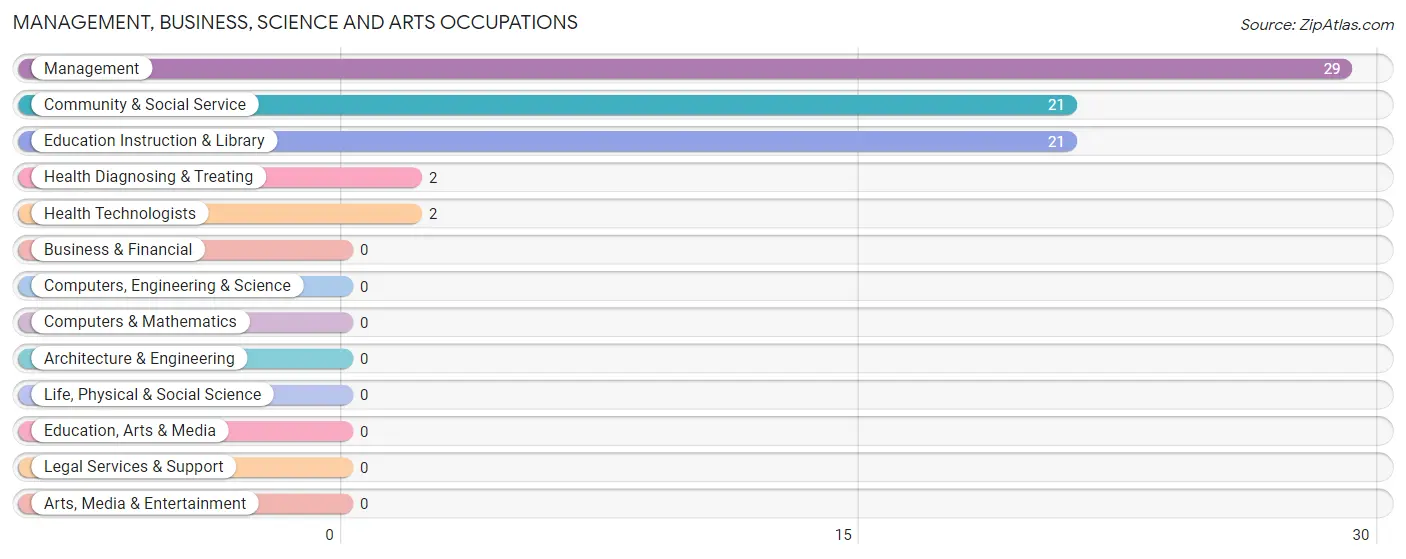
Management, Business, Science and Arts Occupations
The most common Management, Business, Science and Arts occupations in Leamington are Management (29 | 23.0%), Community & Social Service (21 | 16.7%), Education Instruction & Library (21 | 16.7%), Health Diagnosing & Treating (2 | 1.6%), and Health Technologists (2 | 1.6%).
Management, Business, Science and Arts Occupations by Sex
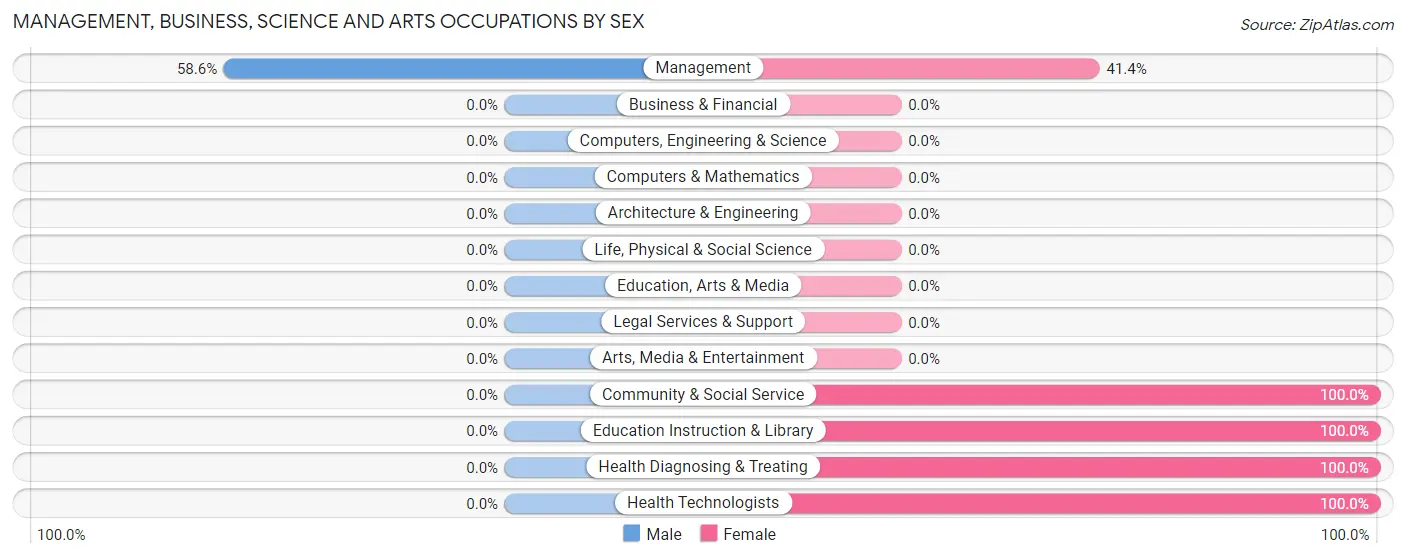
| Occupation | Male | Female |
| Management | 17 (58.6%) | 12 (41.4%) |
| Business & Financial | 0 (0.0%) | 0 (0.0%) |
| Computers, Engineering & Science | 0 (0.0%) | 0 (0.0%) |
| Computers & Mathematics | 0 (0.0%) | 0 (0.0%) |
| Architecture & Engineering | 0 (0.0%) | 0 (0.0%) |
| Life, Physical & Social Science | 0 (0.0%) | 0 (0.0%) |
| Community & Social Service | 0 (0.0%) | 21 (100.0%) |
| Education, Arts & Media | 0 (0.0%) | 0 (0.0%) |
| Legal Services & Support | 0 (0.0%) | 0 (0.0%) |
| Education Instruction & Library | 0 (0.0%) | 21 (100.0%) |
| Arts, Media & Entertainment | 0 (0.0%) | 0 (0.0%) |
| Health Diagnosing & Treating | 0 (0.0%) | 2 (100.0%) |
| Health Technologists | 0 (0.0%) | 2 (100.0%) |
| Total (Category) | 17 (32.7%) | 35 (67.3%) |
| Total (Overall) | 59 (46.8%) | 67 (53.2%) |
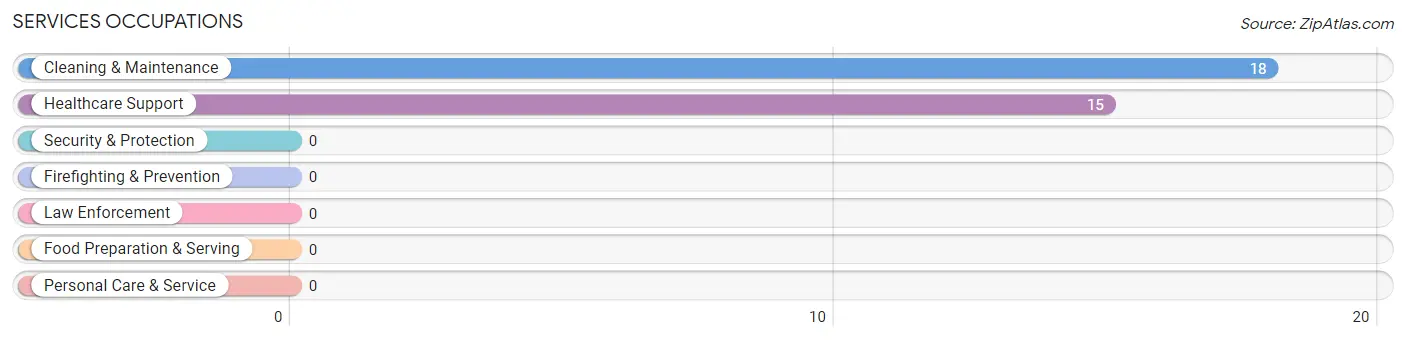
Services Occupations
The most common Services occupations in Leamington are Cleaning & Maintenance (18 | 14.3%), and Healthcare Support (15 | 11.9%).
Services Occupations by Sex
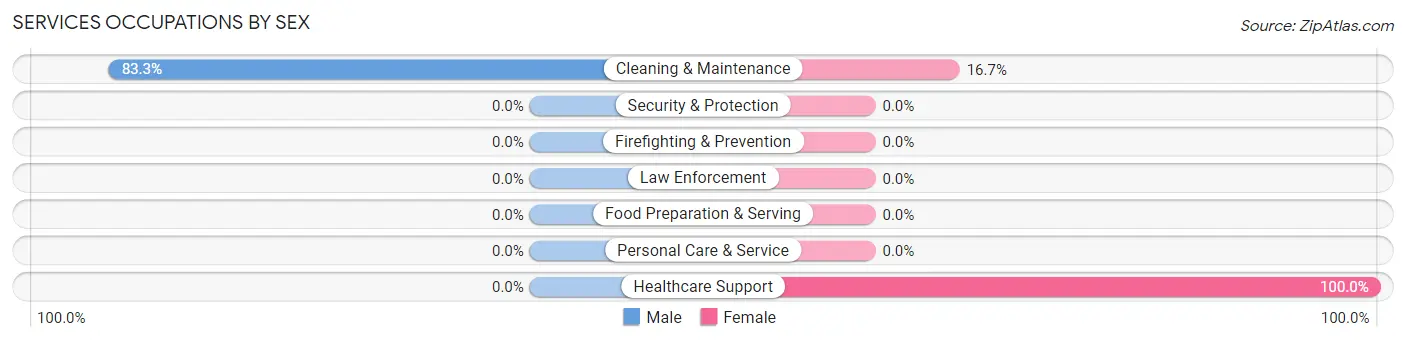
| Occupation | Male | Female |
| Healthcare Support | 0 (0.0%) | 15 (100.0%) |
| Security & Protection | 0 (0.0%) | 0 (0.0%) |
| Firefighting & Prevention | 0 (0.0%) | 0 (0.0%) |
| Law Enforcement | 0 (0.0%) | 0 (0.0%) |
| Food Preparation & Serving | 0 (0.0%) | 0 (0.0%) |
| Cleaning & Maintenance | 15 (83.3%) | 3 (16.7%) |
| Personal Care & Service | 0 (0.0%) | 0 (0.0%) |
| Total (Category) | 15 (45.5%) | 18 (54.5%) |
| Total (Overall) | 59 (46.8%) | 67 (53.2%) |
Sales and Office Occupations
The most common Sales and Office occupations in Leamington are Sales & Related (12 | 9.5%), and Office & Administration (5 | 4.0%).
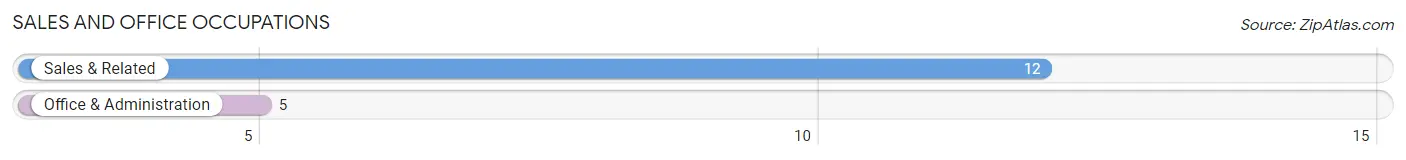
Sales and Office Occupations by Sex
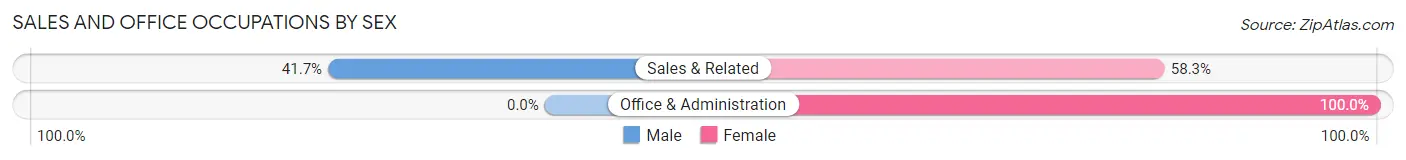
| Occupation | Male | Female |
| Sales & Related | 5 (41.7%) | 7 (58.3%) |
| Office & Administration | 0 (0.0%) | 5 (100.0%) |
| Total (Category) | 5 (29.4%) | 12 (70.6%) |
| Total (Overall) | 59 (46.8%) | 67 (53.2%) |
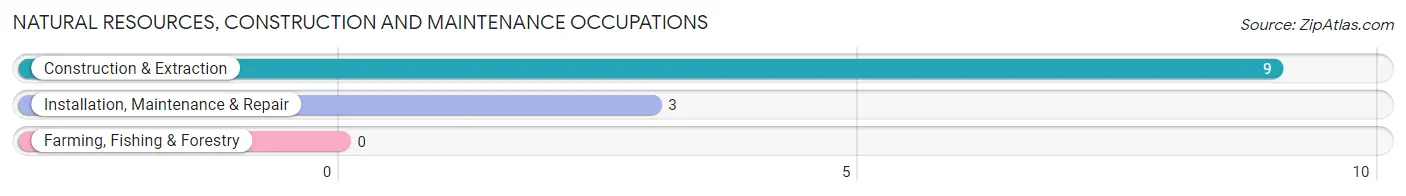
Natural Resources, Construction and Maintenance Occupations
The most common Natural Resources, Construction and Maintenance occupations in Leamington are Construction & Extraction (9 | 7.1%), and Installation, Maintenance & Repair (3 | 2.4%).
Natural Resources, Construction and Maintenance Occupations by Sex
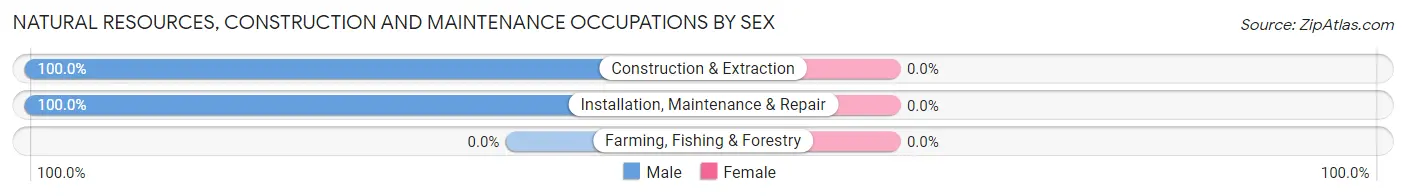
| Occupation | Male | Female |
| Farming, Fishing & Forestry | 0 (0.0%) | 0 (0.0%) |
| Construction & Extraction | 9 (100.0%) | 0 (0.0%) |
| Installation, Maintenance & Repair | 3 (100.0%) | 0 (0.0%) |
| Total (Category) | 12 (100.0%) | 0 (0.0%) |
| Total (Overall) | 59 (46.8%) | 67 (53.2%) |
Production, Transportation and Moving Occupations
The most common Production, Transportation and Moving occupations in Leamington are Transportation (10 | 7.9%), and Material Moving (2 | 1.6%).
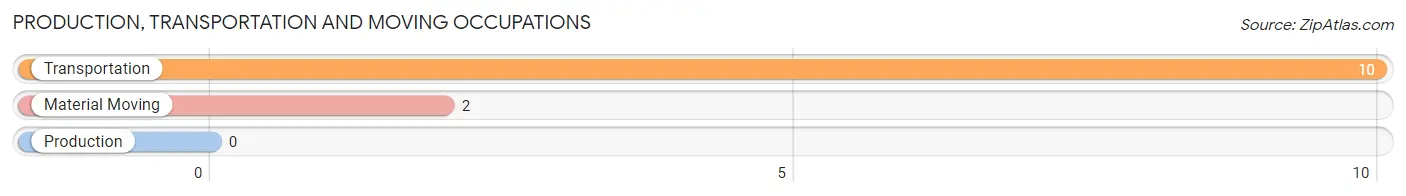
Production, Transportation and Moving Occupations by Sex
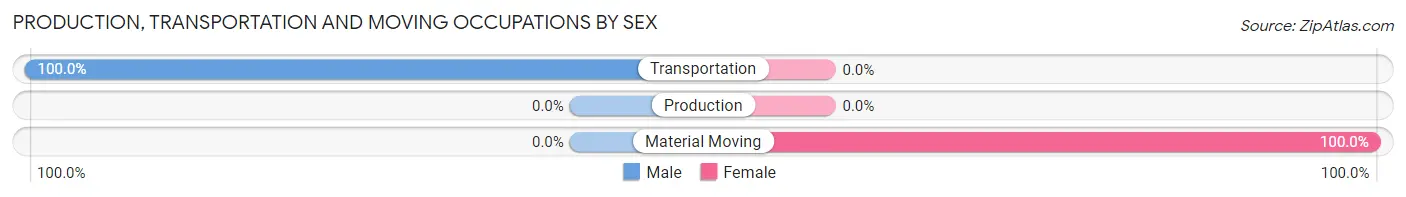
| Occupation | Male | Female |
| Production | 0 (0.0%) | 0 (0.0%) |
| Transportation | 10 (100.0%) | 0 (0.0%) |
| Material Moving | 0 (0.0%) | 2 (100.0%) |
| Total (Category) | 10 (83.3%) | 2 (16.7%) |
| Total (Overall) | 59 (46.8%) | 67 (53.2%) |
Employment Industries by Sex in Leamington
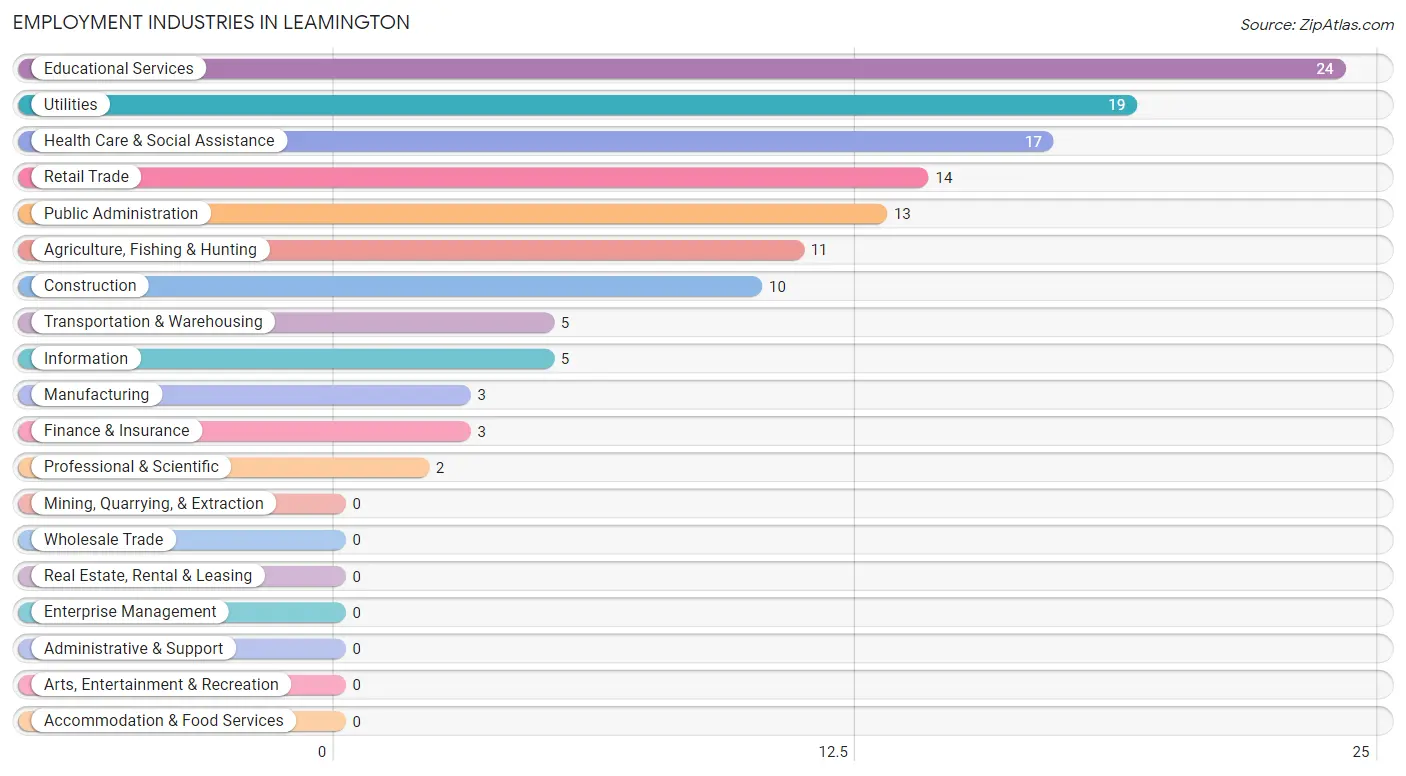
Employment Industries in Leamington
The major employment industries in Leamington include Educational Services (24 | 19.1%), Utilities (19 | 15.1%), Health Care & Social Assistance (17 | 13.5%), Retail Trade (14 | 11.1%), and Public Administration (13 | 10.3%).
Employment Industries by Sex in Leamington
The Leamington industries that see more men than women are Agriculture, Fishing & Hunting (100.0%), Construction (100.0%), and Transportation & Warehousing (100.0%), whereas the industries that tend to have a higher number of women are Finance & Insurance (100.0%), Educational Services (100.0%), and Health Care & Social Assistance (100.0%).
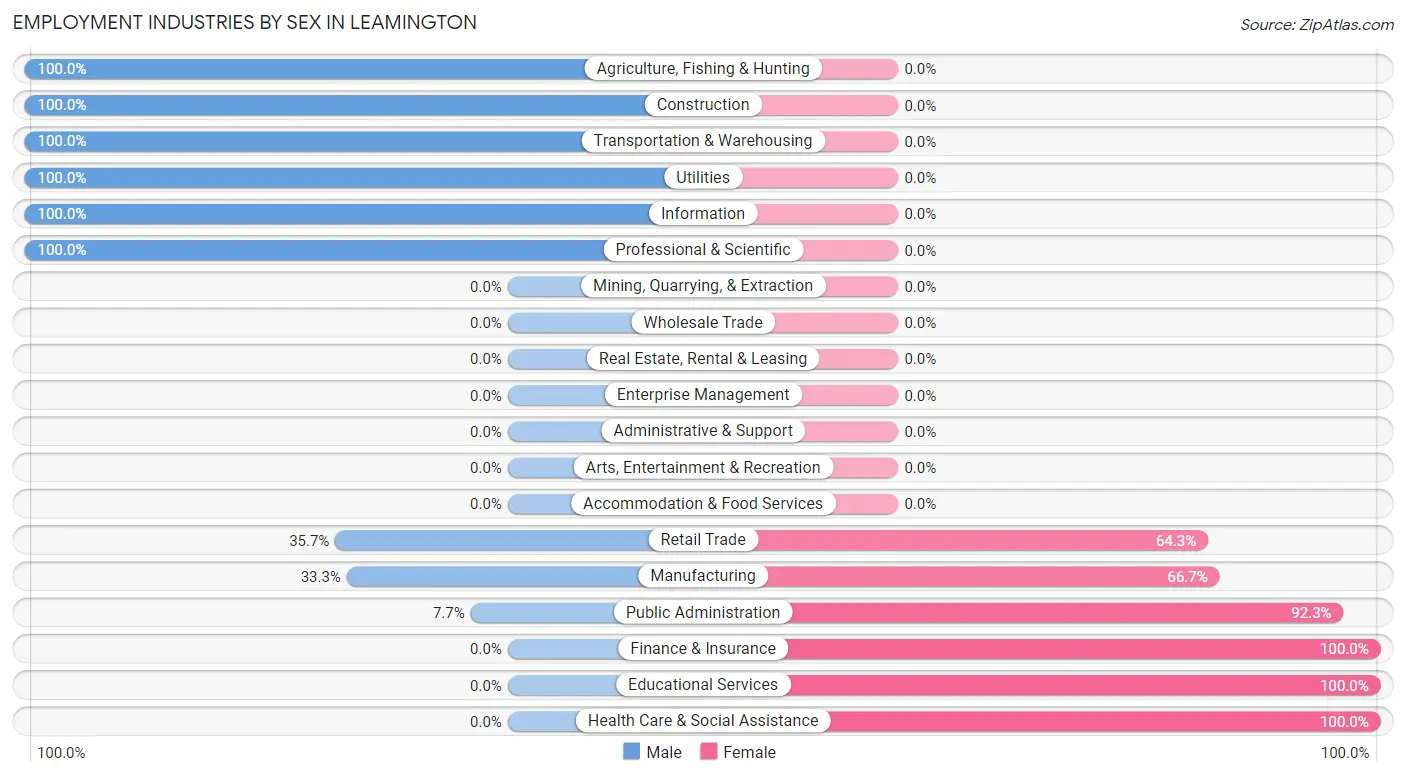
| Industry | Male | Female |
| Agriculture, Fishing & Hunting | 11 (100.0%) | 0 (0.0%) |
| Mining, Quarrying, & Extraction | 0 (0.0%) | 0 (0.0%) |
| Construction | 10 (100.0%) | 0 (0.0%) |
| Manufacturing | 1 (33.3%) | 2 (66.7%) |
| Wholesale Trade | 0 (0.0%) | 0 (0.0%) |
| Retail Trade | 5 (35.7%) | 9 (64.3%) |
| Transportation & Warehousing | 5 (100.0%) | 0 (0.0%) |
| Utilities | 19 (100.0%) | 0 (0.0%) |
| Information | 5 (100.0%) | 0 (0.0%) |
| Finance & Insurance | 0 (0.0%) | 3 (100.0%) |
| Real Estate, Rental & Leasing | 0 (0.0%) | 0 (0.0%) |
| Professional & Scientific | 2 (100.0%) | 0 (0.0%) |
| Enterprise Management | 0 (0.0%) | 0 (0.0%) |
| Administrative & Support | 0 (0.0%) | 0 (0.0%) |
| Educational Services | 0 (0.0%) | 24 (100.0%) |
| Health Care & Social Assistance | 0 (0.0%) | 17 (100.0%) |
| Arts, Entertainment & Recreation | 0 (0.0%) | 0 (0.0%) |
| Accommodation & Food Services | 0 (0.0%) | 0 (0.0%) |
| Public Administration | 1 (7.7%) | 12 (92.3%) |
| Total | 59 (46.8%) | 67 (53.2%) |
Education in Leamington
School Enrollment in Leamington
The most common levels of schooling among the 86 students in Leamington are high school (23 | 26.7%), elementary school (22 | 25.6%), and middle school (14 | 16.3%).
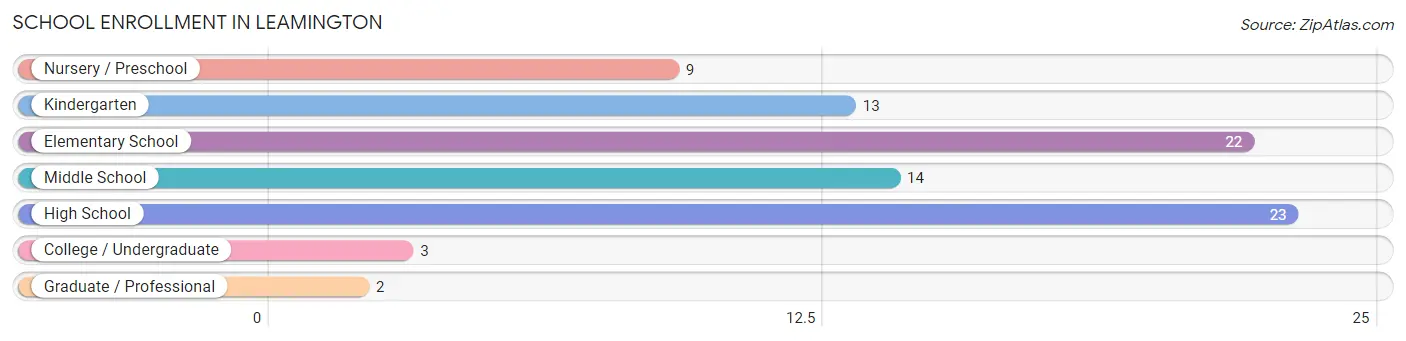
| School Level | # Students | % Students |
| Nursery / Preschool | 9 | 10.5% |
| Kindergarten | 13 | 15.1% |
| Elementary School | 22 | 25.6% |
| Middle School | 14 | 16.3% |
| High School | 23 | 26.7% |
| College / Undergraduate | 3 | 3.5% |
| Graduate / Professional | 2 | 2.3% |
| Total | 86 | 100.0% |
School Enrollment by Age by Funding Source in Leamington
Out of a total of 86 students who are enrolled in schools in Leamington, 12 (14.0%) attend a private institution, while the remaining 74 (86.0%) are enrolled in public schools. The age group of 20 to 24 year olds has the highest likelihood of being enrolled in private schools, with 3 (100.0% in the age bracket) enrolled. Conversely, the age group of 10 to 14 year olds has the lowest likelihood of being enrolled in a private school, with 25 (100.0% in the age bracket) attending a public institution.
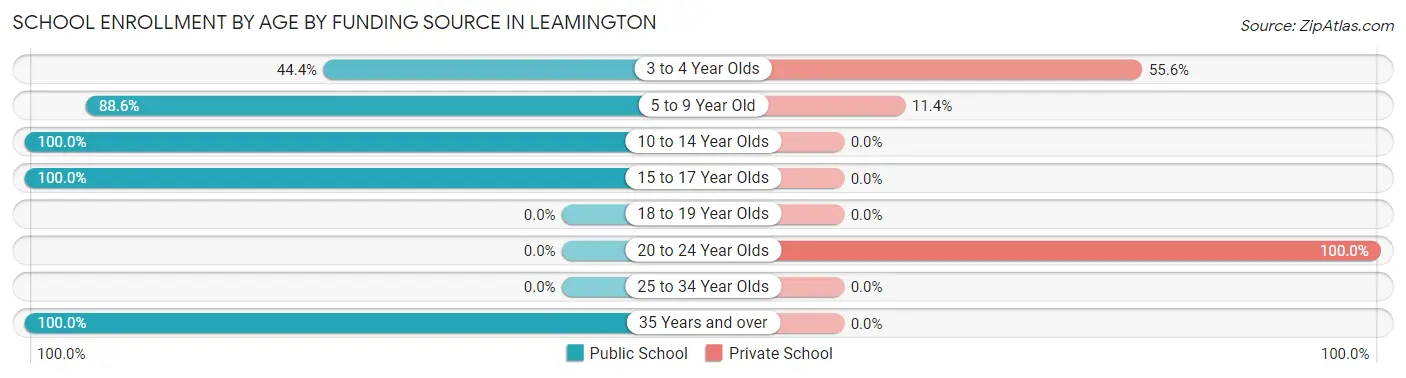
| Age Bracket | Public School | Private School |
| 3 to 4 Year Olds | 4 (44.4%) | 5 (55.6%) |
| 5 to 9 Year Old | 31 (88.6%) | 4 (11.4%) |
| 10 to 14 Year Olds | 25 (100.0%) | 0 (0.0%) |
| 15 to 17 Year Olds | 12 (100.0%) | 0 (0.0%) |
| 18 to 19 Year Olds | 0 (0.0%) | 0 (0.0%) |
| 20 to 24 Year Olds | 0 (0.0%) | 3 (100.0%) |
| 25 to 34 Year Olds | 0 (0.0%) | 0 (0.0%) |
| 35 Years and over | 2 (100.0%) | 0 (0.0%) |
| Total | 74 (86.0%) | 12 (14.0%) |
Educational Attainment by Field of Study in Leamington
Education (21 | 32.8%), business (15 | 23.4%), visual & performing arts (6 | 9.4%), science & technology (5 | 7.8%), and communications (5 | 7.8%) are the most common fields of study among 64 individuals in Leamington who have obtained a bachelor's degree or higher.
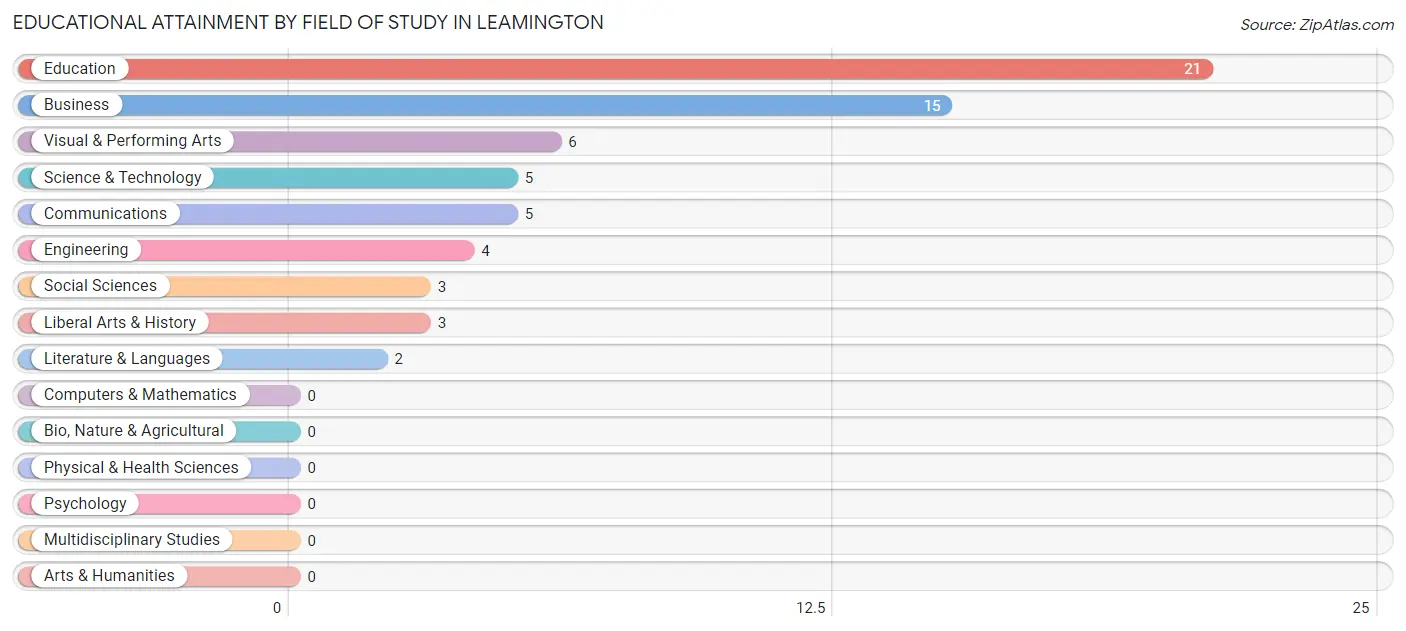
| Field of Study | # Graduates | % Graduates |
| Computers & Mathematics | 0 | 0.0% |
| Bio, Nature & Agricultural | 0 | 0.0% |
| Physical & Health Sciences | 0 | 0.0% |
| Psychology | 0 | 0.0% |
| Social Sciences | 3 | 4.7% |
| Engineering | 4 | 6.2% |
| Multidisciplinary Studies | 0 | 0.0% |
| Science & Technology | 5 | 7.8% |
| Business | 15 | 23.4% |
| Education | 21 | 32.8% |
| Literature & Languages | 2 | 3.1% |
| Liberal Arts & History | 3 | 4.7% |
| Visual & Performing Arts | 6 | 9.4% |
| Communications | 5 | 7.8% |
| Arts & Humanities | 0 | 0.0% |
| Total | 64 | 100.0% |
Transportation & Commute in Leamington
Vehicle Availability by Sex in Leamington
The most prevalent vehicle ownership categories in Leamington are males with 3 vehicles (32, accounting for 54.2%) and females with 3 vehicles (28, making up 47.8%).
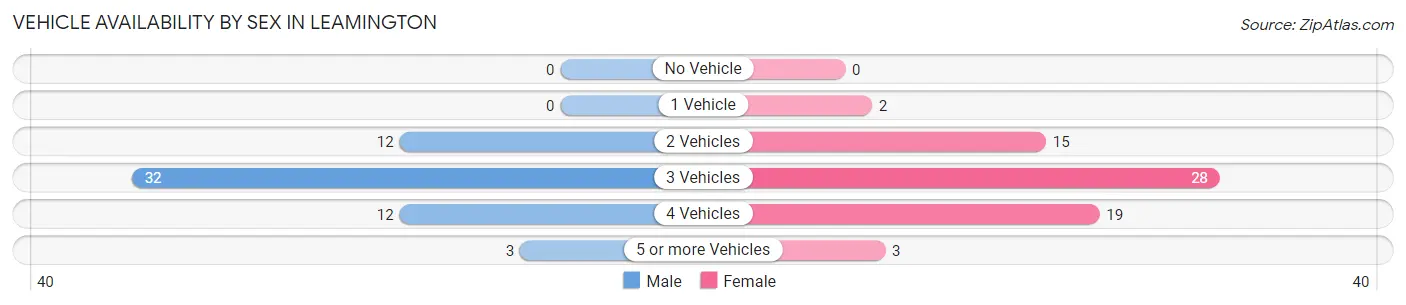
| Vehicles Available | Male | Female |
| No Vehicle | 0 (0.0%) | 0 (0.0%) |
| 1 Vehicle | 0 (0.0%) | 2 (3.0%) |
| 2 Vehicles | 12 (20.3%) | 15 (22.4%) |
| 3 Vehicles | 32 (54.2%) | 28 (41.8%) |
| 4 Vehicles | 12 (20.3%) | 19 (28.4%) |
| 5 or more Vehicles | 3 (5.1%) | 3 (4.5%) |
| Total | 59 (100.0%) | 67 (100.0%) |
Commute Time in Leamington
The most frequently occuring commute durations in Leamington are 20 to 24 minutes (34 commuters, 28.6%), 30 to 34 minutes (24 commuters, 20.2%), and 5 to 9 minutes (22 commuters, 18.5%).
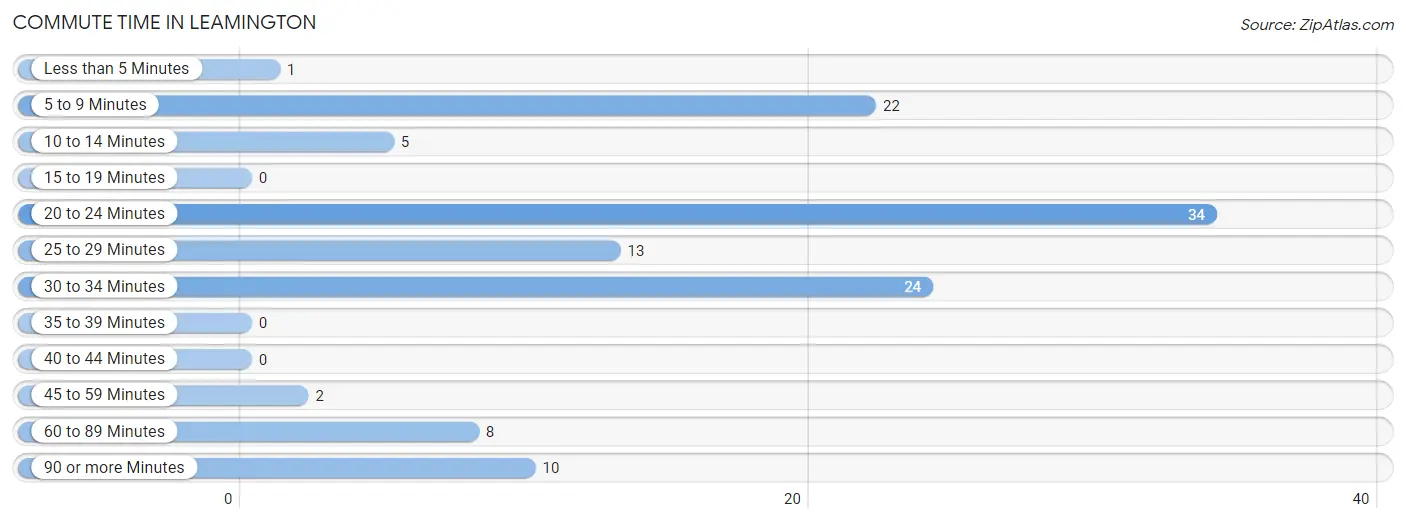
| Commute Time | # Commuters | % Commuters |
| Less than 5 Minutes | 1 | 0.8% |
| 5 to 9 Minutes | 22 | 18.5% |
| 10 to 14 Minutes | 5 | 4.2% |
| 15 to 19 Minutes | 0 | 0.0% |
| 20 to 24 Minutes | 34 | 28.6% |
| 25 to 29 Minutes | 13 | 10.9% |
| 30 to 34 Minutes | 24 | 20.2% |
| 35 to 39 Minutes | 0 | 0.0% |
| 40 to 44 Minutes | 0 | 0.0% |
| 45 to 59 Minutes | 2 | 1.7% |
| 60 to 89 Minutes | 8 | 6.7% |
| 90 or more Minutes | 10 | 8.4% |
Commute Time by Sex in Leamington
The most common commute times in Leamington are 30 to 34 minutes (14 commuters, 25.9%) for males and 20 to 24 minutes (24 commuters, 36.9%) for females.
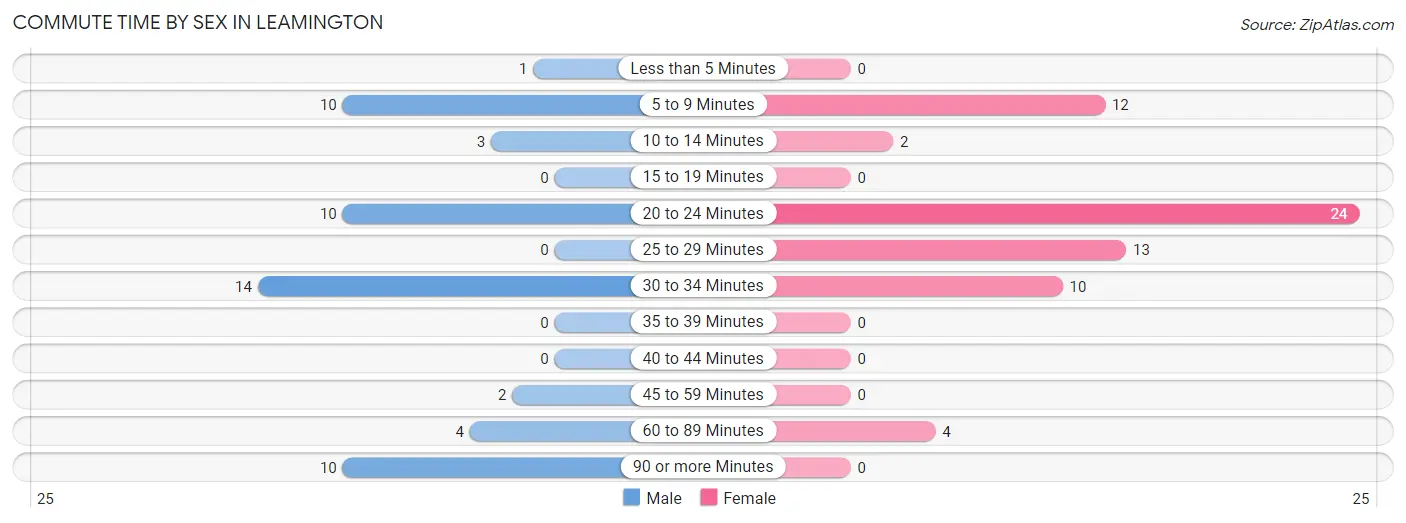
| Commute Time | Male | Female |
| Less than 5 Minutes | 1 (1.8%) | 0 (0.0%) |
| 5 to 9 Minutes | 10 (18.5%) | 12 (18.5%) |
| 10 to 14 Minutes | 3 (5.6%) | 2 (3.1%) |
| 15 to 19 Minutes | 0 (0.0%) | 0 (0.0%) |
| 20 to 24 Minutes | 10 (18.5%) | 24 (36.9%) |
| 25 to 29 Minutes | 0 (0.0%) | 13 (20.0%) |
| 30 to 34 Minutes | 14 (25.9%) | 10 (15.4%) |
| 35 to 39 Minutes | 0 (0.0%) | 0 (0.0%) |
| 40 to 44 Minutes | 0 (0.0%) | 0 (0.0%) |
| 45 to 59 Minutes | 2 (3.7%) | 0 (0.0%) |
| 60 to 89 Minutes | 4 (7.4%) | 4 (6.1%) |
| 90 or more Minutes | 10 (18.5%) | 0 (0.0%) |
Time of Departure to Work by Sex in Leamington
The most frequent times of departure to work in Leamington are 6:00 AM to 6:29 AM (14, 25.9%) for males and 4:00 PM to 11:59 PM (27, 41.5%) for females.
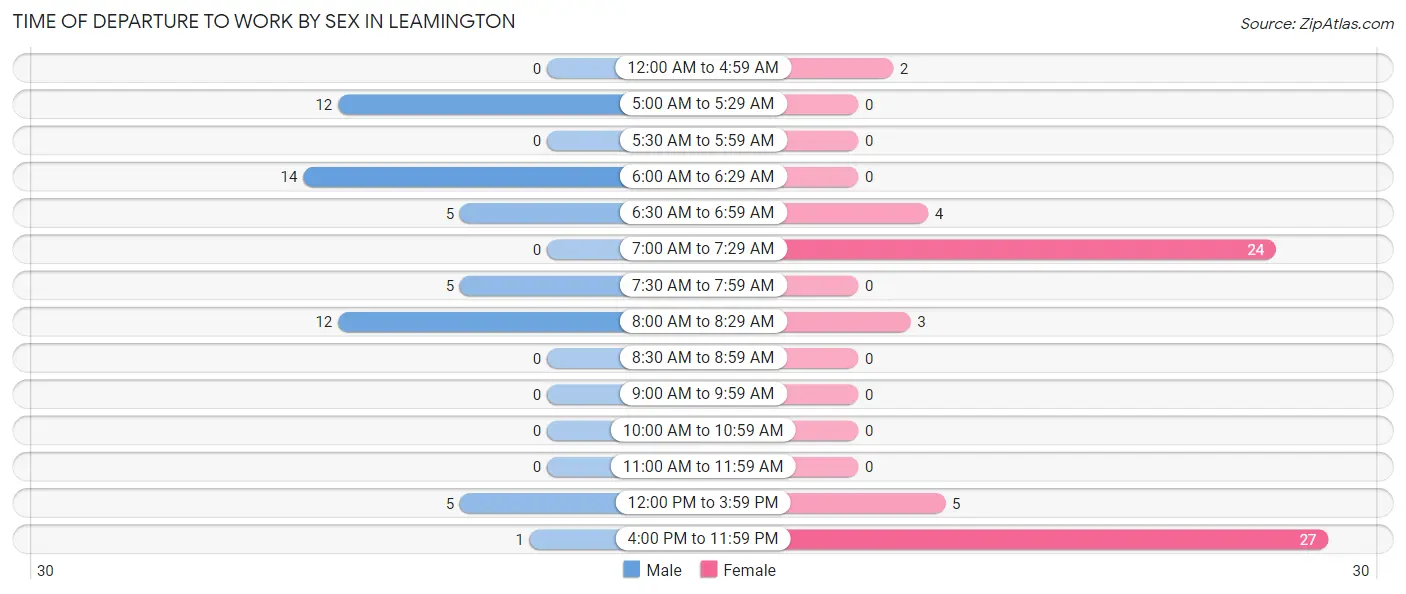
| Time of Departure | Male | Female |
| 12:00 AM to 4:59 AM | 0 (0.0%) | 2 (3.1%) |
| 5:00 AM to 5:29 AM | 12 (22.2%) | 0 (0.0%) |
| 5:30 AM to 5:59 AM | 0 (0.0%) | 0 (0.0%) |
| 6:00 AM to 6:29 AM | 14 (25.9%) | 0 (0.0%) |
| 6:30 AM to 6:59 AM | 5 (9.3%) | 4 (6.1%) |
| 7:00 AM to 7:29 AM | 0 (0.0%) | 24 (36.9%) |
| 7:30 AM to 7:59 AM | 5 (9.3%) | 0 (0.0%) |
| 8:00 AM to 8:29 AM | 12 (22.2%) | 3 (4.6%) |
| 8:30 AM to 8:59 AM | 0 (0.0%) | 0 (0.0%) |
| 9:00 AM to 9:59 AM | 0 (0.0%) | 0 (0.0%) |
| 10:00 AM to 10:59 AM | 0 (0.0%) | 0 (0.0%) |
| 11:00 AM to 11:59 AM | 0 (0.0%) | 0 (0.0%) |
| 12:00 PM to 3:59 PM | 5 (9.3%) | 5 (7.7%) |
| 4:00 PM to 11:59 PM | 1 (1.8%) | 27 (41.5%) |
| Total | 54 (100.0%) | 65 (100.0%) |
Housing Occupancy in Leamington
Occupancy by Ownership in Leamington
Of the total 90 dwellings in Leamington, owner-occupied units account for 88 (97.8%), while renter-occupied units make up 2 (2.2%).
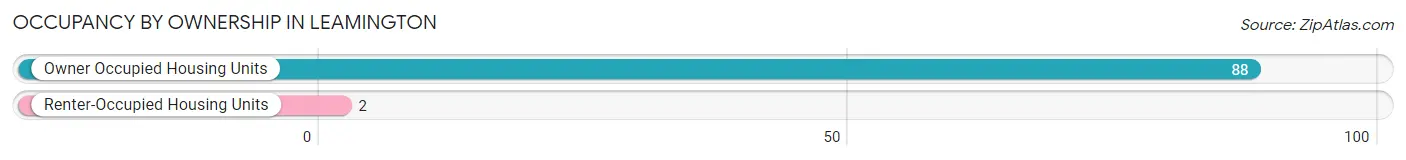
| Occupancy | # Housing Units | % Housing Units |
| Owner Occupied Housing Units | 88 | 97.8% |
| Renter-Occupied Housing Units | 2 | 2.2% |
| Total Occupied Housing Units | 90 | 100.0% |
Occupancy by Household Size in Leamington
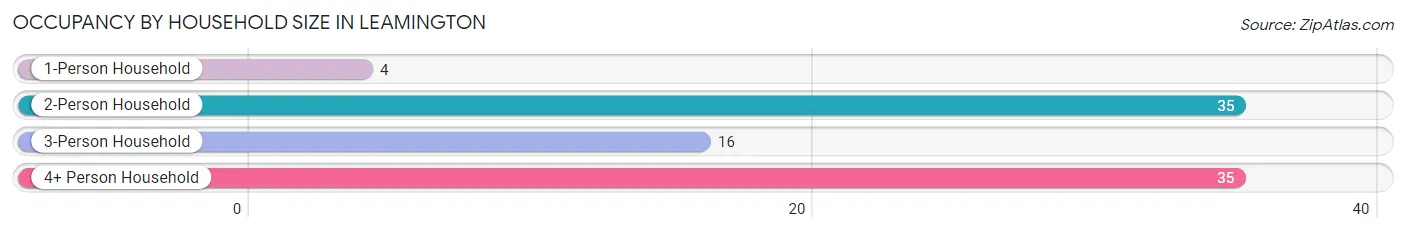
| Household Size | # Housing Units | % Housing Units |
| 1-Person Household | 4 | 4.4% |
| 2-Person Household | 35 | 38.9% |
| 3-Person Household | 16 | 17.8% |
| 4+ Person Household | 35 | 38.9% |
| Total Housing Units | 90 | 100.0% |
Occupancy by Ownership by Household Size in Leamington
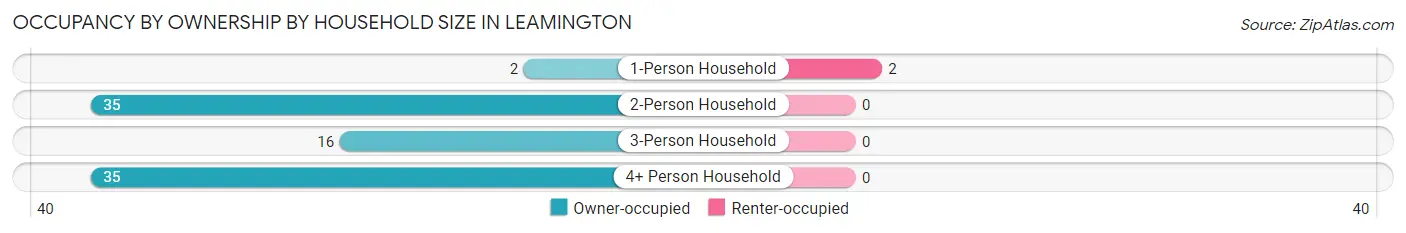
| Household Size | Owner-occupied | Renter-occupied |
| 1-Person Household | 2 (50.0%) | 2 (50.0%) |
| 2-Person Household | 35 (100.0%) | 0 (0.0%) |
| 3-Person Household | 16 (100.0%) | 0 (0.0%) |
| 4+ Person Household | 35 (100.0%) | 0 (0.0%) |
| Total Housing Units | 88 (97.8%) | 2 (2.2%) |
Occupancy by Educational Attainment in Leamington
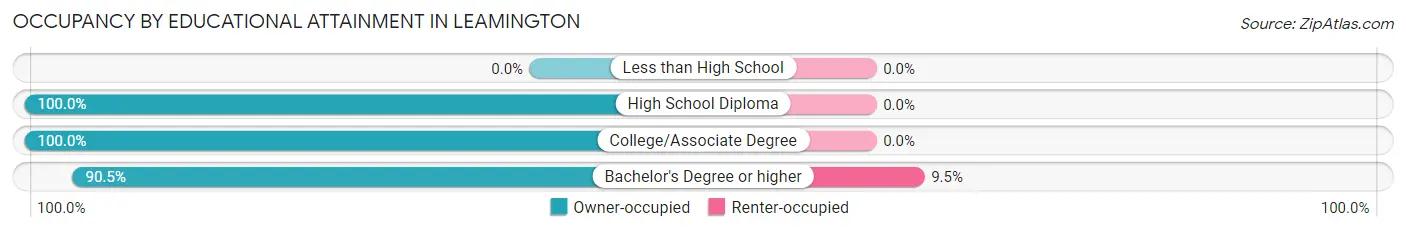
| Household Size | Owner-occupied | Renter-occupied |
| Less than High School | 0 (0.0%) | 0 (0.0%) |
| High School Diploma | 28 (100.0%) | 0 (0.0%) |
| College/Associate Degree | 41 (100.0%) | 0 (0.0%) |
| Bachelor's Degree or higher | 19 (90.5%) | 2 (9.5%) |
Occupancy by Age of Householder in Leamington
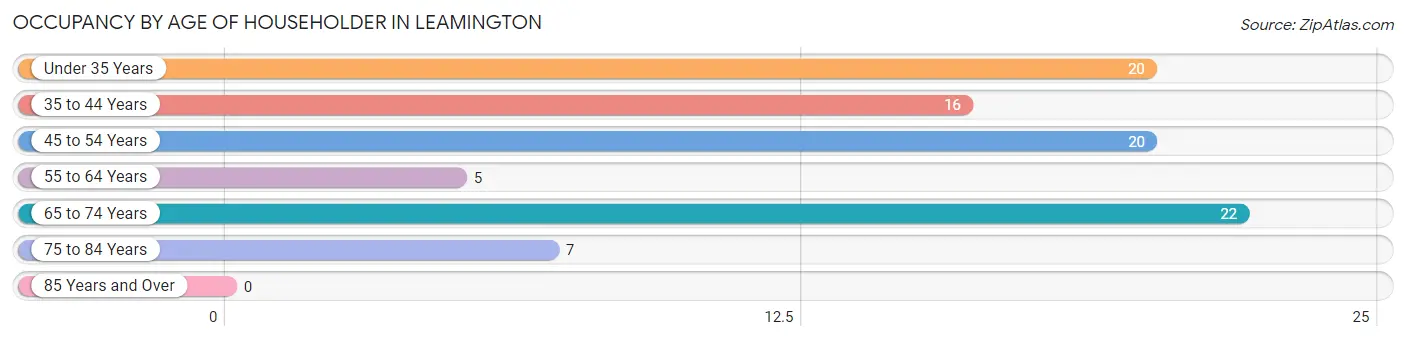
| Age Bracket | # Households | % Households |
| Under 35 Years | 20 | 22.2% |
| 35 to 44 Years | 16 | 17.8% |
| 45 to 54 Years | 20 | 22.2% |
| 55 to 64 Years | 5 | 5.6% |
| 65 to 74 Years | 22 | 24.4% |
| 75 to 84 Years | 7 | 7.8% |
| 85 Years and Over | 0 | 0.0% |
| Total | 90 | 100.0% |
Housing Finances in Leamington
Median Income by Occupancy in Leamington
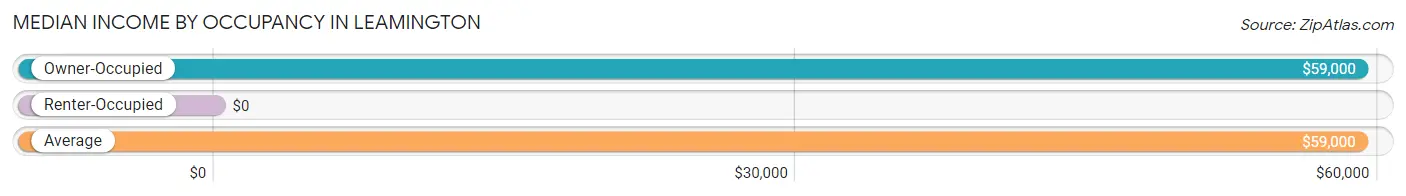
| Occupancy Type | # Households | Median Income |
| Owner-Occupied | 88 (97.8%) | $59,000 |
| Renter-Occupied | 2 (2.2%) | $0 |
| Average | 90 (100.0%) | $59,000 |
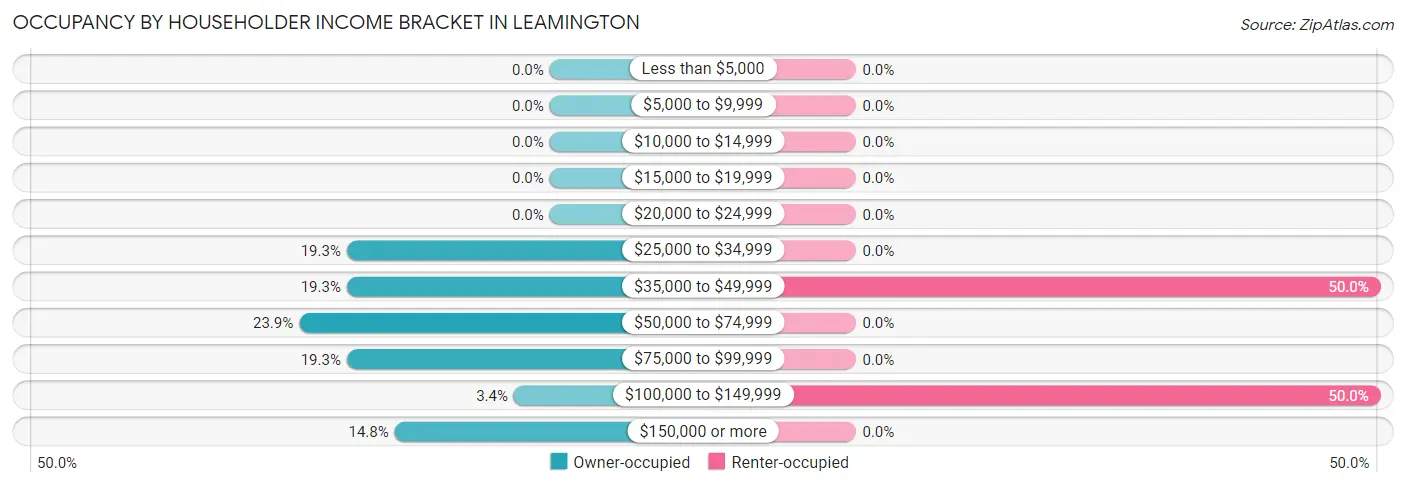
Occupancy by Householder Income Bracket in Leamington
| Income Bracket | Owner-occupied | Renter-occupied |
| Less than $5,000 | 0 (0.0%) | 0 (0.0%) |
| $5,000 to $9,999 | 0 (0.0%) | 0 (0.0%) |
| $10,000 to $14,999 | 0 (0.0%) | 0 (0.0%) |
| $15,000 to $19,999 | 0 (0.0%) | 0 (0.0%) |
| $20,000 to $24,999 | 0 (0.0%) | 0 (0.0%) |
| $25,000 to $34,999 | 17 (19.3%) | 0 (0.0%) |
| $35,000 to $49,999 | 17 (19.3%) | 1 (50.0%) |
| $50,000 to $74,999 | 21 (23.9%) | 0 (0.0%) |
| $75,000 to $99,999 | 17 (19.3%) | 0 (0.0%) |
| $100,000 to $149,999 | 3 (3.4%) | 1 (50.0%) |
| $150,000 or more | 13 (14.8%) | 0 (0.0%) |
| Total | 88 (100.0%) | 2 (100.0%) |
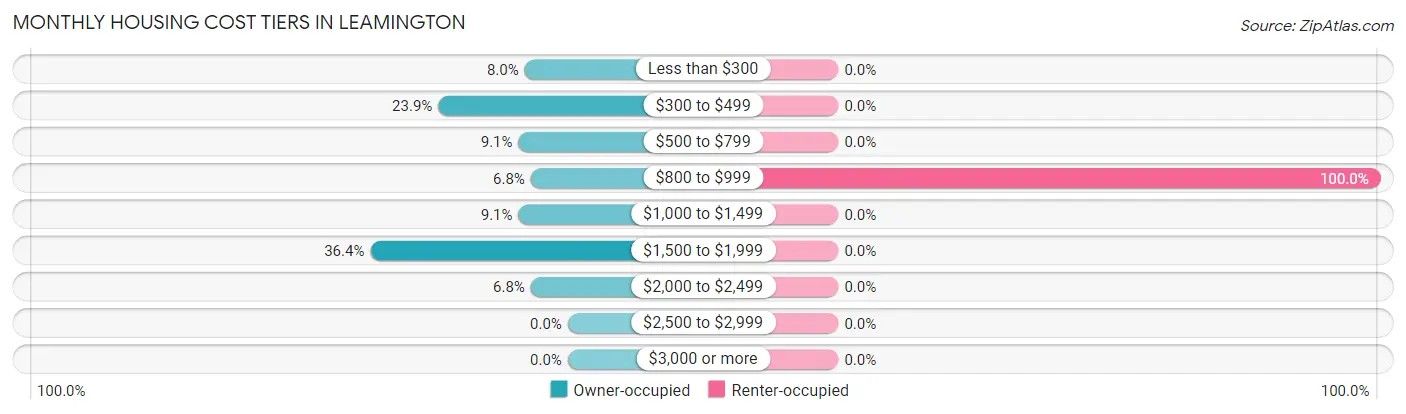
Monthly Housing Cost Tiers in Leamington
| Monthly Cost | Owner-occupied | Renter-occupied |
| Less than $300 | 7 (8.0%) | 0 (0.0%) |
| $300 to $499 | 21 (23.9%) | 0 (0.0%) |
| $500 to $799 | 8 (9.1%) | 0 (0.0%) |
| $800 to $999 | 6 (6.8%) | 2 (100.0%) |
| $1,000 to $1,499 | 8 (9.1%) | 0 (0.0%) |
| $1,500 to $1,999 | 32 (36.4%) | 0 (0.0%) |
| $2,000 to $2,499 | 6 (6.8%) | 0 (0.0%) |
| $2,500 to $2,999 | 0 (0.0%) | 0 (0.0%) |
| $3,000 or more | 0 (0.0%) | 0 (0.0%) |
| Total | 88 (100.0%) | 2 (100.0%) |
Physical Housing Characteristics in Leamington
Housing Structures in Leamington
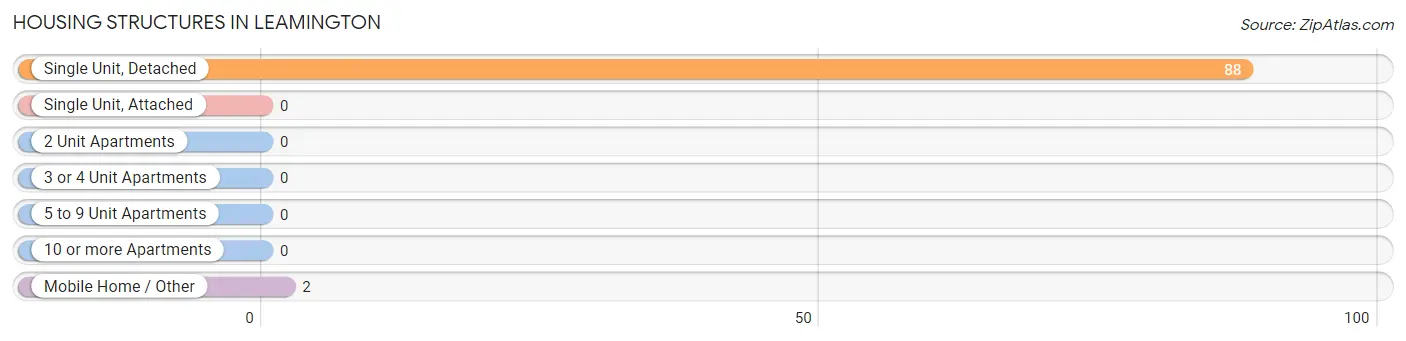
| Structure Type | # Housing Units | % Housing Units |
| Single Unit, Detached | 88 | 97.8% |
| Single Unit, Attached | 0 | 0.0% |
| 2 Unit Apartments | 0 | 0.0% |
| 3 or 4 Unit Apartments | 0 | 0.0% |
| 5 to 9 Unit Apartments | 0 | 0.0% |
| 10 or more Apartments | 0 | 0.0% |
| Mobile Home / Other | 2 | 2.2% |
| Total | 90 | 100.0% |
Housing Structures by Occupancy in Leamington
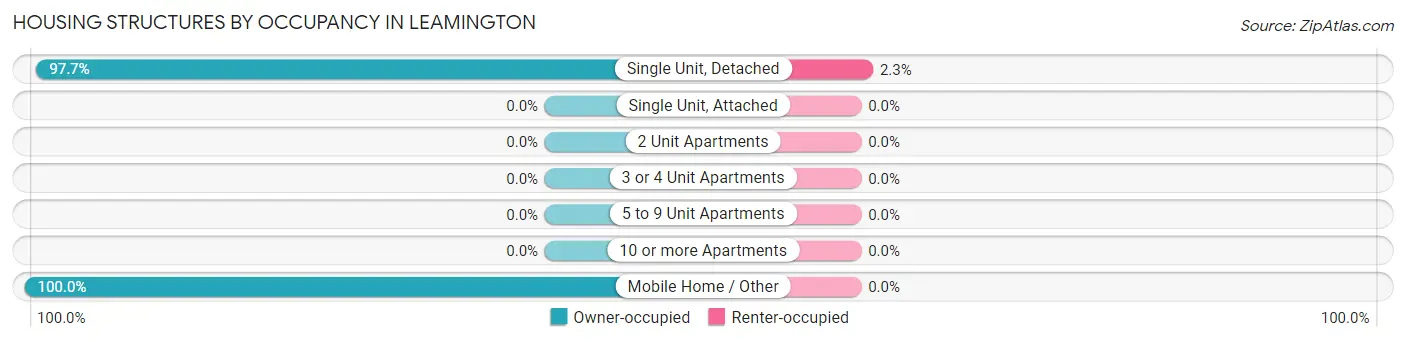
| Structure Type | Owner-occupied | Renter-occupied |
| Single Unit, Detached | 86 (97.7%) | 2 (2.3%) |
| Single Unit, Attached | 0 (0.0%) | 0 (0.0%) |
| 2 Unit Apartments | 0 (0.0%) | 0 (0.0%) |
| 3 or 4 Unit Apartments | 0 (0.0%) | 0 (0.0%) |
| 5 to 9 Unit Apartments | 0 (0.0%) | 0 (0.0%) |
| 10 or more Apartments | 0 (0.0%) | 0 (0.0%) |
| Mobile Home / Other | 2 (100.0%) | 0 (0.0%) |
| Total | 88 (97.8%) | 2 (2.2%) |
Housing Structures by Number of Rooms in Leamington
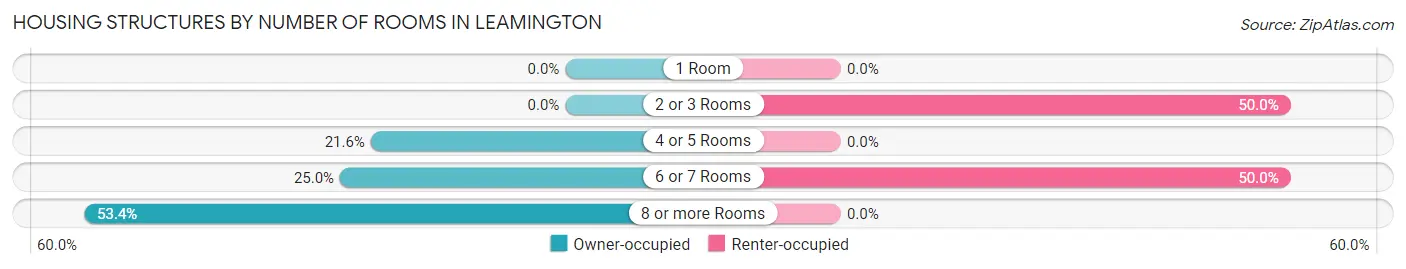
| Number of Rooms | Owner-occupied | Renter-occupied |
| 1 Room | 0 (0.0%) | 0 (0.0%) |
| 2 or 3 Rooms | 0 (0.0%) | 1 (50.0%) |
| 4 or 5 Rooms | 19 (21.6%) | 0 (0.0%) |
| 6 or 7 Rooms | 22 (25.0%) | 1 (50.0%) |
| 8 or more Rooms | 47 (53.4%) | 0 (0.0%) |
| Total | 88 (100.0%) | 2 (100.0%) |
Housing Structure by Heating Type in Leamington
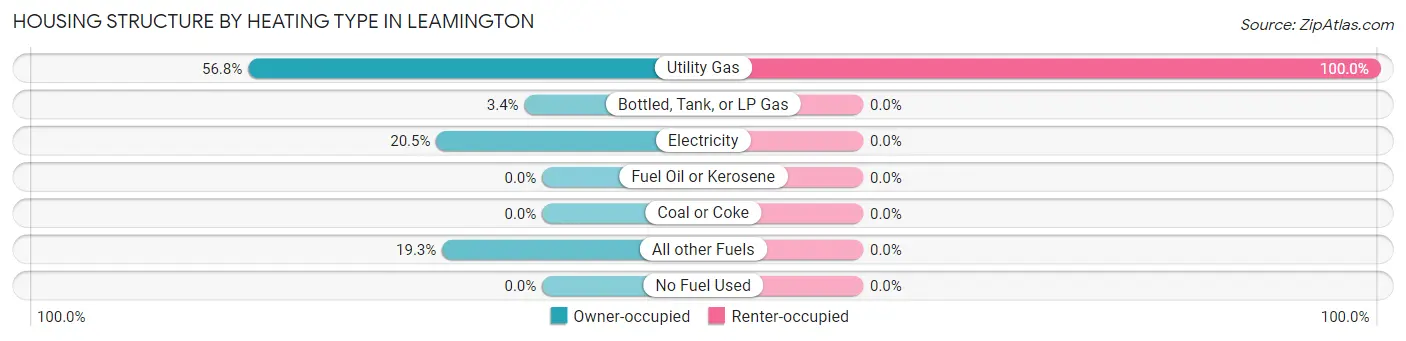
| Heating Type | Owner-occupied | Renter-occupied |
| Utility Gas | 50 (56.8%) | 2 (100.0%) |
| Bottled, Tank, or LP Gas | 3 (3.4%) | 0 (0.0%) |
| Electricity | 18 (20.4%) | 0 (0.0%) |
| Fuel Oil or Kerosene | 0 (0.0%) | 0 (0.0%) |
| Coal or Coke | 0 (0.0%) | 0 (0.0%) |
| All other Fuels | 17 (19.3%) | 0 (0.0%) |
| No Fuel Used | 0 (0.0%) | 0 (0.0%) |
| Total | 88 (100.0%) | 2 (100.0%) |
Household Vehicle Usage in Leamington
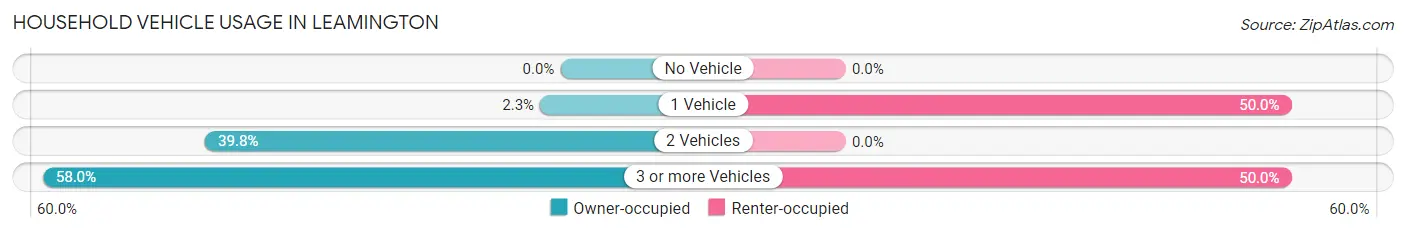
| Vehicles per Household | Owner-occupied | Renter-occupied |
| No Vehicle | 0 (0.0%) | 0 (0.0%) |
| 1 Vehicle | 2 (2.3%) | 1 (50.0%) |
| 2 Vehicles | 35 (39.8%) | 0 (0.0%) |
| 3 or more Vehicles | 51 (58.0%) | 1 (50.0%) |
| Total | 88 (100.0%) | 2 (100.0%) |
Real Estate & Mortgages in Leamington
Real Estate and Mortgage Overview in Leamington
| Characteristic | Without Mortgage | With Mortgage |
| Housing Units | 36 | 52 |
| Median Property Value | $241,700 | $232,100 |
| Median Household Income | $81,250 | $8 |
| Monthly Housing Costs | $367 | $0 |
| Real Estate Taxes | $1,233 | $2 |
Property Value by Mortgage Status in Leamington
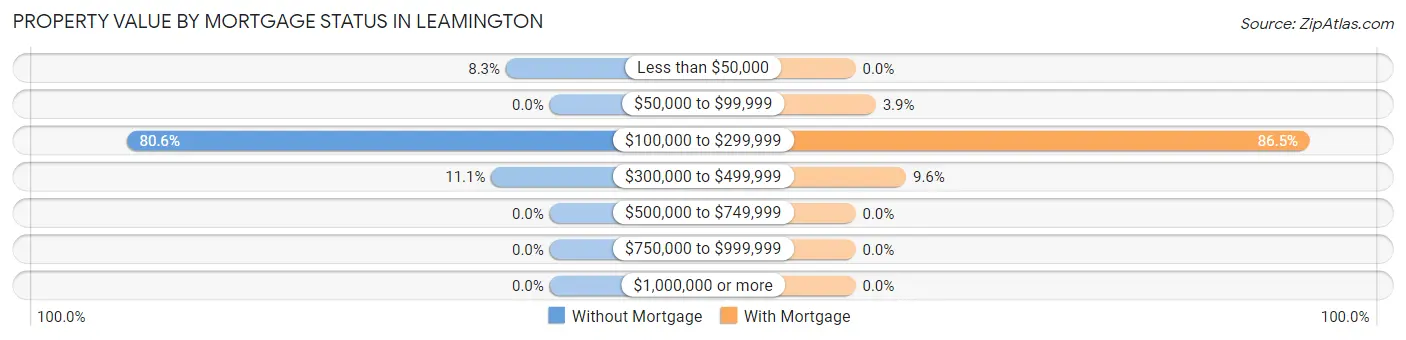
| Property Value | Without Mortgage | With Mortgage |
| Less than $50,000 | 3 (8.3%) | 0 (0.0%) |
| $50,000 to $99,999 | 0 (0.0%) | 2 (3.8%) |
| $100,000 to $299,999 | 29 (80.6%) | 45 (86.5%) |
| $300,000 to $499,999 | 4 (11.1%) | 5 (9.6%) |
| $500,000 to $749,999 | 0 (0.0%) | 0 (0.0%) |
| $750,000 to $999,999 | 0 (0.0%) | 0 (0.0%) |
| $1,000,000 or more | 0 (0.0%) | 0 (0.0%) |
| Total | 36 (100.0%) | 52 (100.0%) |
Household Income by Mortgage Status in Leamington
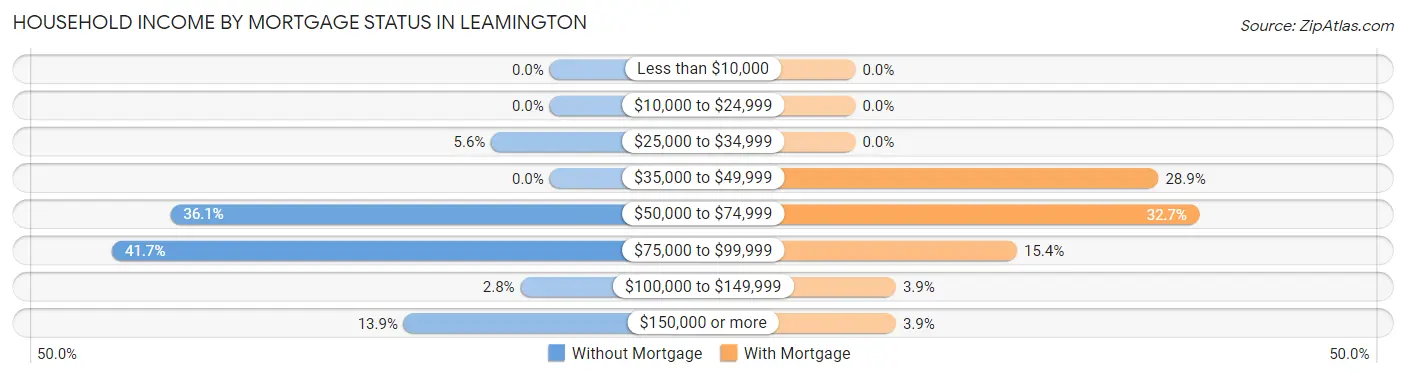
| Household Income | Without Mortgage | With Mortgage |
| Less than $10,000 | 0 (0.0%) | 0 (0.0%) |
| $10,000 to $24,999 | 0 (0.0%) | 0 (0.0%) |
| $25,000 to $34,999 | 2 (5.6%) | 0 (0.0%) |
| $35,000 to $49,999 | 0 (0.0%) | 15 (28.8%) |
| $50,000 to $74,999 | 13 (36.1%) | 17 (32.7%) |
| $75,000 to $99,999 | 15 (41.7%) | 8 (15.4%) |
| $100,000 to $149,999 | 1 (2.8%) | 2 (3.8%) |
| $150,000 or more | 5 (13.9%) | 2 (3.8%) |
| Total | 36 (100.0%) | 52 (100.0%) |
Property Value to Household Income Ratio in Leamington
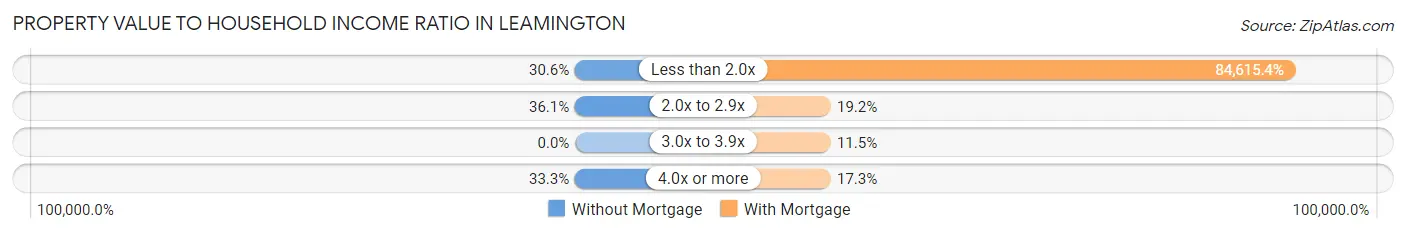
| Value-to-Income Ratio | Without Mortgage | With Mortgage |
| Less than 2.0x | 11 (30.6%) | 44,000 (84,615.4%) |
| 2.0x to 2.9x | 13 (36.1%) | 10 (19.2%) |
| 3.0x to 3.9x | 0 (0.0%) | 6 (11.5%) |
| 4.0x or more | 12 (33.3%) | 9 (17.3%) |
| Total | 36 (100.0%) | 52 (100.0%) |
Real Estate Taxes by Mortgage Status in Leamington
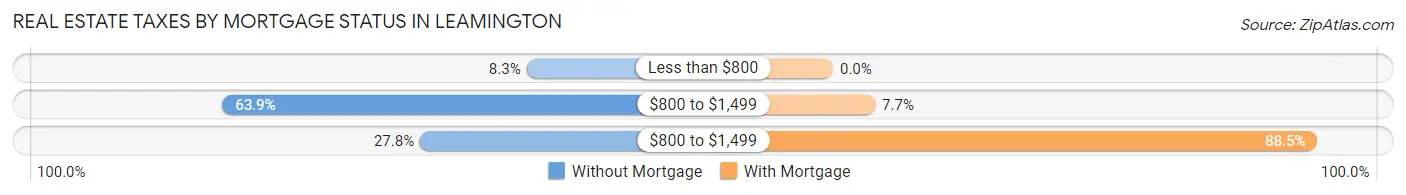
| Property Taxes | Without Mortgage | With Mortgage |
| Less than $800 | 3 (8.3%) | 0 (0.0%) |
| $800 to $1,499 | 23 (63.9%) | 4 (7.7%) |
| $800 to $1,499 | 10 (27.8%) | 46 (88.5%) |
| Total | 36 (100.0%) | 52 (100.0%) |
Health & Disability in Leamington
Health Insurance Coverage by Age in Leamington
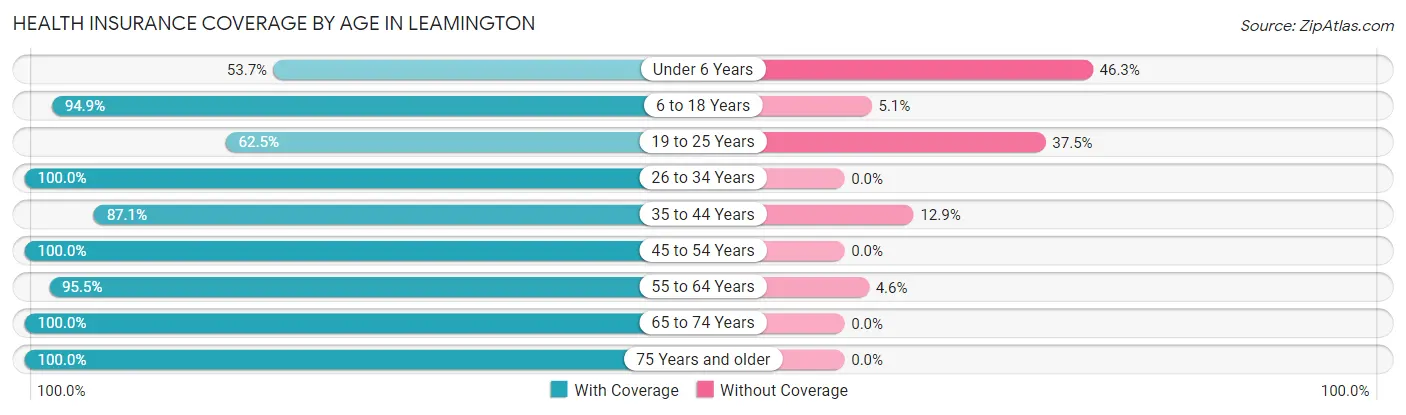
| Age Bracket | With Coverage | Without Coverage |
| Under 6 Years | 29 (53.7%) | 25 (46.3%) |
| 6 to 18 Years | 56 (94.9%) | 3 (5.1%) |
| 19 to 25 Years | 25 (62.5%) | 15 (37.5%) |
| 26 to 34 Years | 5 (100.0%) | 0 (0.0%) |
| 35 to 44 Years | 27 (87.1%) | 4 (12.9%) |
| 45 to 54 Years | 26 (100.0%) | 0 (0.0%) |
| 55 to 64 Years | 21 (95.5%) | 1 (4.5%) |
| 65 to 74 Years | 43 (100.0%) | 0 (0.0%) |
| 75 Years and older | 23 (100.0%) | 0 (0.0%) |
| Total | 255 (84.2%) | 48 (15.8%) |
Health Insurance Coverage by Citizenship Status in Leamington
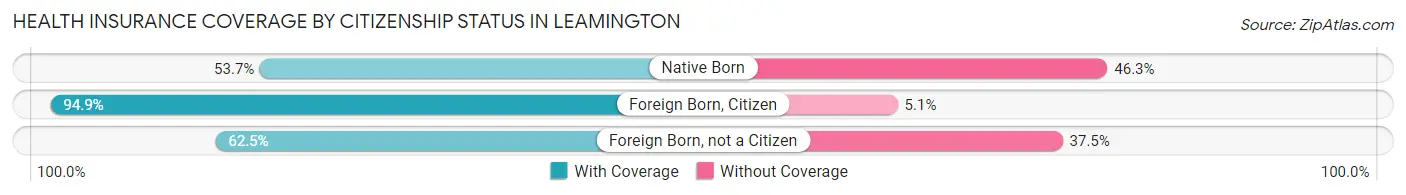
| Citizenship Status | With Coverage | Without Coverage |
| Native Born | 29 (53.7%) | 25 (46.3%) |
| Foreign Born, Citizen | 56 (94.9%) | 3 (5.1%) |
| Foreign Born, not a Citizen | 25 (62.5%) | 15 (37.5%) |
Health Insurance Coverage by Household Income in Leamington
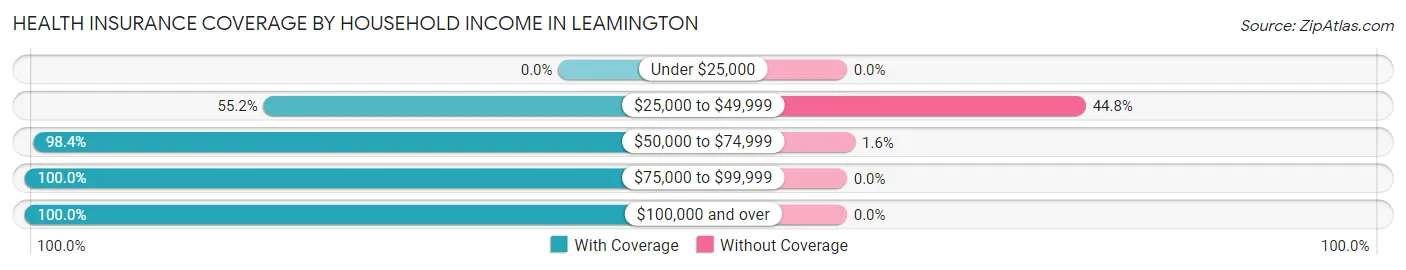
| Household Income | With Coverage | Without Coverage |
| Under $25,000 | 0 (0.0%) | 0 (0.0%) |
| $25,000 to $49,999 | 58 (55.2%) | 47 (44.8%) |
| $50,000 to $74,999 | 63 (98.4%) | 1 (1.6%) |
| $75,000 to $99,999 | 53 (100.0%) | 0 (0.0%) |
| $100,000 and over | 81 (100.0%) | 0 (0.0%) |
Public vs Private Health Insurance Coverage by Age in Leamington
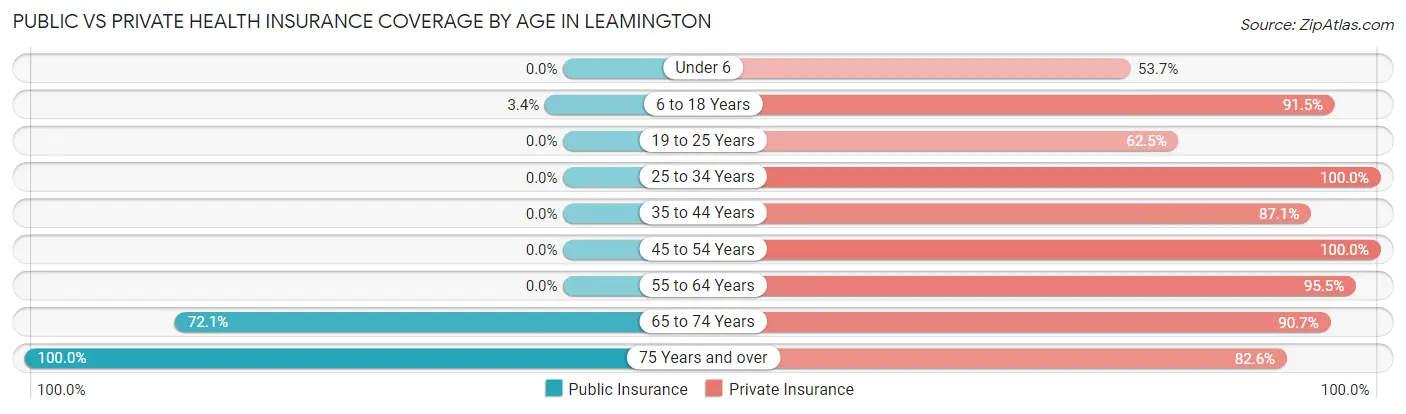
| Age Bracket | Public Insurance | Private Insurance |
| Under 6 | 0 (0.0%) | 29 (53.7%) |
| 6 to 18 Years | 2 (3.4%) | 54 (91.5%) |
| 19 to 25 Years | 0 (0.0%) | 25 (62.5%) |
| 25 to 34 Years | 0 (0.0%) | 5 (100.0%) |
| 35 to 44 Years | 0 (0.0%) | 27 (87.1%) |
| 45 to 54 Years | 0 (0.0%) | 26 (100.0%) |
| 55 to 64 Years | 0 (0.0%) | 21 (95.5%) |
| 65 to 74 Years | 31 (72.1%) | 39 (90.7%) |
| 75 Years and over | 23 (100.0%) | 19 (82.6%) |
| Total | 56 (18.5%) | 245 (80.9%) |
Disability Status by Sex by Age in Leamington
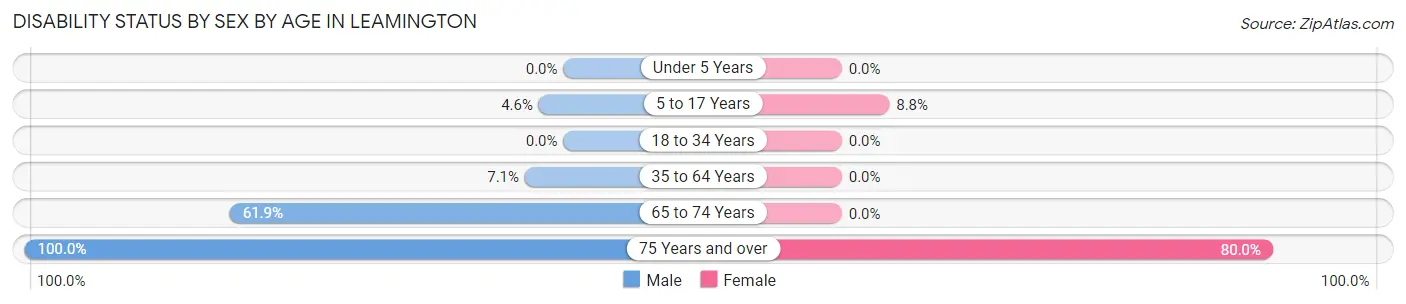
| Age Bracket | Male | Female |
| Under 5 Years | 0 (0.0%) | 0 (0.0%) |
| 5 to 17 Years | 2 (4.5%) | 3 (8.8%) |
| 18 to 34 Years | 0 (0.0%) | 0 (0.0%) |
| 35 to 64 Years | 3 (7.1%) | 0 (0.0%) |
| 65 to 74 Years | 13 (61.9%) | 0 (0.0%) |
| 75 Years and over | 13 (100.0%) | 8 (80.0%) |
Disability Class by Sex by Age in Leamington
Disability Class: Hearing Difficulty
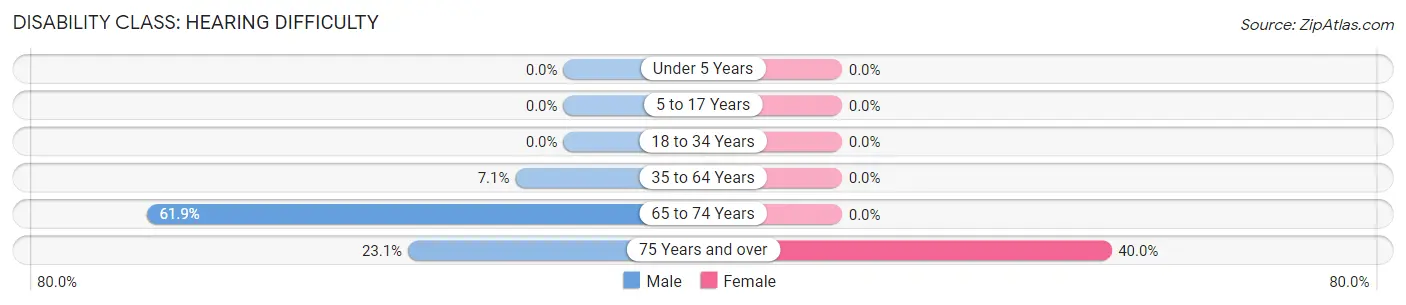
| Age Bracket | Male | Female |
| Under 5 Years | 0 (0.0%) | 0 (0.0%) |
| 5 to 17 Years | 0 (0.0%) | 0 (0.0%) |
| 18 to 34 Years | 0 (0.0%) | 0 (0.0%) |
| 35 to 64 Years | 3 (7.1%) | 0 (0.0%) |
| 65 to 74 Years | 13 (61.9%) | 0 (0.0%) |
| 75 Years and over | 3 (23.1%) | 4 (40.0%) |
Disability Class: Vision Difficulty
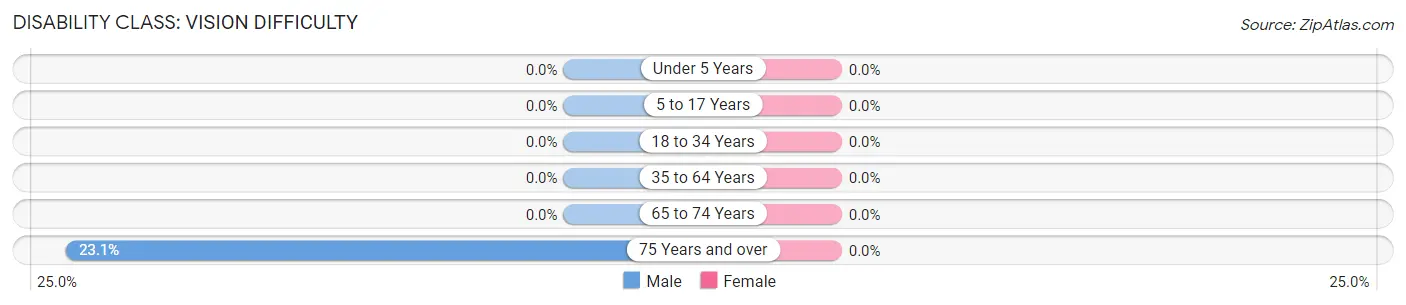
| Age Bracket | Male | Female |
| Under 5 Years | 0 (0.0%) | 0 (0.0%) |
| 5 to 17 Years | 0 (0.0%) | 0 (0.0%) |
| 18 to 34 Years | 0 (0.0%) | 0 (0.0%) |
| 35 to 64 Years | 0 (0.0%) | 0 (0.0%) |
| 65 to 74 Years | 0 (0.0%) | 0 (0.0%) |
| 75 Years and over | 3 (23.1%) | 0 (0.0%) |
Disability Class: Cognitive Difficulty
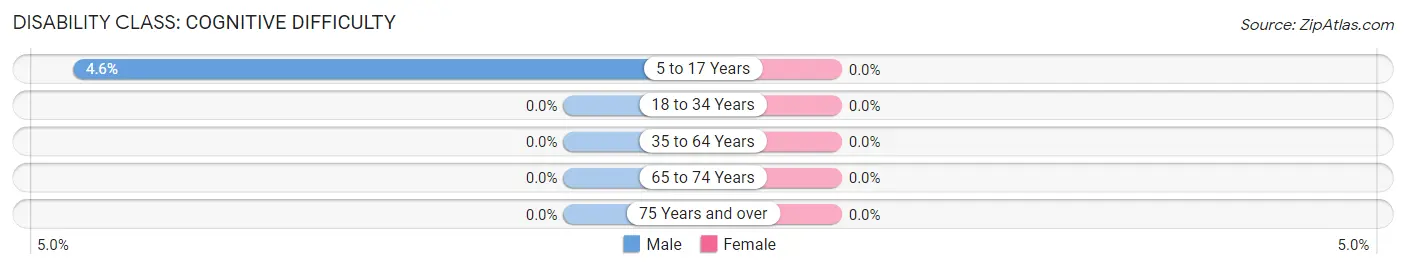
| Age Bracket | Male | Female |
| 5 to 17 Years | 2 (4.5%) | 0 (0.0%) |
| 18 to 34 Years | 0 (0.0%) | 0 (0.0%) |
| 35 to 64 Years | 0 (0.0%) | 0 (0.0%) |
| 65 to 74 Years | 0 (0.0%) | 0 (0.0%) |
| 75 Years and over | 0 (0.0%) | 0 (0.0%) |
Disability Class: Ambulatory Difficulty
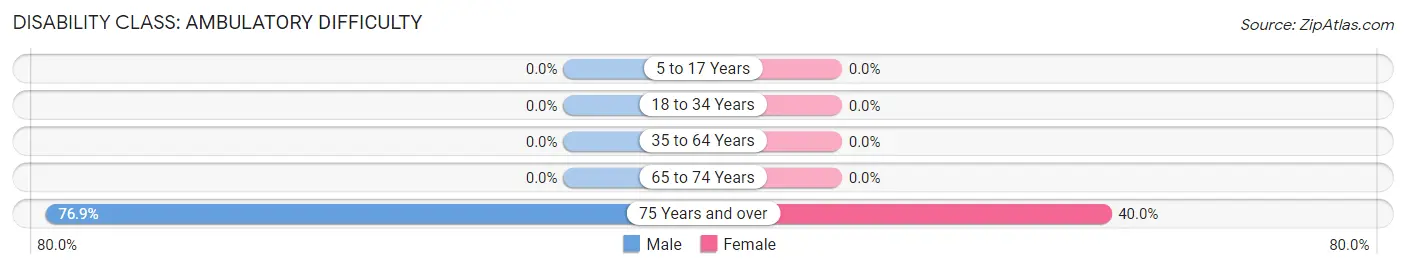
| Age Bracket | Male | Female |
| 5 to 17 Years | 0 (0.0%) | 0 (0.0%) |
| 18 to 34 Years | 0 (0.0%) | 0 (0.0%) |
| 35 to 64 Years | 0 (0.0%) | 0 (0.0%) |
| 65 to 74 Years | 0 (0.0%) | 0 (0.0%) |
| 75 Years and over | 10 (76.9%) | 4 (40.0%) |
Disability Class: Self-Care Difficulty
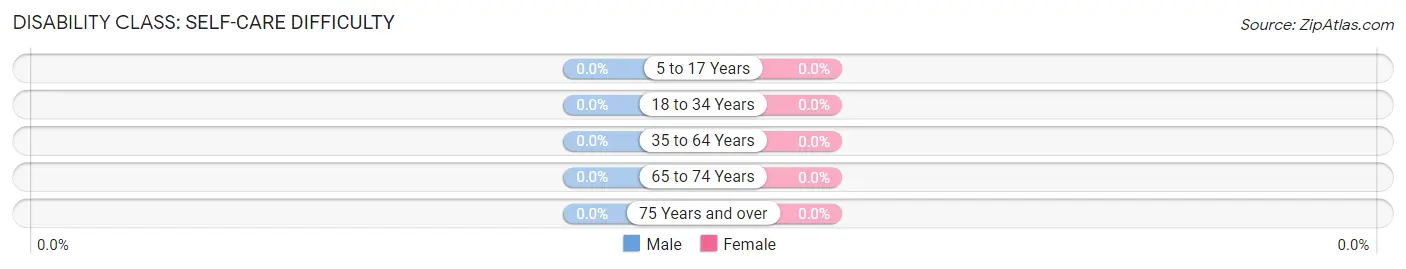
| Age Bracket | Male | Female |
| 5 to 17 Years | 0 (0.0%) | 0 (0.0%) |
| 18 to 34 Years | 0 (0.0%) | 0 (0.0%) |
| 35 to 64 Years | 0 (0.0%) | 0 (0.0%) |
| 65 to 74 Years | 0 (0.0%) | 0 (0.0%) |
| 75 Years and over | 0 (0.0%) | 0 (0.0%) |
Technology Access in Leamington
Computing Device Access in Leamington
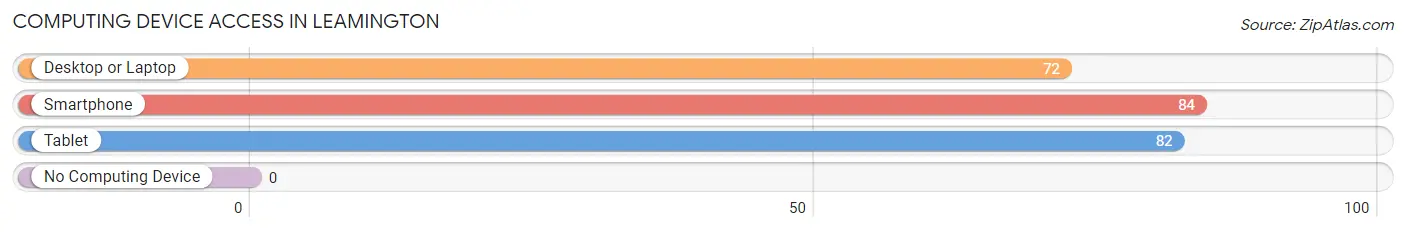
| Device Type | # Households | % Households |
| Desktop or Laptop | 72 | 80.0% |
| Smartphone | 84 | 93.3% |
| Tablet | 82 | 91.1% |
| No Computing Device | 0 | 0.0% |
| Total | 90 | 100.0% |
Internet Access in Leamington
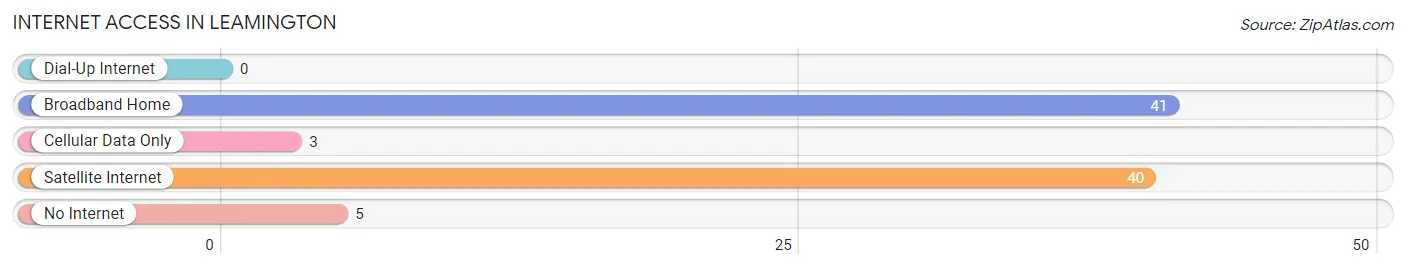
| Internet Type | # Households | % Households |
| Dial-Up Internet | 0 | 0.0% |
| Broadband Home | 41 | 45.6% |
| Cellular Data Only | 3 | 3.3% |
| Satellite Internet | 40 | 44.4% |
| No Internet | 5 | 5.6% |
| Total | 90 | 100.0% |
Leamington Summary
Leamington is a small town located in the state of Utah, in the United States. It is situated in the south-central part of the state, in the Sevier County. The town is located at the junction of State Route 24 and State Route 118, and is about 30 miles south of the city of Richfield. The population of Leamington was estimated to be around 1,000 people in 2020.
History
Leamington was founded in 1891 by a group of settlers from the Church of Jesus Christ of Latter-day Saints. The town was named after a small village in England, and was originally intended to be a farming community. The settlers built a small chapel and a schoolhouse, and the town quickly grew. By the early 1900s, Leamington had become a thriving community, with a population of around 500 people.
The town was incorporated in 1909, and the first mayor was elected in 1910. The town continued to grow, and by the 1920s, it had become a popular tourist destination. The town was known for its natural beauty, and it was a popular spot for fishing and camping.
In the 1950s, the town began to decline, as many of the residents moved away to larger cities. The population of Leamington dropped to around 500 people by the 1970s. However, in the 1980s, the town began to experience a resurgence, as new businesses and residents moved into the area. The population of Leamington has been steadily increasing since then, and it is now estimated to be around 1,000 people.
Geography
Leamington is located in the south-central part of Utah, in the Sevier County. The town is situated at the junction of State Route 24 and State Route 118, and is about 30 miles south of the city of Richfield. The town is surrounded by the Wasatch Mountains to the east, and the Sevier River to the west.
The climate in Leamington is semi-arid, with hot summers and cold winters. The average temperature in the summer is around 80 degrees Fahrenheit, and the average temperature in the winter is around 30 degrees Fahrenheit. The town receives an average of around 10 inches of precipitation per year.
Economy
Leamington’s economy is largely based on agriculture and tourism. The town is home to several farms, which produce a variety of crops, including corn, wheat, and hay. The town is also home to several tourist attractions, including the Leamington State Park, which offers camping, fishing, and hiking opportunities.
The town is also home to several small businesses, including restaurants, shops, and a grocery store. The town is served by the Sevier Valley Medical Center, which provides medical care to the residents of Leamington and the surrounding area.
Demographics
The population of Leamington was estimated to be around 1,000 people in 2020. The town is predominantly white, with around 95% of the population identifying as Caucasian. The remaining 5% of the population is made up of African Americans, Native Americans, and other races.
The median household income in Leamington is around $45,000, and the median home value is around $150,000. The town has a low unemployment rate, and the majority of the residents are employed in the agricultural and tourism industries. The town is served by the Sevier Valley School District, which provides education to the students of Leamington.
Common Questions
What is Per Capita Income in Leamington?
Per Capita income in Leamington is $27,842.
What is the Median Family Income in Leamington?
Median Family Income in Leamington is $59,500.
What is the Median Household income in Leamington?
Median Household Income in Leamington is $59,000.
What is Inequality or Gini Index in Leamington?
Inequality or Gini Index in Leamington is 0.36.
What is the Total Population of Leamington?
Total Population of Leamington is 303.
What is the Total Male Population of Leamington?
Total Male Population of Leamington is 139.
What is the Total Female Population of Leamington?
Total Female Population of Leamington is 164.
What is the Ratio of Males per 100 Females in Leamington?
There are 84.76 Males per 100 Females in Leamington.
What is the Ratio of Females per 100 Males in Leamington?
There are 117.99 Females per 100 Males in Leamington.
What is the Median Population Age in Leamington?
Median Population Age in Leamington is 25.9 Years.
What is the Average Family Size in Leamington
Average Family Size in Leamington is 3.5 People.
What is the Average Household Size in Leamington
Average Household Size in Leamington is 3.4 People.
How Large is the Labor Force in Leamington?
There are 130 People in the Labor Forcein in Leamington.
What is the Percentage of People in the Labor Force in Leamington?
65.0% of People are in the Labor Force in Leamington.
What is the Unemployment Rate in Leamington?
Unemployment Rate in Leamington is 3.1%.