Midway, UT Map & Demographics
Midway Map
Midway Overview
$70,174
PER CAPITA INCOME
$153,072
AVG FAMILY INCOME
$130,648
AVG HOUSEHOLD INCOME
88.2%
WAGE / INCOME GAP [ % ]
11.8¢/ $1
WAGE / INCOME GAP [ $ ]
0.49
INEQUALITY / GINI INDEX
6,019
TOTAL POPULATION
2,981
MALE POPULATION
3,038
FEMALE POPULATION
98.12
MALES / 100 FEMALES
101.91
FEMALES / 100 MALES
41.2
MEDIAN AGE
3.1
AVG FAMILY SIZE
2.8
AVG HOUSEHOLD SIZE
2,481
LABOR FORCE [ PEOPLE ]
54.8%
PERCENT IN LABOR FORCE
4.4%
UNEMPLOYMENT RATE
Midway Zip Codes
Midway Area Codes
Income in Midway
Income Overview in Midway
Per Capita Income in Midway is $70,174, while median incomes of families and households are $153,072 and $130,648 respectively.
| Characteristic | Number | Measure |
| Per Capita Income | 6,019 | $70,174 |
| Median Family Income | 1,771 | $153,072 |
| Mean Family Income | 1,771 | $230,912 |
| Median Household Income | 2,122 | $130,648 |
| Mean Household Income | 2,122 | $200,120 |
| Income Deficit | 1,771 | $0 |
| Wage / Income Gap (%) | 6,019 | 88.22% |
| Wage / Income Gap ($) | 6,019 | 11.78¢ per $1 |
| Gini / Inequality Index | 6,019 | 0.49 |
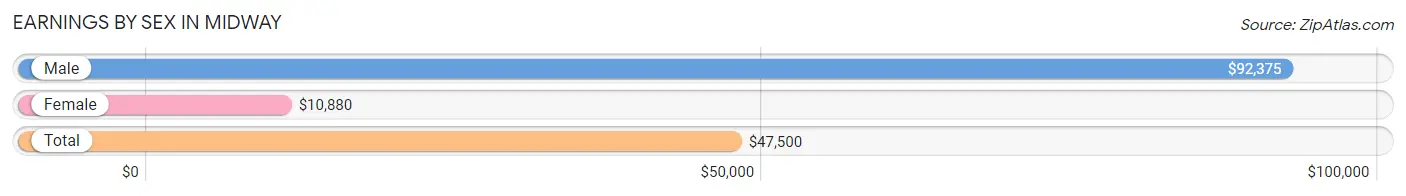
Earnings by Sex in Midway
Average Earnings in Midway are $47,500, $92,375 for men and $10,880 for women, a difference of 88.2%.
| Sex | Number | Average Earnings |
| Male | 1,490 (54.9%) | $92,375 |
| Female | 1,222 (45.1%) | $10,880 |
| Total | 2,712 (100.0%) | $47,500 |
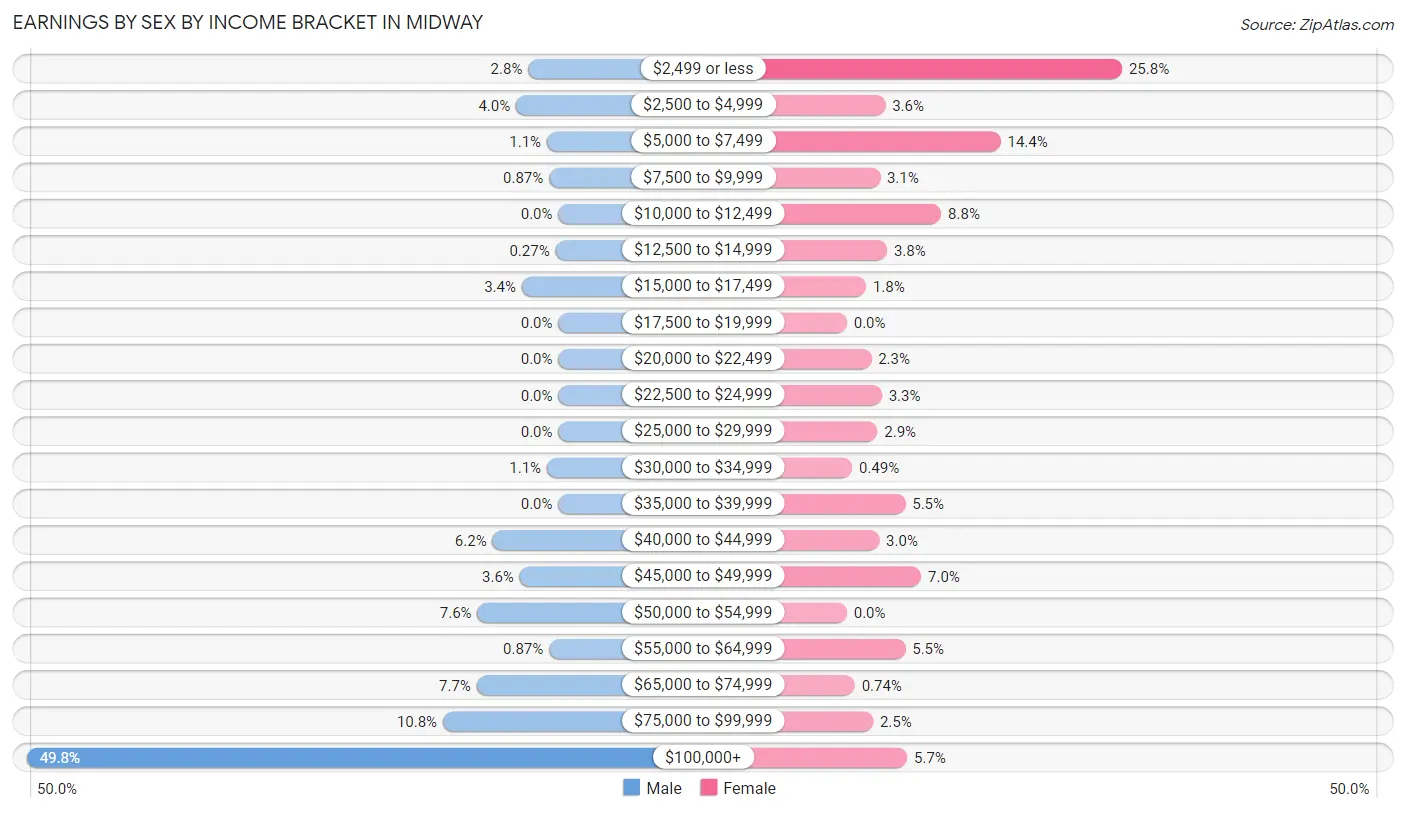
Earnings by Sex by Income Bracket in Midway
The most common earnings brackets in Midway are $100,000+ for men (742 | 49.8%) and $2,499 or less for women (315 | 25.8%).
| Income | Male | Female |
| $2,499 or less | 42 (2.8%) | 315 (25.8%) |
| $2,500 to $4,999 | 59 (4.0%) | 44 (3.6%) |
| $5,000 to $7,499 | 16 (1.1%) | 176 (14.4%) |
| $7,500 to $9,999 | 13 (0.9%) | 38 (3.1%) |
| $10,000 to $12,499 | 0 (0.0%) | 108 (8.8%) |
| $12,500 to $14,999 | 4 (0.3%) | 46 (3.8%) |
| $15,000 to $17,499 | 51 (3.4%) | 22 (1.8%) |
| $17,500 to $19,999 | 0 (0.0%) | 0 (0.0%) |
| $20,000 to $22,499 | 0 (0.0%) | 28 (2.3%) |
| $22,500 to $24,999 | 0 (0.0%) | 40 (3.3%) |
| $25,000 to $29,999 | 0 (0.0%) | 35 (2.9%) |
| $30,000 to $34,999 | 16 (1.1%) | 6 (0.5%) |
| $35,000 to $39,999 | 0 (0.0%) | 67 (5.5%) |
| $40,000 to $44,999 | 92 (6.2%) | 37 (3.0%) |
| $45,000 to $49,999 | 54 (3.6%) | 85 (7.0%) |
| $50,000 to $54,999 | 113 (7.6%) | 0 (0.0%) |
| $55,000 to $64,999 | 13 (0.9%) | 67 (5.5%) |
| $65,000 to $74,999 | 114 (7.6%) | 9 (0.7%) |
| $75,000 to $99,999 | 161 (10.8%) | 30 (2.5%) |
| $100,000+ | 742 (49.8%) | 69 (5.7%) |
| Total | 1,490 (100.0%) | 1,222 (100.0%) |
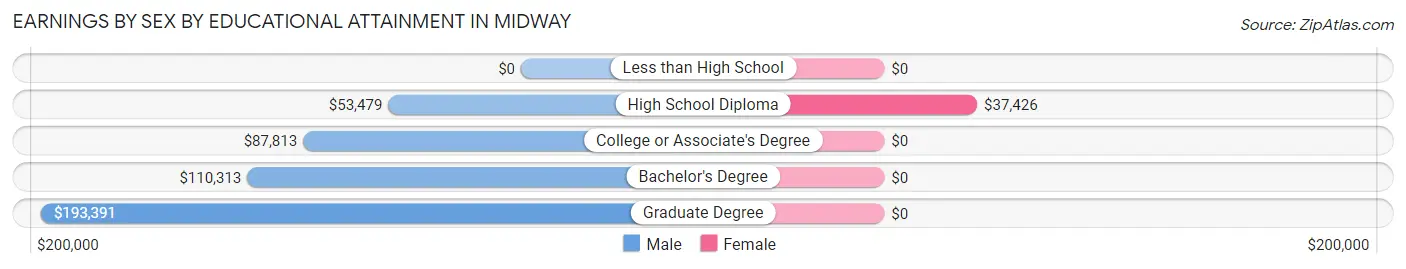
Earnings by Sex by Educational Attainment in Midway
Average earnings in Midway are $110,268 for men and $17,330 for women, a difference of 84.3%. Men with an educational attainment of graduate degree enjoy the highest average annual earnings of $193,391, while those with high school diploma education earn the least with $53,479. Women with an educational attainment of high school diploma earn the most with the average annual earnings of $37,426, while those with high school diploma education have the smallest earnings of $37,426.
| Educational Attainment | Male Income | Female Income |
| Less than High School | - | - |
| High School Diploma | $53,479 | $37,426 |
| College or Associate's Degree | $87,813 | $0 |
| Bachelor's Degree | $110,313 | $0 |
| Graduate Degree | $193,391 | $0 |
| Total | $110,268 | $17,330 |
Family Income in Midway
Family Income Brackets in Midway
According to the Midway family income data, there are 620 families falling into the $200,000+ income range, which is the most common income bracket and makes up 35.0% of all families.
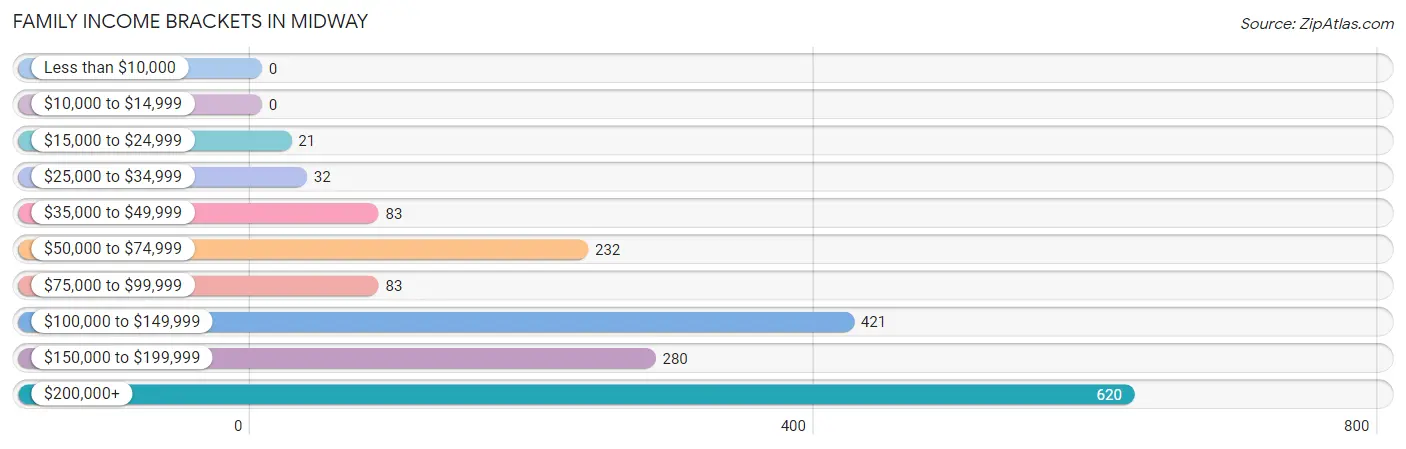
| Income Bracket | # Families | % Families |
| Less than $10,000 | 0 | 0.0% |
| $10,000 to $14,999 | 0 | 0.0% |
| $15,000 to $24,999 | 21 | 1.2% |
| $25,000 to $34,999 | 32 | 1.8% |
| $35,000 to $49,999 | 83 | 4.7% |
| $50,000 to $74,999 | 232 | 13.1% |
| $75,000 to $99,999 | 83 | 4.7% |
| $100,000 to $149,999 | 421 | 23.8% |
| $150,000 to $199,999 | 280 | 15.8% |
| $200,000+ | 620 | 35.0% |
Family Income by Famaliy Size in Midway
6-person families (107 | 6.0%) account for the highest median family income in Midway with $250,001 per family, while 2-person families (953 | 53.8%) have the highest median income of $76,463 per family member.
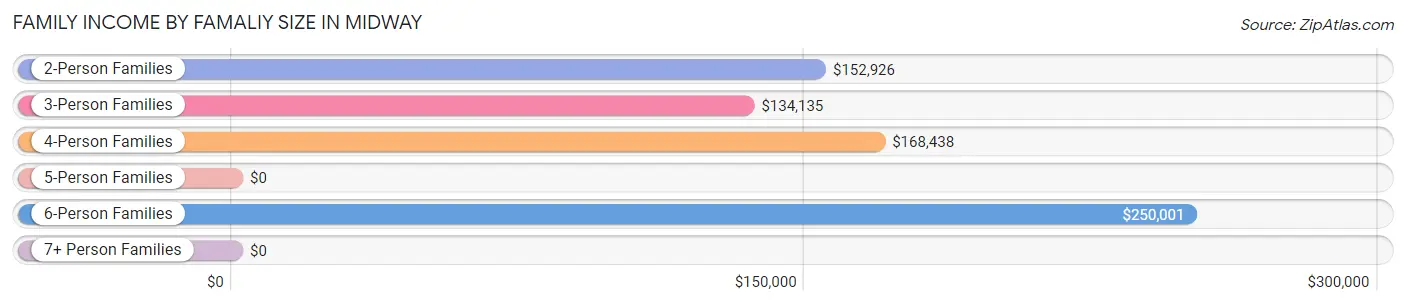
| Income Bracket | # Families | Median Income |
| 2-Person Families | 953 (53.8%) | $152,926 |
| 3-Person Families | 177 (10.0%) | $134,135 |
| 4-Person Families | 319 (18.0%) | $168,438 |
| 5-Person Families | 126 (7.1%) | $0 |
| 6-Person Families | 107 (6.0%) | $250,001 |
| 7+ Person Families | 89 (5.0%) | $0 |
| Total | 1,771 (100.0%) | $153,072 |
Family Income by Number of Earners in Midway
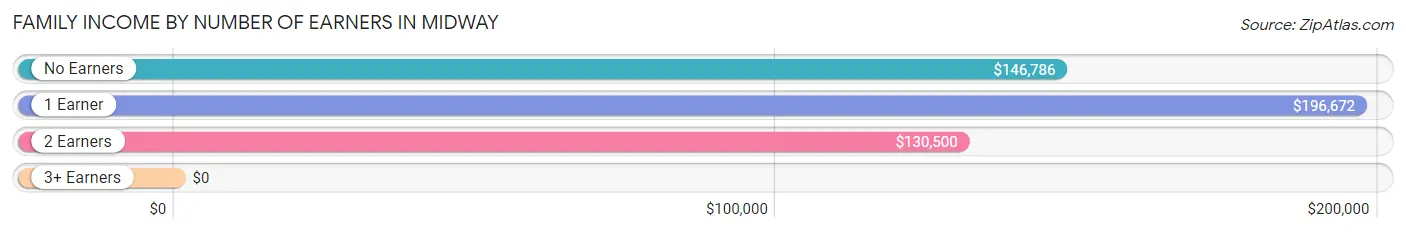
| Number of Earners | # Families | Median Income |
| No Earners | 414 (23.4%) | $146,786 |
| 1 Earner | 535 (30.2%) | $196,672 |
| 2 Earners | 572 (32.3%) | $130,500 |
| 3+ Earners | 250 (14.1%) | $0 |
| Total | 1,771 (100.0%) | $153,072 |
Household Income in Midway
Household Income Brackets in Midway
With 620 households falling in the category, the $200,000+ income range is the most frequent in Midway, accounting for 29.2% of all households. In contrast, only 30 households (1.4%) fall into the less than $10,000 income bracket, making it the least populous group.
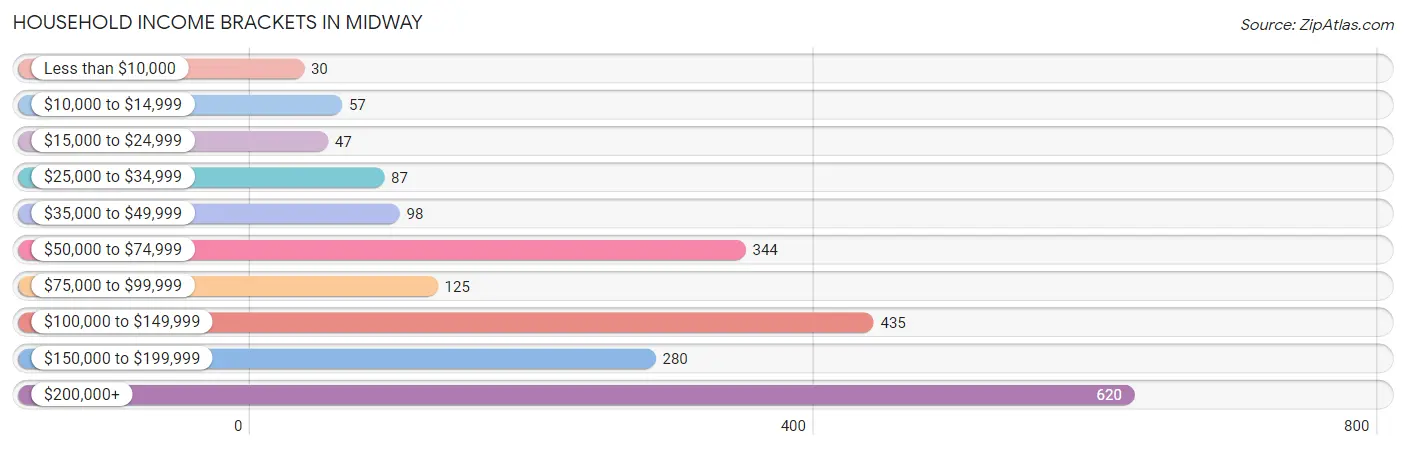
| Income Bracket | # Households | % Households |
| Less than $10,000 | 30 | 1.4% |
| $10,000 to $14,999 | 57 | 2.7% |
| $15,000 to $24,999 | 47 | 2.2% |
| $25,000 to $34,999 | 87 | 4.1% |
| $35,000 to $49,999 | 98 | 4.6% |
| $50,000 to $74,999 | 344 | 16.2% |
| $75,000 to $99,999 | 125 | 5.9% |
| $100,000 to $149,999 | 435 | 20.5% |
| $150,000 to $199,999 | 280 | 13.2% |
| $200,000+ | 620 | 29.2% |
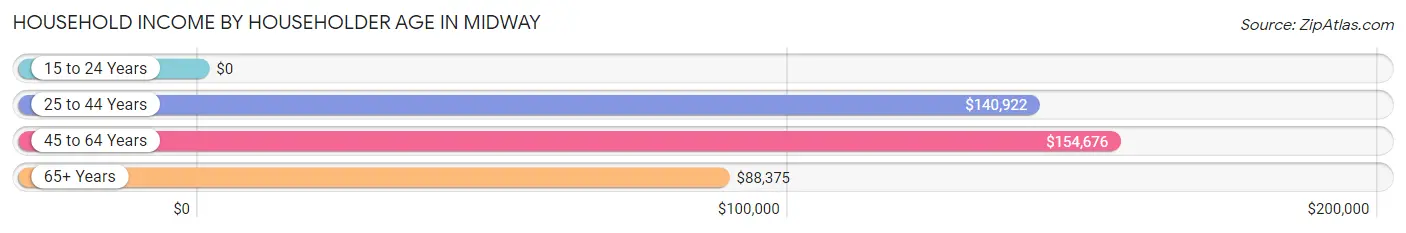
Household Income by Householder Age in Midway
The median household income in Midway is $130,648, with the highest median household income of $154,676 found in the 45 to 64 years age bracket for the primary householder. A total of 723 households (34.1%) fall into this category.
| Income Bracket | # Households | Median Income |
| 15 to 24 Years | 0 (0.0%) | $0 |
| 25 to 44 Years | 685 (32.3%) | $140,922 |
| 45 to 64 Years | 723 (34.1%) | $154,676 |
| 65+ Years | 714 (33.7%) | $88,375 |
| Total | 2,122 (100.0%) | $130,648 |
Poverty in Midway
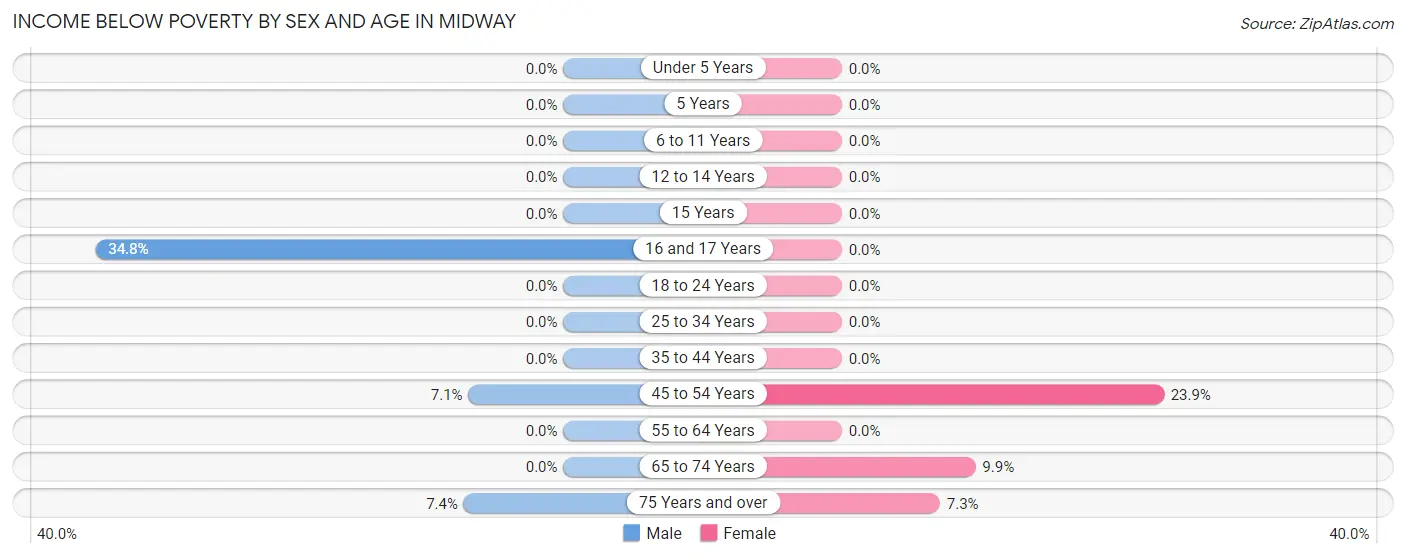
Income Below Poverty by Sex and Age in Midway
With 2.4% poverty level for males and 3.2% for females among the residents of Midway, 16 and 17 year old males and 45 to 54 year old females are the most vulnerable to poverty, with 41 males (34.7%) and 38 females (23.9%) in their respective age groups living below the poverty level.
| Age Bracket | Male | Female |
| Under 5 Years | 0 (0.0%) | 0 (0.0%) |
| 5 Years | 0 (0.0%) | 0 (0.0%) |
| 6 to 11 Years | 0 (0.0%) | 0 (0.0%) |
| 12 to 14 Years | 0 (0.0%) | 0 (0.0%) |
| 15 Years | 0 (0.0%) | 0 (0.0%) |
| 16 and 17 Years | 41 (34.7%) | 0 (0.0%) |
| 18 to 24 Years | 0 (0.0%) | 0 (0.0%) |
| 25 to 34 Years | 0 (0.0%) | 0 (0.0%) |
| 35 to 44 Years | 0 (0.0%) | 0 (0.0%) |
| 45 to 54 Years | 17 (7.0%) | 38 (23.9%) |
| 55 to 64 Years | 0 (0.0%) | 0 (0.0%) |
| 65 to 74 Years | 0 (0.0%) | 49 (9.9%) |
| 75 Years and over | 13 (7.4%) | 11 (7.3%) |
| Total | 71 (2.4%) | 98 (3.2%) |
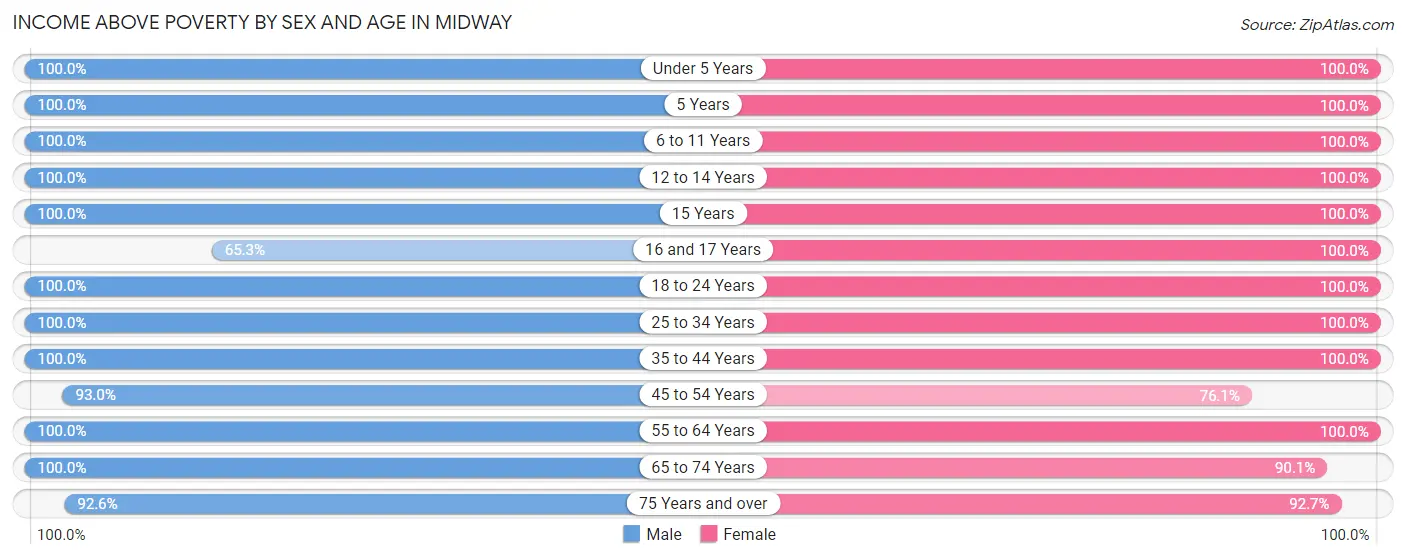
Income Above Poverty by Sex and Age in Midway
According to the poverty statistics in Midway, males aged under 5 years and females aged under 5 years are the age groups that are most secure financially, with 100.0% of males and 100.0% of females in these age groups living above the poverty line.
| Age Bracket | Male | Female |
| Under 5 Years | 214 (100.0%) | 193 (100.0%) |
| 5 Years | 53 (100.0%) | 60 (100.0%) |
| 6 to 11 Years | 356 (100.0%) | 255 (100.0%) |
| 12 to 14 Years | 79 (100.0%) | 125 (100.0%) |
| 15 Years | 82 (100.0%) | 22 (100.0%) |
| 16 and 17 Years | 77 (65.2%) | 145 (100.0%) |
| 18 to 24 Years | 92 (100.0%) | 150 (100.0%) |
| 25 to 34 Years | 184 (100.0%) | 233 (100.0%) |
| 35 to 44 Years | 416 (100.0%) | 558 (100.0%) |
| 45 to 54 Years | 224 (92.9%) | 121 (76.1%) |
| 55 to 64 Years | 467 (100.0%) | 493 (100.0%) |
| 65 to 74 Years | 450 (100.0%) | 445 (90.1%) |
| 75 Years and over | 163 (92.6%) | 140 (92.7%) |
| Total | 2,857 (97.6%) | 2,940 (96.8%) |
Income Below Poverty Among Married-Couple Families in Midway
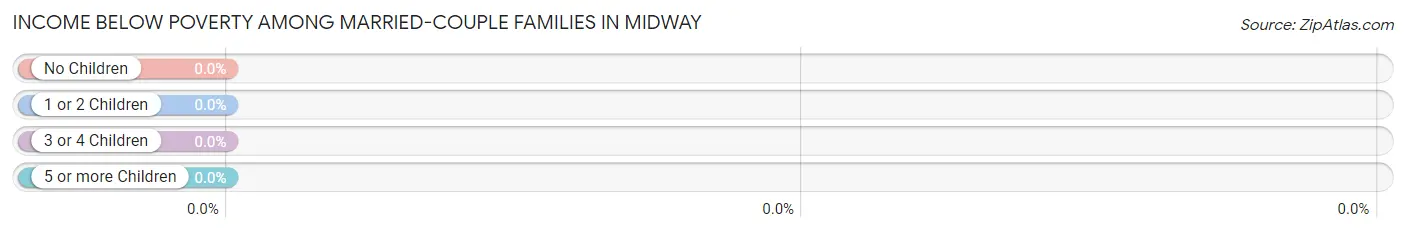
| Children | Above Poverty | Below Poverty |
| No Children | 1,090 (100.0%) | 0 (0.0%) |
| 1 or 2 Children | 334 (100.0%) | 0 (0.0%) |
| 3 or 4 Children | 210 (100.0%) | 0 (0.0%) |
| 5 or more Children | 89 (100.0%) | 0 (0.0%) |
| Total | 1,723 (100.0%) | 0 (0.0%) |
Income Below Poverty Among Single-Parent Households in Midway
| Children | Single Father | Single Mother |
| No Children | 0 (0.0%) | 0 (0.0%) |
| 1 or 2 Children | 0 (0.0%) | 0 (0.0%) |
| 3 or 4 Children | 0 (0.0%) | 0 (0.0%) |
| 5 or more Children | 0 (0.0%) | 0 (0.0%) |
| Total | 0 (0.0%) | 0 (0.0%) |
Income Below Poverty Among Married-Couple vs Single-Parent Households in Midway
| Children | Married-Couple Families | Single-Parent Households |
| No Children | 0 (0.0%) | 0 (0.0%) |
| 1 or 2 Children | 0 (0.0%) | 0 (0.0%) |
| 3 or 4 Children | 0 (0.0%) | 0 (0.0%) |
| 5 or more Children | 0 (0.0%) | 0 (0.0%) |
| Total | 0 (0.0%) | 0 (0.0%) |
Race in Midway
The most populous races in Midway are White / Caucasian (5,781 | 96.1%), Two or more Races (193 | 3.2%), and Hispanic or Latino (104 | 1.7%).
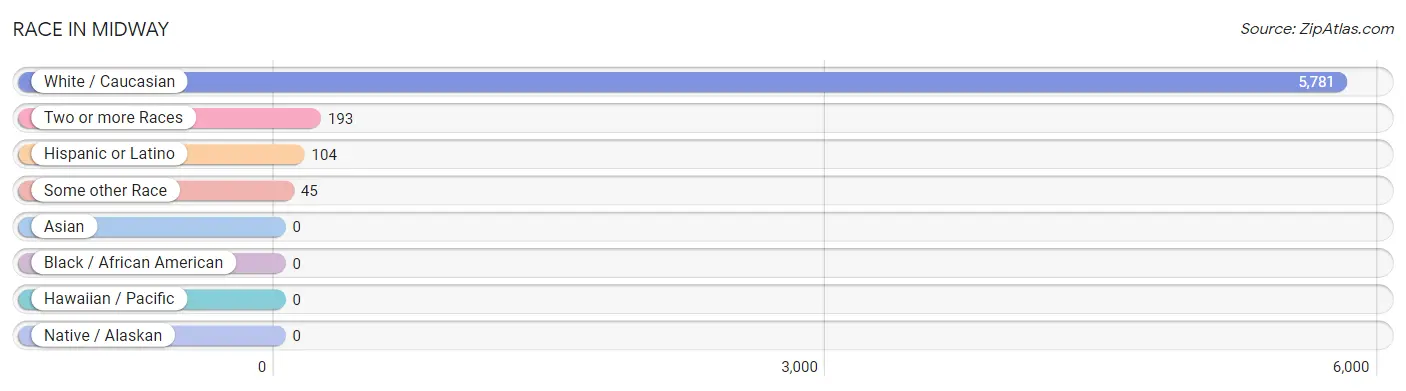
| Race | # Population | % Population |
| Asian | 0 | 0.0% |
| Black / African American | 0 | 0.0% |
| Hawaiian / Pacific | 0 | 0.0% |
| Hispanic or Latino | 104 | 1.7% |
| Native / Alaskan | 0 | 0.0% |
| White / Caucasian | 5,781 | 96.1% |
| Two or more Races | 193 | 3.2% |
| Some other Race | 45 | 0.7% |
| Total | 6,019 | 100.0% |
Ancestry in Midway
The most populous ancestries reported in Midway are English (2,063 | 34.3%), German (693 | 11.5%), Irish (575 | 9.6%), European (479 | 8.0%), and Italian (418 | 6.9%), together accounting for 70.2% of all Midway residents.
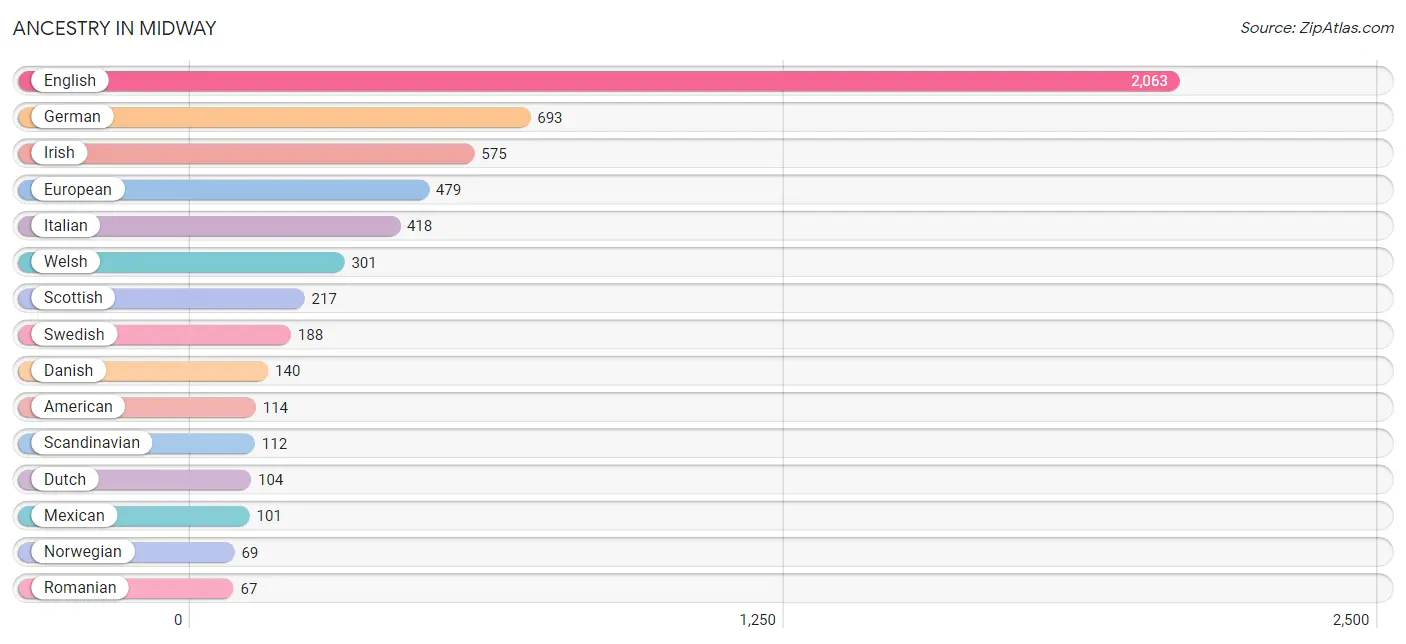
| Ancestry | # Population | % Population |
| American | 114 | 1.9% |
| Austrian | 46 | 0.8% |
| British | 36 | 0.6% |
| Canadian | 20 | 0.3% |
| Czech | 34 | 0.6% |
| Danish | 140 | 2.3% |
| Dutch | 104 | 1.7% |
| Eastern European | 19 | 0.3% |
| English | 2,063 | 34.3% |
| European | 479 | 8.0% |
| Finnish | 22 | 0.4% |
| French | 38 | 0.6% |
| French Canadian | 30 | 0.5% |
| German | 693 | 11.5% |
| Greek | 7 | 0.1% |
| Irish | 575 | 9.6% |
| Israeli | 30 | 0.5% |
| Italian | 418 | 6.9% |
| Mexican | 101 | 1.7% |
| Norwegian | 69 | 1.1% |
| Polish | 41 | 0.7% |
| Romanian | 67 | 1.1% |
| Russian | 11 | 0.2% |
| Scandinavian | 112 | 1.9% |
| Scotch-Irish | 3 | 0.1% |
| Scottish | 217 | 3.6% |
| Slovak | 46 | 0.8% |
| Spaniard | 3 | 0.1% |
| Swedish | 188 | 3.1% |
| Swiss | 59 | 1.0% |
| Welsh | 301 | 5.0% | View All 31 Rows |
Immigrants in Midway
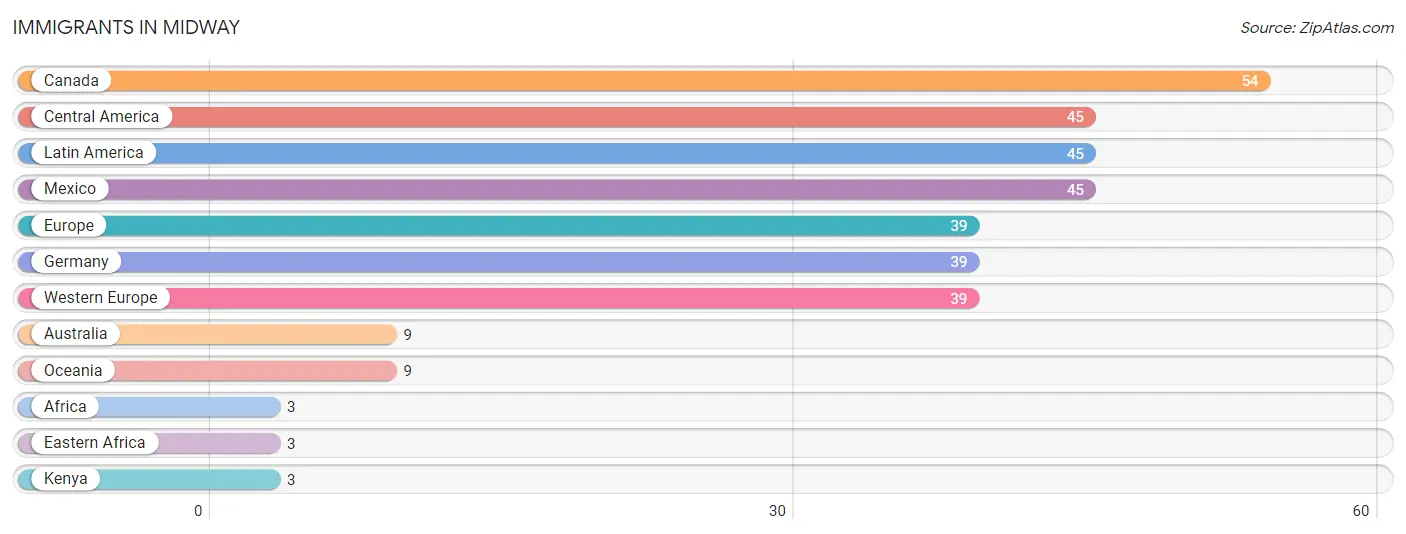
The most numerous immigrant groups reported in Midway came from Canada (54 | 0.9%), Central America (45 | 0.7%), Latin America (45 | 0.7%), Mexico (45 | 0.7%), and Europe (39 | 0.6%), together accounting for 3.8% of all Midway residents.
| Immigration Origin | # Population | % Population |
| Africa | 3 | 0.1% |
| Australia | 9 | 0.2% |
| Canada | 54 | 0.9% |
| Central America | 45 | 0.7% |
| Eastern Africa | 3 | 0.1% |
| Europe | 39 | 0.6% |
| Germany | 39 | 0.6% |
| Kenya | 3 | 0.1% |
| Latin America | 45 | 0.7% |
| Mexico | 45 | 0.7% |
| Oceania | 9 | 0.2% |
| Western Europe | 39 | 0.6% | View All 12 Rows |
Sex and Age in Midway
Sex and Age in Midway
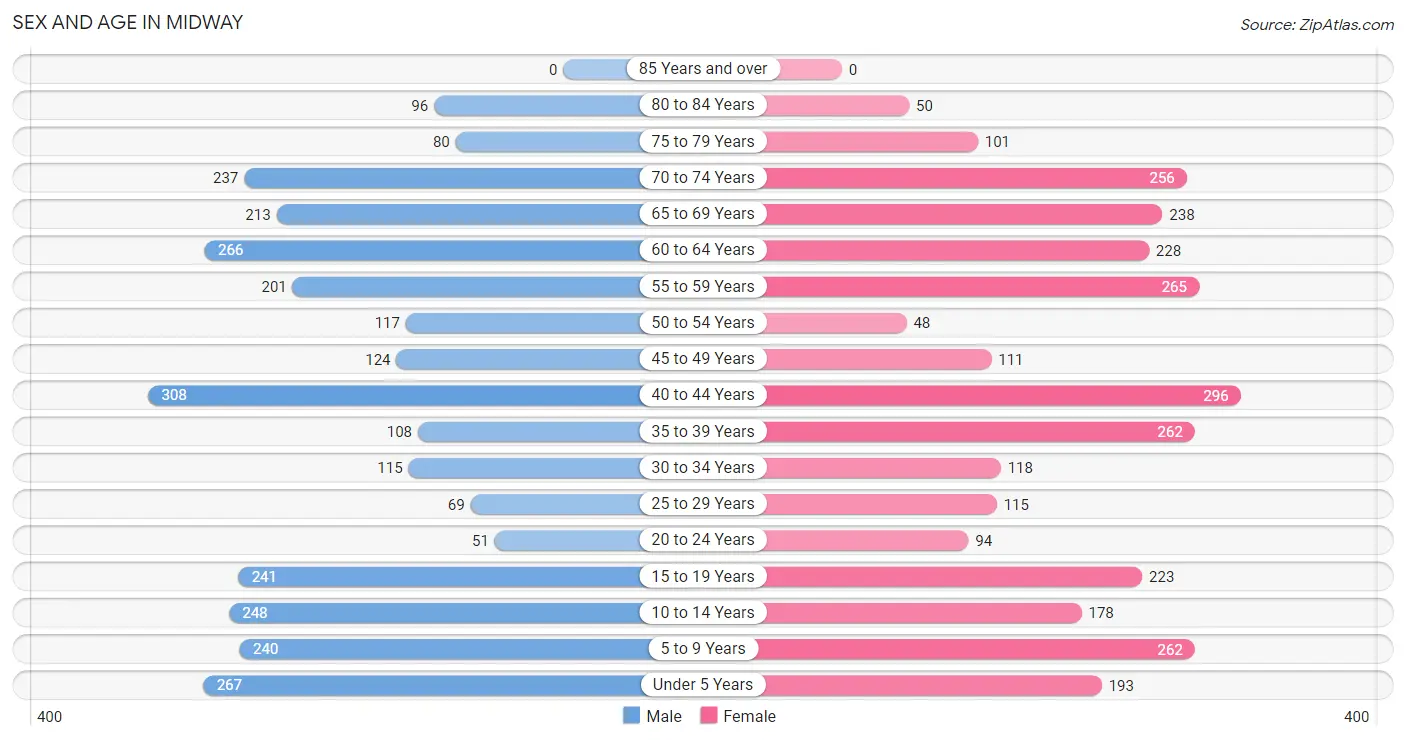
The most populous age groups in Midway are 40 to 44 Years (308 | 10.3%) for men and 40 to 44 Years (296 | 9.7%) for women.
| Age Bracket | Male | Female |
| Under 5 Years | 267 (9.0%) | 193 (6.4%) |
| 5 to 9 Years | 240 (8.1%) | 262 (8.6%) |
| 10 to 14 Years | 248 (8.3%) | 178 (5.9%) |
| 15 to 19 Years | 241 (8.1%) | 223 (7.3%) |
| 20 to 24 Years | 51 (1.7%) | 94 (3.1%) |
| 25 to 29 Years | 69 (2.3%) | 115 (3.8%) |
| 30 to 34 Years | 115 (3.9%) | 118 (3.9%) |
| 35 to 39 Years | 108 (3.6%) | 262 (8.6%) |
| 40 to 44 Years | 308 (10.3%) | 296 (9.7%) |
| 45 to 49 Years | 124 (4.2%) | 111 (3.6%) |
| 50 to 54 Years | 117 (3.9%) | 48 (1.6%) |
| 55 to 59 Years | 201 (6.7%) | 265 (8.7%) |
| 60 to 64 Years | 266 (8.9%) | 228 (7.5%) |
| 65 to 69 Years | 213 (7.1%) | 238 (7.8%) |
| 70 to 74 Years | 237 (8.0%) | 256 (8.4%) |
| 75 to 79 Years | 80 (2.7%) | 101 (3.3%) |
| 80 to 84 Years | 96 (3.2%) | 50 (1.7%) |
| 85 Years and over | 0 (0.0%) | 0 (0.0%) |
| Total | 2,981 (100.0%) | 3,038 (100.0%) |
Families and Households in Midway
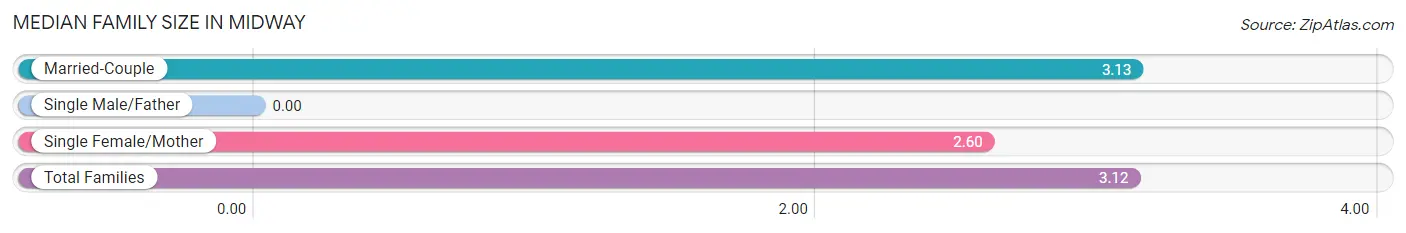
Median Family Size in Midway
| Family Type | # Families | Family Size |
| Married-Couple | 1,723 (97.3%) | 3.13 |
| Single Male/Father | 0 (0.0%) | - |
| Single Female/Mother | 48 (2.7%) | 2.60 |
| Total Families | 1,771 (100.0%) | 3.12 |
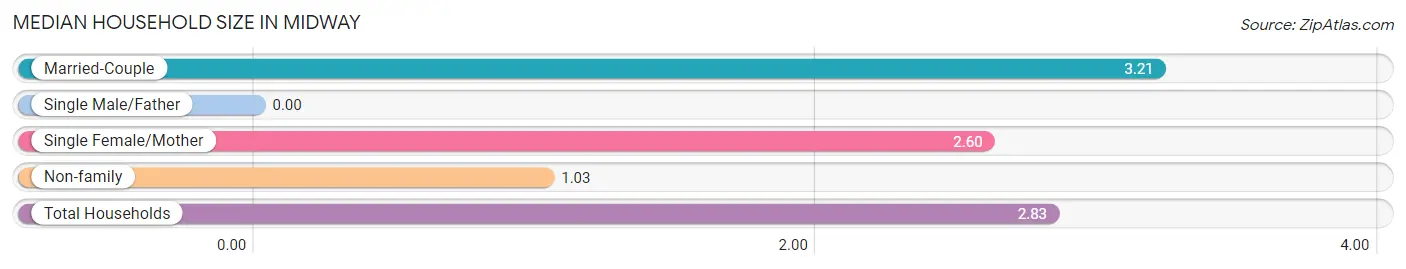
Median Household Size in Midway
| Household Type | # Households | Household Size |
| Married-Couple | 1,723 (81.2%) | 3.21 |
| Single Male/Father | 0 (0.0%) | - |
| Single Female/Mother | 48 (2.3%) | 2.60 |
| Non-family | 351 (16.5%) | 1.03 |
| Total Households | 2,122 (100.0%) | 2.83 |
Household Size by Marriage Status in Midway
Out of a total of 2,122 households in Midway, 1,771 (83.5%) are family households, while 351 (16.5%) are nonfamily households. The most numerous type of family households are 2-person households, comprising 923, and the most common type of nonfamily households are 1-person households, comprising 337.
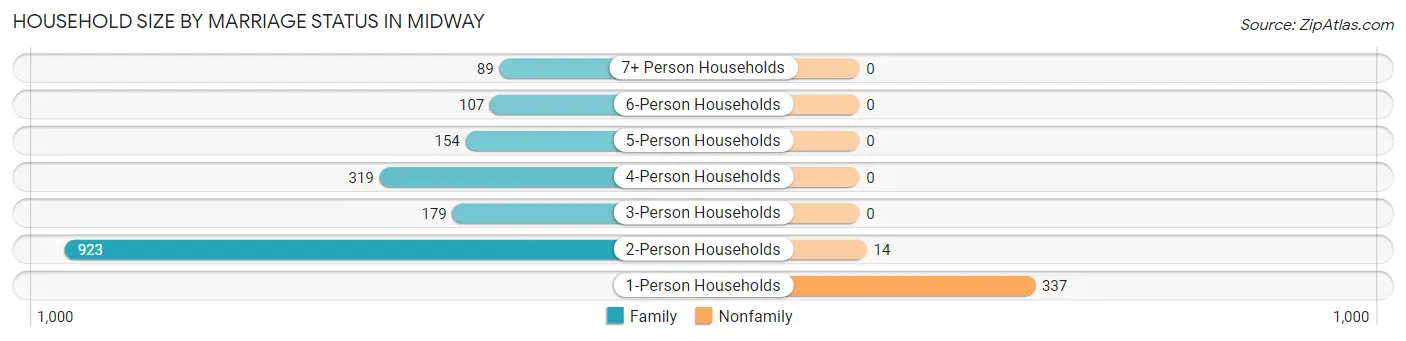
| Household Size | Family Households | Nonfamily Households |
| 1-Person Households | - | 337 (15.9%) |
| 2-Person Households | 923 (43.5%) | 14 (0.7%) |
| 3-Person Households | 179 (8.4%) | 0 (0.0%) |
| 4-Person Households | 319 (15.0%) | 0 (0.0%) |
| 5-Person Households | 154 (7.3%) | 0 (0.0%) |
| 6-Person Households | 107 (5.0%) | 0 (0.0%) |
| 7+ Person Households | 89 (4.2%) | 0 (0.0%) |
| Total | 1,771 (83.5%) | 351 (16.5%) |
Female Fertility in Midway
Fertility by Age in Midway
| Age Bracket | Women with Births | Births / 1,000 Women |
| 15 to 19 years | 0 (0.0%) | 0.0 |
| 20 to 34 years | 0 (0.0%) | 0.0 |
| 35 to 50 years | 0 (0.0%) | 0.0 |
| Total | 0 (0.0%) | 0.0 |
Fertility by Age by Marriage Status in Midway
| Age Bracket | Married | Unmarried |
| 15 to 19 years | 0 (0.0%) | 0 (0.0%) |
| 20 to 34 years | 0 (0.0%) | 0 (0.0%) |
| 35 to 50 years | 0 (0.0%) | 0 (0.0%) |
| Total | 0 (0.0%) | 0 (0.0%) |
Fertility by Education in Midway
| Educational Attainment | Women with Births | Births / 1,000 Women |
| Less than High School | 0 (0.0%) | 0.0 |
| High School Diploma | 0 (0.0%) | 0.0 |
| College or Associate's Degree | 0 (0.0%) | 0.0 |
| Bachelor's Degree | 0 (0.0%) | 0.0 |
| Graduate Degree | 0 (0.0%) | 0.0 |
| Total | 0 (0.0%) | 0.0 |
Fertility by Education by Marriage Status in Midway
| Educational Attainment | Married | Unmarried |
| Less than High School | 0 (0.0%) | 0 (0.0%) |
| High School Diploma | 0 (0.0%) | 0 (0.0%) |
| College or Associate's Degree | 0 (0.0%) | 0 (0.0%) |
| Bachelor's Degree | 0 (0.0%) | 0 (0.0%) |
| Graduate Degree | 0 (0.0%) | 0 (0.0%) |
| Total | 0 (0.0%) | 0 (0.0%) |
Employment Characteristics in Midway
Employment by Class of Employer in Midway
Among the 2,300 employed individuals in Midway, private company employees (1,320 | 57.4%), self-employed (not incorporated) (355 | 15.4%), and local government employees (264 | 11.5%) make up the most common classes of employment.
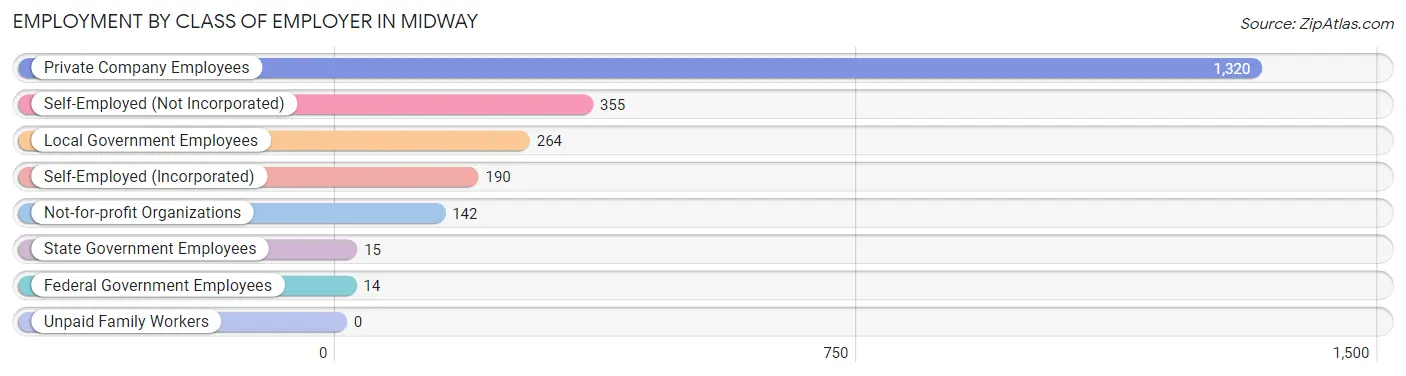
| Employer Class | # Employees | % Employees |
| Private Company Employees | 1,320 | 57.4% |
| Self-Employed (Incorporated) | 190 | 8.3% |
| Self-Employed (Not Incorporated) | 355 | 15.4% |
| Not-for-profit Organizations | 142 | 6.2% |
| Local Government Employees | 264 | 11.5% |
| State Government Employees | 15 | 0.6% |
| Federal Government Employees | 14 | 0.6% |
| Unpaid Family Workers | 0 | 0.0% |
| Total | 2,300 | 100.0% |
Employment Status by Age in Midway
According to the labor force statistics for Midway, out of the total population over 16 years of age (4,527), 54.8% or 2,481 individuals are in the labor force, with 4.4% or 109 of them unemployed. The age group with the highest labor force participation rate is 20 to 24 years, with 100.0% or 145 individuals in the labor force. Within the labor force, the 75 years and over age range has the highest percentage of unemployed individuals, with 85.2% or 23 of them being unemployed.
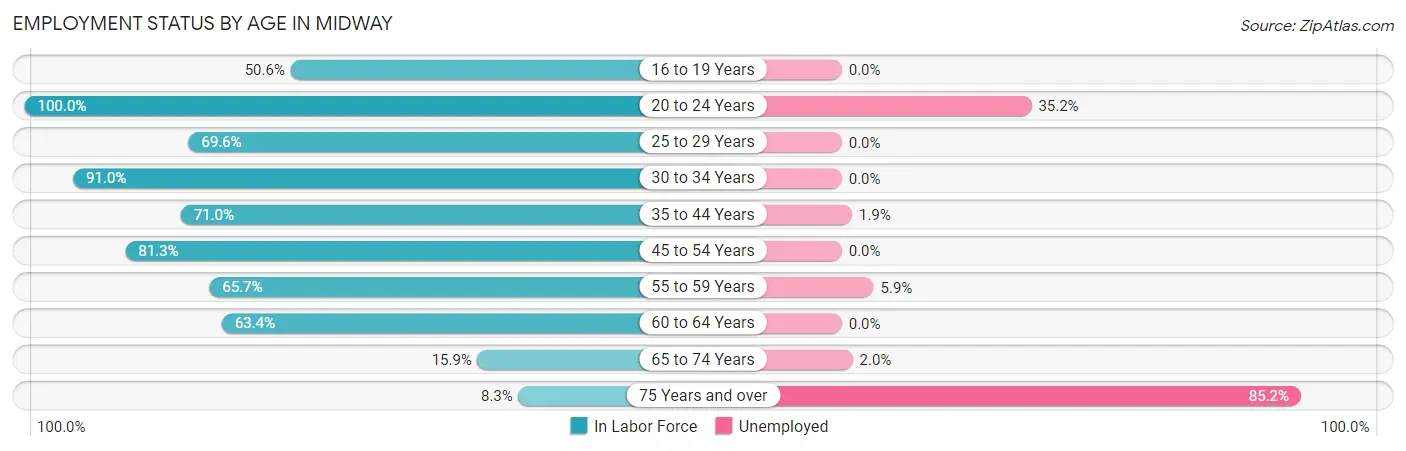
| Age Bracket | In Labor Force | Unemployed |
| 16 to 19 Years | 182 (50.6%) | 0 (0.0%) |
| 20 to 24 Years | 145 (100.0%) | 51 (35.2%) |
| 25 to 29 Years | 128 (69.6%) | 0 (0.0%) |
| 30 to 34 Years | 212 (91.0%) | 0 (0.0%) |
| 35 to 44 Years | 692 (71.0%) | 13 (1.9%) |
| 45 to 54 Years | 325 (81.3%) | 0 (0.0%) |
| 55 to 59 Years | 306 (65.7%) | 18 (5.9%) |
| 60 to 64 Years | 313 (63.4%) | 0 (0.0%) |
| 65 to 74 Years | 150 (15.9%) | 3 (2.0%) |
| 75 Years and over | 27 (8.3%) | 23 (85.2%) |
| Total | 2,481 (54.8%) | 109 (4.4%) |
Employment Status by Educational Attainment in Midway
According to labor force statistics for Midway, 71.8% of individuals (1,975) out of the total population between 25 and 64 years of age (2,751) are in the labor force, with 1.6% or 32 of them being unemployed. The group with the highest labor force participation rate are those with the educational attainment of less than high school, with 100.0% or 45 individuals in the labor force. Within the labor force, individuals with college / associate degree education have the highest percentage of unemployment, with 2.4% or 13 of them being unemployed.
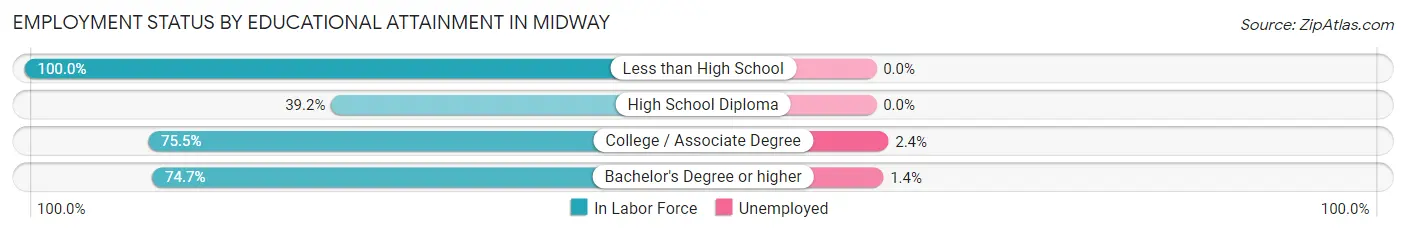
| Educational Attainment | In Labor Force | Unemployed |
| Less than High School | 45 (100.0%) | 0 (0.0%) |
| High School Diploma | 107 (39.2%) | 0 (0.0%) |
| College / Associate Degree | 549 (75.5%) | 17 (2.4%) |
| Bachelor's Degree or higher | 1,274 (74.7%) | 24 (1.4%) |
| Total | 1,975 (71.8%) | 44 (1.6%) |
Employment Occupations by Sex in Midway
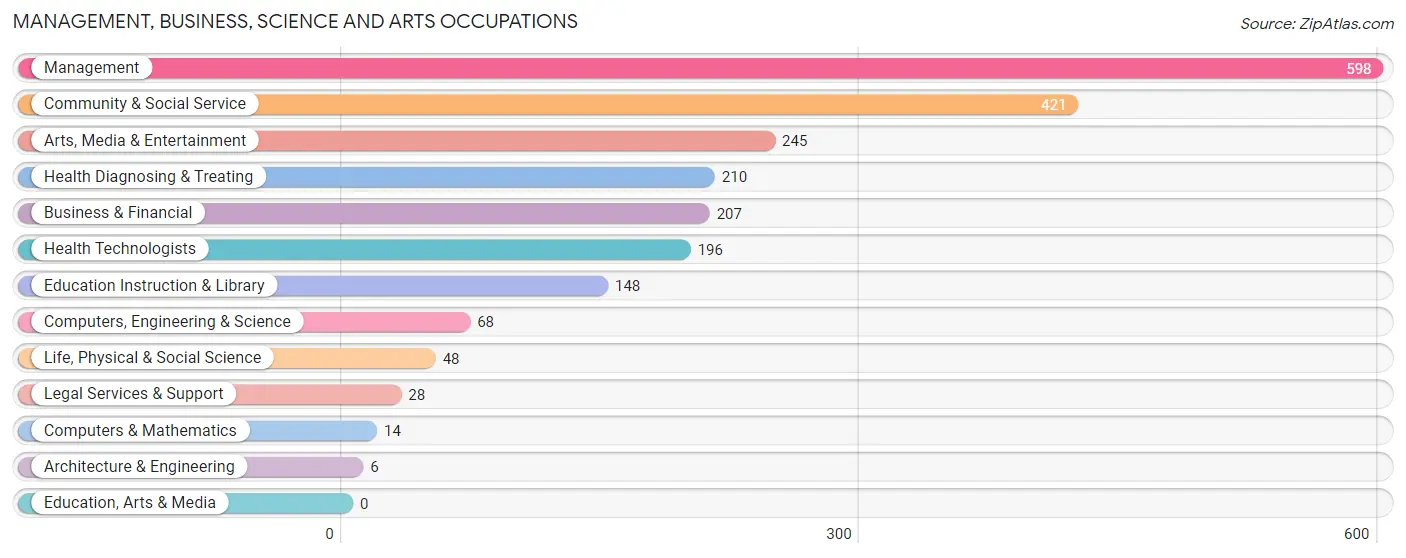
Management, Business, Science and Arts Occupations
The most common Management, Business, Science and Arts occupations in Midway are Management (598 | 25.2%), Community & Social Service (421 | 17.7%), Arts, Media & Entertainment (245 | 10.3%), Health Diagnosing & Treating (210 | 8.8%), and Business & Financial (207 | 8.7%).
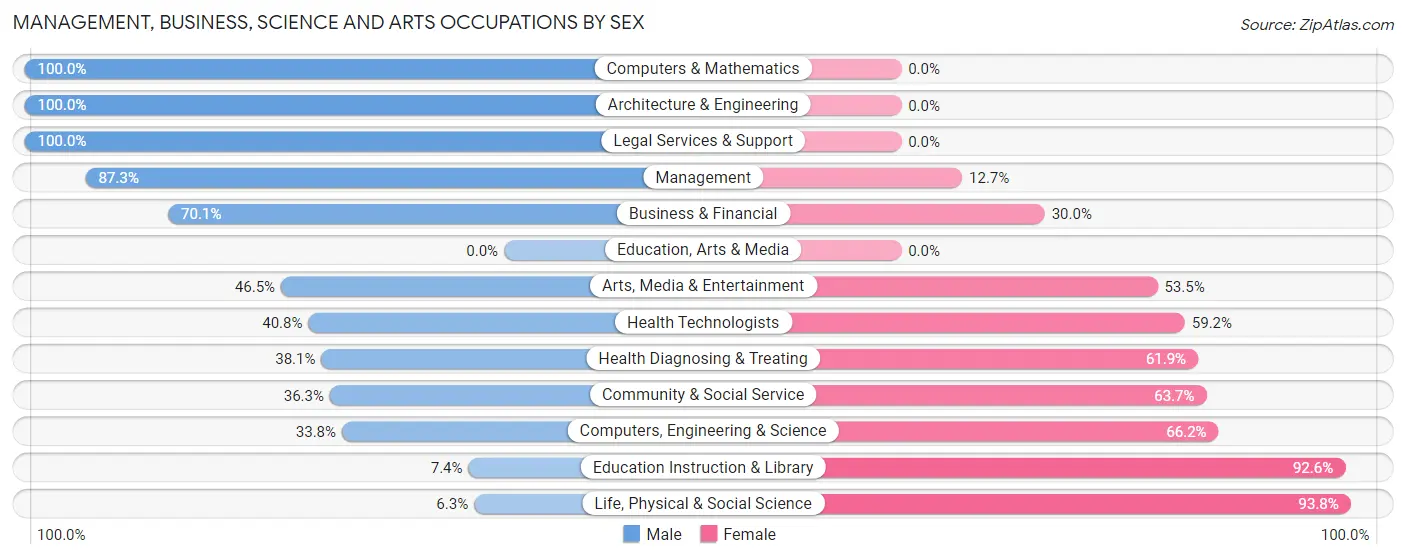
Management, Business, Science and Arts Occupations by Sex
Within the Management, Business, Science and Arts occupations in Midway, the most male-oriented occupations are Computers & Mathematics (100.0%), Architecture & Engineering (100.0%), and Legal Services & Support (100.0%), while the most female-oriented occupations are Life, Physical & Social Science (93.8%), Education Instruction & Library (92.6%), and Computers, Engineering & Science (66.2%).
| Occupation | Male | Female |
| Management | 522 (87.3%) | 76 (12.7%) |
| Business & Financial | 145 (70.1%) | 62 (29.9%) |
| Computers, Engineering & Science | 23 (33.8%) | 45 (66.2%) |
| Computers & Mathematics | 14 (100.0%) | 0 (0.0%) |
| Architecture & Engineering | 6 (100.0%) | 0 (0.0%) |
| Life, Physical & Social Science | 3 (6.2%) | 45 (93.8%) |
| Community & Social Service | 153 (36.3%) | 268 (63.7%) |
| Education, Arts & Media | 0 (0.0%) | 0 (0.0%) |
| Legal Services & Support | 28 (100.0%) | 0 (0.0%) |
| Education Instruction & Library | 11 (7.4%) | 137 (92.6%) |
| Arts, Media & Entertainment | 114 (46.5%) | 131 (53.5%) |
| Health Diagnosing & Treating | 80 (38.1%) | 130 (61.9%) |
| Health Technologists | 80 (40.8%) | 116 (59.2%) |
| Total (Category) | 923 (61.4%) | 581 (38.6%) |
| Total (Overall) | 1,395 (58.8%) | 977 (41.2%) |
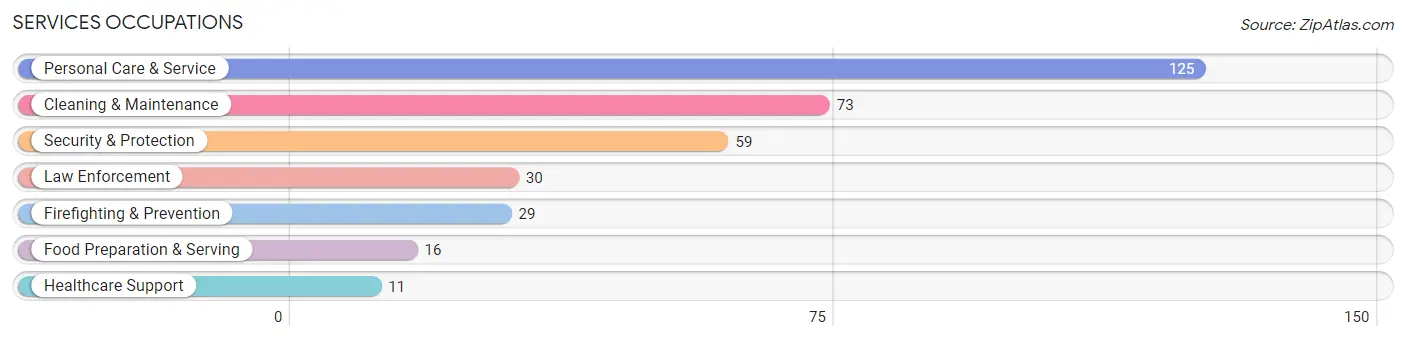
Services Occupations
The most common Services occupations in Midway are Personal Care & Service (125 | 5.3%), Cleaning & Maintenance (73 | 3.1%), Security & Protection (59 | 2.5%), Law Enforcement (30 | 1.3%), and Firefighting & Prevention (29 | 1.2%).
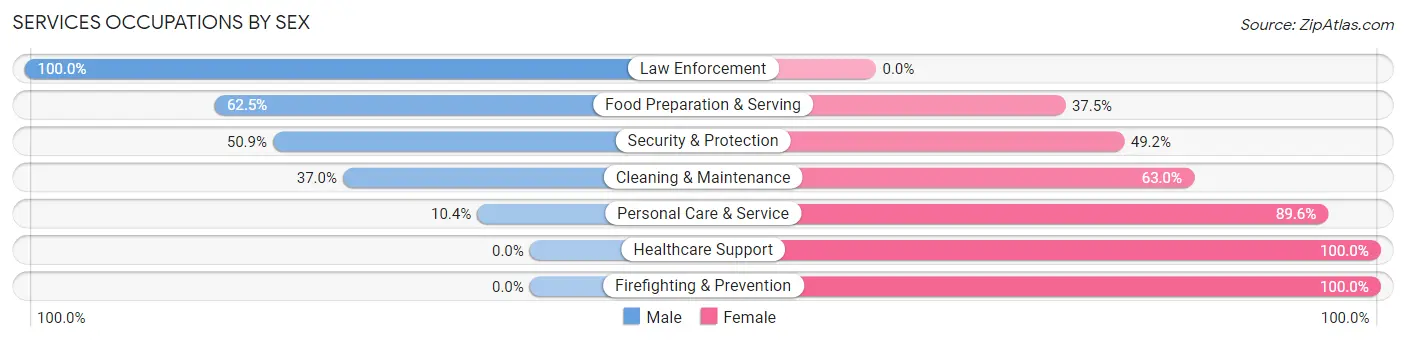
Services Occupations by Sex
Within the Services occupations in Midway, the most male-oriented occupations are Law Enforcement (100.0%), Food Preparation & Serving (62.5%), and Security & Protection (50.8%), while the most female-oriented occupations are Healthcare Support (100.0%), Firefighting & Prevention (100.0%), and Personal Care & Service (89.6%).
| Occupation | Male | Female |
| Healthcare Support | 0 (0.0%) | 11 (100.0%) |
| Security & Protection | 30 (50.8%) | 29 (49.1%) |
| Firefighting & Prevention | 0 (0.0%) | 29 (100.0%) |
| Law Enforcement | 30 (100.0%) | 0 (0.0%) |
| Food Preparation & Serving | 10 (62.5%) | 6 (37.5%) |
| Cleaning & Maintenance | 27 (37.0%) | 46 (63.0%) |
| Personal Care & Service | 13 (10.4%) | 112 (89.6%) |
| Total (Category) | 80 (28.2%) | 204 (71.8%) |
| Total (Overall) | 1,395 (58.8%) | 977 (41.2%) |
Sales and Office Occupations
The most common Sales and Office occupations in Midway are Sales & Related (237 | 10.0%), and Office & Administration (111 | 4.7%).
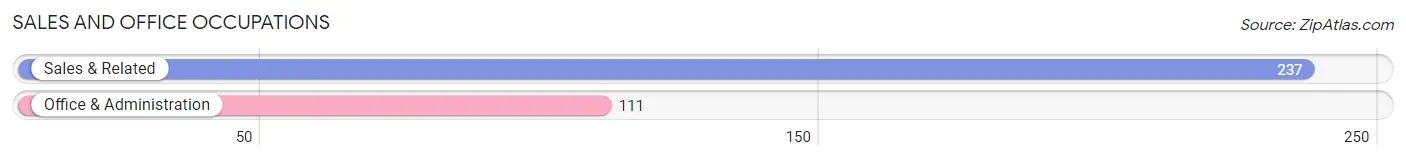
Sales and Office Occupations by Sex

| Occupation | Male | Female |
| Sales & Related | 149 (62.9%) | 88 (37.1%) |
| Office & Administration | 21 (18.9%) | 90 (81.1%) |
| Total (Category) | 170 (48.8%) | 178 (51.1%) |
| Total (Overall) | 1,395 (58.8%) | 977 (41.2%) |
Natural Resources, Construction and Maintenance Occupations
The most common Natural Resources, Construction and Maintenance occupations in Midway are Installation, Maintenance & Repair (62 | 2.6%), and Construction & Extraction (44 | 1.8%).

Natural Resources, Construction and Maintenance Occupations by Sex

| Occupation | Male | Female |
| Farming, Fishing & Forestry | 0 (0.0%) | 0 (0.0%) |
| Construction & Extraction | 44 (100.0%) | 0 (0.0%) |
| Installation, Maintenance & Repair | 62 (100.0%) | 0 (0.0%) |
| Total (Category) | 106 (100.0%) | 0 (0.0%) |
| Total (Overall) | 1,395 (58.8%) | 977 (41.2%) |
Production, Transportation and Moving Occupations
The most common Production, Transportation and Moving occupations in Midway are Transportation (53 | 2.2%), Production (52 | 2.2%), and Material Moving (25 | 1.1%).
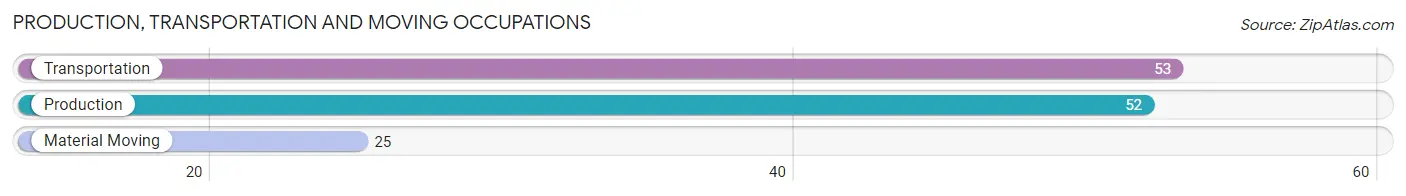
Production, Transportation and Moving Occupations by Sex
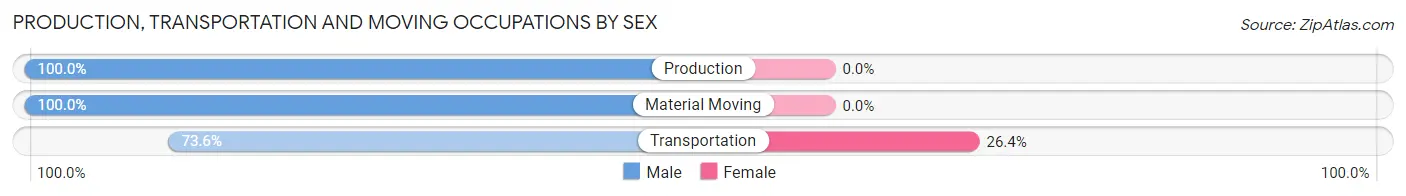
| Occupation | Male | Female |
| Production | 52 (100.0%) | 0 (0.0%) |
| Transportation | 39 (73.6%) | 14 (26.4%) |
| Material Moving | 25 (100.0%) | 0 (0.0%) |
| Total (Category) | 116 (89.2%) | 14 (10.8%) |
| Total (Overall) | 1,395 (58.8%) | 977 (41.2%) |
Employment Industries by Sex in Midway
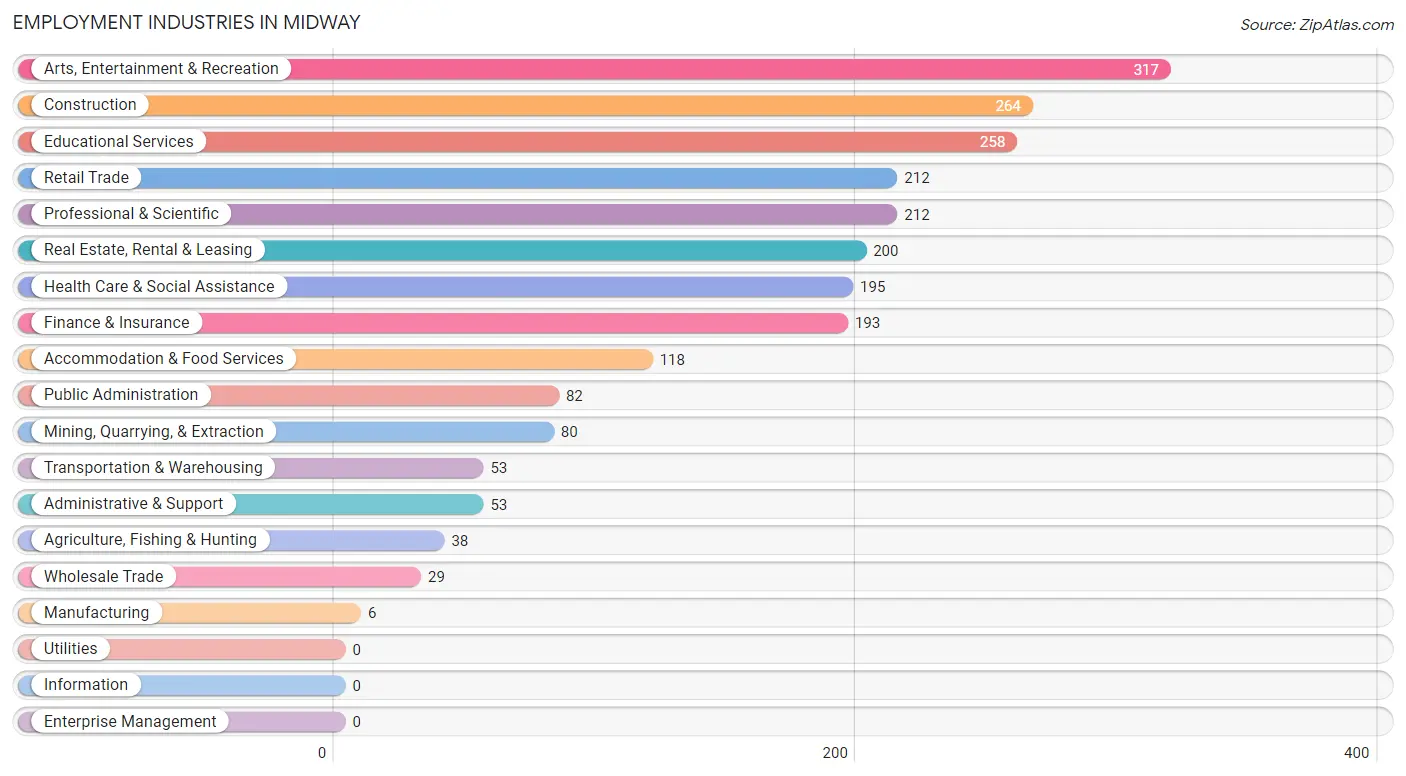
Employment Industries in Midway
The major employment industries in Midway include Arts, Entertainment & Recreation (317 | 13.4%), Construction (264 | 11.1%), Educational Services (258 | 10.9%), Retail Trade (212 | 8.9%), and Professional & Scientific (212 | 8.9%).
Employment Industries by Sex in Midway
The Midway industries that see more men than women are Mining, Quarrying, & Extraction (100.0%), Wholesale Trade (100.0%), and Construction (90.1%), whereas the industries that tend to have a higher number of women are Manufacturing (100.0%), Educational Services (94.6%), and Administrative & Support (75.5%).
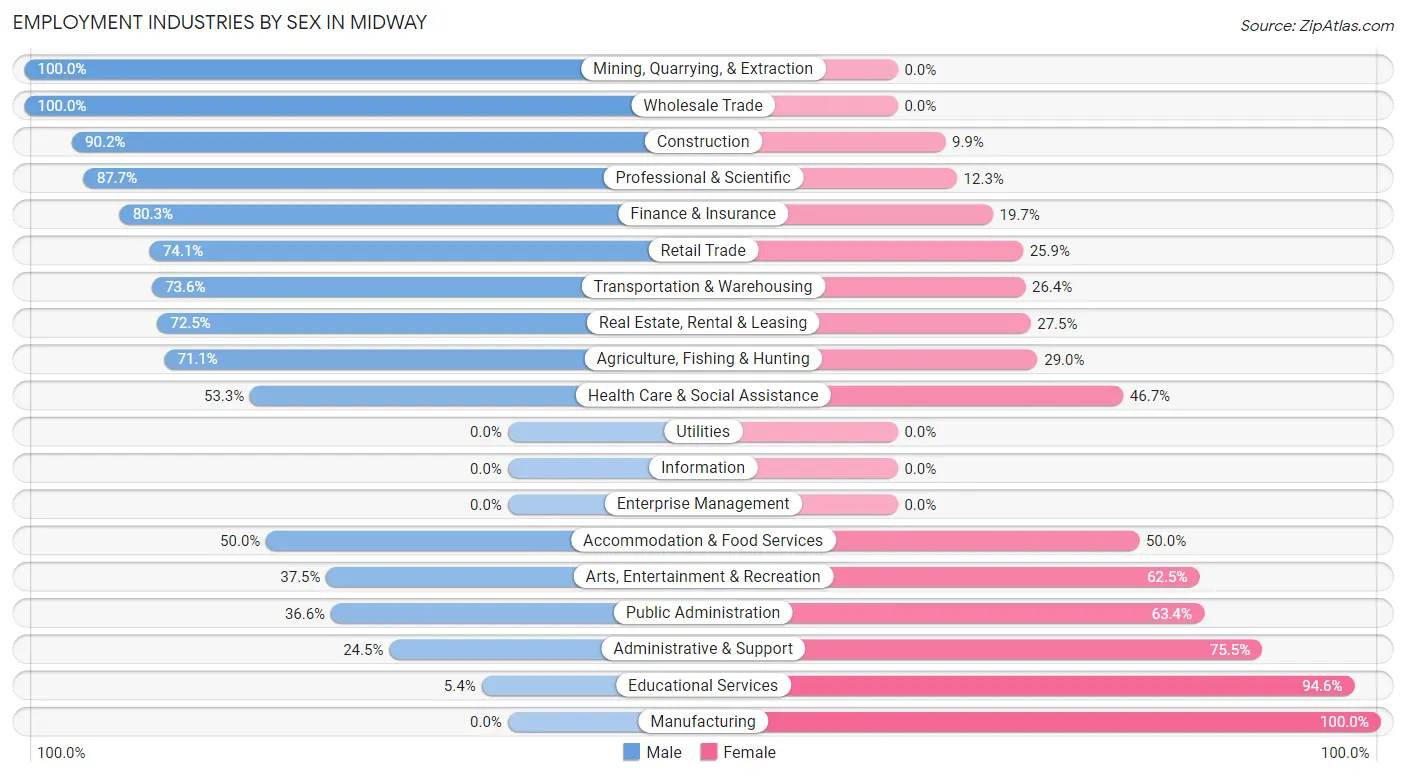
| Industry | Male | Female |
| Agriculture, Fishing & Hunting | 27 (71.1%) | 11 (28.9%) |
| Mining, Quarrying, & Extraction | 80 (100.0%) | 0 (0.0%) |
| Construction | 238 (90.1%) | 26 (9.9%) |
| Manufacturing | 0 (0.0%) | 6 (100.0%) |
| Wholesale Trade | 29 (100.0%) | 0 (0.0%) |
| Retail Trade | 157 (74.1%) | 55 (25.9%) |
| Transportation & Warehousing | 39 (73.6%) | 14 (26.4%) |
| Utilities | 0 (0.0%) | 0 (0.0%) |
| Information | 0 (0.0%) | 0 (0.0%) |
| Finance & Insurance | 155 (80.3%) | 38 (19.7%) |
| Real Estate, Rental & Leasing | 145 (72.5%) | 55 (27.5%) |
| Professional & Scientific | 186 (87.7%) | 26 (12.3%) |
| Enterprise Management | 0 (0.0%) | 0 (0.0%) |
| Administrative & Support | 13 (24.5%) | 40 (75.5%) |
| Educational Services | 14 (5.4%) | 244 (94.6%) |
| Health Care & Social Assistance | 104 (53.3%) | 91 (46.7%) |
| Arts, Entertainment & Recreation | 119 (37.5%) | 198 (62.5%) |
| Accommodation & Food Services | 59 (50.0%) | 59 (50.0%) |
| Public Administration | 30 (36.6%) | 52 (63.4%) |
| Total | 1,395 (58.8%) | 977 (41.2%) |
Education in Midway
School Enrollment in Midway
The most common levels of schooling among the 1,421 students in Midway are high school (483 | 34.0%), middle school (306 | 21.5%), and elementary school (303 | 21.3%).
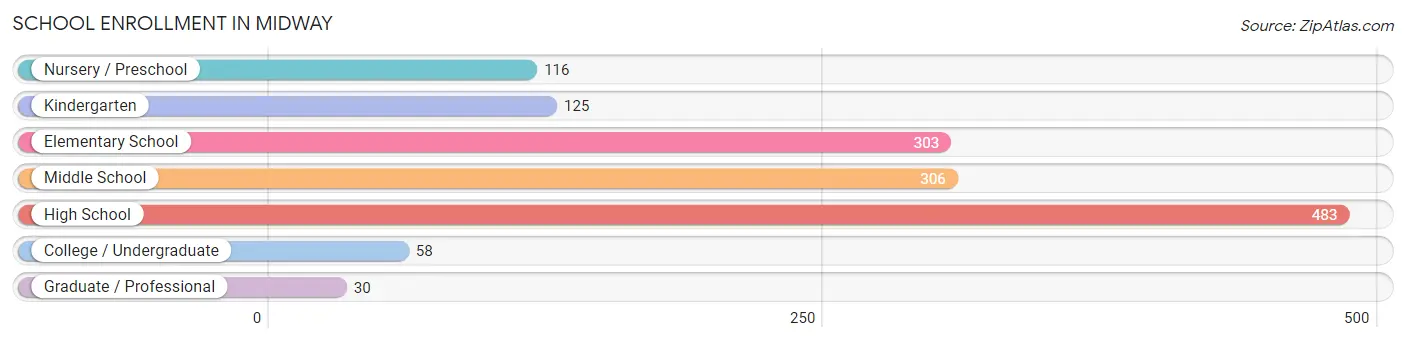
| School Level | # Students | % Students |
| Nursery / Preschool | 116 | 8.2% |
| Kindergarten | 125 | 8.8% |
| Elementary School | 303 | 21.3% |
| Middle School | 306 | 21.5% |
| High School | 483 | 34.0% |
| College / Undergraduate | 58 | 4.1% |
| Graduate / Professional | 30 | 2.1% |
| Total | 1,421 | 100.0% |
School Enrollment by Age by Funding Source in Midway
Out of a total of 1,421 students who are enrolled in schools in Midway, 196 (13.8%) attend a private institution, while the remaining 1,225 (86.2%) are enrolled in public schools. The age group of 3 to 4 year olds has the highest likelihood of being enrolled in private schools, with 107 (100.0% in the age bracket) enrolled. Conversely, the age group of 18 to 19 year olds has the lowest likelihood of being enrolled in a private school, with 36 (100.0% in the age bracket) attending a public institution.
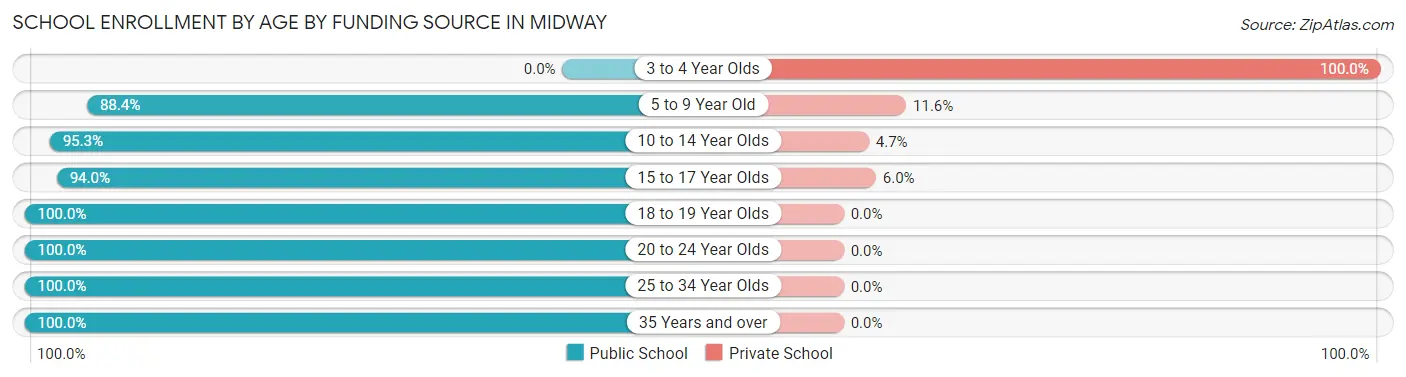
| Age Bracket | Public School | Private School |
| 3 to 4 Year Olds | 0 (0.0%) | 107 (100.0%) |
| 5 to 9 Year Old | 357 (88.4%) | 47 (11.6%) |
| 10 to 14 Year Olds | 406 (95.3%) | 20 (4.7%) |
| 15 to 17 Year Olds | 345 (94.0%) | 22 (6.0%) |
| 18 to 19 Year Olds | 36 (100.0%) | 0 (0.0%) |
| 20 to 24 Year Olds | 51 (100.0%) | 0 (0.0%) |
| 25 to 34 Year Olds | 15 (100.0%) | 0 (0.0%) |
| 35 Years and over | 15 (100.0%) | 0 (0.0%) |
| Total | 1,225 (86.2%) | 196 (13.8%) |
Educational Attainment by Field of Study in Midway
Business (525 | 21.9%), arts & humanities (252 | 10.5%), liberal arts & history (224 | 9.4%), social sciences (189 | 7.9%), and science & technology (183 | 7.6%) are the most common fields of study among 2,393 individuals in Midway who have obtained a bachelor's degree or higher.
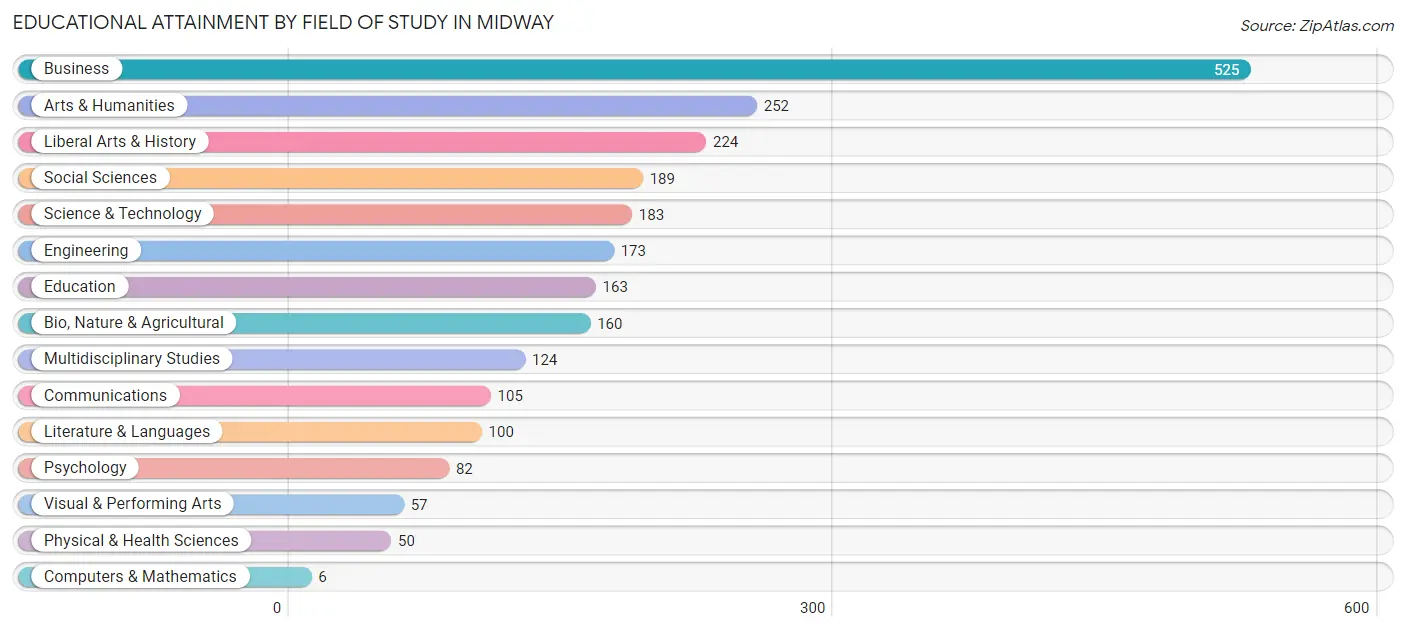
| Field of Study | # Graduates | % Graduates |
| Computers & Mathematics | 6 | 0.3% |
| Bio, Nature & Agricultural | 160 | 6.7% |
| Physical & Health Sciences | 50 | 2.1% |
| Psychology | 82 | 3.4% |
| Social Sciences | 189 | 7.9% |
| Engineering | 173 | 7.2% |
| Multidisciplinary Studies | 124 | 5.2% |
| Science & Technology | 183 | 7.6% |
| Business | 525 | 21.9% |
| Education | 163 | 6.8% |
| Literature & Languages | 100 | 4.2% |
| Liberal Arts & History | 224 | 9.4% |
| Visual & Performing Arts | 57 | 2.4% |
| Communications | 105 | 4.4% |
| Arts & Humanities | 252 | 10.5% |
| Total | 2,393 | 100.0% |
Transportation & Commute in Midway
Vehicle Availability by Sex in Midway
The most prevalent vehicle ownership categories in Midway are males with 2 vehicles (614, accounting for 44.0%) and females with 2 vehicles (399, making up 67.8%).
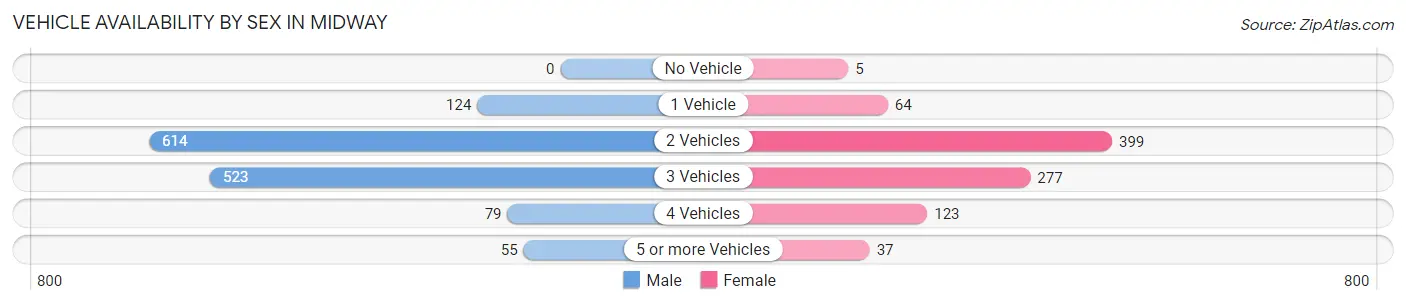
| Vehicles Available | Male | Female |
| No Vehicle | 0 (0.0%) | 5 (0.5%) |
| 1 Vehicle | 124 (8.9%) | 64 (7.1%) |
| 2 Vehicles | 614 (44.0%) | 399 (44.1%) |
| 3 Vehicles | 523 (37.5%) | 277 (30.6%) |
| 4 Vehicles | 79 (5.7%) | 123 (13.6%) |
| 5 or more Vehicles | 55 (3.9%) | 37 (4.1%) |
| Total | 1,395 (100.0%) | 905 (100.0%) |
Commute Time in Midway
The most frequently occuring commute durations in Midway are 30 to 34 minutes (402 commuters, 22.9%), 10 to 14 minutes (357 commuters, 20.3%), and 20 to 24 minutes (320 commuters, 18.2%).
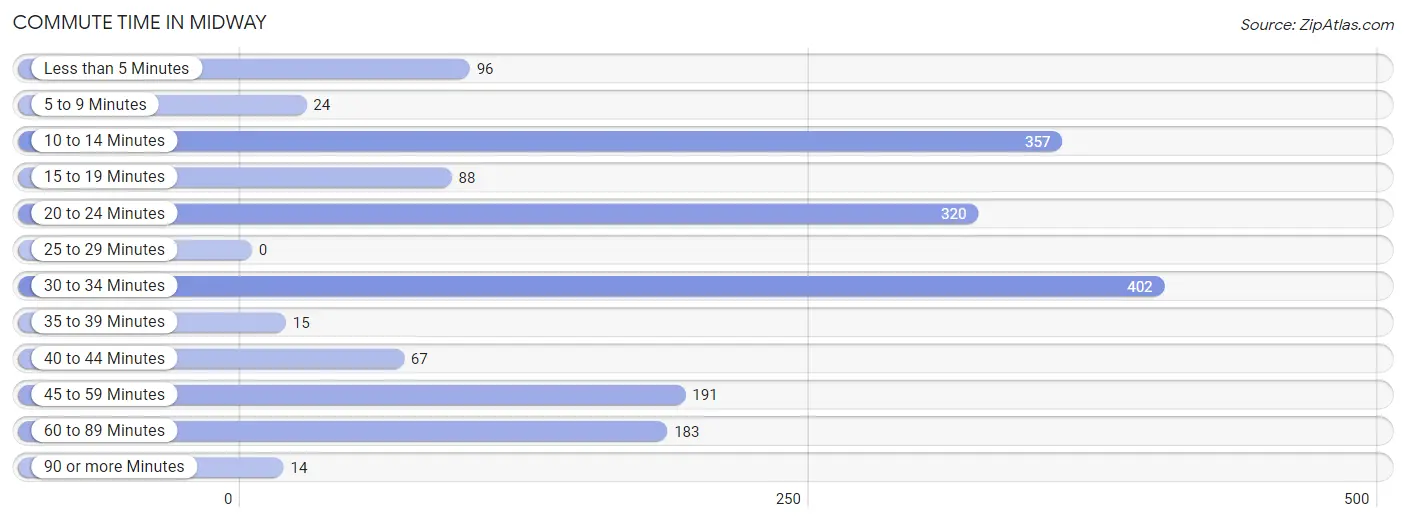
| Commute Time | # Commuters | % Commuters |
| Less than 5 Minutes | 96 | 5.5% |
| 5 to 9 Minutes | 24 | 1.4% |
| 10 to 14 Minutes | 357 | 20.3% |
| 15 to 19 Minutes | 88 | 5.0% |
| 20 to 24 Minutes | 320 | 18.2% |
| 25 to 29 Minutes | 0 | 0.0% |
| 30 to 34 Minutes | 402 | 22.9% |
| 35 to 39 Minutes | 15 | 0.9% |
| 40 to 44 Minutes | 67 | 3.8% |
| 45 to 59 Minutes | 191 | 10.9% |
| 60 to 89 Minutes | 183 | 10.4% |
| 90 or more Minutes | 14 | 0.8% |
Commute Time by Sex in Midway
The most common commute times in Midway are 30 to 34 minutes (282 commuters, 27.7%) for males and 10 to 14 minutes (224 commuters, 30.3%) for females.
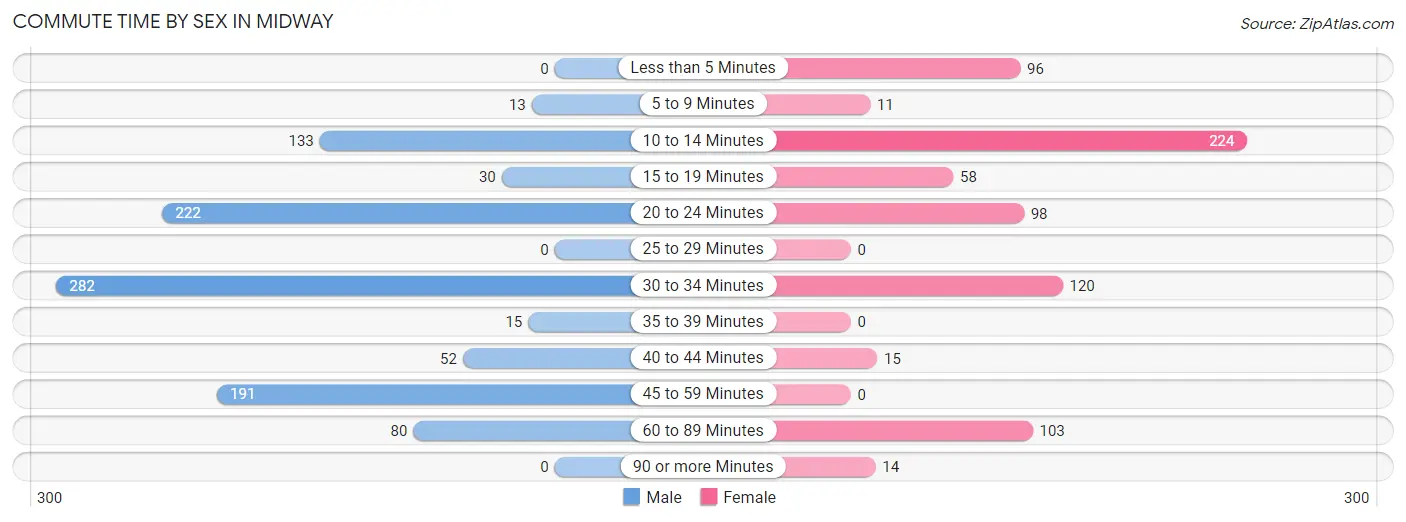
| Commute Time | Male | Female |
| Less than 5 Minutes | 0 (0.0%) | 96 (13.0%) |
| 5 to 9 Minutes | 13 (1.3%) | 11 (1.5%) |
| 10 to 14 Minutes | 133 (13.1%) | 224 (30.3%) |
| 15 to 19 Minutes | 30 (2.9%) | 58 (7.9%) |
| 20 to 24 Minutes | 222 (21.8%) | 98 (13.3%) |
| 25 to 29 Minutes | 0 (0.0%) | 0 (0.0%) |
| 30 to 34 Minutes | 282 (27.7%) | 120 (16.2%) |
| 35 to 39 Minutes | 15 (1.5%) | 0 (0.0%) |
| 40 to 44 Minutes | 52 (5.1%) | 15 (2.0%) |
| 45 to 59 Minutes | 191 (18.8%) | 0 (0.0%) |
| 60 to 89 Minutes | 80 (7.9%) | 103 (13.9%) |
| 90 or more Minutes | 0 (0.0%) | 14 (1.9%) |
Time of Departure to Work by Sex in Midway
The most frequent times of departure to work in Midway are 8:00 AM to 8:29 AM (367, 36.0%) for males and 7:30 AM to 7:59 AM (136, 18.4%) for females.
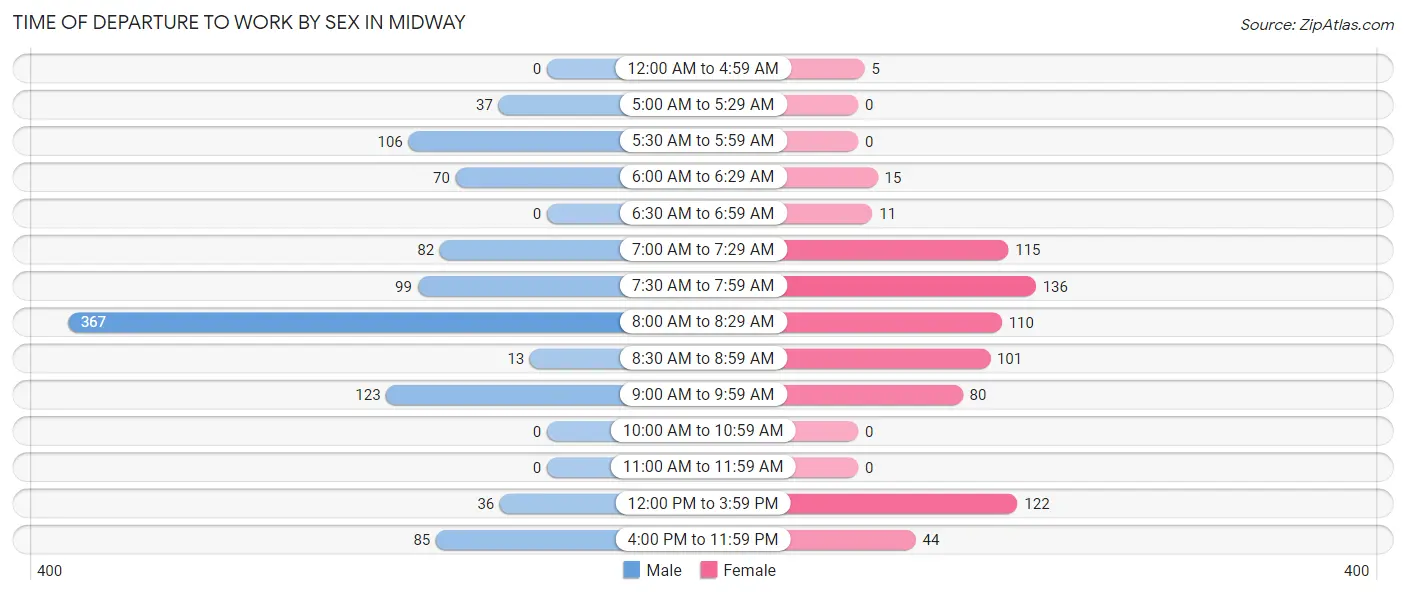
| Time of Departure | Male | Female |
| 12:00 AM to 4:59 AM | 0 (0.0%) | 5 (0.7%) |
| 5:00 AM to 5:29 AM | 37 (3.6%) | 0 (0.0%) |
| 5:30 AM to 5:59 AM | 106 (10.4%) | 0 (0.0%) |
| 6:00 AM to 6:29 AM | 70 (6.9%) | 15 (2.0%) |
| 6:30 AM to 6:59 AM | 0 (0.0%) | 11 (1.5%) |
| 7:00 AM to 7:29 AM | 82 (8.1%) | 115 (15.6%) |
| 7:30 AM to 7:59 AM | 99 (9.7%) | 136 (18.4%) |
| 8:00 AM to 8:29 AM | 367 (36.0%) | 110 (14.9%) |
| 8:30 AM to 8:59 AM | 13 (1.3%) | 101 (13.7%) |
| 9:00 AM to 9:59 AM | 123 (12.1%) | 80 (10.8%) |
| 10:00 AM to 10:59 AM | 0 (0.0%) | 0 (0.0%) |
| 11:00 AM to 11:59 AM | 0 (0.0%) | 0 (0.0%) |
| 12:00 PM to 3:59 PM | 36 (3.5%) | 122 (16.5%) |
| 4:00 PM to 11:59 PM | 85 (8.4%) | 44 (5.9%) |
| Total | 1,018 (100.0%) | 739 (100.0%) |
Housing Occupancy in Midway
Occupancy by Ownership in Midway
Of the total 2,122 dwellings in Midway, owner-occupied units account for 1,805 (85.1%), while renter-occupied units make up 317 (14.9%).
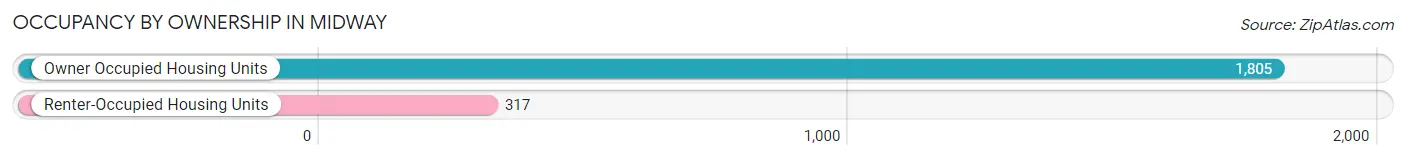
| Occupancy | # Housing Units | % Housing Units |
| Owner Occupied Housing Units | 1,805 | 85.1% |
| Renter-Occupied Housing Units | 317 | 14.9% |
| Total Occupied Housing Units | 2,122 | 100.0% |
Occupancy by Household Size in Midway
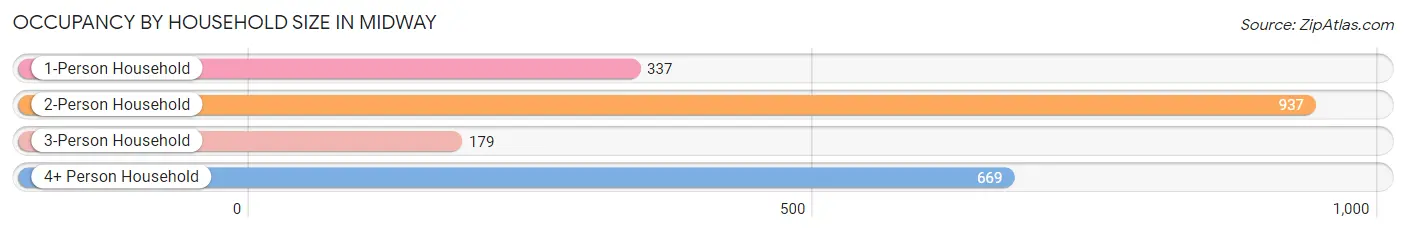
| Household Size | # Housing Units | % Housing Units |
| 1-Person Household | 337 | 15.9% |
| 2-Person Household | 937 | 44.2% |
| 3-Person Household | 179 | 8.4% |
| 4+ Person Household | 669 | 31.5% |
| Total Housing Units | 2,122 | 100.0% |
Occupancy by Ownership by Household Size in Midway
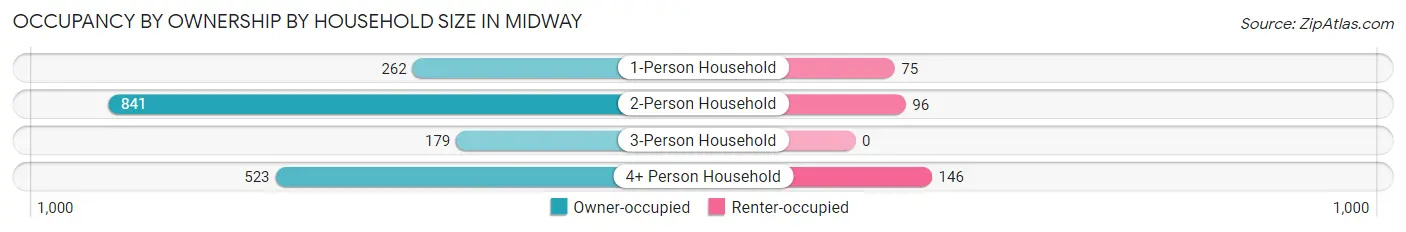
| Household Size | Owner-occupied | Renter-occupied |
| 1-Person Household | 262 (77.7%) | 75 (22.3%) |
| 2-Person Household | 841 (89.7%) | 96 (10.2%) |
| 3-Person Household | 179 (100.0%) | 0 (0.0%) |
| 4+ Person Household | 523 (78.2%) | 146 (21.8%) |
| Total Housing Units | 1,805 (85.1%) | 317 (14.9%) |
Occupancy by Educational Attainment in Midway
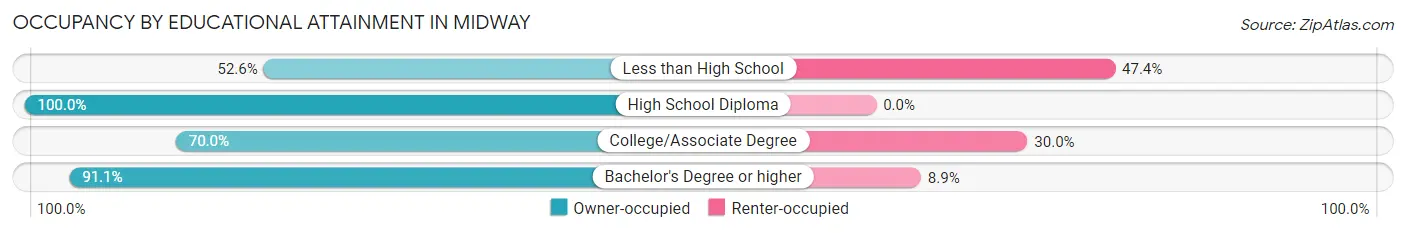
| Household Size | Owner-occupied | Renter-occupied |
| Less than High School | 40 (52.6%) | 36 (47.4%) |
| High School Diploma | 180 (100.0%) | 0 (0.0%) |
| College/Associate Degree | 383 (70.0%) | 164 (30.0%) |
| Bachelor's Degree or higher | 1,202 (91.1%) | 117 (8.9%) |
Occupancy by Age of Householder in Midway
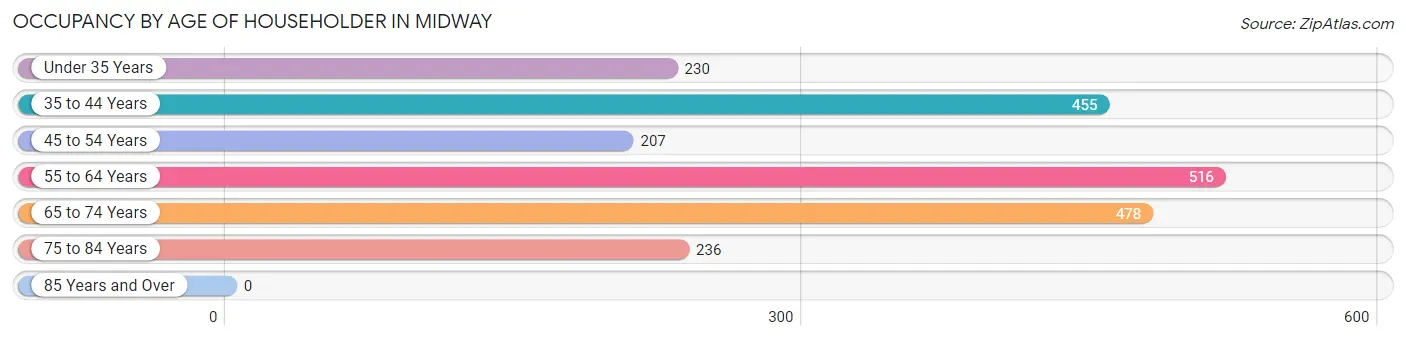
| Age Bracket | # Households | % Households |
| Under 35 Years | 230 | 10.8% |
| 35 to 44 Years | 455 | 21.4% |
| 45 to 54 Years | 207 | 9.8% |
| 55 to 64 Years | 516 | 24.3% |
| 65 to 74 Years | 478 | 22.5% |
| 75 to 84 Years | 236 | 11.1% |
| 85 Years and Over | 0 | 0.0% |
| Total | 2,122 | 100.0% |
Housing Finances in Midway
Median Income by Occupancy in Midway
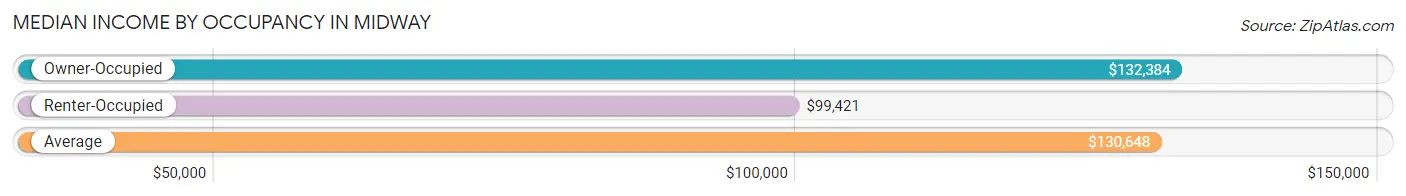
| Occupancy Type | # Households | Median Income |
| Owner-Occupied | 1,805 (85.1%) | $132,384 |
| Renter-Occupied | 317 (14.9%) | $99,421 |
| Average | 2,122 (100.0%) | $130,648 |
Occupancy by Householder Income Bracket in Midway
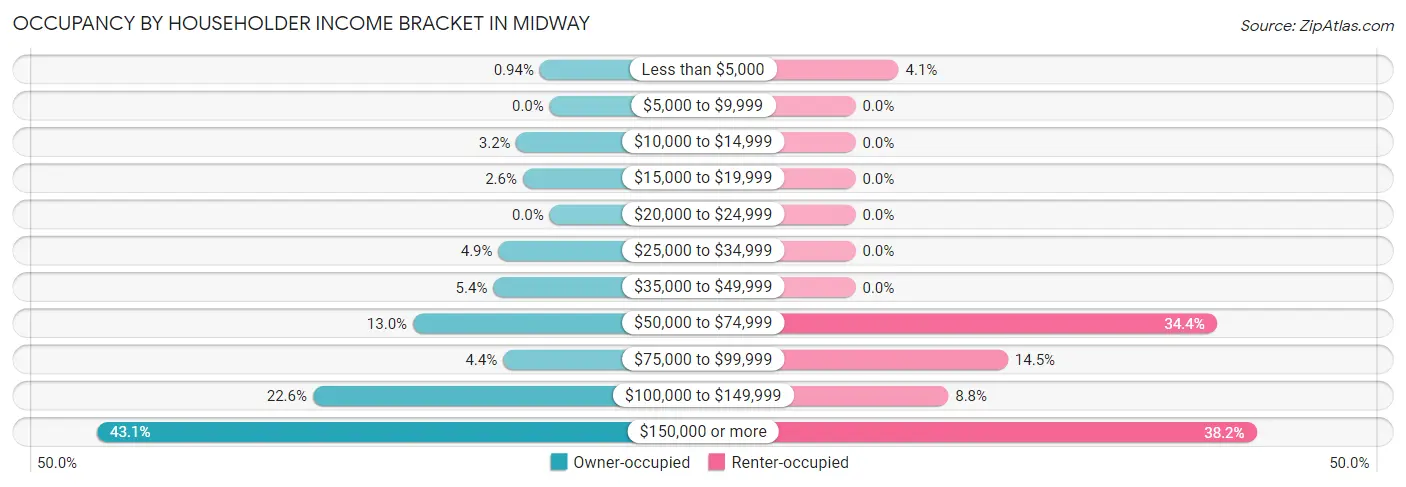
| Income Bracket | Owner-occupied | Renter-occupied |
| Less than $5,000 | 17 (0.9%) | 13 (4.1%) |
| $5,000 to $9,999 | 0 (0.0%) | 0 (0.0%) |
| $10,000 to $14,999 | 57 (3.2%) | 0 (0.0%) |
| $15,000 to $19,999 | 46 (2.5%) | 0 (0.0%) |
| $20,000 to $24,999 | 0 (0.0%) | 0 (0.0%) |
| $25,000 to $34,999 | 88 (4.9%) | 0 (0.0%) |
| $35,000 to $49,999 | 97 (5.4%) | 0 (0.0%) |
| $50,000 to $74,999 | 235 (13.0%) | 109 (34.4%) |
| $75,000 to $99,999 | 80 (4.4%) | 46 (14.5%) |
| $100,000 to $149,999 | 407 (22.6%) | 28 (8.8%) |
| $150,000 or more | 778 (43.1%) | 121 (38.2%) |
| Total | 1,805 (100.0%) | 317 (100.0%) |
Monthly Housing Cost Tiers in Midway
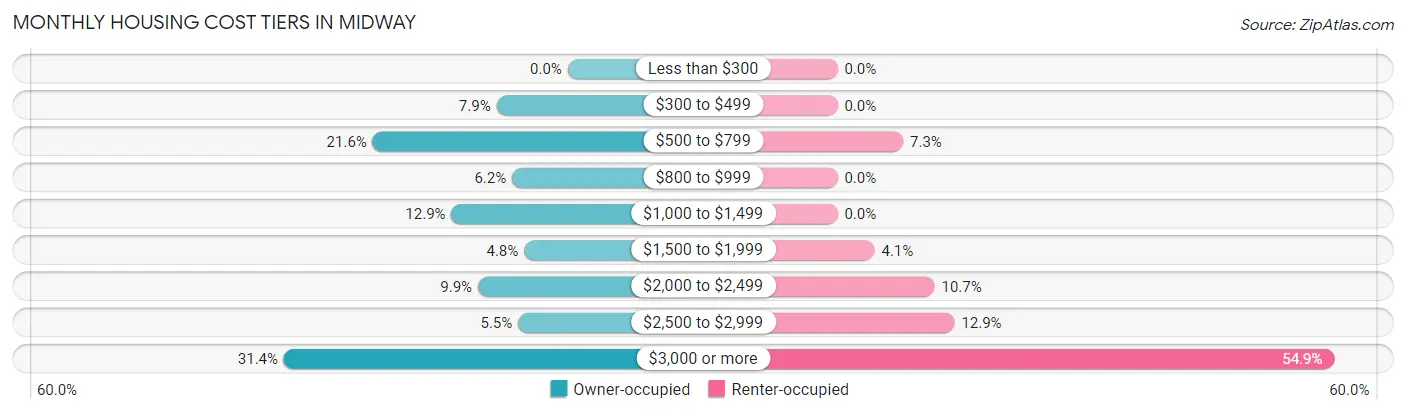
| Monthly Cost | Owner-occupied | Renter-occupied |
| Less than $300 | 0 (0.0%) | 0 (0.0%) |
| $300 to $499 | 142 (7.9%) | 0 (0.0%) |
| $500 to $799 | 389 (21.5%) | 23 (7.3%) |
| $800 to $999 | 111 (6.1%) | 0 (0.0%) |
| $1,000 to $1,499 | 232 (12.9%) | 0 (0.0%) |
| $1,500 to $1,999 | 87 (4.8%) | 13 (4.1%) |
| $2,000 to $2,499 | 179 (9.9%) | 34 (10.7%) |
| $2,500 to $2,999 | 99 (5.5%) | 41 (12.9%) |
| $3,000 or more | 566 (31.4%) | 174 (54.9%) |
| Total | 1,805 (100.0%) | 317 (100.0%) |
Physical Housing Characteristics in Midway
Housing Structures in Midway
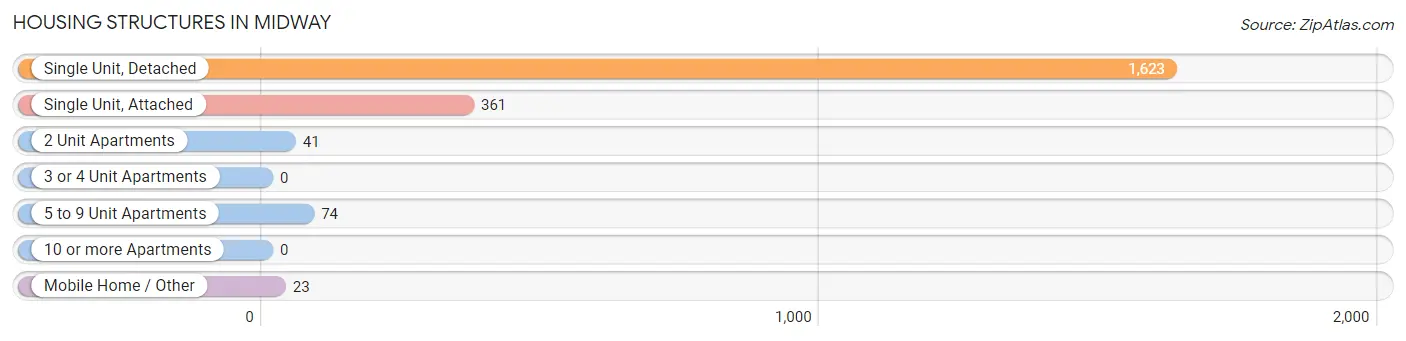
| Structure Type | # Housing Units | % Housing Units |
| Single Unit, Detached | 1,623 | 76.5% |
| Single Unit, Attached | 361 | 17.0% |
| 2 Unit Apartments | 41 | 1.9% |
| 3 or 4 Unit Apartments | 0 | 0.0% |
| 5 to 9 Unit Apartments | 74 | 3.5% |
| 10 or more Apartments | 0 | 0.0% |
| Mobile Home / Other | 23 | 1.1% |
| Total | 2,122 | 100.0% |
Housing Structures by Occupancy in Midway
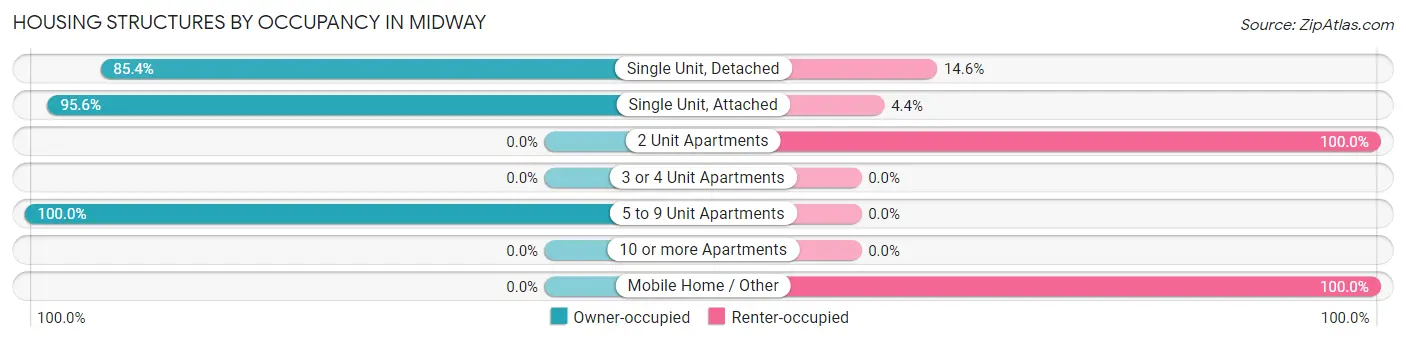
| Structure Type | Owner-occupied | Renter-occupied |
| Single Unit, Detached | 1,386 (85.4%) | 237 (14.6%) |
| Single Unit, Attached | 345 (95.6%) | 16 (4.4%) |
| 2 Unit Apartments | 0 (0.0%) | 41 (100.0%) |
| 3 or 4 Unit Apartments | 0 (0.0%) | 0 (0.0%) |
| 5 to 9 Unit Apartments | 74 (100.0%) | 0 (0.0%) |
| 10 or more Apartments | 0 (0.0%) | 0 (0.0%) |
| Mobile Home / Other | 0 (0.0%) | 23 (100.0%) |
| Total | 1,805 (85.1%) | 317 (14.9%) |
Housing Structures by Number of Rooms in Midway
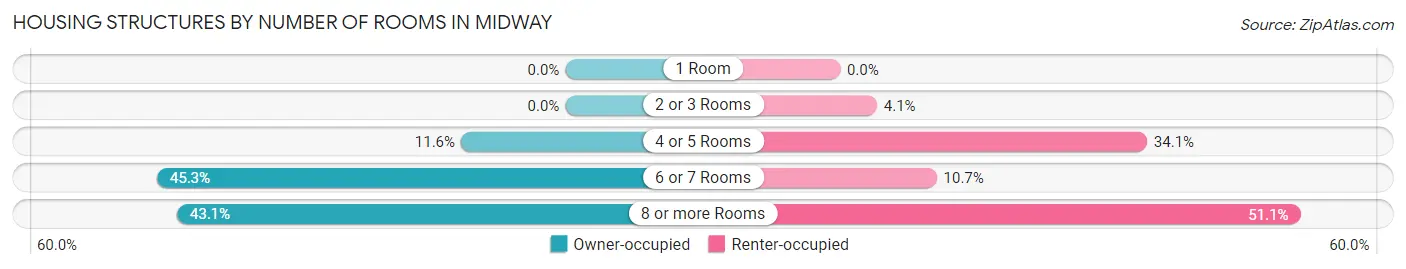
| Number of Rooms | Owner-occupied | Renter-occupied |
| 1 Room | 0 (0.0%) | 0 (0.0%) |
| 2 or 3 Rooms | 0 (0.0%) | 13 (4.1%) |
| 4 or 5 Rooms | 209 (11.6%) | 108 (34.1%) |
| 6 or 7 Rooms | 818 (45.3%) | 34 (10.7%) |
| 8 or more Rooms | 778 (43.1%) | 162 (51.1%) |
| Total | 1,805 (100.0%) | 317 (100.0%) |
Housing Structure by Heating Type in Midway
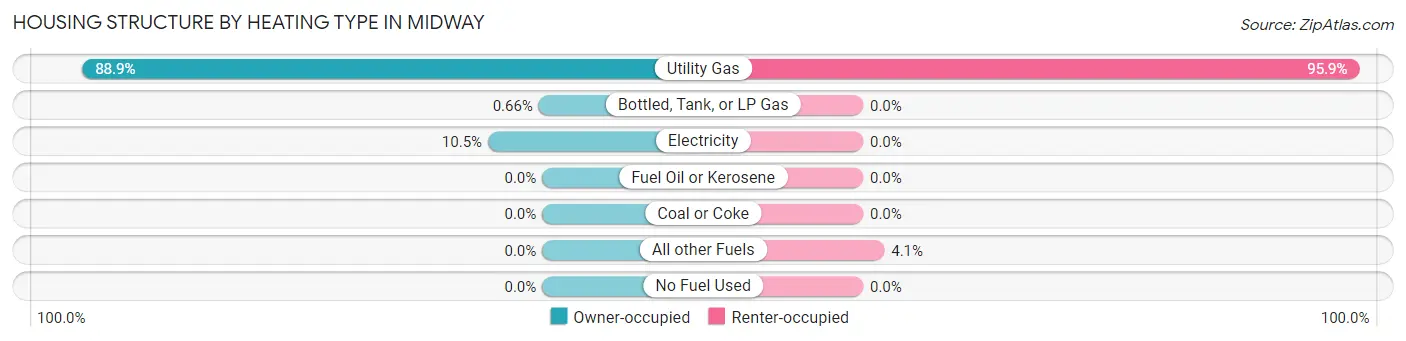
| Heating Type | Owner-occupied | Renter-occupied |
| Utility Gas | 1,604 (88.9%) | 304 (95.9%) |
| Bottled, Tank, or LP Gas | 12 (0.7%) | 0 (0.0%) |
| Electricity | 189 (10.5%) | 0 (0.0%) |
| Fuel Oil or Kerosene | 0 (0.0%) | 0 (0.0%) |
| Coal or Coke | 0 (0.0%) | 0 (0.0%) |
| All other Fuels | 0 (0.0%) | 13 (4.1%) |
| No Fuel Used | 0 (0.0%) | 0 (0.0%) |
| Total | 1,805 (100.0%) | 317 (100.0%) |
Household Vehicle Usage in Midway
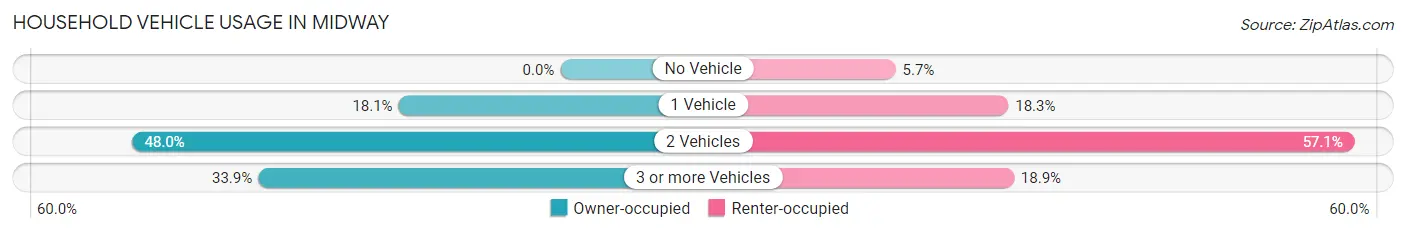
| Vehicles per Household | Owner-occupied | Renter-occupied |
| No Vehicle | 0 (0.0%) | 18 (5.7%) |
| 1 Vehicle | 327 (18.1%) | 58 (18.3%) |
| 2 Vehicles | 867 (48.0%) | 181 (57.1%) |
| 3 or more Vehicles | 611 (33.9%) | 60 (18.9%) |
| Total | 1,805 (100.0%) | 317 (100.0%) |
Real Estate & Mortgages in Midway
Real Estate and Mortgage Overview in Midway
| Characteristic | Without Mortgage | With Mortgage |
| Housing Units | 726 | 1,079 |
| Median Property Value | $728,400 | $837,900 |
| Median Household Income | $109,750 | $510 |
| Monthly Housing Costs | $642 | $566 |
| Real Estate Taxes | $3,730 | $0 |
Property Value by Mortgage Status in Midway
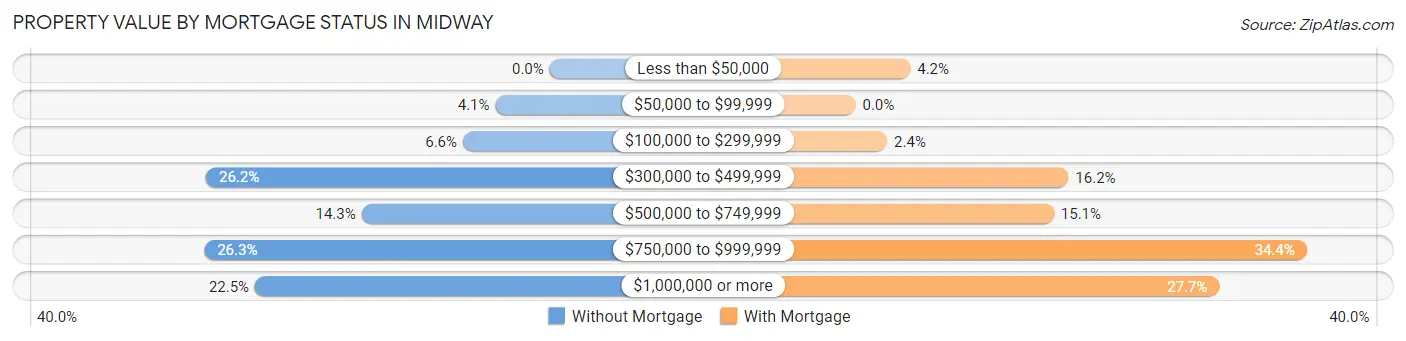
| Property Value | Without Mortgage | With Mortgage |
| Less than $50,000 | 0 (0.0%) | 45 (4.2%) |
| $50,000 to $99,999 | 30 (4.1%) | 0 (0.0%) |
| $100,000 to $299,999 | 48 (6.6%) | 26 (2.4%) |
| $300,000 to $499,999 | 190 (26.2%) | 175 (16.2%) |
| $500,000 to $749,999 | 104 (14.3%) | 163 (15.1%) |
| $750,000 to $999,999 | 191 (26.3%) | 371 (34.4%) |
| $1,000,000 or more | 163 (22.5%) | 299 (27.7%) |
| Total | 726 (100.0%) | 1,079 (100.0%) |
Household Income by Mortgage Status in Midway
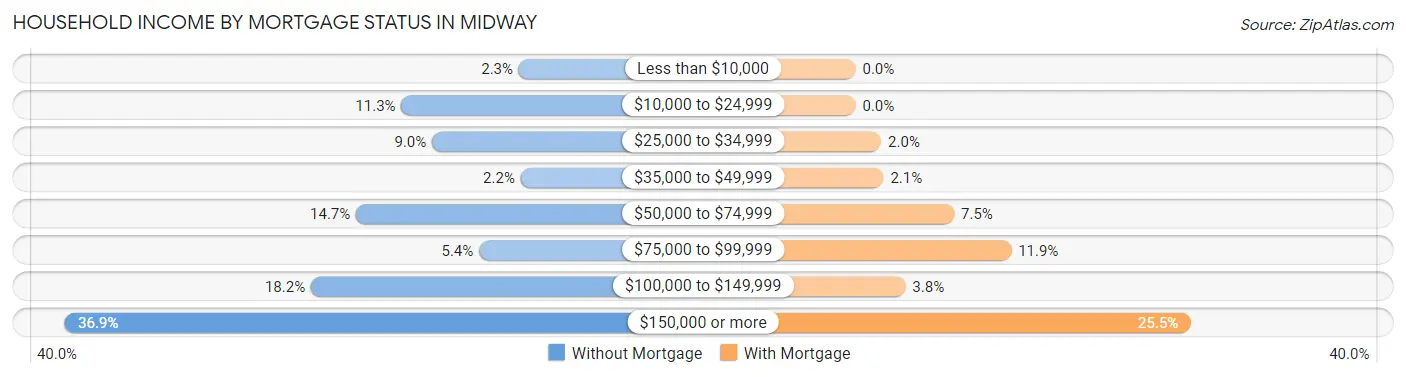
| Household Income | Without Mortgage | With Mortgage |
| Less than $10,000 | 17 (2.3%) | 0 (0.0%) |
| $10,000 to $24,999 | 82 (11.3%) | 0 (0.0%) |
| $25,000 to $34,999 | 65 (8.9%) | 21 (1.9%) |
| $35,000 to $49,999 | 16 (2.2%) | 23 (2.1%) |
| $50,000 to $74,999 | 107 (14.7%) | 81 (7.5%) |
| $75,000 to $99,999 | 39 (5.4%) | 128 (11.9%) |
| $100,000 to $149,999 | 132 (18.2%) | 41 (3.8%) |
| $150,000 or more | 268 (36.9%) | 275 (25.5%) |
| Total | 726 (100.0%) | 1,079 (100.0%) |
Property Value to Household Income Ratio in Midway
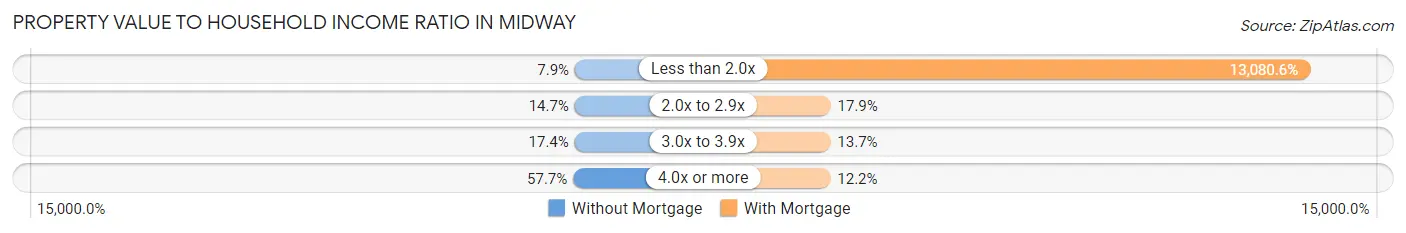
| Value-to-Income Ratio | Without Mortgage | With Mortgage |
| Less than 2.0x | 57 (7.9%) | 141,140 (13,080.6%) |
| 2.0x to 2.9x | 107 (14.7%) | 193 (17.9%) |
| 3.0x to 3.9x | 126 (17.4%) | 148 (13.7%) |
| 4.0x or more | 419 (57.7%) | 132 (12.2%) |
| Total | 726 (100.0%) | 1,079 (100.0%) |
Real Estate Taxes by Mortgage Status in Midway
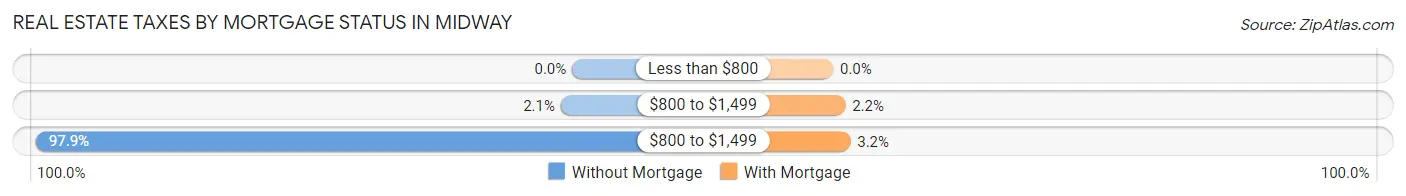
| Property Taxes | Without Mortgage | With Mortgage |
| Less than $800 | 0 (0.0%) | 0 (0.0%) |
| $800 to $1,499 | 15 (2.1%) | 24 (2.2%) |
| $800 to $1,499 | 711 (97.9%) | 34 (3.2%) |
| Total | 726 (100.0%) | 1,079 (100.0%) |
Health & Disability in Midway
Health Insurance Coverage by Age in Midway
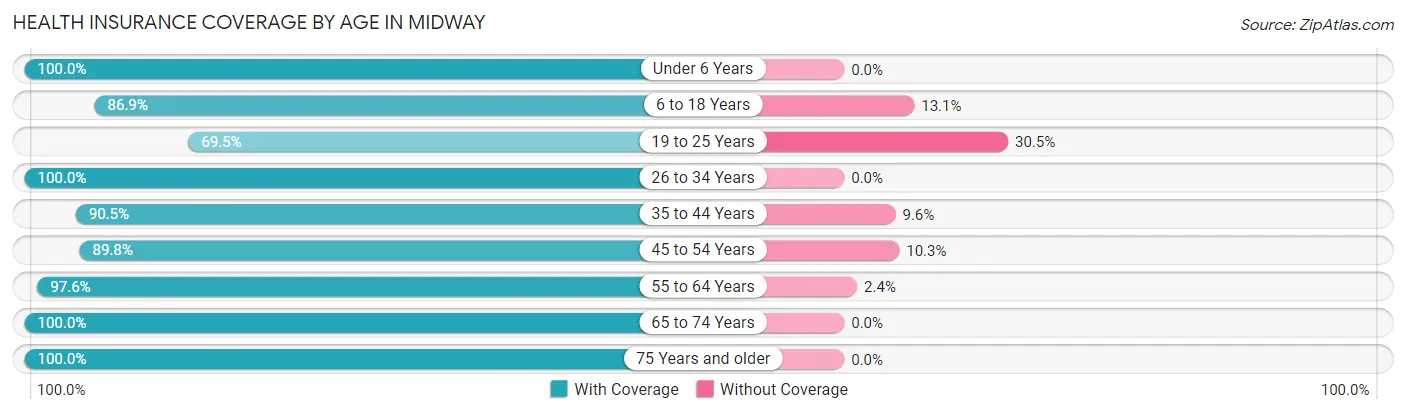
| Age Bracket | With Coverage | Without Coverage |
| Under 6 Years | 573 (100.0%) | 0 (0.0%) |
| 6 to 18 Years | 1,112 (86.9%) | 167 (13.1%) |
| 19 to 25 Years | 116 (69.5%) | 51 (30.5%) |
| 26 to 34 Years | 395 (100.0%) | 0 (0.0%) |
| 35 to 44 Years | 881 (90.4%) | 93 (9.6%) |
| 45 to 54 Years | 359 (89.7%) | 41 (10.2%) |
| 55 to 64 Years | 937 (97.6%) | 23 (2.4%) |
| 65 to 74 Years | 944 (100.0%) | 0 (0.0%) |
| 75 Years and older | 327 (100.0%) | 0 (0.0%) |
| Total | 5,644 (93.8%) | 375 (6.2%) |
Health Insurance Coverage by Citizenship Status in Midway
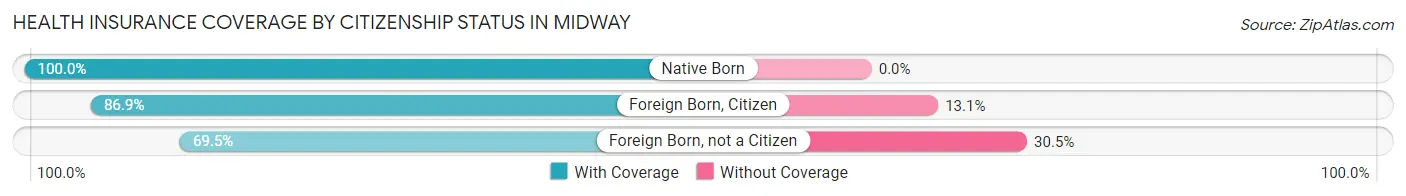
| Citizenship Status | With Coverage | Without Coverage |
| Native Born | 573 (100.0%) | 0 (0.0%) |
| Foreign Born, Citizen | 1,112 (86.9%) | 167 (13.1%) |
| Foreign Born, not a Citizen | 116 (69.5%) | 51 (30.5%) |
Health Insurance Coverage by Household Income in Midway
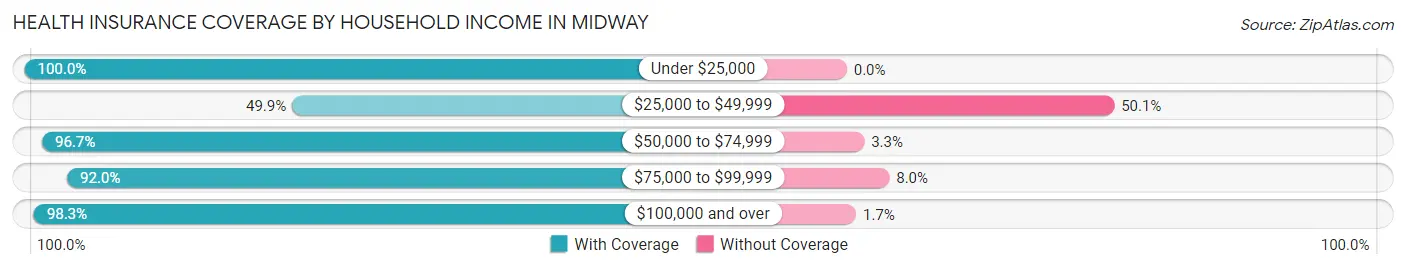
| Household Income | With Coverage | Without Coverage |
| Under $25,000 | 153 (100.0%) | 0 (0.0%) |
| $25,000 to $49,999 | 249 (49.9%) | 250 (50.1%) |
| $50,000 to $74,999 | 770 (96.7%) | 26 (3.3%) |
| $75,000 to $99,999 | 289 (92.0%) | 25 (8.0%) |
| $100,000 and over | 4,178 (98.3%) | 74 (1.7%) |
Public vs Private Health Insurance Coverage by Age in Midway
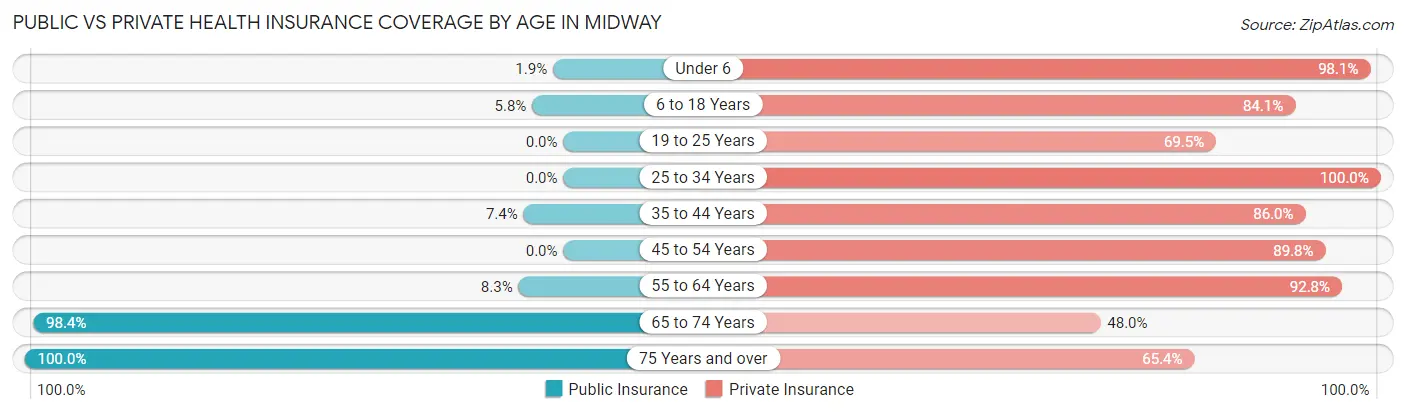
| Age Bracket | Public Insurance | Private Insurance |
| Under 6 | 11 (1.9%) | 562 (98.1%) |
| 6 to 18 Years | 74 (5.8%) | 1,076 (84.1%) |
| 19 to 25 Years | 0 (0.0%) | 116 (69.5%) |
| 25 to 34 Years | 0 (0.0%) | 395 (100.0%) |
| 35 to 44 Years | 72 (7.4%) | 838 (86.0%) |
| 45 to 54 Years | 0 (0.0%) | 359 (89.7%) |
| 55 to 64 Years | 80 (8.3%) | 891 (92.8%) |
| 65 to 74 Years | 929 (98.4%) | 453 (48.0%) |
| 75 Years and over | 327 (100.0%) | 214 (65.4%) |
| Total | 1,493 (24.8%) | 4,904 (81.5%) |
Disability Status by Sex by Age in Midway
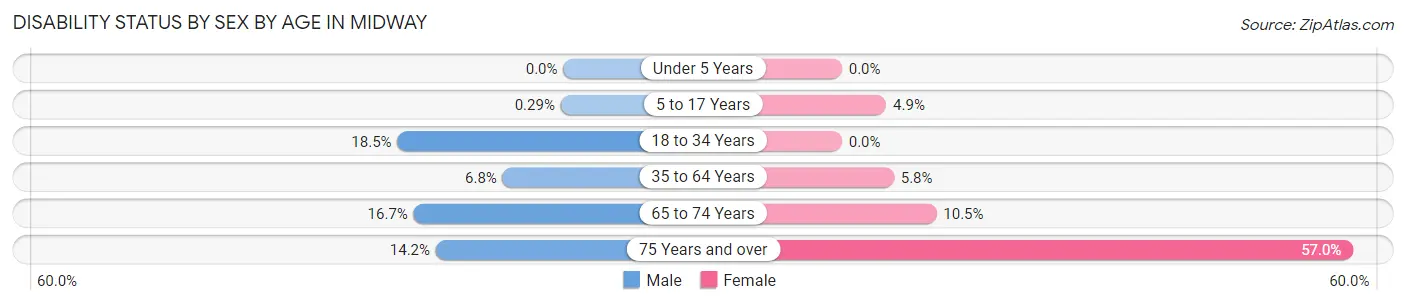
| Age Bracket | Male | Female |
| Under 5 Years | 0 (0.0%) | 0 (0.0%) |
| 5 to 17 Years | 2 (0.3%) | 30 (4.9%) |
| 18 to 34 Years | 51 (18.5%) | 0 (0.0%) |
| 35 to 64 Years | 76 (6.8%) | 70 (5.8%) |
| 65 to 74 Years | 75 (16.7%) | 52 (10.5%) |
| 75 Years and over | 25 (14.2%) | 86 (57.0%) |
Disability Class by Sex by Age in Midway
Disability Class: Hearing Difficulty
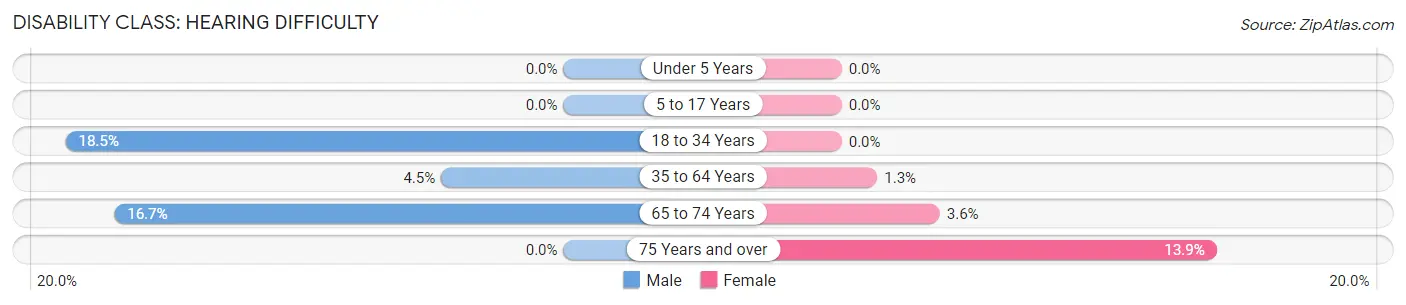
| Age Bracket | Male | Female |
| Under 5 Years | 0 (0.0%) | 0 (0.0%) |
| 5 to 17 Years | 0 (0.0%) | 0 (0.0%) |
| 18 to 34 Years | 51 (18.5%) | 0 (0.0%) |
| 35 to 64 Years | 51 (4.5%) | 16 (1.3%) |
| 65 to 74 Years | 75 (16.7%) | 18 (3.6%) |
| 75 Years and over | 0 (0.0%) | 21 (13.9%) |
Disability Class: Vision Difficulty
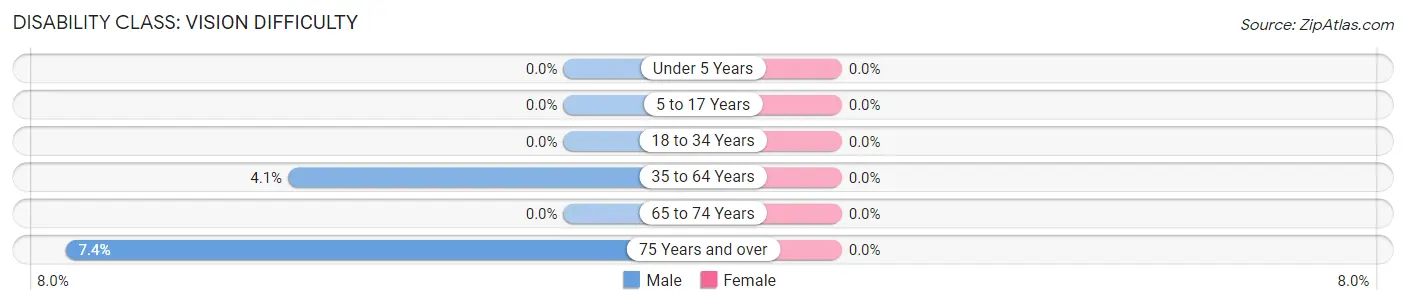
| Age Bracket | Male | Female |
| Under 5 Years | 0 (0.0%) | 0 (0.0%) |
| 5 to 17 Years | 0 (0.0%) | 0 (0.0%) |
| 18 to 34 Years | 0 (0.0%) | 0 (0.0%) |
| 35 to 64 Years | 46 (4.1%) | 0 (0.0%) |
| 65 to 74 Years | 0 (0.0%) | 0 (0.0%) |
| 75 Years and over | 13 (7.4%) | 0 (0.0%) |
Disability Class: Cognitive Difficulty
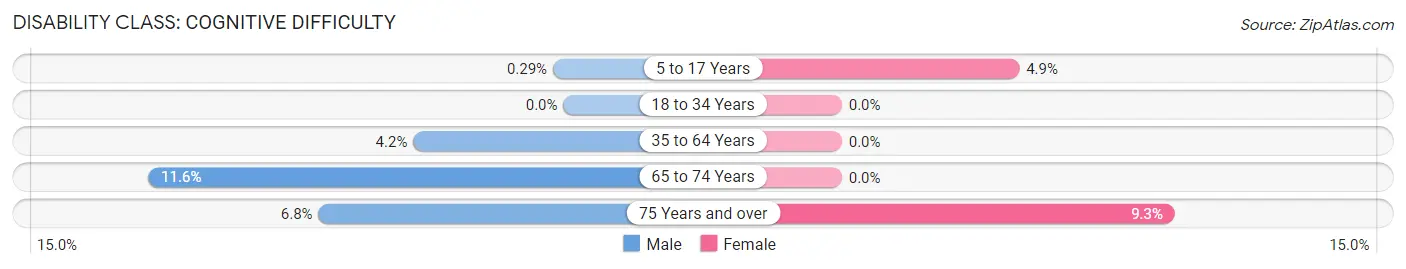
| Age Bracket | Male | Female |
| 5 to 17 Years | 2 (0.3%) | 30 (4.9%) |
| 18 to 34 Years | 0 (0.0%) | 0 (0.0%) |
| 35 to 64 Years | 47 (4.2%) | 0 (0.0%) |
| 65 to 74 Years | 52 (11.6%) | 0 (0.0%) |
| 75 Years and over | 12 (6.8%) | 14 (9.3%) |
Disability Class: Ambulatory Difficulty
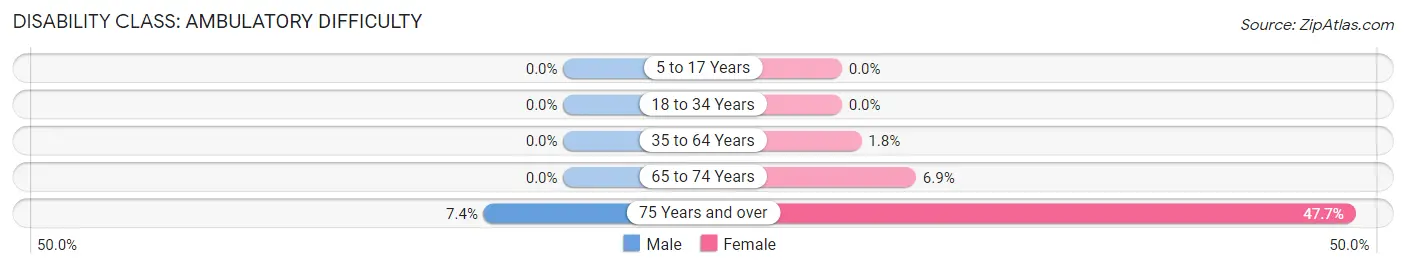
| Age Bracket | Male | Female |
| 5 to 17 Years | 0 (0.0%) | 0 (0.0%) |
| 18 to 34 Years | 0 (0.0%) | 0 (0.0%) |
| 35 to 64 Years | 0 (0.0%) | 22 (1.8%) |
| 65 to 74 Years | 0 (0.0%) | 34 (6.9%) |
| 75 Years and over | 13 (7.4%) | 72 (47.7%) |
Disability Class: Self-Care Difficulty
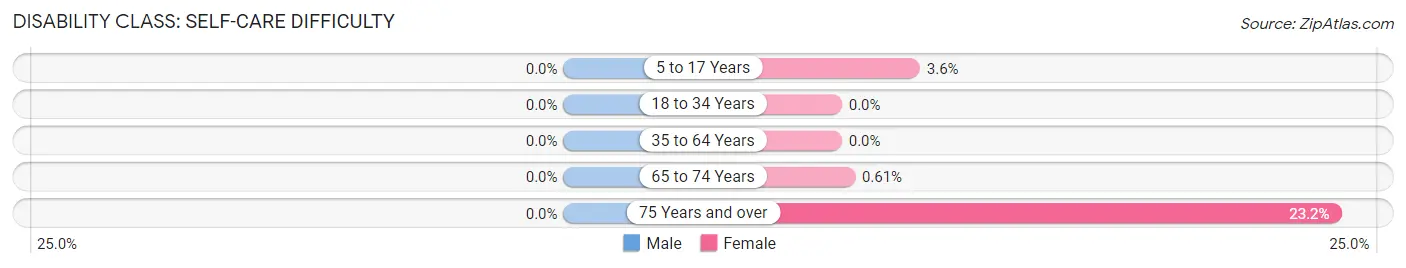
| Age Bracket | Male | Female |
| 5 to 17 Years | 0 (0.0%) | 22 (3.6%) |
| 18 to 34 Years | 0 (0.0%) | 0 (0.0%) |
| 35 to 64 Years | 0 (0.0%) | 0 (0.0%) |
| 65 to 74 Years | 0 (0.0%) | 3 (0.6%) |
| 75 Years and over | 0 (0.0%) | 35 (23.2%) |
Technology Access in Midway
Computing Device Access in Midway
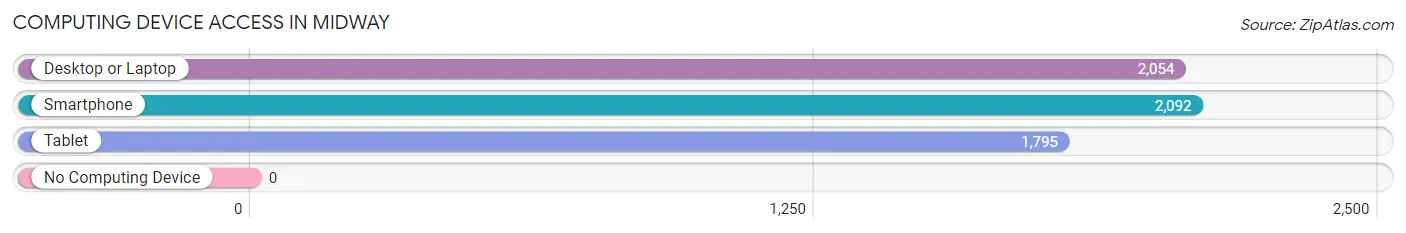
| Device Type | # Households | % Households |
| Desktop or Laptop | 2,054 | 96.8% |
| Smartphone | 2,092 | 98.6% |
| Tablet | 1,795 | 84.6% |
| No Computing Device | 0 | 0.0% |
| Total | 2,122 | 100.0% |
Internet Access in Midway
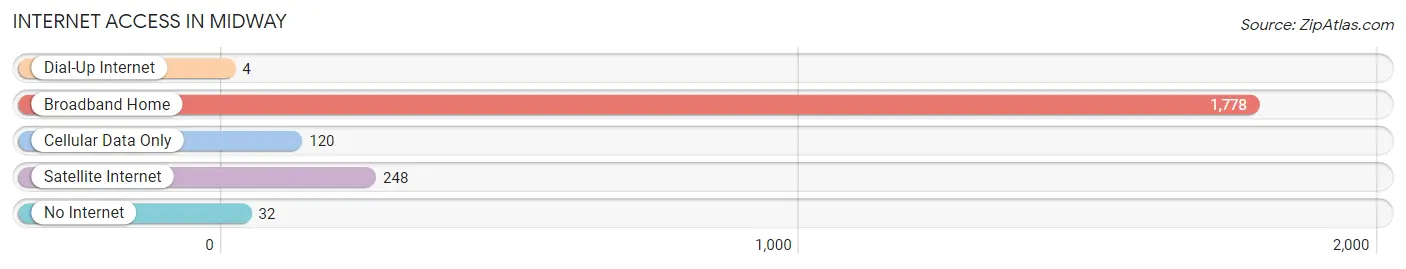
| Internet Type | # Households | % Households |
| Dial-Up Internet | 4 | 0.2% |
| Broadband Home | 1,778 | 83.8% |
| Cellular Data Only | 120 | 5.7% |
| Satellite Internet | 248 | 11.7% |
| No Internet | 32 | 1.5% |
| Total | 2,122 | 100.0% |
Midway Summary
Midway, Utah is a small city located in Wasatch County, Utah. It is situated in the Heber Valley, about 30 miles southeast of Salt Lake City. The city is known for its picturesque mountain views, historic sites, and recreational activities.
History
Midway was first settled in 1859 by a group of Mormon pioneers led by John S. Higbee. The pioneers named the settlement after the nearby Midway Creek, which was named for its location halfway between Salt Lake City and Heber City. The settlers built a fort and a sawmill, and the area quickly grew into a thriving community.
In 1867, the town was officially incorporated as Midway City. The city was a popular stop for travelers on the stagecoach line between Salt Lake City and Heber City. The city also became a popular destination for tourists, who came to enjoy the area’s natural beauty and recreational activities.
In the late 19th century, Midway became known for its hot springs, which were believed to have healing properties. The hot springs were a popular destination for visitors from all over the world.
In the early 20th century, Midway became a popular destination for skiers. The city was home to the first ski resort in Utah, the Homestead Resort, which opened in 1936. The resort was a popular destination for skiers from all over the world.
Geography
Midway is located in the Heber Valley, about 30 miles southeast of Salt Lake City. The city is situated at an elevation of 5,400 feet, and is surrounded by the Wasatch Mountains. The city is located in a valley, and is bordered by the Provo River to the north and the Jordan River to the south.
The city has a total area of 4.3 square miles, of which 4.2 square miles is land and 0.1 square miles is water. The city is home to several parks, including the Homestead Resort, which is located on the banks of the Provo River.
Economy
Midway’s economy is largely based on tourism and recreation. The city is home to several resorts, including the Homestead Resort, which is a popular destination for skiers. The city is also home to several restaurants, shops, and other businesses that cater to tourists.
The city is also home to several manufacturing companies, including a furniture factory and a plastics factory. The city is also home to several farms, which produce hay, alfalfa, and other crops.
Demographics
As of the 2010 census, Midway had a population of 2,125. The racial makeup of the city was 94.3% White, 0.3% African American, 0.3% Native American, 0.7% Asian, 0.1% Pacific Islander, 2.2% from other races, and 2.3% from two or more races. Hispanic or Latino of any race were 4.7% of the population.
The median income for a household in Midway was $50,938, and the median income for a family was $54,844. The per capita income for the city was $22,945. About 6.3% of families and 8.2% of the population were below the poverty line, including 10.2% of those under age 18 and 4.2% of those age 65 or over.
Common Questions
What is Per Capita Income in Midway?
Per Capita income in Midway is $70,174.
What is the Median Family Income in Midway?
Median Family Income in Midway is $153,072.
What is the Median Household income in Midway?
Median Household Income in Midway is $130,648.
What is Income or Wage Gap in Midway?
Income or Wage Gap in Midway is 88.2%.
Women in Midway earn 11.8 cents for every dollar earned by a man.
What is Inequality or Gini Index in Midway?
Inequality or Gini Index in Midway is 0.49.
What is the Total Population of Midway?
Total Population of Midway is 6,019.
What is the Total Male Population of Midway?
Total Male Population of Midway is 2,981.
What is the Total Female Population of Midway?
Total Female Population of Midway is 3,038.
What is the Ratio of Males per 100 Females in Midway?
There are 98.12 Males per 100 Females in Midway.
What is the Ratio of Females per 100 Males in Midway?
There are 101.91 Females per 100 Males in Midway.
What is the Median Population Age in Midway?
Median Population Age in Midway is 41.2 Years.
What is the Average Family Size in Midway
Average Family Size in Midway is 3.1 People.
What is the Average Household Size in Midway
Average Household Size in Midway is 2.8 People.
How Large is the Labor Force in Midway?
There are 2,481 People in the Labor Forcein in Midway.
What is the Percentage of People in the Labor Force in Midway?
54.8% of People are in the Labor Force in Midway.
What is the Unemployment Rate in Midway?
Unemployment Rate in Midway is 4.4%.