Glenwood, UT Map & Demographics
Glenwood Map
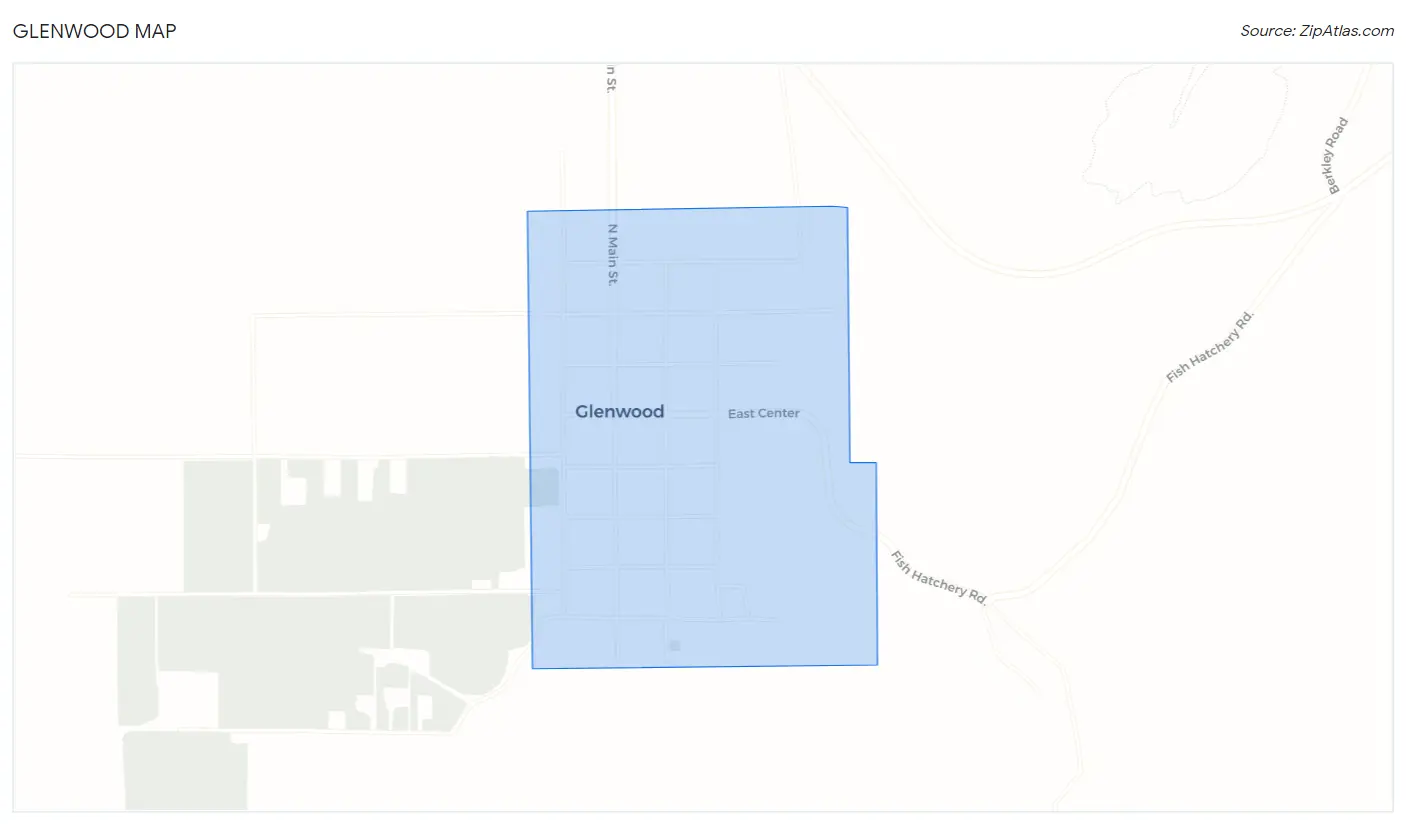
Glenwood Overview
$38,812
PER CAPITA INCOME
$107,500
AVG FAMILY INCOME
$87,500
AVG HOUSEHOLD INCOME
66.7%
WAGE / INCOME GAP [ % ]
33.3¢/ $1
WAGE / INCOME GAP [ $ ]
0.35
INEQUALITY / GINI INDEX
608
TOTAL POPULATION
299
MALE POPULATION
309
FEMALE POPULATION
96.76
MALES / 100 FEMALES
103.34
FEMALES / 100 MALES
43.5
MEDIAN AGE
3.1
AVG FAMILY SIZE
2.9
AVG HOUSEHOLD SIZE
263
LABOR FORCE [ PEOPLE ]
59.0%
PERCENT IN LABOR FORCE
0.8%
UNEMPLOYMENT RATE
Glenwood Zip Codes
Glenwood Area Codes
Income in Glenwood
Income Overview in Glenwood
Per Capita Income in Glenwood is $38,812, while median incomes of families and households are $107,500 and $87,500 respectively.
| Characteristic | Number | Measure |
| Per Capita Income | 608 | $38,812 |
| Median Family Income | 174 | $107,500 |
| Mean Family Income | 174 | $122,619 |
| Median Household Income | 208 | $87,500 |
| Mean Household Income | 208 | $109,538 |
| Income Deficit | 174 | $0 |
| Wage / Income Gap (%) | 608 | 66.66% |
| Wage / Income Gap ($) | 608 | 33.34¢ per $1 |
| Gini / Inequality Index | 608 | 0.35 |
Earnings by Sex in Glenwood
Average Earnings in Glenwood are $48,194, $63,370 for men and $21,125 for women, a difference of 66.7%.
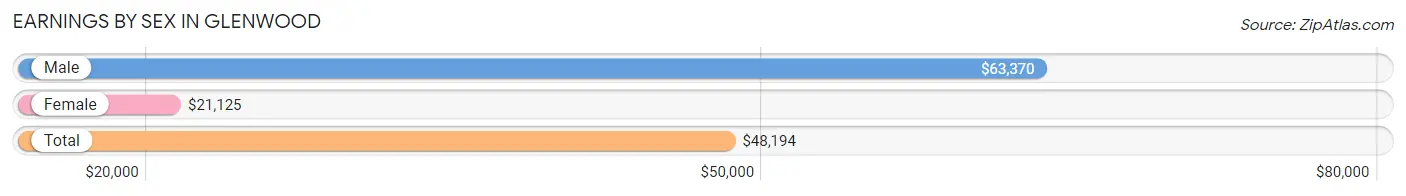
| Sex | Number | Average Earnings |
| Male | 180 (62.3%) | $63,370 |
| Female | 109 (37.7%) | $21,125 |
| Total | 289 (100.0%) | $48,194 |
Earnings by Sex by Income Bracket in Glenwood
The most common earnings brackets in Glenwood are $100,000+ for men (53 | 29.4%) and $2,499 or less for women (18 | 16.5%).
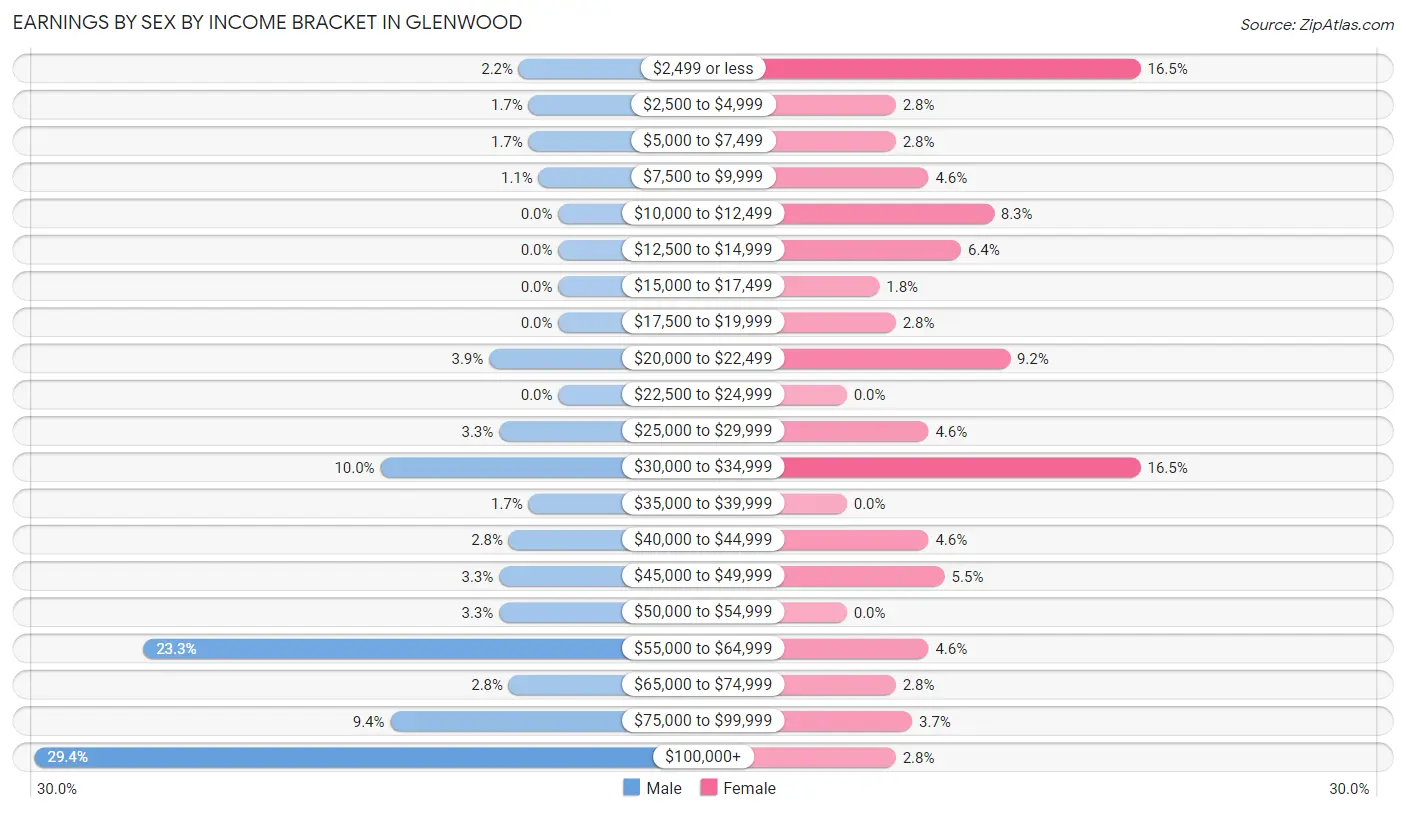
| Income | Male | Female |
| $2,499 or less | 4 (2.2%) | 18 (16.5%) |
| $2,500 to $4,999 | 3 (1.7%) | 3 (2.8%) |
| $5,000 to $7,499 | 3 (1.7%) | 3 (2.8%) |
| $7,500 to $9,999 | 2 (1.1%) | 5 (4.6%) |
| $10,000 to $12,499 | 0 (0.0%) | 9 (8.3%) |
| $12,500 to $14,999 | 0 (0.0%) | 7 (6.4%) |
| $15,000 to $17,499 | 0 (0.0%) | 2 (1.8%) |
| $17,500 to $19,999 | 0 (0.0%) | 3 (2.8%) |
| $20,000 to $22,499 | 7 (3.9%) | 10 (9.2%) |
| $22,500 to $24,999 | 0 (0.0%) | 0 (0.0%) |
| $25,000 to $29,999 | 6 (3.3%) | 5 (4.6%) |
| $30,000 to $34,999 | 18 (10.0%) | 18 (16.5%) |
| $35,000 to $39,999 | 3 (1.7%) | 0 (0.0%) |
| $40,000 to $44,999 | 5 (2.8%) | 5 (4.6%) |
| $45,000 to $49,999 | 6 (3.3%) | 6 (5.5%) |
| $50,000 to $54,999 | 6 (3.3%) | 0 (0.0%) |
| $55,000 to $64,999 | 42 (23.3%) | 5 (4.6%) |
| $65,000 to $74,999 | 5 (2.8%) | 3 (2.8%) |
| $75,000 to $99,999 | 17 (9.4%) | 4 (3.7%) |
| $100,000+ | 53 (29.4%) | 3 (2.8%) |
| Total | 180 (100.0%) | 109 (100.0%) |
Earnings by Sex by Educational Attainment in Glenwood
Average earnings in Glenwood are $64,130 for men and $21,719 for women, a difference of 66.1%. Men with an educational attainment of graduate degree enjoy the highest average annual earnings of $116,189, while those with less than high school education earn the least with $20,893. Women with an educational attainment of graduate degree earn the most with the average annual earnings of $78,750, while those with bachelor's degree education have the smallest earnings of $2,499.
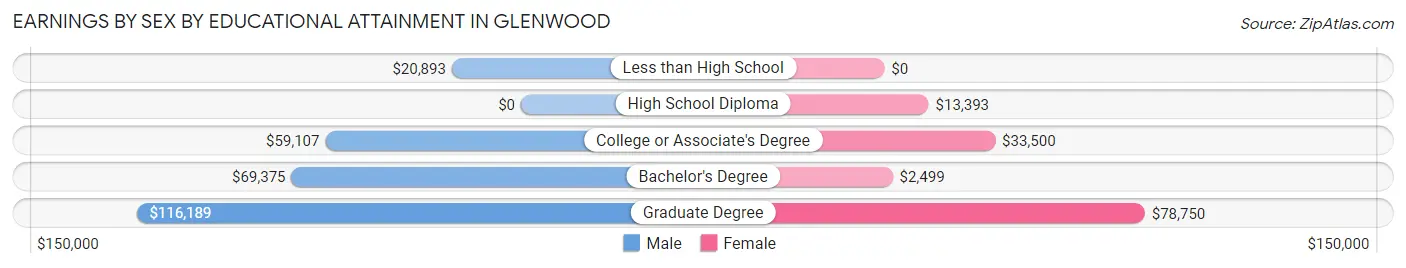
| Educational Attainment | Male Income | Female Income |
| Less than High School | $20,893 | $0 |
| High School Diploma | - | - |
| College or Associate's Degree | $59,107 | $33,500 |
| Bachelor's Degree | $69,375 | $2,499 |
| Graduate Degree | $116,189 | $78,750 |
| Total | $64,130 | $21,719 |
Family Income in Glenwood
Family Income Brackets in Glenwood
According to the Glenwood family income data, there are 48 families falling into the $200,000+ income range, which is the most common income bracket and makes up 27.6% of all families.
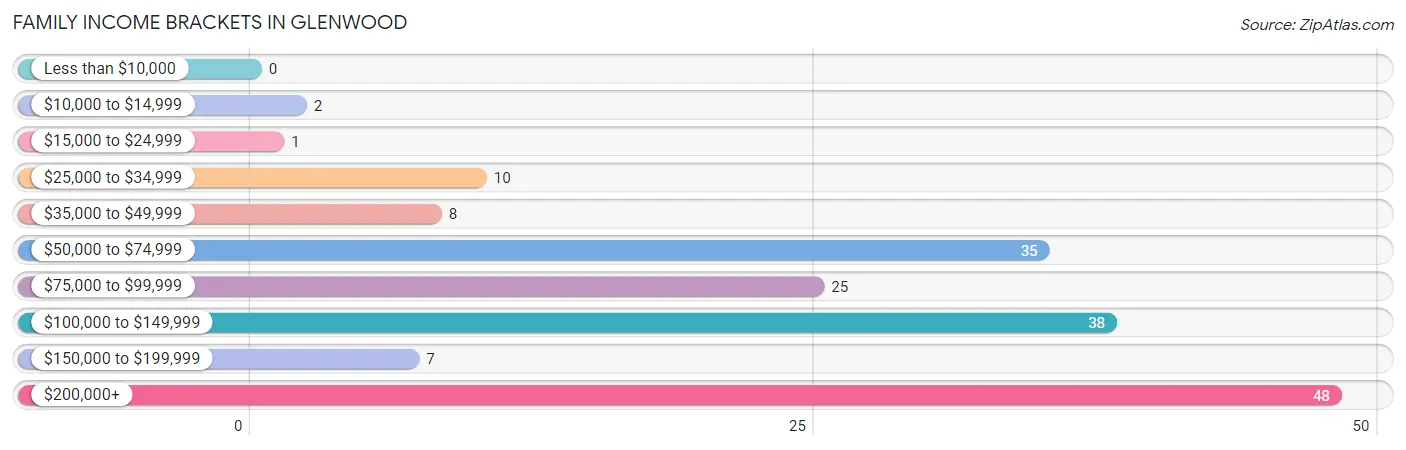
| Income Bracket | # Families | % Families |
| Less than $10,000 | 0 | 0.0% |
| $10,000 to $14,999 | 2 | 1.1% |
| $15,000 to $24,999 | 1 | 0.6% |
| $25,000 to $34,999 | 10 | 5.7% |
| $35,000 to $49,999 | 8 | 4.6% |
| $50,000 to $74,999 | 35 | 20.1% |
| $75,000 to $99,999 | 25 | 14.4% |
| $100,000 to $149,999 | 38 | 21.8% |
| $150,000 to $199,999 | 7 | 4.0% |
| $200,000+ | 48 | 27.6% |
Family Income by Famaliy Size in Glenwood
4-person families (7 | 4.0%) account for the highest median family income in Glenwood with $193,750 per family, while 2-person families (113 | 64.9%) have the highest median income of $61,094 per family member.
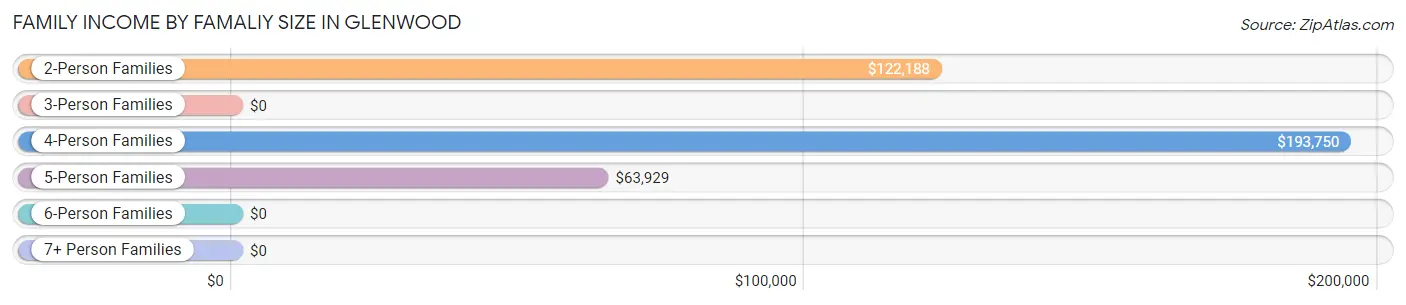
| Income Bracket | # Families | Median Income |
| 2-Person Families | 113 (64.9%) | $122,188 |
| 3-Person Families | 17 (9.8%) | $0 |
| 4-Person Families | 7 (4.0%) | $193,750 |
| 5-Person Families | 32 (18.4%) | $63,929 |
| 6-Person Families | 4 (2.3%) | $0 |
| 7+ Person Families | 1 (0.6%) | $0 |
| Total | 174 (100.0%) | $107,500 |
Family Income by Number of Earners in Glenwood
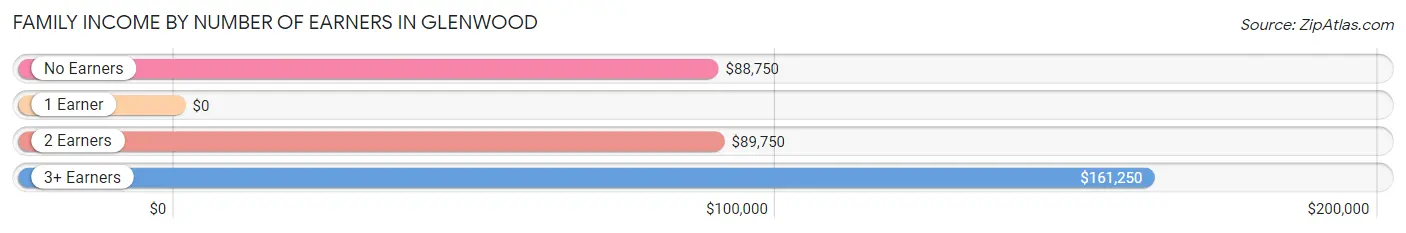
| Number of Earners | # Families | Median Income |
| No Earners | 17 (9.8%) | $88,750 |
| 1 Earner | 84 (48.3%) | $0 |
| 2 Earners | 65 (37.4%) | $89,750 |
| 3+ Earners | 8 (4.6%) | $161,250 |
| Total | 174 (100.0%) | $107,500 |
Household Income in Glenwood
Household Income Brackets in Glenwood
With 48 households falling in the category, the $200,000+ income range is the most frequent in Glenwood, accounting for 23.1% of all households.
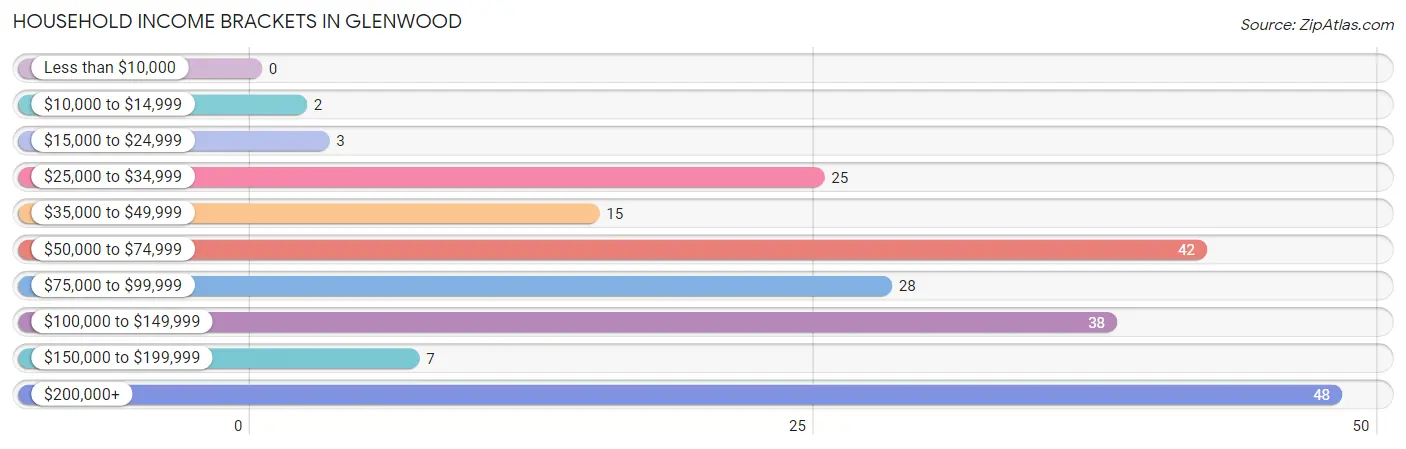
| Income Bracket | # Households | % Households |
| Less than $10,000 | 0 | 0.0% |
| $10,000 to $14,999 | 2 | 1.0% |
| $15,000 to $24,999 | 3 | 1.4% |
| $25,000 to $34,999 | 25 | 12.0% |
| $35,000 to $49,999 | 15 | 7.2% |
| $50,000 to $74,999 | 42 | 20.2% |
| $75,000 to $99,999 | 28 | 13.5% |
| $100,000 to $149,999 | 38 | 18.3% |
| $150,000 to $199,999 | 7 | 3.4% |
| $200,000+ | 48 | 23.1% |
Household Income by Householder Age in Glenwood
The median household income in Glenwood is $87,500, with the highest median household income of $102,500 found in the 45 to 64 years age bracket for the primary householder. A total of 58 households (27.9%) fall into this category. Meanwhile, the 65+ years age bracket for the primary householder has the lowest median household income of $0, with 96 households (46.2%) in this group.
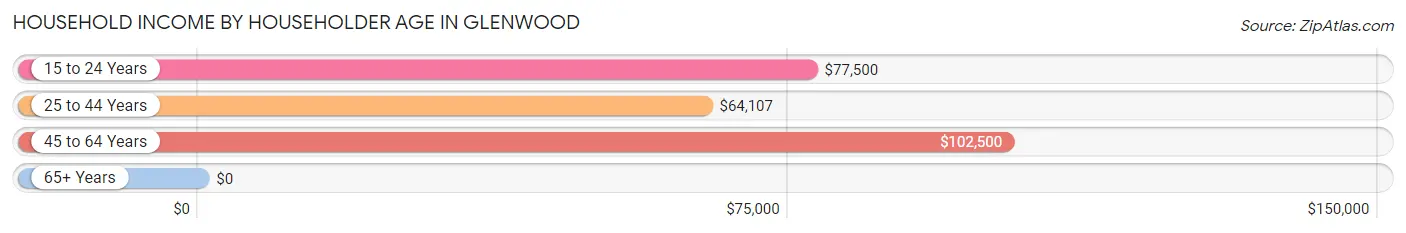
| Income Bracket | # Households | Median Income |
| 15 to 24 Years | 4 (1.9%) | $77,500 |
| 25 to 44 Years | 50 (24.0%) | $64,107 |
| 45 to 64 Years | 58 (27.9%) | $102,500 |
| 65+ Years | 96 (46.2%) | $0 |
| Total | 208 (100.0%) | $87,500 |
Poverty in Glenwood
Income Below Poverty by Sex and Age in Glenwood
With 2.1% poverty level for males and 3.6% for females among the residents of Glenwood, 55 to 64 year old males and 35 to 44 year old females are the most vulnerable to poverty, with 6 males (19.4%) and 8 females (19.5%) in their respective age groups living below the poverty level.
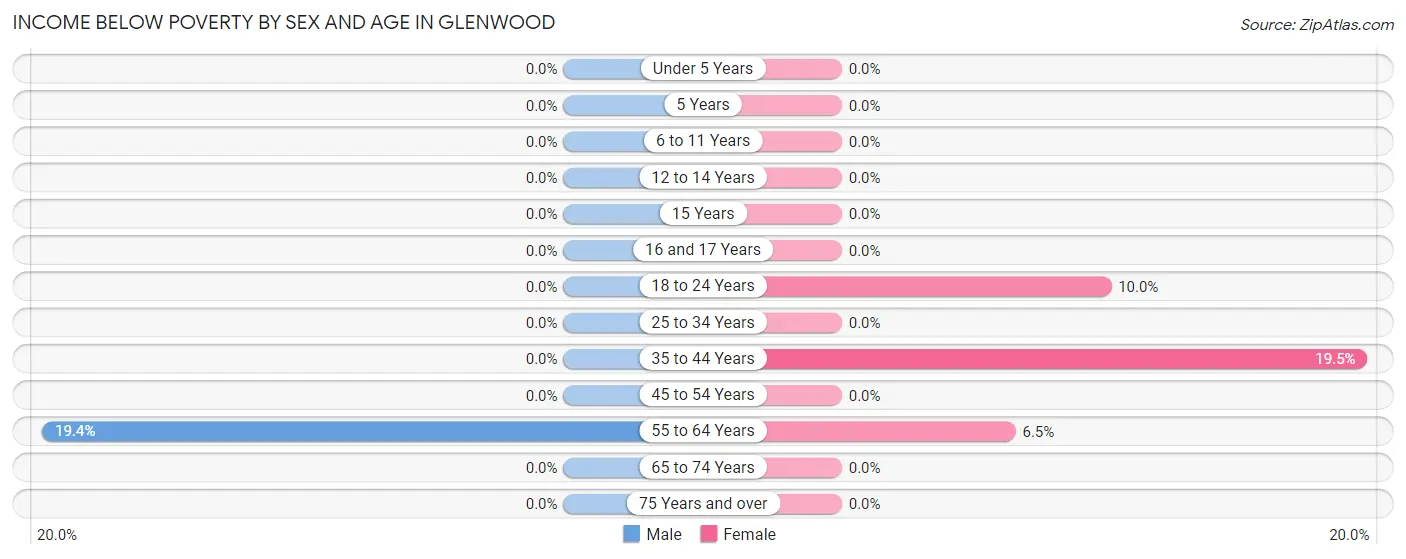
| Age Bracket | Male | Female |
| Under 5 Years | 0 (0.0%) | 0 (0.0%) |
| 5 Years | 0 (0.0%) | 0 (0.0%) |
| 6 to 11 Years | 0 (0.0%) | 0 (0.0%) |
| 12 to 14 Years | 0 (0.0%) | 0 (0.0%) |
| 15 Years | 0 (0.0%) | 0 (0.0%) |
| 16 and 17 Years | 0 (0.0%) | 0 (0.0%) |
| 18 to 24 Years | 0 (0.0%) | 1 (10.0%) |
| 25 to 34 Years | 0 (0.0%) | 0 (0.0%) |
| 35 to 44 Years | 0 (0.0%) | 8 (19.5%) |
| 45 to 54 Years | 0 (0.0%) | 0 (0.0%) |
| 55 to 64 Years | 6 (19.4%) | 2 (6.5%) |
| 65 to 74 Years | 0 (0.0%) | 0 (0.0%) |
| 75 Years and over | 0 (0.0%) | 0 (0.0%) |
| Total | 6 (2.1%) | 11 (3.6%) |
Income Above Poverty by Sex and Age in Glenwood
According to the poverty statistics in Glenwood, males aged under 5 years and females aged under 5 years are the age groups that are most secure financially, with 100.0% of males and 100.0% of females in these age groups living above the poverty line.
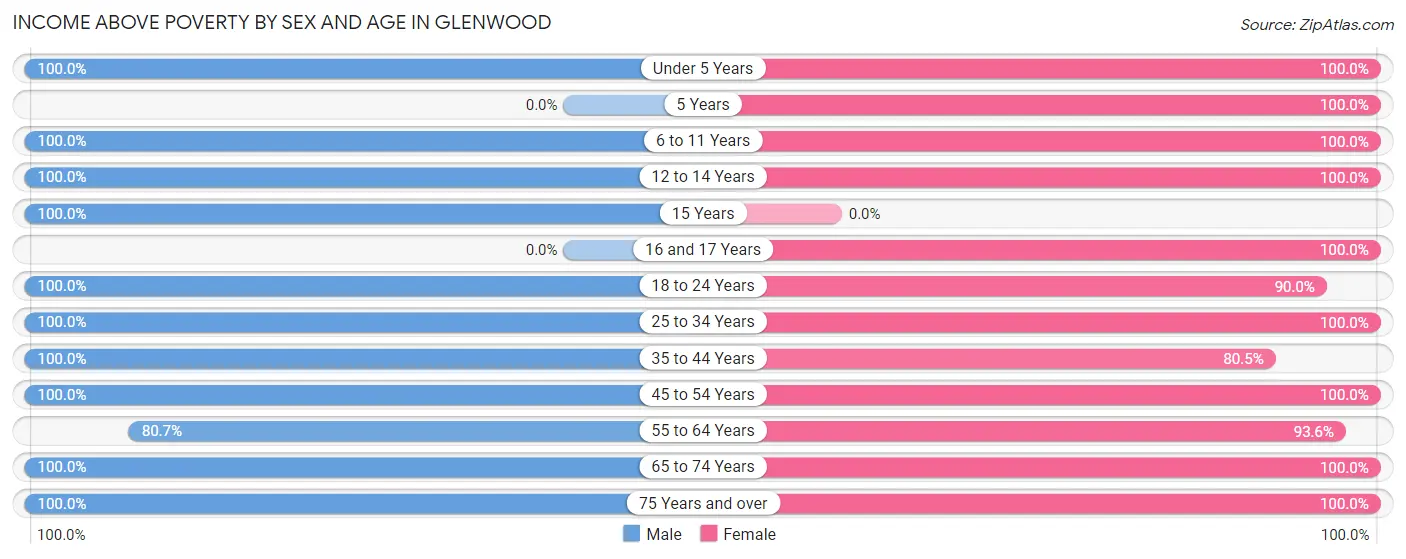
| Age Bracket | Male | Female |
| Under 5 Years | 8 (100.0%) | 5 (100.0%) |
| 5 Years | 0 (0.0%) | 39 (100.0%) |
| 6 to 11 Years | 48 (100.0%) | 12 (100.0%) |
| 12 to 14 Years | 4 (100.0%) | 27 (100.0%) |
| 15 Years | 11 (100.0%) | 0 (0.0%) |
| 16 and 17 Years | 0 (0.0%) | 9 (100.0%) |
| 18 to 24 Years | 14 (100.0%) | 9 (90.0%) |
| 25 to 34 Years | 30 (100.0%) | 16 (100.0%) |
| 35 to 44 Years | 26 (100.0%) | 33 (80.5%) |
| 45 to 54 Years | 37 (100.0%) | 32 (100.0%) |
| 55 to 64 Years | 25 (80.6%) | 29 (93.5%) |
| 65 to 74 Years | 75 (100.0%) | 64 (100.0%) |
| 75 Years and over | 7 (100.0%) | 23 (100.0%) |
| Total | 285 (97.9%) | 298 (96.4%) |
Income Below Poverty Among Married-Couple Families in Glenwood
The poverty statistics for married-couple families in Glenwood show that 1.3% or 2 of the total 160 families live below the poverty line. Families with no children have the highest poverty rate of 1.8%, comprising of 2 families. On the other hand, families with 1 or 2 children have the lowest poverty rate of 0.0%, which includes 0 families.
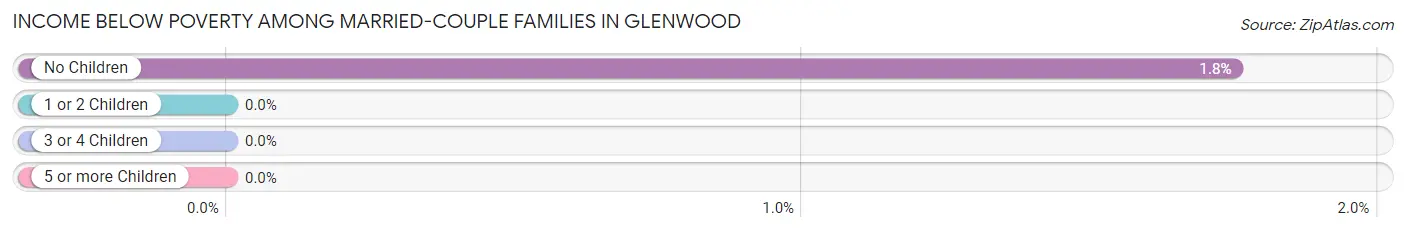
| Children | Above Poverty | Below Poverty |
| No Children | 112 (98.3%) | 2 (1.8%) |
| 1 or 2 Children | 10 (100.0%) | 0 (0.0%) |
| 3 or 4 Children | 35 (100.0%) | 0 (0.0%) |
| 5 or more Children | 1 (100.0%) | 0 (0.0%) |
| Total | 158 (98.8%) | 2 (1.3%) |
Income Below Poverty Among Single-Parent Households in Glenwood
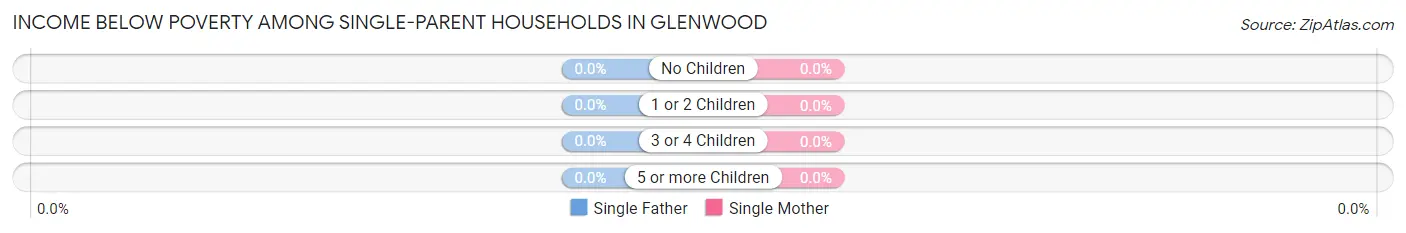
| Children | Single Father | Single Mother |
| No Children | 0 (0.0%) | 0 (0.0%) |
| 1 or 2 Children | 0 (0.0%) | 0 (0.0%) |
| 3 or 4 Children | 0 (0.0%) | 0 (0.0%) |
| 5 or more Children | 0 (0.0%) | 0 (0.0%) |
| Total | 0 (0.0%) | 0 (0.0%) |
Income Below Poverty Among Married-Couple vs Single-Parent Households in Glenwood
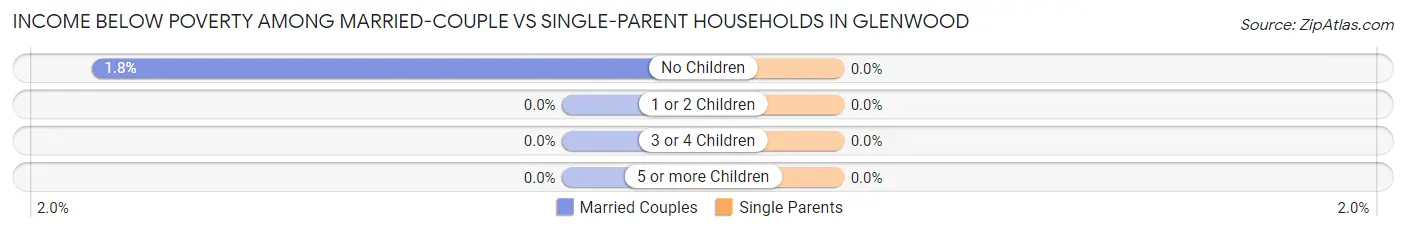
| Children | Married-Couple Families | Single-Parent Households |
| No Children | 2 (1.8%) | 0 (0.0%) |
| 1 or 2 Children | 0 (0.0%) | 0 (0.0%) |
| 3 or 4 Children | 0 (0.0%) | 0 (0.0%) |
| 5 or more Children | 0 (0.0%) | 0 (0.0%) |
| Total | 2 (1.3%) | 0 (0.0%) |
Race in Glenwood
The most populous races in Glenwood are White / Caucasian (600 | 98.7%), Native / Alaskan (8 | 1.3%), and Hispanic or Latino (6 | 1.0%).
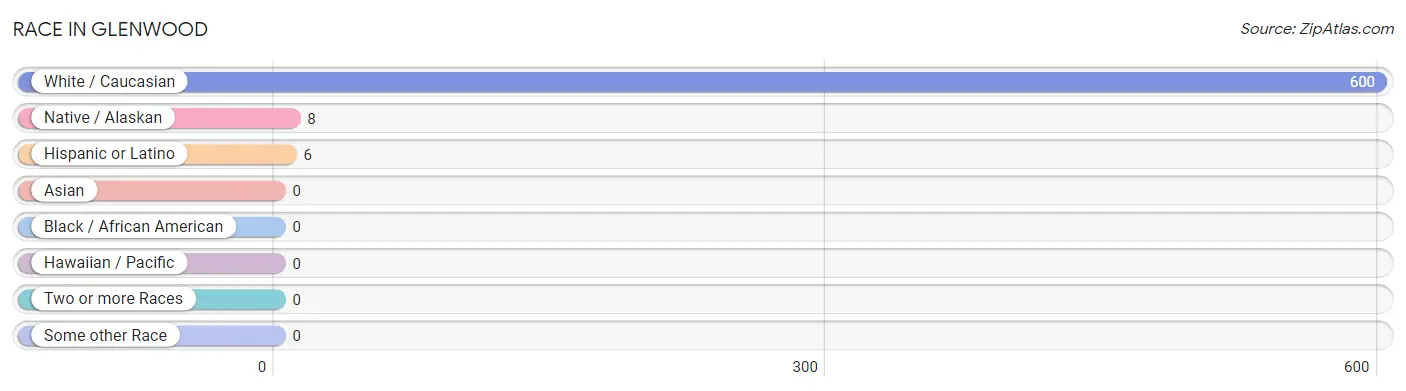
| Race | # Population | % Population |
| Asian | 0 | 0.0% |
| Black / African American | 0 | 0.0% |
| Hawaiian / Pacific | 0 | 0.0% |
| Hispanic or Latino | 6 | 1.0% |
| Native / Alaskan | 8 | 1.3% |
| White / Caucasian | 600 | 98.7% |
| Two or more Races | 0 | 0.0% |
| Some other Race | 0 | 0.0% |
| Total | 608 | 100.0% |
Ancestry in Glenwood
The most populous ancestries reported in Glenwood are English (276 | 45.4%), Danish (64 | 10.5%), Scottish (55 | 9.0%), German (53 | 8.7%), and Dutch (39 | 6.4%), together accounting for 80.1% of all Glenwood residents.
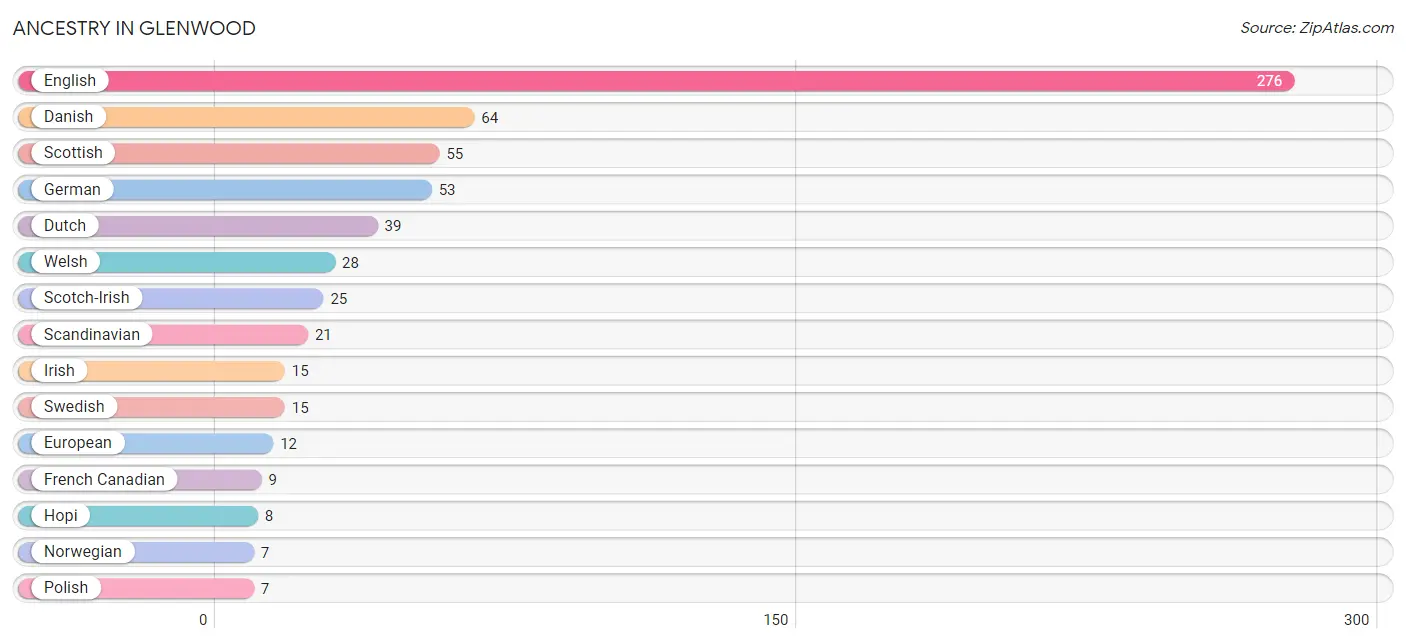
| Ancestry | # Population | % Population |
| American | 6 | 1.0% |
| British | 6 | 1.0% |
| Central American | 6 | 1.0% |
| Danish | 64 | 10.5% |
| Dutch | 39 | 6.4% |
| English | 276 | 45.4% |
| European | 12 | 2.0% |
| French | 4 | 0.7% |
| French Canadian | 9 | 1.5% |
| German | 53 | 8.7% |
| Guatemalan | 6 | 1.0% |
| Hopi | 8 | 1.3% |
| Irish | 15 | 2.5% |
| Norwegian | 7 | 1.1% |
| Polish | 7 | 1.1% |
| Scandinavian | 21 | 3.5% |
| Scotch-Irish | 25 | 4.1% |
| Scottish | 55 | 9.0% |
| Swedish | 15 | 2.5% |
| Swiss | 2 | 0.3% |
| Welsh | 28 | 4.6% | View All 21 Rows |
Immigrants in Glenwood
The most numerous immigrant groups reported in Glenwood came from Central America (6 | 1.0%), Guatemala (6 | 1.0%), Latin America (6 | 1.0%), Europe (2 | 0.3%), and Netherlands (2 | 0.3%), together accounting for 3.6% of all Glenwood residents.
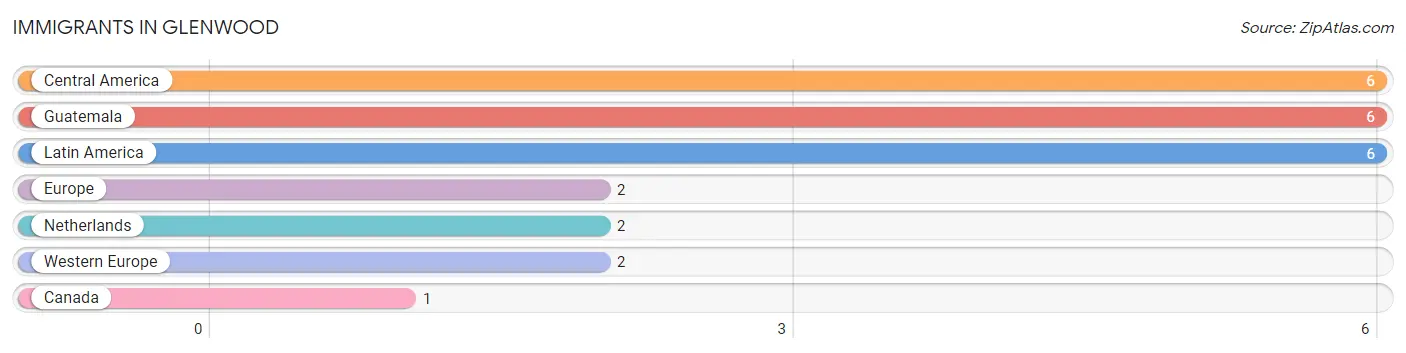
| Immigration Origin | # Population | % Population |
| Canada | 1 | 0.2% |
| Central America | 6 | 1.0% |
| Europe | 2 | 0.3% |
| Guatemala | 6 | 1.0% |
| Latin America | 6 | 1.0% |
| Netherlands | 2 | 0.3% |
| Western Europe | 2 | 0.3% | View All 7 Rows |
Sex and Age in Glenwood
Sex and Age in Glenwood
The most populous age groups in Glenwood are 70 to 74 Years (48 | 16.1%) for men and 5 to 9 Years (48 | 15.5%) for women.
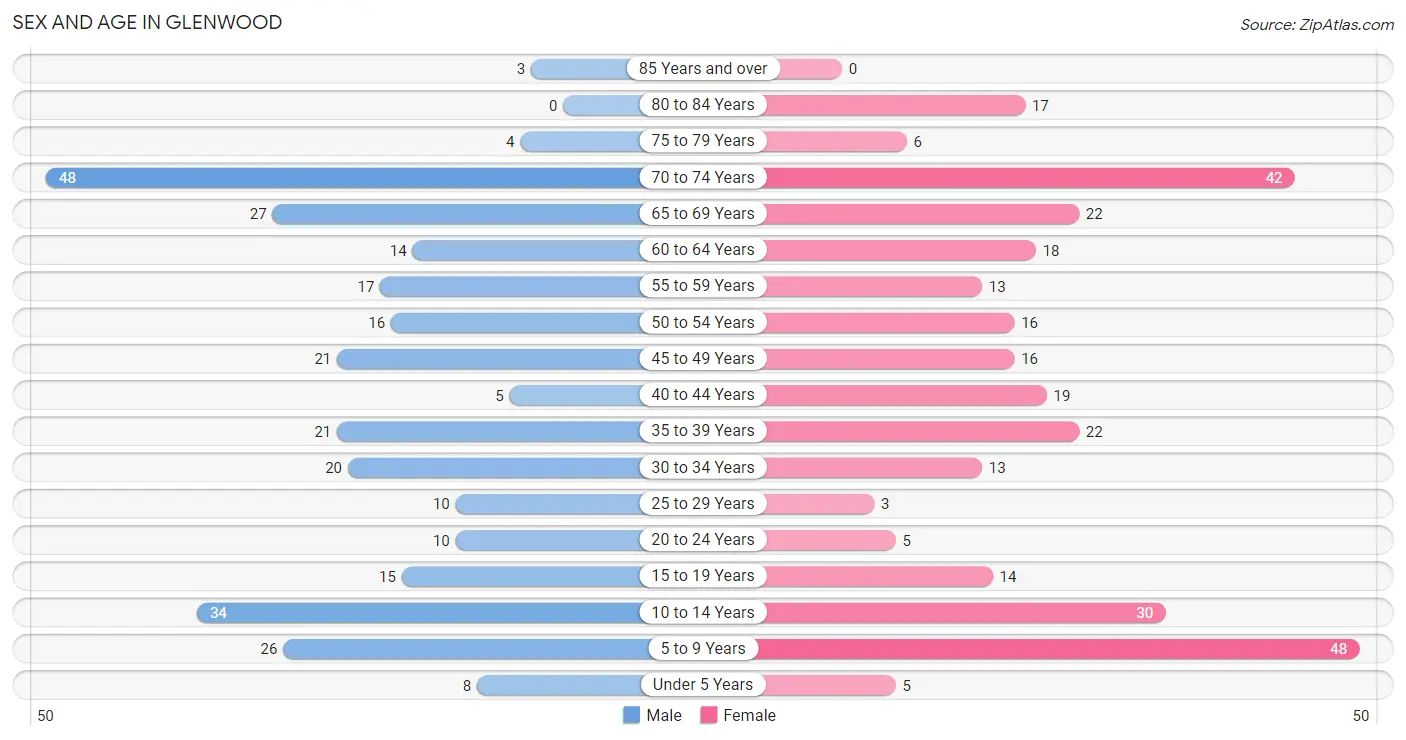
| Age Bracket | Male | Female |
| Under 5 Years | 8 (2.7%) | 5 (1.6%) |
| 5 to 9 Years | 26 (8.7%) | 48 (15.5%) |
| 10 to 14 Years | 34 (11.4%) | 30 (9.7%) |
| 15 to 19 Years | 15 (5.0%) | 14 (4.5%) |
| 20 to 24 Years | 10 (3.3%) | 5 (1.6%) |
| 25 to 29 Years | 10 (3.3%) | 3 (1.0%) |
| 30 to 34 Years | 20 (6.7%) | 13 (4.2%) |
| 35 to 39 Years | 21 (7.0%) | 22 (7.1%) |
| 40 to 44 Years | 5 (1.7%) | 19 (6.1%) |
| 45 to 49 Years | 21 (7.0%) | 16 (5.2%) |
| 50 to 54 Years | 16 (5.3%) | 16 (5.2%) |
| 55 to 59 Years | 17 (5.7%) | 13 (4.2%) |
| 60 to 64 Years | 14 (4.7%) | 18 (5.8%) |
| 65 to 69 Years | 27 (9.0%) | 22 (7.1%) |
| 70 to 74 Years | 48 (16.1%) | 42 (13.6%) |
| 75 to 79 Years | 4 (1.3%) | 6 (1.9%) |
| 80 to 84 Years | 0 (0.0%) | 17 (5.5%) |
| 85 Years and over | 3 (1.0%) | 0 (0.0%) |
| Total | 299 (100.0%) | 309 (100.0%) |
Families and Households in Glenwood
Median Family Size in Glenwood
The median family size in Glenwood is 3.09 persons per family, with single female/mother families (6 | 3.5%) accounting for the largest median family size of 3.33 persons per family. On the other hand, single male/father families (8 | 4.6%) represent the smallest median family size with 2.13 persons per family.
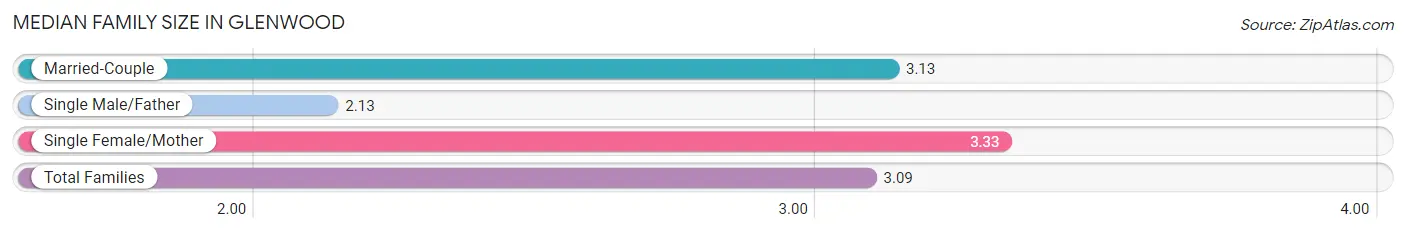
| Family Type | # Families | Family Size |
| Married-Couple | 160 (91.9%) | 3.13 |
| Single Male/Father | 8 (4.6%) | 2.13 |
| Single Female/Mother | 6 (3.5%) | 3.33 |
| Total Families | 174 (100.0%) | 3.09 |
Median Household Size in Glenwood
The median household size in Glenwood is 2.90 persons per household, with single male/father households (8 | 3.8%) accounting for the largest median household size of 4.13 persons per household. non-family households (34 | 16.4%) represent the smallest median household size with 1.47 persons per household.
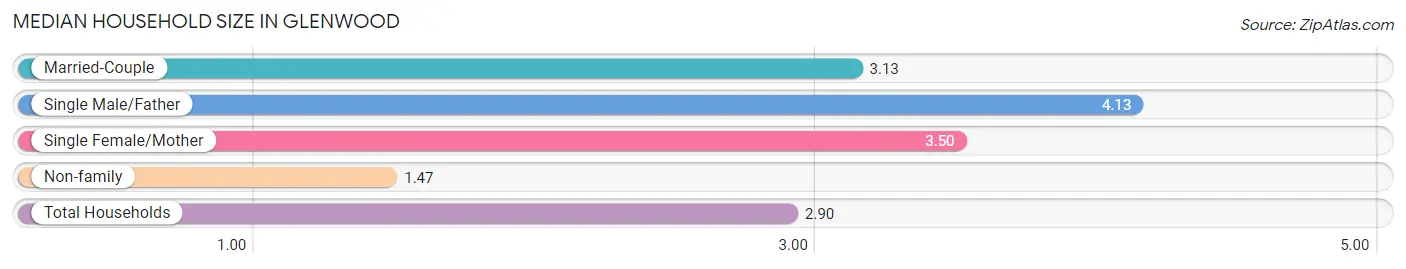
| Household Type | # Households | Household Size |
| Married-Couple | 160 (76.9%) | 3.13 |
| Single Male/Father | 8 (3.8%) | 4.13 |
| Single Female/Mother | 6 (2.9%) | 3.50 |
| Non-family | 34 (16.4%) | 1.47 |
| Total Households | 208 (100.0%) | 2.90 |
Household Size by Marriage Status in Glenwood
Out of a total of 208 households in Glenwood, 174 (83.7%) are family households, while 34 (16.4%) are nonfamily households. The most numerous type of family households are 2-person households, comprising 104, and the most common type of nonfamily households are 1-person households, comprising 22.
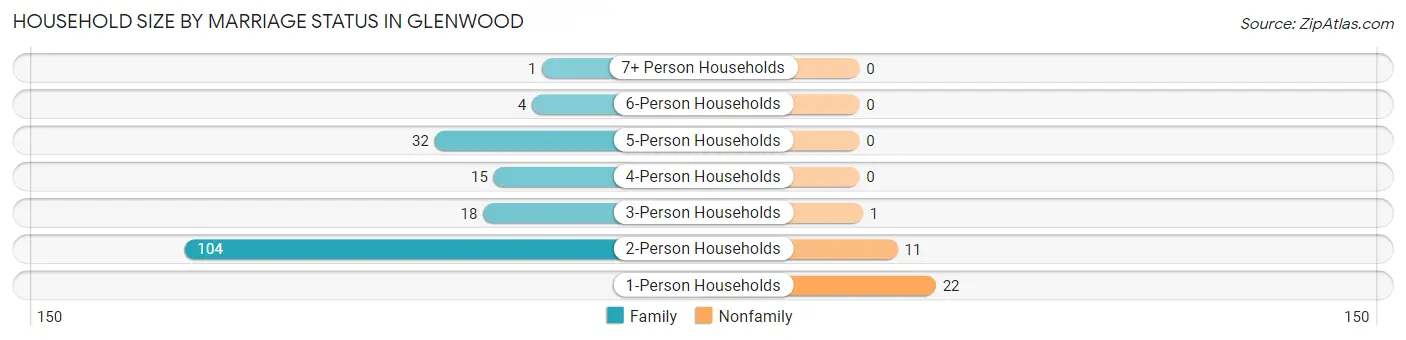
| Household Size | Family Households | Nonfamily Households |
| 1-Person Households | - | 22 (10.6%) |
| 2-Person Households | 104 (50.0%) | 11 (5.3%) |
| 3-Person Households | 18 (8.6%) | 1 (0.5%) |
| 4-Person Households | 15 (7.2%) | 0 (0.0%) |
| 5-Person Households | 32 (15.4%) | 0 (0.0%) |
| 6-Person Households | 4 (1.9%) | 0 (0.0%) |
| 7+ Person Households | 1 (0.5%) | 0 (0.0%) |
| Total | 174 (83.7%) | 34 (16.4%) |
Female Fertility in Glenwood
Fertility by Age in Glenwood
| Age Bracket | Women with Births | Births / 1,000 Women |
| 15 to 19 years | 0 (0.0%) | 0.0 |
| 20 to 34 years | 0 (0.0%) | 0.0 |
| 35 to 50 years | 0 (0.0%) | 0.0 |
| Total | 0 (0.0%) | 0.0 |
Fertility by Age by Marriage Status in Glenwood
| Age Bracket | Married | Unmarried |
| 15 to 19 years | 0 (0.0%) | 0 (0.0%) |
| 20 to 34 years | 0 (0.0%) | 0 (0.0%) |
| 35 to 50 years | 0 (0.0%) | 0 (0.0%) |
| Total | 0 (0.0%) | 0 (0.0%) |
Fertility by Education in Glenwood
| Educational Attainment | Women with Births | Births / 1,000 Women |
| Less than High School | 0 (0.0%) | 0.0 |
| High School Diploma | 0 (0.0%) | 0.0 |
| College or Associate's Degree | 0 (0.0%) | 0.0 |
| Bachelor's Degree | 0 (0.0%) | 0.0 |
| Graduate Degree | 0 (0.0%) | 0.0 |
| Total | 0 (0.0%) | 0.0 |
Fertility by Education by Marriage Status in Glenwood
| Educational Attainment | Married | Unmarried |
| Less than High School | 0 (0.0%) | 0 (0.0%) |
| High School Diploma | 0 (0.0%) | 0 (0.0%) |
| College or Associate's Degree | 0 (0.0%) | 0 (0.0%) |
| Bachelor's Degree | 0 (0.0%) | 0 (0.0%) |
| Graduate Degree | 0 (0.0%) | 0 (0.0%) |
| Total | 0 (0.0%) | 0 (0.0%) |
Employment Characteristics in Glenwood
Employment by Class of Employer in Glenwood
Among the 254 employed individuals in Glenwood, private company employees (135 | 53.1%), self-employed (not incorporated) (51 | 20.1%), and not-for-profit organizations (23 | 9.1%) make up the most common classes of employment.
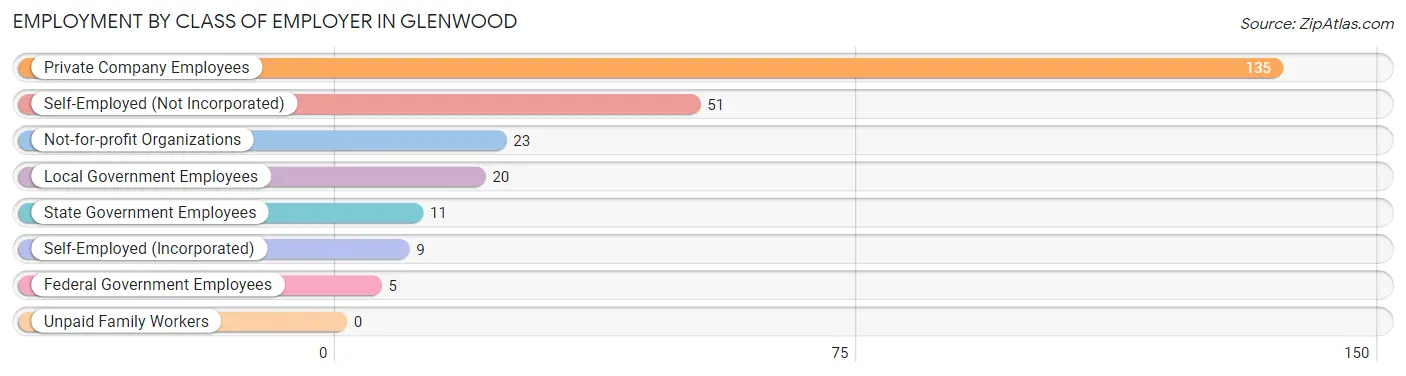
| Employer Class | # Employees | % Employees |
| Private Company Employees | 135 | 53.1% |
| Self-Employed (Incorporated) | 9 | 3.5% |
| Self-Employed (Not Incorporated) | 51 | 20.1% |
| Not-for-profit Organizations | 23 | 9.1% |
| Local Government Employees | 20 | 7.9% |
| State Government Employees | 11 | 4.3% |
| Federal Government Employees | 5 | 2.0% |
| Unpaid Family Workers | 0 | 0.0% |
| Total | 254 | 100.0% |
Employment Status by Age in Glenwood
According to the labor force statistics for Glenwood, out of the total population over 16 years of age (446), 59.0% or 263 individuals are in the labor force, with 0.8% or 2 of them unemployed. The age group with the highest labor force participation rate is 20 to 24 years, with 100.0% or 15 individuals in the labor force. Within the labor force, the 16 to 19 years age range has the highest percentage of unemployed individuals, with 22.2% or 2 of them being unemployed.
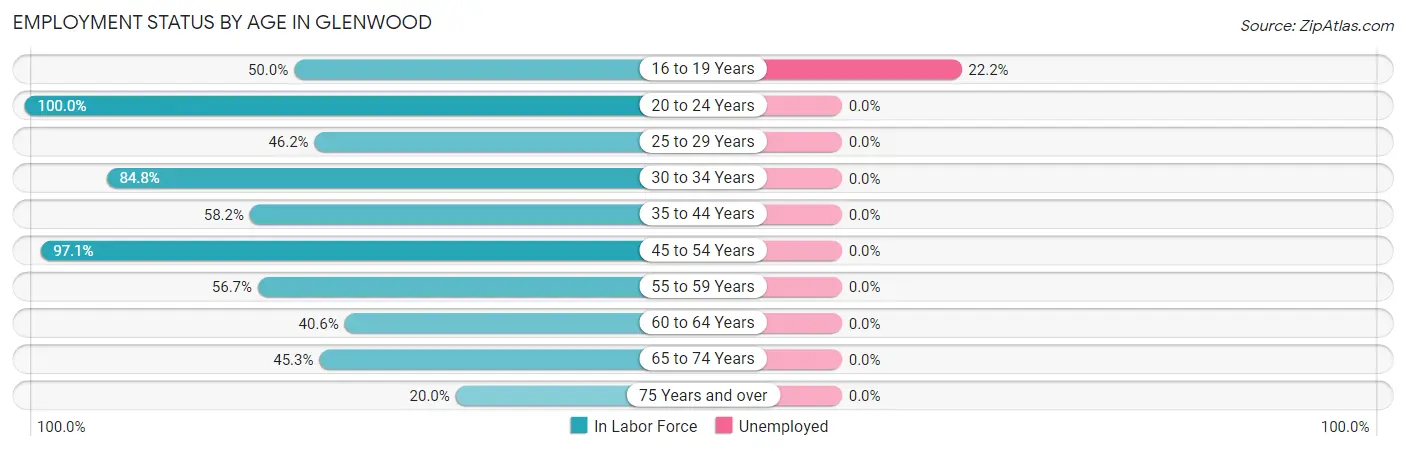
| Age Bracket | In Labor Force | Unemployed |
| 16 to 19 Years | 9 (50.0%) | 2 (22.2%) |
| 20 to 24 Years | 15 (100.0%) | 0 (0.0%) |
| 25 to 29 Years | 6 (46.2%) | 0 (0.0%) |
| 30 to 34 Years | 28 (84.8%) | 0 (0.0%) |
| 35 to 44 Years | 39 (58.2%) | 0 (0.0%) |
| 45 to 54 Years | 67 (97.1%) | 0 (0.0%) |
| 55 to 59 Years | 17 (56.7%) | 0 (0.0%) |
| 60 to 64 Years | 13 (40.6%) | 0 (0.0%) |
| 65 to 74 Years | 63 (45.3%) | 0 (0.0%) |
| 75 Years and over | 6 (20.0%) | 0 (0.0%) |
| Total | 263 (59.0%) | 2 (0.8%) |
Employment Status by Educational Attainment in Glenwood
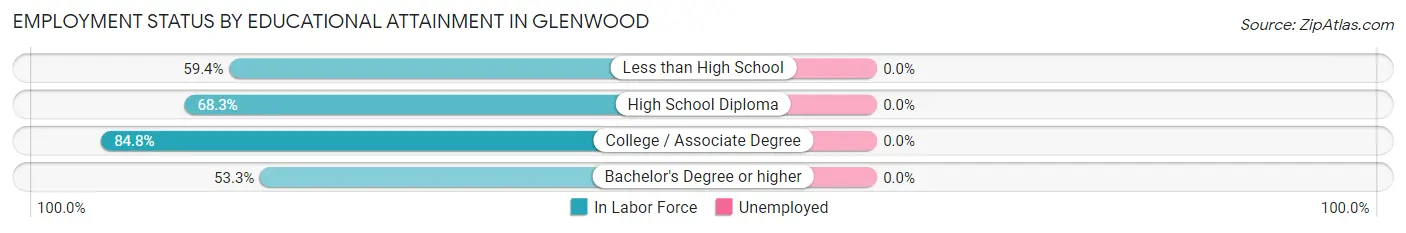
| Educational Attainment | In Labor Force | Unemployed |
| Less than High School | 19 (59.4%) | 0 (0.0%) |
| High School Diploma | 41 (68.3%) | 0 (0.0%) |
| College / Associate Degree | 78 (84.8%) | 0 (0.0%) |
| Bachelor's Degree or higher | 32 (53.3%) | 0 (0.0%) |
| Total | 170 (69.7%) | 0 (0.0%) |
Employment Occupations by Sex in Glenwood
Management, Business, Science and Arts Occupations
The most common Management, Business, Science and Arts occupations in Glenwood are Health Diagnosing & Treating (50 | 19.2%), Health Technologists (45 | 17.2%), Community & Social Service (14 | 5.4%), Management (13 | 5.0%), and Business & Financial (10 | 3.8%).
Management, Business, Science and Arts Occupations by Sex
Within the Management, Business, Science and Arts occupations in Glenwood, the most male-oriented occupations are Computers, Engineering & Science (100.0%), Architecture & Engineering (100.0%), and Life, Physical & Social Science (100.0%), while the most female-oriented occupations are Arts, Media & Entertainment (100.0%), Community & Social Service (85.7%), and Education Instruction & Library (80.0%).
| Occupation | Male | Female |
| Management | 10 (76.9%) | 3 (23.1%) |
| Business & Financial | 6 (60.0%) | 4 (40.0%) |
| Computers, Engineering & Science | 6 (100.0%) | 0 (0.0%) |
| Computers & Mathematics | 0 (0.0%) | 0 (0.0%) |
| Architecture & Engineering | 3 (100.0%) | 0 (0.0%) |
| Life, Physical & Social Science | 3 (100.0%) | 0 (0.0%) |
| Community & Social Service | 2 (14.3%) | 12 (85.7%) |
| Education, Arts & Media | 0 (0.0%) | 0 (0.0%) |
| Legal Services & Support | 0 (0.0%) | 0 (0.0%) |
| Education Instruction & Library | 2 (20.0%) | 8 (80.0%) |
| Arts, Media & Entertainment | 0 (0.0%) | 4 (100.0%) |
| Health Diagnosing & Treating | 44 (88.0%) | 6 (12.0%) |
| Health Technologists | 41 (91.1%) | 4 (8.9%) |
| Total (Category) | 68 (73.1%) | 25 (26.9%) |
| Total (Overall) | 176 (67.4%) | 85 (32.6%) |
Services Occupations
The most common Services occupations in Glenwood are Personal Care & Service (7 | 2.7%), Security & Protection (5 | 1.9%), Food Preparation & Serving (4 | 1.5%), Healthcare Support (3 | 1.1%), and Law Enforcement (3 | 1.1%).
Services Occupations by Sex
Within the Services occupations in Glenwood, the most male-oriented occupations are Security & Protection (100.0%), Firefighting & Prevention (100.0%), and Law Enforcement (100.0%), while the most female-oriented occupations are Personal Care & Service (100.0%), Healthcare Support (33.3%), and Food Preparation & Serving (25.0%).
| Occupation | Male | Female |
| Healthcare Support | 2 (66.7%) | 1 (33.3%) |
| Security & Protection | 5 (100.0%) | 0 (0.0%) |
| Firefighting & Prevention | 2 (100.0%) | 0 (0.0%) |
| Law Enforcement | 3 (100.0%) | 0 (0.0%) |
| Food Preparation & Serving | 3 (75.0%) | 1 (25.0%) |
| Cleaning & Maintenance | 2 (100.0%) | 0 (0.0%) |
| Personal Care & Service | 0 (0.0%) | 7 (100.0%) |
| Total (Category) | 12 (57.1%) | 9 (42.9%) |
| Total (Overall) | 176 (67.4%) | 85 (32.6%) |
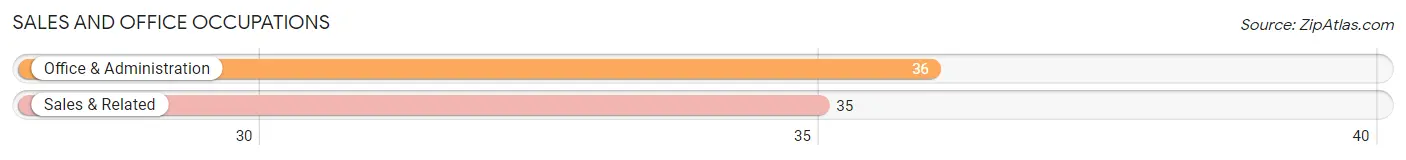
Sales and Office Occupations
The most common Sales and Office occupations in Glenwood are Office & Administration (36 | 13.8%), and Sales & Related (35 | 13.4%).
Sales and Office Occupations by Sex
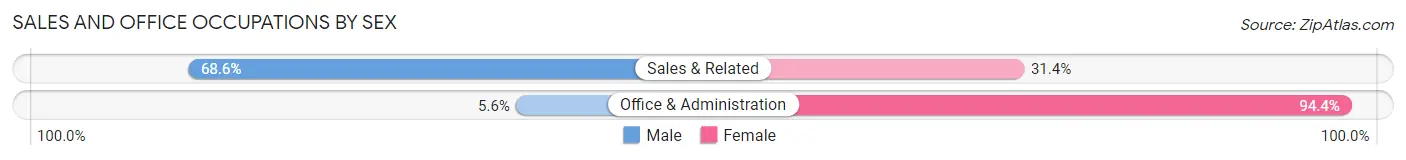
| Occupation | Male | Female |
| Sales & Related | 24 (68.6%) | 11 (31.4%) |
| Office & Administration | 2 (5.6%) | 34 (94.4%) |
| Total (Category) | 26 (36.6%) | 45 (63.4%) |
| Total (Overall) | 176 (67.4%) | 85 (32.6%) |
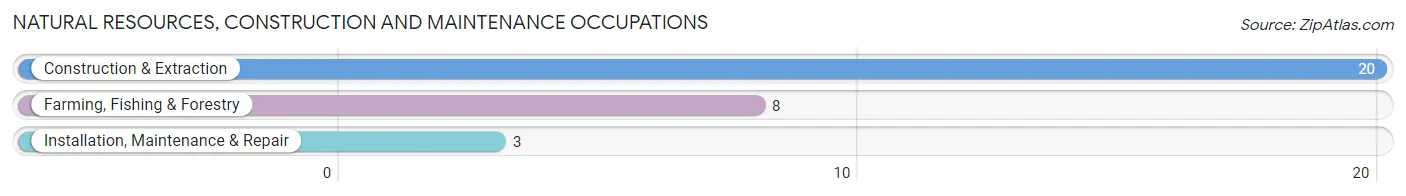
Natural Resources, Construction and Maintenance Occupations
The most common Natural Resources, Construction and Maintenance occupations in Glenwood are Construction & Extraction (20 | 7.7%), Farming, Fishing & Forestry (8 | 3.1%), and Installation, Maintenance & Repair (3 | 1.1%).
Natural Resources, Construction and Maintenance Occupations by Sex
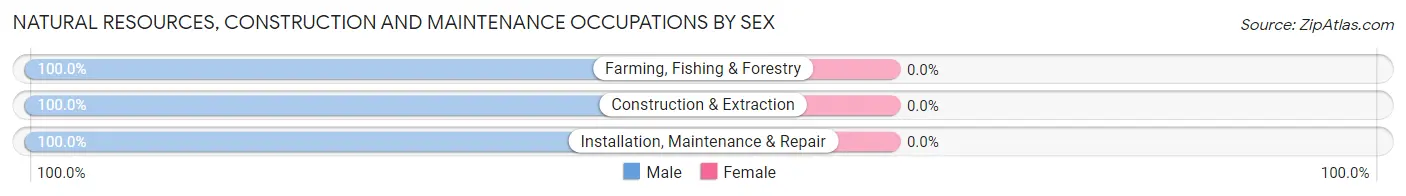
| Occupation | Male | Female |
| Farming, Fishing & Forestry | 8 (100.0%) | 0 (0.0%) |
| Construction & Extraction | 20 (100.0%) | 0 (0.0%) |
| Installation, Maintenance & Repair | 3 (100.0%) | 0 (0.0%) |
| Total (Category) | 31 (100.0%) | 0 (0.0%) |
| Total (Overall) | 176 (67.4%) | 85 (32.6%) |
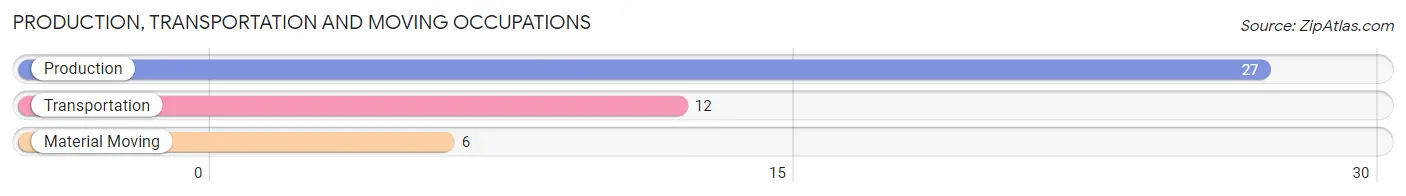
Production, Transportation and Moving Occupations
The most common Production, Transportation and Moving occupations in Glenwood are Production (27 | 10.3%), Transportation (12 | 4.6%), and Material Moving (6 | 2.3%).
Production, Transportation and Moving Occupations by Sex
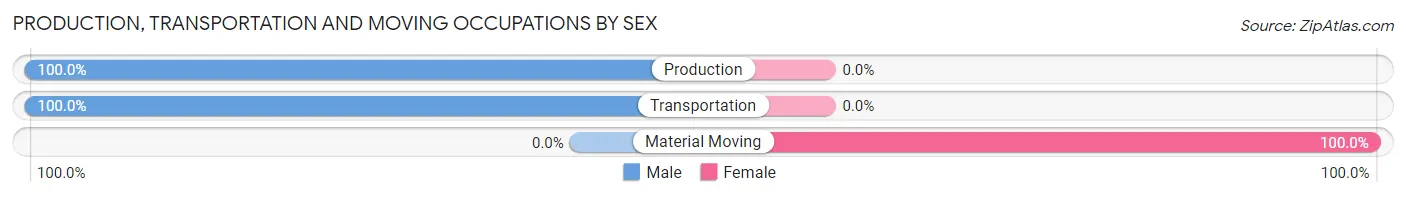
| Occupation | Male | Female |
| Production | 27 (100.0%) | 0 (0.0%) |
| Transportation | 12 (100.0%) | 0 (0.0%) |
| Material Moving | 0 (0.0%) | 6 (100.0%) |
| Total (Category) | 39 (86.7%) | 6 (13.3%) |
| Total (Overall) | 176 (67.4%) | 85 (32.6%) |
Employment Industries by Sex in Glenwood
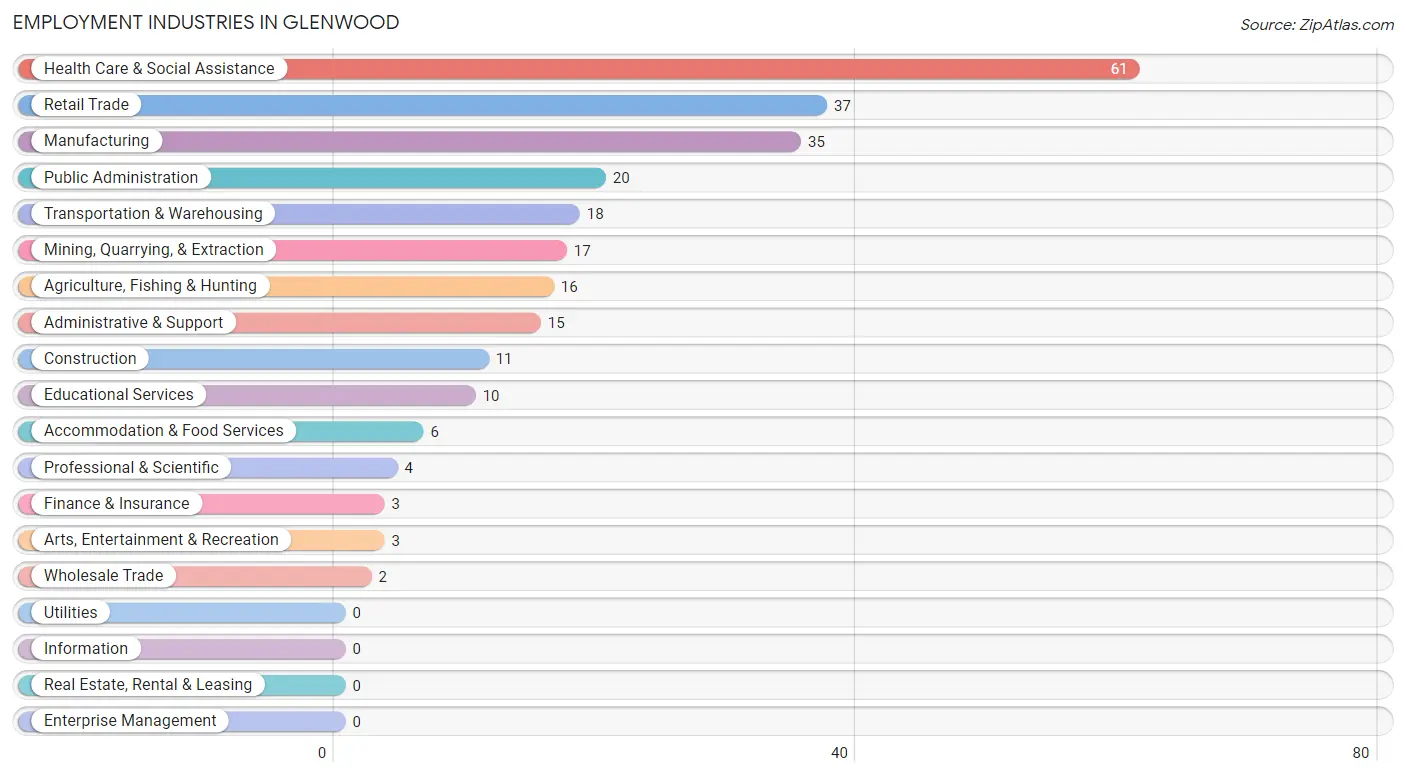
Employment Industries in Glenwood
The major employment industries in Glenwood include Health Care & Social Assistance (61 | 23.4%), Retail Trade (37 | 14.2%), Manufacturing (35 | 13.4%), Public Administration (20 | 7.7%), and Transportation & Warehousing (18 | 6.9%).
Employment Industries by Sex in Glenwood
The Glenwood industries that see more men than women are Agriculture, Fishing & Hunting (100.0%), Mining, Quarrying, & Extraction (100.0%), and Construction (100.0%), whereas the industries that tend to have a higher number of women are Finance & Insurance (100.0%), Educational Services (80.0%), and Professional & Scientific (75.0%).
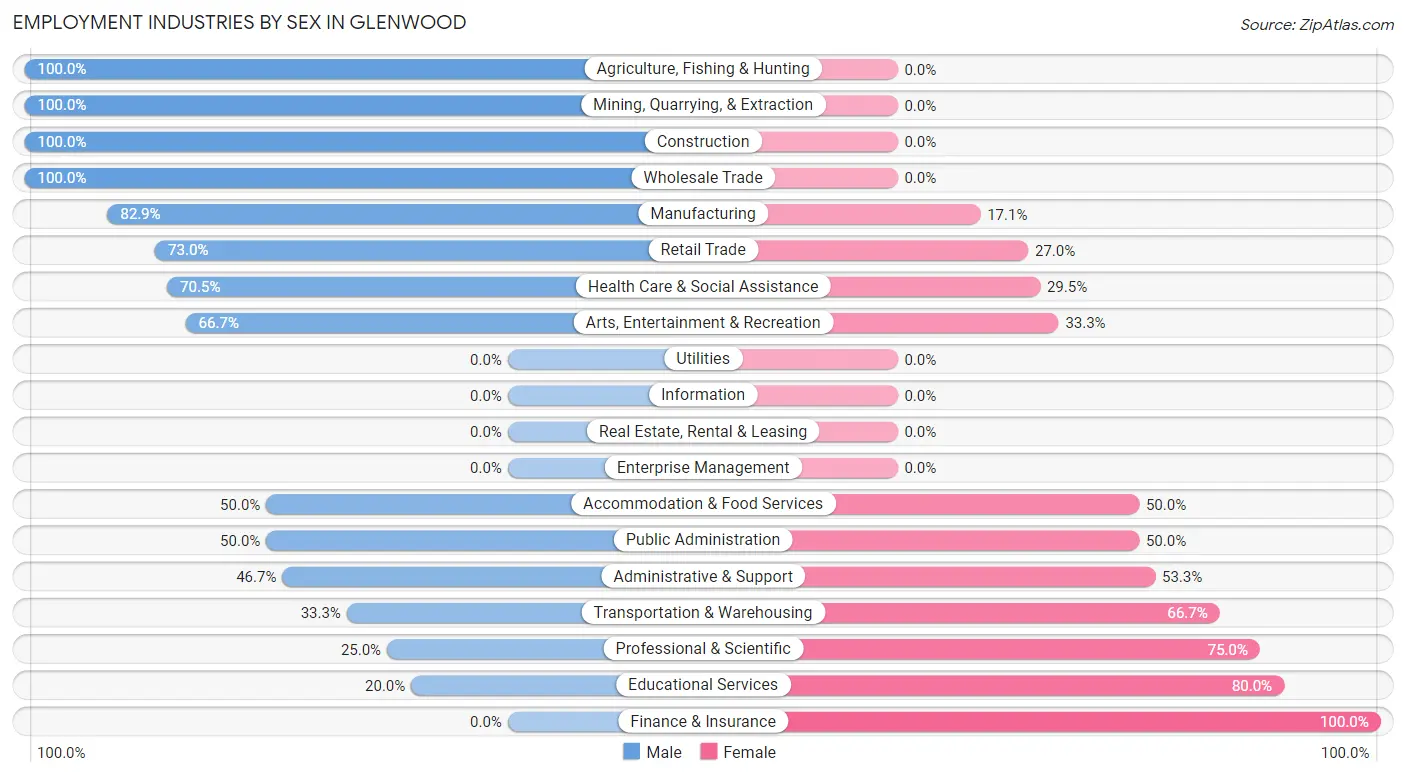
| Industry | Male | Female |
| Agriculture, Fishing & Hunting | 16 (100.0%) | 0 (0.0%) |
| Mining, Quarrying, & Extraction | 17 (100.0%) | 0 (0.0%) |
| Construction | 11 (100.0%) | 0 (0.0%) |
| Manufacturing | 29 (82.9%) | 6 (17.1%) |
| Wholesale Trade | 2 (100.0%) | 0 (0.0%) |
| Retail Trade | 27 (73.0%) | 10 (27.0%) |
| Transportation & Warehousing | 6 (33.3%) | 12 (66.7%) |
| Utilities | 0 (0.0%) | 0 (0.0%) |
| Information | 0 (0.0%) | 0 (0.0%) |
| Finance & Insurance | 0 (0.0%) | 3 (100.0%) |
| Real Estate, Rental & Leasing | 0 (0.0%) | 0 (0.0%) |
| Professional & Scientific | 1 (25.0%) | 3 (75.0%) |
| Enterprise Management | 0 (0.0%) | 0 (0.0%) |
| Administrative & Support | 7 (46.7%) | 8 (53.3%) |
| Educational Services | 2 (20.0%) | 8 (80.0%) |
| Health Care & Social Assistance | 43 (70.5%) | 18 (29.5%) |
| Arts, Entertainment & Recreation | 2 (66.7%) | 1 (33.3%) |
| Accommodation & Food Services | 3 (50.0%) | 3 (50.0%) |
| Public Administration | 10 (50.0%) | 10 (50.0%) |
| Total | 176 (67.4%) | 85 (32.6%) |
Education in Glenwood
School Enrollment in Glenwood
The most common levels of schooling among the 178 students in Glenwood are middle school (56 | 31.5%), elementary school (40 | 22.5%), and kindergarten (39 | 21.9%).
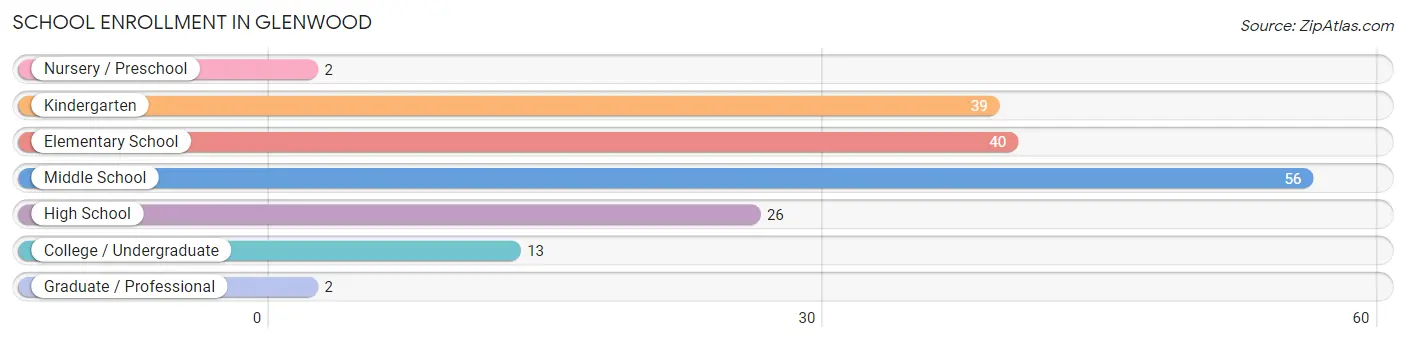
| School Level | # Students | % Students |
| Nursery / Preschool | 2 | 1.1% |
| Kindergarten | 39 | 21.9% |
| Elementary School | 40 | 22.5% |
| Middle School | 56 | 31.5% |
| High School | 26 | 14.6% |
| College / Undergraduate | 13 | 7.3% |
| Graduate / Professional | 2 | 1.1% |
| Total | 178 | 100.0% |
School Enrollment by Age by Funding Source in Glenwood
Out of a total of 178 students who are enrolled in schools in Glenwood, 27 (15.2%) attend a private institution, while the remaining 151 (84.8%) are enrolled in public schools. The age group of 3 to 4 year olds has the highest likelihood of being enrolled in private schools, with 2 (100.0% in the age bracket) enrolled. Conversely, the age group of 10 to 14 year olds has the lowest likelihood of being enrolled in a private school, with 64 (100.0% in the age bracket) attending a public institution.
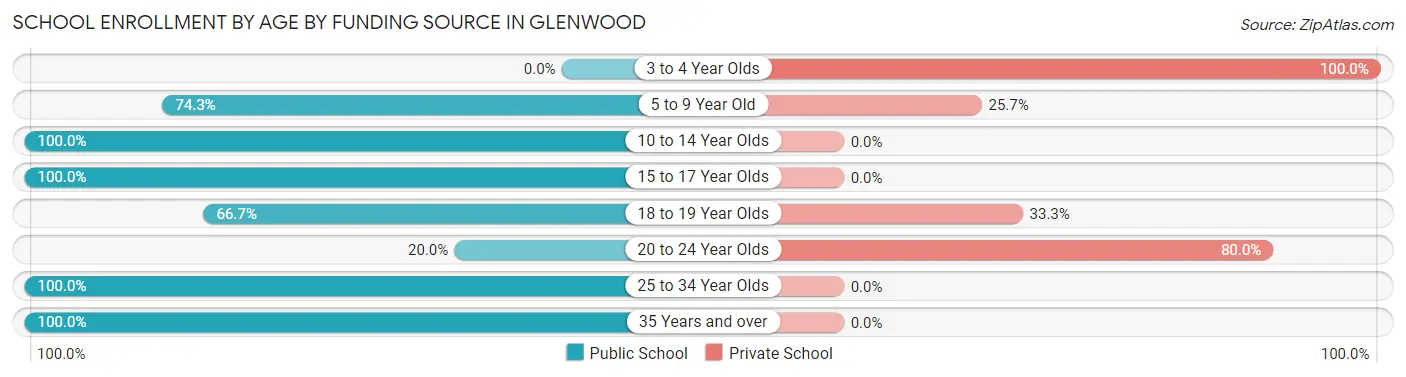
| Age Bracket | Public School | Private School |
| 3 to 4 Year Olds | 0 (0.0%) | 2 (100.0%) |
| 5 to 9 Year Old | 55 (74.3%) | 19 (25.7%) |
| 10 to 14 Year Olds | 64 (100.0%) | 0 (0.0%) |
| 15 to 17 Year Olds | 20 (100.0%) | 0 (0.0%) |
| 18 to 19 Year Olds | 4 (66.7%) | 2 (33.3%) |
| 20 to 24 Year Olds | 1 (20.0%) | 4 (80.0%) |
| 25 to 34 Year Olds | 5 (100.0%) | 0 (0.0%) |
| 35 Years and over | 2 (100.0%) | 0 (0.0%) |
| Total | 151 (84.8%) | 27 (15.2%) |
Educational Attainment by Field of Study in Glenwood
Bio, nature & agricultural (55 | 34.6%), social sciences (45 | 28.3%), education (22 | 13.8%), business (14 | 8.8%), and arts & humanities (7 | 4.4%) are the most common fields of study among 159 individuals in Glenwood who have obtained a bachelor's degree or higher.
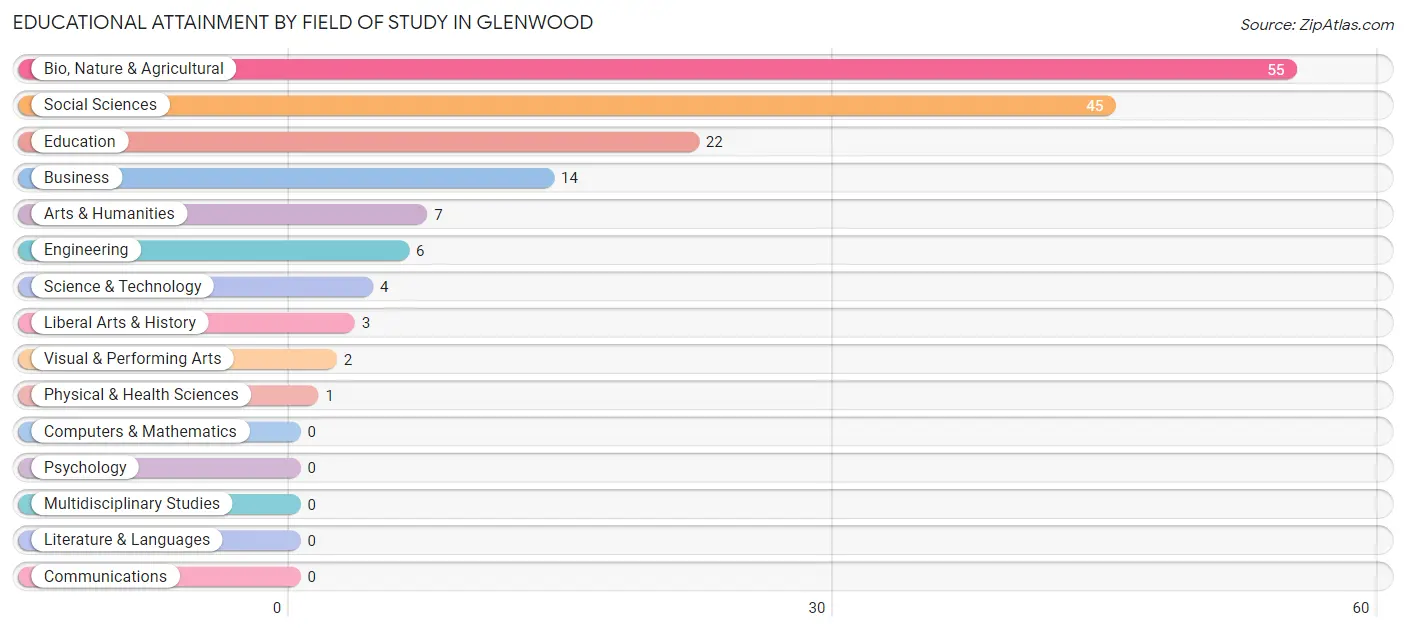
| Field of Study | # Graduates | % Graduates |
| Computers & Mathematics | 0 | 0.0% |
| Bio, Nature & Agricultural | 55 | 34.6% |
| Physical & Health Sciences | 1 | 0.6% |
| Psychology | 0 | 0.0% |
| Social Sciences | 45 | 28.3% |
| Engineering | 6 | 3.8% |
| Multidisciplinary Studies | 0 | 0.0% |
| Science & Technology | 4 | 2.5% |
| Business | 14 | 8.8% |
| Education | 22 | 13.8% |
| Literature & Languages | 0 | 0.0% |
| Liberal Arts & History | 3 | 1.9% |
| Visual & Performing Arts | 2 | 1.3% |
| Communications | 0 | 0.0% |
| Arts & Humanities | 7 | 4.4% |
| Total | 159 | 100.0% |
Transportation & Commute in Glenwood
Vehicle Availability by Sex in Glenwood
The most prevalent vehicle ownership categories in Glenwood are males with 3 vehicles (96, accounting for 56.8%) and females with 3 vehicles (25, making up 112.9%).
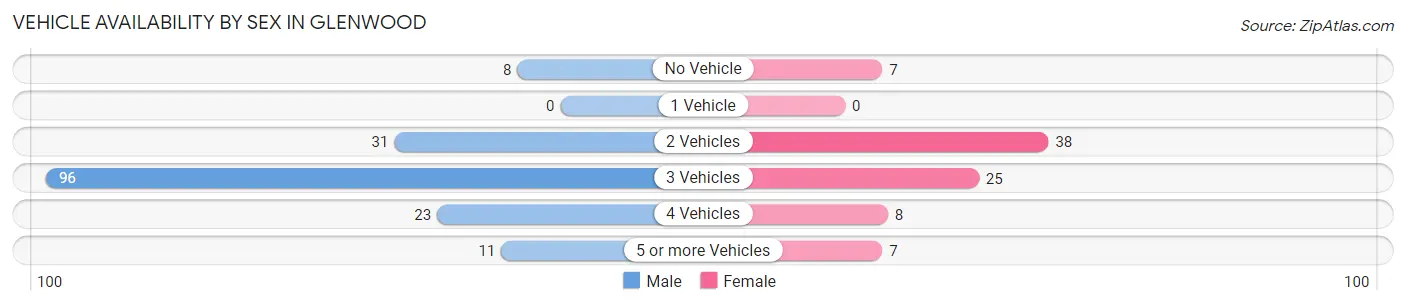
| Vehicles Available | Male | Female |
| No Vehicle | 8 (4.7%) | 7 (8.2%) |
| 1 Vehicle | 0 (0.0%) | 0 (0.0%) |
| 2 Vehicles | 31 (18.3%) | 38 (44.7%) |
| 3 Vehicles | 96 (56.8%) | 25 (29.4%) |
| 4 Vehicles | 23 (13.6%) | 8 (9.4%) |
| 5 or more Vehicles | 11 (6.5%) | 7 (8.2%) |
| Total | 169 (100.0%) | 85 (100.0%) |
Commute Time in Glenwood
The most frequently occuring commute durations in Glenwood are 10 to 14 minutes (95 commuters, 42.6%), 15 to 19 minutes (44 commuters, 19.7%), and 60 to 89 minutes (26 commuters, 11.7%).
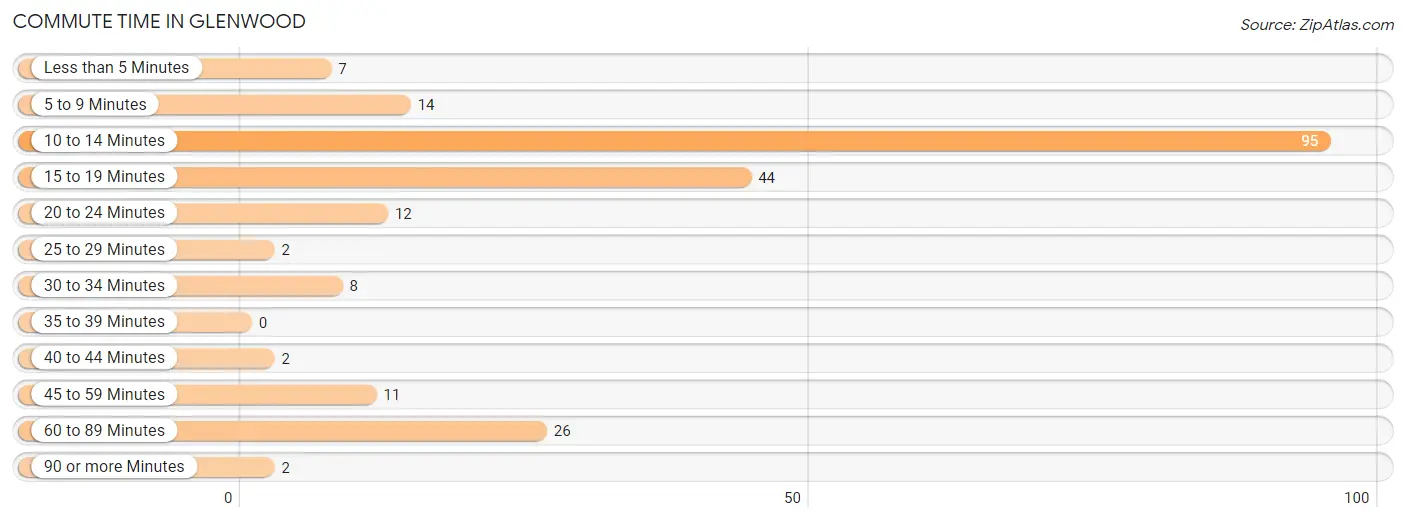
| Commute Time | # Commuters | % Commuters |
| Less than 5 Minutes | 7 | 3.1% |
| 5 to 9 Minutes | 14 | 6.3% |
| 10 to 14 Minutes | 95 | 42.6% |
| 15 to 19 Minutes | 44 | 19.7% |
| 20 to 24 Minutes | 12 | 5.4% |
| 25 to 29 Minutes | 2 | 0.9% |
| 30 to 34 Minutes | 8 | 3.6% |
| 35 to 39 Minutes | 0 | 0.0% |
| 40 to 44 Minutes | 2 | 0.9% |
| 45 to 59 Minutes | 11 | 4.9% |
| 60 to 89 Minutes | 26 | 11.7% |
| 90 or more Minutes | 2 | 0.9% |
Commute Time by Sex in Glenwood
The most common commute times in Glenwood are 10 to 14 minutes (67 commuters, 44.1%) for males and 10 to 14 minutes (28 commuters, 39.4%) for females.
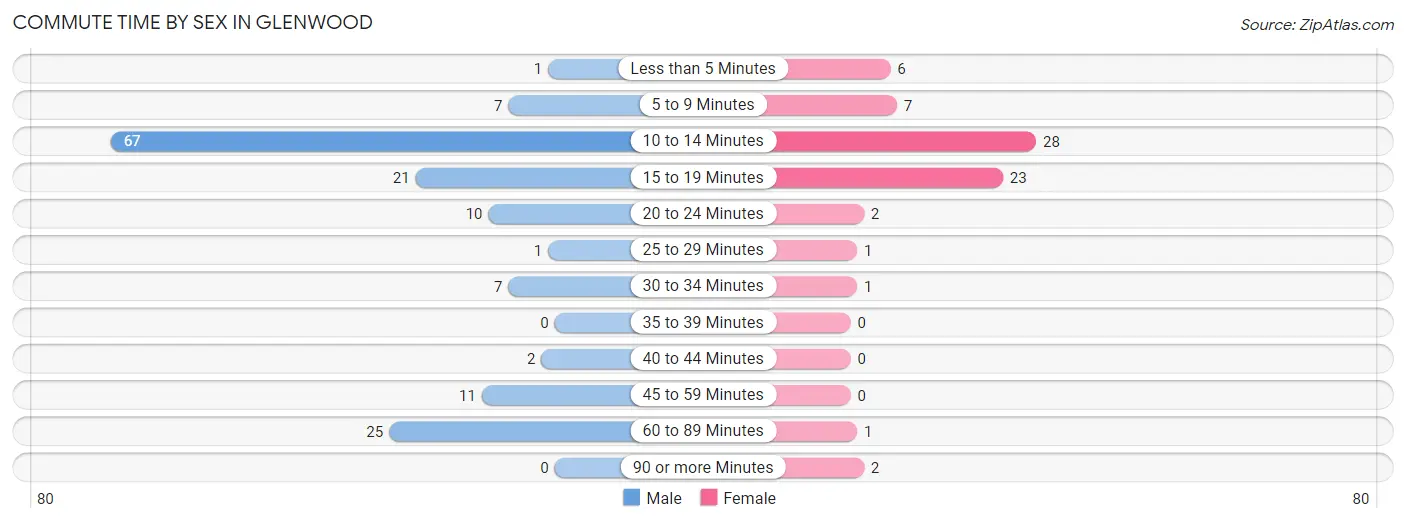
| Commute Time | Male | Female |
| Less than 5 Minutes | 1 (0.7%) | 6 (8.5%) |
| 5 to 9 Minutes | 7 (4.6%) | 7 (9.9%) |
| 10 to 14 Minutes | 67 (44.1%) | 28 (39.4%) |
| 15 to 19 Minutes | 21 (13.8%) | 23 (32.4%) |
| 20 to 24 Minutes | 10 (6.6%) | 2 (2.8%) |
| 25 to 29 Minutes | 1 (0.7%) | 1 (1.4%) |
| 30 to 34 Minutes | 7 (4.6%) | 1 (1.4%) |
| 35 to 39 Minutes | 0 (0.0%) | 0 (0.0%) |
| 40 to 44 Minutes | 2 (1.3%) | 0 (0.0%) |
| 45 to 59 Minutes | 11 (7.2%) | 0 (0.0%) |
| 60 to 89 Minutes | 25 (16.5%) | 1 (1.4%) |
| 90 or more Minutes | 0 (0.0%) | 2 (2.8%) |
Time of Departure to Work by Sex in Glenwood
The most frequent times of departure to work in Glenwood are 8:30 AM to 8:59 AM (44, 28.9%) for males and 7:30 AM to 7:59 AM (21, 29.6%) for females.
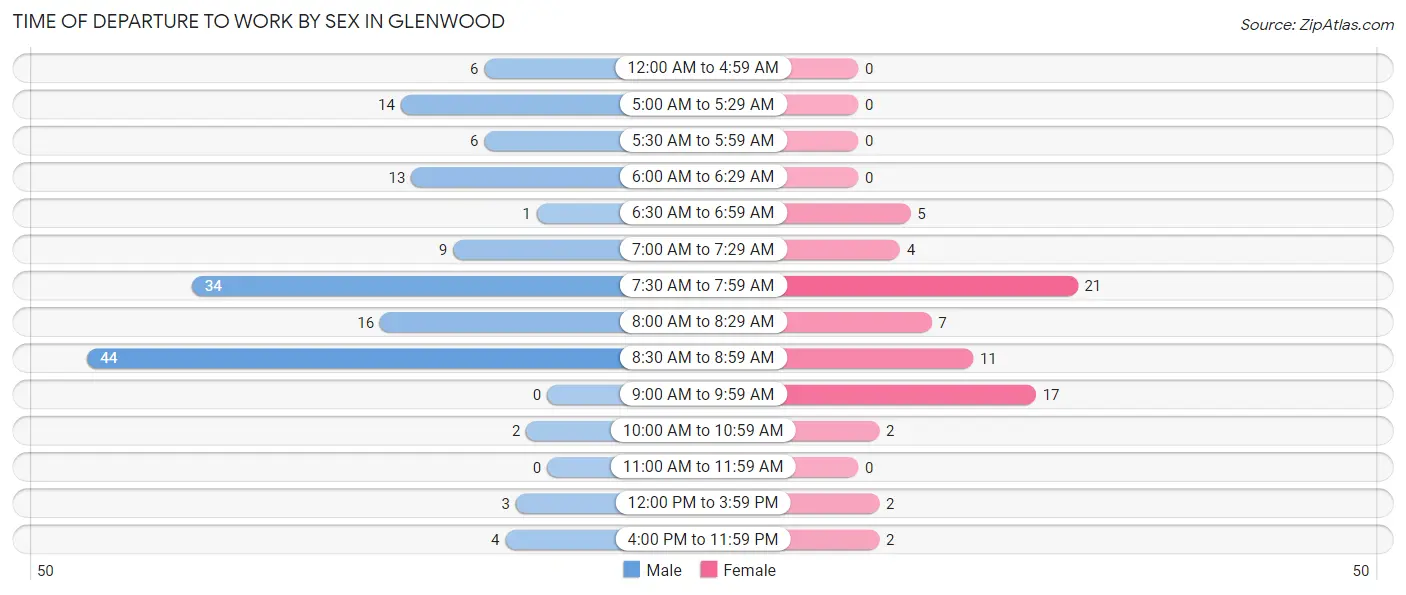
| Time of Departure | Male | Female |
| 12:00 AM to 4:59 AM | 6 (4.0%) | 0 (0.0%) |
| 5:00 AM to 5:29 AM | 14 (9.2%) | 0 (0.0%) |
| 5:30 AM to 5:59 AM | 6 (4.0%) | 0 (0.0%) |
| 6:00 AM to 6:29 AM | 13 (8.6%) | 0 (0.0%) |
| 6:30 AM to 6:59 AM | 1 (0.7%) | 5 (7.0%) |
| 7:00 AM to 7:29 AM | 9 (5.9%) | 4 (5.6%) |
| 7:30 AM to 7:59 AM | 34 (22.4%) | 21 (29.6%) |
| 8:00 AM to 8:29 AM | 16 (10.5%) | 7 (9.9%) |
| 8:30 AM to 8:59 AM | 44 (28.9%) | 11 (15.5%) |
| 9:00 AM to 9:59 AM | 0 (0.0%) | 17 (23.9%) |
| 10:00 AM to 10:59 AM | 2 (1.3%) | 2 (2.8%) |
| 11:00 AM to 11:59 AM | 0 (0.0%) | 0 (0.0%) |
| 12:00 PM to 3:59 PM | 3 (2.0%) | 2 (2.8%) |
| 4:00 PM to 11:59 PM | 4 (2.6%) | 2 (2.8%) |
| Total | 152 (100.0%) | 71 (100.0%) |
Housing Occupancy in Glenwood
Occupancy by Ownership in Glenwood
Of the total 208 dwellings in Glenwood, owner-occupied units account for 184 (88.5%), while renter-occupied units make up 24 (11.5%).
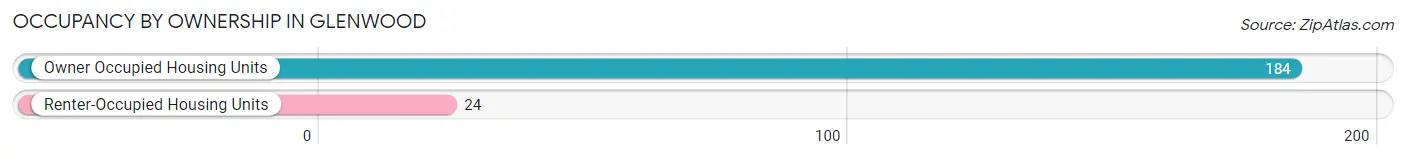
| Occupancy | # Housing Units | % Housing Units |
| Owner Occupied Housing Units | 184 | 88.5% |
| Renter-Occupied Housing Units | 24 | 11.5% |
| Total Occupied Housing Units | 208 | 100.0% |
Occupancy by Household Size in Glenwood
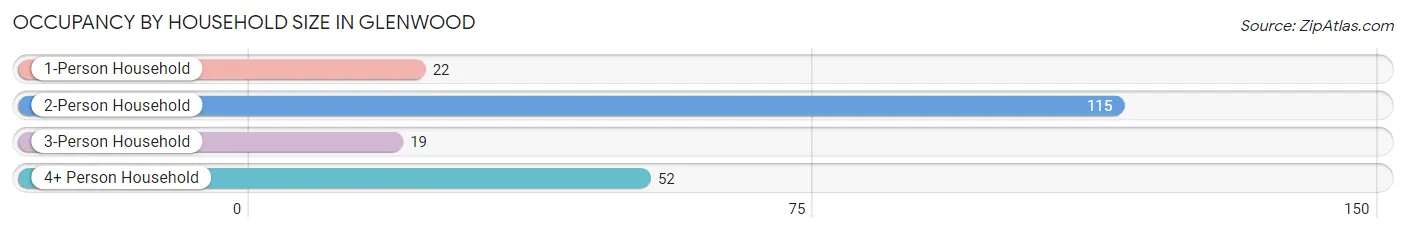
| Household Size | # Housing Units | % Housing Units |
| 1-Person Household | 22 | 10.6% |
| 2-Person Household | 115 | 55.3% |
| 3-Person Household | 19 | 9.1% |
| 4+ Person Household | 52 | 25.0% |
| Total Housing Units | 208 | 100.0% |
Occupancy by Ownership by Household Size in Glenwood
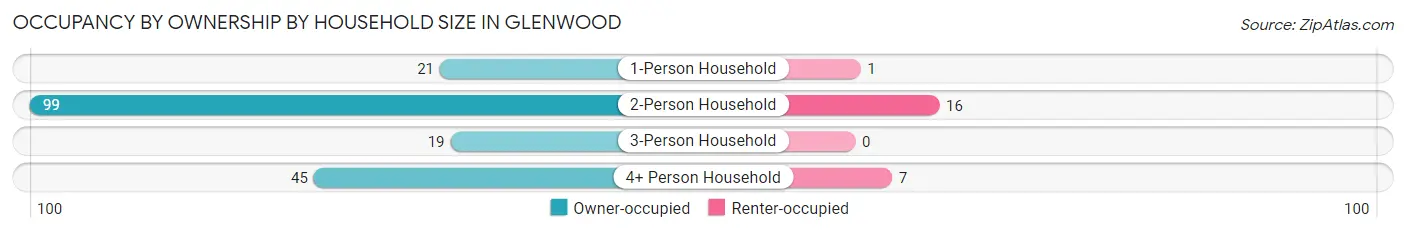
| Household Size | Owner-occupied | Renter-occupied |
| 1-Person Household | 21 (95.5%) | 1 (4.5%) |
| 2-Person Household | 99 (86.1%) | 16 (13.9%) |
| 3-Person Household | 19 (100.0%) | 0 (0.0%) |
| 4+ Person Household | 45 (86.5%) | 7 (13.5%) |
| Total Housing Units | 184 (88.5%) | 24 (11.5%) |
Occupancy by Educational Attainment in Glenwood
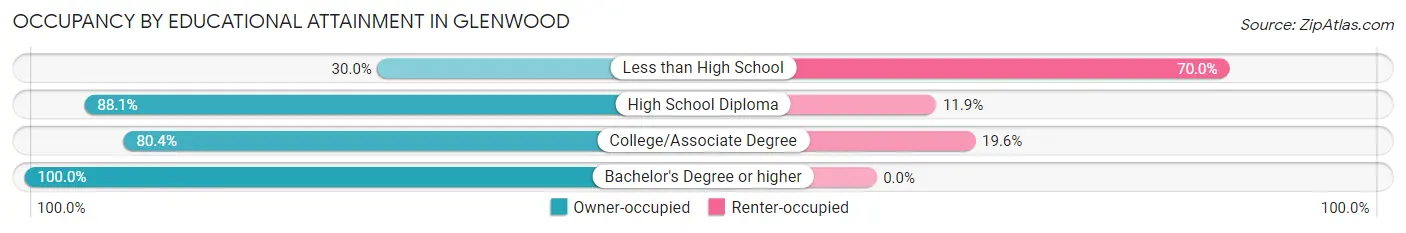
| Household Size | Owner-occupied | Renter-occupied |
| Less than High School | 3 (30.0%) | 7 (70.0%) |
| High School Diploma | 52 (88.1%) | 7 (11.9%) |
| College/Associate Degree | 41 (80.4%) | 10 (19.6%) |
| Bachelor's Degree or higher | 88 (100.0%) | 0 (0.0%) |
Occupancy by Age of Householder in Glenwood
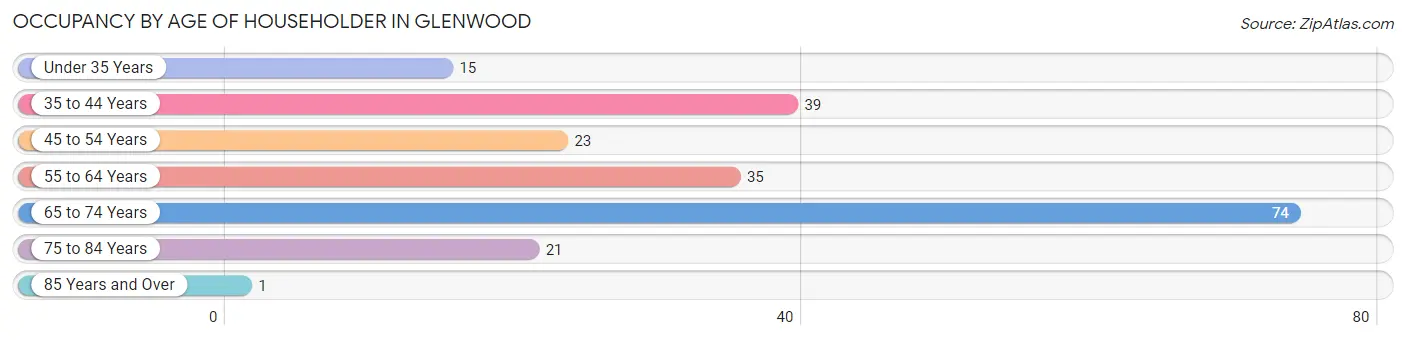
| Age Bracket | # Households | % Households |
| Under 35 Years | 15 | 7.2% |
| 35 to 44 Years | 39 | 18.8% |
| 45 to 54 Years | 23 | 11.1% |
| 55 to 64 Years | 35 | 16.8% |
| 65 to 74 Years | 74 | 35.6% |
| 75 to 84 Years | 21 | 10.1% |
| 85 Years and Over | 1 | 0.5% |
| Total | 208 | 100.0% |
Housing Finances in Glenwood
Median Income by Occupancy in Glenwood
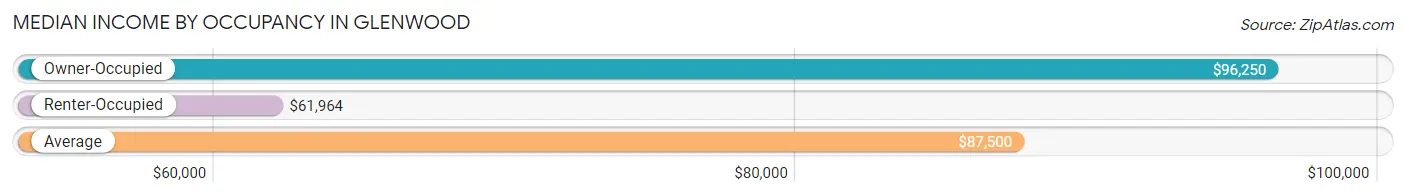
| Occupancy Type | # Households | Median Income |
| Owner-Occupied | 184 (88.5%) | $96,250 |
| Renter-Occupied | 24 (11.5%) | $61,964 |
| Average | 208 (100.0%) | $87,500 |
Occupancy by Householder Income Bracket in Glenwood
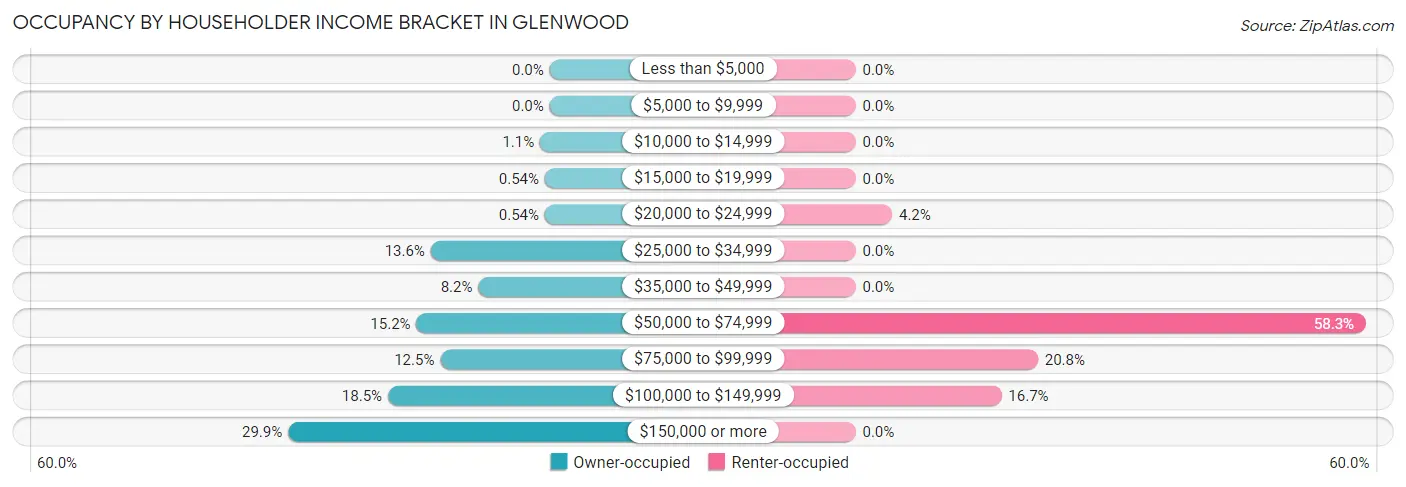
| Income Bracket | Owner-occupied | Renter-occupied |
| Less than $5,000 | 0 (0.0%) | 0 (0.0%) |
| $5,000 to $9,999 | 0 (0.0%) | 0 (0.0%) |
| $10,000 to $14,999 | 2 (1.1%) | 0 (0.0%) |
| $15,000 to $19,999 | 1 (0.5%) | 0 (0.0%) |
| $20,000 to $24,999 | 1 (0.5%) | 1 (4.2%) |
| $25,000 to $34,999 | 25 (13.6%) | 0 (0.0%) |
| $35,000 to $49,999 | 15 (8.2%) | 0 (0.0%) |
| $50,000 to $74,999 | 28 (15.2%) | 14 (58.3%) |
| $75,000 to $99,999 | 23 (12.5%) | 5 (20.8%) |
| $100,000 to $149,999 | 34 (18.5%) | 4 (16.7%) |
| $150,000 or more | 55 (29.9%) | 0 (0.0%) |
| Total | 184 (100.0%) | 24 (100.0%) |
Monthly Housing Cost Tiers in Glenwood
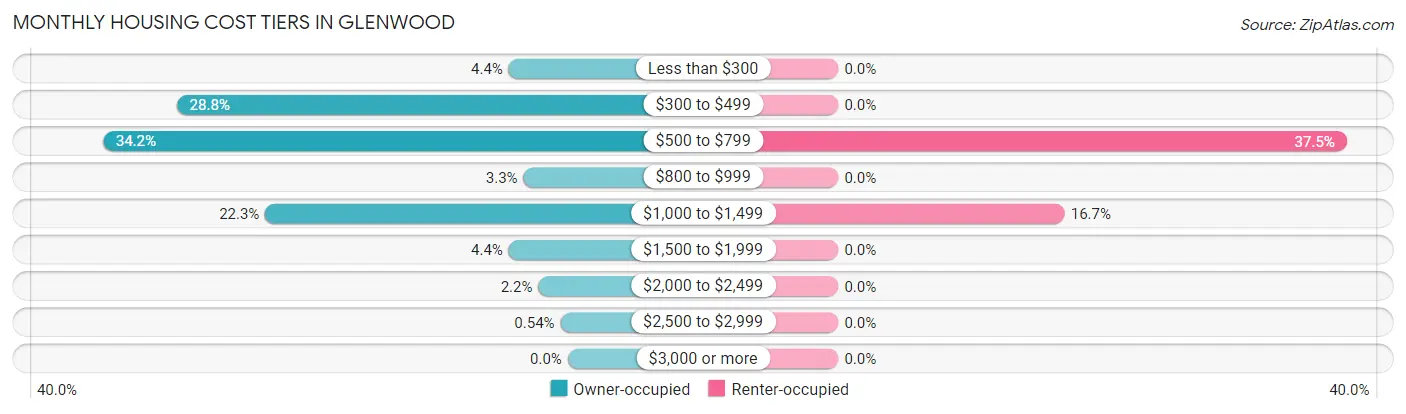
| Monthly Cost | Owner-occupied | Renter-occupied |
| Less than $300 | 8 (4.3%) | 0 (0.0%) |
| $300 to $499 | 53 (28.8%) | 0 (0.0%) |
| $500 to $799 | 63 (34.2%) | 9 (37.5%) |
| $800 to $999 | 6 (3.3%) | 0 (0.0%) |
| $1,000 to $1,499 | 41 (22.3%) | 4 (16.7%) |
| $1,500 to $1,999 | 8 (4.3%) | 0 (0.0%) |
| $2,000 to $2,499 | 4 (2.2%) | 0 (0.0%) |
| $2,500 to $2,999 | 1 (0.5%) | 0 (0.0%) |
| $3,000 or more | 0 (0.0%) | 0 (0.0%) |
| Total | 184 (100.0%) | 24 (100.0%) |
Physical Housing Characteristics in Glenwood
Housing Structures in Glenwood
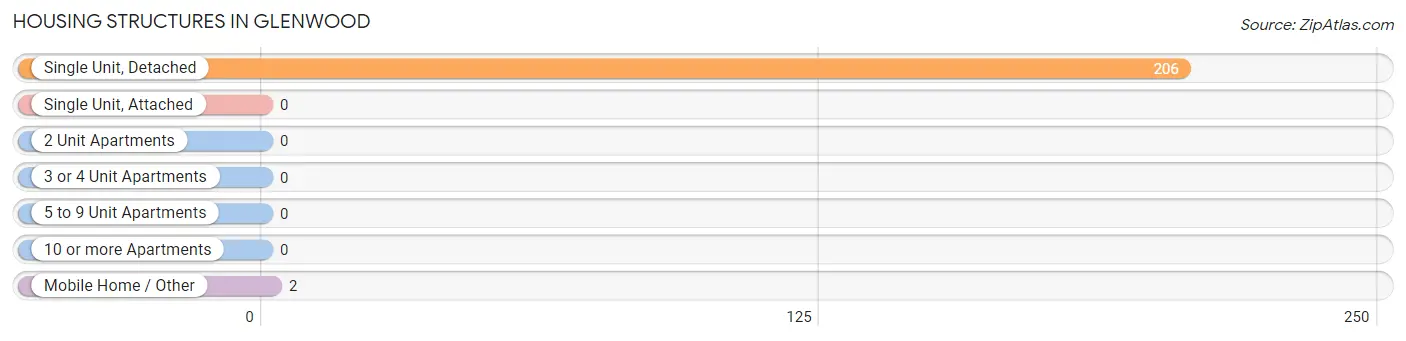
| Structure Type | # Housing Units | % Housing Units |
| Single Unit, Detached | 206 | 99.0% |
| Single Unit, Attached | 0 | 0.0% |
| 2 Unit Apartments | 0 | 0.0% |
| 3 or 4 Unit Apartments | 0 | 0.0% |
| 5 to 9 Unit Apartments | 0 | 0.0% |
| 10 or more Apartments | 0 | 0.0% |
| Mobile Home / Other | 2 | 1.0% |
| Total | 208 | 100.0% |
Housing Structures by Occupancy in Glenwood
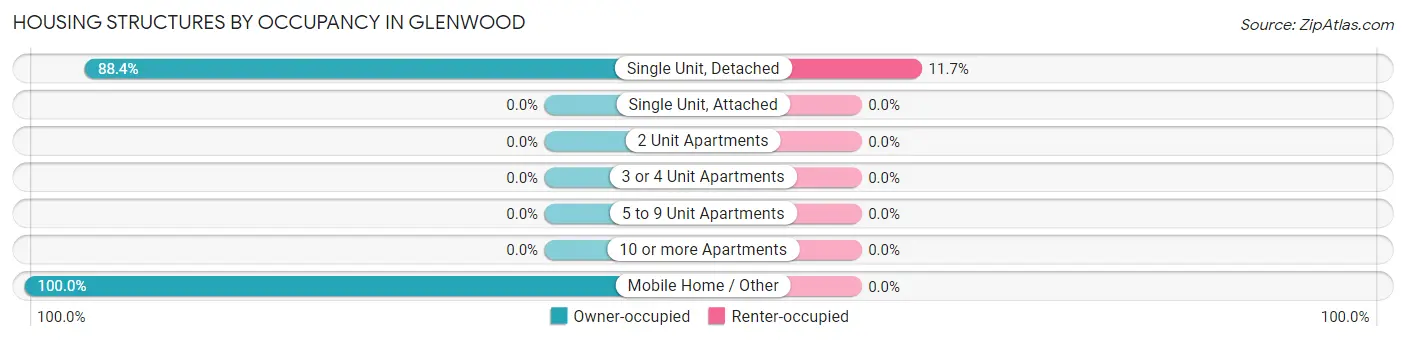
| Structure Type | Owner-occupied | Renter-occupied |
| Single Unit, Detached | 182 (88.3%) | 24 (11.7%) |
| Single Unit, Attached | 0 (0.0%) | 0 (0.0%) |
| 2 Unit Apartments | 0 (0.0%) | 0 (0.0%) |
| 3 or 4 Unit Apartments | 0 (0.0%) | 0 (0.0%) |
| 5 to 9 Unit Apartments | 0 (0.0%) | 0 (0.0%) |
| 10 or more Apartments | 0 (0.0%) | 0 (0.0%) |
| Mobile Home / Other | 2 (100.0%) | 0 (0.0%) |
| Total | 184 (88.5%) | 24 (11.5%) |
Housing Structures by Number of Rooms in Glenwood
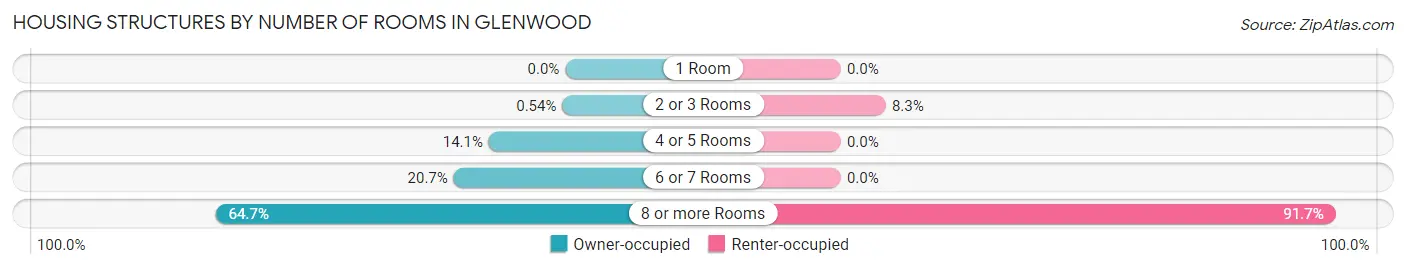
| Number of Rooms | Owner-occupied | Renter-occupied |
| 1 Room | 0 (0.0%) | 0 (0.0%) |
| 2 or 3 Rooms | 1 (0.5%) | 2 (8.3%) |
| 4 or 5 Rooms | 26 (14.1%) | 0 (0.0%) |
| 6 or 7 Rooms | 38 (20.6%) | 0 (0.0%) |
| 8 or more Rooms | 119 (64.7%) | 22 (91.7%) |
| Total | 184 (100.0%) | 24 (100.0%) |
Housing Structure by Heating Type in Glenwood
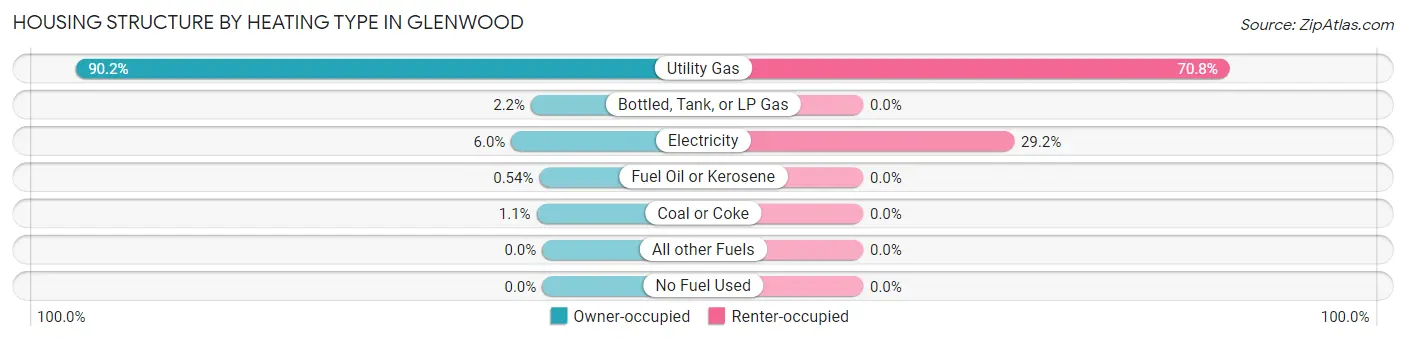
| Heating Type | Owner-occupied | Renter-occupied |
| Utility Gas | 166 (90.2%) | 17 (70.8%) |
| Bottled, Tank, or LP Gas | 4 (2.2%) | 0 (0.0%) |
| Electricity | 11 (6.0%) | 7 (29.2%) |
| Fuel Oil or Kerosene | 1 (0.5%) | 0 (0.0%) |
| Coal or Coke | 2 (1.1%) | 0 (0.0%) |
| All other Fuels | 0 (0.0%) | 0 (0.0%) |
| No Fuel Used | 0 (0.0%) | 0 (0.0%) |
| Total | 184 (100.0%) | 24 (100.0%) |
Household Vehicle Usage in Glenwood
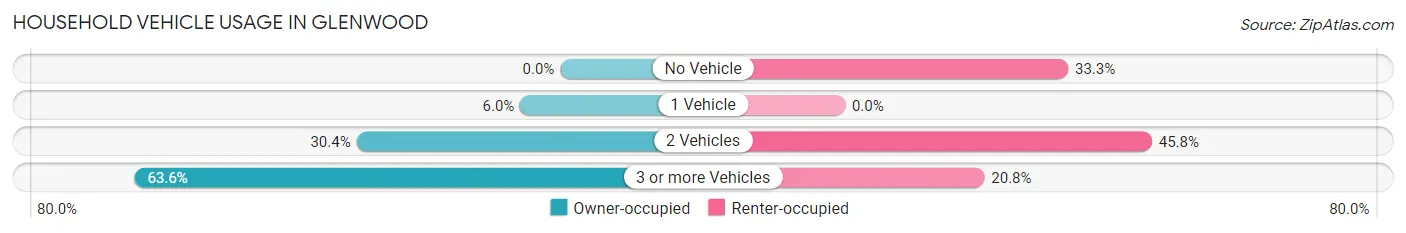
| Vehicles per Household | Owner-occupied | Renter-occupied |
| No Vehicle | 0 (0.0%) | 8 (33.3%) |
| 1 Vehicle | 11 (6.0%) | 0 (0.0%) |
| 2 Vehicles | 56 (30.4%) | 11 (45.8%) |
| 3 or more Vehicles | 117 (63.6%) | 5 (20.8%) |
| Total | 184 (100.0%) | 24 (100.0%) |
Real Estate & Mortgages in Glenwood
Real Estate and Mortgage Overview in Glenwood
| Characteristic | Without Mortgage | With Mortgage |
| Housing Units | 105 | 79 |
| Median Property Value | $321,000 | $221,700 |
| Median Household Income | - | - |
| Monthly Housing Costs | $494 | $0 |
| Real Estate Taxes | $2,118 | $1 |
Property Value by Mortgage Status in Glenwood
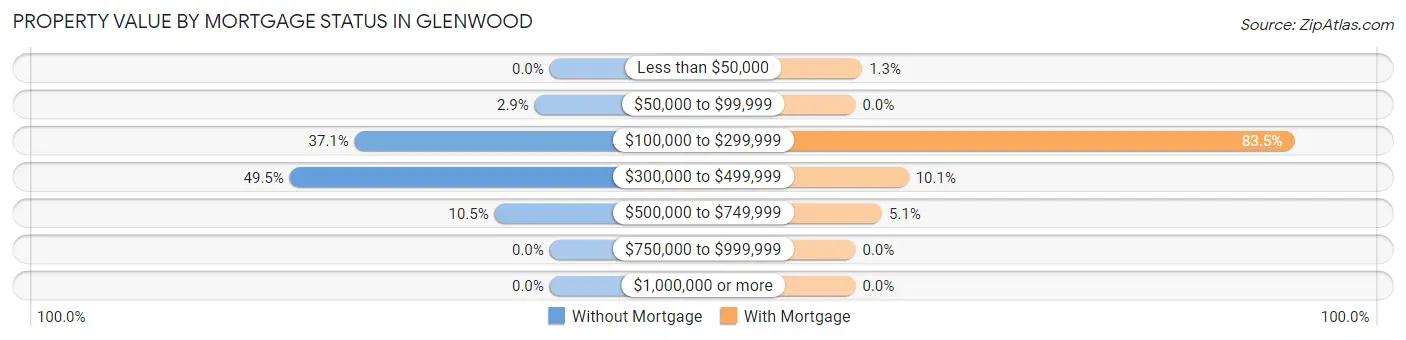
| Property Value | Without Mortgage | With Mortgage |
| Less than $50,000 | 0 (0.0%) | 1 (1.3%) |
| $50,000 to $99,999 | 3 (2.9%) | 0 (0.0%) |
| $100,000 to $299,999 | 39 (37.1%) | 66 (83.5%) |
| $300,000 to $499,999 | 52 (49.5%) | 8 (10.1%) |
| $500,000 to $749,999 | 11 (10.5%) | 4 (5.1%) |
| $750,000 to $999,999 | 0 (0.0%) | 0 (0.0%) |
| $1,000,000 or more | 0 (0.0%) | 0 (0.0%) |
| Total | 105 (100.0%) | 79 (100.0%) |
Household Income by Mortgage Status in Glenwood
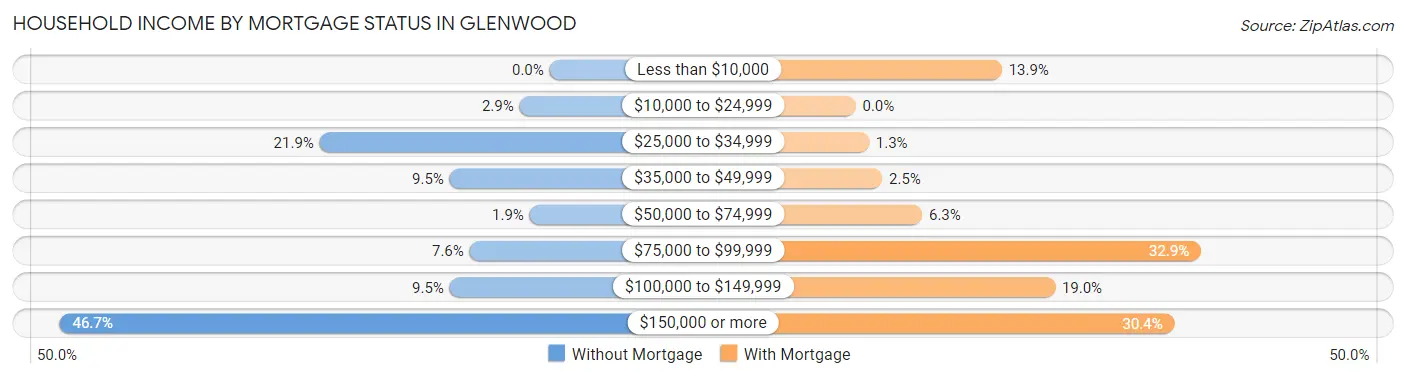
| Household Income | Without Mortgage | With Mortgage |
| Less than $10,000 | 0 (0.0%) | 11 (13.9%) |
| $10,000 to $24,999 | 3 (2.9%) | 0 (0.0%) |
| $25,000 to $34,999 | 23 (21.9%) | 1 (1.3%) |
| $35,000 to $49,999 | 10 (9.5%) | 2 (2.5%) |
| $50,000 to $74,999 | 2 (1.9%) | 5 (6.3%) |
| $75,000 to $99,999 | 8 (7.6%) | 26 (32.9%) |
| $100,000 to $149,999 | 10 (9.5%) | 15 (19.0%) |
| $150,000 or more | 49 (46.7%) | 24 (30.4%) |
| Total | 105 (100.0%) | 79 (100.0%) |
Property Value to Household Income Ratio in Glenwood
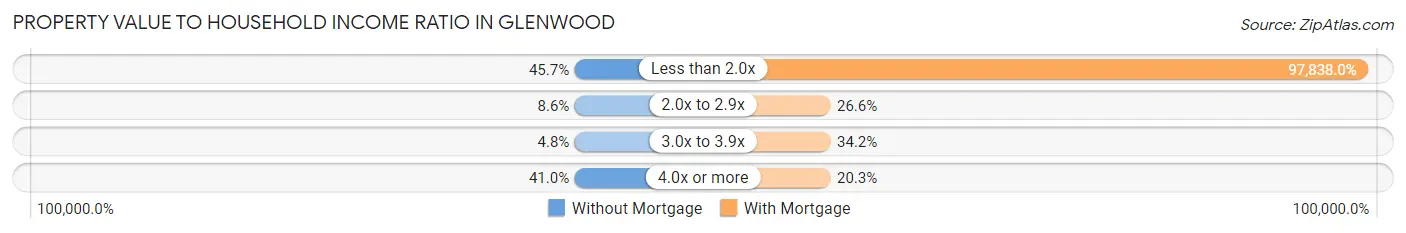
| Value-to-Income Ratio | Without Mortgage | With Mortgage |
| Less than 2.0x | 48 (45.7%) | 77,292 (97,838.0%) |
| 2.0x to 2.9x | 9 (8.6%) | 21 (26.6%) |
| 3.0x to 3.9x | 5 (4.8%) | 27 (34.2%) |
| 4.0x or more | 43 (40.9%) | 16 (20.3%) |
| Total | 105 (100.0%) | 79 (100.0%) |
Real Estate Taxes by Mortgage Status in Glenwood
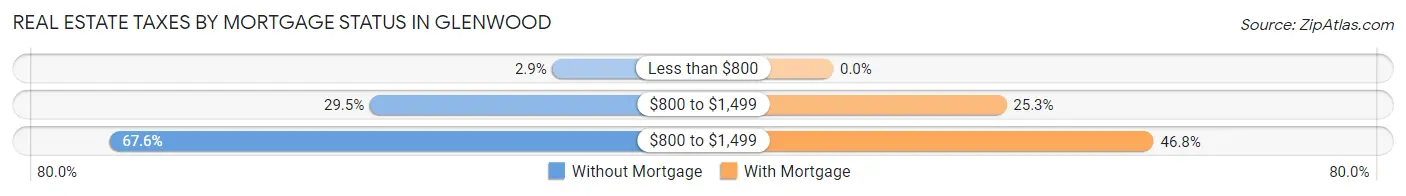
| Property Taxes | Without Mortgage | With Mortgage |
| Less than $800 | 3 (2.9%) | 0 (0.0%) |
| $800 to $1,499 | 31 (29.5%) | 20 (25.3%) |
| $800 to $1,499 | 71 (67.6%) | 37 (46.8%) |
| Total | 105 (100.0%) | 79 (100.0%) |
Health & Disability in Glenwood
Health Insurance Coverage by Age in Glenwood
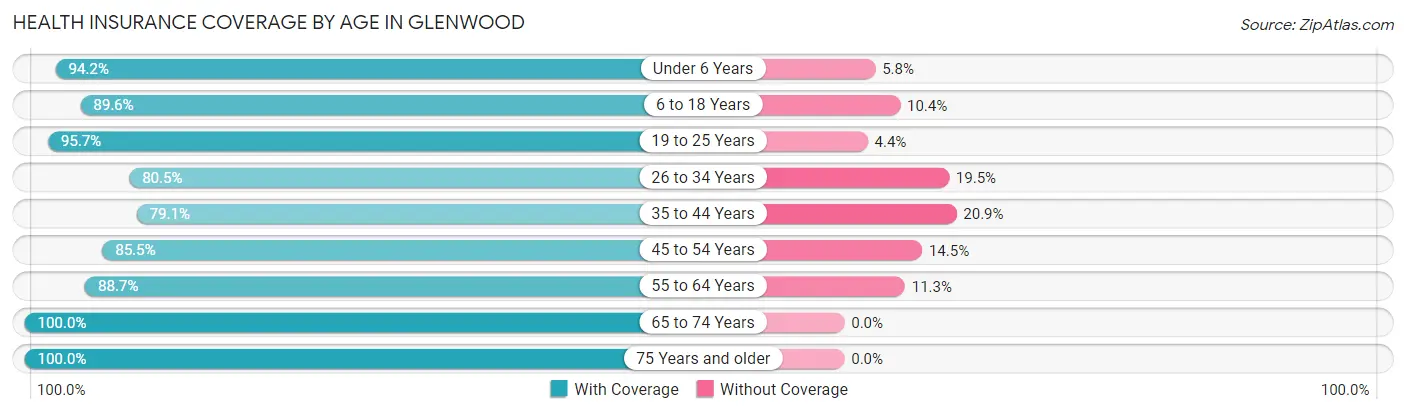
| Age Bracket | With Coverage | Without Coverage |
| Under 6 Years | 49 (94.2%) | 3 (5.8%) |
| 6 to 18 Years | 112 (89.6%) | 13 (10.4%) |
| 19 to 25 Years | 22 (95.7%) | 1 (4.3%) |
| 26 to 34 Years | 33 (80.5%) | 8 (19.5%) |
| 35 to 44 Years | 53 (79.1%) | 14 (20.9%) |
| 45 to 54 Years | 59 (85.5%) | 10 (14.5%) |
| 55 to 64 Years | 55 (88.7%) | 7 (11.3%) |
| 65 to 74 Years | 139 (100.0%) | 0 (0.0%) |
| 75 Years and older | 30 (100.0%) | 0 (0.0%) |
| Total | 552 (90.8%) | 56 (9.2%) |
Health Insurance Coverage by Citizenship Status in Glenwood
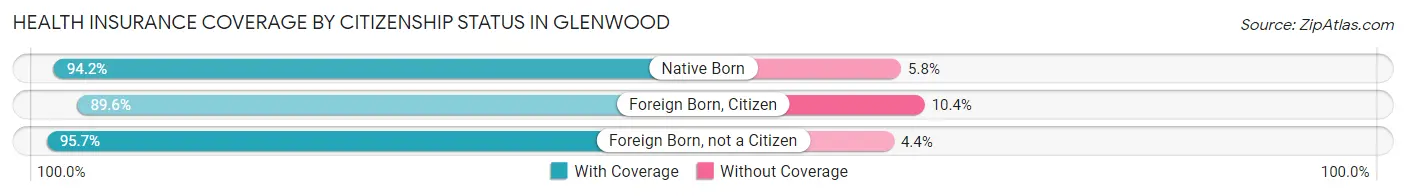
| Citizenship Status | With Coverage | Without Coverage |
| Native Born | 49 (94.2%) | 3 (5.8%) |
| Foreign Born, Citizen | 112 (89.6%) | 13 (10.4%) |
| Foreign Born, not a Citizen | 22 (95.7%) | 1 (4.3%) |
Health Insurance Coverage by Household Income in Glenwood
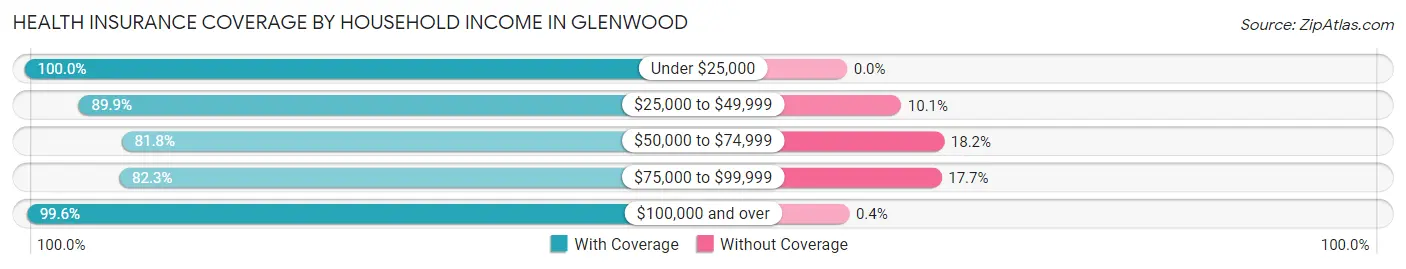
| Household Income | With Coverage | Without Coverage |
| Under $25,000 | 11 (100.0%) | 0 (0.0%) |
| $25,000 to $49,999 | 71 (89.9%) | 8 (10.1%) |
| $50,000 to $74,999 | 135 (81.8%) | 30 (18.2%) |
| $75,000 to $99,999 | 79 (82.3%) | 17 (17.7%) |
| $100,000 and over | 252 (99.6%) | 1 (0.4%) |
Public vs Private Health Insurance Coverage by Age in Glenwood
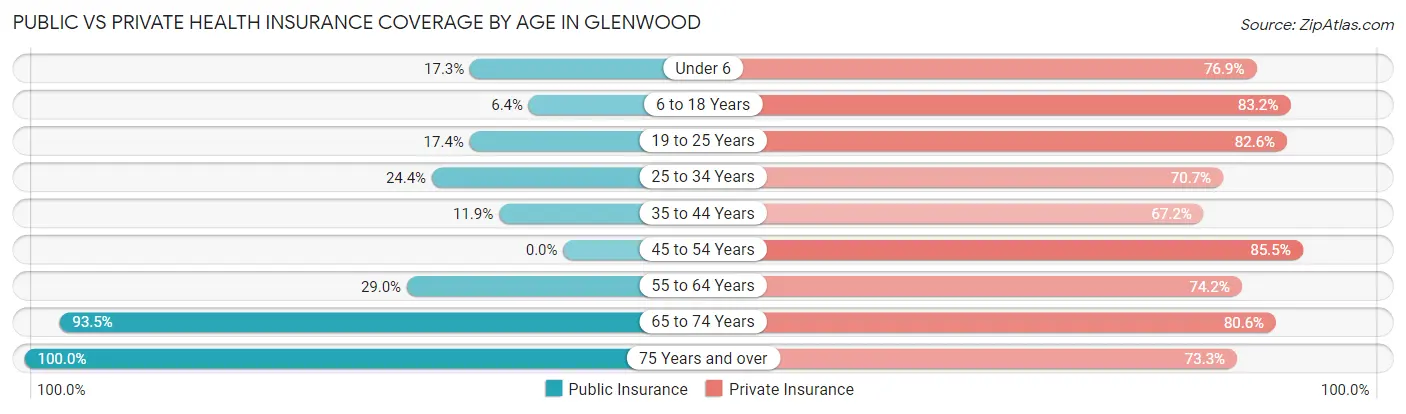
| Age Bracket | Public Insurance | Private Insurance |
| Under 6 | 9 (17.3%) | 40 (76.9%) |
| 6 to 18 Years | 8 (6.4%) | 104 (83.2%) |
| 19 to 25 Years | 4 (17.4%) | 19 (82.6%) |
| 25 to 34 Years | 10 (24.4%) | 29 (70.7%) |
| 35 to 44 Years | 8 (11.9%) | 45 (67.2%) |
| 45 to 54 Years | 0 (0.0%) | 59 (85.5%) |
| 55 to 64 Years | 18 (29.0%) | 46 (74.2%) |
| 65 to 74 Years | 130 (93.5%) | 112 (80.6%) |
| 75 Years and over | 30 (100.0%) | 22 (73.3%) |
| Total | 217 (35.7%) | 476 (78.3%) |
Disability Status by Sex by Age in Glenwood
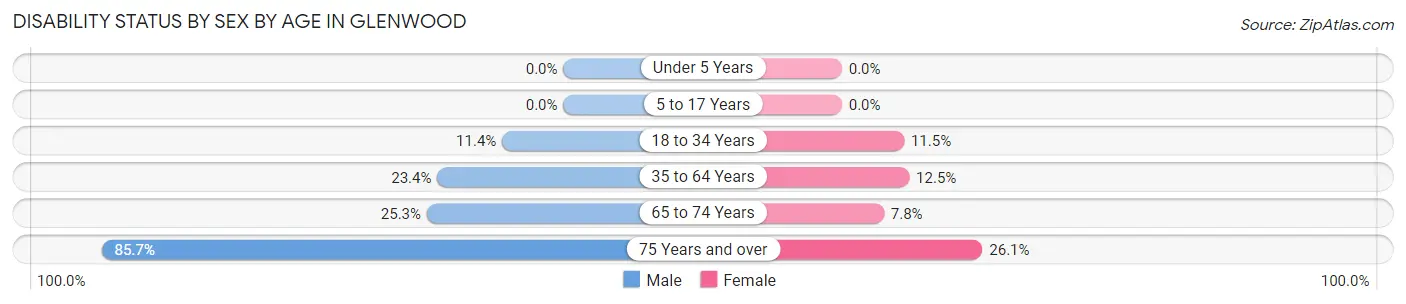
| Age Bracket | Male | Female |
| Under 5 Years | 0 (0.0%) | 0 (0.0%) |
| 5 to 17 Years | 0 (0.0%) | 0 (0.0%) |
| 18 to 34 Years | 5 (11.4%) | 3 (11.5%) |
| 35 to 64 Years | 22 (23.4%) | 13 (12.5%) |
| 65 to 74 Years | 19 (25.3%) | 5 (7.8%) |
| 75 Years and over | 6 (85.7%) | 6 (26.1%) |
Disability Class by Sex by Age in Glenwood
Disability Class: Hearing Difficulty
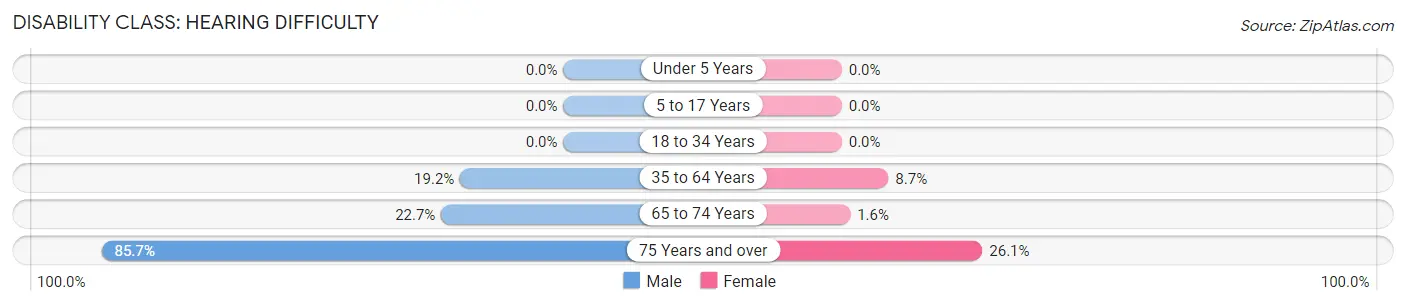
| Age Bracket | Male | Female |
| Under 5 Years | 0 (0.0%) | 0 (0.0%) |
| 5 to 17 Years | 0 (0.0%) | 0 (0.0%) |
| 18 to 34 Years | 0 (0.0%) | 0 (0.0%) |
| 35 to 64 Years | 18 (19.2%) | 9 (8.6%) |
| 65 to 74 Years | 17 (22.7%) | 1 (1.6%) |
| 75 Years and over | 6 (85.7%) | 6 (26.1%) |
Disability Class: Vision Difficulty
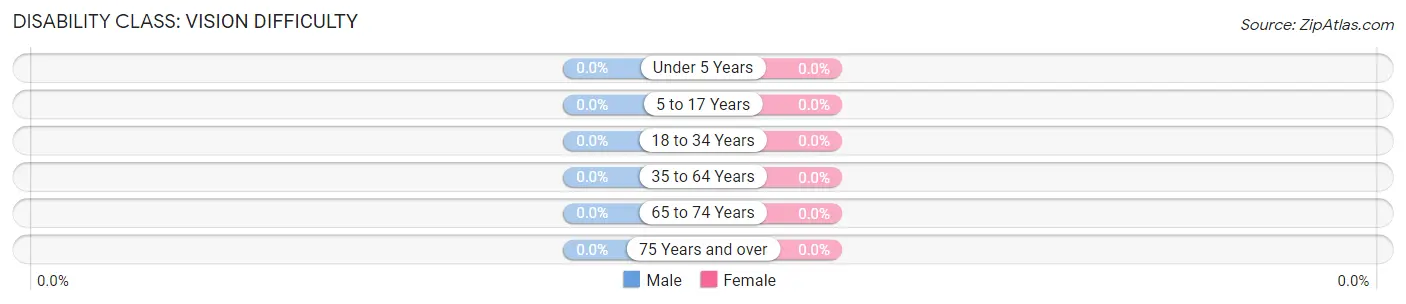
| Age Bracket | Male | Female |
| Under 5 Years | 0 (0.0%) | 0 (0.0%) |
| 5 to 17 Years | 0 (0.0%) | 0 (0.0%) |
| 18 to 34 Years | 0 (0.0%) | 0 (0.0%) |
| 35 to 64 Years | 0 (0.0%) | 0 (0.0%) |
| 65 to 74 Years | 0 (0.0%) | 0 (0.0%) |
| 75 Years and over | 0 (0.0%) | 0 (0.0%) |
Disability Class: Cognitive Difficulty
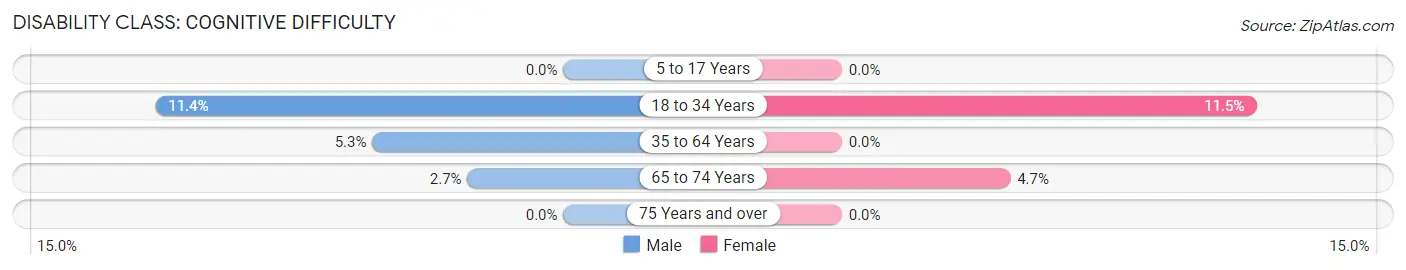
| Age Bracket | Male | Female |
| 5 to 17 Years | 0 (0.0%) | 0 (0.0%) |
| 18 to 34 Years | 5 (11.4%) | 3 (11.5%) |
| 35 to 64 Years | 5 (5.3%) | 0 (0.0%) |
| 65 to 74 Years | 2 (2.7%) | 3 (4.7%) |
| 75 Years and over | 0 (0.0%) | 0 (0.0%) |
Disability Class: Ambulatory Difficulty
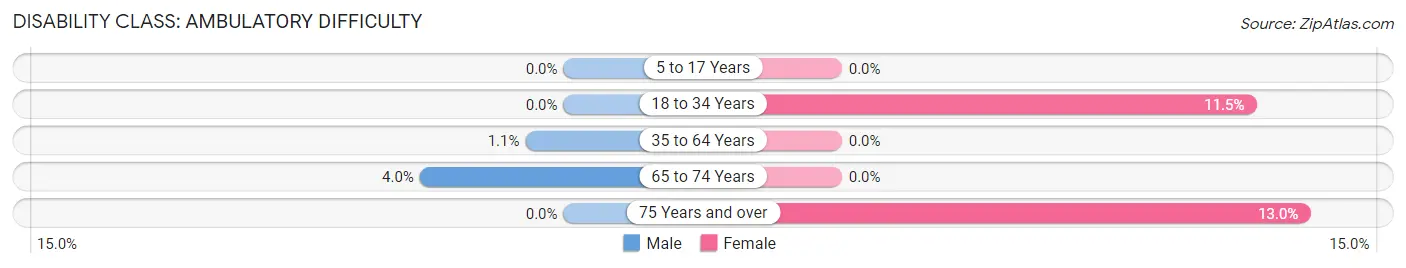
| Age Bracket | Male | Female |
| 5 to 17 Years | 0 (0.0%) | 0 (0.0%) |
| 18 to 34 Years | 0 (0.0%) | 3 (11.5%) |
| 35 to 64 Years | 1 (1.1%) | 0 (0.0%) |
| 65 to 74 Years | 3 (4.0%) | 0 (0.0%) |
| 75 Years and over | 0 (0.0%) | 3 (13.0%) |
Disability Class: Self-Care Difficulty
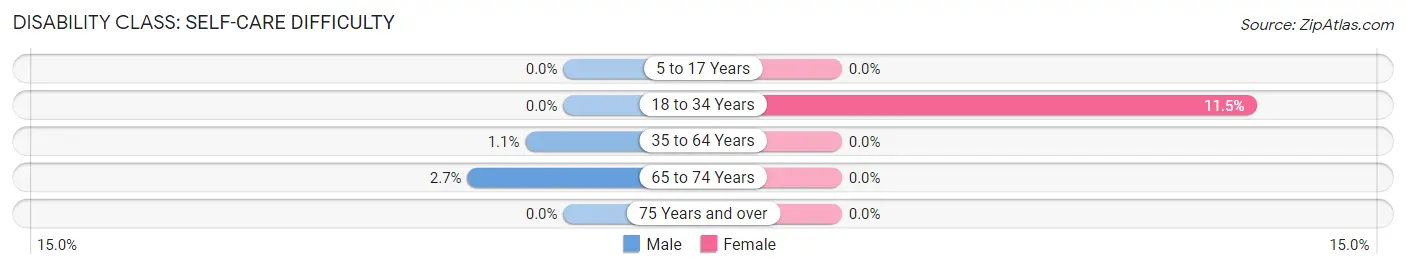
| Age Bracket | Male | Female |
| 5 to 17 Years | 0 (0.0%) | 0 (0.0%) |
| 18 to 34 Years | 0 (0.0%) | 3 (11.5%) |
| 35 to 64 Years | 1 (1.1%) | 0 (0.0%) |
| 65 to 74 Years | 2 (2.7%) | 0 (0.0%) |
| 75 Years and over | 0 (0.0%) | 0 (0.0%) |
Technology Access in Glenwood
Computing Device Access in Glenwood
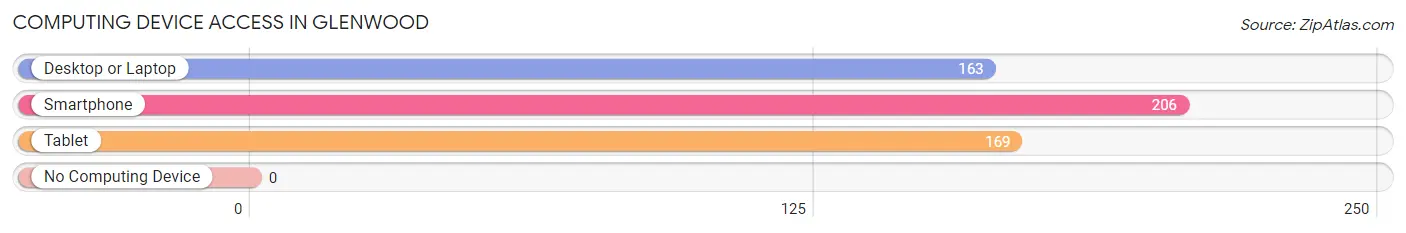
| Device Type | # Households | % Households |
| Desktop or Laptop | 163 | 78.4% |
| Smartphone | 206 | 99.0% |
| Tablet | 169 | 81.2% |
| No Computing Device | 0 | 0.0% |
| Total | 208 | 100.0% |
Internet Access in Glenwood
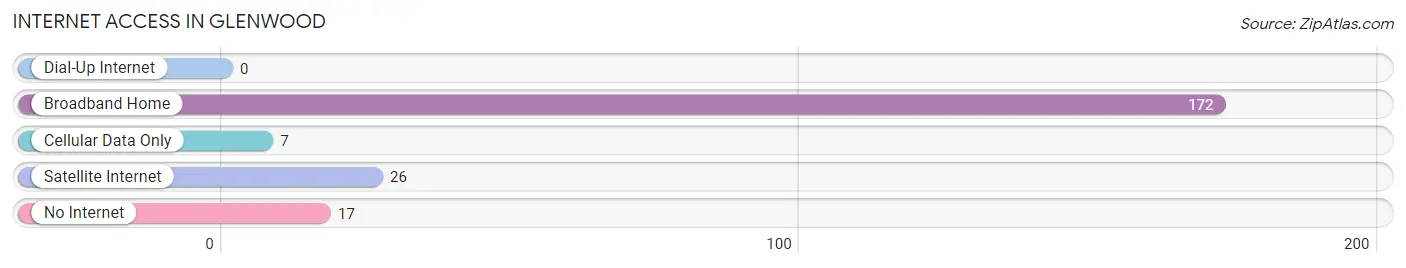
| Internet Type | # Households | % Households |
| Dial-Up Internet | 0 | 0.0% |
| Broadband Home | 172 | 82.7% |
| Cellular Data Only | 7 | 3.4% |
| Satellite Internet | 26 | 12.5% |
| No Internet | 17 | 8.2% |
| Total | 208 | 100.0% |
Glenwood Summary
Glenwood is a small unincorporated community located in the southeastern corner of Utah, in the United States. It is situated in the San Rafael Swell, a large geological formation in the Colorado Plateau. The town is located in Emery County, and is the closest settlement to the San Rafael Swell's western entrance.
History
Glenwood was first settled in the late 1800s by Mormon pioneers. The town was originally known as "Little Muddy" due to the muddy conditions of the area. The name was changed to Glenwood in 1891, after the nearby Glenwood Springs. The town was incorporated in 1895, and the first post office was established in 1896.
The town was a popular stop for travelers and settlers heading to the nearby San Rafael Swell. The area was also known for its coal mining operations, which began in the early 1900s. The coal mines were eventually closed in the 1950s, and the town's population began to decline.
Geography
Glenwood is located in the San Rafael Swell, a large geological formation in the Colorado Plateau. The town is situated at an elevation of 5,400 feet (1,646 m). The area is characterized by its rugged terrain, with steep canyons and mesas. The town is located in Emery County, and is the closest settlement to the San Rafael Swell's western entrance.
The climate in Glenwood is semi-arid, with hot summers and cold winters. The average annual precipitation is 8.5 inches (216 mm).
Economy
The economy of Glenwood is largely based on tourism. The town is a popular destination for outdoor recreation, such as camping, hiking, and fishing. The nearby San Rafael Swell is a popular destination for rock climbing, mountain biking, and off-roading.
The town is also home to a number of small businesses, including a gas station, a grocery store, and a few restaurants. The town is also home to a number of small-scale agricultural operations, such as cattle ranching and hay farming.
Demographics
As of the 2010 census, the population of Glenwood was 545. The racial makeup of the town was 97.3% White, 0.2% African American, 0.2% Native American, 0.2% Asian, 0.2% Pacific Islander, 0.7% from other races, and 1.2% from two or more races. Hispanic or Latino of any race were 2.2% of the population.
The median household income in Glenwood was $37,500, and the median family income was $41,250. The per capita income was $17,818. About 11.2% of families and 14.2% of the population were below the poverty line, including 17.2% of those under age 18 and none of those age 65 or over.
Common Questions
What is Per Capita Income in Glenwood?
Per Capita income in Glenwood is $38,812.
What is the Median Family Income in Glenwood?
Median Family Income in Glenwood is $107,500.
What is the Median Household income in Glenwood?
Median Household Income in Glenwood is $87,500.
What is Income or Wage Gap in Glenwood?
Income or Wage Gap in Glenwood is 66.7%.
Women in Glenwood earn 33.3 cents for every dollar earned by a man.
What is Inequality or Gini Index in Glenwood?
Inequality or Gini Index in Glenwood is 0.35.
What is the Total Population of Glenwood?
Total Population of Glenwood is 608.
What is the Total Male Population of Glenwood?
Total Male Population of Glenwood is 299.
What is the Total Female Population of Glenwood?
Total Female Population of Glenwood is 309.
What is the Ratio of Males per 100 Females in Glenwood?
There are 96.76 Males per 100 Females in Glenwood.
What is the Ratio of Females per 100 Males in Glenwood?
There are 103.34 Females per 100 Males in Glenwood.
What is the Median Population Age in Glenwood?
Median Population Age in Glenwood is 43.5 Years.
What is the Average Family Size in Glenwood
Average Family Size in Glenwood is 3.1 People.
What is the Average Household Size in Glenwood
Average Household Size in Glenwood is 2.9 People.
How Large is the Labor Force in Glenwood?
There are 263 People in the Labor Forcein in Glenwood.
What is the Percentage of People in the Labor Force in Glenwood?
59.0% of People are in the Labor Force in Glenwood.
What is the Unemployment Rate in Glenwood?
Unemployment Rate in Glenwood is 0.8%.