Summit, UT Map & Demographics
Summit Map
Summit Overview
$44,668
PER CAPITA INCOME
$95,769
AVG FAMILY INCOME
$95,769
AVG HOUSEHOLD INCOME
0.33
INEQUALITY / GINI INDEX
234
TOTAL POPULATION
128
MALE POPULATION
106
FEMALE POPULATION
120.75
MALES / 100 FEMALES
82.81
FEMALES / 100 MALES
54.4
MEDIAN AGE
2.6
AVG FAMILY SIZE
2.9
AVG HOUSEHOLD SIZE
135
LABOR FORCE [ PEOPLE ]
69.2%
PERCENT IN LABOR FORCE
Summit Zip Codes
Summit Area Codes
Income in Summit
Income Overview in Summit
Per Capita Income in Summit is $44,668, while median incomes of families and households are $95,769 and $95,769 respectively.
| Characteristic | Number | Measure |
| Per Capita Income | 234 | $44,668 |
| Median Family Income | 82 | $95,769 |
| Mean Family Income | 82 | $115,668 |
| Median Household Income | 82 | $95,769 |
| Mean Household Income | 82 | $116,679 |
| Income Deficit | 82 | $0 |
| Wage / Income Gap (%) | 234 | 0.00% |
| Wage / Income Gap ($) | 234 | 100.00¢ per $1 |
| Gini / Inequality Index | 234 | 0.33 |
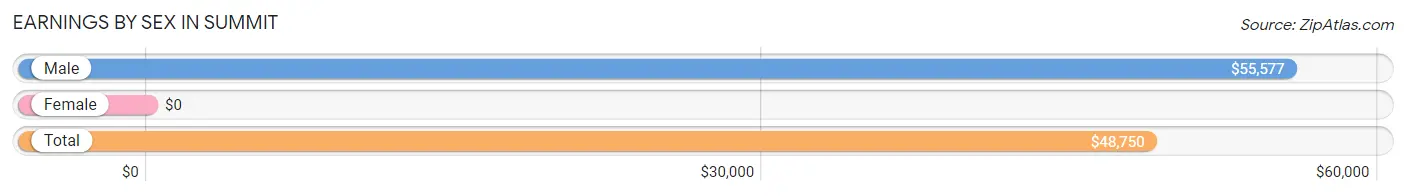
Earnings by Sex in Summit
| Sex | Number | Average Earnings |
| Male | 98 (72.6%) | $55,577 |
| Female | 37 (27.4%) | $0 |
| Total | 135 (100.0%) | $48,750 |
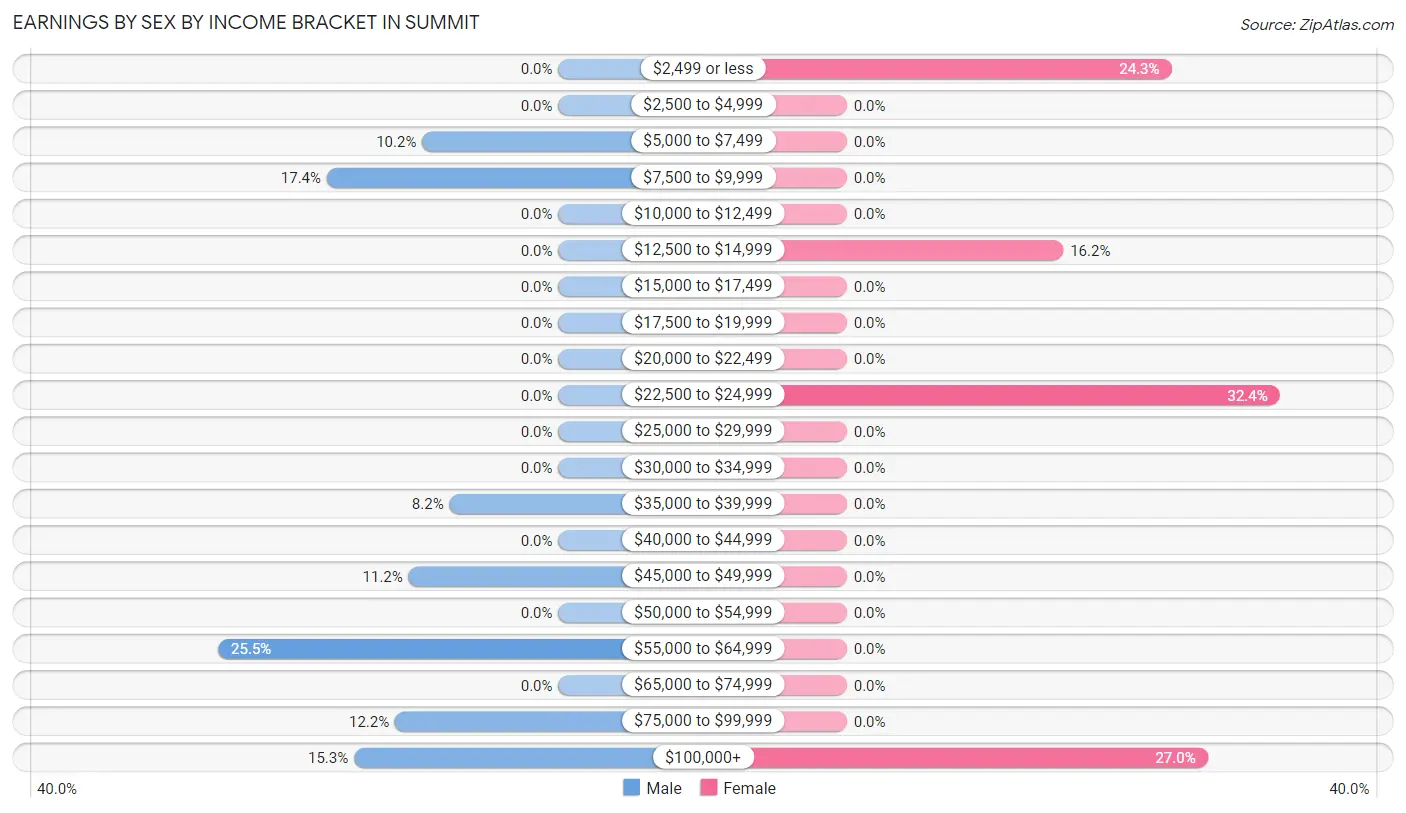
Earnings by Sex by Income Bracket in Summit
The most common earnings brackets in Summit are $55,000 to $64,999 for men (25 | 25.5%) and $22,500 to $24,999 for women (12 | 32.4%).
| Income | Male | Female |
| $2,499 or less | 0 (0.0%) | 9 (24.3%) |
| $2,500 to $4,999 | 0 (0.0%) | 0 (0.0%) |
| $5,000 to $7,499 | 10 (10.2%) | 0 (0.0%) |
| $7,500 to $9,999 | 17 (17.3%) | 0 (0.0%) |
| $10,000 to $12,499 | 0 (0.0%) | 0 (0.0%) |
| $12,500 to $14,999 | 0 (0.0%) | 6 (16.2%) |
| $15,000 to $17,499 | 0 (0.0%) | 0 (0.0%) |
| $17,500 to $19,999 | 0 (0.0%) | 0 (0.0%) |
| $20,000 to $22,499 | 0 (0.0%) | 0 (0.0%) |
| $22,500 to $24,999 | 0 (0.0%) | 12 (32.4%) |
| $25,000 to $29,999 | 0 (0.0%) | 0 (0.0%) |
| $30,000 to $34,999 | 0 (0.0%) | 0 (0.0%) |
| $35,000 to $39,999 | 8 (8.2%) | 0 (0.0%) |
| $40,000 to $44,999 | 0 (0.0%) | 0 (0.0%) |
| $45,000 to $49,999 | 11 (11.2%) | 0 (0.0%) |
| $50,000 to $54,999 | 0 (0.0%) | 0 (0.0%) |
| $55,000 to $64,999 | 25 (25.5%) | 0 (0.0%) |
| $65,000 to $74,999 | 0 (0.0%) | 0 (0.0%) |
| $75,000 to $99,999 | 12 (12.2%) | 0 (0.0%) |
| $100,000+ | 15 (15.3%) | 10 (27.0%) |
| Total | 98 (100.0%) | 37 (100.0%) |
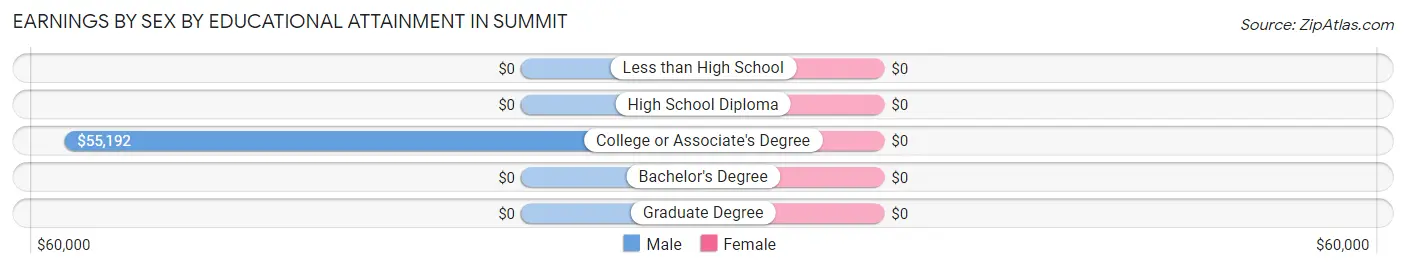
Earnings by Sex by Educational Attainment in Summit
| Educational Attainment | Male Income | Female Income |
| Less than High School | - | - |
| High School Diploma | - | - |
| College or Associate's Degree | $55,192 | $0 |
| Bachelor's Degree | - | - |
| Graduate Degree | - | - |
| Total | $55,577 | $0 |
Family Income in Summit
Family Income Brackets in Summit
According to the Summit family income data, there are 25 families falling into the $200,000+ income range, which is the most common income bracket and makes up 30.5% of all families.
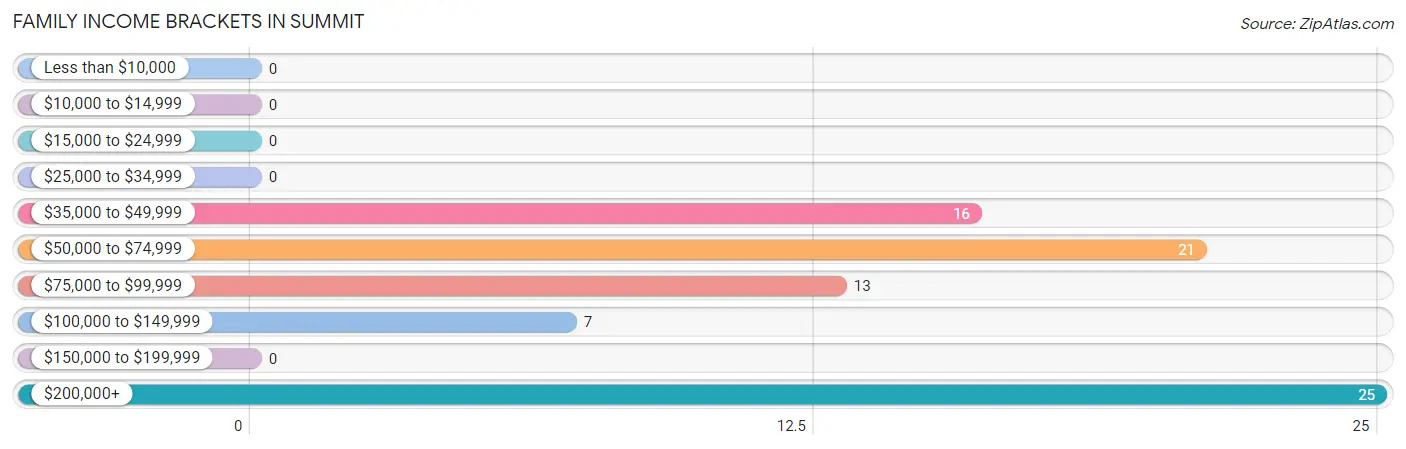
| Income Bracket | # Families | % Families |
| Less than $10,000 | 0 | 0.0% |
| $10,000 to $14,999 | 0 | 0.0% |
| $15,000 to $24,999 | 0 | 0.0% |
| $25,000 to $34,999 | 0 | 0.0% |
| $35,000 to $49,999 | 16 | 19.5% |
| $50,000 to $74,999 | 21 | 25.6% |
| $75,000 to $99,999 | 13 | 15.9% |
| $100,000 to $149,999 | 7 | 8.5% |
| $150,000 to $199,999 | 0 | 0.0% |
| $200,000+ | 25 | 30.5% |
Family Income by Famaliy Size in Summit
| Income Bracket | # Families | Median Income |
| 2-Person Families | 50 (61.0%) | $0 |
| 3-Person Families | 22 (26.8%) | $0 |
| 4-Person Families | 10 (12.2%) | $0 |
| 5-Person Families | 0 (0.0%) | $0 |
| 6-Person Families | 0 (0.0%) | $0 |
| 7+ Person Families | 0 (0.0%) | $0 |
| Total | 82 (100.0%) | $95,769 |
Family Income by Number of Earners in Summit
| Number of Earners | # Families | Median Income |
| No Earners | 13 (15.9%) | $0 |
| 1 Earner | 34 (41.5%) | $0 |
| 2 Earners | 35 (42.7%) | $0 |
| 3+ Earners | 0 (0.0%) | $0 |
| Total | 82 (100.0%) | $95,769 |
Household Income in Summit
Household Income Brackets in Summit
With 25 households falling in the category, the $200,000+ income range is the most frequent in Summit, accounting for 30.5% of all households.
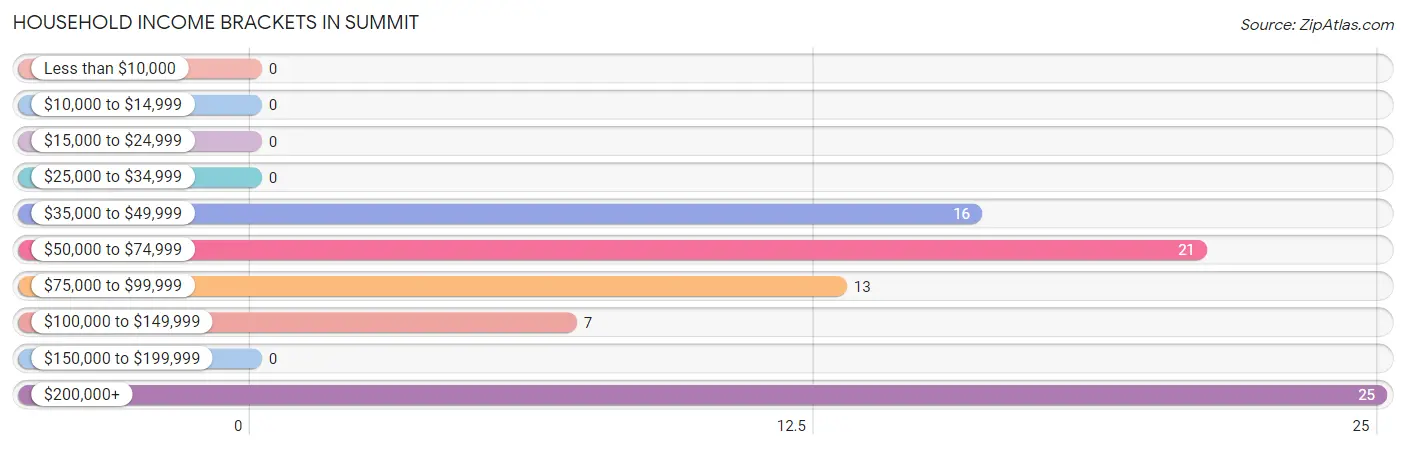
| Income Bracket | # Households | % Households |
| Less than $10,000 | 0 | 0.0% |
| $10,000 to $14,999 | 0 | 0.0% |
| $15,000 to $24,999 | 0 | 0.0% |
| $25,000 to $34,999 | 0 | 0.0% |
| $35,000 to $49,999 | 16 | 19.5% |
| $50,000 to $74,999 | 21 | 25.6% |
| $75,000 to $99,999 | 13 | 15.9% |
| $100,000 to $149,999 | 7 | 8.5% |
| $150,000 to $199,999 | 0 | 0.0% |
| $200,000+ | 25 | 30.5% |
Household Income by Householder Age in Summit
| Income Bracket | # Households | Median Income |
| 15 to 24 Years | 0 (0.0%) | $0 |
| 25 to 44 Years | 9 (11.0%) | $0 |
| 45 to 64 Years | 66 (80.5%) | $0 |
| 65+ Years | 7 (8.5%) | $0 |
| Total | 82 (100.0%) | $95,769 |
Poverty in Summit
Income Below Poverty by Sex and Age in Summit
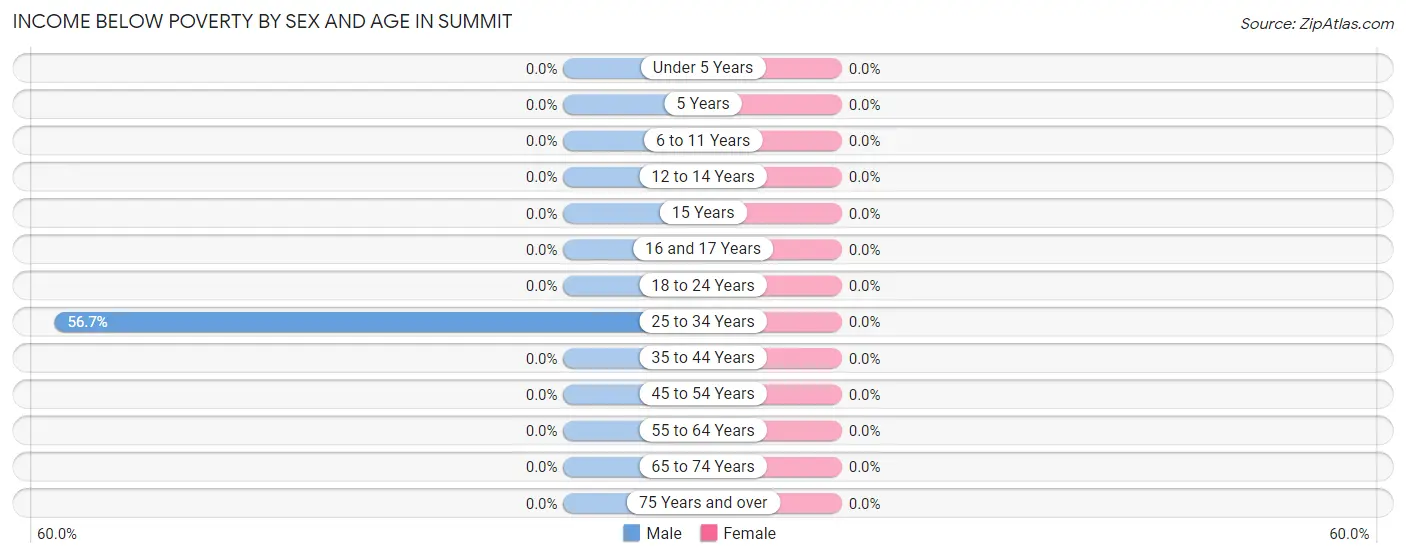
| Age Bracket | Male | Female |
| Under 5 Years | 0 (0.0%) | 0 (0.0%) |
| 5 Years | 0 (0.0%) | 0 (0.0%) |
| 6 to 11 Years | 0 (0.0%) | 0 (0.0%) |
| 12 to 14 Years | 0 (0.0%) | 0 (0.0%) |
| 15 Years | 0 (0.0%) | 0 (0.0%) |
| 16 and 17 Years | 0 (0.0%) | 0 (0.0%) |
| 18 to 24 Years | 0 (0.0%) | 0 (0.0%) |
| 25 to 34 Years | 17 (56.7%) | 0 (0.0%) |
| 35 to 44 Years | 0 (0.0%) | 0 (0.0%) |
| 45 to 54 Years | 0 (0.0%) | 0 (0.0%) |
| 55 to 64 Years | 0 (0.0%) | 0 (0.0%) |
| 65 to 74 Years | 0 (0.0%) | 0 (0.0%) |
| 75 Years and over | 0 (0.0%) | 0 (0.0%) |
| Total | 17 (13.3%) | 0 (0.0%) |
Income Above Poverty by Sex and Age in Summit
According to the poverty statistics in Summit, males aged 5 years and females aged under 5 years are the age groups that are most secure financially, with 100.0% of males and 100.0% of females in these age groups living above the poverty line.
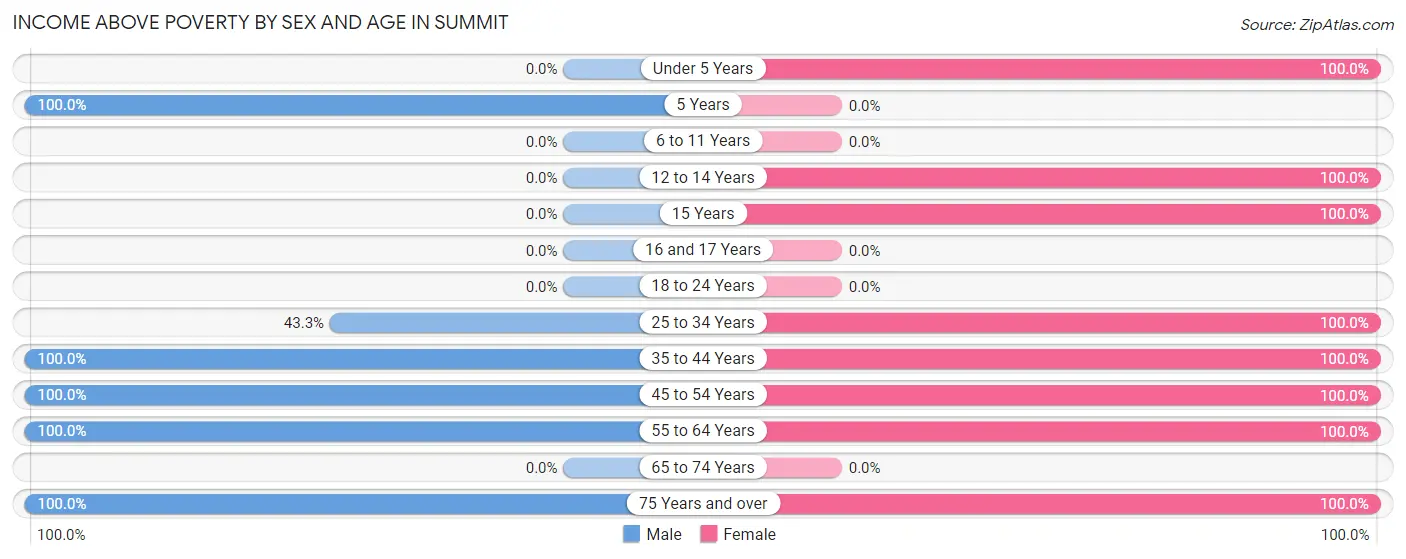
| Age Bracket | Male | Female |
| Under 5 Years | 0 (0.0%) | 9 (100.0%) |
| 5 Years | 10 (100.0%) | 0 (0.0%) |
| 6 to 11 Years | 0 (0.0%) | 0 (0.0%) |
| 12 to 14 Years | 0 (0.0%) | 7 (100.0%) |
| 15 Years | 0 (0.0%) | 13 (100.0%) |
| 16 and 17 Years | 0 (0.0%) | 0 (0.0%) |
| 18 to 24 Years | 0 (0.0%) | 0 (0.0%) |
| 25 to 34 Years | 13 (43.3%) | 9 (100.0%) |
| 35 to 44 Years | 11 (100.0%) | 12 (100.0%) |
| 45 to 54 Years | 10 (100.0%) | 17 (100.0%) |
| 55 to 64 Years | 60 (100.0%) | 30 (100.0%) |
| 65 to 74 Years | 0 (0.0%) | 0 (0.0%) |
| 75 Years and over | 7 (100.0%) | 9 (100.0%) |
| Total | 111 (86.7%) | 106 (100.0%) |
Income Below Poverty Among Married-Couple Families in Summit
| Children | Above Poverty | Below Poverty |
| No Children | 45 (100.0%) | 0 (0.0%) |
| 1 or 2 Children | 25 (100.0%) | 0 (0.0%) |
| 3 or 4 Children | 0 (0.0%) | 0 (0.0%) |
| 5 or more Children | 0 (0.0%) | 0 (0.0%) |
| Total | 70 (100.0%) | 0 (0.0%) |
Income Below Poverty Among Single-Parent Households in Summit
| Children | Single Father | Single Mother |
| No Children | 0 (0.0%) | 0 (0.0%) |
| 1 or 2 Children | 0 (0.0%) | 0 (0.0%) |
| 3 or 4 Children | 0 (0.0%) | 0 (0.0%) |
| 5 or more Children | 0 (0.0%) | 0 (0.0%) |
| Total | 0 (0.0%) | 0 (0.0%) |
Income Below Poverty Among Married-Couple vs Single-Parent Households in Summit
| Children | Married-Couple Families | Single-Parent Households |
| No Children | 0 (0.0%) | 0 (0.0%) |
| 1 or 2 Children | 0 (0.0%) | 0 (0.0%) |
| 3 or 4 Children | 0 (0.0%) | 0 (0.0%) |
| 5 or more Children | 0 (0.0%) | 0 (0.0%) |
| Total | 0 (0.0%) | 0 (0.0%) |
Race in Summit
The most populous races in Summit are White / Caucasian (234 | 100.0%), and Hispanic or Latino (10 | 4.3%).
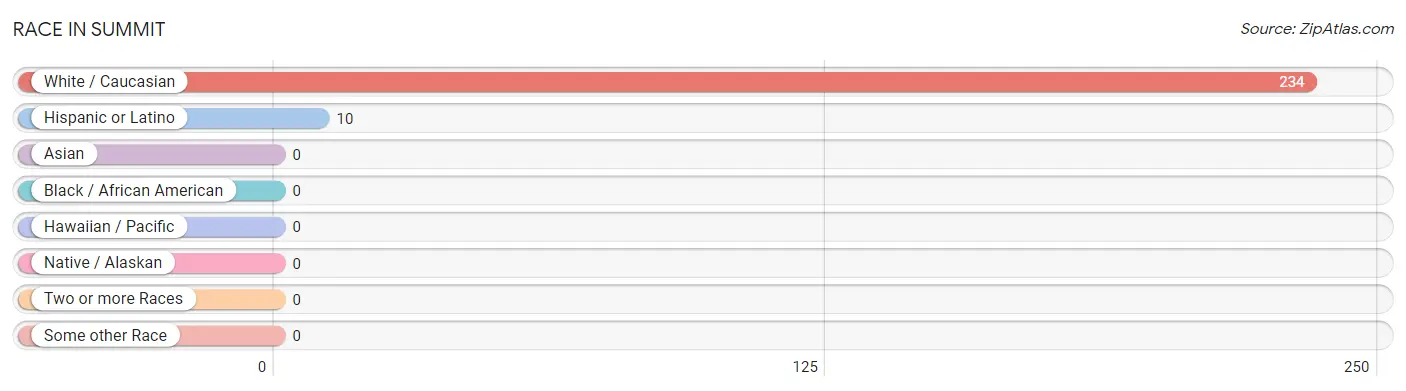
| Race | # Population | % Population |
| Asian | 0 | 0.0% |
| Black / African American | 0 | 0.0% |
| Hawaiian / Pacific | 0 | 0.0% |
| Hispanic or Latino | 10 | 4.3% |
| Native / Alaskan | 0 | 0.0% |
| White / Caucasian | 234 | 100.0% |
| Two or more Races | 0 | 0.0% |
| Some other Race | 0 | 0.0% |
| Total | 234 | 100.0% |
Ancestry in Summit
The most populous ancestries reported in Summit are English (90 | 38.5%), Swedish (26 | 11.1%), Irish (25 | 10.7%), Norwegian (25 | 10.7%), and French (22 | 9.4%), together accounting for 80.3% of all Summit residents.
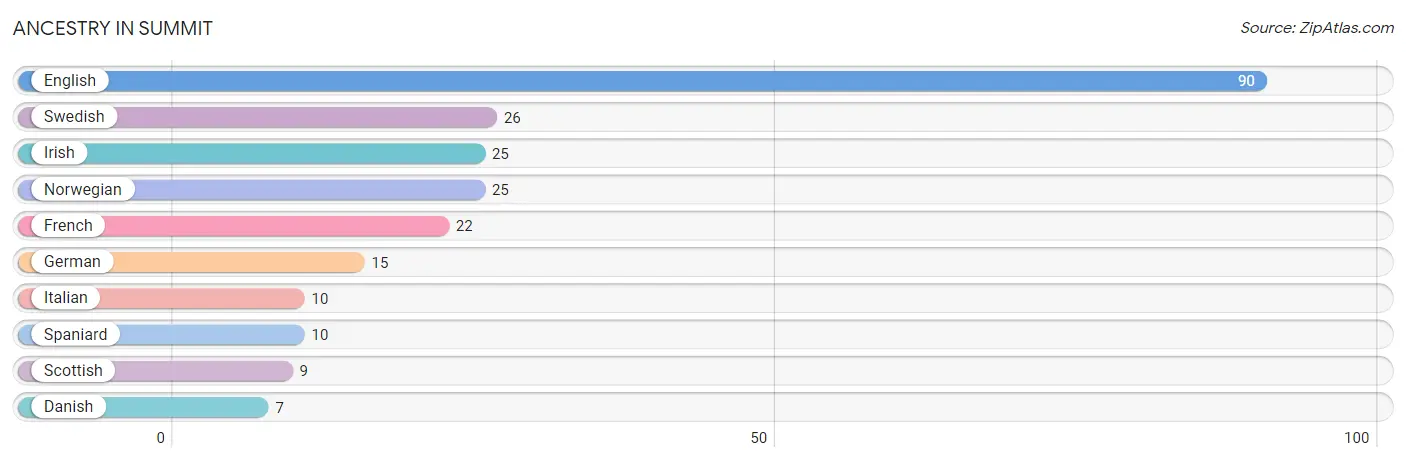
| Ancestry | # Population | % Population |
| Danish | 7 | 3.0% |
| English | 90 | 38.5% |
| French | 22 | 9.4% |
| German | 15 | 6.4% |
| Irish | 25 | 10.7% |
| Italian | 10 | 4.3% |
| Norwegian | 25 | 10.7% |
| Scottish | 9 | 3.8% |
| Spaniard | 10 | 4.3% |
| Swedish | 26 | 11.1% | View All 10 Rows |
Immigrants in Summit

| Immigration Origin | # Population | % Population | View All 0 Rows |
Sex and Age in Summit
Sex and Age in Summit
The most populous age groups in Summit are 55 to 59 Years (47 | 36.7%) for men and 55 to 59 Years (21 | 19.8%) for women.
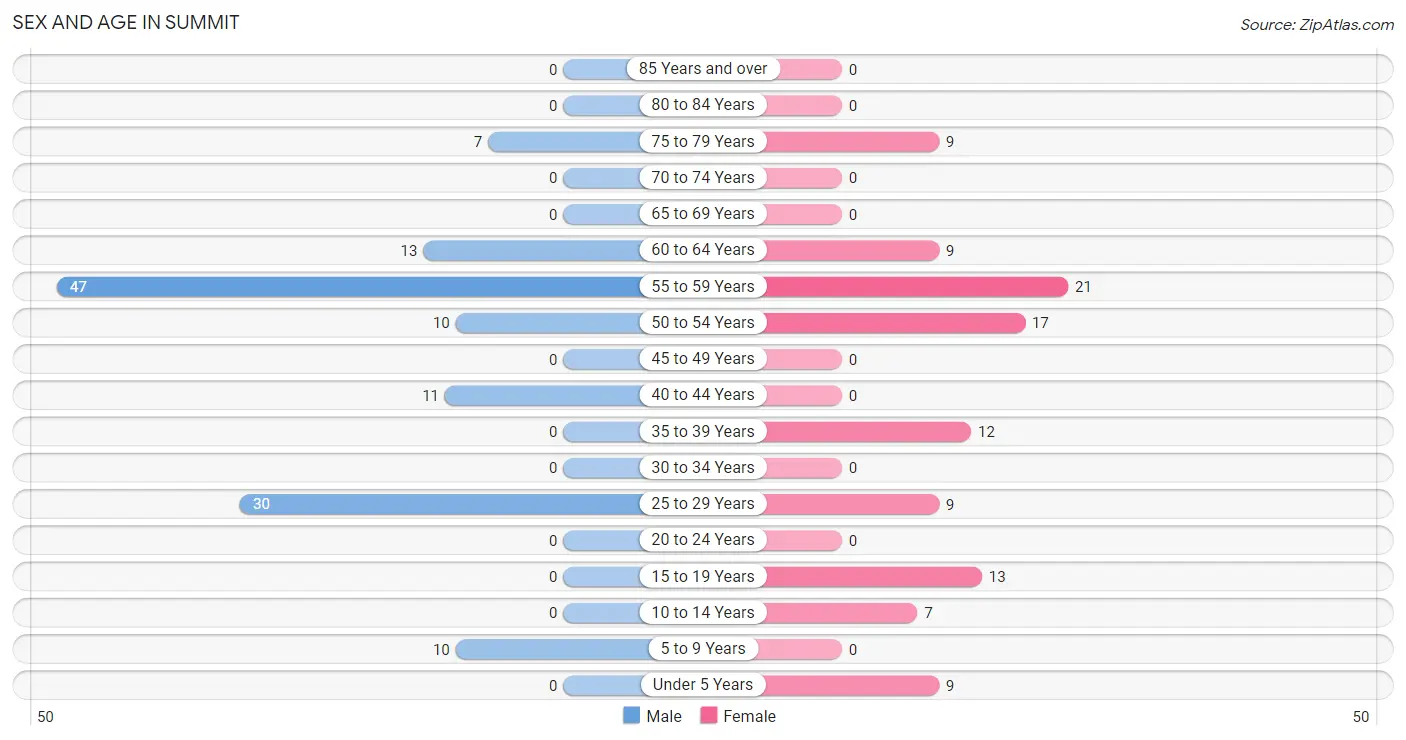
| Age Bracket | Male | Female |
| Under 5 Years | 0 (0.0%) | 9 (8.5%) |
| 5 to 9 Years | 10 (7.8%) | 0 (0.0%) |
| 10 to 14 Years | 0 (0.0%) | 7 (6.6%) |
| 15 to 19 Years | 0 (0.0%) | 13 (12.3%) |
| 20 to 24 Years | 0 (0.0%) | 0 (0.0%) |
| 25 to 29 Years | 30 (23.4%) | 9 (8.5%) |
| 30 to 34 Years | 0 (0.0%) | 0 (0.0%) |
| 35 to 39 Years | 0 (0.0%) | 12 (11.3%) |
| 40 to 44 Years | 11 (8.6%) | 0 (0.0%) |
| 45 to 49 Years | 0 (0.0%) | 0 (0.0%) |
| 50 to 54 Years | 10 (7.8%) | 17 (16.0%) |
| 55 to 59 Years | 47 (36.7%) | 21 (19.8%) |
| 60 to 64 Years | 13 (10.2%) | 9 (8.5%) |
| 65 to 69 Years | 0 (0.0%) | 0 (0.0%) |
| 70 to 74 Years | 0 (0.0%) | 0 (0.0%) |
| 75 to 79 Years | 7 (5.5%) | 9 (8.5%) |
| 80 to 84 Years | 0 (0.0%) | 0 (0.0%) |
| 85 Years and over | 0 (0.0%) | 0 (0.0%) |
| Total | 128 (100.0%) | 106 (100.0%) |
Families and Households in Summit
Median Family Size in Summit
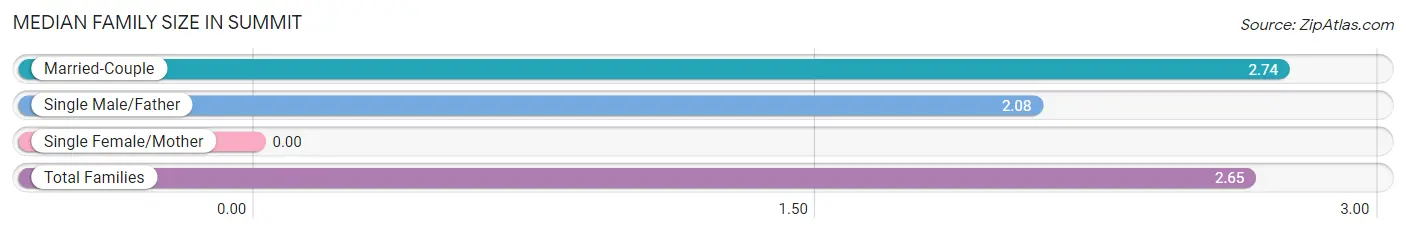
| Family Type | # Families | Family Size |
| Married-Couple | 70 (85.4%) | 2.74 |
| Single Male/Father | 12 (14.6%) | 2.08 |
| Single Female/Mother | 0 (0.0%) | - |
| Total Families | 82 (100.0%) | 2.65 |
Median Household Size in Summit
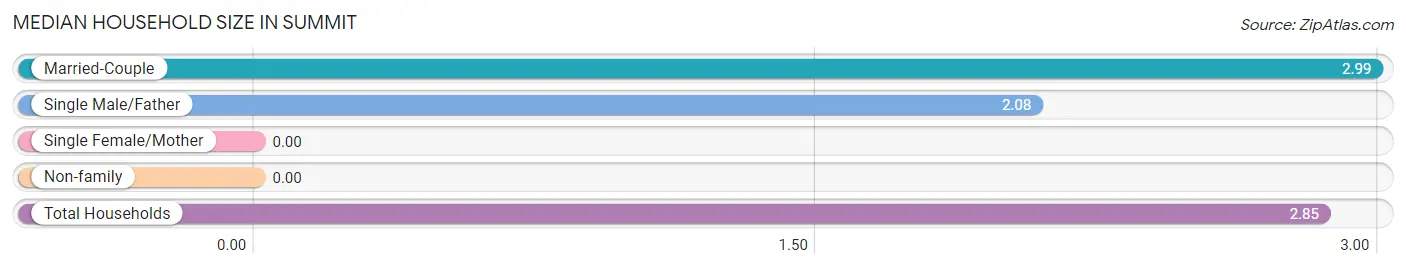
| Household Type | # Households | Household Size |
| Married-Couple | 70 (85.4%) | 2.99 |
| Single Male/Father | 12 (14.6%) | 2.08 |
| Single Female/Mother | 0 (0.0%) | - |
| Non-family | 0 (0.0%) | - |
| Total Households | 82 (100.0%) | 2.85 |
Household Size by Marriage Status in Summit
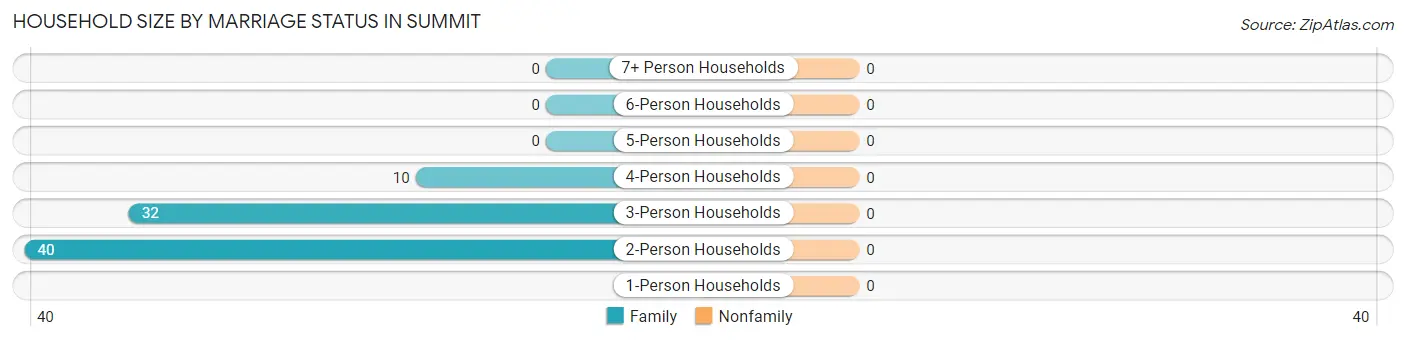
| Household Size | Family Households | Nonfamily Households |
| 1-Person Households | - | 0 (0.0%) |
| 2-Person Households | 40 (48.8%) | 0 (0.0%) |
| 3-Person Households | 32 (39.0%) | 0 (0.0%) |
| 4-Person Households | 10 (12.2%) | 0 (0.0%) |
| 5-Person Households | 0 (0.0%) | 0 (0.0%) |
| 6-Person Households | 0 (0.0%) | 0 (0.0%) |
| 7+ Person Households | 0 (0.0%) | 0 (0.0%) |
| Total | 82 (100.0%) | 0 (0.0%) |
Female Fertility in Summit
Fertility by Age in Summit
| Age Bracket | Women with Births | Births / 1,000 Women |
| 15 to 19 years | 0 (0.0%) | 0.0 |
| 20 to 34 years | 0 (0.0%) | 0.0 |
| 35 to 50 years | 0 (0.0%) | 0.0 |
| Total | 0 (0.0%) | 0.0 |
Fertility by Age by Marriage Status in Summit
| Age Bracket | Married | Unmarried |
| 15 to 19 years | 0 (0.0%) | 0 (0.0%) |
| 20 to 34 years | 0 (0.0%) | 0 (0.0%) |
| 35 to 50 years | 0 (0.0%) | 0 (0.0%) |
| Total | 0 (0.0%) | 0 (0.0%) |
Fertility by Education in Summit
| Educational Attainment | Women with Births | Births / 1,000 Women |
| Less than High School | 0 (0.0%) | 0.0 |
| High School Diploma | 0 (0.0%) | 0.0 |
| College or Associate's Degree | 0 (0.0%) | 0.0 |
| Bachelor's Degree | 0 (0.0%) | 0.0 |
| Graduate Degree | 0 (0.0%) | 0.0 |
| Total | 0 (0.0%) | 0.0 |
Fertility by Education by Marriage Status in Summit
| Educational Attainment | Married | Unmarried |
| Less than High School | 0 (0.0%) | 0 (0.0%) |
| High School Diploma | 0 (0.0%) | 0 (0.0%) |
| College or Associate's Degree | 0 (0.0%) | 0 (0.0%) |
| Bachelor's Degree | 0 (0.0%) | 0 (0.0%) |
| Graduate Degree | 0 (0.0%) | 0 (0.0%) |
| Total | 0 (0.0%) | 0 (0.0%) |
Employment Characteristics in Summit
Employment by Class of Employer in Summit
Among the 135 employed individuals in Summit, private company employees (86 | 63.7%), self-employed (incorporated) (39 | 28.9%), and self-employed (not incorporated) (10 | 7.4%) make up the most common classes of employment.
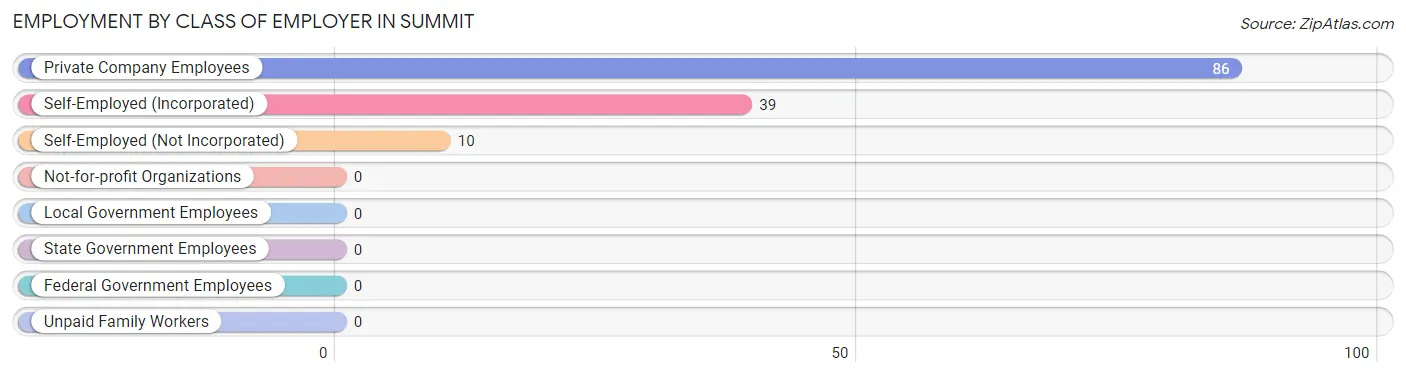
| Employer Class | # Employees | % Employees |
| Private Company Employees | 86 | 63.7% |
| Self-Employed (Incorporated) | 39 | 28.9% |
| Self-Employed (Not Incorporated) | 10 | 7.4% |
| Not-for-profit Organizations | 0 | 0.0% |
| Local Government Employees | 0 | 0.0% |
| State Government Employees | 0 | 0.0% |
| Federal Government Employees | 0 | 0.0% |
| Unpaid Family Workers | 0 | 0.0% |
| Total | 135 | 100.0% |
Employment Status by Age in Summit
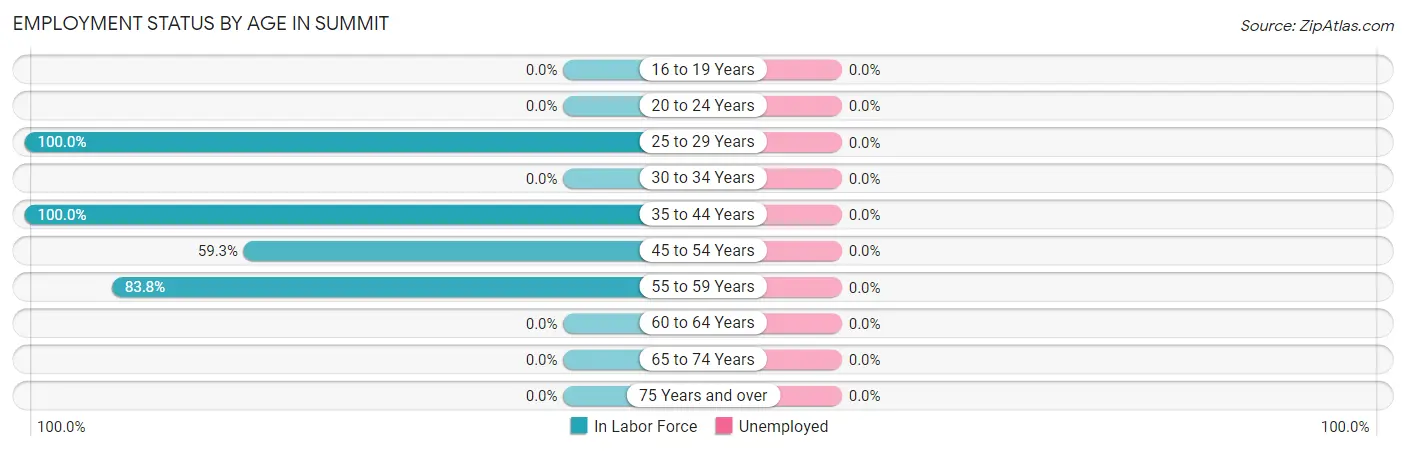
| Age Bracket | In Labor Force | Unemployed |
| 16 to 19 Years | 0 (0.0%) | 0 (0.0%) |
| 20 to 24 Years | 0 (0.0%) | 0 (0.0%) |
| 25 to 29 Years | 39 (100.0%) | 0 (0.0%) |
| 30 to 34 Years | 0 (0.0%) | 0 (0.0%) |
| 35 to 44 Years | 23 (100.0%) | 0 (0.0%) |
| 45 to 54 Years | 16 (59.3%) | 0 (0.0%) |
| 55 to 59 Years | 57 (83.8%) | 0 (0.0%) |
| 60 to 64 Years | 0 (0.0%) | 0 (0.0%) |
| 65 to 74 Years | 0 (0.0%) | 0 (0.0%) |
| 75 Years and over | 0 (0.0%) | 0 (0.0%) |
| Total | 135 (69.2%) | 0 (0.0%) |
Employment Status by Educational Attainment in Summit
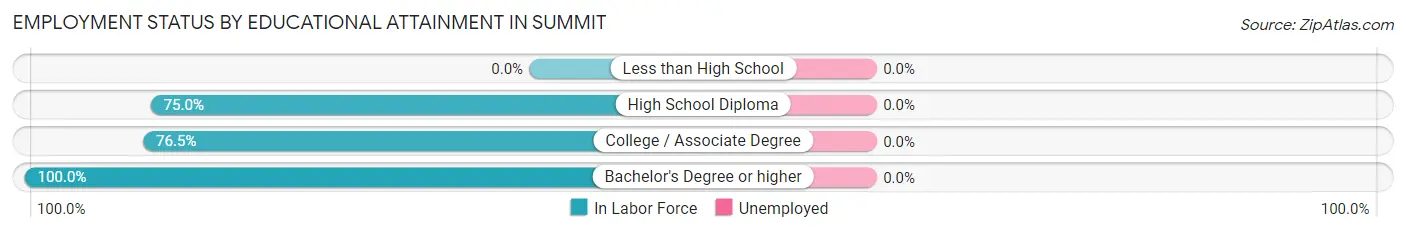
| Educational Attainment | In Labor Force | Unemployed |
| Less than High School | 0 (0.0%) | 0 (0.0%) |
| High School Diploma | 33 (75.0%) | 0 (0.0%) |
| College / Associate Degree | 78 (76.5%) | 0 (0.0%) |
| Bachelor's Degree or higher | 24 (100.0%) | 0 (0.0%) |
| Total | 135 (75.4%) | 0 (0.0%) |
Employment Occupations by Sex in Summit
Management, Business, Science and Arts Occupations
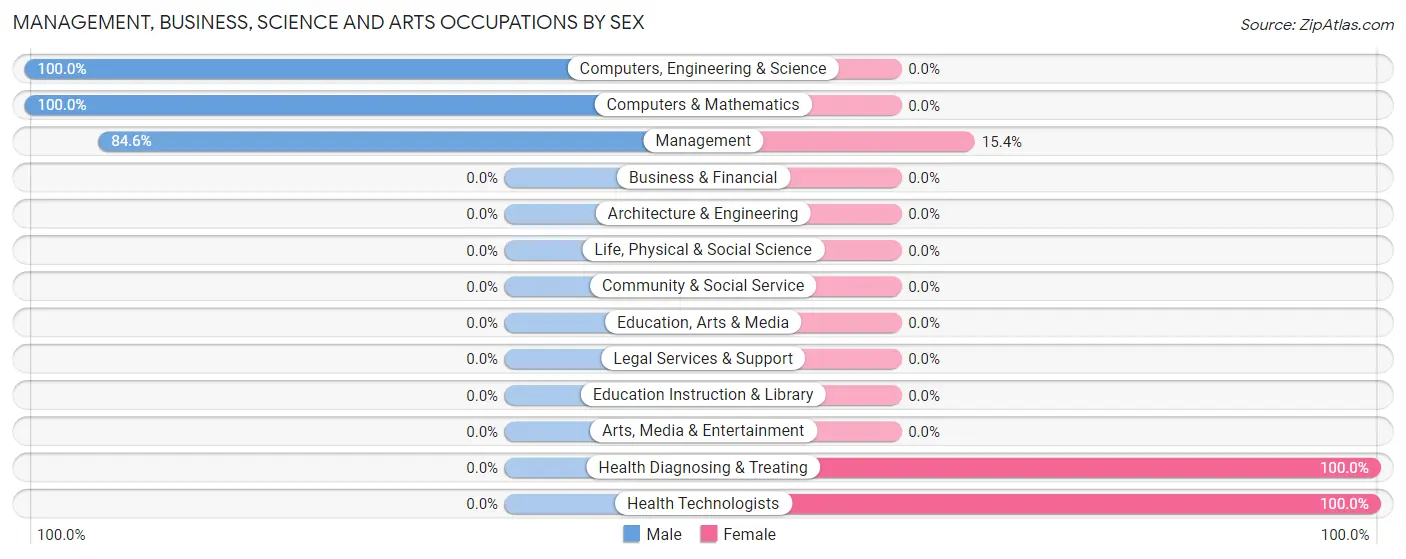
The most common Management, Business, Science and Arts occupations in Summit are Management (39 | 28.9%), Computers, Engineering & Science (15 | 11.1%), Computers & Mathematics (15 | 11.1%), Health Diagnosing & Treating (9 | 6.7%), and Health Technologists (9 | 6.7%).
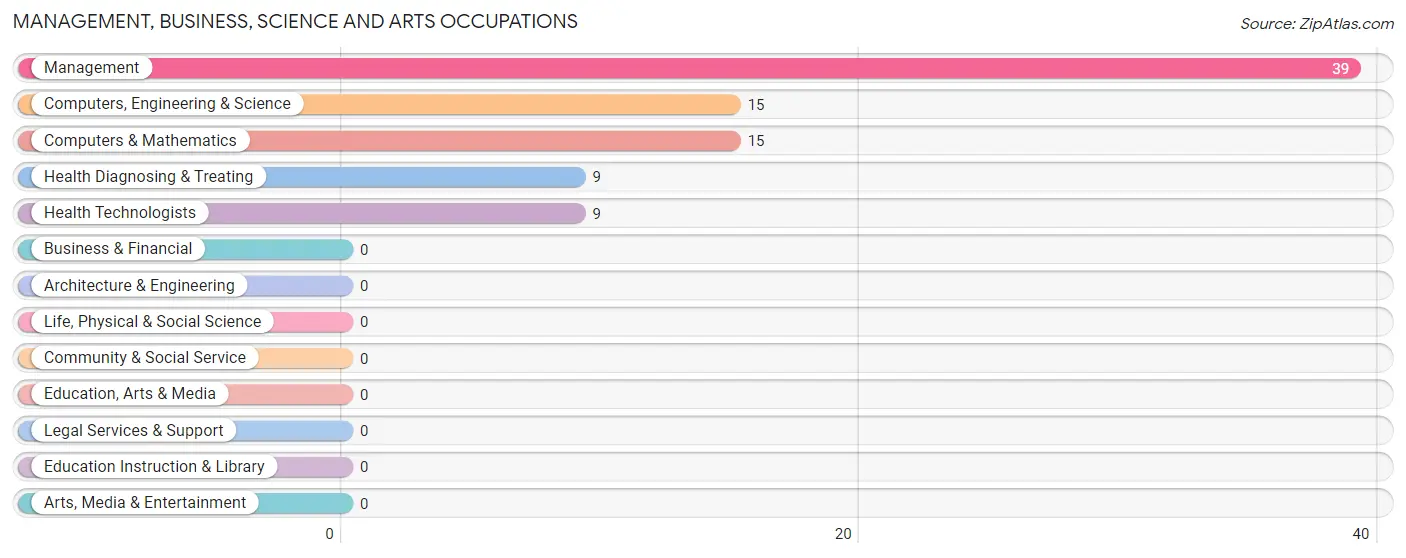
Management, Business, Science and Arts Occupations by Sex
Within the Management, Business, Science and Arts occupations in Summit, the most male-oriented occupations are Computers, Engineering & Science (100.0%), Computers & Mathematics (100.0%), and Management (84.6%), while the most female-oriented occupations are Health Diagnosing & Treating (100.0%), Health Technologists (100.0%), and Management (15.4%).
| Occupation | Male | Female |
| Management | 33 (84.6%) | 6 (15.4%) |
| Business & Financial | 0 (0.0%) | 0 (0.0%) |
| Computers, Engineering & Science | 15 (100.0%) | 0 (0.0%) |
| Computers & Mathematics | 15 (100.0%) | 0 (0.0%) |
| Architecture & Engineering | 0 (0.0%) | 0 (0.0%) |
| Life, Physical & Social Science | 0 (0.0%) | 0 (0.0%) |
| Community & Social Service | 0 (0.0%) | 0 (0.0%) |
| Education, Arts & Media | 0 (0.0%) | 0 (0.0%) |
| Legal Services & Support | 0 (0.0%) | 0 (0.0%) |
| Education Instruction & Library | 0 (0.0%) | 0 (0.0%) |
| Arts, Media & Entertainment | 0 (0.0%) | 0 (0.0%) |
| Health Diagnosing & Treating | 0 (0.0%) | 9 (100.0%) |
| Health Technologists | 0 (0.0%) | 9 (100.0%) |
| Total (Category) | 48 (76.2%) | 15 (23.8%) |
| Total (Overall) | 98 (72.6%) | 37 (27.4%) |
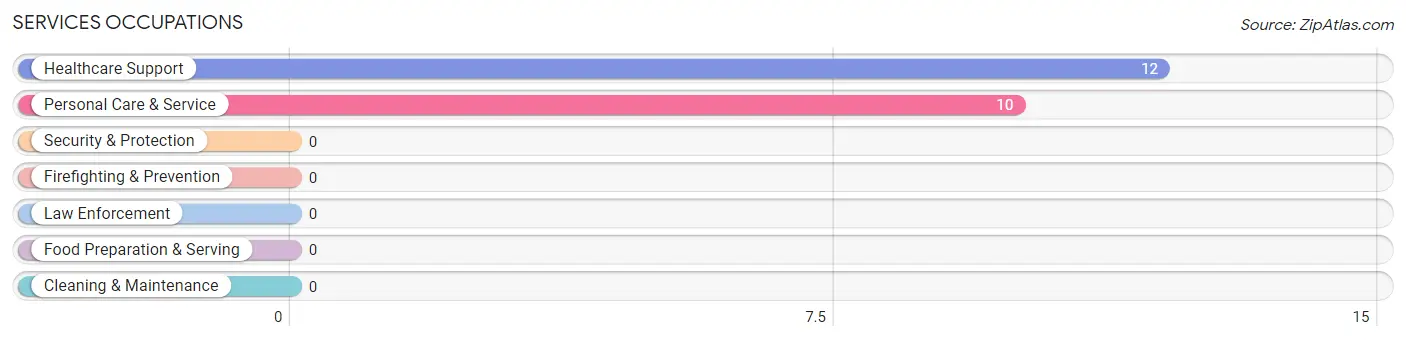
Services Occupations
The most common Services occupations in Summit are Healthcare Support (12 | 8.9%), and Personal Care & Service (10 | 7.4%).
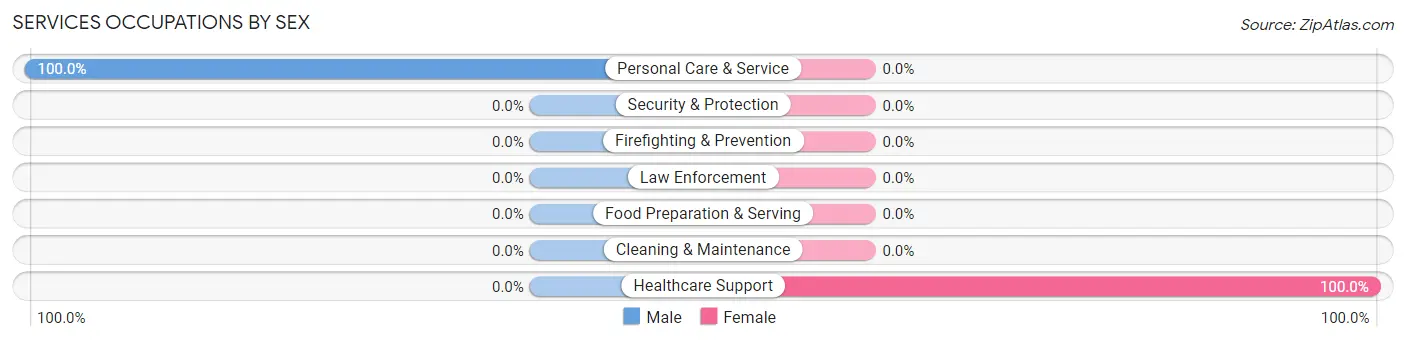
Services Occupations by Sex
| Occupation | Male | Female |
| Healthcare Support | 0 (0.0%) | 12 (100.0%) |
| Security & Protection | 0 (0.0%) | 0 (0.0%) |
| Firefighting & Prevention | 0 (0.0%) | 0 (0.0%) |
| Law Enforcement | 0 (0.0%) | 0 (0.0%) |
| Food Preparation & Serving | 0 (0.0%) | 0 (0.0%) |
| Cleaning & Maintenance | 0 (0.0%) | 0 (0.0%) |
| Personal Care & Service | 10 (100.0%) | 0 (0.0%) |
| Total (Category) | 10 (45.5%) | 12 (54.5%) |
| Total (Overall) | 98 (72.6%) | 37 (27.4%) |
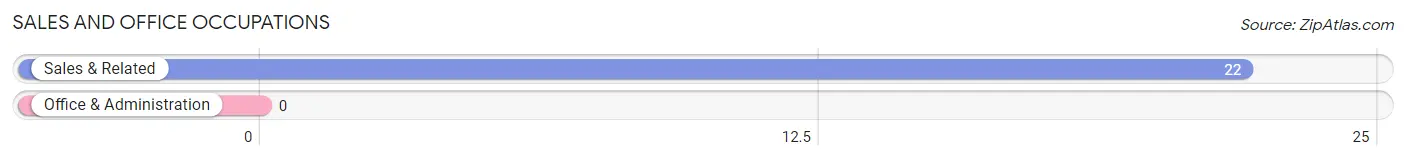
Sales and Office Occupations
The most common Sales and Office occupations in Summit are , and Sales & Related (22 | 16.3%).
Sales and Office Occupations by Sex
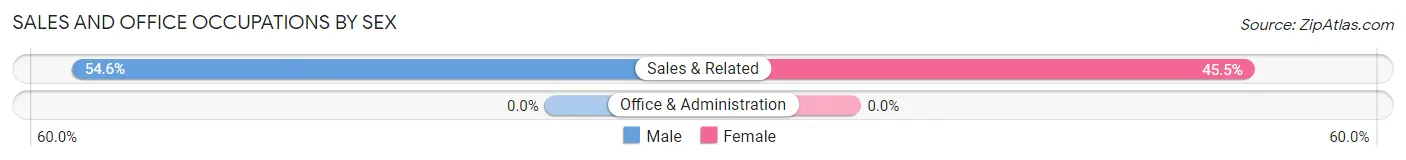
| Occupation | Male | Female |
| Sales & Related | 12 (54.5%) | 10 (45.5%) |
| Office & Administration | 0 (0.0%) | 0 (0.0%) |
| Total (Category) | 12 (54.5%) | 10 (45.5%) |
| Total (Overall) | 98 (72.6%) | 37 (27.4%) |
Natural Resources, Construction and Maintenance Occupations
The most common Natural Resources, Construction and Maintenance occupations in Summit are , and Construction & Extraction (17 | 12.6%).
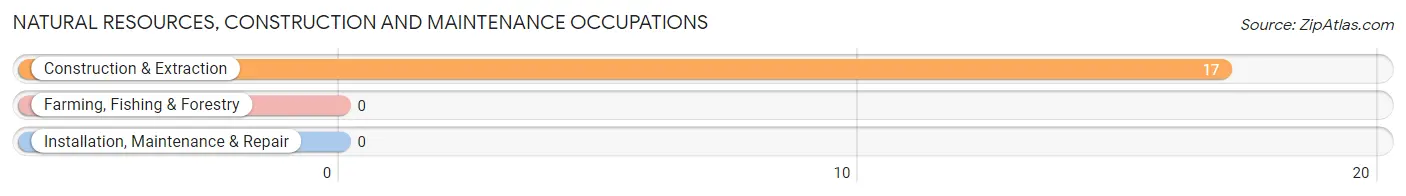
Natural Resources, Construction and Maintenance Occupations by Sex
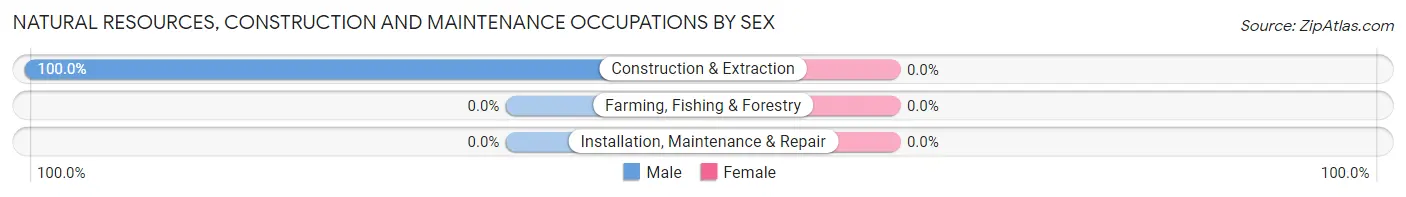
| Occupation | Male | Female |
| Farming, Fishing & Forestry | 0 (0.0%) | 0 (0.0%) |
| Construction & Extraction | 17 (100.0%) | 0 (0.0%) |
| Installation, Maintenance & Repair | 0 (0.0%) | 0 (0.0%) |
| Total (Category) | 17 (100.0%) | 0 (0.0%) |
| Total (Overall) | 98 (72.6%) | 37 (27.4%) |
Production, Transportation and Moving Occupations
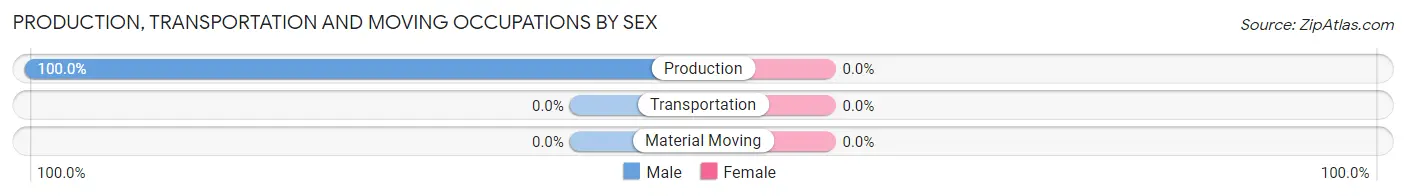
The most common Production, Transportation and Moving occupations in Summit are , and Production (11 | 8.2%).
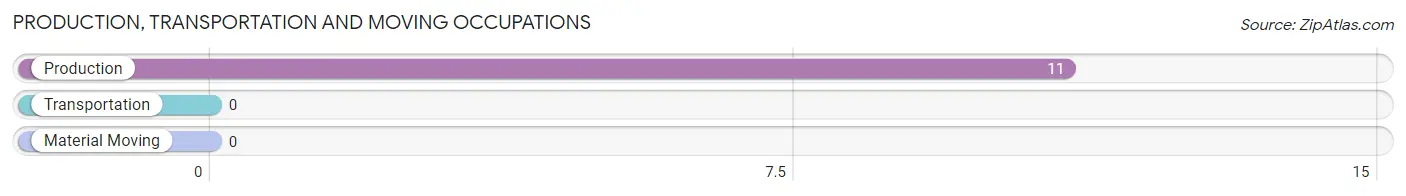
Production, Transportation and Moving Occupations by Sex
| Occupation | Male | Female |
| Production | 11 (100.0%) | 0 (0.0%) |
| Transportation | 0 (0.0%) | 0 (0.0%) |
| Material Moving | 0 (0.0%) | 0 (0.0%) |
| Total (Category) | 11 (100.0%) | 0 (0.0%) |
| Total (Overall) | 98 (72.6%) | 37 (27.4%) |
Employment Industries by Sex in Summit
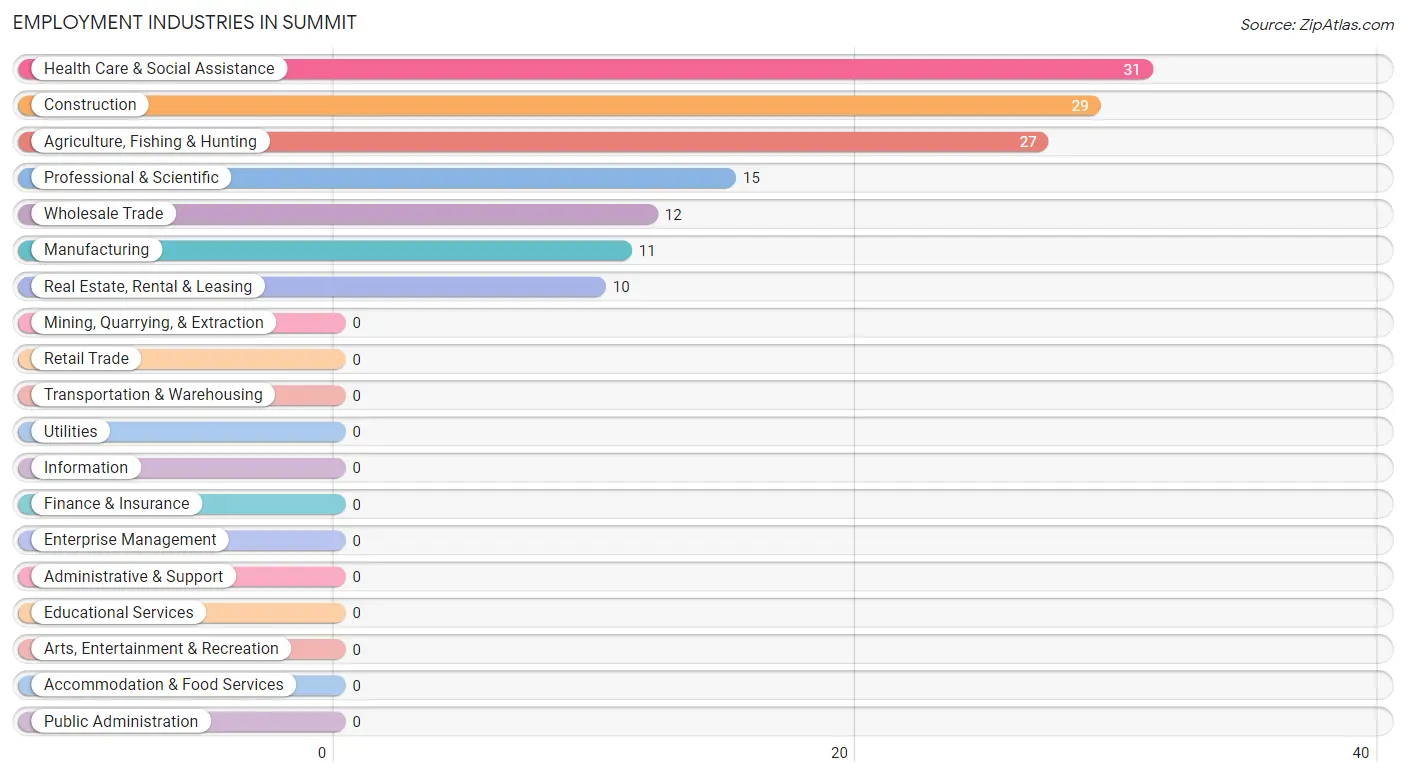
Employment Industries in Summit
The major employment industries in Summit include Health Care & Social Assistance (31 | 23.0%), Construction (29 | 21.5%), Agriculture, Fishing & Hunting (27 | 20.0%), Professional & Scientific (15 | 11.1%), and Wholesale Trade (12 | 8.9%).
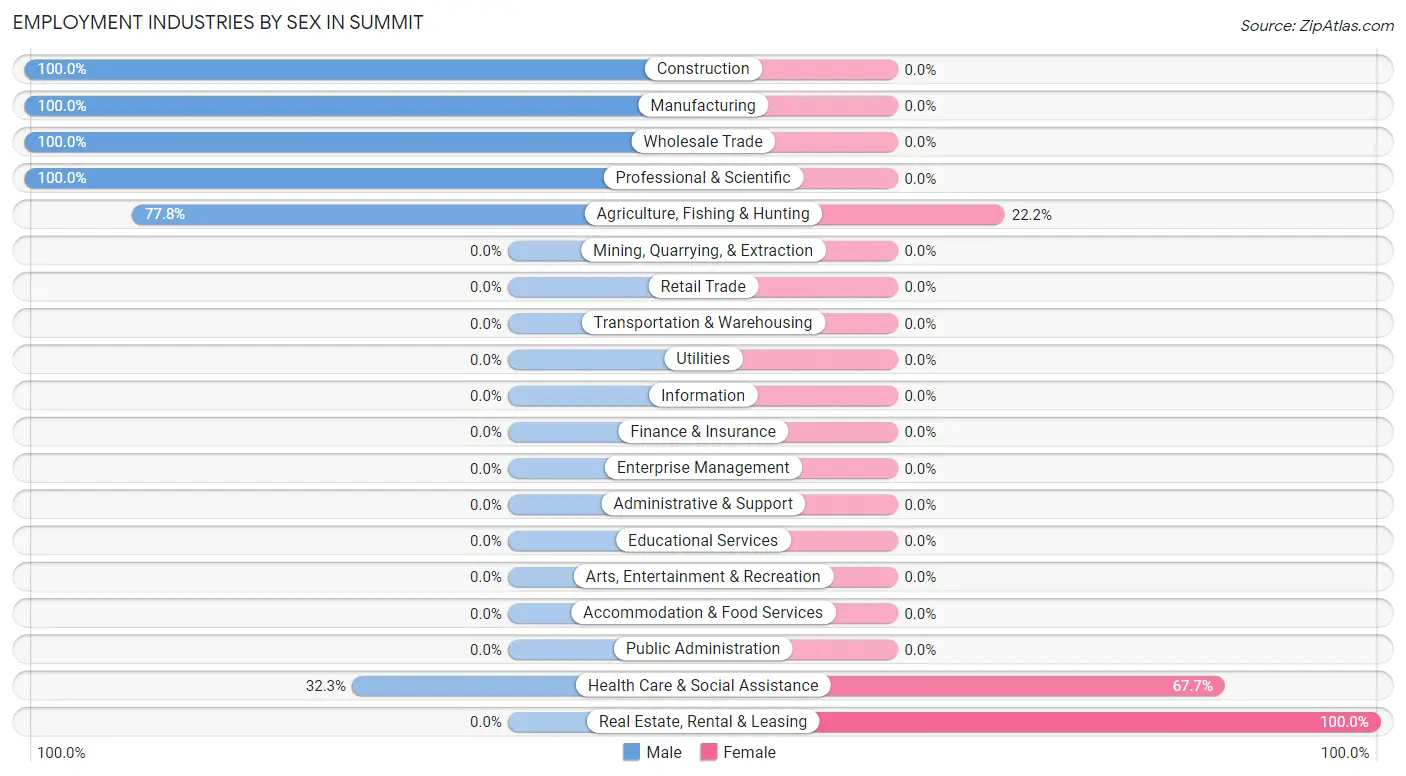
Employment Industries by Sex in Summit
The Summit industries that see more men than women are Construction (100.0%), Manufacturing (100.0%), and Wholesale Trade (100.0%), whereas the industries that tend to have a higher number of women are Real Estate, Rental & Leasing (100.0%), Health Care & Social Assistance (67.7%), and Agriculture, Fishing & Hunting (22.2%).
| Industry | Male | Female |
| Agriculture, Fishing & Hunting | 21 (77.8%) | 6 (22.2%) |
| Mining, Quarrying, & Extraction | 0 (0.0%) | 0 (0.0%) |
| Construction | 29 (100.0%) | 0 (0.0%) |
| Manufacturing | 11 (100.0%) | 0 (0.0%) |
| Wholesale Trade | 12 (100.0%) | 0 (0.0%) |
| Retail Trade | 0 (0.0%) | 0 (0.0%) |
| Transportation & Warehousing | 0 (0.0%) | 0 (0.0%) |
| Utilities | 0 (0.0%) | 0 (0.0%) |
| Information | 0 (0.0%) | 0 (0.0%) |
| Finance & Insurance | 0 (0.0%) | 0 (0.0%) |
| Real Estate, Rental & Leasing | 0 (0.0%) | 10 (100.0%) |
| Professional & Scientific | 15 (100.0%) | 0 (0.0%) |
| Enterprise Management | 0 (0.0%) | 0 (0.0%) |
| Administrative & Support | 0 (0.0%) | 0 (0.0%) |
| Educational Services | 0 (0.0%) | 0 (0.0%) |
| Health Care & Social Assistance | 10 (32.3%) | 21 (67.7%) |
| Arts, Entertainment & Recreation | 0 (0.0%) | 0 (0.0%) |
| Accommodation & Food Services | 0 (0.0%) | 0 (0.0%) |
| Public Administration | 0 (0.0%) | 0 (0.0%) |
| Total | 98 (72.6%) | 37 (27.4%) |
Education in Summit
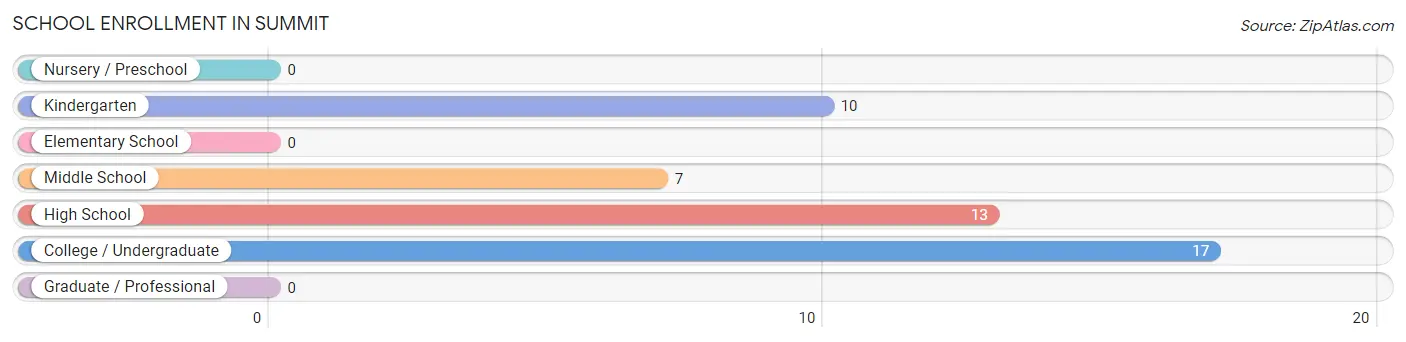
School Enrollment in Summit
The most common levels of schooling among the 47 students in Summit are college / undergraduate (17 | 36.2%), high school (13 | 27.7%), and kindergarten (10 | 21.3%).
| School Level | # Students | % Students |
| Nursery / Preschool | 0 | 0.0% |
| Kindergarten | 10 | 21.3% |
| Elementary School | 0 | 0.0% |
| Middle School | 7 | 14.9% |
| High School | 13 | 27.7% |
| College / Undergraduate | 17 | 36.2% |
| Graduate / Professional | 0 | 0.0% |
| Total | 47 | 100.0% |
School Enrollment by Age by Funding Source in Summit
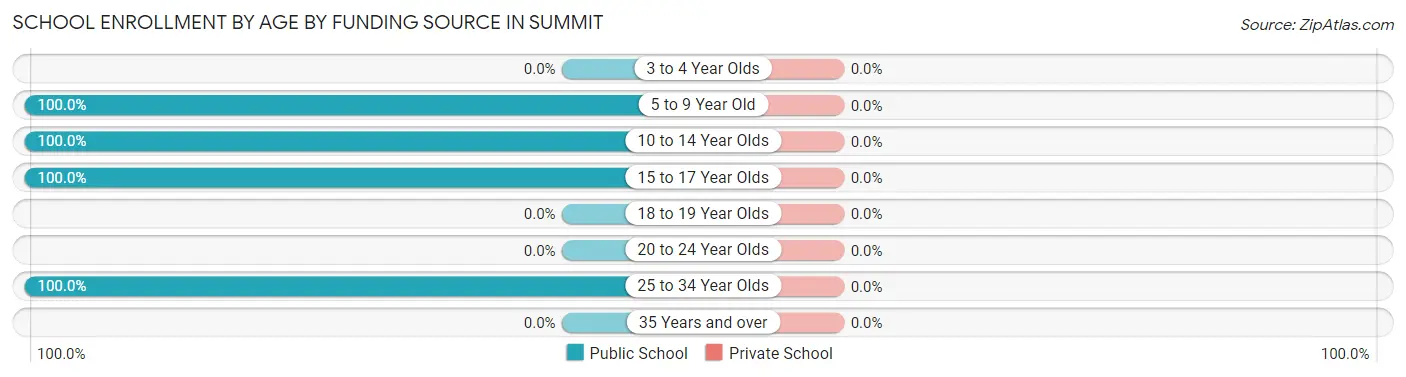
| Age Bracket | Public School | Private School |
| 3 to 4 Year Olds | 0 (0.0%) | 0 (0.0%) |
| 5 to 9 Year Old | 10 (100.0%) | 0 (0.0%) |
| 10 to 14 Year Olds | 7 (100.0%) | 0 (0.0%) |
| 15 to 17 Year Olds | 13 (100.0%) | 0 (0.0%) |
| 18 to 19 Year Olds | 0 (0.0%) | 0 (0.0%) |
| 20 to 24 Year Olds | 0 (0.0%) | 0 (0.0%) |
| 25 to 34 Year Olds | 17 (100.0%) | 0 (0.0%) |
| 35 Years and over | 0 (0.0%) | 0 (0.0%) |
| Total | 47 (100.0%) | 0 (0.0%) |
Educational Attainment by Field of Study in Summit
Computers & mathematics (15 | 45.5%), science & technology (9 | 27.3%), and education (9 | 27.3%) are the most common fields of study among 33 individuals in Summit who have obtained a bachelor's degree or higher.
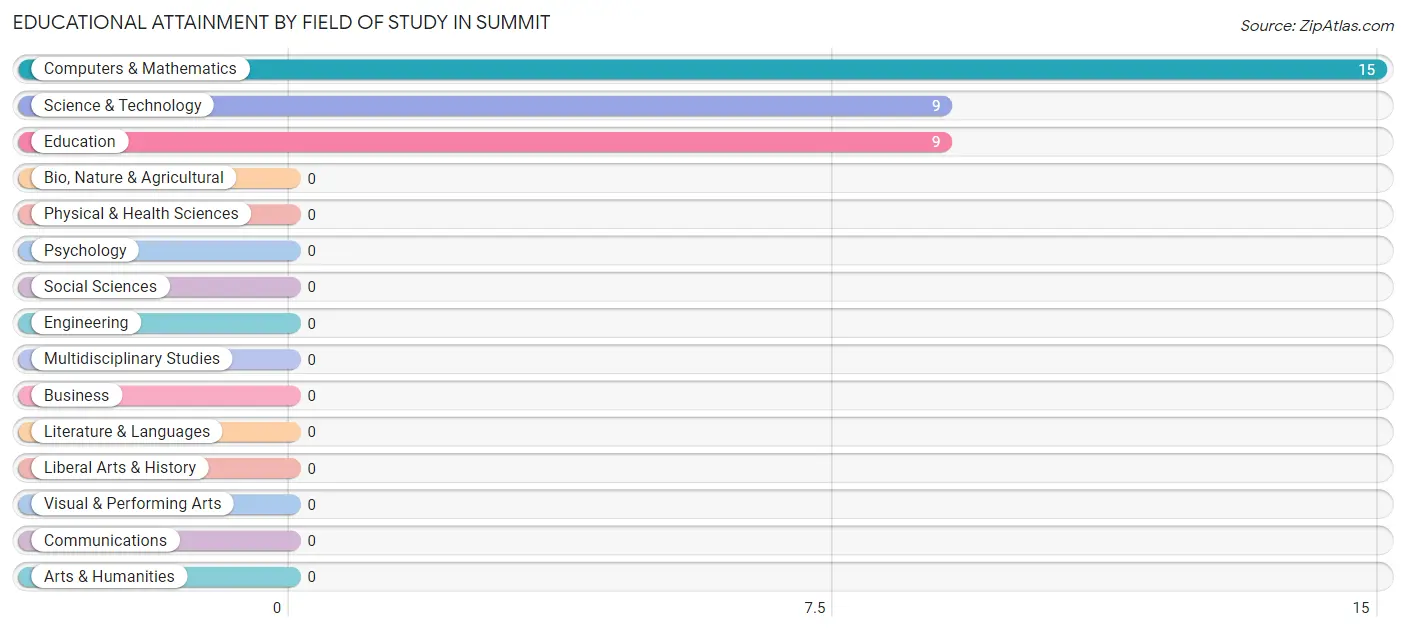
| Field of Study | # Graduates | % Graduates |
| Computers & Mathematics | 15 | 45.5% |
| Bio, Nature & Agricultural | 0 | 0.0% |
| Physical & Health Sciences | 0 | 0.0% |
| Psychology | 0 | 0.0% |
| Social Sciences | 0 | 0.0% |
| Engineering | 0 | 0.0% |
| Multidisciplinary Studies | 0 | 0.0% |
| Science & Technology | 9 | 27.3% |
| Business | 0 | 0.0% |
| Education | 9 | 27.3% |
| Literature & Languages | 0 | 0.0% |
| Liberal Arts & History | 0 | 0.0% |
| Visual & Performing Arts | 0 | 0.0% |
| Communications | 0 | 0.0% |
| Arts & Humanities | 0 | 0.0% |
| Total | 33 | 100.0% |
Transportation & Commute in Summit
Vehicle Availability by Sex in Summit
The most prevalent vehicle ownership categories in Summit are males with 4 vehicles (48, accounting for 49.0%) and females with 4 vehicles (16, making up 129.7%).
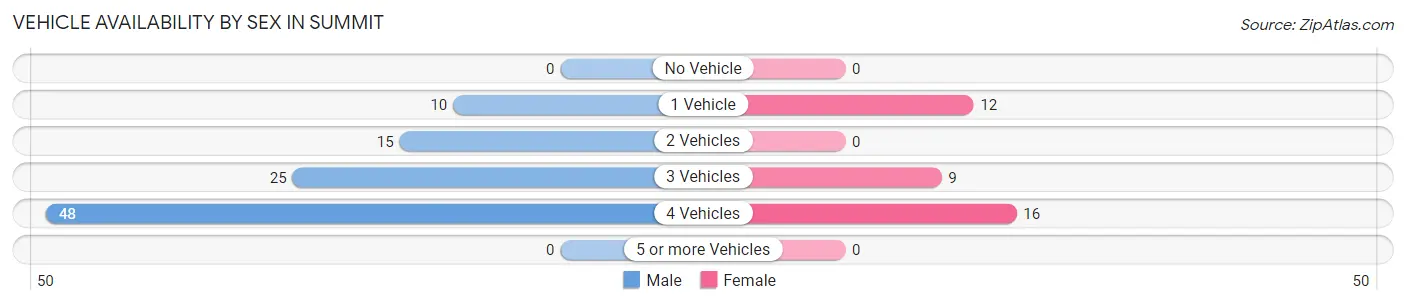
| Vehicles Available | Male | Female |
| No Vehicle | 0 (0.0%) | 0 (0.0%) |
| 1 Vehicle | 10 (10.2%) | 12 (32.4%) |
| 2 Vehicles | 15 (15.3%) | 0 (0.0%) |
| 3 Vehicles | 25 (25.5%) | 9 (24.3%) |
| 4 Vehicles | 48 (49.0%) | 16 (43.2%) |
| 5 or more Vehicles | 0 (0.0%) | 0 (0.0%) |
| Total | 98 (100.0%) | 37 (100.0%) |
Commute Time in Summit
The most frequently occuring commute durations in Summit are 15 to 19 minutes (51 commuters, 46.4%), 5 to 9 minutes (27 commuters, 24.5%), and 10 to 14 minutes (12 commuters, 10.9%).
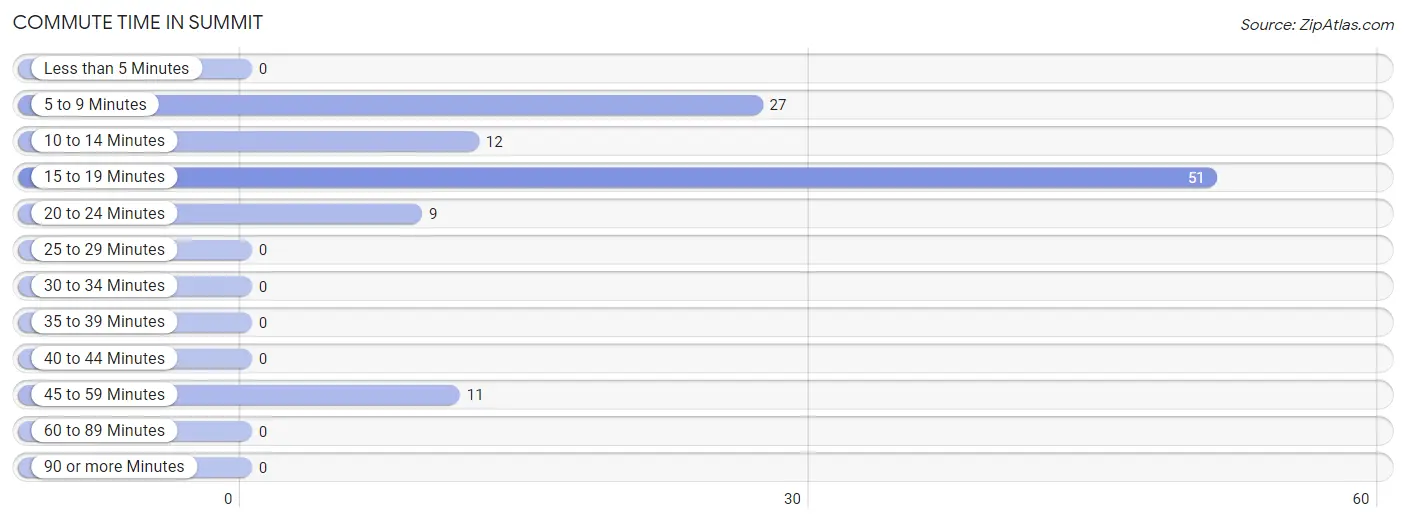
| Commute Time | # Commuters | % Commuters |
| Less than 5 Minutes | 0 | 0.0% |
| 5 to 9 Minutes | 27 | 24.5% |
| 10 to 14 Minutes | 12 | 10.9% |
| 15 to 19 Minutes | 51 | 46.4% |
| 20 to 24 Minutes | 9 | 8.2% |
| 25 to 29 Minutes | 0 | 0.0% |
| 30 to 34 Minutes | 0 | 0.0% |
| 35 to 39 Minutes | 0 | 0.0% |
| 40 to 44 Minutes | 0 | 0.0% |
| 45 to 59 Minutes | 11 | 10.0% |
| 60 to 89 Minutes | 0 | 0.0% |
| 90 or more Minutes | 0 | 0.0% |
Commute Time by Sex in Summit
The most common commute times in Summit are 15 to 19 minutes (29 commuters, 39.7%) for males and 15 to 19 minutes (22 commuters, 59.5%) for females.
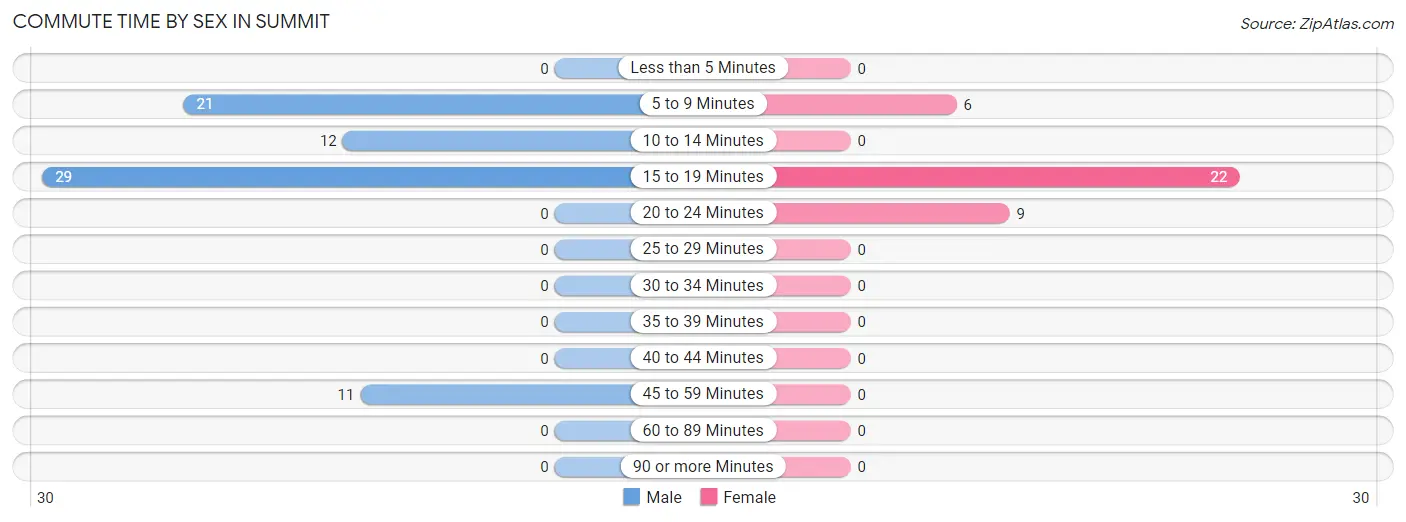
| Commute Time | Male | Female |
| Less than 5 Minutes | 0 (0.0%) | 0 (0.0%) |
| 5 to 9 Minutes | 21 (28.8%) | 6 (16.2%) |
| 10 to 14 Minutes | 12 (16.4%) | 0 (0.0%) |
| 15 to 19 Minutes | 29 (39.7%) | 22 (59.5%) |
| 20 to 24 Minutes | 0 (0.0%) | 9 (24.3%) |
| 25 to 29 Minutes | 0 (0.0%) | 0 (0.0%) |
| 30 to 34 Minutes | 0 (0.0%) | 0 (0.0%) |
| 35 to 39 Minutes | 0 (0.0%) | 0 (0.0%) |
| 40 to 44 Minutes | 0 (0.0%) | 0 (0.0%) |
| 45 to 59 Minutes | 11 (15.1%) | 0 (0.0%) |
| 60 to 89 Minutes | 0 (0.0%) | 0 (0.0%) |
| 90 or more Minutes | 0 (0.0%) | 0 (0.0%) |
Time of Departure to Work by Sex in Summit
The most frequent times of departure to work in Summit are 8:00 AM to 8:29 AM (29, 39.7%) for males and 9:00 AM to 9:59 AM (25, 67.6%) for females.
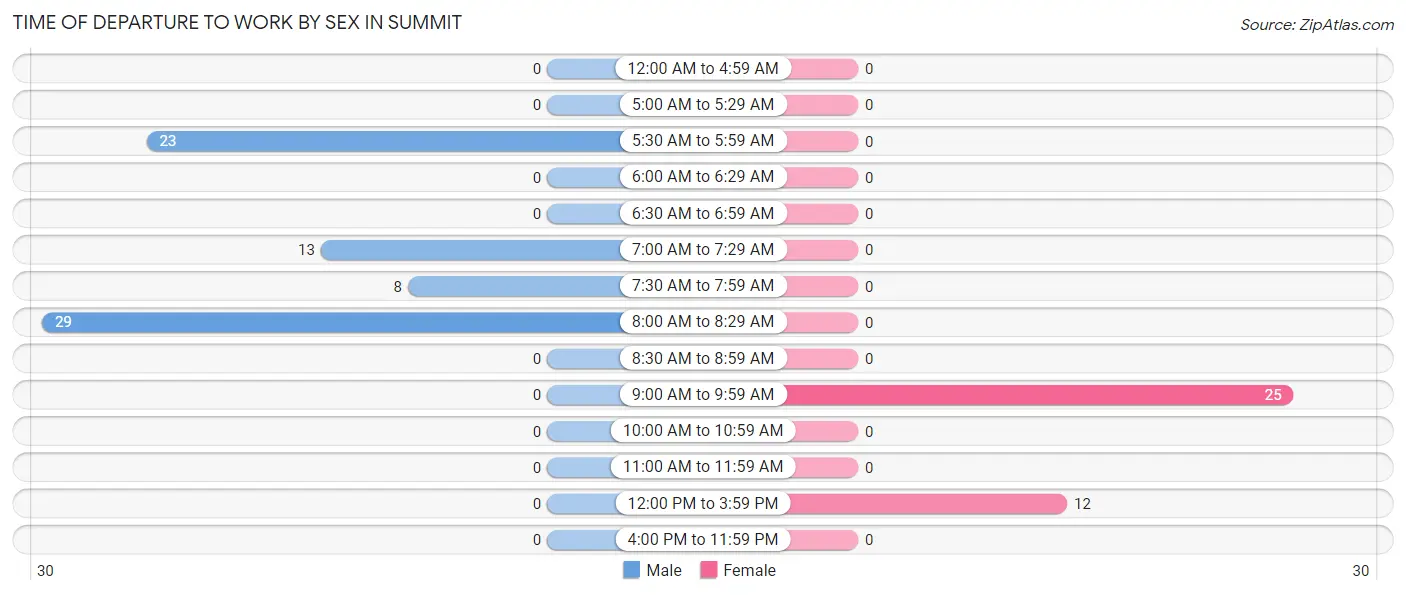
| Time of Departure | Male | Female |
| 12:00 AM to 4:59 AM | 0 (0.0%) | 0 (0.0%) |
| 5:00 AM to 5:29 AM | 0 (0.0%) | 0 (0.0%) |
| 5:30 AM to 5:59 AM | 23 (31.5%) | 0 (0.0%) |
| 6:00 AM to 6:29 AM | 0 (0.0%) | 0 (0.0%) |
| 6:30 AM to 6:59 AM | 0 (0.0%) | 0 (0.0%) |
| 7:00 AM to 7:29 AM | 13 (17.8%) | 0 (0.0%) |
| 7:30 AM to 7:59 AM | 8 (11.0%) | 0 (0.0%) |
| 8:00 AM to 8:29 AM | 29 (39.7%) | 0 (0.0%) |
| 8:30 AM to 8:59 AM | 0 (0.0%) | 0 (0.0%) |
| 9:00 AM to 9:59 AM | 0 (0.0%) | 25 (67.6%) |
| 10:00 AM to 10:59 AM | 0 (0.0%) | 0 (0.0%) |
| 11:00 AM to 11:59 AM | 0 (0.0%) | 0 (0.0%) |
| 12:00 PM to 3:59 PM | 0 (0.0%) | 12 (32.4%) |
| 4:00 PM to 11:59 PM | 0 (0.0%) | 0 (0.0%) |
| Total | 73 (100.0%) | 37 (100.0%) |
Housing Occupancy in Summit
Occupancy by Ownership in Summit
Of the total 82 dwellings in Summit, owner-occupied units account for 63 (76.8%), while renter-occupied units make up 19 (23.2%).
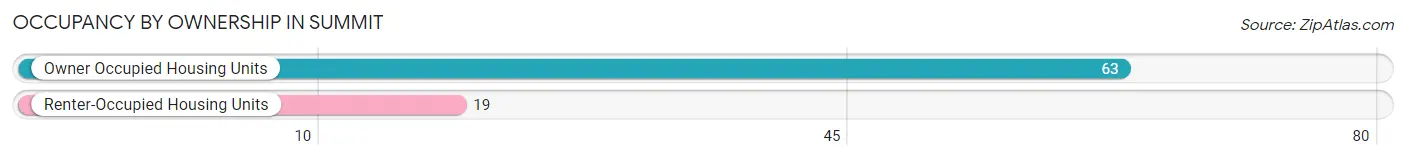
| Occupancy | # Housing Units | % Housing Units |
| Owner Occupied Housing Units | 63 | 76.8% |
| Renter-Occupied Housing Units | 19 | 23.2% |
| Total Occupied Housing Units | 82 | 100.0% |
Occupancy by Household Size in Summit
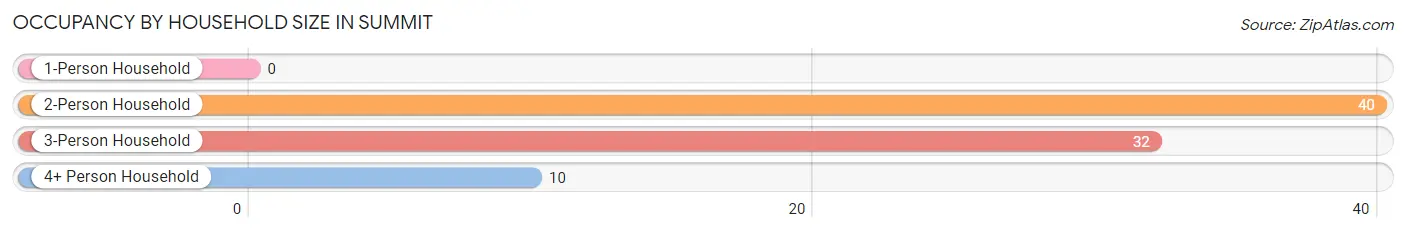
| Household Size | # Housing Units | % Housing Units |
| 1-Person Household | 0 | 0.0% |
| 2-Person Household | 40 | 48.8% |
| 3-Person Household | 32 | 39.0% |
| 4+ Person Household | 10 | 12.2% |
| Total Housing Units | 82 | 100.0% |
Occupancy by Ownership by Household Size in Summit
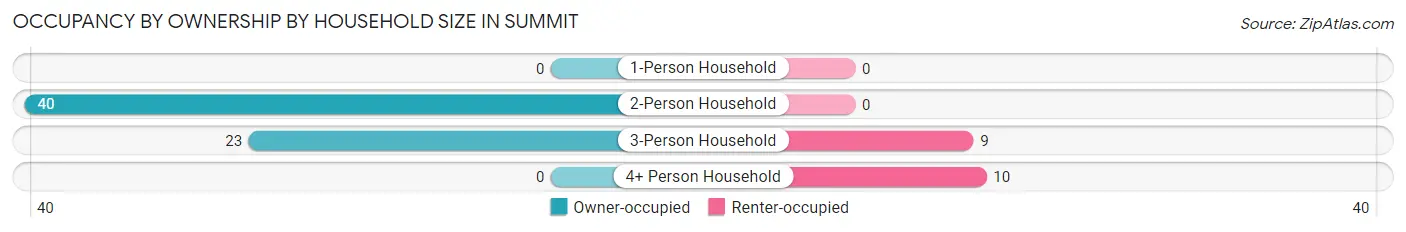
| Household Size | Owner-occupied | Renter-occupied |
| 1-Person Household | 0 (0.0%) | 0 (0.0%) |
| 2-Person Household | 40 (100.0%) | 0 (0.0%) |
| 3-Person Household | 23 (71.9%) | 9 (28.1%) |
| 4+ Person Household | 0 (0.0%) | 10 (100.0%) |
| Total Housing Units | 63 (76.8%) | 19 (23.2%) |
Occupancy by Educational Attainment in Summit
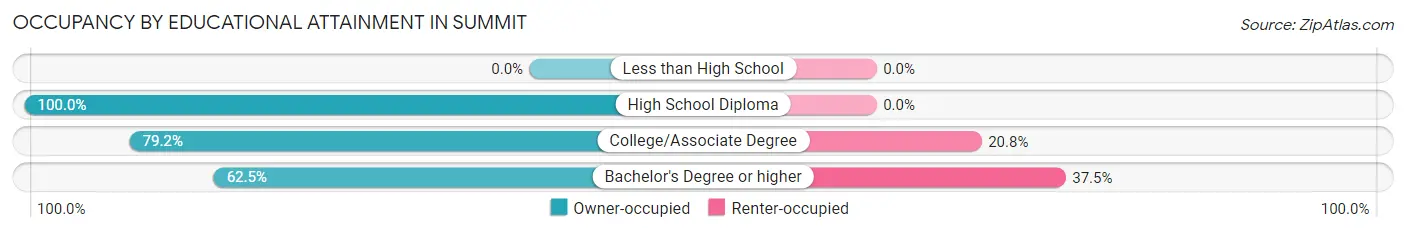
| Household Size | Owner-occupied | Renter-occupied |
| Less than High School | 0 (0.0%) | 0 (0.0%) |
| High School Diploma | 10 (100.0%) | 0 (0.0%) |
| College/Associate Degree | 38 (79.2%) | 10 (20.8%) |
| Bachelor's Degree or higher | 15 (62.5%) | 9 (37.5%) |
Occupancy by Age of Householder in Summit
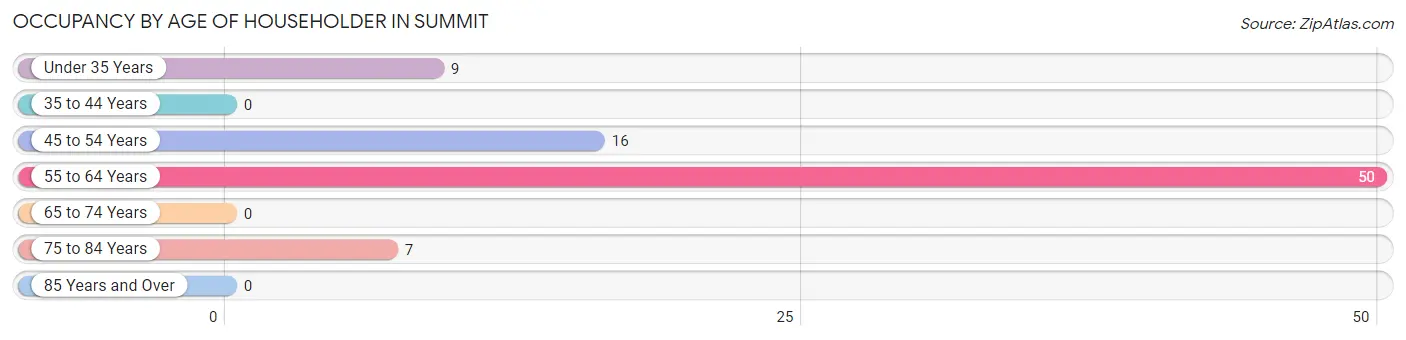
| Age Bracket | # Households | % Households |
| Under 35 Years | 9 | 11.0% |
| 35 to 44 Years | 0 | 0.0% |
| 45 to 54 Years | 16 | 19.5% |
| 55 to 64 Years | 50 | 61.0% |
| 65 to 74 Years | 0 | 0.0% |
| 75 to 84 Years | 7 | 8.5% |
| 85 Years and Over | 0 | 0.0% |
| Total | 82 | 100.0% |
Housing Finances in Summit
Median Income by Occupancy in Summit
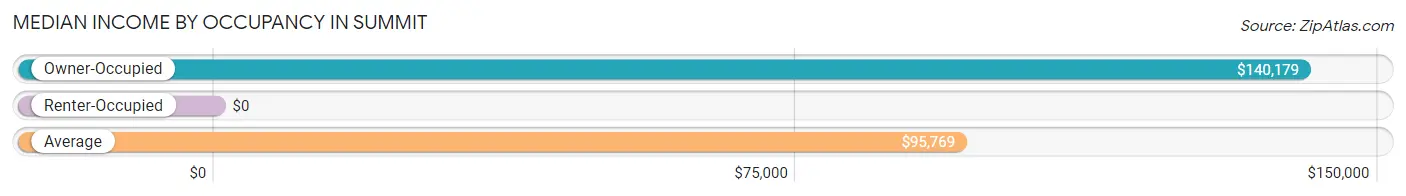
| Occupancy Type | # Households | Median Income |
| Owner-Occupied | 63 (76.8%) | $140,179 |
| Renter-Occupied | 19 (23.2%) | $0 |
| Average | 82 (100.0%) | $95,769 |
Occupancy by Householder Income Bracket in Summit
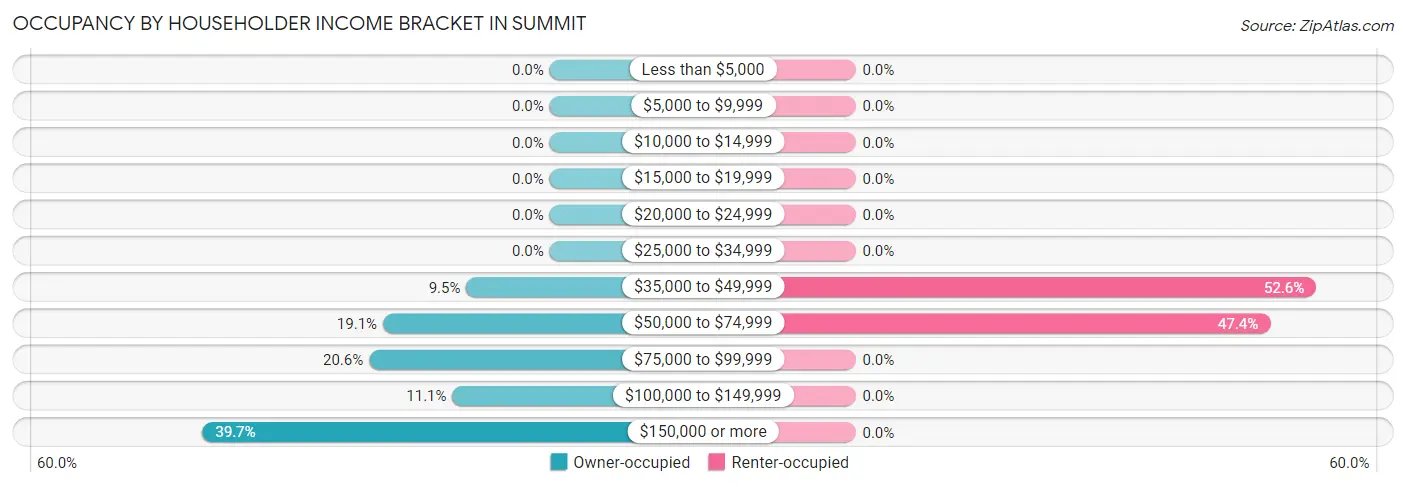
| Income Bracket | Owner-occupied | Renter-occupied |
| Less than $5,000 | 0 (0.0%) | 0 (0.0%) |
| $5,000 to $9,999 | 0 (0.0%) | 0 (0.0%) |
| $10,000 to $14,999 | 0 (0.0%) | 0 (0.0%) |
| $15,000 to $19,999 | 0 (0.0%) | 0 (0.0%) |
| $20,000 to $24,999 | 0 (0.0%) | 0 (0.0%) |
| $25,000 to $34,999 | 0 (0.0%) | 0 (0.0%) |
| $35,000 to $49,999 | 6 (9.5%) | 10 (52.6%) |
| $50,000 to $74,999 | 12 (19.1%) | 9 (47.4%) |
| $75,000 to $99,999 | 13 (20.6%) | 0 (0.0%) |
| $100,000 to $149,999 | 7 (11.1%) | 0 (0.0%) |
| $150,000 or more | 25 (39.7%) | 0 (0.0%) |
| Total | 63 (100.0%) | 19 (100.0%) |
Monthly Housing Cost Tiers in Summit
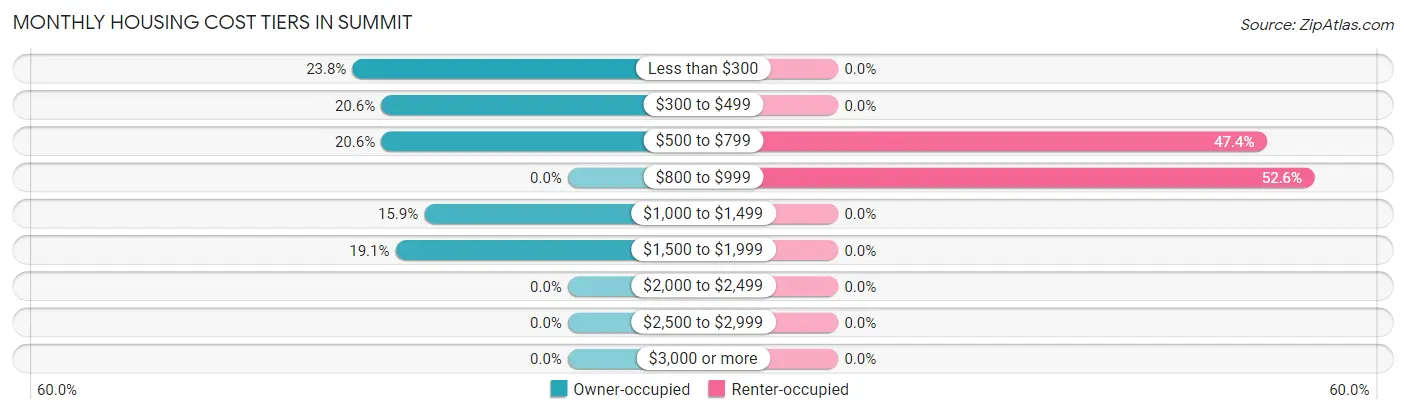
| Monthly Cost | Owner-occupied | Renter-occupied |
| Less than $300 | 15 (23.8%) | 0 (0.0%) |
| $300 to $499 | 13 (20.6%) | 0 (0.0%) |
| $500 to $799 | 13 (20.6%) | 9 (47.4%) |
| $800 to $999 | 0 (0.0%) | 10 (52.6%) |
| $1,000 to $1,499 | 10 (15.9%) | 0 (0.0%) |
| $1,500 to $1,999 | 12 (19.1%) | 0 (0.0%) |
| $2,000 to $2,499 | 0 (0.0%) | 0 (0.0%) |
| $2,500 to $2,999 | 0 (0.0%) | 0 (0.0%) |
| $3,000 or more | 0 (0.0%) | 0 (0.0%) |
| Total | 63 (100.0%) | 19 (100.0%) |
Physical Housing Characteristics in Summit
Housing Structures in Summit
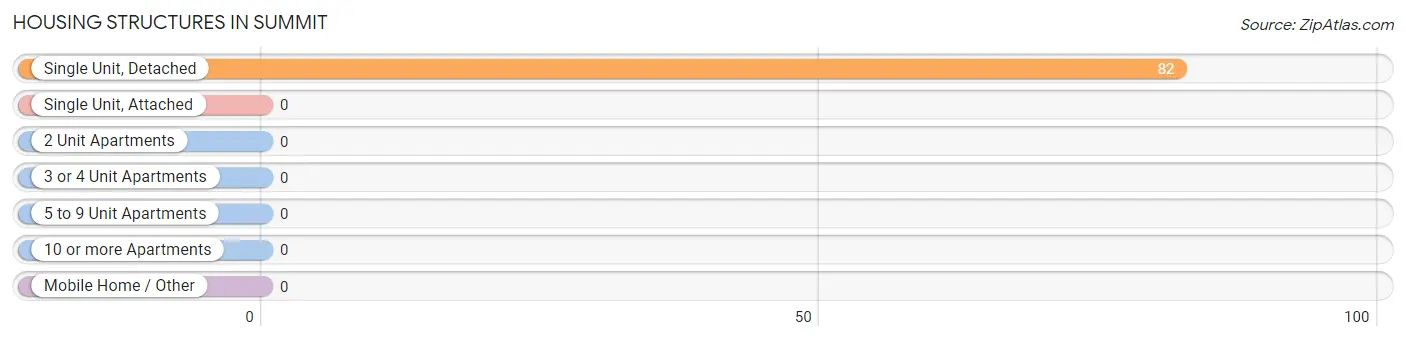
| Structure Type | # Housing Units | % Housing Units |
| Single Unit, Detached | 82 | 100.0% |
| Single Unit, Attached | 0 | 0.0% |
| 2 Unit Apartments | 0 | 0.0% |
| 3 or 4 Unit Apartments | 0 | 0.0% |
| 5 to 9 Unit Apartments | 0 | 0.0% |
| 10 or more Apartments | 0 | 0.0% |
| Mobile Home / Other | 0 | 0.0% |
| Total | 82 | 100.0% |
Housing Structures by Occupancy in Summit
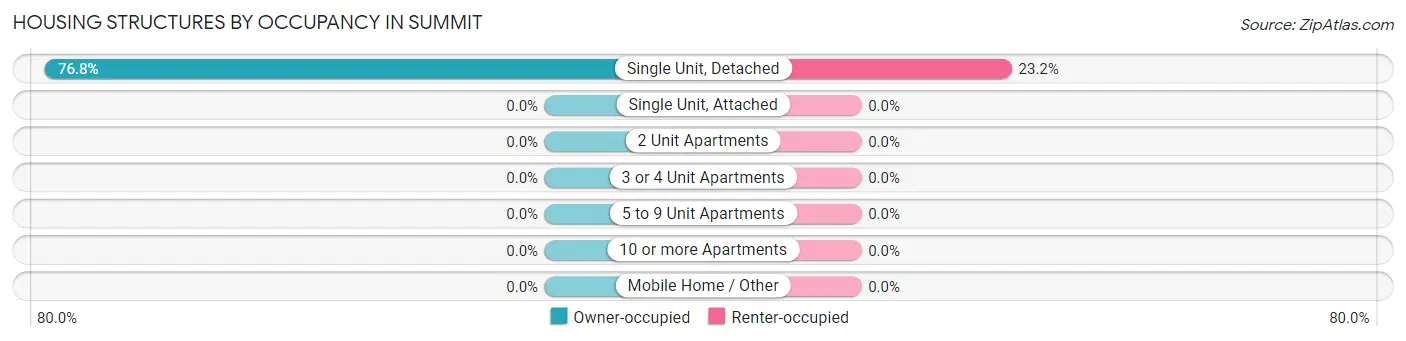
| Structure Type | Owner-occupied | Renter-occupied |
| Single Unit, Detached | 63 (76.8%) | 19 (23.2%) |
| Single Unit, Attached | 0 (0.0%) | 0 (0.0%) |
| 2 Unit Apartments | 0 (0.0%) | 0 (0.0%) |
| 3 or 4 Unit Apartments | 0 (0.0%) | 0 (0.0%) |
| 5 to 9 Unit Apartments | 0 (0.0%) | 0 (0.0%) |
| 10 or more Apartments | 0 (0.0%) | 0 (0.0%) |
| Mobile Home / Other | 0 (0.0%) | 0 (0.0%) |
| Total | 63 (76.8%) | 19 (23.2%) |
Housing Structures by Number of Rooms in Summit
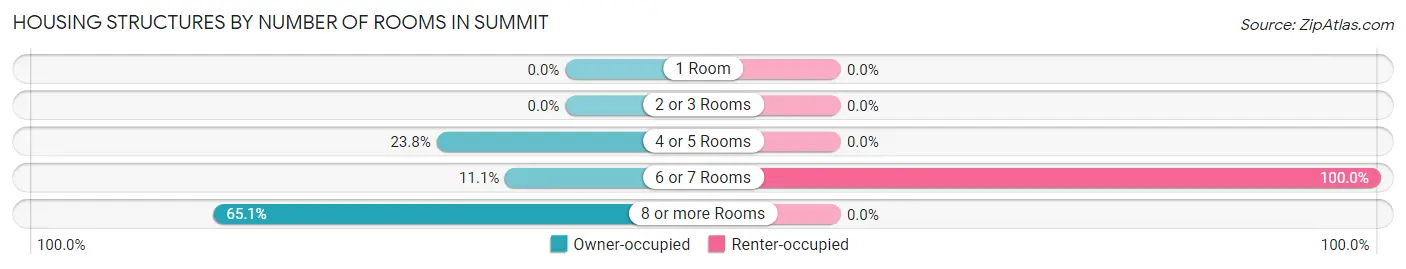
| Number of Rooms | Owner-occupied | Renter-occupied |
| 1 Room | 0 (0.0%) | 0 (0.0%) |
| 2 or 3 Rooms | 0 (0.0%) | 0 (0.0%) |
| 4 or 5 Rooms | 15 (23.8%) | 0 (0.0%) |
| 6 or 7 Rooms | 7 (11.1%) | 19 (100.0%) |
| 8 or more Rooms | 41 (65.1%) | 0 (0.0%) |
| Total | 63 (100.0%) | 19 (100.0%) |
Housing Structure by Heating Type in Summit
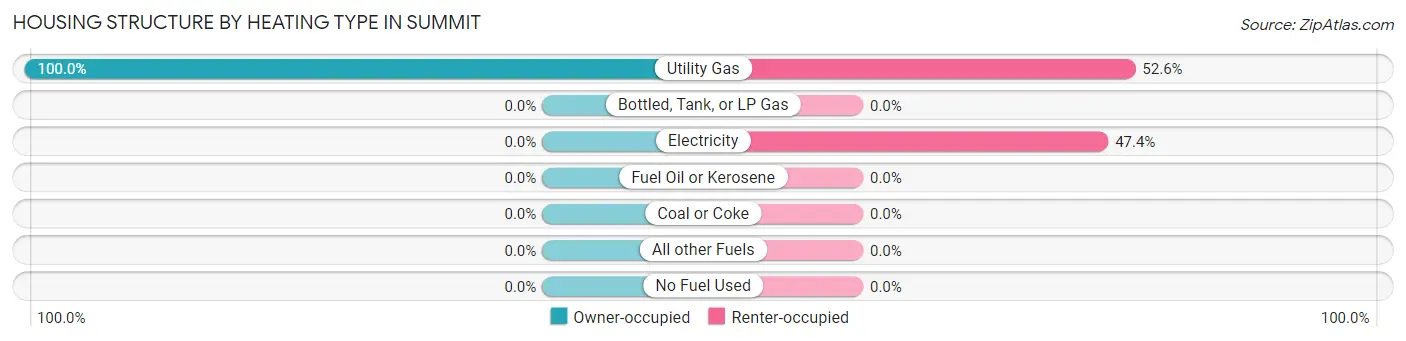
| Heating Type | Owner-occupied | Renter-occupied |
| Utility Gas | 63 (100.0%) | 10 (52.6%) |
| Bottled, Tank, or LP Gas | 0 (0.0%) | 0 (0.0%) |
| Electricity | 0 (0.0%) | 9 (47.4%) |
| Fuel Oil or Kerosene | 0 (0.0%) | 0 (0.0%) |
| Coal or Coke | 0 (0.0%) | 0 (0.0%) |
| All other Fuels | 0 (0.0%) | 0 (0.0%) |
| No Fuel Used | 0 (0.0%) | 0 (0.0%) |
| Total | 63 (100.0%) | 19 (100.0%) |
Household Vehicle Usage in Summit
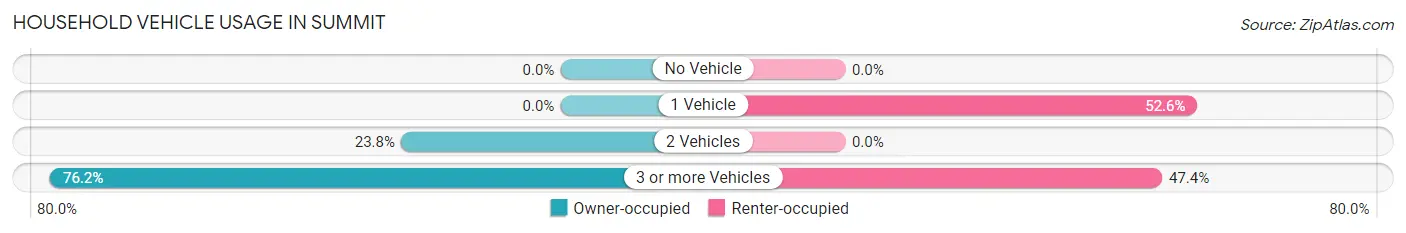
| Vehicles per Household | Owner-occupied | Renter-occupied |
| No Vehicle | 0 (0.0%) | 0 (0.0%) |
| 1 Vehicle | 0 (0.0%) | 10 (52.6%) |
| 2 Vehicles | 15 (23.8%) | 0 (0.0%) |
| 3 or more Vehicles | 48 (76.2%) | 9 (47.4%) |
| Total | 63 (100.0%) | 19 (100.0%) |
Real Estate & Mortgages in Summit
Real Estate and Mortgage Overview in Summit
| Characteristic | Without Mortgage | With Mortgage |
| Housing Units | 41 | 22 |
| Median Property Value | $245,000 | $0 |
| Median Household Income | $140,536 | $10 |
| Monthly Housing Costs | $371 | $0 |
| Real Estate Taxes | $957 | $0 |
Property Value by Mortgage Status in Summit
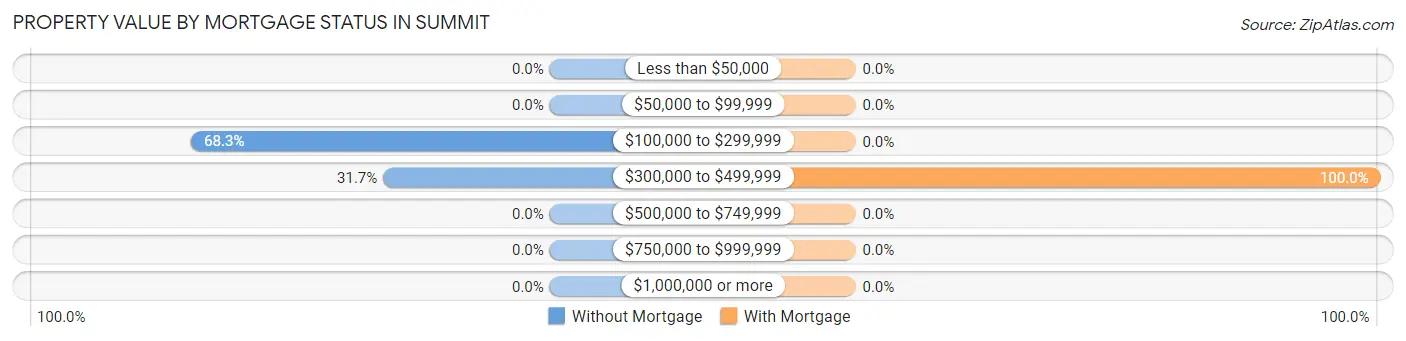
| Property Value | Without Mortgage | With Mortgage |
| Less than $50,000 | 0 (0.0%) | 0 (0.0%) |
| $50,000 to $99,999 | 0 (0.0%) | 0 (0.0%) |
| $100,000 to $299,999 | 28 (68.3%) | 0 (0.0%) |
| $300,000 to $499,999 | 13 (31.7%) | 22 (100.0%) |
| $500,000 to $749,999 | 0 (0.0%) | 0 (0.0%) |
| $750,000 to $999,999 | 0 (0.0%) | 0 (0.0%) |
| $1,000,000 or more | 0 (0.0%) | 0 (0.0%) |
| Total | 41 (100.0%) | 22 (100.0%) |
Household Income by Mortgage Status in Summit
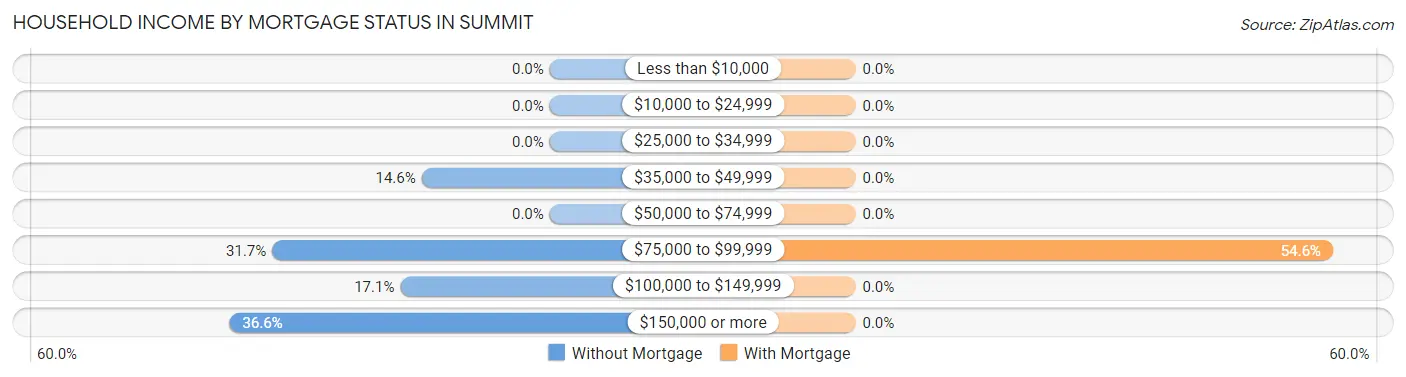
| Household Income | Without Mortgage | With Mortgage |
| Less than $10,000 | 0 (0.0%) | 0 (0.0%) |
| $10,000 to $24,999 | 0 (0.0%) | 0 (0.0%) |
| $25,000 to $34,999 | 0 (0.0%) | 0 (0.0%) |
| $35,000 to $49,999 | 6 (14.6%) | 0 (0.0%) |
| $50,000 to $74,999 | 0 (0.0%) | 0 (0.0%) |
| $75,000 to $99,999 | 13 (31.7%) | 12 (54.5%) |
| $100,000 to $149,999 | 7 (17.1%) | 0 (0.0%) |
| $150,000 or more | 15 (36.6%) | 0 (0.0%) |
| Total | 41 (100.0%) | 22 (100.0%) |
Property Value to Household Income Ratio in Summit
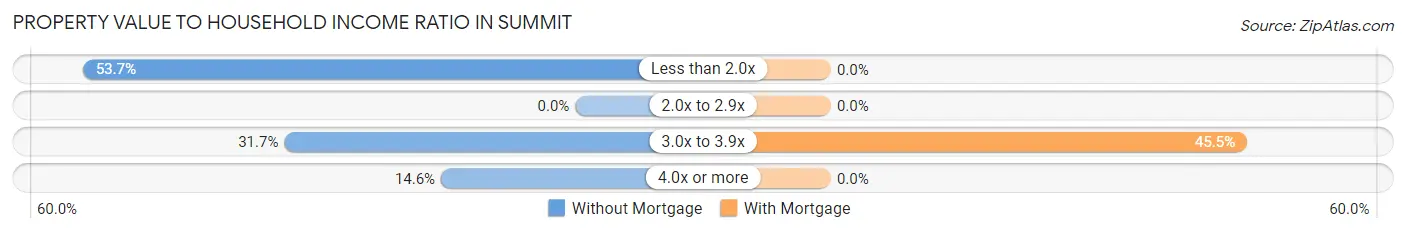
| Value-to-Income Ratio | Without Mortgage | With Mortgage |
| Less than 2.0x | 22 (53.7%) | 0 (0.0%) |
| 2.0x to 2.9x | 0 (0.0%) | 0 (0.0%) |
| 3.0x to 3.9x | 13 (31.7%) | 10 (45.5%) |
| 4.0x or more | 6 (14.6%) | 0 (0.0%) |
| Total | 41 (100.0%) | 22 (100.0%) |
Real Estate Taxes by Mortgage Status in Summit
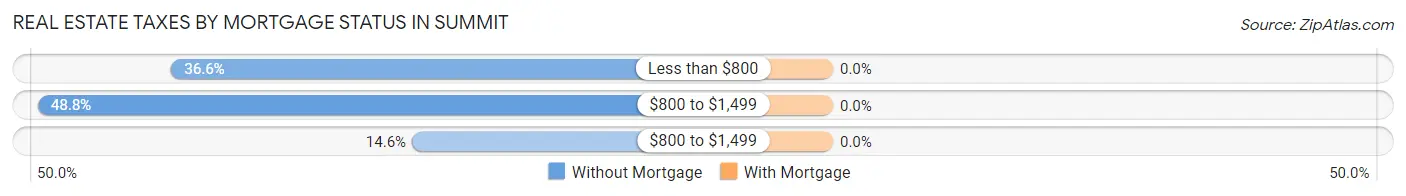
| Property Taxes | Without Mortgage | With Mortgage |
| Less than $800 | 15 (36.6%) | 0 (0.0%) |
| $800 to $1,499 | 20 (48.8%) | 0 (0.0%) |
| $800 to $1,499 | 6 (14.6%) | 0 (0.0%) |
| Total | 41 (100.0%) | 22 (100.0%) |
Health & Disability in Summit
Health Insurance Coverage by Age in Summit
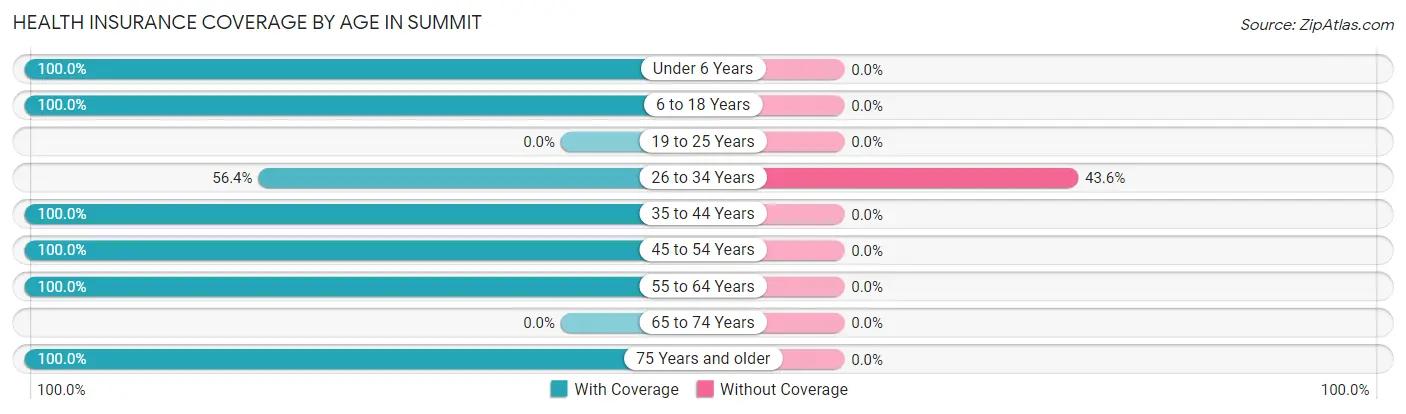
| Age Bracket | With Coverage | Without Coverage |
| Under 6 Years | 19 (100.0%) | 0 (0.0%) |
| 6 to 18 Years | 20 (100.0%) | 0 (0.0%) |
| 19 to 25 Years | 0 (0.0%) | 0 (0.0%) |
| 26 to 34 Years | 22 (56.4%) | 17 (43.6%) |
| 35 to 44 Years | 23 (100.0%) | 0 (0.0%) |
| 45 to 54 Years | 27 (100.0%) | 0 (0.0%) |
| 55 to 64 Years | 90 (100.0%) | 0 (0.0%) |
| 65 to 74 Years | 0 (0.0%) | 0 (0.0%) |
| 75 Years and older | 16 (100.0%) | 0 (0.0%) |
| Total | 217 (92.7%) | 17 (7.3%) |
Health Insurance Coverage by Citizenship Status in Summit
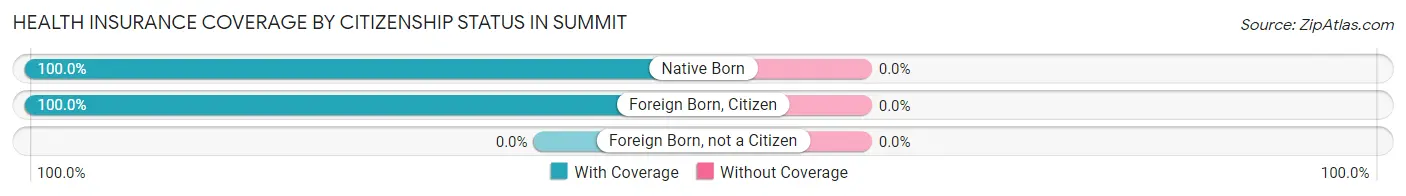
| Citizenship Status | With Coverage | Without Coverage |
| Native Born | 19 (100.0%) | 0 (0.0%) |
| Foreign Born, Citizen | 20 (100.0%) | 0 (0.0%) |
| Foreign Born, not a Citizen | 0 (0.0%) | 0 (0.0%) |
Health Insurance Coverage by Household Income in Summit
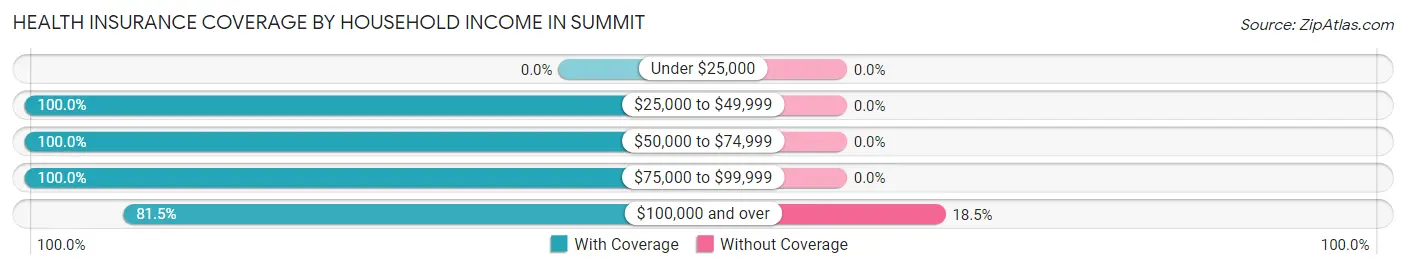
| Household Income | With Coverage | Without Coverage |
| Under $25,000 | 0 (0.0%) | 0 (0.0%) |
| $25,000 to $49,999 | 62 (100.0%) | 0 (0.0%) |
| $50,000 to $74,999 | 56 (100.0%) | 0 (0.0%) |
| $75,000 to $99,999 | 24 (100.0%) | 0 (0.0%) |
| $100,000 and over | 75 (81.5%) | 17 (18.5%) |
Public vs Private Health Insurance Coverage by Age in Summit
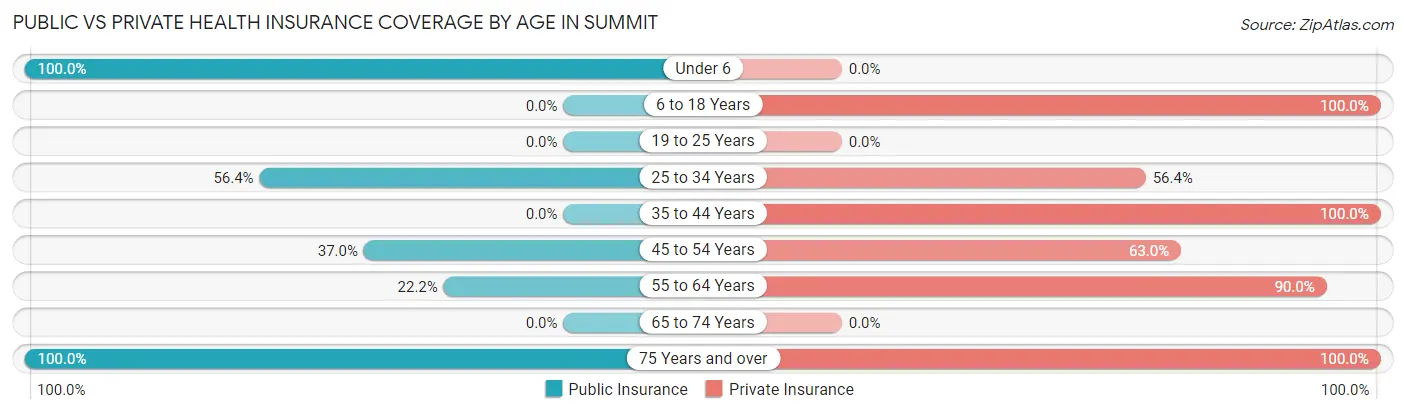
| Age Bracket | Public Insurance | Private Insurance |
| Under 6 | 19 (100.0%) | 0 (0.0%) |
| 6 to 18 Years | 0 (0.0%) | 20 (100.0%) |
| 19 to 25 Years | 0 (0.0%) | 0 (0.0%) |
| 25 to 34 Years | 22 (56.4%) | 22 (56.4%) |
| 35 to 44 Years | 0 (0.0%) | 23 (100.0%) |
| 45 to 54 Years | 10 (37.0%) | 17 (63.0%) |
| 55 to 64 Years | 20 (22.2%) | 81 (90.0%) |
| 65 to 74 Years | 0 (0.0%) | 0 (0.0%) |
| 75 Years and over | 16 (100.0%) | 16 (100.0%) |
| Total | 87 (37.2%) | 179 (76.5%) |
Disability Status by Sex by Age in Summit
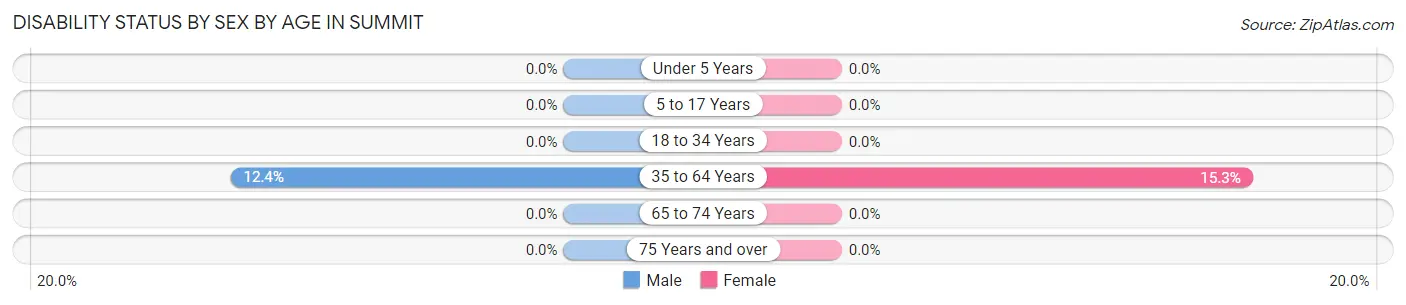
| Age Bracket | Male | Female |
| Under 5 Years | 0 (0.0%) | 0 (0.0%) |
| 5 to 17 Years | 0 (0.0%) | 0 (0.0%) |
| 18 to 34 Years | 0 (0.0%) | 0 (0.0%) |
| 35 to 64 Years | 10 (12.3%) | 9 (15.2%) |
| 65 to 74 Years | 0 (0.0%) | 0 (0.0%) |
| 75 Years and over | 0 (0.0%) | 0 (0.0%) |
Disability Class by Sex by Age in Summit
Disability Class: Hearing Difficulty
| Age Bracket | Male | Female |
| Under 5 Years | 0 (0.0%) | 0 (0.0%) |
| 5 to 17 Years | 0 (0.0%) | 0 (0.0%) |
| 18 to 34 Years | 0 (0.0%) | 0 (0.0%) |
| 35 to 64 Years | 0 (0.0%) | 0 (0.0%) |
| 65 to 74 Years | 0 (0.0%) | 0 (0.0%) |
| 75 Years and over | 0 (0.0%) | 0 (0.0%) |
Disability Class: Vision Difficulty
| Age Bracket | Male | Female |
| Under 5 Years | 0 (0.0%) | 0 (0.0%) |
| 5 to 17 Years | 0 (0.0%) | 0 (0.0%) |
| 18 to 34 Years | 0 (0.0%) | 0 (0.0%) |
| 35 to 64 Years | 0 (0.0%) | 0 (0.0%) |
| 65 to 74 Years | 0 (0.0%) | 0 (0.0%) |
| 75 Years and over | 0 (0.0%) | 0 (0.0%) |
Disability Class: Cognitive Difficulty
| Age Bracket | Male | Female |
| 5 to 17 Years | 0 (0.0%) | 0 (0.0%) |
| 18 to 34 Years | 0 (0.0%) | 0 (0.0%) |
| 35 to 64 Years | 10 (12.3%) | 9 (15.2%) |
| 65 to 74 Years | 0 (0.0%) | 0 (0.0%) |
| 75 Years and over | 0 (0.0%) | 0 (0.0%) |
Disability Class: Ambulatory Difficulty
| Age Bracket | Male | Female |
| 5 to 17 Years | 0 (0.0%) | 0 (0.0%) |
| 18 to 34 Years | 0 (0.0%) | 0 (0.0%) |
| 35 to 64 Years | 0 (0.0%) | 0 (0.0%) |
| 65 to 74 Years | 0 (0.0%) | 0 (0.0%) |
| 75 Years and over | 0 (0.0%) | 0 (0.0%) |
Disability Class: Self-Care Difficulty
| Age Bracket | Male | Female |
| 5 to 17 Years | 0 (0.0%) | 0 (0.0%) |
| 18 to 34 Years | 0 (0.0%) | 0 (0.0%) |
| 35 to 64 Years | 0 (0.0%) | 0 (0.0%) |
| 65 to 74 Years | 0 (0.0%) | 0 (0.0%) |
| 75 Years and over | 0 (0.0%) | 0 (0.0%) |
Technology Access in Summit
Computing Device Access in Summit
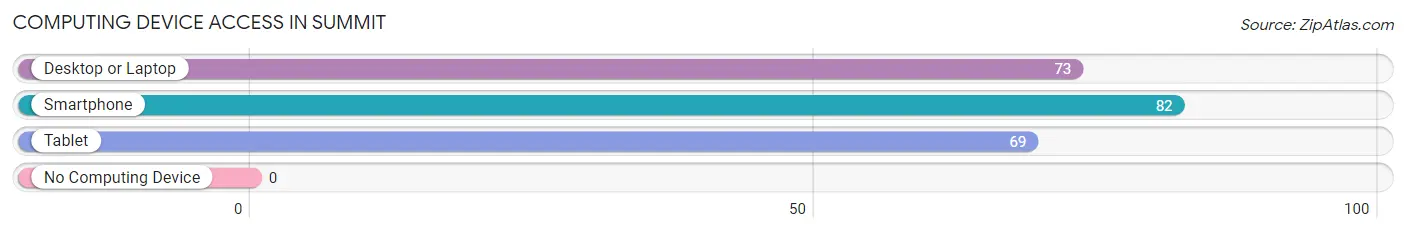
| Device Type | # Households | % Households |
| Desktop or Laptop | 73 | 89.0% |
| Smartphone | 82 | 100.0% |
| Tablet | 69 | 84.2% |
| No Computing Device | 0 | 0.0% |
| Total | 82 | 100.0% |
Internet Access in Summit
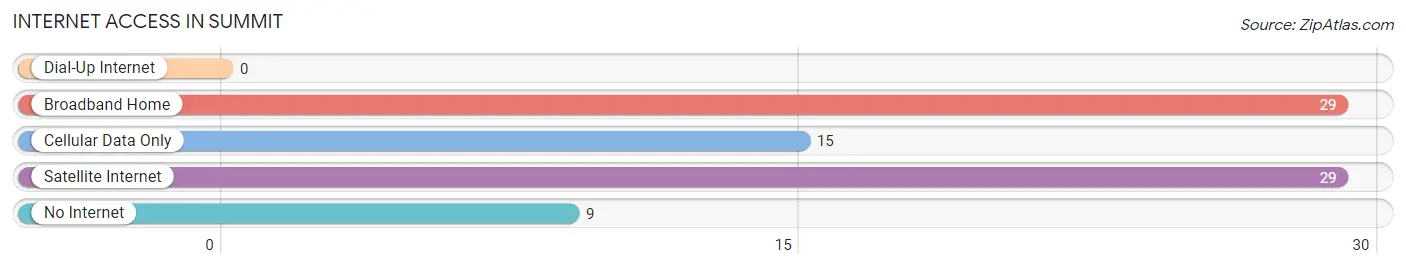
| Internet Type | # Households | % Households |
| Dial-Up Internet | 0 | 0.0% |
| Broadband Home | 29 | 35.4% |
| Cellular Data Only | 15 | 18.3% |
| Satellite Internet | 29 | 35.4% |
| No Internet | 9 | 11.0% |
| Total | 82 | 100.0% |
Summit Summary
Summit is a small unincorporated community located in the Wasatch Mountains of Utah. It is situated in Summit County, which is part of the Salt Lake City metropolitan area. The population of Summit was estimated to be 1,845 in 2020.
History
The area that is now Summit was first settled in the late 1800s by Mormon pioneers. The first settlers were primarily farmers and ranchers, and the area was known as Summitville. In the early 1900s, the area began to develop as a resort destination, and the name was changed to Summit. The area was popular for its skiing and other outdoor activities, and it was also known for its mineral springs.
In the 1950s, the area began to experience rapid growth as more people moved to the area for its recreational opportunities. The population of Summit increased from just over 500 in 1950 to over 1,000 in 1960.
Geography
Summit is located in the Wasatch Mountains of Utah, about 30 miles east of Salt Lake City. The area is known for its rugged terrain and stunning views of the surrounding mountains. The highest point in Summit is the summit of Mount Timpanogos, which is 11,752 feet above sea level.
The climate in Summit is generally mild, with cold winters and warm summers. The average annual temperature is around 40 degrees Fahrenheit. The area receives an average of about 20 inches of precipitation per year.
Economy
The economy of Summit is largely based on tourism and recreation. The area is known for its skiing, hiking, and other outdoor activities. There are several ski resorts in the area, including Park City Mountain Resort and Deer Valley Resort.
The area is also home to several businesses, including restaurants, retail stores, and lodging. The area is also home to several tech companies, including Adobe and Oracle.
Demographics
The population of Summit was estimated to be 1,845 in 2020. The racial makeup of the area is predominantly white, with about 90% of the population identifying as white. The median household income in Summit is around $80,000, which is higher than the national average.
The area is also home to a large number of retirees, with about 25% of the population over the age of 65. The area is also home to a large number of young professionals, with about 25% of the population between the ages of 25 and 44.
Conclusion
Summit is a small unincorporated community located in the Wasatch Mountains of Utah. It is known for its stunning views and outdoor activities, and it is home to several ski resorts and tech companies. The population of Summit was estimated to be 1,845 in 2020, and the area is predominantly white. The economy of Summit is largely based on tourism and recreation, and the median household income is higher than the national average.
Common Questions
What is Per Capita Income in Summit?
Per Capita income in Summit is $44,668.
What is the Median Family Income in Summit?
Median Family Income in Summit is $95,769.
What is the Median Household income in Summit?
Median Household Income in Summit is $95,769.
What is Inequality or Gini Index in Summit?
Inequality or Gini Index in Summit is 0.33.
What is the Total Population of Summit?
Total Population of Summit is 234.
What is the Total Male Population of Summit?
Total Male Population of Summit is 128.
What is the Total Female Population of Summit?
Total Female Population of Summit is 106.
What is the Ratio of Males per 100 Females in Summit?
There are 120.75 Males per 100 Females in Summit.
What is the Ratio of Females per 100 Males in Summit?
There are 82.81 Females per 100 Males in Summit.
What is the Median Population Age in Summit?
Median Population Age in Summit is 54.4 Years.
What is the Average Family Size in Summit
Average Family Size in Summit is 2.6 People.
What is the Average Household Size in Summit
Average Household Size in Summit is 2.9 People.
How Large is the Labor Force in Summit?
There are 135 People in the Labor Forcein in Summit.
What is the Percentage of People in the Labor Force in Summit?
69.2% of People are in the Labor Force in Summit.