Lyman, UT Map & Demographics
Lyman Map
Lyman Overview
$35,855
PER CAPITA INCOME
$71,250
AVG FAMILY INCOME
$67,500
AVG HOUSEHOLD INCOME
37.4%
WAGE / INCOME GAP [ % ]
62.6¢/ $1
WAGE / INCOME GAP [ $ ]
0.45
INEQUALITY / GINI INDEX
200
TOTAL POPULATION
100
MALE POPULATION
100
FEMALE POPULATION
100.00
MALES / 100 FEMALES
100.00
FEMALES / 100 MALES
41.4
MEDIAN AGE
2.7
AVG FAMILY SIZE
2.6
AVG HOUSEHOLD SIZE
101
LABOR FORCE [ PEOPLE ]
61.6%
PERCENT IN LABOR FORCE
Lyman Zip Codes
Lyman Area Codes
Income in Lyman
Income Overview in Lyman
Per Capita Income in Lyman is $35,855, while median incomes of families and households are $71,250 and $67,500 respectively.
| Characteristic | Number | Measure |
| Per Capita Income | 200 | $35,855 |
| Median Family Income | 70 | $71,250 |
| Mean Family Income | 70 | $113,407 |
| Median Household Income | 72 | $67,500 |
| Mean Household Income | 72 | $111,007 |
| Income Deficit | 70 | $0 |
| Wage / Income Gap (%) | 200 | 37.42% |
| Wage / Income Gap ($) | 200 | 62.58¢ per $1 |
| Gini / Inequality Index | 200 | 0.45 |
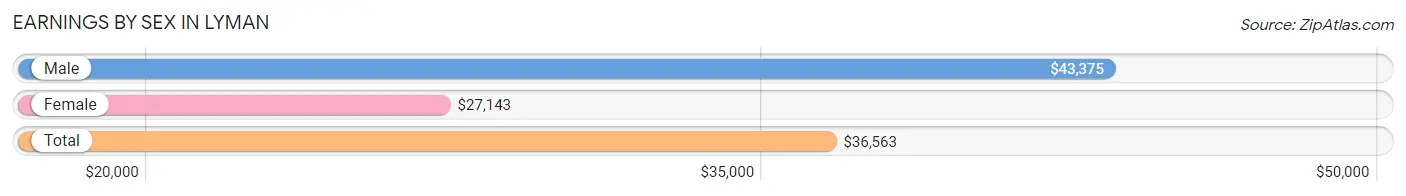
Earnings by Sex in Lyman
Average Earnings in Lyman are $36,563, $43,375 for men and $27,143 for women, a difference of 37.4%.
| Sex | Number | Average Earnings |
| Male | 57 (55.3%) | $43,375 |
| Female | 46 (44.7%) | $27,143 |
| Total | 103 (100.0%) | $36,563 |
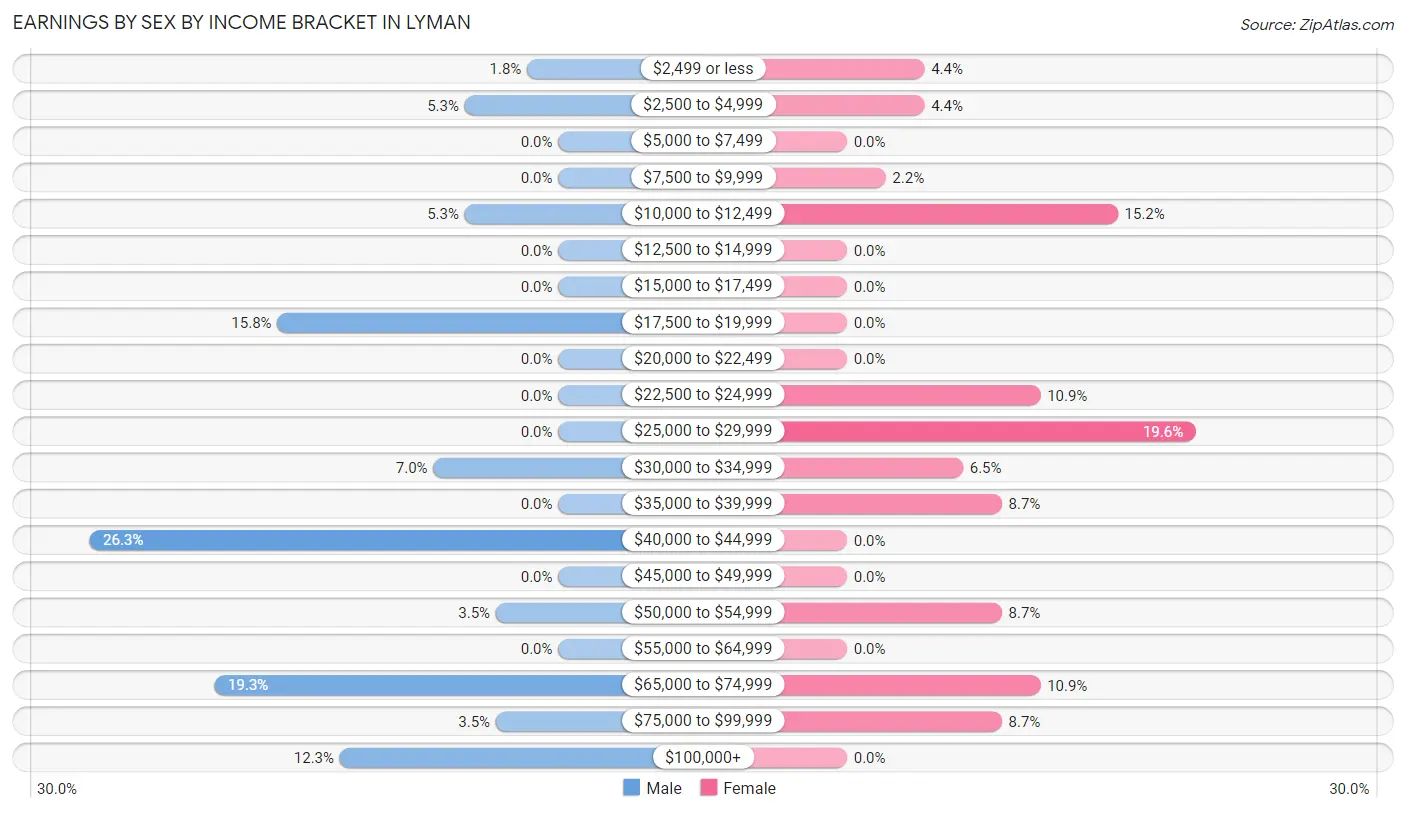
Earnings by Sex by Income Bracket in Lyman
The most common earnings brackets in Lyman are $40,000 to $44,999 for men (15 | 26.3%) and $25,000 to $29,999 for women (9 | 19.6%).
| Income | Male | Female |
| $2,499 or less | 1 (1.8%) | 2 (4.3%) |
| $2,500 to $4,999 | 3 (5.3%) | 2 (4.3%) |
| $5,000 to $7,499 | 0 (0.0%) | 0 (0.0%) |
| $7,500 to $9,999 | 0 (0.0%) | 1 (2.2%) |
| $10,000 to $12,499 | 3 (5.3%) | 7 (15.2%) |
| $12,500 to $14,999 | 0 (0.0%) | 0 (0.0%) |
| $15,000 to $17,499 | 0 (0.0%) | 0 (0.0%) |
| $17,500 to $19,999 | 9 (15.8%) | 0 (0.0%) |
| $20,000 to $22,499 | 0 (0.0%) | 0 (0.0%) |
| $22,500 to $24,999 | 0 (0.0%) | 5 (10.9%) |
| $25,000 to $29,999 | 0 (0.0%) | 9 (19.6%) |
| $30,000 to $34,999 | 4 (7.0%) | 3 (6.5%) |
| $35,000 to $39,999 | 0 (0.0%) | 4 (8.7%) |
| $40,000 to $44,999 | 15 (26.3%) | 0 (0.0%) |
| $45,000 to $49,999 | 0 (0.0%) | 0 (0.0%) |
| $50,000 to $54,999 | 2 (3.5%) | 4 (8.7%) |
| $55,000 to $64,999 | 0 (0.0%) | 0 (0.0%) |
| $65,000 to $74,999 | 11 (19.3%) | 5 (10.9%) |
| $75,000 to $99,999 | 2 (3.5%) | 4 (8.7%) |
| $100,000+ | 7 (12.3%) | 0 (0.0%) |
| Total | 57 (100.0%) | 46 (100.0%) |
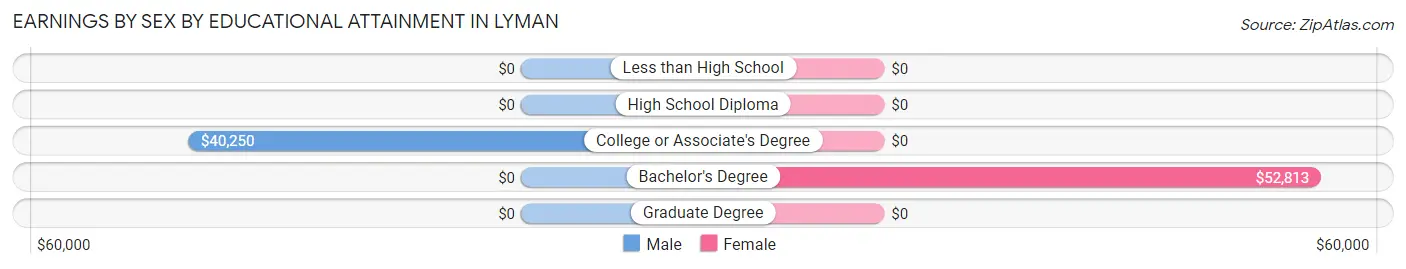
Earnings by Sex by Educational Attainment in Lyman
Average earnings in Lyman are $43,375 for men and $27,321 for women, a difference of 37.0%. Men with an educational attainment of college or associate's degree enjoy the highest average annual earnings of $40,250, while those with college or associate's degree education earn the least with $40,250. Women with an educational attainment of bachelor's degree earn the most with the average annual earnings of $52,813, while those with bachelor's degree education have the smallest earnings of $52,813.
| Educational Attainment | Male Income | Female Income |
| Less than High School | - | - |
| High School Diploma | - | - |
| College or Associate's Degree | $40,250 | $0 |
| Bachelor's Degree | - | - |
| Graduate Degree | - | - |
| Total | $43,375 | $27,321 |
Family Income in Lyman
Family Income Brackets in Lyman
According to the Lyman family income data, there are 17 families falling into the $35,000 to $49,999 income range, which is the most common income bracket and makes up 24.3% of all families.
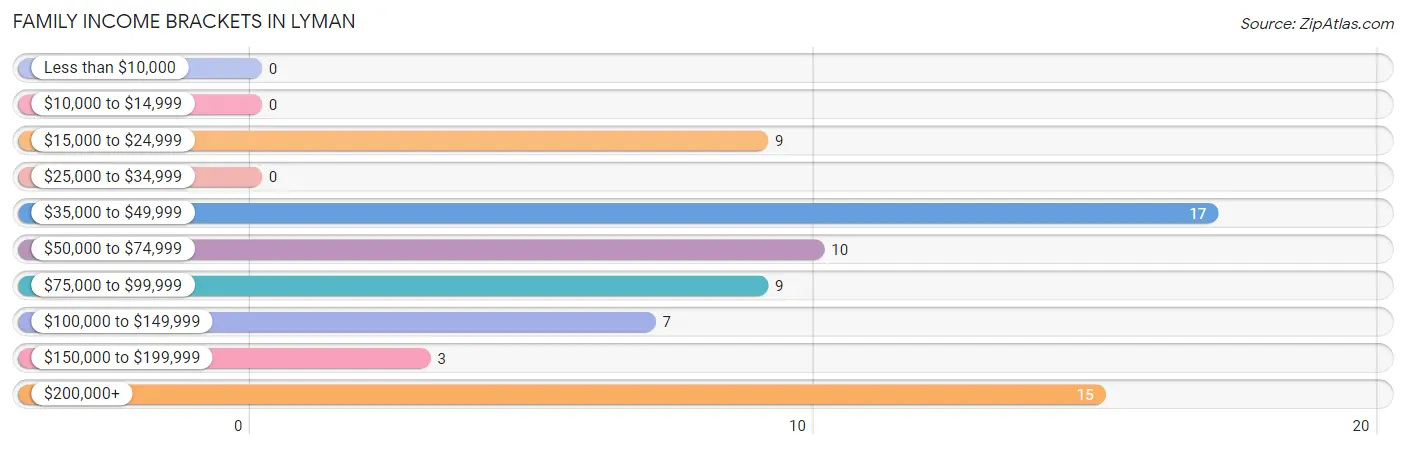
| Income Bracket | # Families | % Families |
| Less than $10,000 | 0 | 0.0% |
| $10,000 to $14,999 | 0 | 0.0% |
| $15,000 to $24,999 | 9 | 12.9% |
| $25,000 to $34,999 | 0 | 0.0% |
| $35,000 to $49,999 | 17 | 24.3% |
| $50,000 to $74,999 | 10 | 14.3% |
| $75,000 to $99,999 | 9 | 12.9% |
| $100,000 to $149,999 | 7 | 10.0% |
| $150,000 to $199,999 | 3 | 4.3% |
| $200,000+ | 15 | 21.4% |
Family Income by Famaliy Size in Lyman
2-person families (32 | 45.7%) account for the highest median family income in Lyman with $85,625 per family, while 2-person families (32 | 45.7%) have the highest median income of $42,812 per family member.
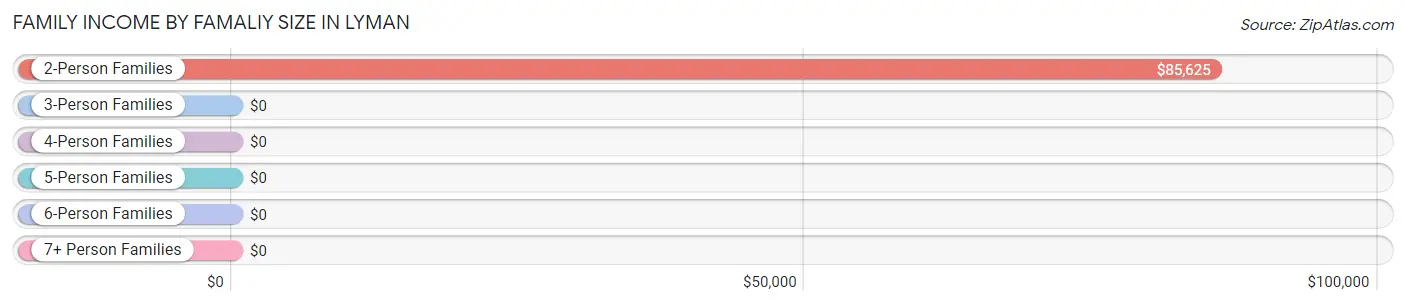
| Income Bracket | # Families | Median Income |
| 2-Person Families | 32 (45.7%) | $85,625 |
| 3-Person Families | 17 (24.3%) | $0 |
| 4-Person Families | 4 (5.7%) | $0 |
| 5-Person Families | 5 (7.1%) | $0 |
| 6-Person Families | 2 (2.9%) | $0 |
| 7+ Person Families | 10 (14.3%) | $0 |
| Total | 70 (100.0%) | $71,250 |
Family Income by Number of Earners in Lyman
The median family income in Lyman is $71,250, with families comprising 3+ earners (12) having the highest median family income of $250,001, while families with 1 earner (28) have the lowest median family income of $43,750, accounting for 17.1% and 40.0% of families, respectively.
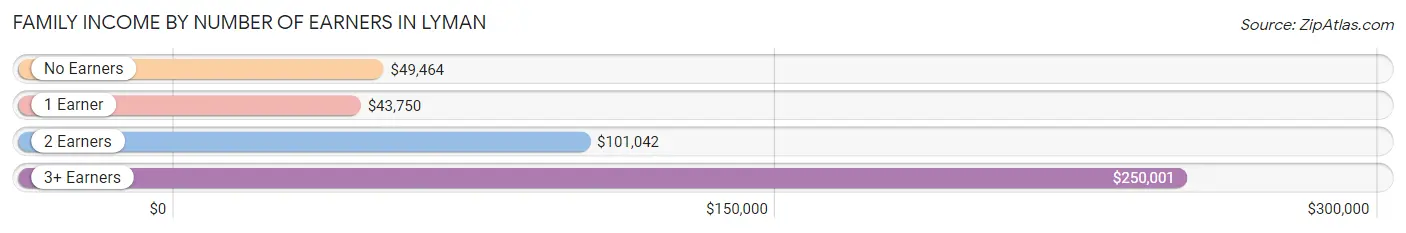
| Number of Earners | # Families | Median Income |
| No Earners | 11 (15.7%) | $49,464 |
| 1 Earner | 28 (40.0%) | $43,750 |
| 2 Earners | 19 (27.1%) | $101,042 |
| 3+ Earners | 12 (17.1%) | $250,001 |
| Total | 70 (100.0%) | $71,250 |
Household Income in Lyman
Household Income Brackets in Lyman
With 17 households falling in the category, the $35,000 to $49,999 income range is the most frequent in Lyman, accounting for 23.6% of all households.
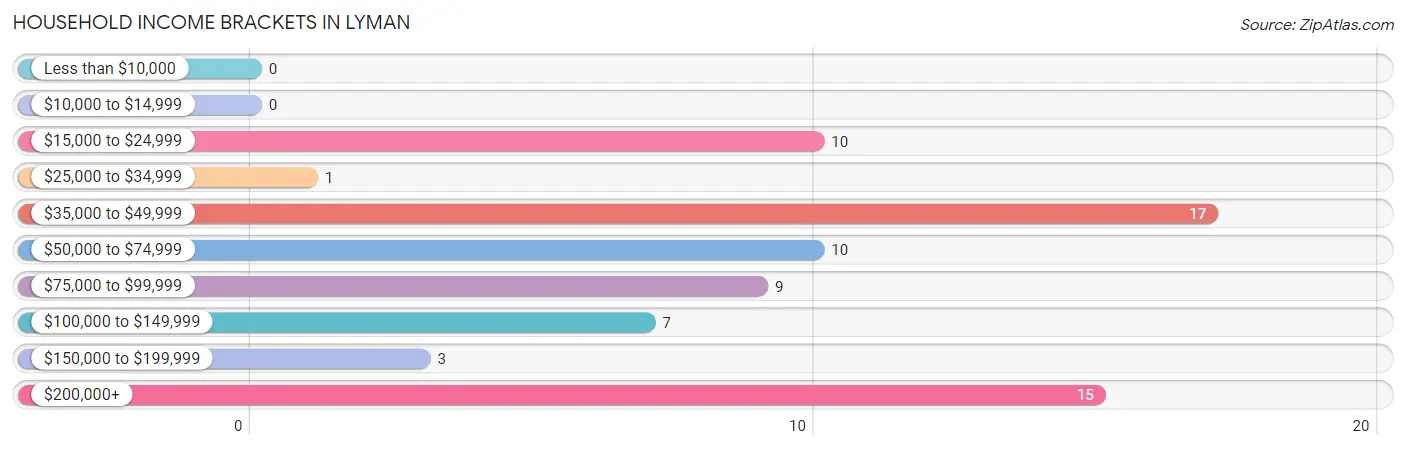
| Income Bracket | # Households | % Households |
| Less than $10,000 | 0 | 0.0% |
| $10,000 to $14,999 | 0 | 0.0% |
| $15,000 to $24,999 | 10 | 13.9% |
| $25,000 to $34,999 | 1 | 1.4% |
| $35,000 to $49,999 | 17 | 23.6% |
| $50,000 to $74,999 | 10 | 13.9% |
| $75,000 to $99,999 | 9 | 12.5% |
| $100,000 to $149,999 | 7 | 9.7% |
| $150,000 to $199,999 | 3 | 4.2% |
| $200,000+ | 15 | 20.8% |
Household Income by Householder Age in Lyman
The median household income in Lyman is $67,500, with the highest median household income of $203,125 found in the 45 to 64 years age bracket for the primary householder. A total of 28 households (38.9%) fall into this category.
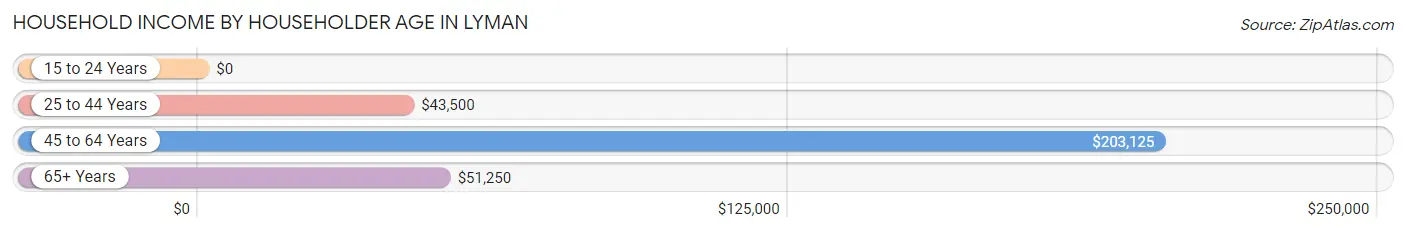
| Income Bracket | # Households | Median Income |
| 15 to 24 Years | 0 (0.0%) | $0 |
| 25 to 44 Years | 26 (36.1%) | $43,500 |
| 45 to 64 Years | 28 (38.9%) | $203,125 |
| 65+ Years | 18 (25.0%) | $51,250 |
| Total | 72 (100.0%) | $67,500 |
Poverty in Lyman
Income Below Poverty by Sex and Age in Lyman
With 31.0% poverty level for males and 40.0% for females among the residents of Lyman, 18 to 24 year old males and 6 to 11 year old females are the most vulnerable to poverty, with 2 males (100.0%) and 11 females (100.0%) in their respective age groups living below the poverty level.
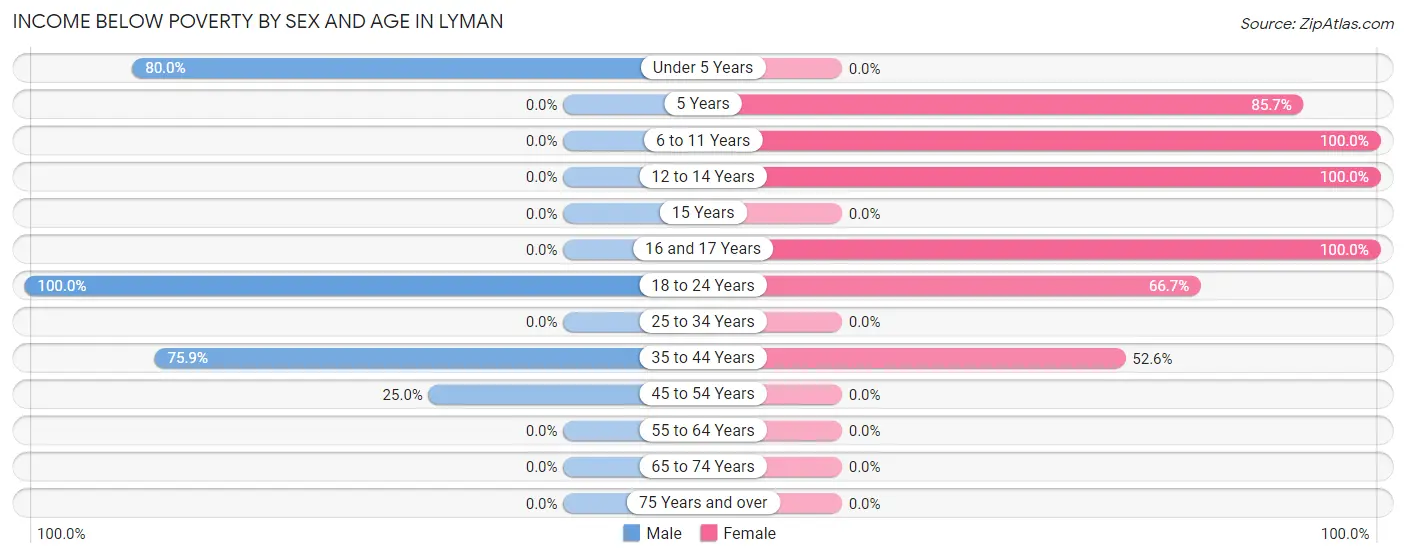
| Age Bracket | Male | Female |
| Under 5 Years | 4 (80.0%) | 0 (0.0%) |
| 5 Years | 0 (0.0%) | 6 (85.7%) |
| 6 to 11 Years | 0 (0.0%) | 11 (100.0%) |
| 12 to 14 Years | 0 (0.0%) | 5 (100.0%) |
| 15 Years | 0 (0.0%) | 0 (0.0%) |
| 16 and 17 Years | 0 (0.0%) | 4 (100.0%) |
| 18 to 24 Years | 2 (100.0%) | 4 (66.7%) |
| 25 to 34 Years | 0 (0.0%) | 0 (0.0%) |
| 35 to 44 Years | 22 (75.9%) | 10 (52.6%) |
| 45 to 54 Years | 3 (25.0%) | 0 (0.0%) |
| 55 to 64 Years | 0 (0.0%) | 0 (0.0%) |
| 65 to 74 Years | 0 (0.0%) | 0 (0.0%) |
| 75 Years and over | 0 (0.0%) | 0 (0.0%) |
| Total | 31 (31.0%) | 40 (40.0%) |
Income Above Poverty by Sex and Age in Lyman
According to the poverty statistics in Lyman, males aged 6 to 11 years and females aged 25 to 34 years are the age groups that are most secure financially, with 100.0% of males and 100.0% of females in these age groups living above the poverty line.
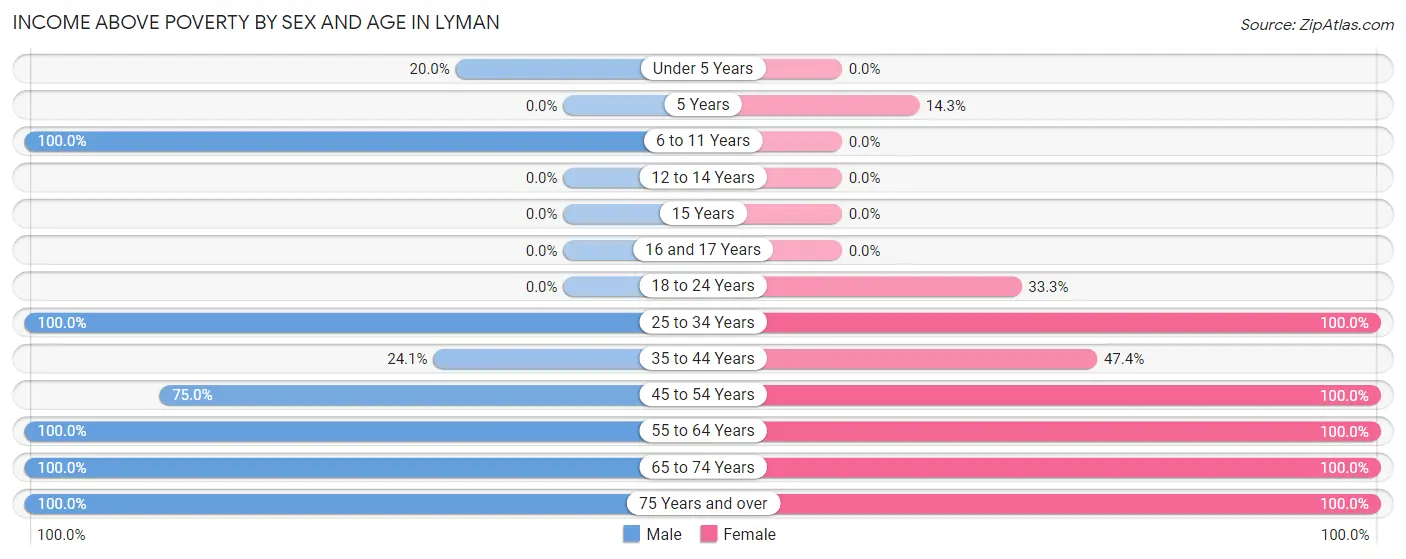
| Age Bracket | Male | Female |
| Under 5 Years | 1 (20.0%) | 0 (0.0%) |
| 5 Years | 0 (0.0%) | 1 (14.3%) |
| 6 to 11 Years | 8 (100.0%) | 0 (0.0%) |
| 12 to 14 Years | 0 (0.0%) | 0 (0.0%) |
| 15 Years | 0 (0.0%) | 0 (0.0%) |
| 16 and 17 Years | 0 (0.0%) | 0 (0.0%) |
| 18 to 24 Years | 0 (0.0%) | 2 (33.3%) |
| 25 to 34 Years | 6 (100.0%) | 2 (100.0%) |
| 35 to 44 Years | 7 (24.1%) | 9 (47.4%) |
| 45 to 54 Years | 9 (75.0%) | 16 (100.0%) |
| 55 to 64 Years | 16 (100.0%) | 15 (100.0%) |
| 65 to 74 Years | 6 (100.0%) | 6 (100.0%) |
| 75 Years and over | 16 (100.0%) | 9 (100.0%) |
| Total | 69 (69.0%) | 60 (60.0%) |
Income Below Poverty Among Married-Couple Families in Lyman
The poverty statistics for married-couple families in Lyman show that 16.4% or 10 of the total 61 families live below the poverty line. Families with 5 or more children have the highest poverty rate of 100.0%, comprising of 10 families. On the other hand, families with no children have the lowest poverty rate of 0.0%, which includes 0 families.
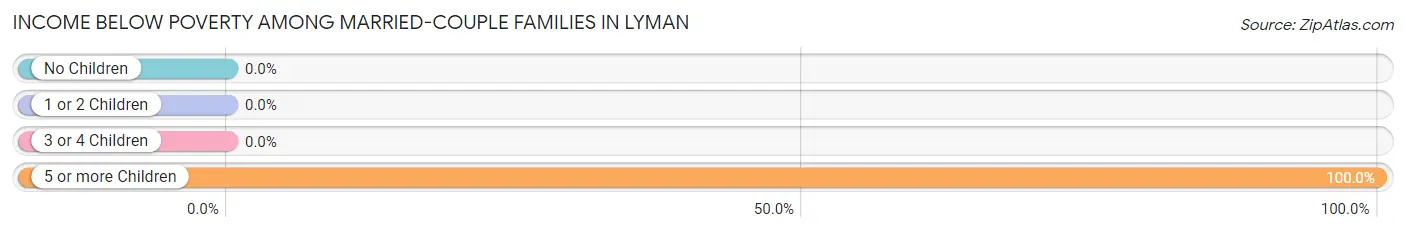
| Children | Above Poverty | Below Poverty |
| No Children | 44 (100.0%) | 0 (0.0%) |
| 1 or 2 Children | 5 (100.0%) | 0 (0.0%) |
| 3 or 4 Children | 2 (100.0%) | 0 (0.0%) |
| 5 or more Children | 0 (0.0%) | 10 (100.0%) |
| Total | 51 (83.6%) | 10 (16.4%) |
Income Below Poverty Among Single-Parent Households in Lyman
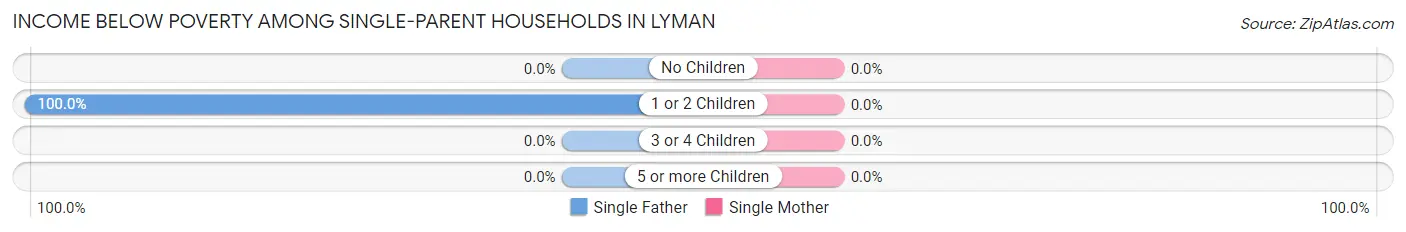
| Children | Single Father | Single Mother |
| No Children | 0 (0.0%) | 0 (0.0%) |
| 1 or 2 Children | 9 (100.0%) | 0 (0.0%) |
| 3 or 4 Children | 0 (0.0%) | 0 (0.0%) |
| 5 or more Children | 0 (0.0%) | 0 (0.0%) |
| Total | 9 (100.0%) | 0 (0.0%) |
Income Below Poverty Among Married-Couple vs Single-Parent Households in Lyman
The poverty data for Lyman shows that 10 of the married-couple family households (16.4%) and 9 of the single-parent households (100.0%) are living below the poverty level. Within the married-couple family households, those with 5 or more children have the highest poverty rate, with 10 households (100.0%) falling below the poverty line. Among the single-parent households, those with 1 or 2 children have the highest poverty rate, with 9 household (100.0%) living below poverty.
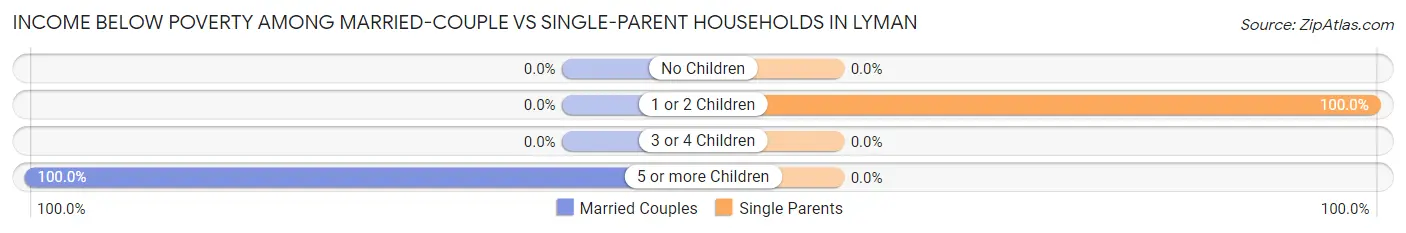
| Children | Married-Couple Families | Single-Parent Households |
| No Children | 0 (0.0%) | 0 (0.0%) |
| 1 or 2 Children | 0 (0.0%) | 9 (100.0%) |
| 3 or 4 Children | 0 (0.0%) | 0 (0.0%) |
| 5 or more Children | 10 (100.0%) | 0 (0.0%) |
| Total | 10 (16.4%) | 9 (100.0%) |
Race in Lyman
The most populous races in Lyman are White / Caucasian (198 | 99.0%), and Two or more Races (2 | 1.0%).
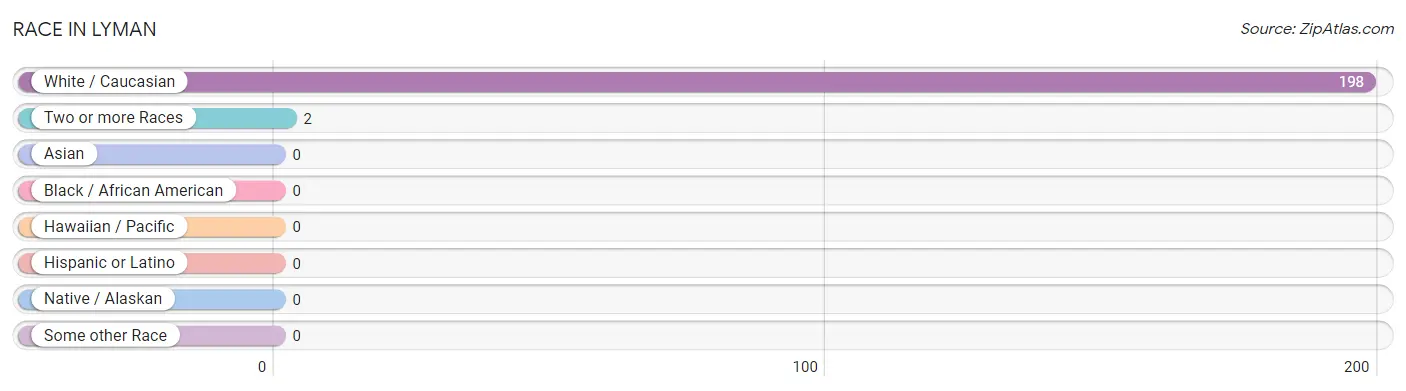
| Race | # Population | % Population |
| Asian | 0 | 0.0% |
| Black / African American | 0 | 0.0% |
| Hawaiian / Pacific | 0 | 0.0% |
| Hispanic or Latino | 0 | 0.0% |
| Native / Alaskan | 0 | 0.0% |
| White / Caucasian | 198 | 99.0% |
| Two or more Races | 2 | 1.0% |
| Some other Race | 0 | 0.0% |
| Total | 200 | 100.0% |
Ancestry in Lyman
The most populous ancestries reported in Lyman are English (127 | 63.5%), Danish (15 | 7.5%), Scottish (12 | 6.0%), American (10 | 5.0%), and Swedish (10 | 5.0%), together accounting for 87.0% of all Lyman residents.
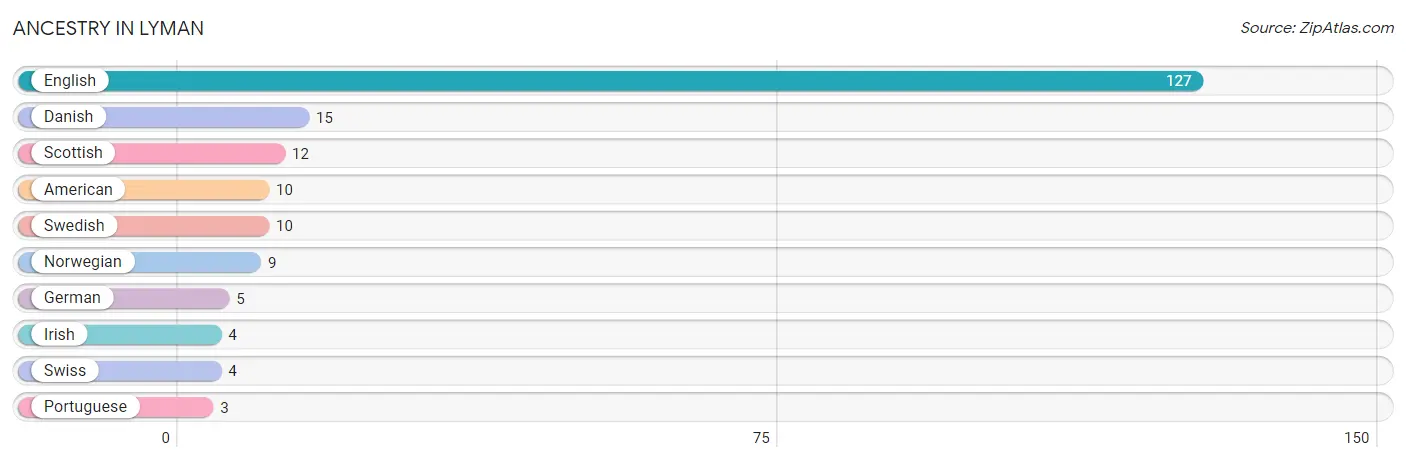
| Ancestry | # Population | % Population |
| American | 10 | 5.0% |
| Danish | 15 | 7.5% |
| English | 127 | 63.5% |
| German | 5 | 2.5% |
| Irish | 4 | 2.0% |
| Norwegian | 9 | 4.5% |
| Portuguese | 3 | 1.5% |
| Scottish | 12 | 6.0% |
| Swedish | 10 | 5.0% |
| Swiss | 4 | 2.0% | View All 10 Rows |
Immigrants in Lyman
The most numerous immigrant groups reported in Lyman came from , and Canada (11 | 5.5%), together accounting for 5.5% of all Lyman residents.

| Immigration Origin | # Population | % Population |
| Canada | 11 | 5.5% | View All 1 Rows |
Sex and Age in Lyman
Sex and Age in Lyman
The most populous age groups in Lyman are 35 to 39 Years (15 | 15.0%) for men and 5 to 9 Years (12 | 12.0%) for women.
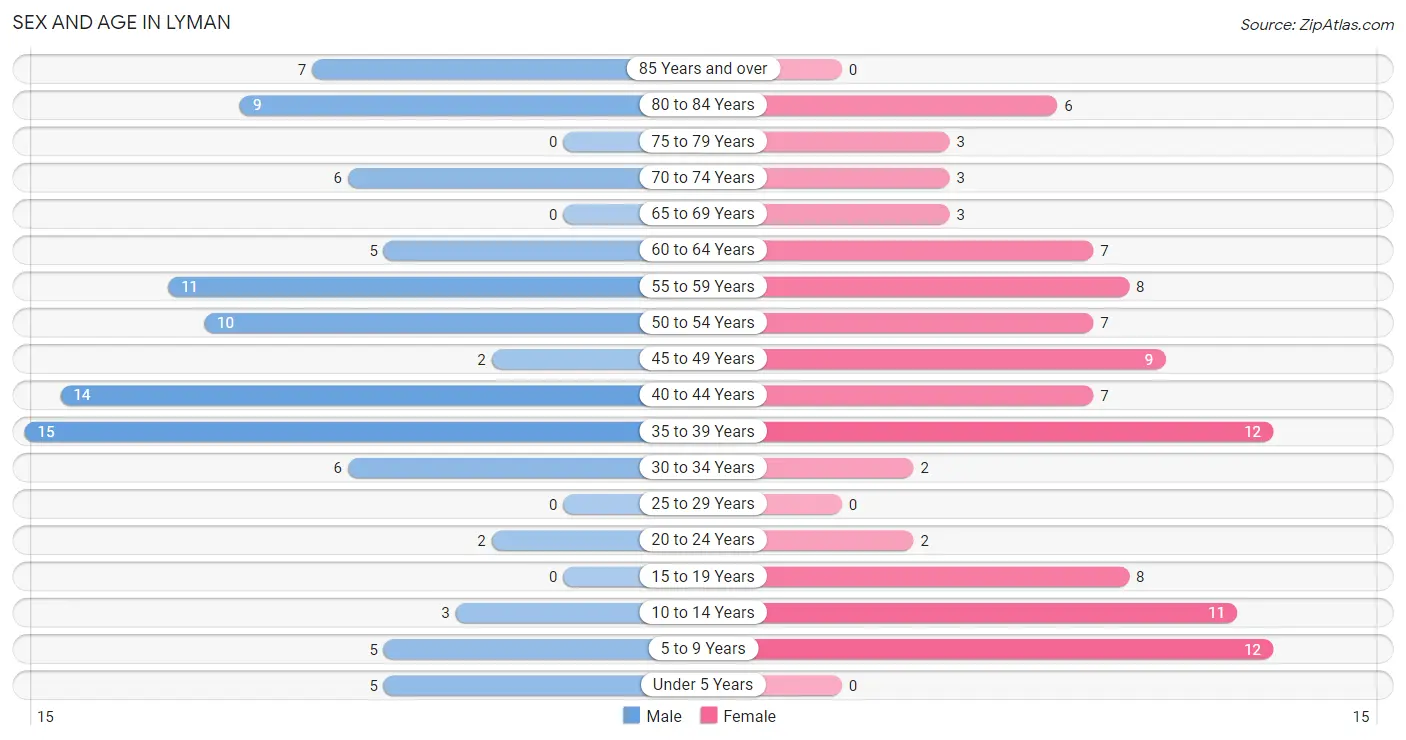
| Age Bracket | Male | Female |
| Under 5 Years | 5 (5.0%) | 0 (0.0%) |
| 5 to 9 Years | 5 (5.0%) | 12 (12.0%) |
| 10 to 14 Years | 3 (3.0%) | 11 (11.0%) |
| 15 to 19 Years | 0 (0.0%) | 8 (8.0%) |
| 20 to 24 Years | 2 (2.0%) | 2 (2.0%) |
| 25 to 29 Years | 0 (0.0%) | 0 (0.0%) |
| 30 to 34 Years | 6 (6.0%) | 2 (2.0%) |
| 35 to 39 Years | 15 (15.0%) | 12 (12.0%) |
| 40 to 44 Years | 14 (14.0%) | 7 (7.0%) |
| 45 to 49 Years | 2 (2.0%) | 9 (9.0%) |
| 50 to 54 Years | 10 (10.0%) | 7 (7.0%) |
| 55 to 59 Years | 11 (11.0%) | 8 (8.0%) |
| 60 to 64 Years | 5 (5.0%) | 7 (7.0%) |
| 65 to 69 Years | 0 (0.0%) | 3 (3.0%) |
| 70 to 74 Years | 6 (6.0%) | 3 (3.0%) |
| 75 to 79 Years | 0 (0.0%) | 3 (3.0%) |
| 80 to 84 Years | 9 (9.0%) | 6 (6.0%) |
| 85 Years and over | 7 (7.0%) | 0 (0.0%) |
| Total | 100 (100.0%) | 100 (100.0%) |
Families and Households in Lyman
Median Family Size in Lyman
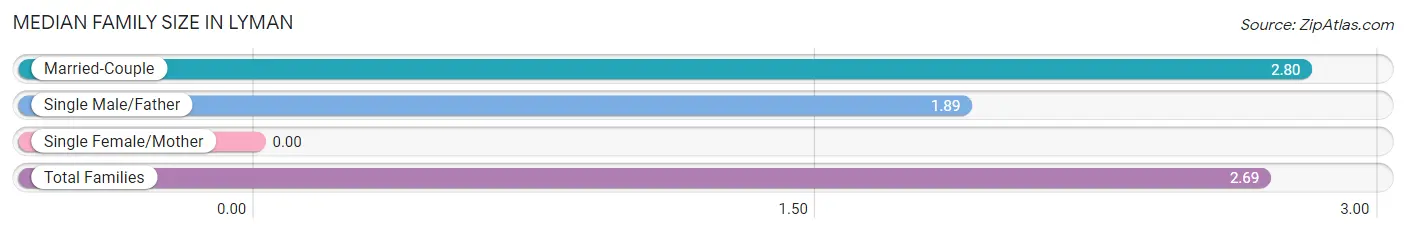
| Family Type | # Families | Family Size |
| Married-Couple | 61 (87.1%) | 2.80 |
| Single Male/Father | 9 (12.9%) | 1.89 |
| Single Female/Mother | 0 (0.0%) | - |
| Total Families | 70 (100.0%) | 2.69 |
Median Household Size in Lyman
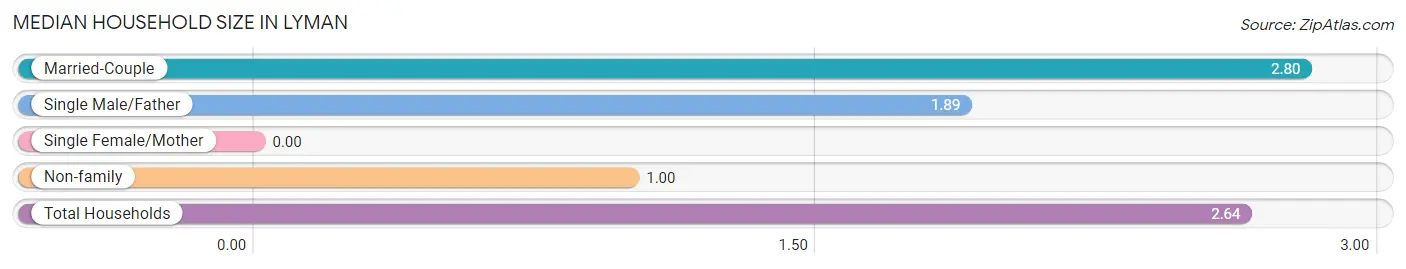
| Household Type | # Households | Household Size |
| Married-Couple | 61 (84.7%) | 2.80 |
| Single Male/Father | 9 (12.5%) | 1.89 |
| Single Female/Mother | 0 (0.0%) | - |
| Non-family | 2 (2.8%) | 1.00 |
| Total Households | 72 (100.0%) | 2.64 |
Household Size by Marriage Status in Lyman
Out of a total of 72 households in Lyman, 70 (97.2%) are family households, while 2 (2.8%) are nonfamily households. The most numerous type of family households are 2-person households, comprising 32, and the most common type of nonfamily households are 1-person households, comprising 2.
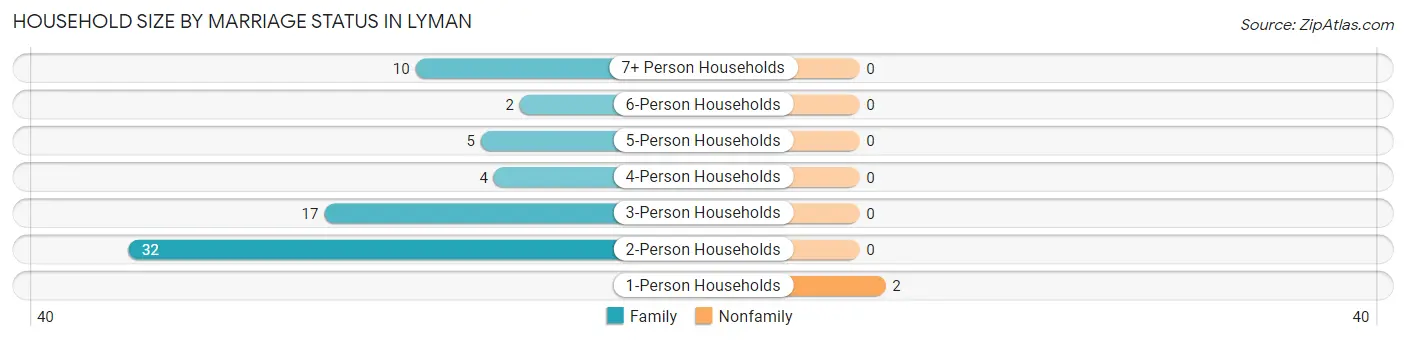
| Household Size | Family Households | Nonfamily Households |
| 1-Person Households | - | 2 (2.8%) |
| 2-Person Households | 32 (44.4%) | 0 (0.0%) |
| 3-Person Households | 17 (23.6%) | 0 (0.0%) |
| 4-Person Households | 4 (5.6%) | 0 (0.0%) |
| 5-Person Households | 5 (6.9%) | 0 (0.0%) |
| 6-Person Households | 2 (2.8%) | 0 (0.0%) |
| 7+ Person Households | 10 (13.9%) | 0 (0.0%) |
| Total | 70 (97.2%) | 2 (2.8%) |
Female Fertility in Lyman
Fertility by Age in Lyman
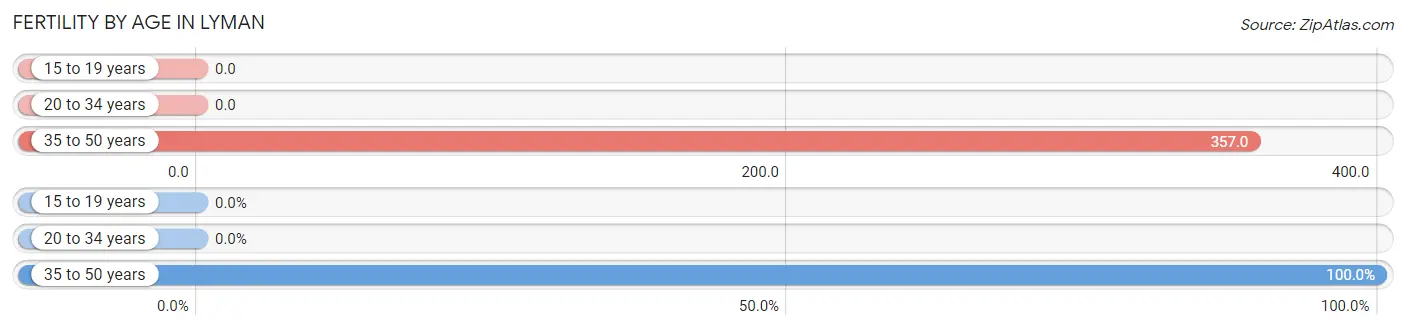
Average fertility rate in Lyman is 250.0 births per 1,000 women. Women in the age bracket of 35 to 50 years have the highest fertility rate with 357.0 births per 1,000 women. Women in the age bracket of 35 to 50 years acount for 100.0% of all women with births.
| Age Bracket | Women with Births | Births / 1,000 Women |
| 15 to 19 years | 0 (0.0%) | 0.0 |
| 20 to 34 years | 0 (0.0%) | 0.0 |
| 35 to 50 years | 10 (100.0%) | 357.0 |
| Total | 10 (100.0%) | 250.0 |
Fertility by Age by Marriage Status in Lyman
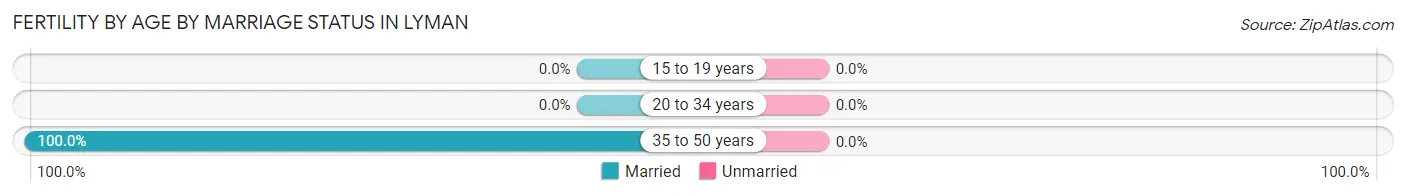
| Age Bracket | Married | Unmarried |
| 15 to 19 years | 0 (0.0%) | 0 (0.0%) |
| 20 to 34 years | 0 (0.0%) | 0 (0.0%) |
| 35 to 50 years | 10 (100.0%) | 0 (0.0%) |
| Total | 10 (100.0%) | 0 (0.0%) |
Fertility by Education in Lyman
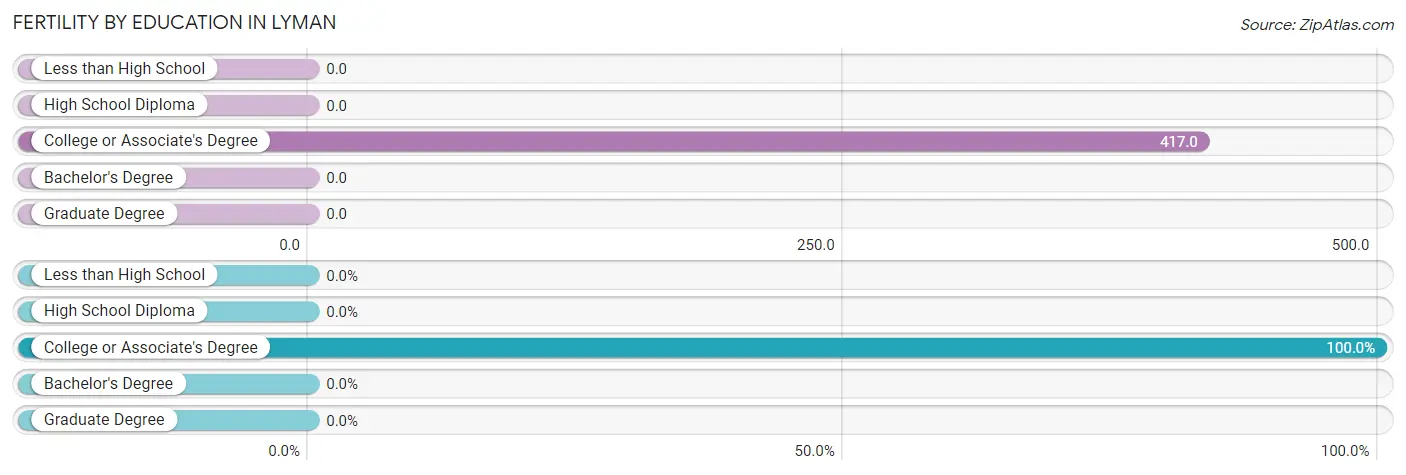
| Educational Attainment | Women with Births | Births / 1,000 Women |
| Less than High School | 0 (0.0%) | 0.0 |
| High School Diploma | 0 (0.0%) | 0.0 |
| College or Associate's Degree | 10 (100.0%) | 417.0 |
| Bachelor's Degree | 0 (0.0%) | 0.0 |
| Graduate Degree | 0 (0.0%) | 0.0 |
| Total | 10 (100.0%) | 250.0 |
Fertility by Education by Marriage Status in Lyman
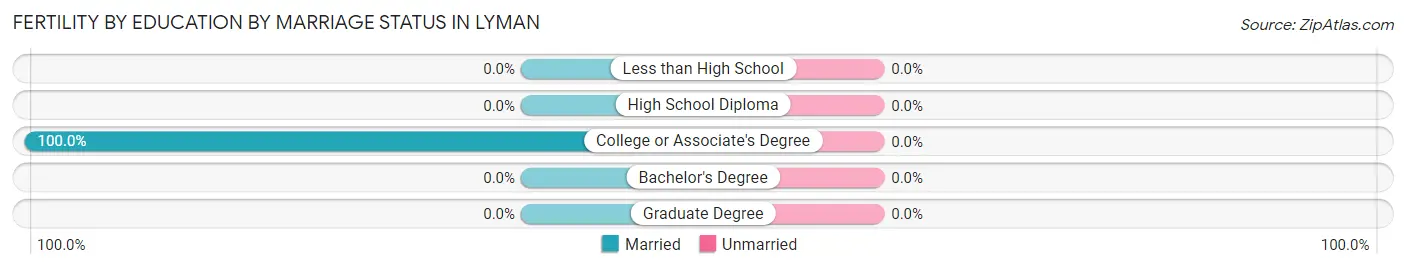
| Educational Attainment | Married | Unmarried |
| Less than High School | 0 (0.0%) | 0 (0.0%) |
| High School Diploma | 0 (0.0%) | 0 (0.0%) |
| College or Associate's Degree | 10 (100.0%) | 0 (0.0%) |
| Bachelor's Degree | 0 (0.0%) | 0 (0.0%) |
| Graduate Degree | 0 (0.0%) | 0 (0.0%) |
| Total | 10 (100.0%) | 0 (0.0%) |
Employment Characteristics in Lyman
Employment by Class of Employer in Lyman
Among the 101 employed individuals in Lyman, private company employees (50 | 49.5%), not-for-profit organizations (17 | 16.8%), and federal government employees (12 | 11.9%) make up the most common classes of employment.
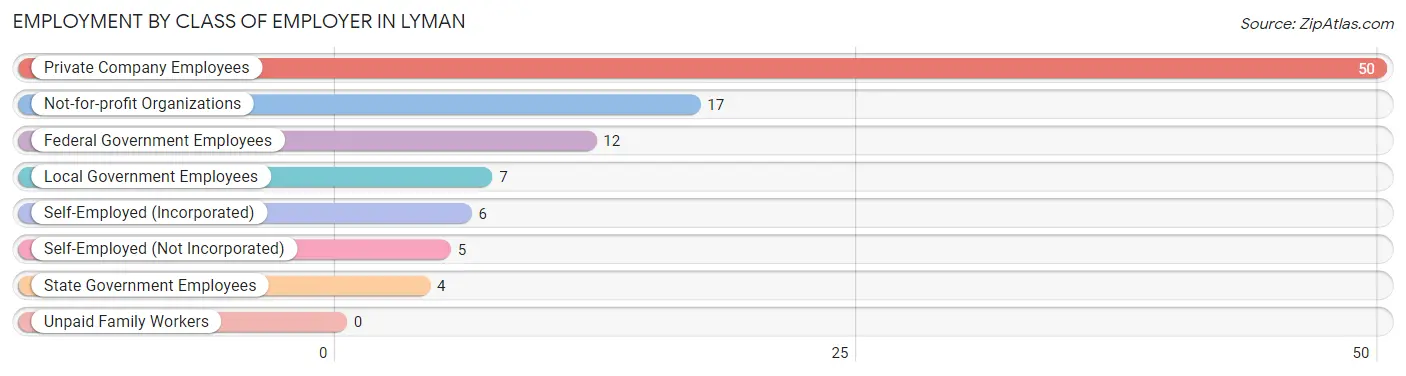
| Employer Class | # Employees | % Employees |
| Private Company Employees | 50 | 49.5% |
| Self-Employed (Incorporated) | 6 | 5.9% |
| Self-Employed (Not Incorporated) | 5 | 5.0% |
| Not-for-profit Organizations | 17 | 16.8% |
| Local Government Employees | 7 | 6.9% |
| State Government Employees | 4 | 4.0% |
| Federal Government Employees | 12 | 11.9% |
| Unpaid Family Workers | 0 | 0.0% |
| Total | 101 | 100.0% |
Employment Status by Age in Lyman
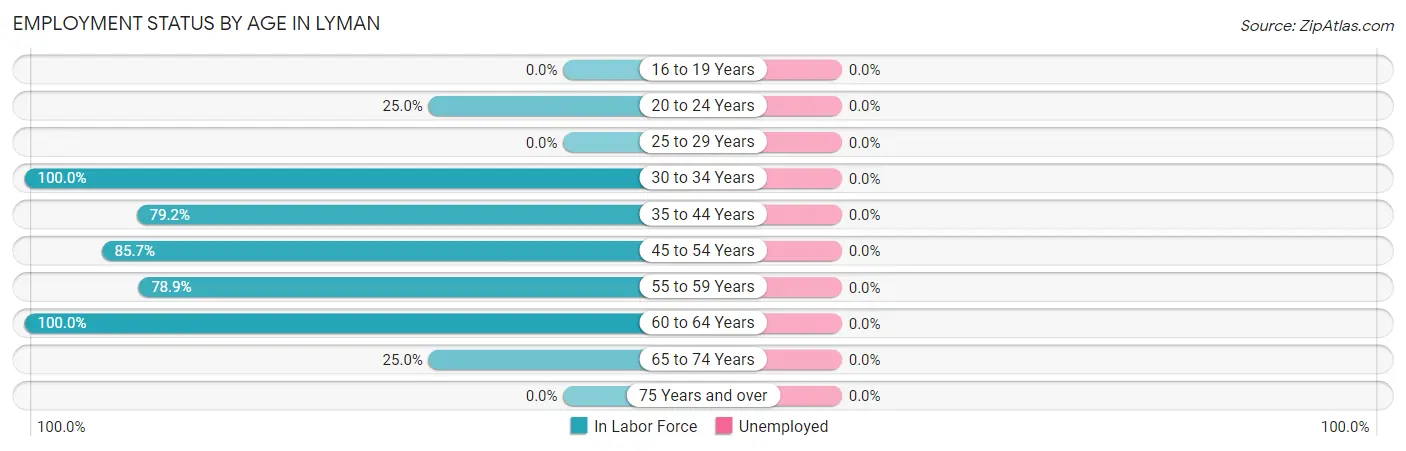
| Age Bracket | In Labor Force | Unemployed |
| 16 to 19 Years | 0 (0.0%) | 0 (0.0%) |
| 20 to 24 Years | 1 (25.0%) | 0 (0.0%) |
| 25 to 29 Years | 0 (0.0%) | 0 (0.0%) |
| 30 to 34 Years | 8 (100.0%) | 0 (0.0%) |
| 35 to 44 Years | 38 (79.2%) | 0 (0.0%) |
| 45 to 54 Years | 24 (85.7%) | 0 (0.0%) |
| 55 to 59 Years | 15 (78.9%) | 0 (0.0%) |
| 60 to 64 Years | 12 (100.0%) | 0 (0.0%) |
| 65 to 74 Years | 3 (25.0%) | 0 (0.0%) |
| 75 Years and over | 0 (0.0%) | 0 (0.0%) |
| Total | 101 (61.6%) | 0 (0.0%) |
Employment Status by Educational Attainment in Lyman
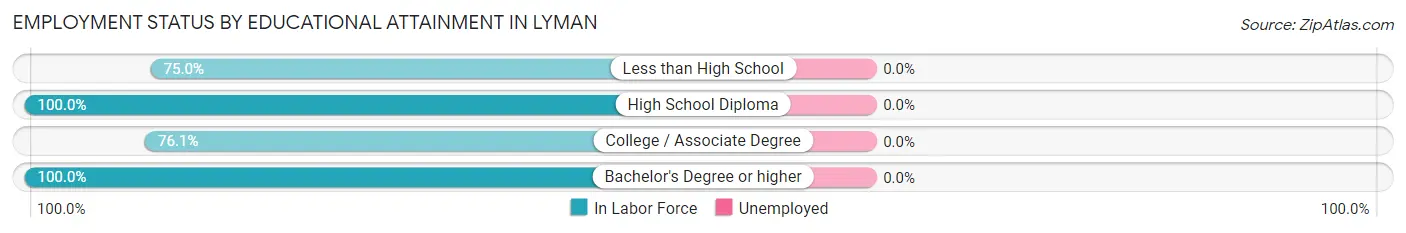
| Educational Attainment | In Labor Force | Unemployed |
| Less than High School | 6 (75.0%) | 0 (0.0%) |
| High School Diploma | 22 (100.0%) | 0 (0.0%) |
| College / Associate Degree | 51 (76.1%) | 0 (0.0%) |
| Bachelor's Degree or higher | 18 (100.0%) | 0 (0.0%) |
| Total | 97 (84.3%) | 0 (0.0%) |
Employment Occupations by Sex in Lyman
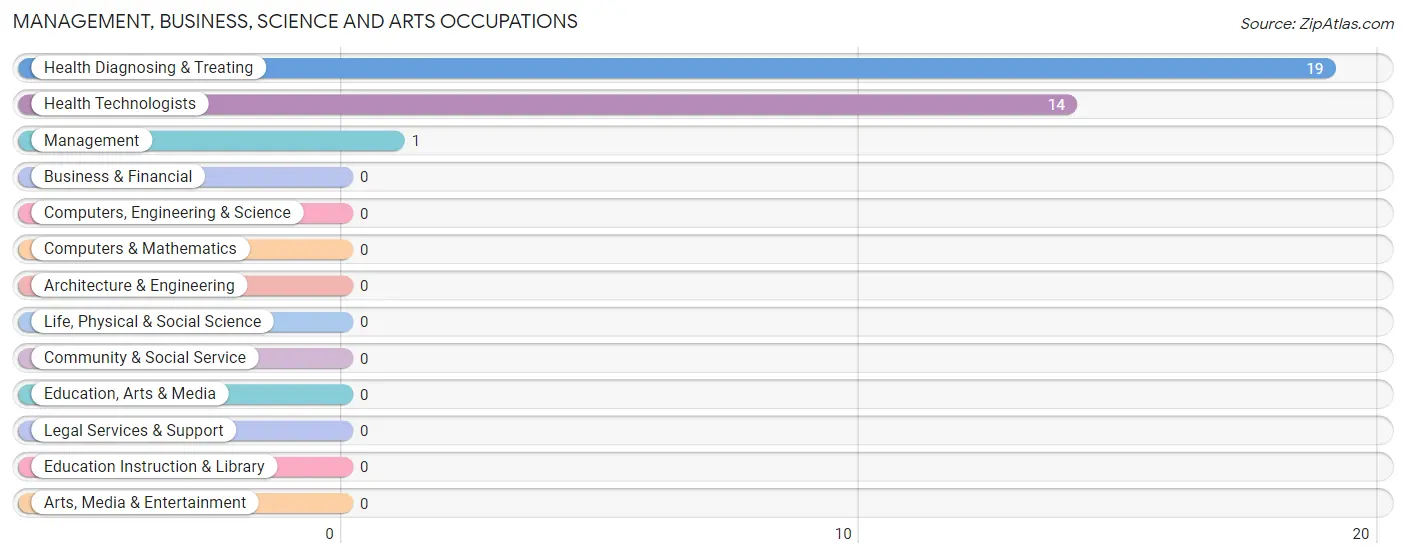
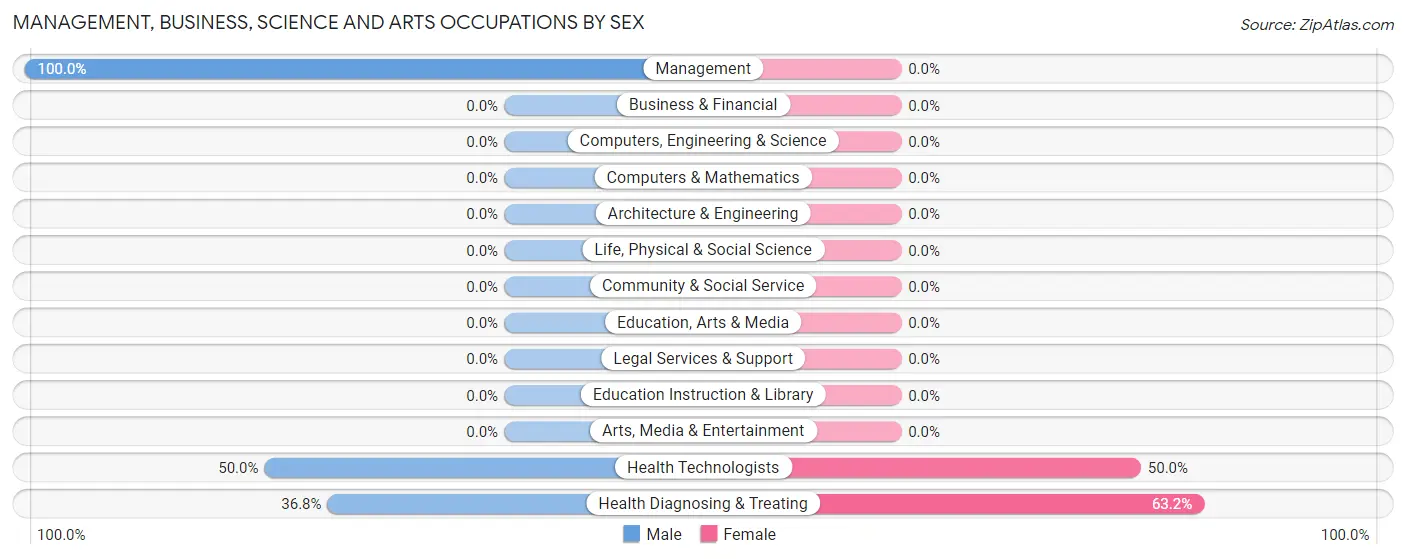
Management, Business, Science and Arts Occupations
The most common Management, Business, Science and Arts occupations in Lyman are Health Diagnosing & Treating (19 | 18.8%), Health Technologists (14 | 13.9%), and Management (1 | 1.0%).
Management, Business, Science and Arts Occupations by Sex
Within the Management, Business, Science and Arts occupations in Lyman, the most male-oriented occupations are Management (100.0%), Health Technologists (50.0%), and Health Diagnosing & Treating (36.8%), while the most female-oriented occupations are Health Diagnosing & Treating (63.2%), and Health Technologists (50.0%).
| Occupation | Male | Female |
| Management | 1 (100.0%) | 0 (0.0%) |
| Business & Financial | 0 (0.0%) | 0 (0.0%) |
| Computers, Engineering & Science | 0 (0.0%) | 0 (0.0%) |
| Computers & Mathematics | 0 (0.0%) | 0 (0.0%) |
| Architecture & Engineering | 0 (0.0%) | 0 (0.0%) |
| Life, Physical & Social Science | 0 (0.0%) | 0 (0.0%) |
| Community & Social Service | 0 (0.0%) | 0 (0.0%) |
| Education, Arts & Media | 0 (0.0%) | 0 (0.0%) |
| Legal Services & Support | 0 (0.0%) | 0 (0.0%) |
| Education Instruction & Library | 0 (0.0%) | 0 (0.0%) |
| Arts, Media & Entertainment | 0 (0.0%) | 0 (0.0%) |
| Health Diagnosing & Treating | 7 (36.8%) | 12 (63.2%) |
| Health Technologists | 7 (50.0%) | 7 (50.0%) |
| Total (Category) | 8 (40.0%) | 12 (60.0%) |
| Total (Overall) | 57 (56.4%) | 44 (43.6%) |
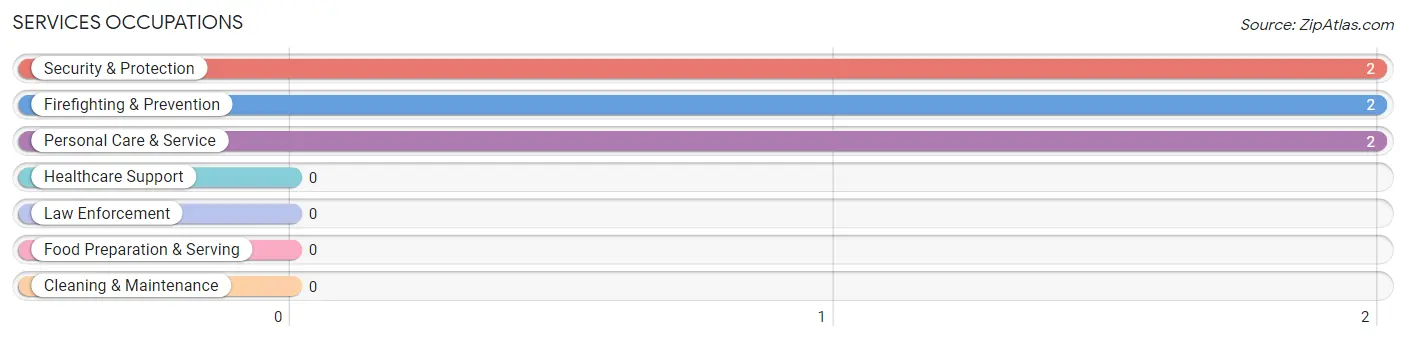
Services Occupations
The most common Services occupations in Lyman are Security & Protection (2 | 2.0%), Firefighting & Prevention (2 | 2.0%), and Personal Care & Service (2 | 2.0%).
Services Occupations by Sex
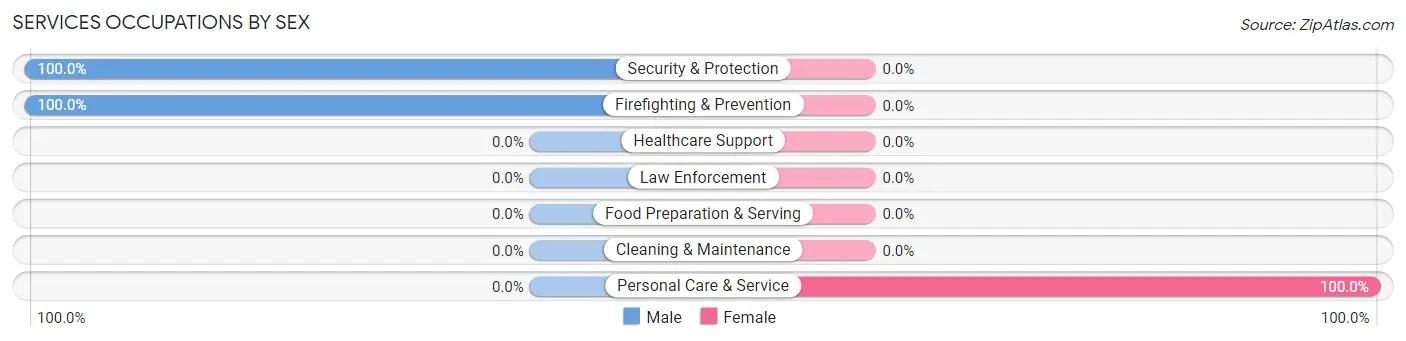
| Occupation | Male | Female |
| Healthcare Support | 0 (0.0%) | 0 (0.0%) |
| Security & Protection | 2 (100.0%) | 0 (0.0%) |
| Firefighting & Prevention | 2 (100.0%) | 0 (0.0%) |
| Law Enforcement | 0 (0.0%) | 0 (0.0%) |
| Food Preparation & Serving | 0 (0.0%) | 0 (0.0%) |
| Cleaning & Maintenance | 0 (0.0%) | 0 (0.0%) |
| Personal Care & Service | 0 (0.0%) | 2 (100.0%) |
| Total (Category) | 2 (50.0%) | 2 (50.0%) |
| Total (Overall) | 57 (56.4%) | 44 (43.6%) |
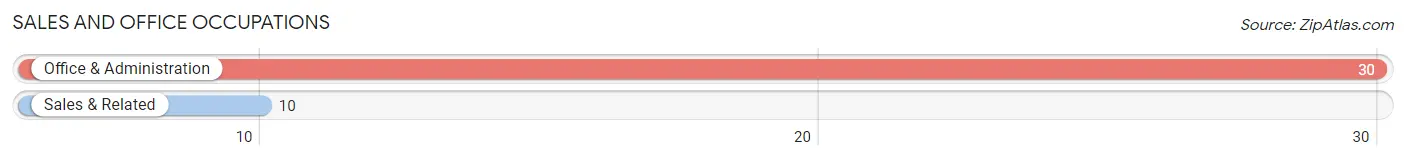
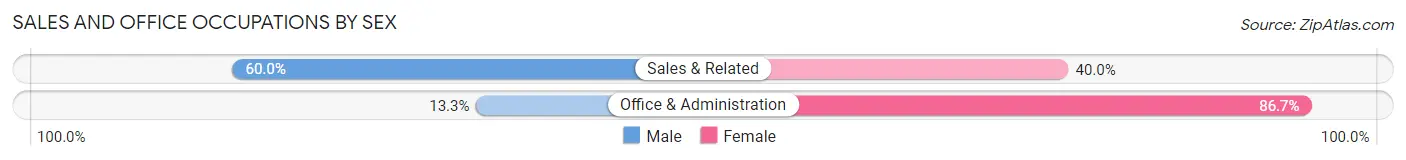
Sales and Office Occupations
The most common Sales and Office occupations in Lyman are Office & Administration (30 | 29.7%), and Sales & Related (10 | 9.9%).
Sales and Office Occupations by Sex
| Occupation | Male | Female |
| Sales & Related | 6 (60.0%) | 4 (40.0%) |
| Office & Administration | 4 (13.3%) | 26 (86.7%) |
| Total (Category) | 10 (25.0%) | 30 (75.0%) |
| Total (Overall) | 57 (56.4%) | 44 (43.6%) |
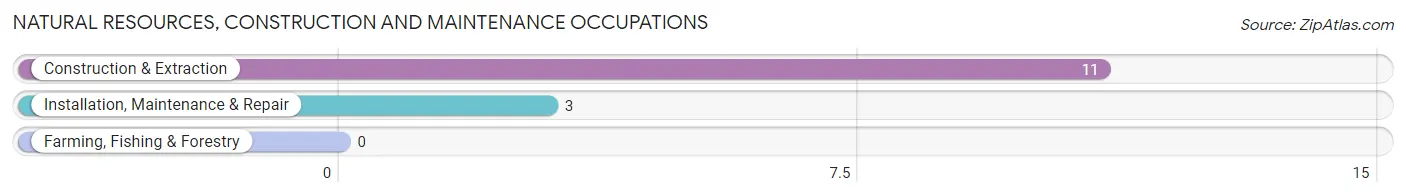
Natural Resources, Construction and Maintenance Occupations
The most common Natural Resources, Construction and Maintenance occupations in Lyman are Construction & Extraction (11 | 10.9%), and Installation, Maintenance & Repair (3 | 3.0%).
Natural Resources, Construction and Maintenance Occupations by Sex
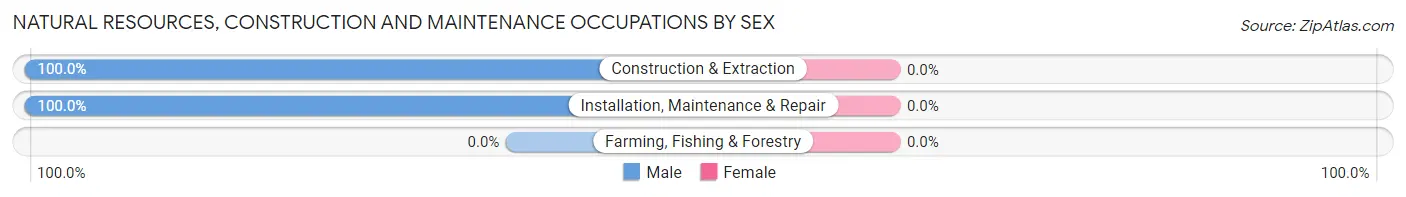
| Occupation | Male | Female |
| Farming, Fishing & Forestry | 0 (0.0%) | 0 (0.0%) |
| Construction & Extraction | 11 (100.0%) | 0 (0.0%) |
| Installation, Maintenance & Repair | 3 (100.0%) | 0 (0.0%) |
| Total (Category) | 14 (100.0%) | 0 (0.0%) |
| Total (Overall) | 57 (56.4%) | 44 (43.6%) |
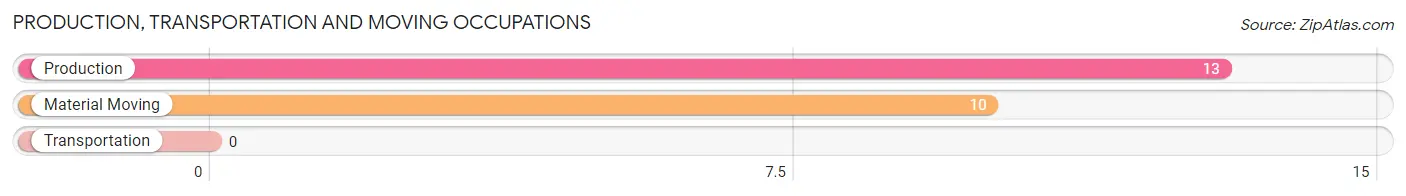
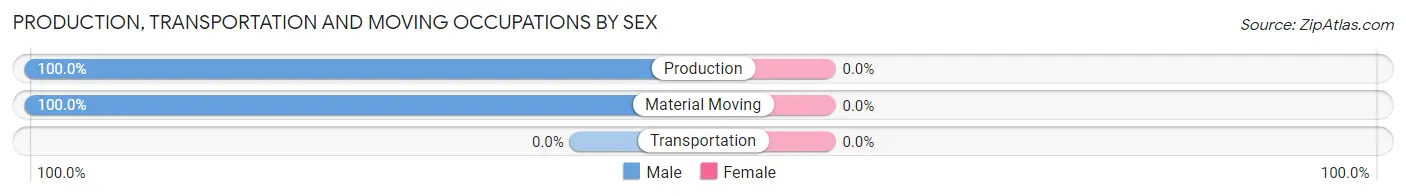
Production, Transportation and Moving Occupations
The most common Production, Transportation and Moving occupations in Lyman are Production (13 | 12.9%), and Material Moving (10 | 9.9%).
Production, Transportation and Moving Occupations by Sex
| Occupation | Male | Female |
| Production | 13 (100.0%) | 0 (0.0%) |
| Transportation | 0 (0.0%) | 0 (0.0%) |
| Material Moving | 10 (100.0%) | 0 (0.0%) |
| Total (Category) | 23 (100.0%) | 0 (0.0%) |
| Total (Overall) | 57 (56.4%) | 44 (43.6%) |
Employment Industries by Sex in Lyman
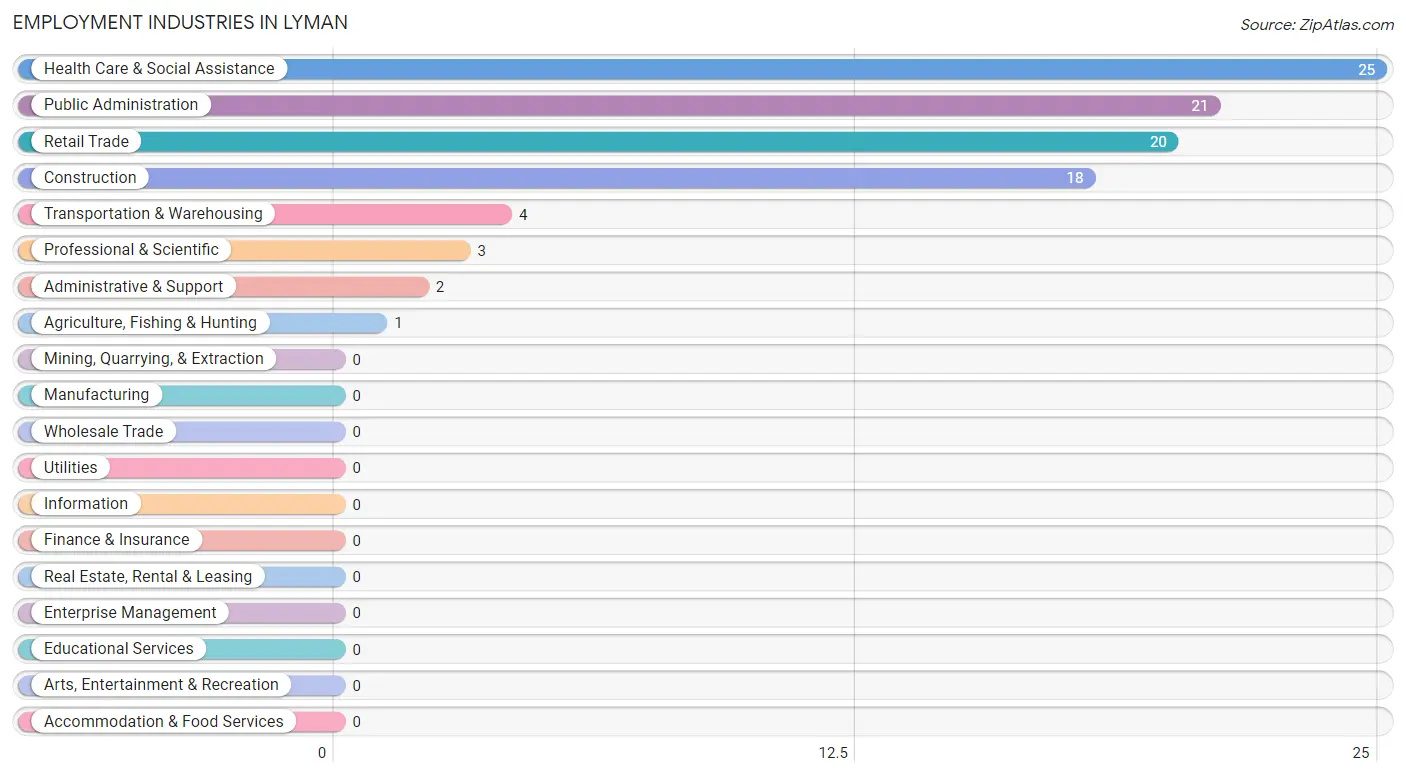
Employment Industries in Lyman
The major employment industries in Lyman include Health Care & Social Assistance (25 | 24.7%), Public Administration (21 | 20.8%), Retail Trade (20 | 19.8%), Construction (18 | 17.8%), and Transportation & Warehousing (4 | 4.0%).
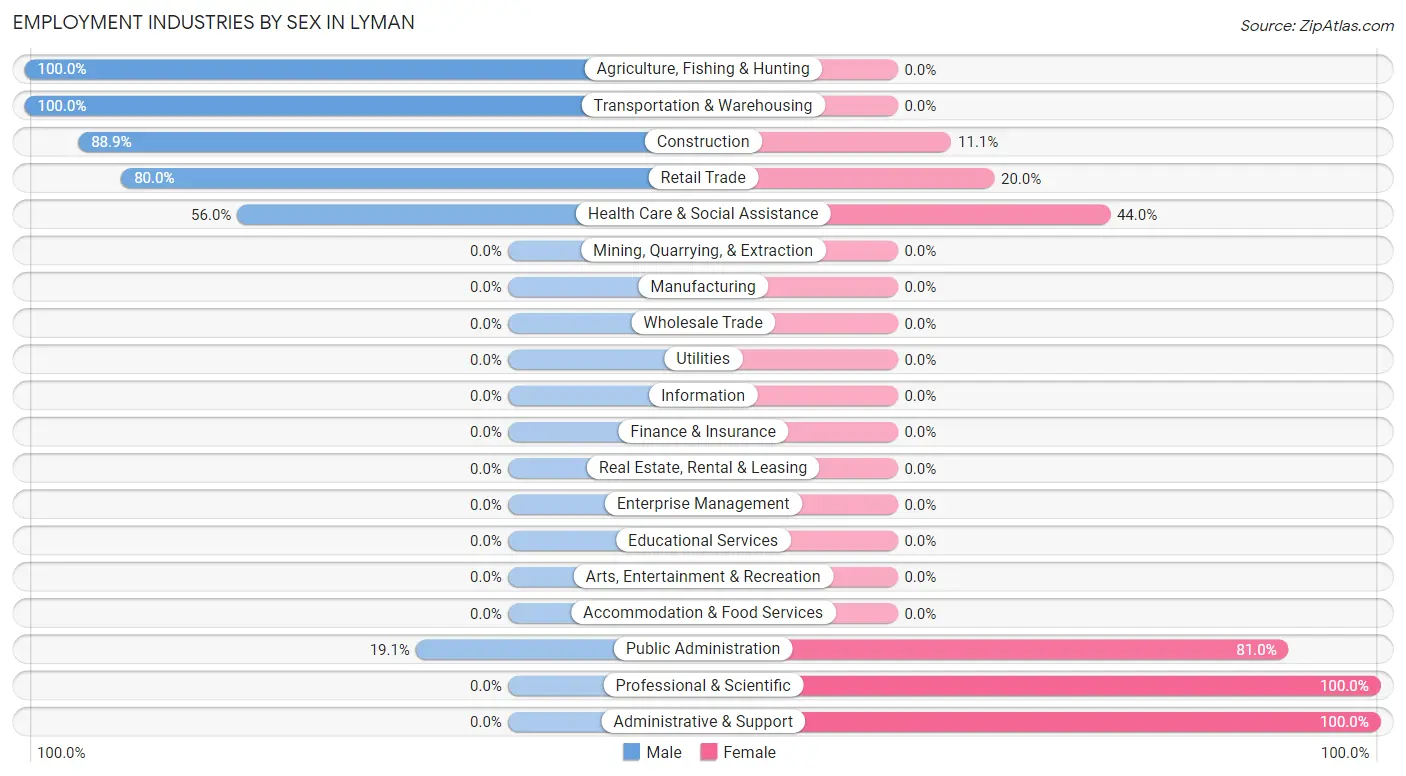
Employment Industries by Sex in Lyman
The Lyman industries that see more men than women are Agriculture, Fishing & Hunting (100.0%), Transportation & Warehousing (100.0%), and Construction (88.9%), whereas the industries that tend to have a higher number of women are Professional & Scientific (100.0%), Administrative & Support (100.0%), and Public Administration (80.9%).
| Industry | Male | Female |
| Agriculture, Fishing & Hunting | 1 (100.0%) | 0 (0.0%) |
| Mining, Quarrying, & Extraction | 0 (0.0%) | 0 (0.0%) |
| Construction | 16 (88.9%) | 2 (11.1%) |
| Manufacturing | 0 (0.0%) | 0 (0.0%) |
| Wholesale Trade | 0 (0.0%) | 0 (0.0%) |
| Retail Trade | 16 (80.0%) | 4 (20.0%) |
| Transportation & Warehousing | 4 (100.0%) | 0 (0.0%) |
| Utilities | 0 (0.0%) | 0 (0.0%) |
| Information | 0 (0.0%) | 0 (0.0%) |
| Finance & Insurance | 0 (0.0%) | 0 (0.0%) |
| Real Estate, Rental & Leasing | 0 (0.0%) | 0 (0.0%) |
| Professional & Scientific | 0 (0.0%) | 3 (100.0%) |
| Enterprise Management | 0 (0.0%) | 0 (0.0%) |
| Administrative & Support | 0 (0.0%) | 2 (100.0%) |
| Educational Services | 0 (0.0%) | 0 (0.0%) |
| Health Care & Social Assistance | 14 (56.0%) | 11 (44.0%) |
| Arts, Entertainment & Recreation | 0 (0.0%) | 0 (0.0%) |
| Accommodation & Food Services | 0 (0.0%) | 0 (0.0%) |
| Public Administration | 4 (19.1%) | 17 (80.9%) |
| Total | 57 (56.4%) | 44 (43.6%) |
Education in Lyman
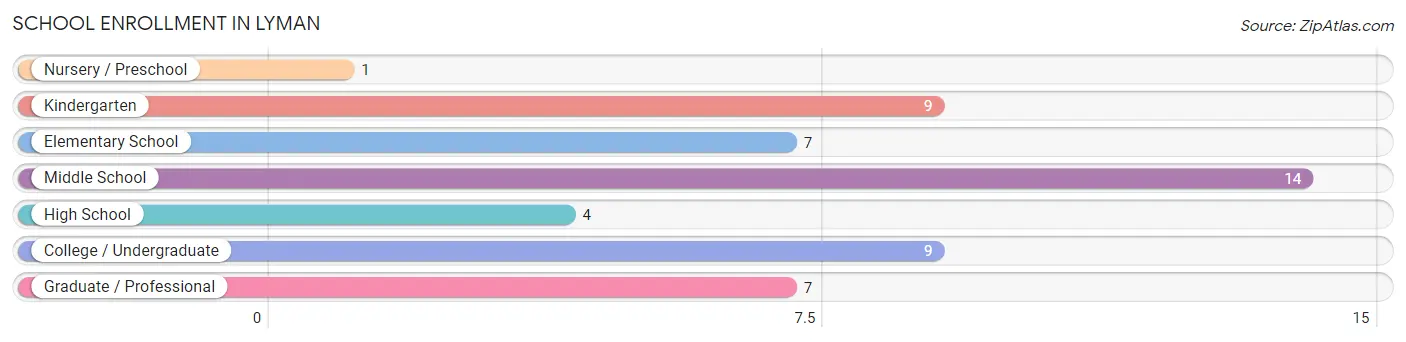
School Enrollment in Lyman
The most common levels of schooling among the 51 students in Lyman are middle school (14 | 27.5%), kindergarten (9 | 17.6%), and college / undergraduate (9 | 17.6%).
| School Level | # Students | % Students |
| Nursery / Preschool | 1 | 2.0% |
| Kindergarten | 9 | 17.6% |
| Elementary School | 7 | 13.7% |
| Middle School | 14 | 27.5% |
| High School | 4 | 7.8% |
| College / Undergraduate | 9 | 17.6% |
| Graduate / Professional | 7 | 13.7% |
| Total | 51 | 100.0% |
School Enrollment by Age by Funding Source in Lyman
Out of a total of 51 students who are enrolled in schools in Lyman, 4 (7.8%) attend a private institution, while the remaining 47 (92.2%) are enrolled in public schools. The age group of 35 years and over has the highest likelihood of being enrolled in private schools, with 4 (36.4% in the age bracket) enrolled. Conversely, the age group of 5 to 9 year old has the lowest likelihood of being enrolled in a private school, with 17 (100.0% in the age bracket) attending a public institution.
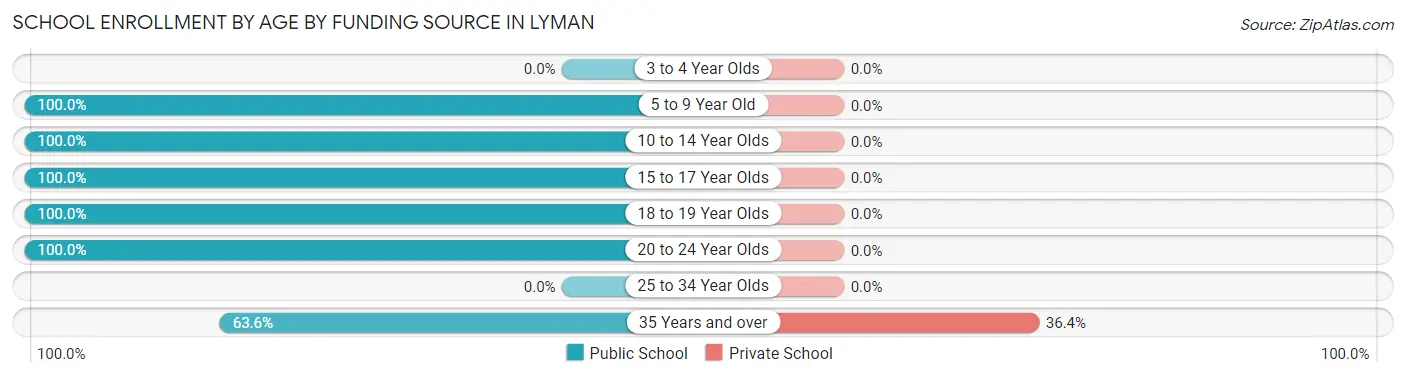
| Age Bracket | Public School | Private School |
| 3 to 4 Year Olds | 0 (0.0%) | 0 (0.0%) |
| 5 to 9 Year Old | 17 (100.0%) | 0 (0.0%) |
| 10 to 14 Year Olds | 14 (100.0%) | 0 (0.0%) |
| 15 to 17 Year Olds | 4 (100.0%) | 0 (0.0%) |
| 18 to 19 Year Olds | 4 (100.0%) | 0 (0.0%) |
| 20 to 24 Year Olds | 1 (100.0%) | 0 (0.0%) |
| 25 to 34 Year Olds | 0 (0.0%) | 0 (0.0%) |
| 35 Years and over | 7 (63.6%) | 4 (36.4%) |
| Total | 47 (92.2%) | 4 (7.8%) |
Educational Attainment by Field of Study in Lyman
Science & technology (16 | 44.4%), education (14 | 38.9%), communications (3 | 8.3%), bio, nature & agricultural (2 | 5.6%), and business (1 | 2.8%) are the most common fields of study among 36 individuals in Lyman who have obtained a bachelor's degree or higher.
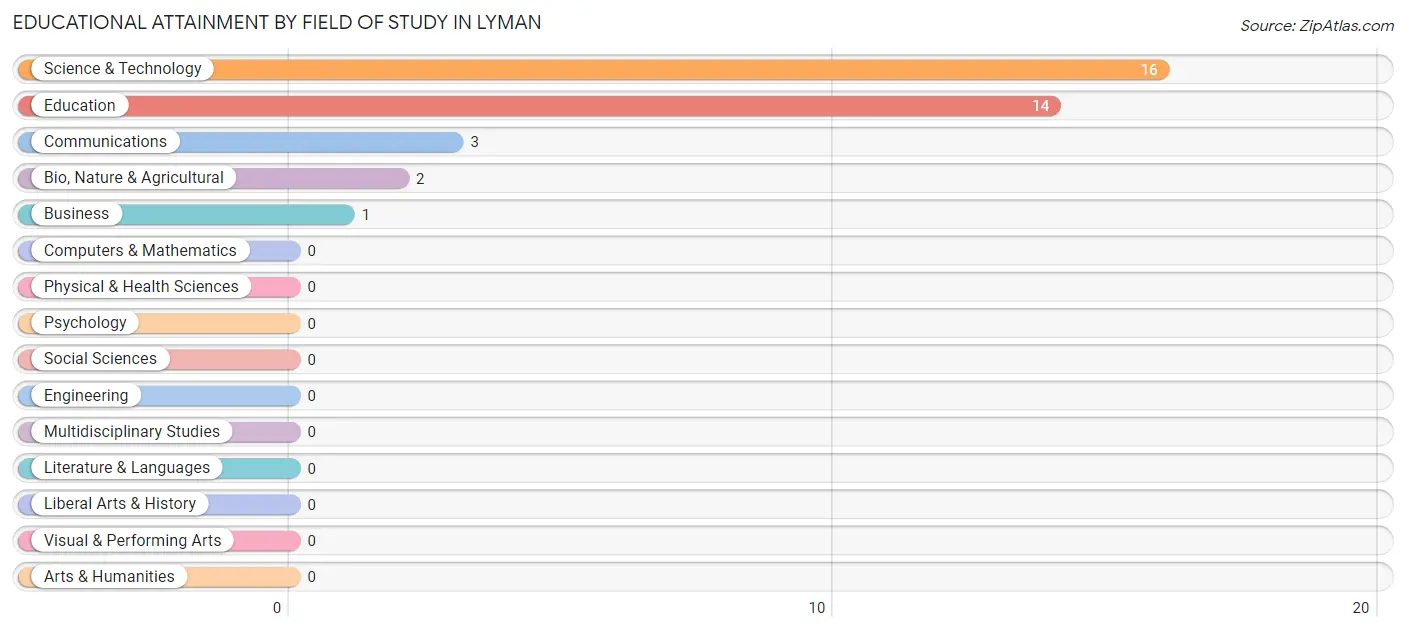
| Field of Study | # Graduates | % Graduates |
| Computers & Mathematics | 0 | 0.0% |
| Bio, Nature & Agricultural | 2 | 5.6% |
| Physical & Health Sciences | 0 | 0.0% |
| Psychology | 0 | 0.0% |
| Social Sciences | 0 | 0.0% |
| Engineering | 0 | 0.0% |
| Multidisciplinary Studies | 0 | 0.0% |
| Science & Technology | 16 | 44.4% |
| Business | 1 | 2.8% |
| Education | 14 | 38.9% |
| Literature & Languages | 0 | 0.0% |
| Liberal Arts & History | 0 | 0.0% |
| Visual & Performing Arts | 0 | 0.0% |
| Communications | 3 | 8.3% |
| Arts & Humanities | 0 | 0.0% |
| Total | 36 | 100.0% |
Transportation & Commute in Lyman
Vehicle Availability by Sex in Lyman
The most prevalent vehicle ownership categories in Lyman are males with 3 vehicles (21, accounting for 41.2%) and females with 3 vehicles (4, making up 47.7%).
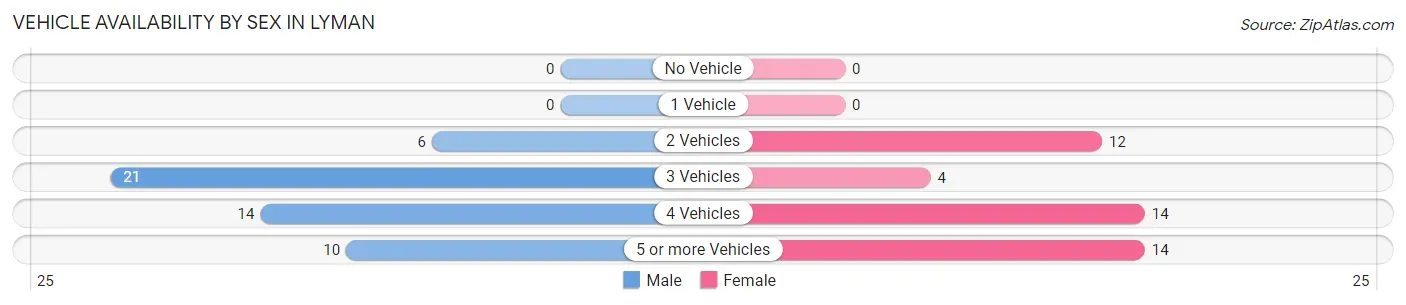
| Vehicles Available | Male | Female |
| No Vehicle | 0 (0.0%) | 0 (0.0%) |
| 1 Vehicle | 0 (0.0%) | 0 (0.0%) |
| 2 Vehicles | 6 (11.8%) | 12 (27.3%) |
| 3 Vehicles | 21 (41.2%) | 4 (9.1%) |
| 4 Vehicles | 14 (27.5%) | 14 (31.8%) |
| 5 or more Vehicles | 10 (19.6%) | 14 (31.8%) |
| Total | 51 (100.0%) | 44 (100.0%) |
Commute Time in Lyman
The most frequently occuring commute durations in Lyman are 30 to 34 minutes (29 commuters, 30.5%), 5 to 9 minutes (21 commuters, 22.1%), and 10 to 14 minutes (19 commuters, 20.0%).
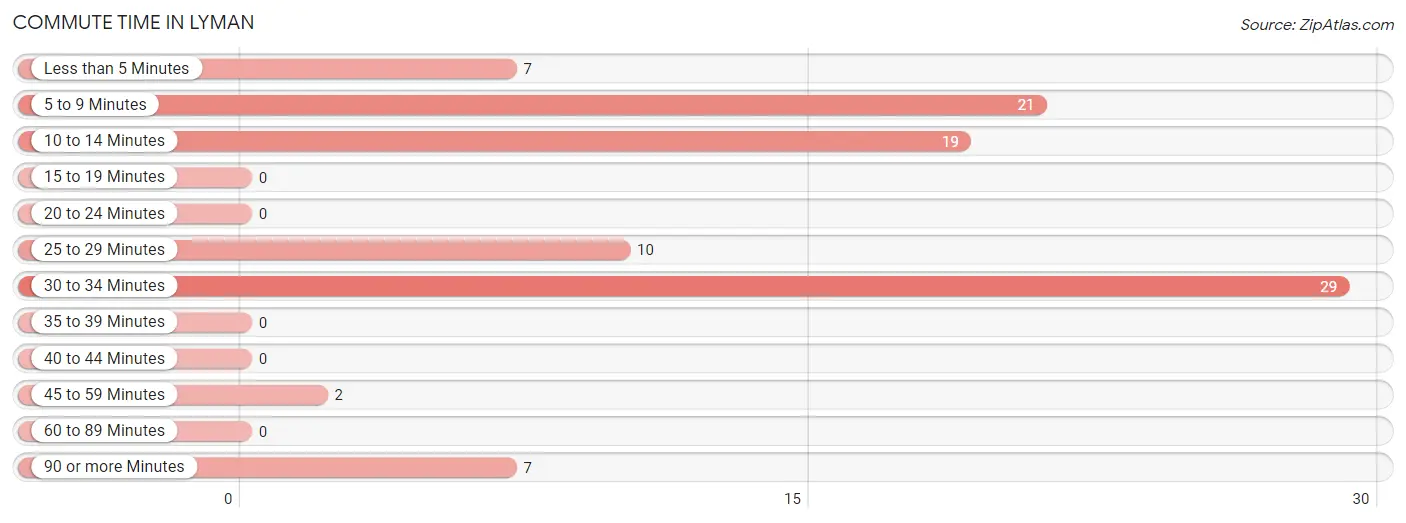
| Commute Time | # Commuters | % Commuters |
| Less than 5 Minutes | 7 | 7.4% |
| 5 to 9 Minutes | 21 | 22.1% |
| 10 to 14 Minutes | 19 | 20.0% |
| 15 to 19 Minutes | 0 | 0.0% |
| 20 to 24 Minutes | 0 | 0.0% |
| 25 to 29 Minutes | 10 | 10.5% |
| 30 to 34 Minutes | 29 | 30.5% |
| 35 to 39 Minutes | 0 | 0.0% |
| 40 to 44 Minutes | 0 | 0.0% |
| 45 to 59 Minutes | 2 | 2.1% |
| 60 to 89 Minutes | 0 | 0.0% |
| 90 or more Minutes | 7 | 7.4% |
Commute Time by Sex in Lyman
The most common commute times in Lyman are 10 to 14 minutes (19 commuters, 35.2%) for males and 5 to 9 minutes (10 commuters, 24.4%) for females.
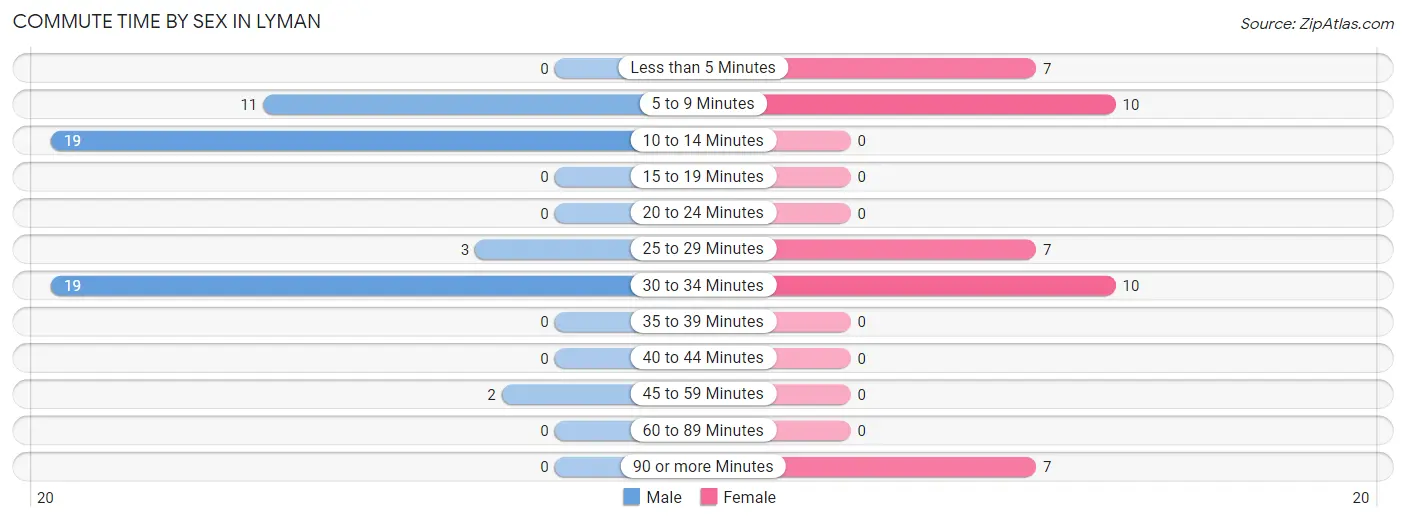
| Commute Time | Male | Female |
| Less than 5 Minutes | 0 (0.0%) | 7 (17.1%) |
| 5 to 9 Minutes | 11 (20.4%) | 10 (24.4%) |
| 10 to 14 Minutes | 19 (35.2%) | 0 (0.0%) |
| 15 to 19 Minutes | 0 (0.0%) | 0 (0.0%) |
| 20 to 24 Minutes | 0 (0.0%) | 0 (0.0%) |
| 25 to 29 Minutes | 3 (5.6%) | 7 (17.1%) |
| 30 to 34 Minutes | 19 (35.2%) | 10 (24.4%) |
| 35 to 39 Minutes | 0 (0.0%) | 0 (0.0%) |
| 40 to 44 Minutes | 0 (0.0%) | 0 (0.0%) |
| 45 to 59 Minutes | 2 (3.7%) | 0 (0.0%) |
| 60 to 89 Minutes | 0 (0.0%) | 0 (0.0%) |
| 90 or more Minutes | 0 (0.0%) | 7 (17.1%) |
Time of Departure to Work by Sex in Lyman
The most frequent times of departure to work in Lyman are 7:00 AM to 7:29 AM (23, 42.6%) for males and 8:30 AM to 8:59 AM (12, 29.3%) for females.
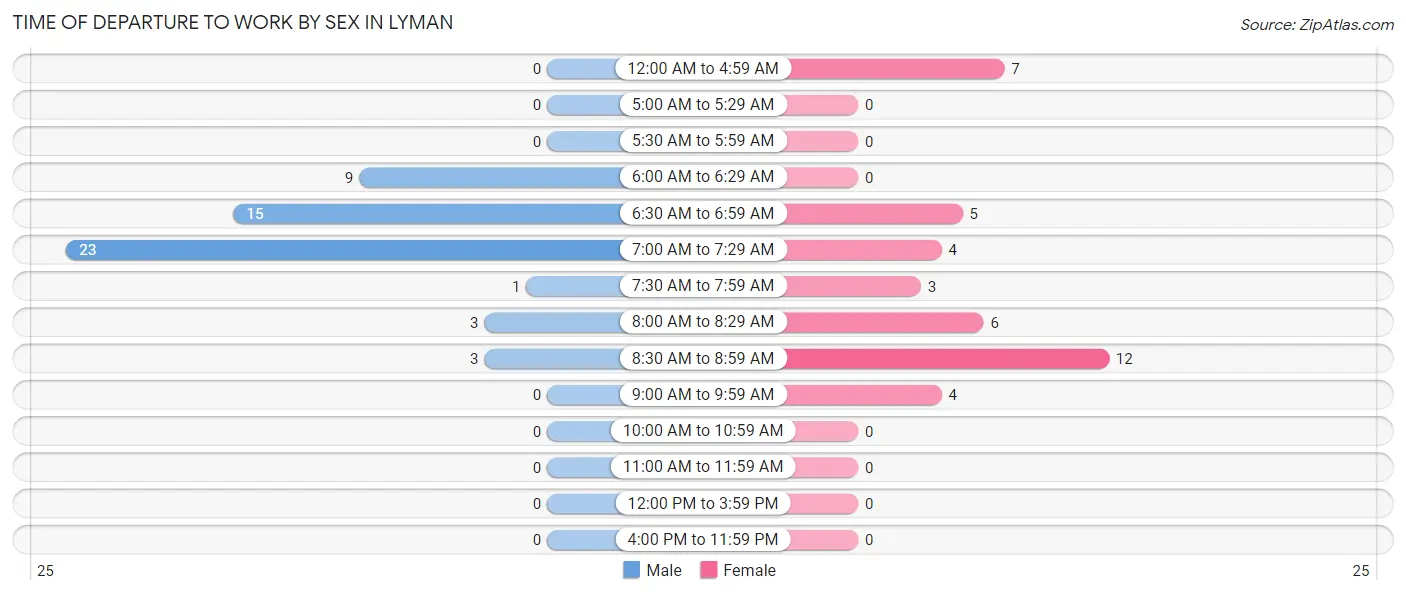
| Time of Departure | Male | Female |
| 12:00 AM to 4:59 AM | 0 (0.0%) | 7 (17.1%) |
| 5:00 AM to 5:29 AM | 0 (0.0%) | 0 (0.0%) |
| 5:30 AM to 5:59 AM | 0 (0.0%) | 0 (0.0%) |
| 6:00 AM to 6:29 AM | 9 (16.7%) | 0 (0.0%) |
| 6:30 AM to 6:59 AM | 15 (27.8%) | 5 (12.2%) |
| 7:00 AM to 7:29 AM | 23 (42.6%) | 4 (9.8%) |
| 7:30 AM to 7:59 AM | 1 (1.8%) | 3 (7.3%) |
| 8:00 AM to 8:29 AM | 3 (5.6%) | 6 (14.6%) |
| 8:30 AM to 8:59 AM | 3 (5.6%) | 12 (29.3%) |
| 9:00 AM to 9:59 AM | 0 (0.0%) | 4 (9.8%) |
| 10:00 AM to 10:59 AM | 0 (0.0%) | 0 (0.0%) |
| 11:00 AM to 11:59 AM | 0 (0.0%) | 0 (0.0%) |
| 12:00 PM to 3:59 PM | 0 (0.0%) | 0 (0.0%) |
| 4:00 PM to 11:59 PM | 0 (0.0%) | 0 (0.0%) |
| Total | 54 (100.0%) | 41 (100.0%) |
Housing Occupancy in Lyman
Occupancy by Ownership in Lyman
Of the total 72 dwellings in Lyman, owner-occupied units account for 72 (100.0%), while renter-occupied units make up 0 (0.0%).
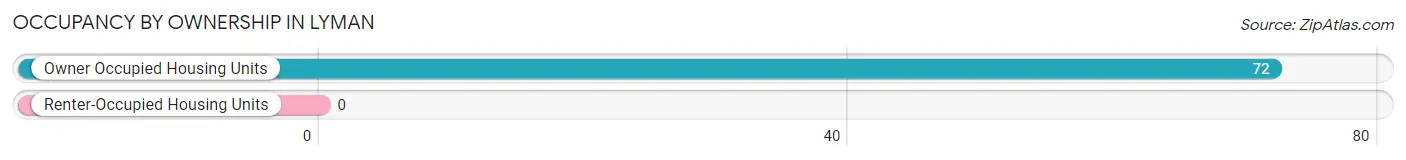
| Occupancy | # Housing Units | % Housing Units |
| Owner Occupied Housing Units | 72 | 100.0% |
| Renter-Occupied Housing Units | 0 | 0.0% |
| Total Occupied Housing Units | 72 | 100.0% |
Occupancy by Household Size in Lyman
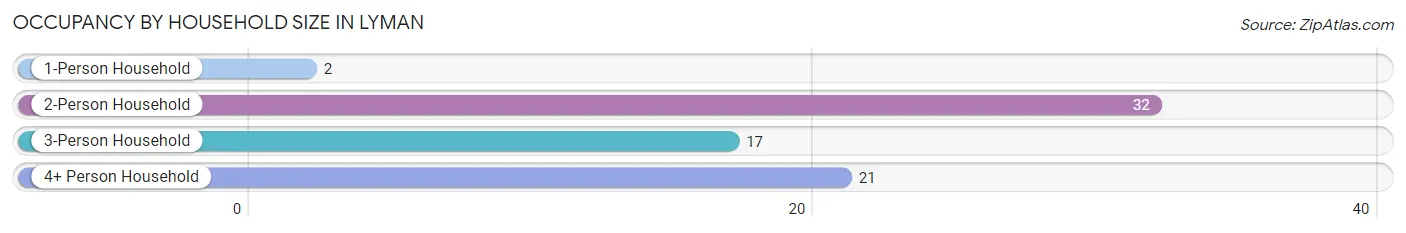
| Household Size | # Housing Units | % Housing Units |
| 1-Person Household | 2 | 2.8% |
| 2-Person Household | 32 | 44.4% |
| 3-Person Household | 17 | 23.6% |
| 4+ Person Household | 21 | 29.2% |
| Total Housing Units | 72 | 100.0% |
Occupancy by Ownership by Household Size in Lyman
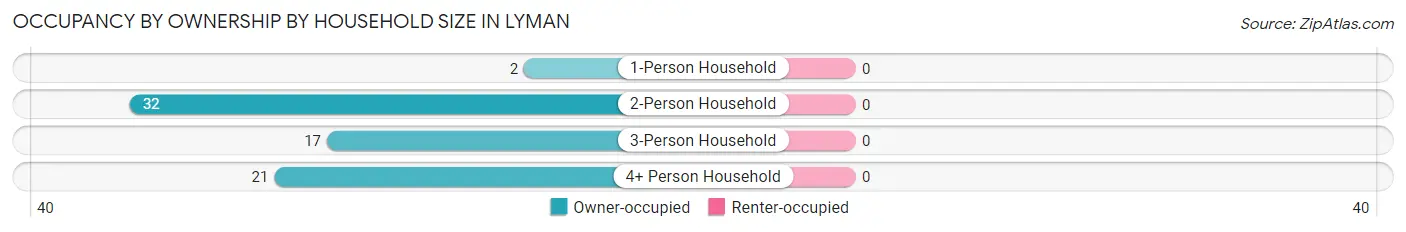
| Household Size | Owner-occupied | Renter-occupied |
| 1-Person Household | 2 (100.0%) | 0 (0.0%) |
| 2-Person Household | 32 (100.0%) | 0 (0.0%) |
| 3-Person Household | 17 (100.0%) | 0 (0.0%) |
| 4+ Person Household | 21 (100.0%) | 0 (0.0%) |
| Total Housing Units | 72 (100.0%) | 0 (0.0%) |
Occupancy by Educational Attainment in Lyman
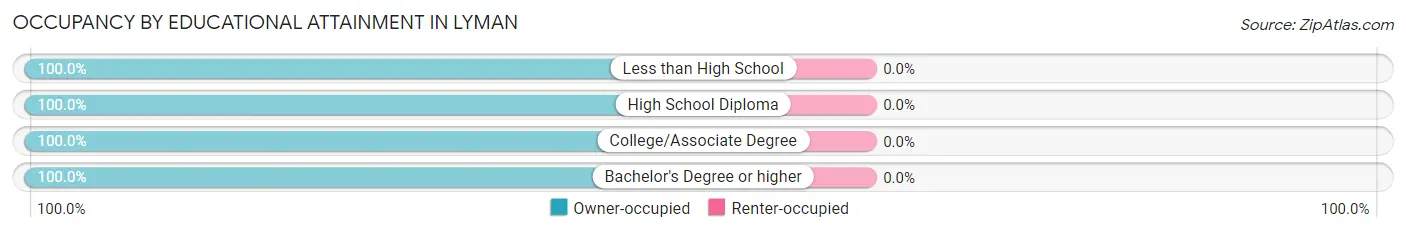
| Household Size | Owner-occupied | Renter-occupied |
| Less than High School | 1 (100.0%) | 0 (0.0%) |
| High School Diploma | 5 (100.0%) | 0 (0.0%) |
| College/Associate Degree | 46 (100.0%) | 0 (0.0%) |
| Bachelor's Degree or higher | 20 (100.0%) | 0 (0.0%) |
Occupancy by Age of Householder in Lyman
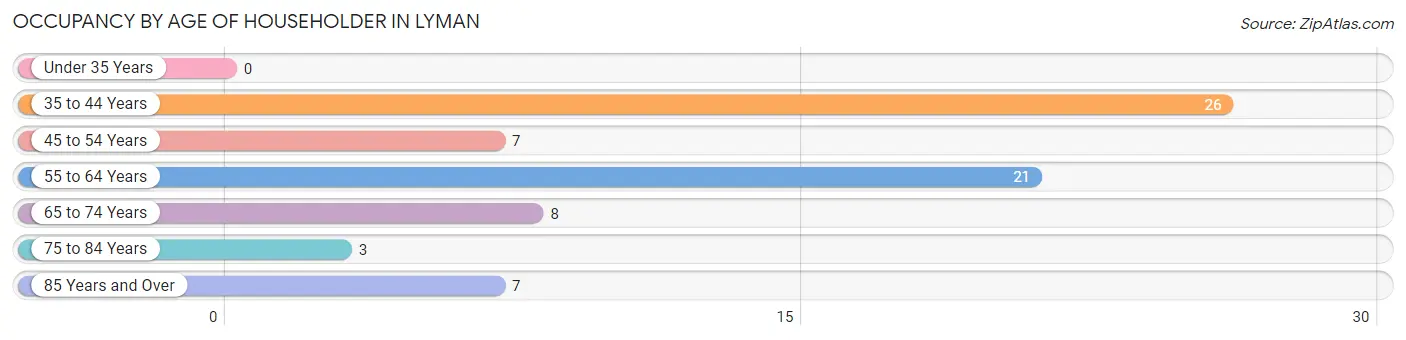
| Age Bracket | # Households | % Households |
| Under 35 Years | 0 | 0.0% |
| 35 to 44 Years | 26 | 36.1% |
| 45 to 54 Years | 7 | 9.7% |
| 55 to 64 Years | 21 | 29.2% |
| 65 to 74 Years | 8 | 11.1% |
| 75 to 84 Years | 3 | 4.2% |
| 85 Years and Over | 7 | 9.7% |
| Total | 72 | 100.0% |
Housing Finances in Lyman
Median Income by Occupancy in Lyman
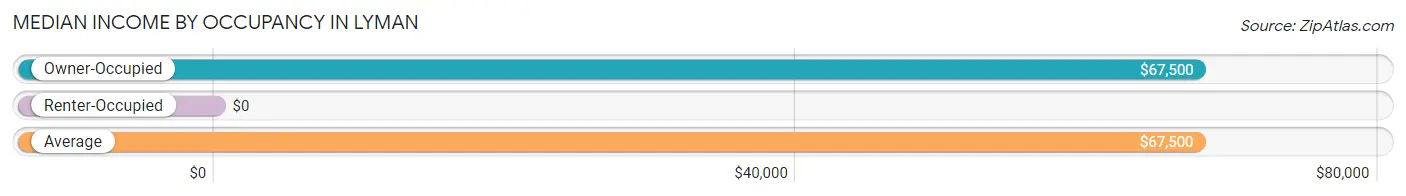
| Occupancy Type | # Households | Median Income |
| Owner-Occupied | 72 (100.0%) | $67,500 |
| Renter-Occupied | 0 (0.0%) | $0 |
| Average | 72 (100.0%) | $67,500 |
Occupancy by Householder Income Bracket in Lyman
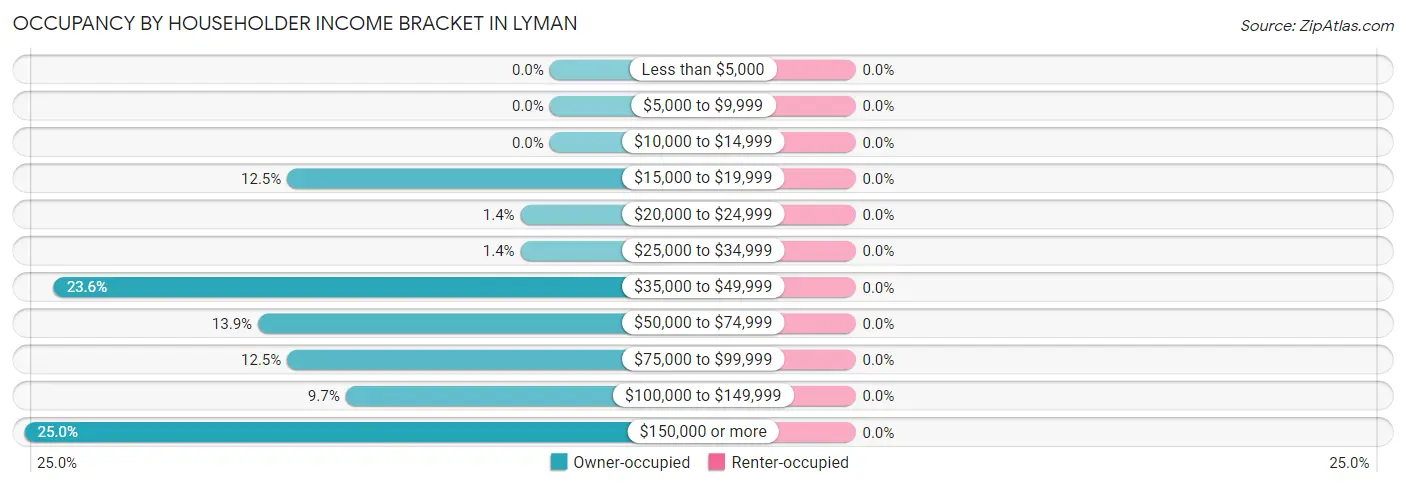
| Income Bracket | Owner-occupied | Renter-occupied |
| Less than $5,000 | 0 (0.0%) | 0 (0.0%) |
| $5,000 to $9,999 | 0 (0.0%) | 0 (0.0%) |
| $10,000 to $14,999 | 0 (0.0%) | 0 (0.0%) |
| $15,000 to $19,999 | 9 (12.5%) | 0 (0.0%) |
| $20,000 to $24,999 | 1 (1.4%) | 0 (0.0%) |
| $25,000 to $34,999 | 1 (1.4%) | 0 (0.0%) |
| $35,000 to $49,999 | 17 (23.6%) | 0 (0.0%) |
| $50,000 to $74,999 | 10 (13.9%) | 0 (0.0%) |
| $75,000 to $99,999 | 9 (12.5%) | 0 (0.0%) |
| $100,000 to $149,999 | 7 (9.7%) | 0 (0.0%) |
| $150,000 or more | 18 (25.0%) | 0 (0.0%) |
| Total | 72 (100.0%) | 0 (0.0%) |
Monthly Housing Cost Tiers in Lyman
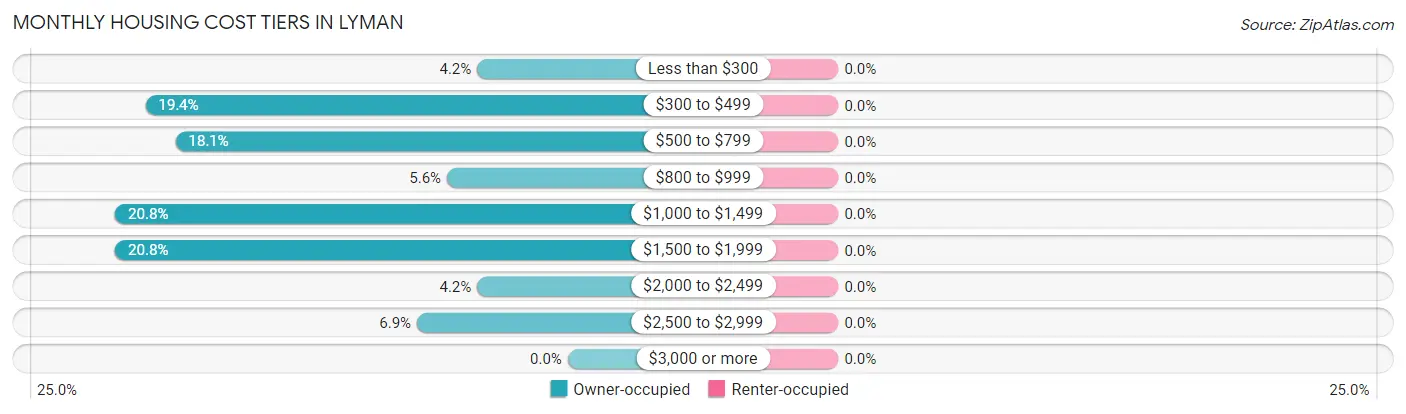
| Monthly Cost | Owner-occupied | Renter-occupied |
| Less than $300 | 3 (4.2%) | 0 (0.0%) |
| $300 to $499 | 14 (19.4%) | 0 (0.0%) |
| $500 to $799 | 13 (18.1%) | 0 (0.0%) |
| $800 to $999 | 4 (5.6%) | 0 (0.0%) |
| $1,000 to $1,499 | 15 (20.8%) | 0 (0.0%) |
| $1,500 to $1,999 | 15 (20.8%) | 0 (0.0%) |
| $2,000 to $2,499 | 3 (4.2%) | 0 (0.0%) |
| $2,500 to $2,999 | 5 (6.9%) | 0 (0.0%) |
| $3,000 or more | 0 (0.0%) | 0 (0.0%) |
| Total | 72 (100.0%) | 0 (0.0%) |
Physical Housing Characteristics in Lyman
Housing Structures in Lyman
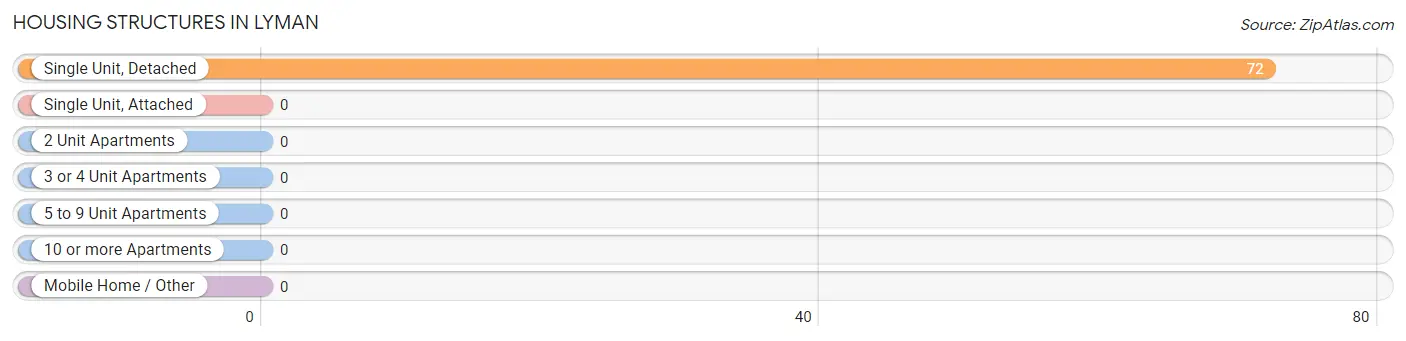
| Structure Type | # Housing Units | % Housing Units |
| Single Unit, Detached | 72 | 100.0% |
| Single Unit, Attached | 0 | 0.0% |
| 2 Unit Apartments | 0 | 0.0% |
| 3 or 4 Unit Apartments | 0 | 0.0% |
| 5 to 9 Unit Apartments | 0 | 0.0% |
| 10 or more Apartments | 0 | 0.0% |
| Mobile Home / Other | 0 | 0.0% |
| Total | 72 | 100.0% |
Housing Structures by Occupancy in Lyman
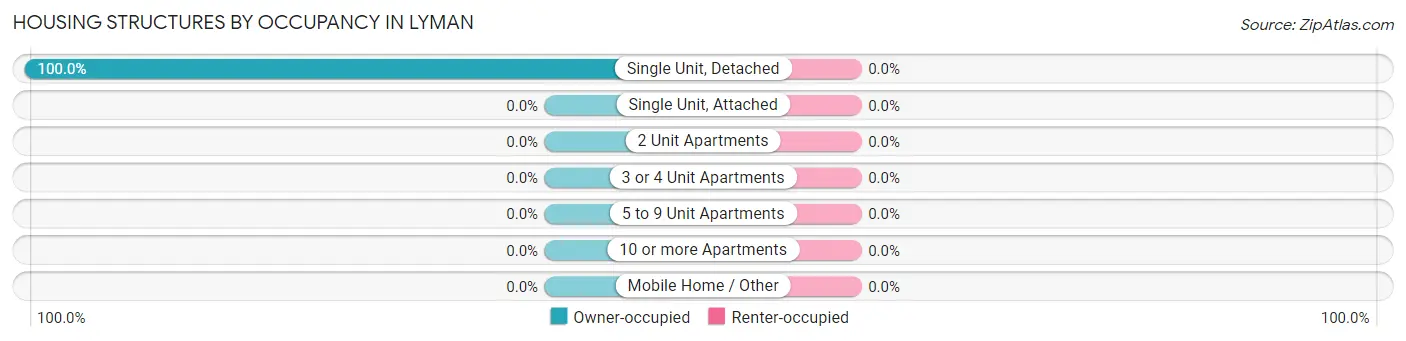
| Structure Type | Owner-occupied | Renter-occupied |
| Single Unit, Detached | 72 (100.0%) | 0 (0.0%) |
| Single Unit, Attached | 0 (0.0%) | 0 (0.0%) |
| 2 Unit Apartments | 0 (0.0%) | 0 (0.0%) |
| 3 or 4 Unit Apartments | 0 (0.0%) | 0 (0.0%) |
| 5 to 9 Unit Apartments | 0 (0.0%) | 0 (0.0%) |
| 10 or more Apartments | 0 (0.0%) | 0 (0.0%) |
| Mobile Home / Other | 0 (0.0%) | 0 (0.0%) |
| Total | 72 (100.0%) | 0 (0.0%) |
Housing Structures by Number of Rooms in Lyman
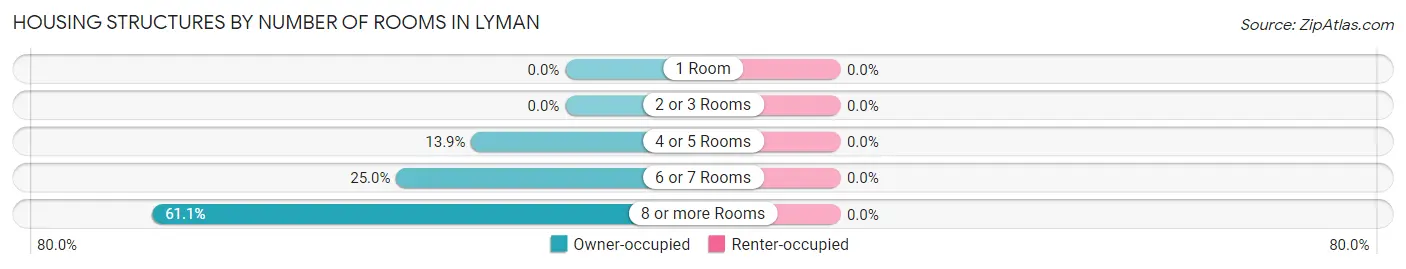
| Number of Rooms | Owner-occupied | Renter-occupied |
| 1 Room | 0 (0.0%) | 0 (0.0%) |
| 2 or 3 Rooms | 0 (0.0%) | 0 (0.0%) |
| 4 or 5 Rooms | 10 (13.9%) | 0 (0.0%) |
| 6 or 7 Rooms | 18 (25.0%) | 0 (0.0%) |
| 8 or more Rooms | 44 (61.1%) | 0 (0.0%) |
| Total | 72 (100.0%) | 0 (0.0%) |
Housing Structure by Heating Type in Lyman
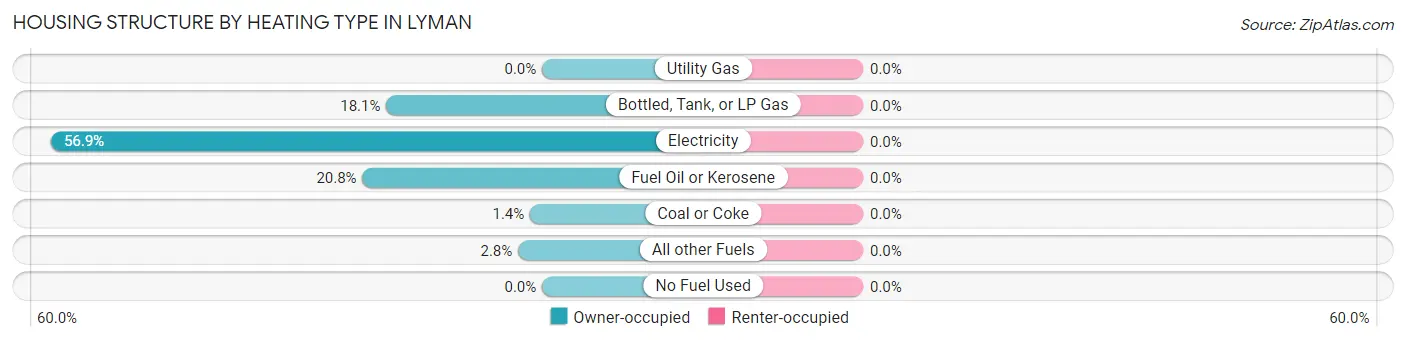
| Heating Type | Owner-occupied | Renter-occupied |
| Utility Gas | 0 (0.0%) | 0 (0.0%) |
| Bottled, Tank, or LP Gas | 13 (18.1%) | 0 (0.0%) |
| Electricity | 41 (56.9%) | 0 (0.0%) |
| Fuel Oil or Kerosene | 15 (20.8%) | 0 (0.0%) |
| Coal or Coke | 1 (1.4%) | 0 (0.0%) |
| All other Fuels | 2 (2.8%) | 0 (0.0%) |
| No Fuel Used | 0 (0.0%) | 0 (0.0%) |
| Total | 72 (100.0%) | 0 (0.0%) |
Household Vehicle Usage in Lyman
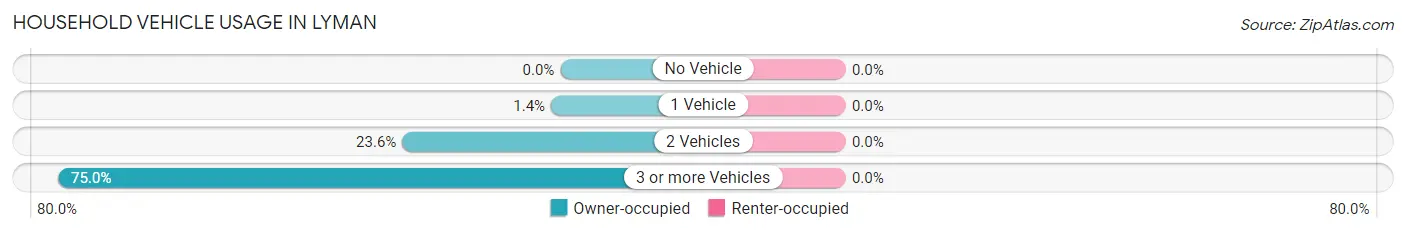
| Vehicles per Household | Owner-occupied | Renter-occupied |
| No Vehicle | 0 (0.0%) | 0 (0.0%) |
| 1 Vehicle | 1 (1.4%) | 0 (0.0%) |
| 2 Vehicles | 17 (23.6%) | 0 (0.0%) |
| 3 or more Vehicles | 54 (75.0%) | 0 (0.0%) |
| Total | 72 (100.0%) | 0 (0.0%) |
Real Estate & Mortgages in Lyman
Real Estate and Mortgage Overview in Lyman
| Characteristic | Without Mortgage | With Mortgage |
| Housing Units | 30 | 42 |
| Median Property Value | $383,300 | $284,200 |
| Median Household Income | - | - |
| Monthly Housing Costs | $482 | $0 |
| Real Estate Taxes | $1,600 | $0 |
Property Value by Mortgage Status in Lyman
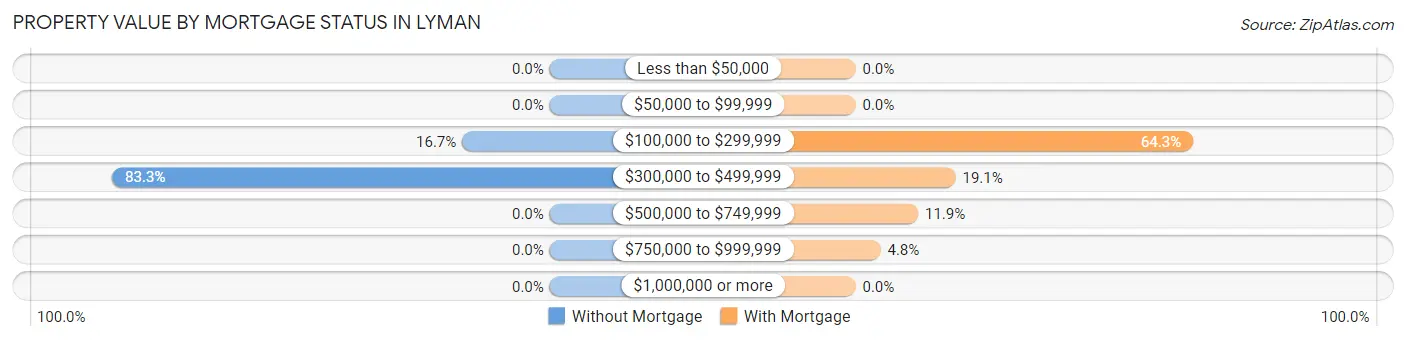
| Property Value | Without Mortgage | With Mortgage |
| Less than $50,000 | 0 (0.0%) | 0 (0.0%) |
| $50,000 to $99,999 | 0 (0.0%) | 0 (0.0%) |
| $100,000 to $299,999 | 5 (16.7%) | 27 (64.3%) |
| $300,000 to $499,999 | 25 (83.3%) | 8 (19.1%) |
| $500,000 to $749,999 | 0 (0.0%) | 5 (11.9%) |
| $750,000 to $999,999 | 0 (0.0%) | 2 (4.8%) |
| $1,000,000 or more | 0 (0.0%) | 0 (0.0%) |
| Total | 30 (100.0%) | 42 (100.0%) |
Household Income by Mortgage Status in Lyman
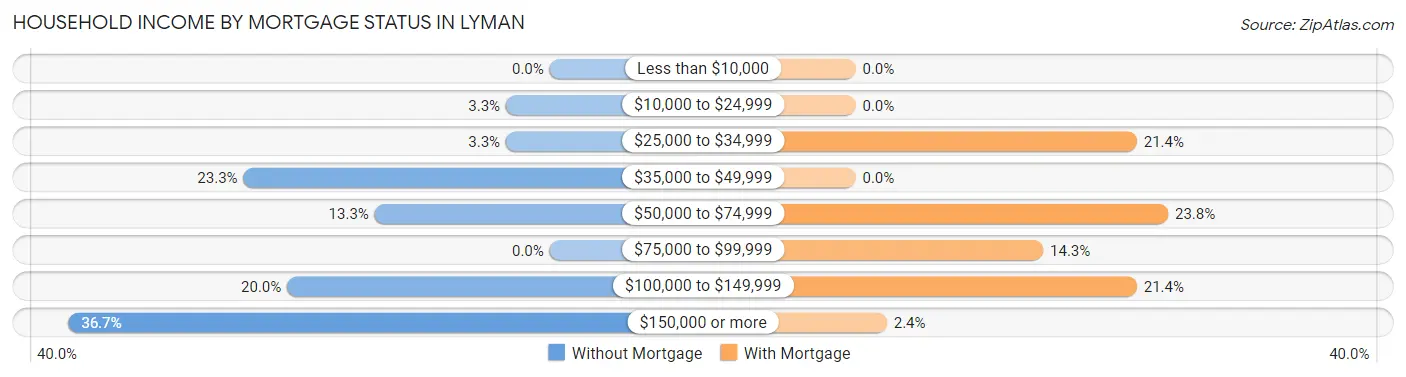
| Household Income | Without Mortgage | With Mortgage |
| Less than $10,000 | 0 (0.0%) | 0 (0.0%) |
| $10,000 to $24,999 | 1 (3.3%) | 0 (0.0%) |
| $25,000 to $34,999 | 1 (3.3%) | 9 (21.4%) |
| $35,000 to $49,999 | 7 (23.3%) | 0 (0.0%) |
| $50,000 to $74,999 | 4 (13.3%) | 10 (23.8%) |
| $75,000 to $99,999 | 0 (0.0%) | 6 (14.3%) |
| $100,000 to $149,999 | 6 (20.0%) | 9 (21.4%) |
| $150,000 or more | 11 (36.7%) | 1 (2.4%) |
| Total | 30 (100.0%) | 42 (100.0%) |
Property Value to Household Income Ratio in Lyman
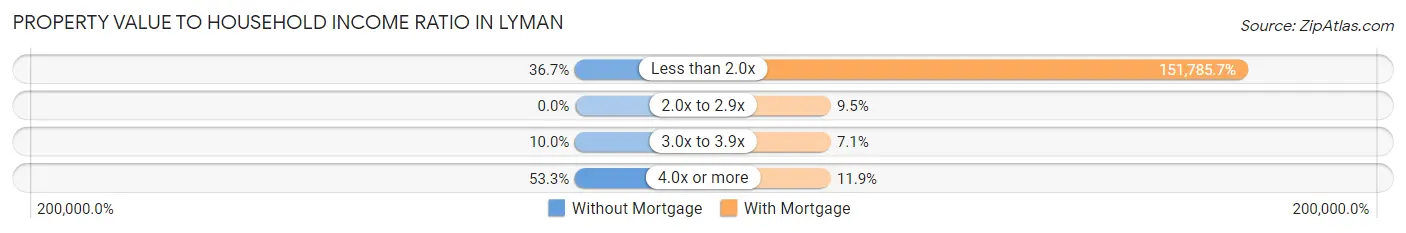
| Value-to-Income Ratio | Without Mortgage | With Mortgage |
| Less than 2.0x | 11 (36.7%) | 63,750 (151,785.7%) |
| 2.0x to 2.9x | 0 (0.0%) | 4 (9.5%) |
| 3.0x to 3.9x | 3 (10.0%) | 3 (7.1%) |
| 4.0x or more | 16 (53.3%) | 5 (11.9%) |
| Total | 30 (100.0%) | 42 (100.0%) |
Real Estate Taxes by Mortgage Status in Lyman
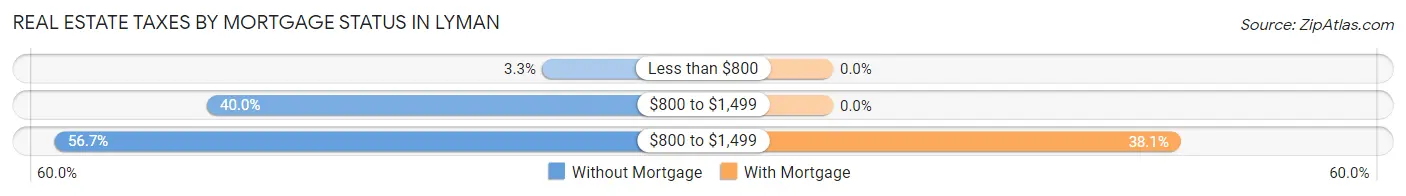
| Property Taxes | Without Mortgage | With Mortgage |
| Less than $800 | 1 (3.3%) | 0 (0.0%) |
| $800 to $1,499 | 12 (40.0%) | 0 (0.0%) |
| $800 to $1,499 | 17 (56.7%) | 16 (38.1%) |
| Total | 30 (100.0%) | 42 (100.0%) |
Health & Disability in Lyman
Health Insurance Coverage by Age in Lyman
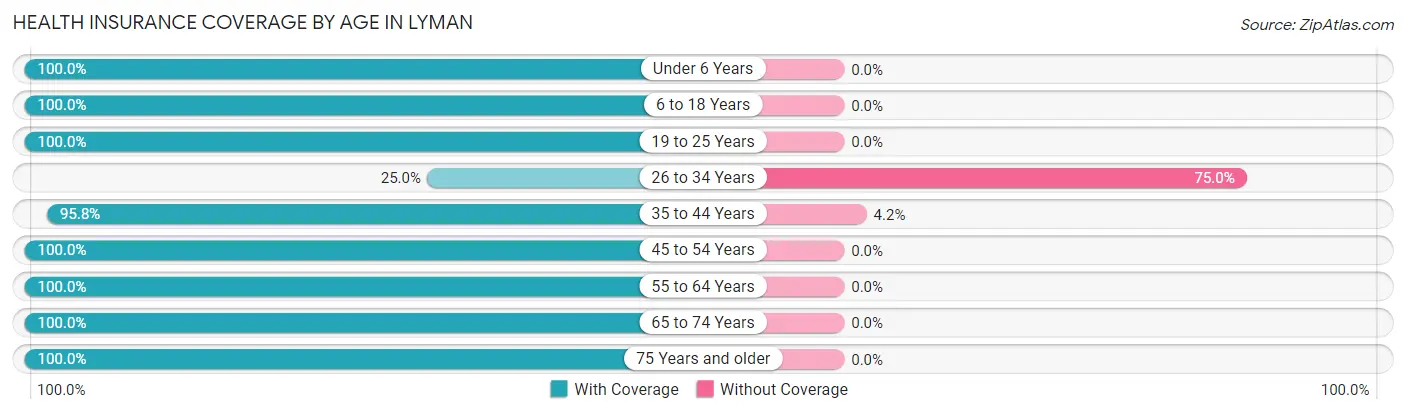
| Age Bracket | With Coverage | Without Coverage |
| Under 6 Years | 12 (100.0%) | 0 (0.0%) |
| 6 to 18 Years | 32 (100.0%) | 0 (0.0%) |
| 19 to 25 Years | 4 (100.0%) | 0 (0.0%) |
| 26 to 34 Years | 2 (25.0%) | 6 (75.0%) |
| 35 to 44 Years | 46 (95.8%) | 2 (4.2%) |
| 45 to 54 Years | 28 (100.0%) | 0 (0.0%) |
| 55 to 64 Years | 31 (100.0%) | 0 (0.0%) |
| 65 to 74 Years | 12 (100.0%) | 0 (0.0%) |
| 75 Years and older | 25 (100.0%) | 0 (0.0%) |
| Total | 192 (96.0%) | 8 (4.0%) |
Health Insurance Coverage by Citizenship Status in Lyman
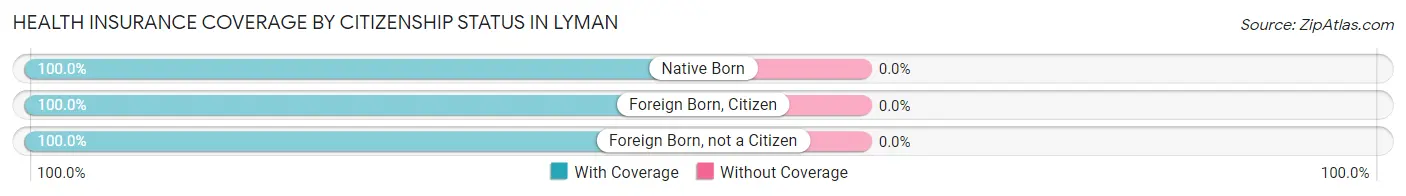
| Citizenship Status | With Coverage | Without Coverage |
| Native Born | 12 (100.0%) | 0 (0.0%) |
| Foreign Born, Citizen | 32 (100.0%) | 0 (0.0%) |
| Foreign Born, not a Citizen | 4 (100.0%) | 0 (0.0%) |
Health Insurance Coverage by Household Income in Lyman
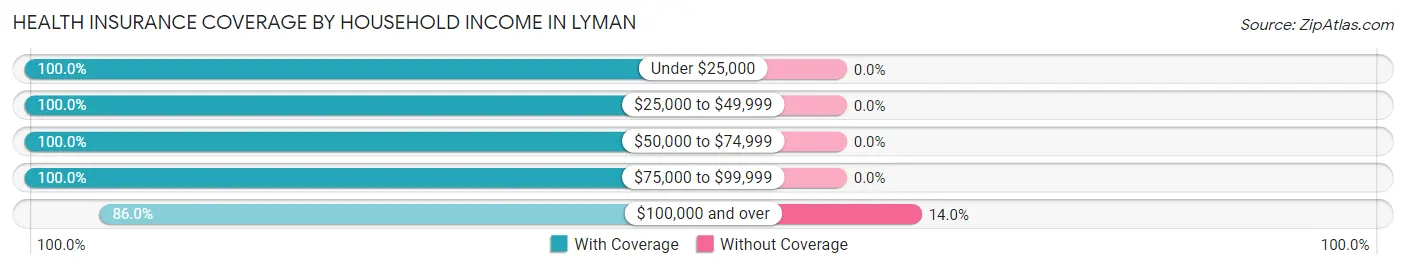
| Household Income | With Coverage | Without Coverage |
| Under $25,000 | 18 (100.0%) | 0 (0.0%) |
| $25,000 to $49,999 | 60 (100.0%) | 0 (0.0%) |
| $50,000 to $74,999 | 30 (100.0%) | 0 (0.0%) |
| $75,000 to $99,999 | 25 (100.0%) | 0 (0.0%) |
| $100,000 and over | 49 (86.0%) | 8 (14.0%) |
Public vs Private Health Insurance Coverage by Age in Lyman
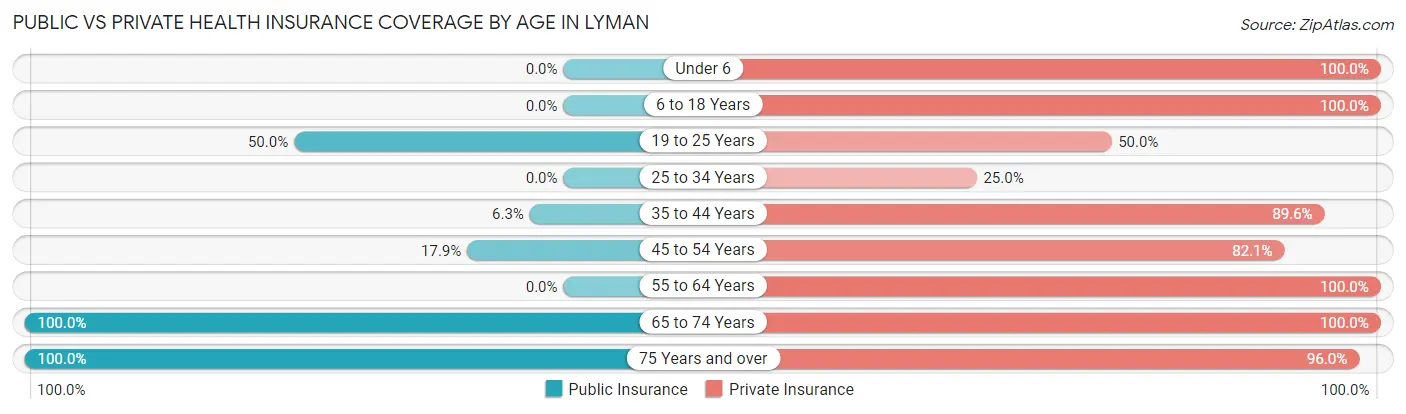
| Age Bracket | Public Insurance | Private Insurance |
| Under 6 | 0 (0.0%) | 12 (100.0%) |
| 6 to 18 Years | 0 (0.0%) | 32 (100.0%) |
| 19 to 25 Years | 2 (50.0%) | 2 (50.0%) |
| 25 to 34 Years | 0 (0.0%) | 2 (25.0%) |
| 35 to 44 Years | 3 (6.2%) | 43 (89.6%) |
| 45 to 54 Years | 5 (17.9%) | 23 (82.1%) |
| 55 to 64 Years | 0 (0.0%) | 31 (100.0%) |
| 65 to 74 Years | 12 (100.0%) | 12 (100.0%) |
| 75 Years and over | 25 (100.0%) | 24 (96.0%) |
| Total | 47 (23.5%) | 181 (90.5%) |
Disability Status by Sex by Age in Lyman
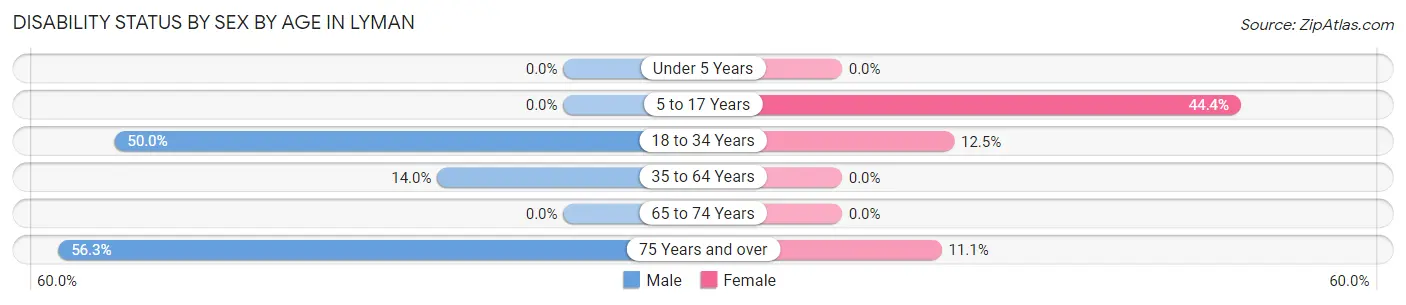
| Age Bracket | Male | Female |
| Under 5 Years | 0 (0.0%) | 0 (0.0%) |
| 5 to 17 Years | 0 (0.0%) | 12 (44.4%) |
| 18 to 34 Years | 4 (50.0%) | 1 (12.5%) |
| 35 to 64 Years | 8 (14.0%) | 0 (0.0%) |
| 65 to 74 Years | 0 (0.0%) | 0 (0.0%) |
| 75 Years and over | 9 (56.2%) | 1 (11.1%) |
Disability Class by Sex by Age in Lyman
Disability Class: Hearing Difficulty
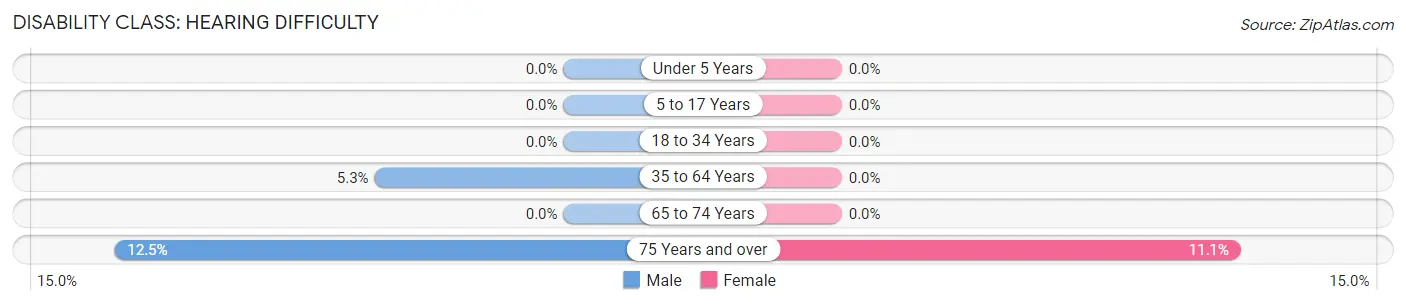
| Age Bracket | Male | Female |
| Under 5 Years | 0 (0.0%) | 0 (0.0%) |
| 5 to 17 Years | 0 (0.0%) | 0 (0.0%) |
| 18 to 34 Years | 0 (0.0%) | 0 (0.0%) |
| 35 to 64 Years | 3 (5.3%) | 0 (0.0%) |
| 65 to 74 Years | 0 (0.0%) | 0 (0.0%) |
| 75 Years and over | 2 (12.5%) | 1 (11.1%) |
Disability Class: Vision Difficulty
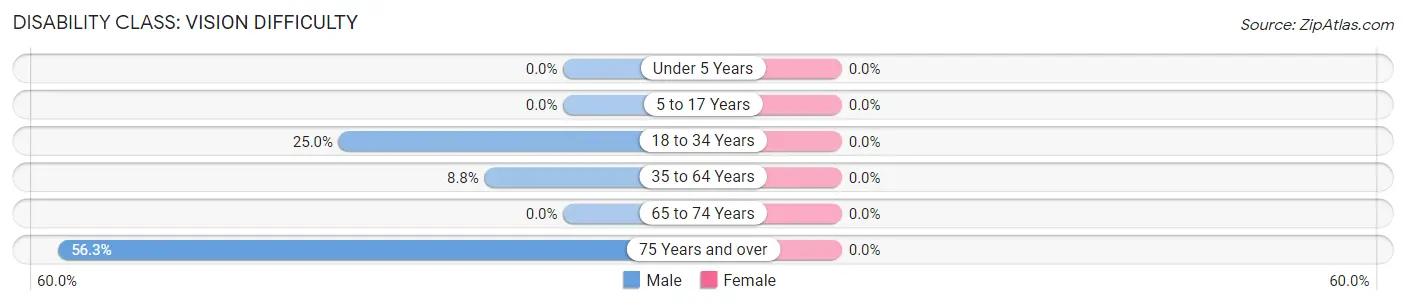
| Age Bracket | Male | Female |
| Under 5 Years | 0 (0.0%) | 0 (0.0%) |
| 5 to 17 Years | 0 (0.0%) | 0 (0.0%) |
| 18 to 34 Years | 2 (25.0%) | 0 (0.0%) |
| 35 to 64 Years | 5 (8.8%) | 0 (0.0%) |
| 65 to 74 Years | 0 (0.0%) | 0 (0.0%) |
| 75 Years and over | 9 (56.2%) | 0 (0.0%) |
Disability Class: Cognitive Difficulty
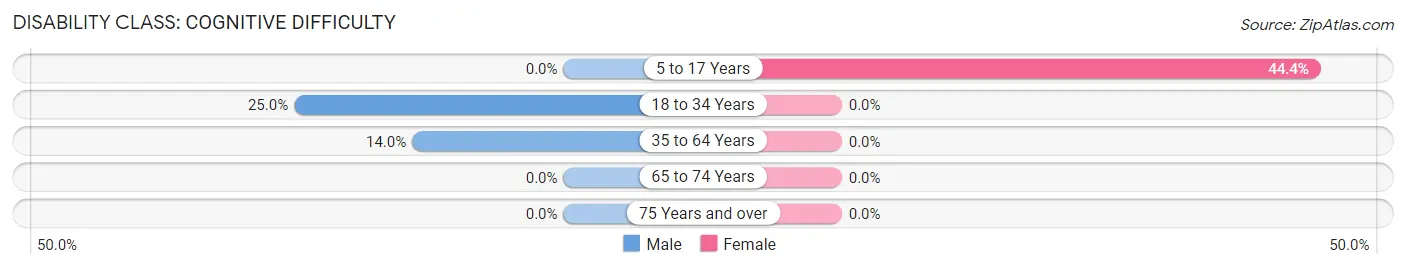
| Age Bracket | Male | Female |
| 5 to 17 Years | 0 (0.0%) | 12 (44.4%) |
| 18 to 34 Years | 2 (25.0%) | 0 (0.0%) |
| 35 to 64 Years | 8 (14.0%) | 0 (0.0%) |
| 65 to 74 Years | 0 (0.0%) | 0 (0.0%) |
| 75 Years and over | 0 (0.0%) | 0 (0.0%) |
Disability Class: Ambulatory Difficulty
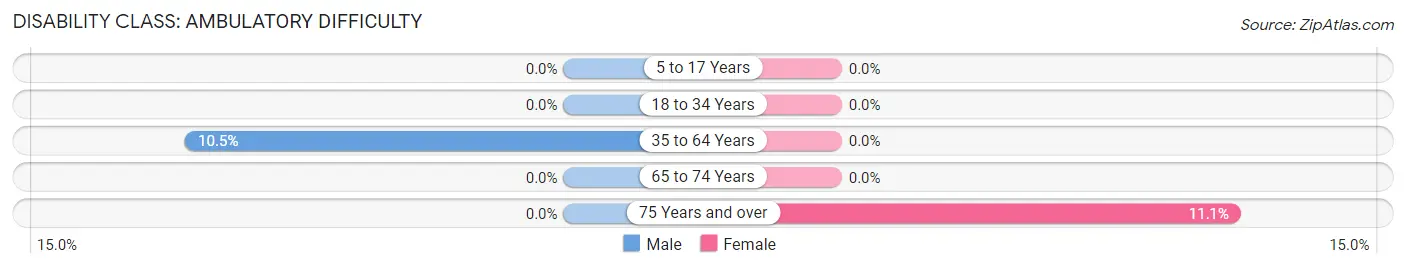
| Age Bracket | Male | Female |
| 5 to 17 Years | 0 (0.0%) | 0 (0.0%) |
| 18 to 34 Years | 0 (0.0%) | 0 (0.0%) |
| 35 to 64 Years | 6 (10.5%) | 0 (0.0%) |
| 65 to 74 Years | 0 (0.0%) | 0 (0.0%) |
| 75 Years and over | 0 (0.0%) | 1 (11.1%) |
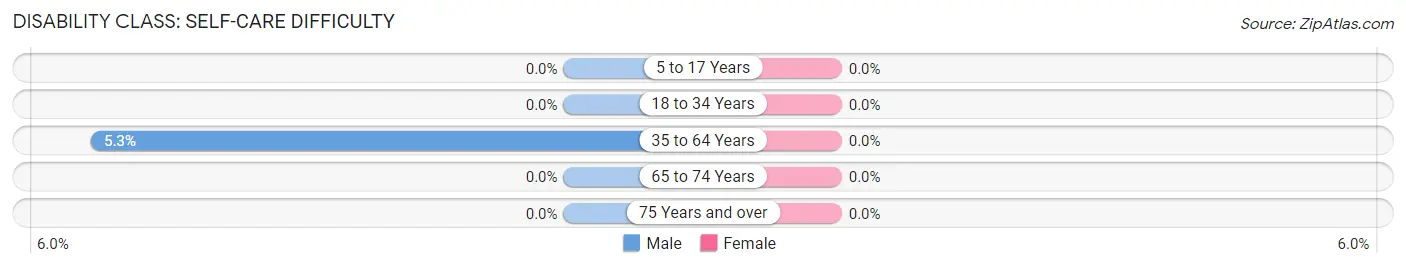
Disability Class: Self-Care Difficulty
| Age Bracket | Male | Female |
| 5 to 17 Years | 0 (0.0%) | 0 (0.0%) |
| 18 to 34 Years | 0 (0.0%) | 0 (0.0%) |
| 35 to 64 Years | 3 (5.3%) | 0 (0.0%) |
| 65 to 74 Years | 0 (0.0%) | 0 (0.0%) |
| 75 Years and over | 0 (0.0%) | 0 (0.0%) |
Technology Access in Lyman
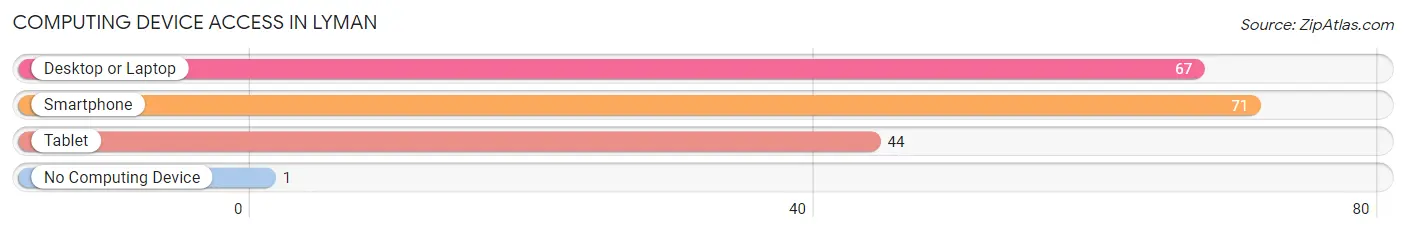
Computing Device Access in Lyman
| Device Type | # Households | % Households |
| Desktop or Laptop | 67 | 93.1% |
| Smartphone | 71 | 98.6% |
| Tablet | 44 | 61.1% |
| No Computing Device | 1 | 1.4% |
| Total | 72 | 100.0% |
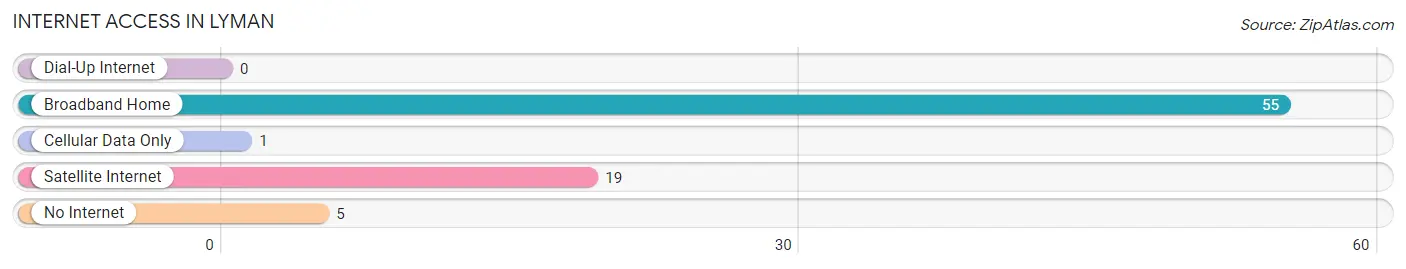
Internet Access in Lyman
| Internet Type | # Households | % Households |
| Dial-Up Internet | 0 | 0.0% |
| Broadband Home | 55 | 76.4% |
| Cellular Data Only | 1 | 1.4% |
| Satellite Internet | 19 | 26.4% |
| No Internet | 5 | 6.9% |
| Total | 72 | 100.0% |
Lyman Summary
Lyman is a small town located in the Uintah Basin of northeastern Utah. It is situated in the Uintah and Ouray Indian Reservation, and is the county seat of Uintah County. The town was founded in 1879 by Mormon settlers, and has a population of approximately 1,000 people.
Geography
Lyman is located in the Uintah Basin of northeastern Utah, at an elevation of 4,890 feet. The town is situated in the Uintah and Ouray Indian Reservation, and is the county seat of Uintah County. The town is surrounded by the Uinta Mountains to the east, the Wasatch Mountains to the west, and the Book Cliffs to the south. The climate in Lyman is semi-arid, with hot summers and cold winters.
Economy
The economy of Lyman is largely based on agriculture and ranching. The town is home to several large farms and ranches, which produce a variety of crops and livestock. The town is also home to several small businesses, including a grocery store, a hardware store, and a few restaurants.
Demographics
As of the 2010 census, the population of Lyman was 1,000 people. The racial makeup of the town was 95.2% White, 0.7% Native American, 0.3% Asian, 0.1% Pacific Islander, 0.1% from other races, and 3.7% from two or more races. The median household income in Lyman was $37,500, and the median family income was $41,250.
History
Lyman was founded in 1879 by Mormon settlers. The town was named after William Lyman, a prominent Mormon leader. The town quickly grew, and by the early 1900s, it had become a thriving agricultural center. In the 1920s, the town was connected to the rest of the state by the Utah Railway.
In the 1950s, the town began to decline as the local economy shifted away from agriculture. The town was further impacted by the construction of the Flaming Gorge Dam in the 1960s, which flooded much of the surrounding land. Despite these setbacks, the town has managed to remain a vibrant community.
Today, Lyman is a small but thriving town. The town is home to several small businesses, and is a popular destination for outdoor recreation. The town is also home to a number of historic sites, including the Lyman Museum and the Lyman Tabernacle.
Common Questions
What is Per Capita Income in Lyman?
Per Capita income in Lyman is $35,855.
What is the Median Family Income in Lyman?
Median Family Income in Lyman is $71,250.
What is the Median Household income in Lyman?
Median Household Income in Lyman is $67,500.
What is Income or Wage Gap in Lyman?
Income or Wage Gap in Lyman is 37.4%.
Women in Lyman earn 62.6 cents for every dollar earned by a man.
What is Inequality or Gini Index in Lyman?
Inequality or Gini Index in Lyman is 0.45.
What is the Total Population of Lyman?
Total Population of Lyman is 200.
What is the Total Male Population of Lyman?
Total Male Population of Lyman is 100.
What is the Total Female Population of Lyman?
Total Female Population of Lyman is 100.
What is the Ratio of Males per 100 Females in Lyman?
There are 100.00 Males per 100 Females in Lyman.
What is the Ratio of Females per 100 Males in Lyman?
There are 100.00 Females per 100 Males in Lyman.
What is the Median Population Age in Lyman?
Median Population Age in Lyman is 41.4 Years.
What is the Average Family Size in Lyman
Average Family Size in Lyman is 2.7 People.
What is the Average Household Size in Lyman
Average Household Size in Lyman is 2.6 People.
How Large is the Labor Force in Lyman?
There are 101 People in the Labor Forcein in Lyman.
What is the Percentage of People in the Labor Force in Lyman?
61.6% of People are in the Labor Force in Lyman.