Providence, UT Map & Demographics
Providence Map
Providence Overview
$40,138
PER CAPITA INCOME
$115,078
AVG FAMILY INCOME
$98,454
AVG HOUSEHOLD INCOME
61.2%
WAGE / INCOME GAP [ % ]
38.8¢/ $1
WAGE / INCOME GAP [ $ ]
$12,402
FAMILY INCOME DEFICIT
0.40
INEQUALITY / GINI INDEX
8,418
TOTAL POPULATION
4,257
MALE POPULATION
4,161
FEMALE POPULATION
102.31
MALES / 100 FEMALES
97.74
FEMALES / 100 MALES
33.6
MEDIAN AGE
3.6
AVG FAMILY SIZE
3.3
AVG HOUSEHOLD SIZE
3,703
LABOR FORCE [ PEOPLE ]
64.2%
PERCENT IN LABOR FORCE
2.4%
UNEMPLOYMENT RATE
Providence Zip Codes
Providence Area Codes
Income in Providence
Income Overview in Providence
Per Capita Income in Providence is $40,138, while median incomes of families and households are $115,078 and $98,454 respectively.
| Characteristic | Number | Measure |
| Per Capita Income | 8,418 | $40,138 |
| Median Family Income | 2,177 | $115,078 |
| Mean Family Income | 2,177 | $142,855 |
| Median Household Income | 2,581 | $98,454 |
| Mean Household Income | 2,581 | $129,571 |
| Income Deficit | 2,177 | $12,402 |
| Wage / Income Gap (%) | 8,418 | 61.16% |
| Wage / Income Gap ($) | 8,418 | 38.84¢ per $1 |
| Gini / Inequality Index | 8,418 | 0.40 |
Earnings by Sex in Providence
Average Earnings in Providence are $46,681, $70,044 for men and $27,207 for women, a difference of 61.2%.
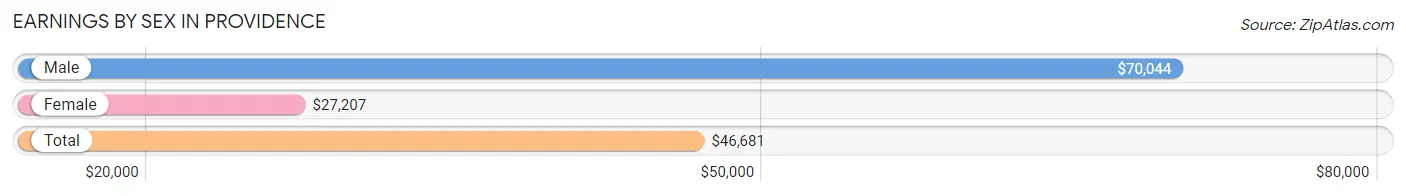
| Sex | Number | Average Earnings |
| Male | 2,064 (50.8%) | $70,044 |
| Female | 1,995 (49.1%) | $27,207 |
| Total | 4,059 (100.0%) | $46,681 |
Earnings by Sex by Income Bracket in Providence
The most common earnings brackets in Providence are $100,000+ for men (526 | 25.5%) and $5,000 to $7,499 for women (153 | 7.7%).
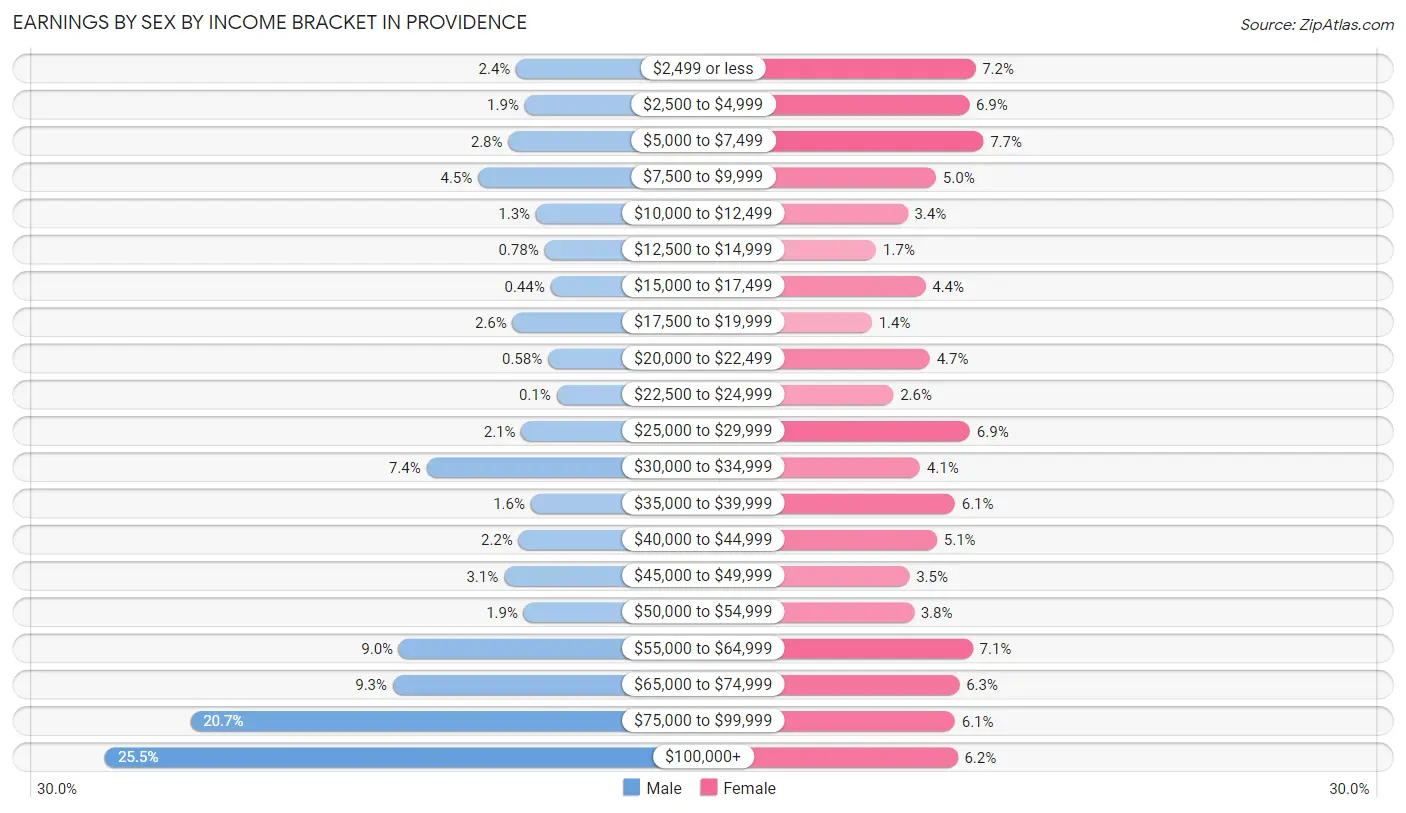
| Income | Male | Female |
| $2,499 or less | 49 (2.4%) | 144 (7.2%) |
| $2,500 to $4,999 | 39 (1.9%) | 137 (6.9%) |
| $5,000 to $7,499 | 58 (2.8%) | 153 (7.7%) |
| $7,500 to $9,999 | 93 (4.5%) | 100 (5.0%) |
| $10,000 to $12,499 | 26 (1.3%) | 68 (3.4%) |
| $12,500 to $14,999 | 16 (0.8%) | 33 (1.7%) |
| $15,000 to $17,499 | 9 (0.4%) | 88 (4.4%) |
| $17,500 to $19,999 | 53 (2.6%) | 28 (1.4%) |
| $20,000 to $22,499 | 12 (0.6%) | 93 (4.7%) |
| $22,500 to $24,999 | 2 (0.1%) | 52 (2.6%) |
| $25,000 to $29,999 | 43 (2.1%) | 138 (6.9%) |
| $30,000 to $34,999 | 153 (7.4%) | 82 (4.1%) |
| $35,000 to $39,999 | 32 (1.5%) | 121 (6.1%) |
| $40,000 to $44,999 | 46 (2.2%) | 101 (5.1%) |
| $45,000 to $49,999 | 63 (3.0%) | 70 (3.5%) |
| $50,000 to $54,999 | 40 (1.9%) | 75 (3.8%) |
| $55,000 to $64,999 | 185 (9.0%) | 141 (7.1%) |
| $65,000 to $74,999 | 192 (9.3%) | 126 (6.3%) |
| $75,000 to $99,999 | 427 (20.7%) | 121 (6.1%) |
| $100,000+ | 526 (25.5%) | 124 (6.2%) |
| Total | 2,064 (100.0%) | 1,995 (100.0%) |
Earnings by Sex by Educational Attainment in Providence
Average earnings in Providence are $78,303 for men and $36,594 for women, a difference of 53.3%. Men with an educational attainment of bachelor's degree enjoy the highest average annual earnings of $96,176, while those with college or associate's degree education earn the least with $59,268. Women with an educational attainment of bachelor's degree earn the most with the average annual earnings of $56,518, while those with college or associate's degree education have the smallest earnings of $28,315.
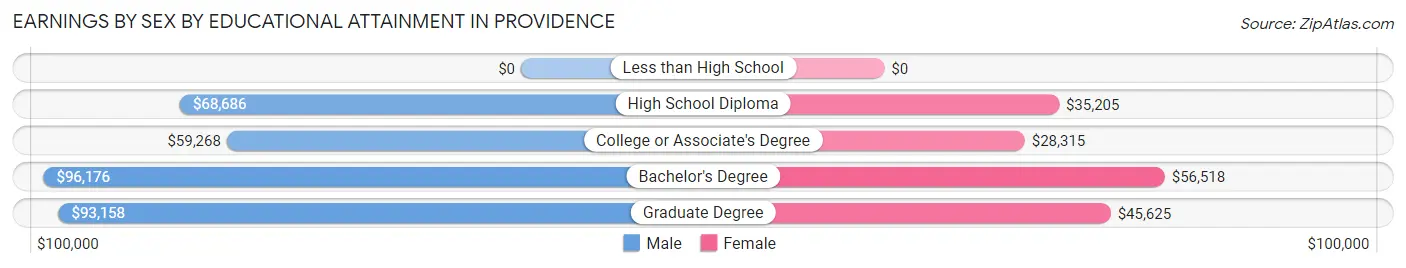
| Educational Attainment | Male Income | Female Income |
| Less than High School | - | - |
| High School Diploma | $68,686 | $35,205 |
| College or Associate's Degree | $59,268 | $28,315 |
| Bachelor's Degree | $96,176 | $56,518 |
| Graduate Degree | $93,158 | $45,625 |
| Total | $78,303 | $36,594 |
Family Income in Providence
Family Income Brackets in Providence
According to the Providence family income data, there are 483 families falling into the $150,000 to $199,999 income range, which is the most common income bracket and makes up 22.2% of all families. Conversely, the less than $10,000 income bracket is the least frequent group with only 7 families (0.3%) belonging to this category.
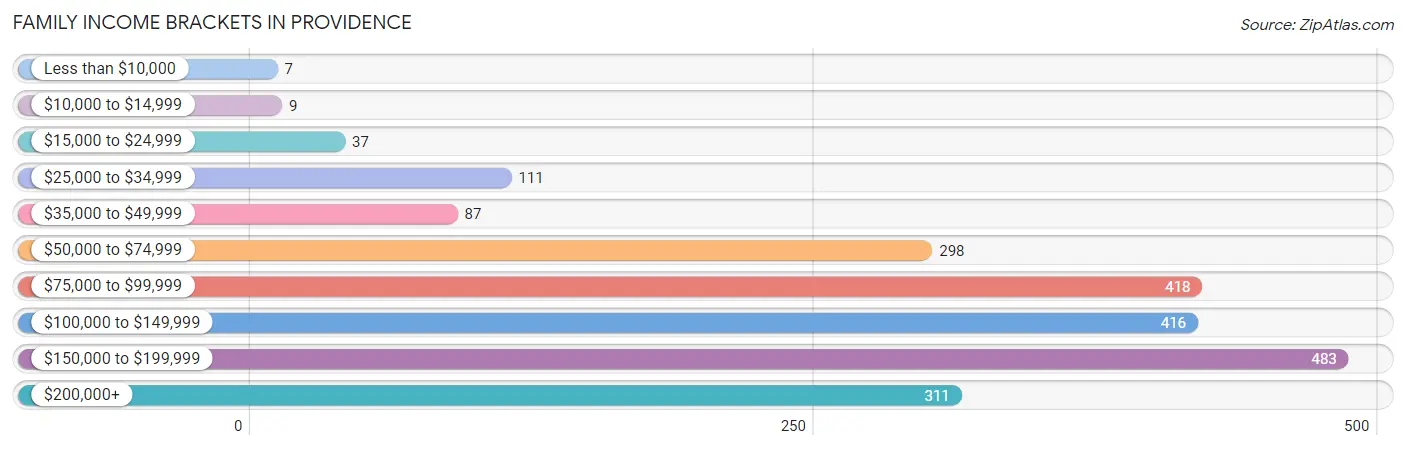
| Income Bracket | # Families | % Families |
| Less than $10,000 | 7 | 0.3% |
| $10,000 to $14,999 | 9 | 0.4% |
| $15,000 to $24,999 | 37 | 1.7% |
| $25,000 to $34,999 | 111 | 5.1% |
| $35,000 to $49,999 | 87 | 4.0% |
| $50,000 to $74,999 | 298 | 13.7% |
| $75,000 to $99,999 | 418 | 19.2% |
| $100,000 to $149,999 | 416 | 19.1% |
| $150,000 to $199,999 | 483 | 22.2% |
| $200,000+ | 311 | 14.3% |
Family Income by Famaliy Size in Providence
3-person families (309 | 14.2%) account for the highest median family income in Providence with $185,135 per family, while 3-person families (309 | 14.2%) have the highest median income of $61,712 per family member.
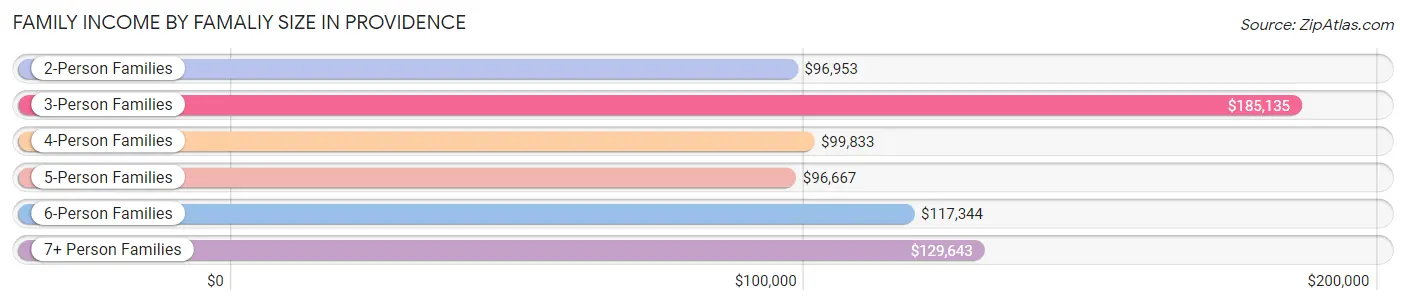
| Income Bracket | # Families | Median Income |
| 2-Person Families | 944 (43.4%) | $96,953 |
| 3-Person Families | 309 (14.2%) | $185,135 |
| 4-Person Families | 304 (14.0%) | $99,833 |
| 5-Person Families | 298 (13.7%) | $96,667 |
| 6-Person Families | 184 (8.5%) | $117,344 |
| 7+ Person Families | 138 (6.3%) | $129,643 |
| Total | 2,177 (100.0%) | $115,078 |
Family Income by Number of Earners in Providence
The median family income in Providence is $115,078, with families comprising 3+ earners (257) having the highest median family income of $156,181, while families with no earners (236) have the lowest median family income of $86,250, accounting for 11.8% and 10.8% of families, respectively.
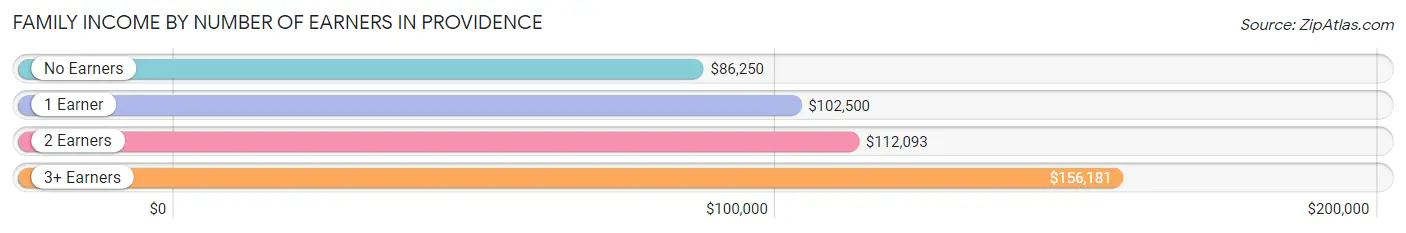
| Number of Earners | # Families | Median Income |
| No Earners | 236 (10.8%) | $86,250 |
| 1 Earner | 568 (26.1%) | $102,500 |
| 2 Earners | 1,116 (51.3%) | $112,093 |
| 3+ Earners | 257 (11.8%) | $156,181 |
| Total | 2,177 (100.0%) | $115,078 |
Household Income in Providence
Household Income Brackets in Providence
With 493 households falling in the category, the $150,000 to $199,999 income range is the most frequent in Providence, accounting for 19.1% of all households. In contrast, only 8 households (0.3%) fall into the $10,000 to $14,999 income bracket, making it the least populous group.
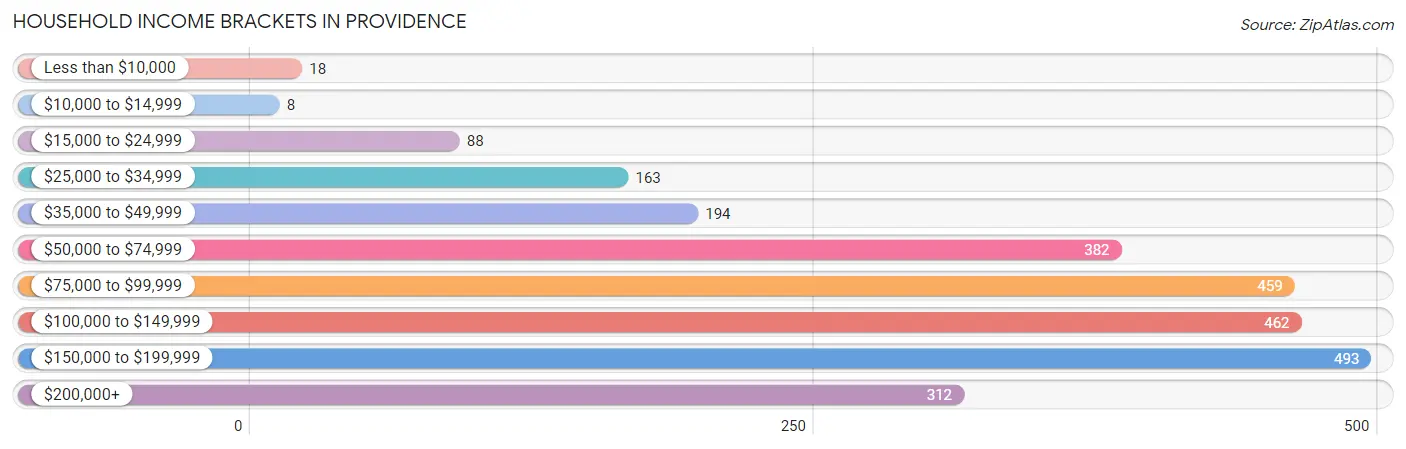
| Income Bracket | # Households | % Households |
| Less than $10,000 | 18 | 0.7% |
| $10,000 to $14,999 | 8 | 0.3% |
| $15,000 to $24,999 | 88 | 3.4% |
| $25,000 to $34,999 | 163 | 6.3% |
| $35,000 to $49,999 | 194 | 7.5% |
| $50,000 to $74,999 | 382 | 14.8% |
| $75,000 to $99,999 | 459 | 17.8% |
| $100,000 to $149,999 | 462 | 17.9% |
| $150,000 to $199,999 | 493 | 19.1% |
| $200,000+ | 312 | 12.1% |
Household Income by Householder Age in Providence
The median household income in Providence is $98,454, with the highest median household income of $125,489 found in the 25 to 44 years age bracket for the primary householder. A total of 833 households (32.3%) fall into this category. Meanwhile, the 15 to 24 years age bracket for the primary householder has the lowest median household income of $0, with 83 households (3.2%) in this group.
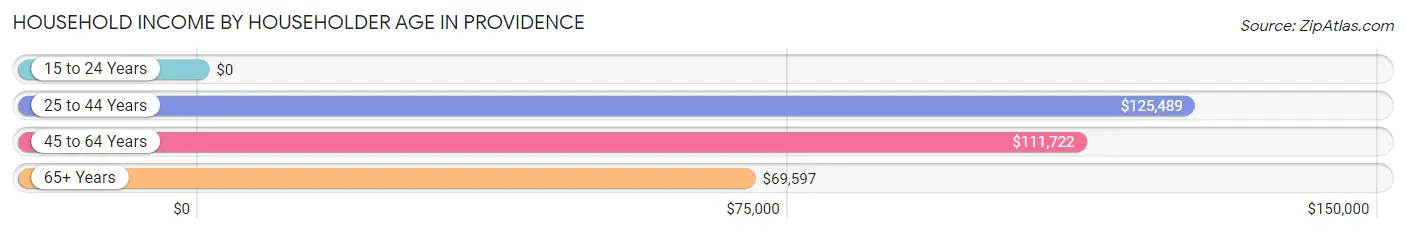
| Income Bracket | # Households | Median Income |
| 15 to 24 Years | 83 (3.2%) | $0 |
| 25 to 44 Years | 833 (32.3%) | $125,489 |
| 45 to 64 Years | 950 (36.8%) | $111,722 |
| 65+ Years | 715 (27.7%) | $69,597 |
| Total | 2,581 (100.0%) | $98,454 |
Poverty in Providence
Income Below Poverty by Sex and Age in Providence
With 5.4% poverty level for males and 8.1% for females among the residents of Providence, 15 year old males and 18 to 24 year old females are the most vulnerable to poverty, with 33 males (27.3%) and 80 females (22.2%) in their respective age groups living below the poverty level.
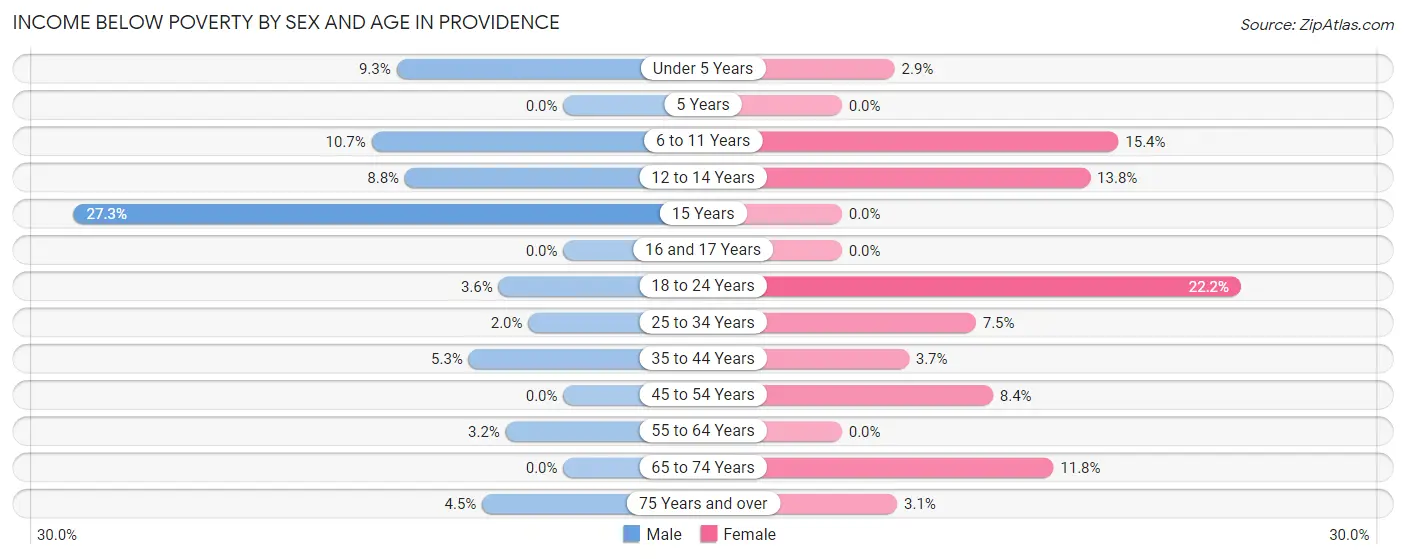
| Age Bracket | Male | Female |
| Under 5 Years | 34 (9.3%) | 7 (2.9%) |
| 5 Years | 0 (0.0%) | 0 (0.0%) |
| 6 to 11 Years | 75 (10.7%) | 69 (15.4%) |
| 12 to 14 Years | 24 (8.8%) | 39 (13.8%) |
| 15 Years | 33 (27.3%) | 0 (0.0%) |
| 16 and 17 Years | 0 (0.0%) | 0 (0.0%) |
| 18 to 24 Years | 11 (3.6%) | 80 (22.2%) |
| 25 to 34 Years | 7 (1.9%) | 30 (7.5%) |
| 35 to 44 Years | 24 (5.3%) | 24 (3.7%) |
| 45 to 54 Years | 0 (0.0%) | 38 (8.4%) |
| 55 to 64 Years | 11 (3.2%) | 0 (0.0%) |
| 65 to 74 Years | 0 (0.0%) | 41 (11.8%) |
| 75 Years and over | 9 (4.5%) | 7 (3.1%) |
| Total | 228 (5.4%) | 335 (8.1%) |
Income Above Poverty by Sex and Age in Providence
According to the poverty statistics in Providence, males aged 5 years and females aged 5 years are the age groups that are most secure financially, with 100.0% of males and 100.0% of females in these age groups living above the poverty line.
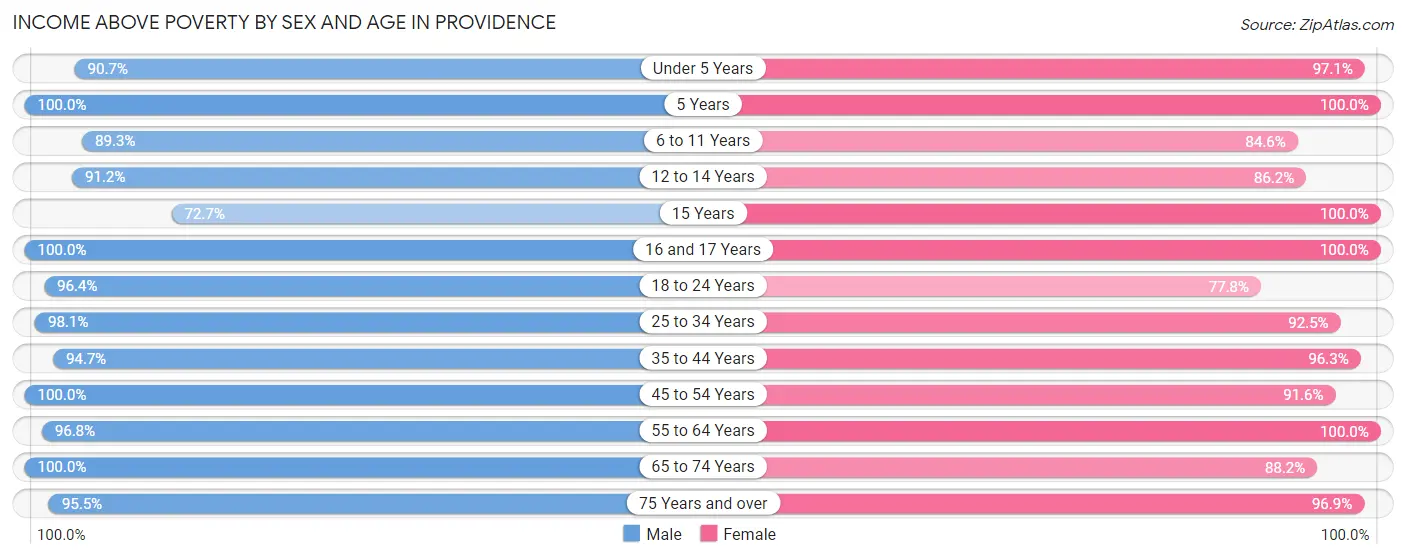
| Age Bracket | Male | Female |
| Under 5 Years | 332 (90.7%) | 231 (97.1%) |
| 5 Years | 93 (100.0%) | 63 (100.0%) |
| 6 to 11 Years | 627 (89.3%) | 379 (84.6%) |
| 12 to 14 Years | 248 (91.2%) | 243 (86.2%) |
| 15 Years | 88 (72.7%) | 65 (100.0%) |
| 16 and 17 Years | 98 (100.0%) | 152 (100.0%) |
| 18 to 24 Years | 294 (96.4%) | 280 (77.8%) |
| 25 to 34 Years | 352 (98.1%) | 372 (92.5%) |
| 35 to 44 Years | 431 (94.7%) | 620 (96.3%) |
| 45 to 54 Years | 551 (100.0%) | 414 (91.6%) |
| 55 to 64 Years | 332 (96.8%) | 479 (100.0%) |
| 65 to 74 Years | 392 (100.0%) | 307 (88.2%) |
| 75 Years and over | 190 (95.5%) | 220 (96.9%) |
| Total | 4,028 (94.6%) | 3,825 (91.9%) |
Income Below Poverty Among Married-Couple Families in Providence
The poverty statistics for married-couple families in Providence show that 2.3% or 43 of the total 1,901 families live below the poverty line. Families with 3 or 4 children have the highest poverty rate of 6.8%, comprising of 27 families. On the other hand, families with 5 or more children have the lowest poverty rate of 0.0%, which includes 0 families.
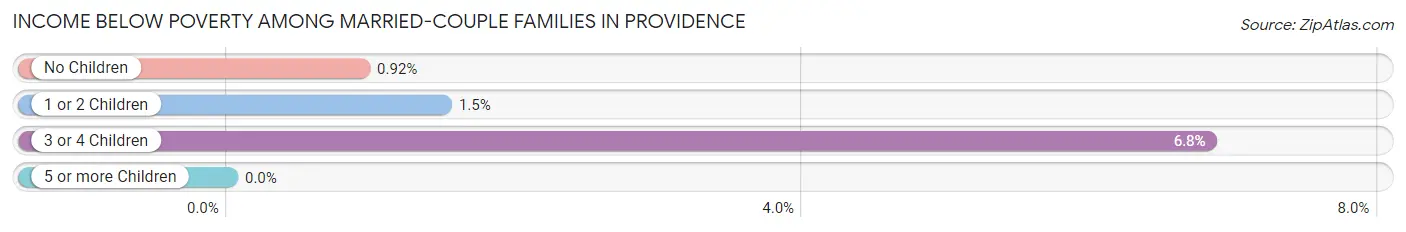
| Children | Above Poverty | Below Poverty |
| No Children | 969 (99.1%) | 9 (0.9%) |
| 1 or 2 Children | 463 (98.5%) | 7 (1.5%) |
| 3 or 4 Children | 369 (93.2%) | 27 (6.8%) |
| 5 or more Children | 57 (100.0%) | 0 (0.0%) |
| Total | 1,858 (97.7%) | 43 (2.3%) |
Income Below Poverty Among Single-Parent Households in Providence
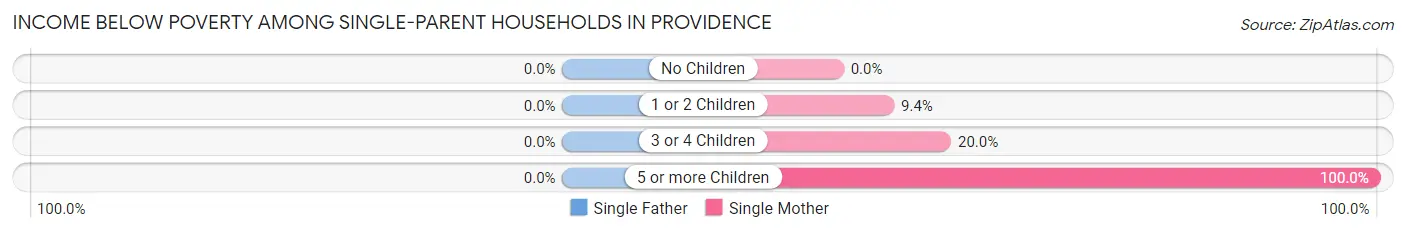
| Children | Single Father | Single Mother |
| No Children | 0 (0.0%) | 0 (0.0%) |
| 1 or 2 Children | 0 (0.0%) | 11 (9.4%) |
| 3 or 4 Children | 0 (0.0%) | 5 (20.0%) |
| 5 or more Children | 0 (0.0%) | 24 (100.0%) |
| Total | 0 (0.0%) | 40 (20.1%) |
Income Below Poverty Among Married-Couple vs Single-Parent Households in Providence
The poverty data for Providence shows that 43 of the married-couple family households (2.3%) and 40 of the single-parent households (14.5%) are living below the poverty level. Within the married-couple family households, those with 3 or 4 children have the highest poverty rate, with 27 households (6.8%) falling below the poverty line. Among the single-parent households, those with 5 or more children have the highest poverty rate, with 24 household (100.0%) living below poverty.
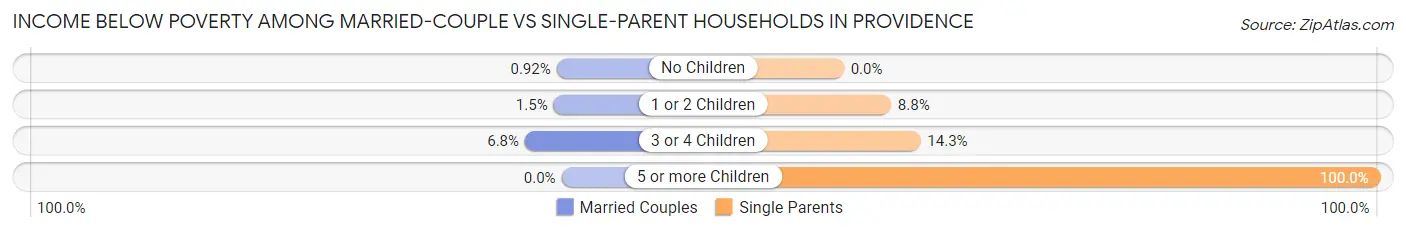
| Children | Married-Couple Families | Single-Parent Households |
| No Children | 9 (0.9%) | 0 (0.0%) |
| 1 or 2 Children | 7 (1.5%) | 11 (8.8%) |
| 3 or 4 Children | 27 (6.8%) | 5 (14.3%) |
| 5 or more Children | 0 (0.0%) | 24 (100.0%) |
| Total | 43 (2.3%) | 40 (14.5%) |
Race in Providence
The most populous races in Providence are White / Caucasian (7,462 | 88.6%), Hispanic or Latino (1,034 | 12.3%), and Two or more Races (733 | 8.7%).
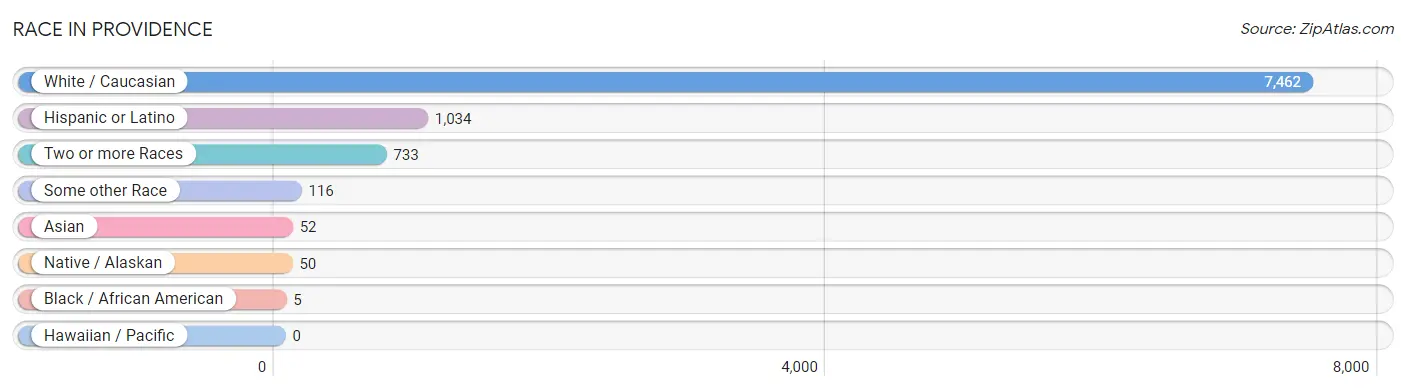
| Race | # Population | % Population |
| Asian | 52 | 0.6% |
| Black / African American | 5 | 0.1% |
| Hawaiian / Pacific | 0 | 0.0% |
| Hispanic or Latino | 1,034 | 12.3% |
| Native / Alaskan | 50 | 0.6% |
| White / Caucasian | 7,462 | 88.6% |
| Two or more Races | 733 | 8.7% |
| Some other Race | 116 | 1.4% |
| Total | 8,418 | 100.0% |
Ancestry in Providence
The most populous ancestries reported in Providence are English (2,325 | 27.6%), German (1,294 | 15.4%), Danish (738 | 8.8%), European (738 | 8.8%), and Mexican (708 | 8.4%), together accounting for 68.9% of all Providence residents.
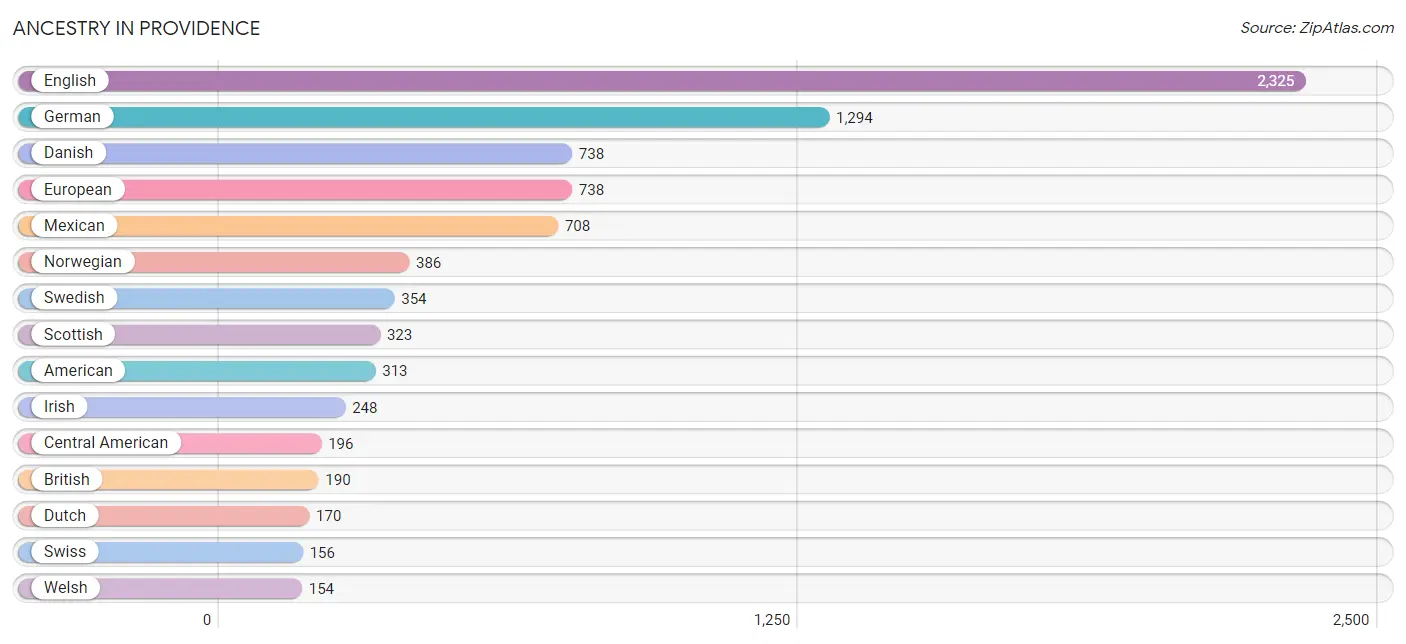
| Ancestry | # Population | % Population |
| African | 44 | 0.5% |
| American | 313 | 3.7% |
| Belgian | 15 | 0.2% |
| Bhutanese | 19 | 0.2% |
| British | 190 | 2.3% |
| Canadian | 14 | 0.2% |
| Central American | 196 | 2.3% |
| Chippewa | 10 | 0.1% |
| Cree | 10 | 0.1% |
| Czech | 12 | 0.1% |
| Danish | 738 | 8.8% |
| Dutch | 170 | 2.0% |
| Eastern European | 35 | 0.4% |
| Ecuadorian | 28 | 0.3% |
| English | 2,325 | 27.6% |
| European | 738 | 8.8% |
| Finnish | 15 | 0.2% |
| French | 61 | 0.7% |
| French American Indian | 19 | 0.2% |
| French Canadian | 30 | 0.4% |
| German | 1,294 | 15.4% |
| Greek | 19 | 0.2% |
| Guatemalan | 90 | 1.1% |
| Hungarian | 4 | 0.1% |
| Icelander | 83 | 1.0% |
| Indian (Asian) | 16 | 0.2% |
| Irish | 248 | 2.9% |
| Italian | 46 | 0.5% |
| Japanese | 32 | 0.4% |
| Korean | 2 | 0.0% |
| Menominee | 22 | 0.3% |
| Mexican | 708 | 8.4% |
| Northern European | 8 | 0.1% |
| Norwegian | 386 | 4.6% |
| Polish | 10 | 0.1% |
| Puerto Rican | 25 | 0.3% |
| Russian | 42 | 0.5% |
| Salvadoran | 106 | 1.3% |
| Samoan | 27 | 0.3% |
| Scandinavian | 136 | 1.6% |
| Scotch-Irish | 82 | 1.0% |
| Scottish | 323 | 3.8% |
| Sioux | 139 | 1.7% |
| Slovak | 26 | 0.3% |
| South American | 28 | 0.3% |
| Spaniard | 48 | 0.6% |
| Spanish | 28 | 0.3% |
| Sri Lankan | 36 | 0.4% |
| Subsaharan African | 44 | 0.5% |
| Swedish | 354 | 4.2% |
| Swiss | 156 | 1.8% |
| Turkish | 19 | 0.2% |
| Welsh | 154 | 1.8% | View All 53 Rows |
Immigrants in Providence
The most numerous immigrant groups reported in Providence came from Latin America (119 | 1.4%), Central America (110 | 1.3%), Mexico (69 | 0.8%), Europe (48 | 0.6%), and Asia (41 | 0.5%), together accounting for 4.6% of all Providence residents.
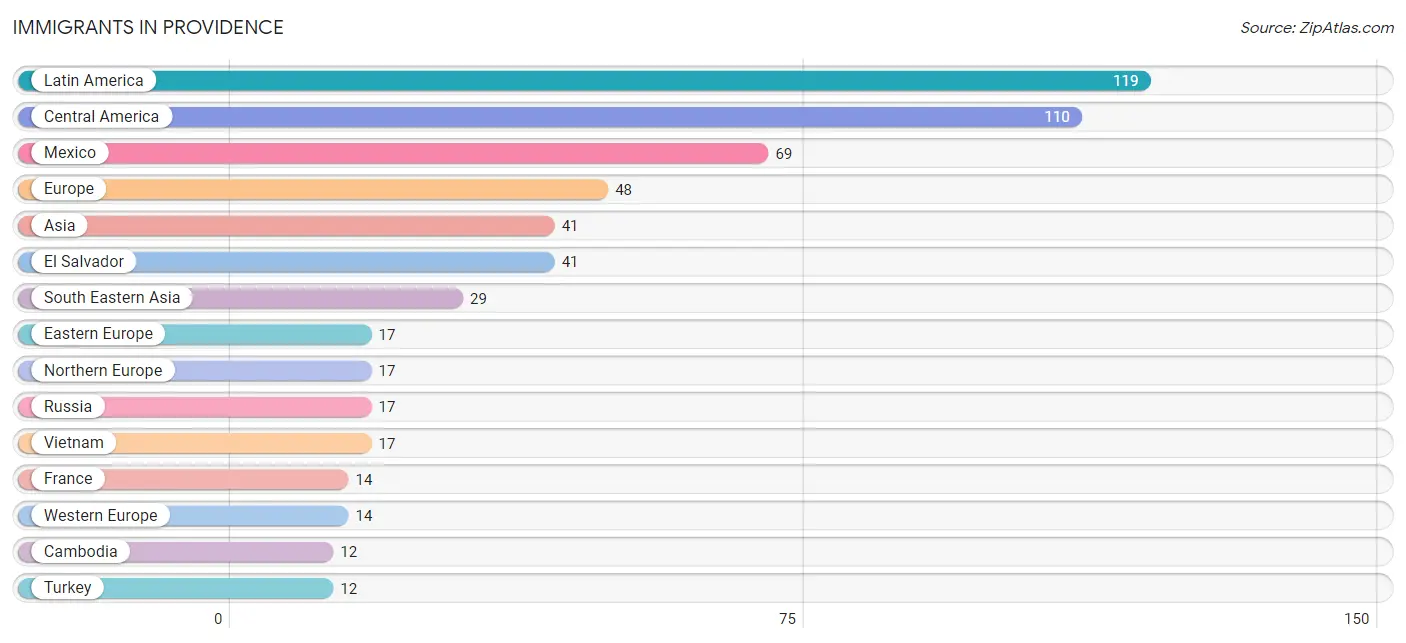
| Immigration Origin | # Population | % Population |
| Asia | 41 | 0.5% |
| Cambodia | 12 | 0.1% |
| Central America | 110 | 1.3% |
| Eastern Europe | 17 | 0.2% |
| Ecuador | 9 | 0.1% |
| El Salvador | 41 | 0.5% |
| England | 5 | 0.1% |
| Europe | 48 | 0.6% |
| France | 14 | 0.2% |
| Latin America | 119 | 1.4% |
| Mexico | 69 | 0.8% |
| Northern Europe | 17 | 0.2% |
| Russia | 17 | 0.2% |
| South America | 9 | 0.1% |
| South Eastern Asia | 29 | 0.3% |
| Sweden | 5 | 0.1% |
| Turkey | 12 | 0.1% |
| Vietnam | 17 | 0.2% |
| Western Asia | 12 | 0.1% |
| Western Europe | 14 | 0.2% | View All 20 Rows |
Sex and Age in Providence
Sex and Age in Providence
The most populous age groups in Providence are 5 to 9 Years (558 | 13.1%) for men and 5 to 9 Years (413 | 9.9%) for women.
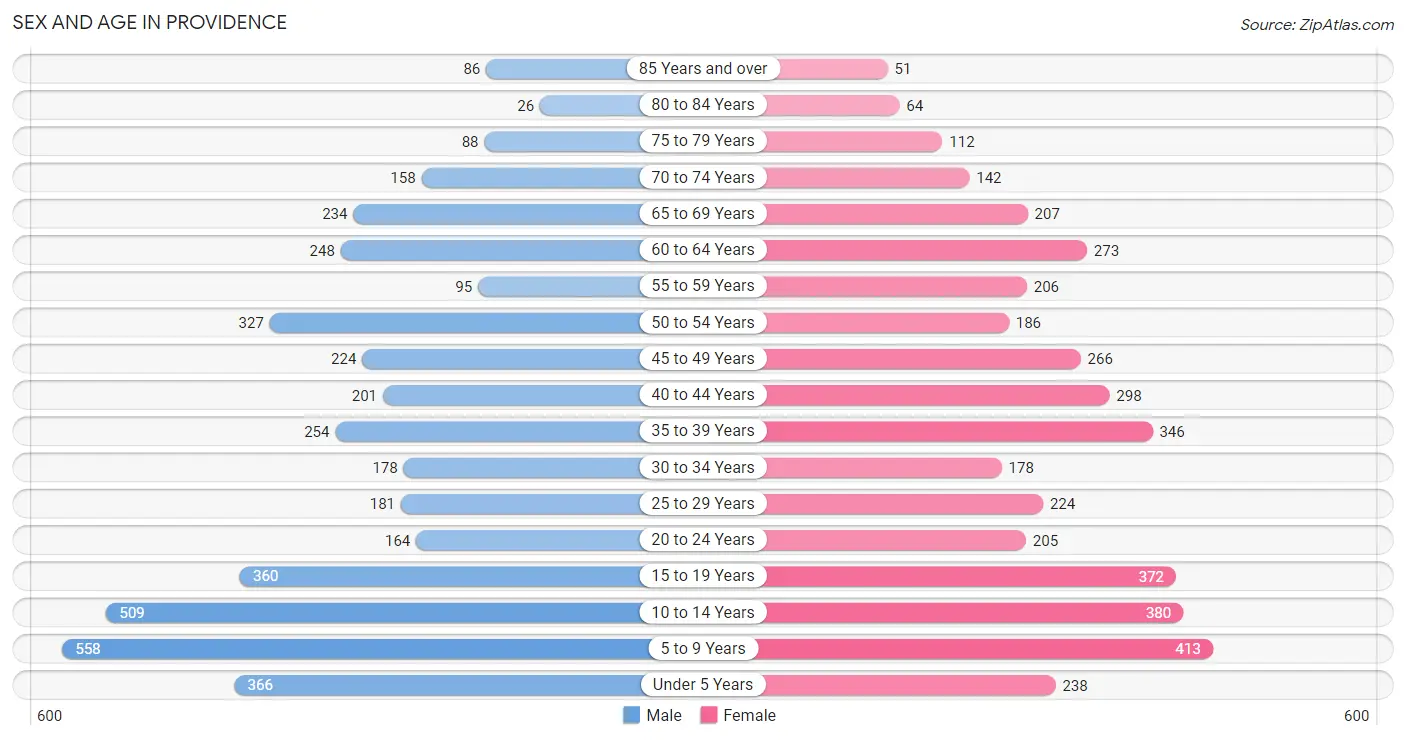
| Age Bracket | Male | Female |
| Under 5 Years | 366 (8.6%) | 238 (5.7%) |
| 5 to 9 Years | 558 (13.1%) | 413 (9.9%) |
| 10 to 14 Years | 509 (12.0%) | 380 (9.1%) |
| 15 to 19 Years | 360 (8.5%) | 372 (8.9%) |
| 20 to 24 Years | 164 (3.8%) | 205 (4.9%) |
| 25 to 29 Years | 181 (4.3%) | 224 (5.4%) |
| 30 to 34 Years | 178 (4.2%) | 178 (4.3%) |
| 35 to 39 Years | 254 (6.0%) | 346 (8.3%) |
| 40 to 44 Years | 201 (4.7%) | 298 (7.2%) |
| 45 to 49 Years | 224 (5.3%) | 266 (6.4%) |
| 50 to 54 Years | 327 (7.7%) | 186 (4.5%) |
| 55 to 59 Years | 95 (2.2%) | 206 (5.0%) |
| 60 to 64 Years | 248 (5.8%) | 273 (6.6%) |
| 65 to 69 Years | 234 (5.5%) | 207 (5.0%) |
| 70 to 74 Years | 158 (3.7%) | 142 (3.4%) |
| 75 to 79 Years | 88 (2.1%) | 112 (2.7%) |
| 80 to 84 Years | 26 (0.6%) | 64 (1.5%) |
| 85 Years and over | 86 (2.0%) | 51 (1.2%) |
| Total | 4,257 (100.0%) | 4,161 (100.0%) |
Families and Households in Providence
Median Family Size in Providence
The median family size in Providence is 3.61 persons per family, with single female/mother families (199 | 9.1%) accounting for the largest median family size of 3.98 persons per family. On the other hand, single male/father families (77 | 3.5%) represent the smallest median family size with 2.47 persons per family.
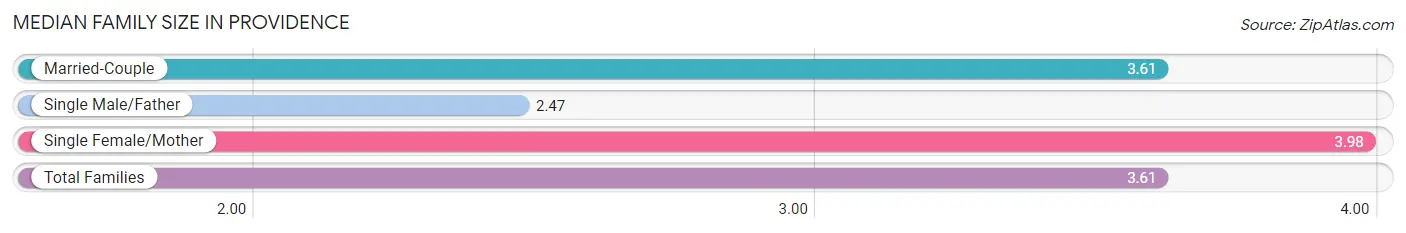
| Family Type | # Families | Family Size |
| Married-Couple | 1,901 (87.3%) | 3.61 |
| Single Male/Father | 77 (3.5%) | 2.47 |
| Single Female/Mother | 199 (9.1%) | 3.98 |
| Total Families | 2,177 (100.0%) | 3.61 |
Median Household Size in Providence
The median household size in Providence is 3.26 persons per household, with single female/mother households (199 | 7.7%) accounting for the largest median household size of 4.12 persons per household. non-family households (404 | 15.7%) represent the smallest median household size with 1.28 persons per household.
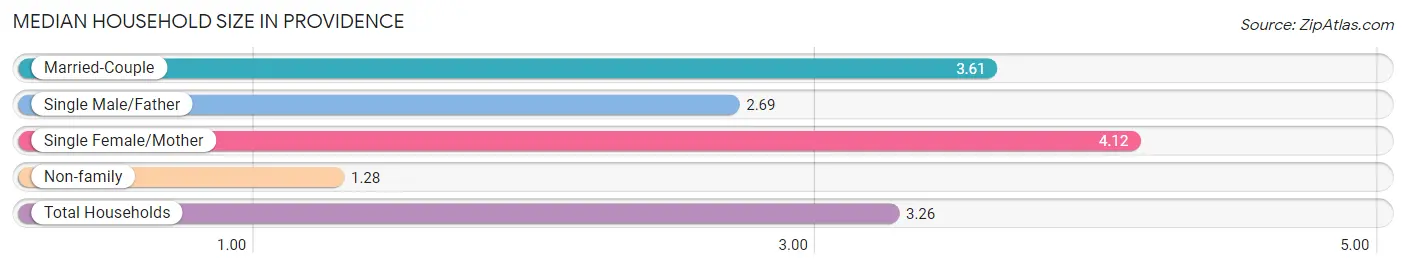
| Household Type | # Households | Household Size |
| Married-Couple | 1,901 (73.7%) | 3.61 |
| Single Male/Father | 77 (3.0%) | 2.69 |
| Single Female/Mother | 199 (7.7%) | 4.12 |
| Non-family | 404 (15.7%) | 1.28 |
| Total Households | 2,581 (100.0%) | 3.26 |
Household Size by Marriage Status in Providence
Out of a total of 2,581 households in Providence, 2,177 (84.4%) are family households, while 404 (15.7%) are nonfamily households. The most numerous type of family households are 2-person households, comprising 944, and the most common type of nonfamily households are 1-person households, comprising 338.
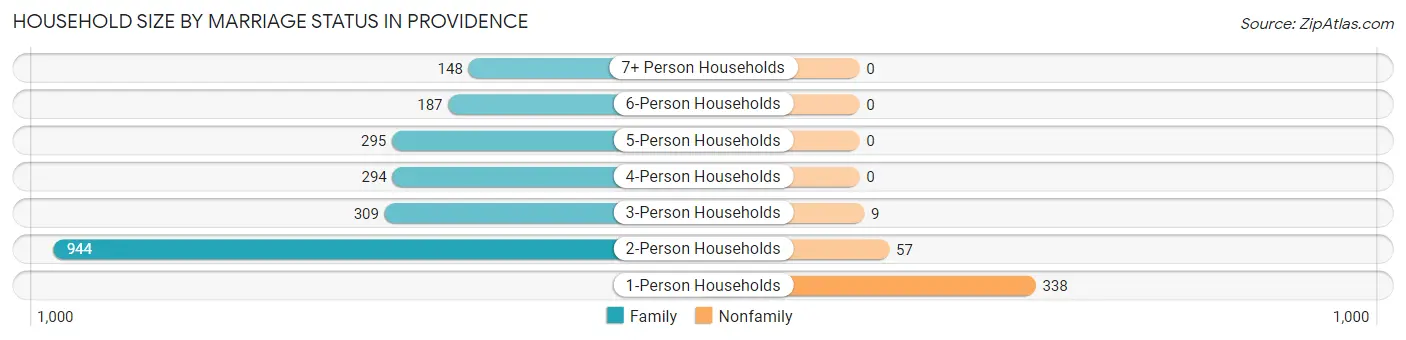
| Household Size | Family Households | Nonfamily Households |
| 1-Person Households | - | 338 (13.1%) |
| 2-Person Households | 944 (36.6%) | 57 (2.2%) |
| 3-Person Households | 309 (12.0%) | 9 (0.4%) |
| 4-Person Households | 294 (11.4%) | 0 (0.0%) |
| 5-Person Households | 295 (11.4%) | 0 (0.0%) |
| 6-Person Households | 187 (7.2%) | 0 (0.0%) |
| 7+ Person Households | 148 (5.7%) | 0 (0.0%) |
| Total | 2,177 (84.4%) | 404 (15.7%) |
Female Fertility in Providence
Fertility by Age in Providence
Average fertility rate in Providence is 73.0 births per 1,000 women. Women in the age bracket of 20 to 34 years have the highest fertility rate with 189.0 births per 1,000 women. Women in the age bracket of 20 to 34 years acount for 81.6% of all women with births.
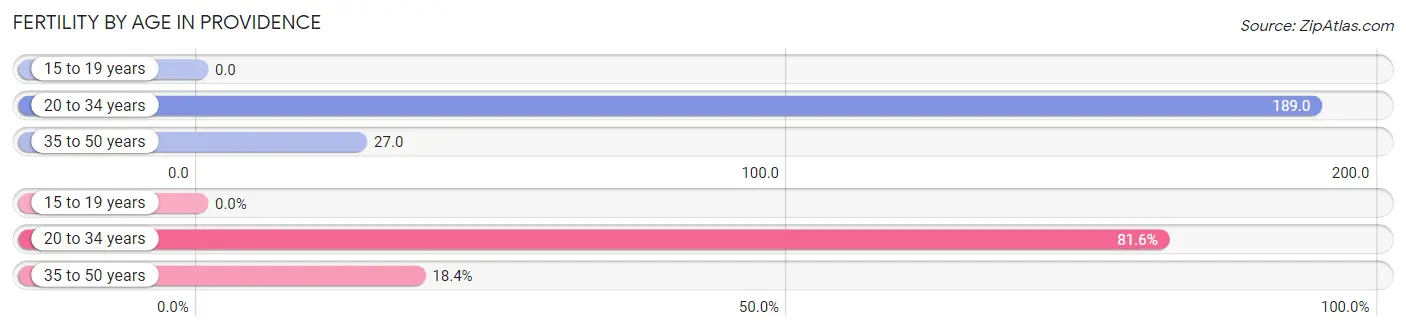
| Age Bracket | Women with Births | Births / 1,000 Women |
| 15 to 19 years | 0 (0.0%) | 0.0 |
| 20 to 34 years | 115 (81.6%) | 189.0 |
| 35 to 50 years | 26 (18.4%) | 27.0 |
| Total | 141 (100.0%) | 73.0 |
Fertility by Age by Marriage Status in Providence
70.2% of women with births (141) in Providence are married. The highest percentage of unmarried women with births falls into 20 to 34 years age bracket with 36.5% of them unmarried at the time of birth, while the lowest percentage of unmarried women with births belong to 35 to 50 years age bracket with 0.0% of them unmarried.
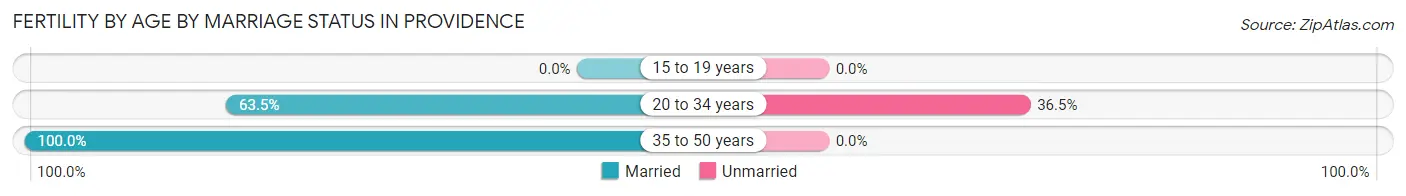
| Age Bracket | Married | Unmarried |
| 15 to 19 years | 0 (0.0%) | 0 (0.0%) |
| 20 to 34 years | 73 (63.5%) | 42 (36.5%) |
| 35 to 50 years | 26 (100.0%) | 0 (0.0%) |
| Total | 99 (70.2%) | 42 (29.8%) |
Fertility by Education in Providence
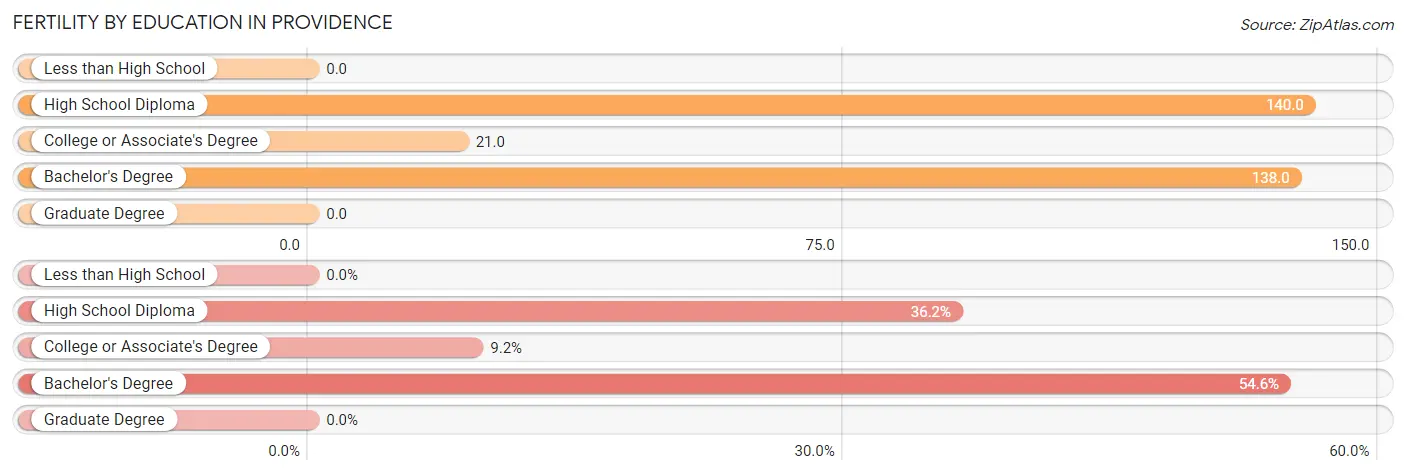
| Educational Attainment | Women with Births | Births / 1,000 Women |
| Less than High School | 0 (0.0%) | 0.0 |
| High School Diploma | 51 (36.2%) | 140.0 |
| College or Associate's Degree | 13 (9.2%) | 21.0 |
| Bachelor's Degree | 77 (54.6%) | 138.0 |
| Graduate Degree | 0 (0.0%) | 0.0 |
| Total | 141 (100.0%) | 73.0 |
Fertility by Education by Marriage Status in Providence
29.8% of women with births in Providence are unmarried. Women with the educational attainment of college or associate's degree are most likely to be married with 100.0% of them married at childbirth, while women with the educational attainment of high school diploma are least likely to be married with 82.4% of them unmarried at childbirth.
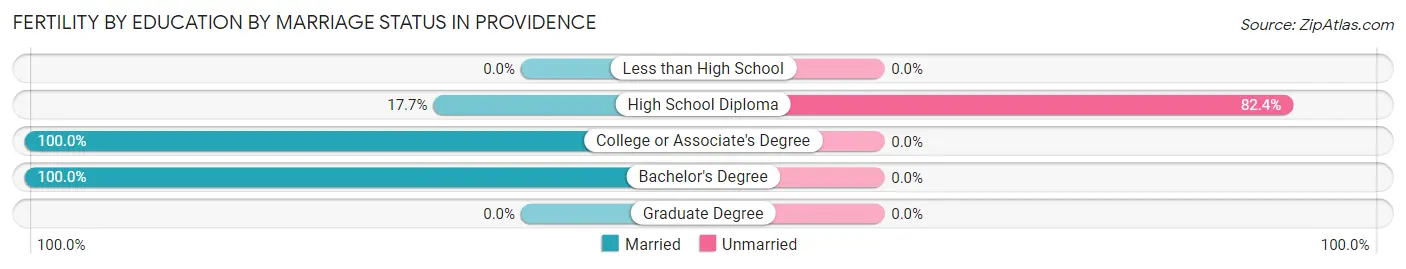
| Educational Attainment | Married | Unmarried |
| Less than High School | 0 (0.0%) | 0 (0.0%) |
| High School Diploma | 9 (17.6%) | 42 (82.4%) |
| College or Associate's Degree | 13 (100.0%) | 0 (0.0%) |
| Bachelor's Degree | 77 (100.0%) | 0 (0.0%) |
| Graduate Degree | 0 (0.0%) | 0 (0.0%) |
| Total | 99 (70.2%) | 42 (29.8%) |
Employment Characteristics in Providence
Employment by Class of Employer in Providence
Among the 3,571 employed individuals in Providence, private company employees (2,199 | 61.6%), state government employees (308 | 8.6%), and local government employees (273 | 7.6%) make up the most common classes of employment.
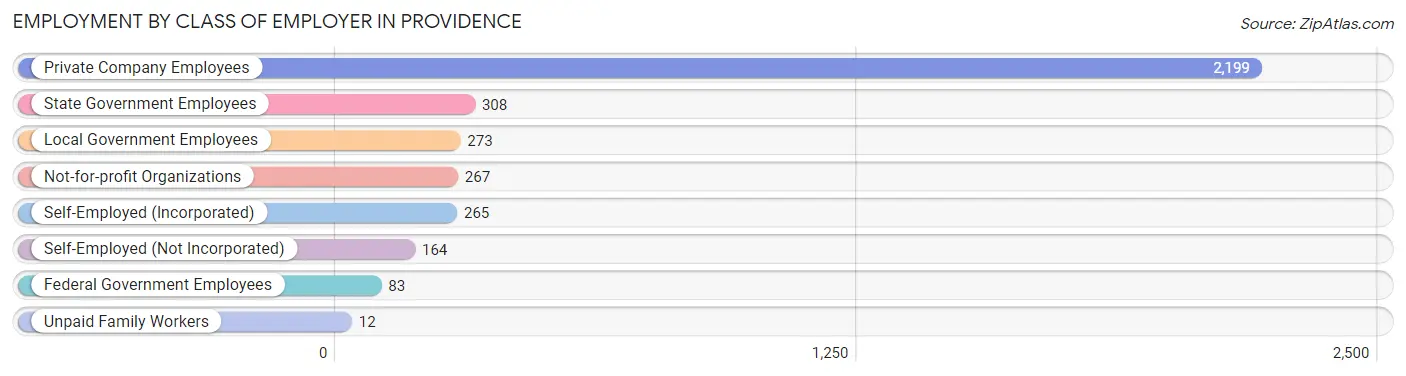
| Employer Class | # Employees | % Employees |
| Private Company Employees | 2,199 | 61.6% |
| Self-Employed (Incorporated) | 265 | 7.4% |
| Self-Employed (Not Incorporated) | 164 | 4.6% |
| Not-for-profit Organizations | 267 | 7.5% |
| Local Government Employees | 273 | 7.6% |
| State Government Employees | 308 | 8.6% |
| Federal Government Employees | 83 | 2.3% |
| Unpaid Family Workers | 12 | 0.3% |
| Total | 3,571 | 100.0% |
Employment Status by Age in Providence
According to the labor force statistics for Providence, out of the total population over 16 years of age (5,768), 64.2% or 3,703 individuals are in the labor force, with 2.4% or 89 of them unemployed. The age group with the highest labor force participation rate is 20 to 24 years, with 96.7% or 357 individuals in the labor force. Within the labor force, the 20 to 24 years age range has the highest percentage of unemployed individuals, with 14.8% or 53 of them being unemployed.
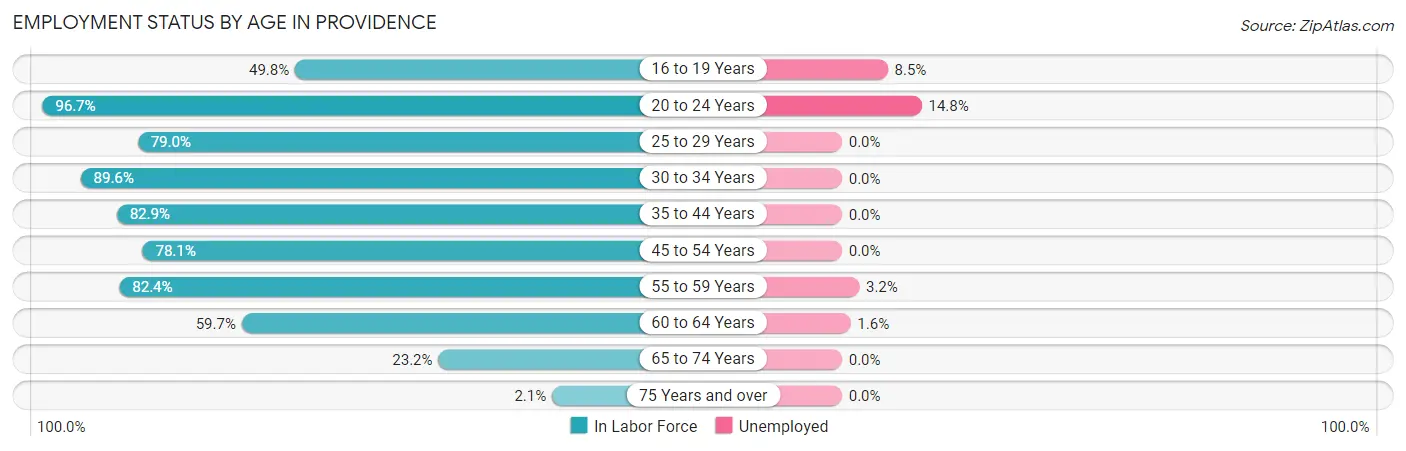
| Age Bracket | In Labor Force | Unemployed |
| 16 to 19 Years | 272 (49.8%) | 23 (8.5%) |
| 20 to 24 Years | 357 (96.7%) | 53 (14.8%) |
| 25 to 29 Years | 320 (79.0%) | 0 (0.0%) |
| 30 to 34 Years | 319 (89.6%) | 0 (0.0%) |
| 35 to 44 Years | 911 (82.9%) | 0 (0.0%) |
| 45 to 54 Years | 783 (78.1%) | 0 (0.0%) |
| 55 to 59 Years | 248 (82.4%) | 8 (3.2%) |
| 60 to 64 Years | 311 (59.7%) | 5 (1.6%) |
| 65 to 74 Years | 172 (23.2%) | 0 (0.0%) |
| 75 Years and over | 9 (2.1%) | 0 (0.0%) |
| Total | 3,703 (64.2%) | 89 (2.4%) |
Employment Status by Educational Attainment in Providence
According to labor force statistics for Providence, 78.5% of individuals (2,893) out of the total population between 25 and 64 years of age (3,685) are in the labor force, with 0.4% or 12 of them being unemployed. The group with the highest labor force participation rate are those with the educational attainment of high school diploma, with 86.5% or 594 individuals in the labor force. Within the labor force, individuals with bachelor's degree or higher education have the highest percentage of unemployment, with 0.9% or 12 of them being unemployed.
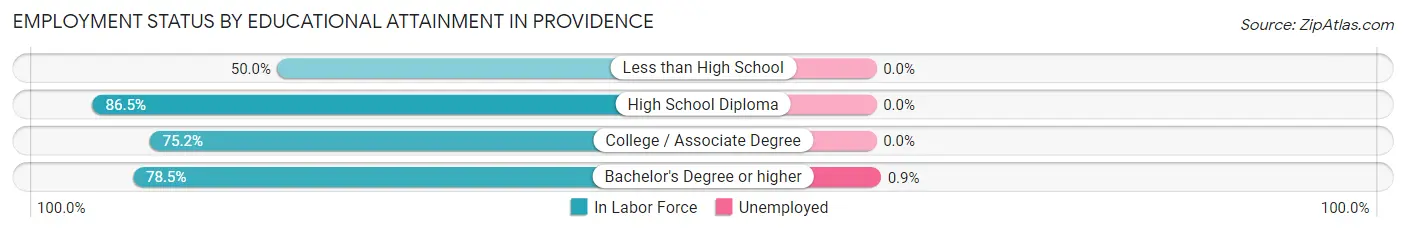
| Educational Attainment | In Labor Force | Unemployed |
| Less than High School | 28 (50.0%) | 0 (0.0%) |
| High School Diploma | 594 (86.5%) | 0 (0.0%) |
| College / Associate Degree | 896 (75.2%) | 0 (0.0%) |
| Bachelor's Degree or higher | 1,375 (78.5%) | 16 (0.9%) |
| Total | 2,893 (78.5%) | 15 (0.4%) |
Employment Occupations by Sex in Providence
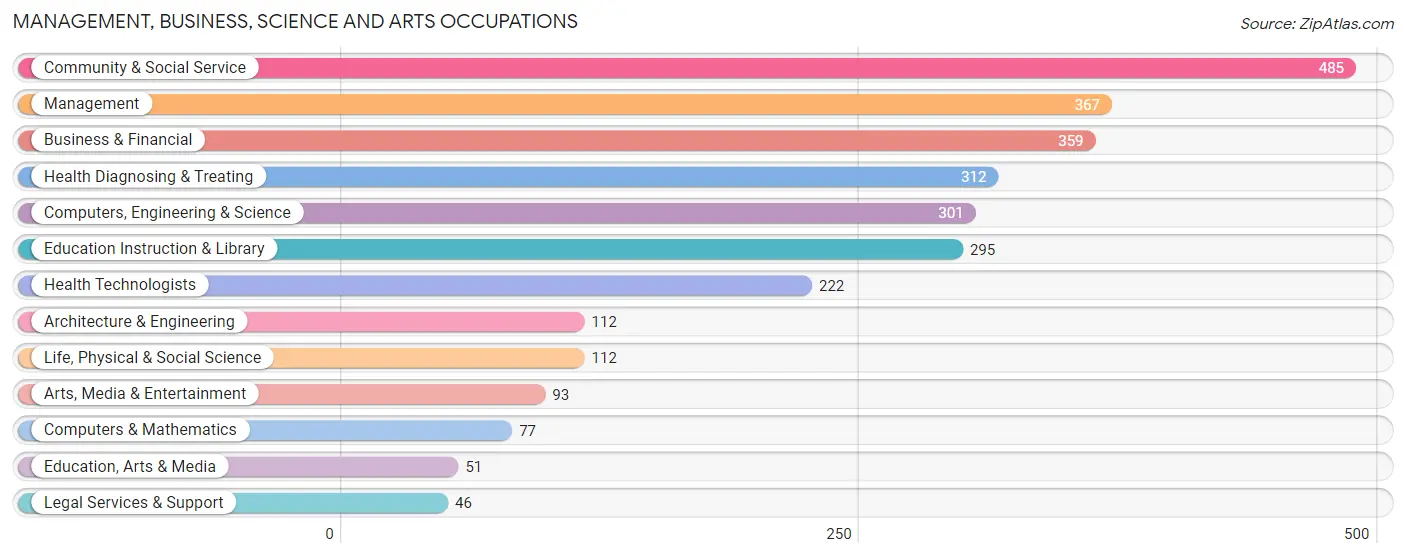
Management, Business, Science and Arts Occupations
The most common Management, Business, Science and Arts occupations in Providence are Community & Social Service (485 | 13.4%), Management (367 | 10.2%), Business & Financial (359 | 9.9%), Health Diagnosing & Treating (312 | 8.6%), and Computers, Engineering & Science (301 | 8.3%).
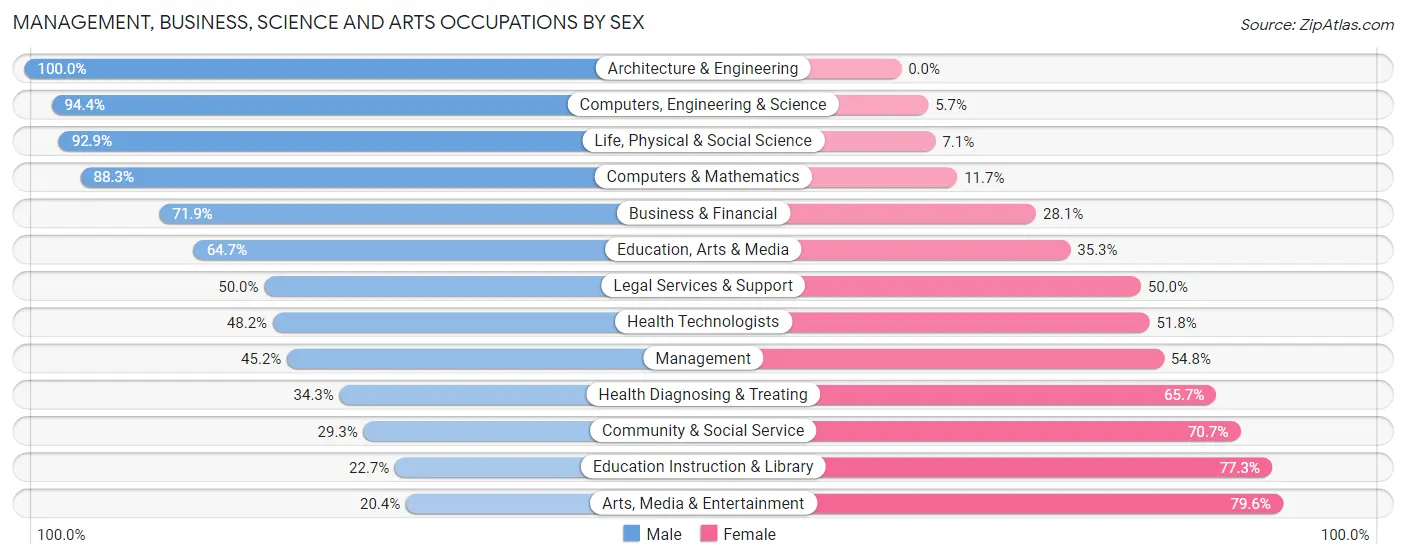
Management, Business, Science and Arts Occupations by Sex
Within the Management, Business, Science and Arts occupations in Providence, the most male-oriented occupations are Architecture & Engineering (100.0%), Computers, Engineering & Science (94.4%), and Life, Physical & Social Science (92.9%), while the most female-oriented occupations are Arts, Media & Entertainment (79.6%), Education Instruction & Library (77.3%), and Community & Social Service (70.7%).
| Occupation | Male | Female |
| Management | 166 (45.2%) | 201 (54.8%) |
| Business & Financial | 258 (71.9%) | 101 (28.1%) |
| Computers, Engineering & Science | 284 (94.4%) | 17 (5.7%) |
| Computers & Mathematics | 68 (88.3%) | 9 (11.7%) |
| Architecture & Engineering | 112 (100.0%) | 0 (0.0%) |
| Life, Physical & Social Science | 104 (92.9%) | 8 (7.1%) |
| Community & Social Service | 142 (29.3%) | 343 (70.7%) |
| Education, Arts & Media | 33 (64.7%) | 18 (35.3%) |
| Legal Services & Support | 23 (50.0%) | 23 (50.0%) |
| Education Instruction & Library | 67 (22.7%) | 228 (77.3%) |
| Arts, Media & Entertainment | 19 (20.4%) | 74 (79.6%) |
| Health Diagnosing & Treating | 107 (34.3%) | 205 (65.7%) |
| Health Technologists | 107 (48.2%) | 115 (51.8%) |
| Total (Category) | 957 (52.5%) | 867 (47.5%) |
| Total (Overall) | 1,941 (53.7%) | 1,672 (46.3%) |
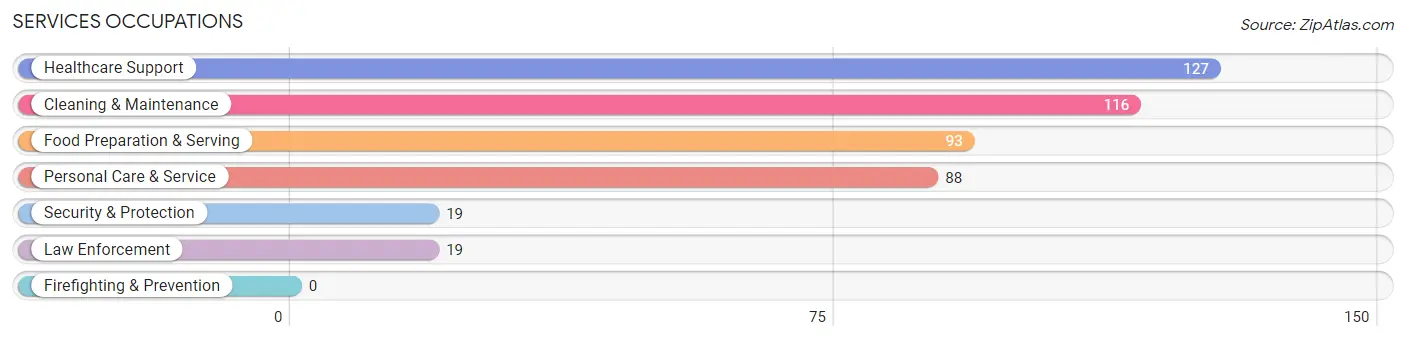
Services Occupations
The most common Services occupations in Providence are Healthcare Support (127 | 3.5%), Cleaning & Maintenance (116 | 3.2%), Food Preparation & Serving (93 | 2.6%), Personal Care & Service (88 | 2.4%), and Security & Protection (19 | 0.5%).
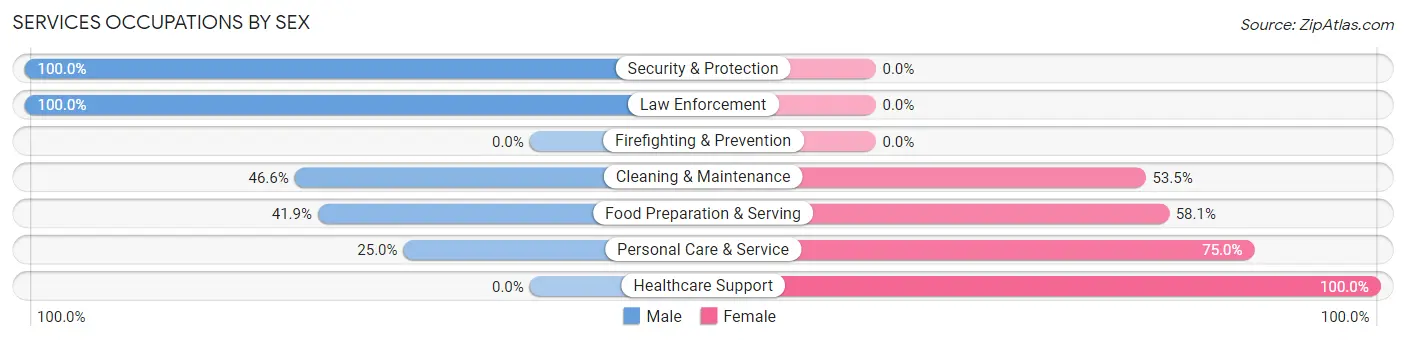
Services Occupations by Sex
Within the Services occupations in Providence, the most male-oriented occupations are Security & Protection (100.0%), Law Enforcement (100.0%), and Cleaning & Maintenance (46.6%), while the most female-oriented occupations are Healthcare Support (100.0%), Personal Care & Service (75.0%), and Food Preparation & Serving (58.1%).
| Occupation | Male | Female |
| Healthcare Support | 0 (0.0%) | 127 (100.0%) |
| Security & Protection | 19 (100.0%) | 0 (0.0%) |
| Firefighting & Prevention | 0 (0.0%) | 0 (0.0%) |
| Law Enforcement | 19 (100.0%) | 0 (0.0%) |
| Food Preparation & Serving | 39 (41.9%) | 54 (58.1%) |
| Cleaning & Maintenance | 54 (46.6%) | 62 (53.4%) |
| Personal Care & Service | 22 (25.0%) | 66 (75.0%) |
| Total (Category) | 134 (30.2%) | 309 (69.8%) |
| Total (Overall) | 1,941 (53.7%) | 1,672 (46.3%) |
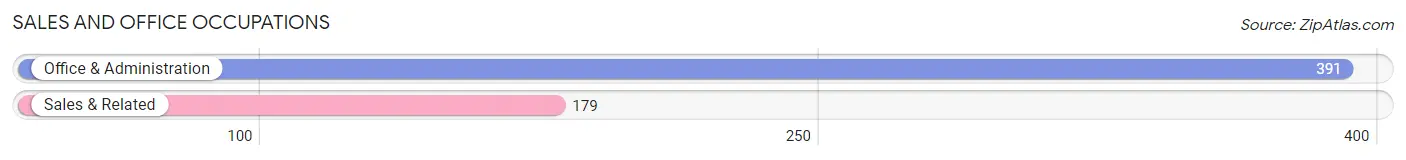
Sales and Office Occupations
The most common Sales and Office occupations in Providence are Office & Administration (391 | 10.8%), and Sales & Related (179 | 5.0%).
Sales and Office Occupations by Sex
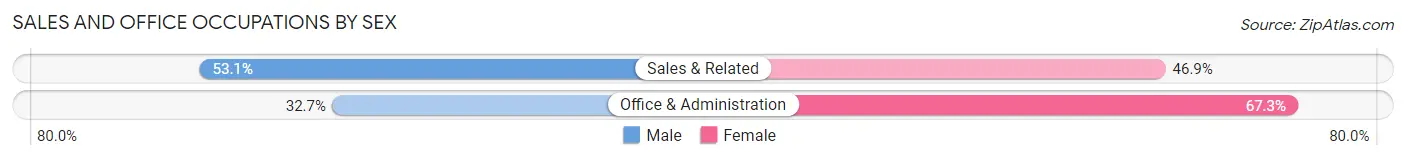
| Occupation | Male | Female |
| Sales & Related | 95 (53.1%) | 84 (46.9%) |
| Office & Administration | 128 (32.7%) | 263 (67.3%) |
| Total (Category) | 223 (39.1%) | 347 (60.9%) |
| Total (Overall) | 1,941 (53.7%) | 1,672 (46.3%) |
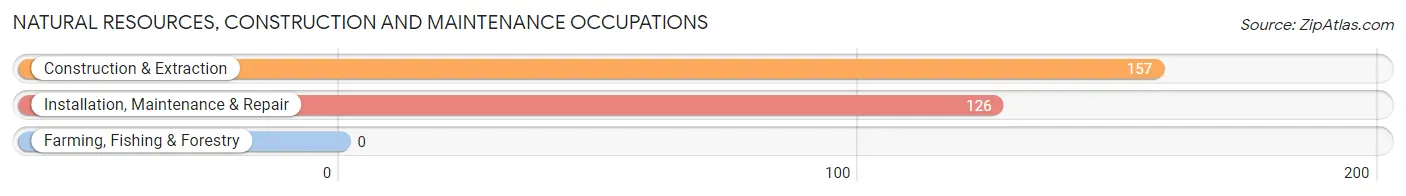
Natural Resources, Construction and Maintenance Occupations
The most common Natural Resources, Construction and Maintenance occupations in Providence are Construction & Extraction (157 | 4.3%), and Installation, Maintenance & Repair (126 | 3.5%).
Natural Resources, Construction and Maintenance Occupations by Sex

| Occupation | Male | Female |
| Farming, Fishing & Forestry | 0 (0.0%) | 0 (0.0%) |
| Construction & Extraction | 148 (94.3%) | 9 (5.7%) |
| Installation, Maintenance & Repair | 126 (100.0%) | 0 (0.0%) |
| Total (Category) | 274 (96.8%) | 9 (3.2%) |
| Total (Overall) | 1,941 (53.7%) | 1,672 (46.3%) |
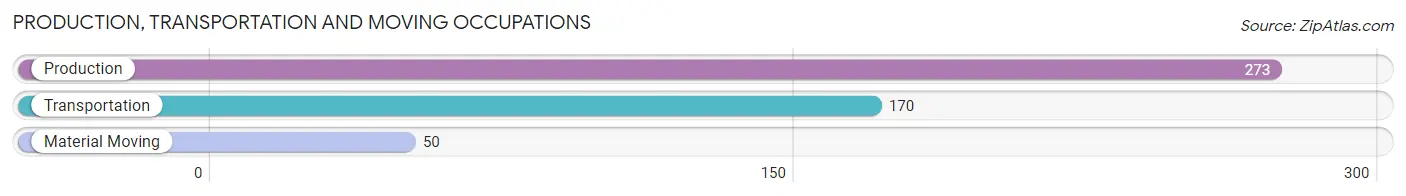
Production, Transportation and Moving Occupations
The most common Production, Transportation and Moving occupations in Providence are Production (273 | 7.6%), Transportation (170 | 4.7%), and Material Moving (50 | 1.4%).
Production, Transportation and Moving Occupations by Sex
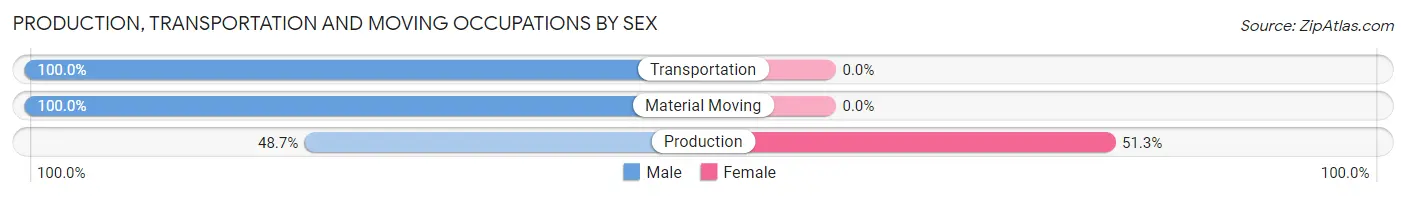
| Occupation | Male | Female |
| Production | 133 (48.7%) | 140 (51.3%) |
| Transportation | 170 (100.0%) | 0 (0.0%) |
| Material Moving | 50 (100.0%) | 0 (0.0%) |
| Total (Category) | 353 (71.6%) | 140 (28.4%) |
| Total (Overall) | 1,941 (53.7%) | 1,672 (46.3%) |
Employment Industries by Sex in Providence
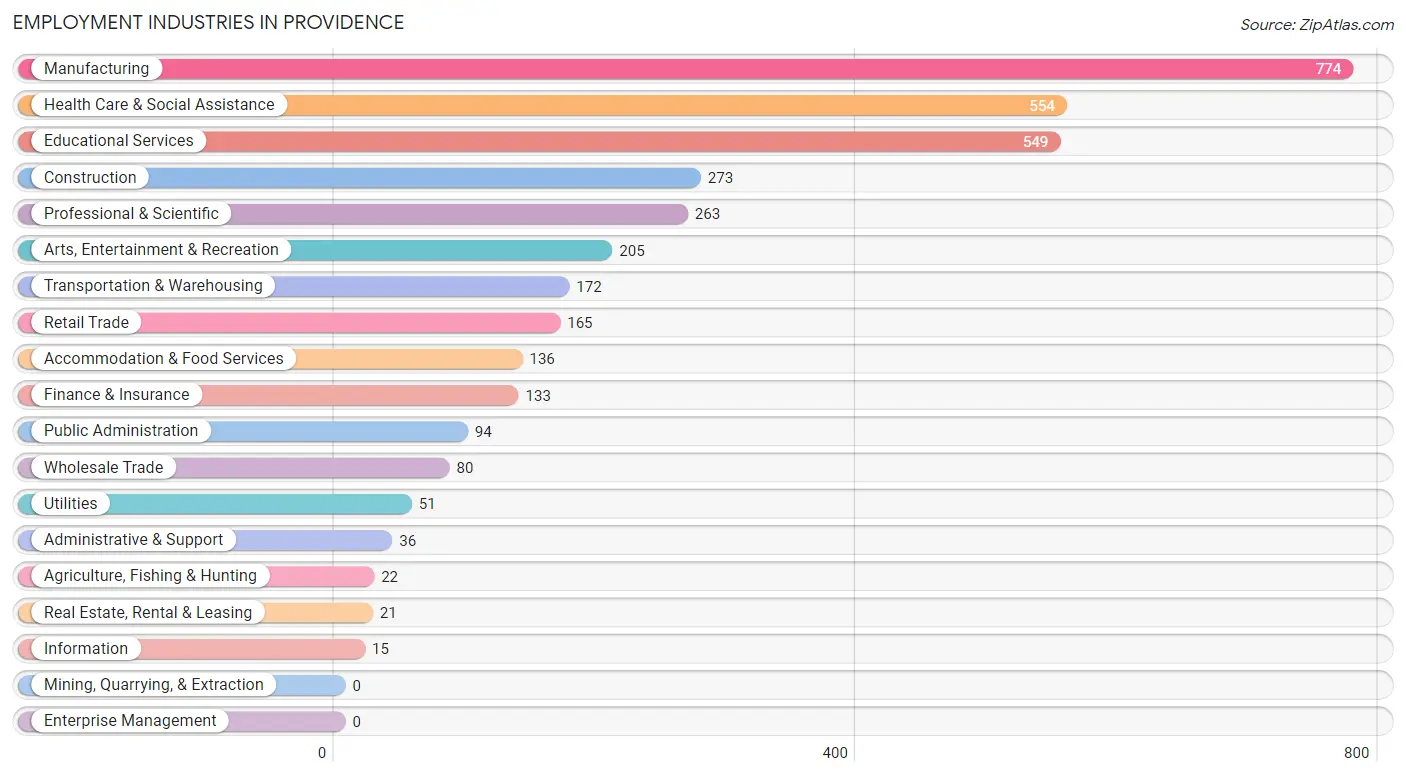
Employment Industries in Providence
The major employment industries in Providence include Manufacturing (774 | 21.4%), Health Care & Social Assistance (554 | 15.3%), Educational Services (549 | 15.2%), Construction (273 | 7.6%), and Professional & Scientific (263 | 7.3%).
Employment Industries by Sex in Providence
The Providence industries that see more men than women are Agriculture, Fishing & Hunting (100.0%), Transportation & Warehousing (92.4%), and Construction (89.4%), whereas the industries that tend to have a higher number of women are Arts, Entertainment & Recreation (75.1%), Health Care & Social Assistance (73.8%), and Real Estate, Rental & Leasing (66.7%).
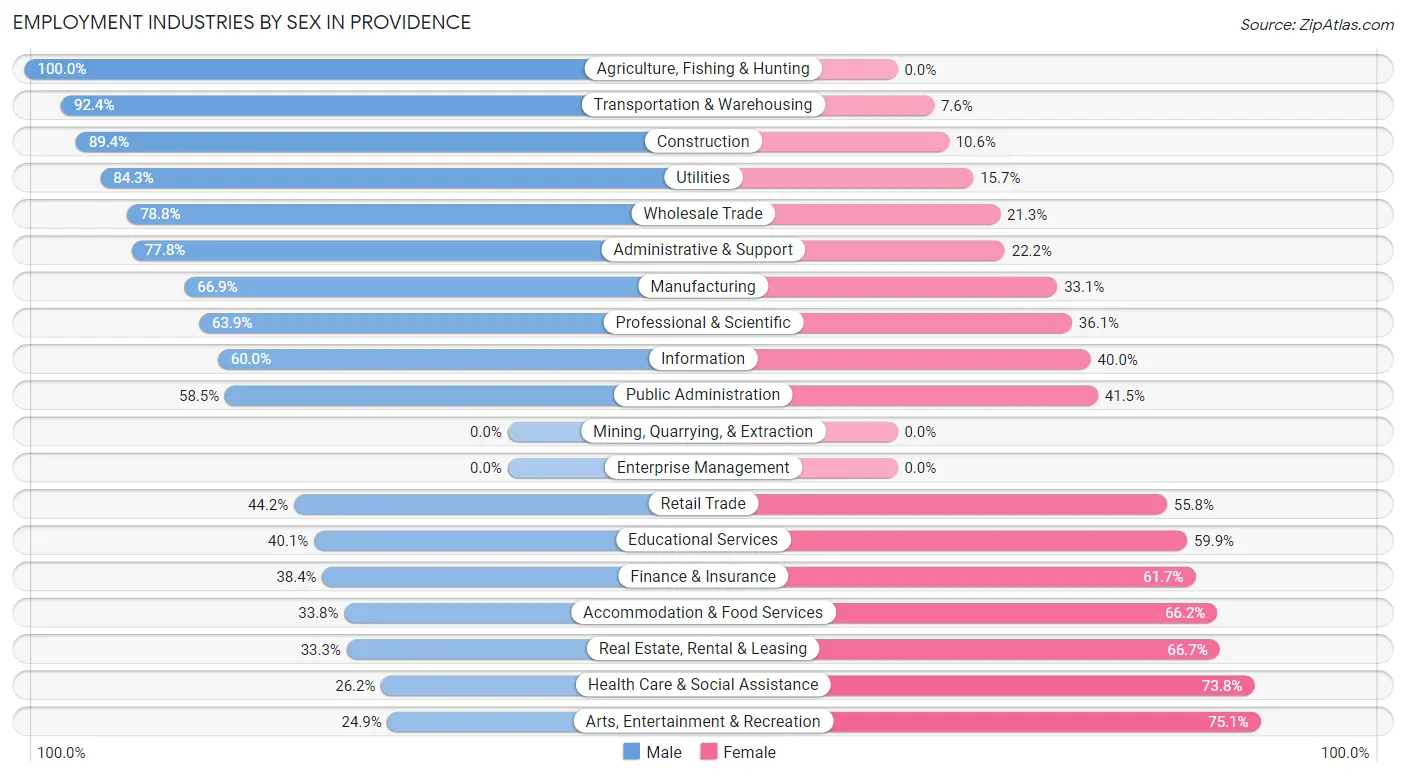
| Industry | Male | Female |
| Agriculture, Fishing & Hunting | 22 (100.0%) | 0 (0.0%) |
| Mining, Quarrying, & Extraction | 0 (0.0%) | 0 (0.0%) |
| Construction | 244 (89.4%) | 29 (10.6%) |
| Manufacturing | 518 (66.9%) | 256 (33.1%) |
| Wholesale Trade | 63 (78.7%) | 17 (21.2%) |
| Retail Trade | 73 (44.2%) | 92 (55.8%) |
| Transportation & Warehousing | 159 (92.4%) | 13 (7.6%) |
| Utilities | 43 (84.3%) | 8 (15.7%) |
| Information | 9 (60.0%) | 6 (40.0%) |
| Finance & Insurance | 51 (38.4%) | 82 (61.7%) |
| Real Estate, Rental & Leasing | 7 (33.3%) | 14 (66.7%) |
| Professional & Scientific | 168 (63.9%) | 95 (36.1%) |
| Enterprise Management | 0 (0.0%) | 0 (0.0%) |
| Administrative & Support | 28 (77.8%) | 8 (22.2%) |
| Educational Services | 220 (40.1%) | 329 (59.9%) |
| Health Care & Social Assistance | 145 (26.2%) | 409 (73.8%) |
| Arts, Entertainment & Recreation | 51 (24.9%) | 154 (75.1%) |
| Accommodation & Food Services | 46 (33.8%) | 90 (66.2%) |
| Public Administration | 55 (58.5%) | 39 (41.5%) |
| Total | 1,941 (53.7%) | 1,672 (46.3%) |
Education in Providence
School Enrollment in Providence
The most common levels of schooling among the 2,914 students in Providence are middle school (772 | 26.5%), elementary school (747 | 25.6%), and high school (567 | 19.5%).
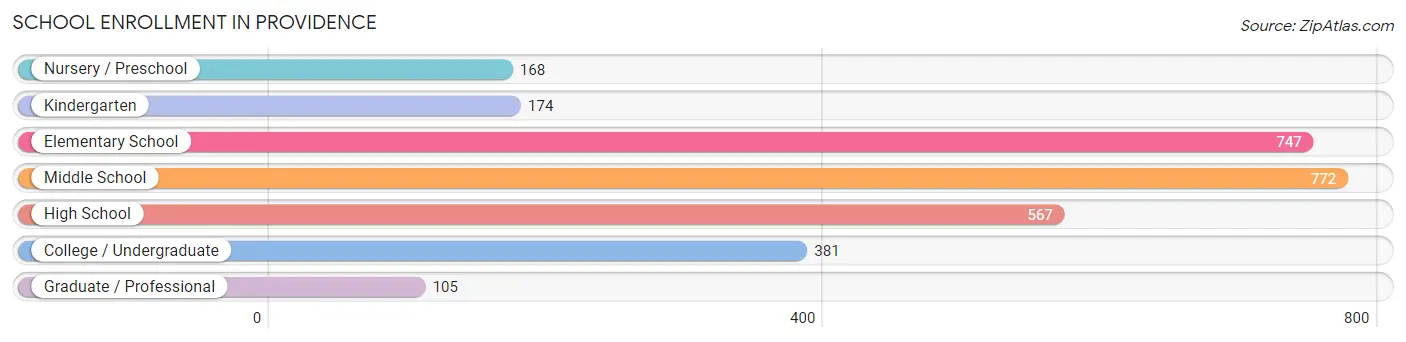
| School Level | # Students | % Students |
| Nursery / Preschool | 168 | 5.8% |
| Kindergarten | 174 | 6.0% |
| Elementary School | 747 | 25.6% |
| Middle School | 772 | 26.5% |
| High School | 567 | 19.5% |
| College / Undergraduate | 381 | 13.1% |
| Graduate / Professional | 105 | 3.6% |
| Total | 2,914 | 100.0% |
School Enrollment by Age by Funding Source in Providence
Out of a total of 2,914 students who are enrolled in schools in Providence, 140 (4.8%) attend a private institution, while the remaining 2,774 (95.2%) are enrolled in public schools. The age group of 3 to 4 year olds has the highest likelihood of being enrolled in private schools, with 41 (58.6% in the age bracket) enrolled. Conversely, the age group of 15 to 17 year olds has the lowest likelihood of being enrolled in a private school, with 436 (100.0% in the age bracket) attending a public institution.
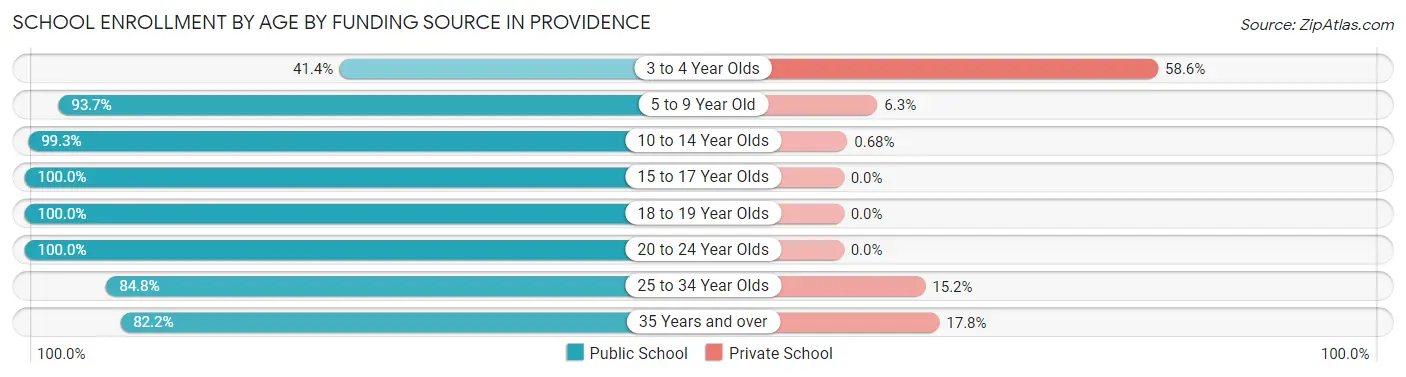
| Age Bracket | Public School | Private School |
| 3 to 4 Year Olds | 29 (41.4%) | 41 (58.6%) |
| 5 to 9 Year Old | 910 (93.7%) | 61 (6.3%) |
| 10 to 14 Year Olds | 881 (99.3%) | 6 (0.7%) |
| 15 to 17 Year Olds | 436 (100.0%) | 0 (0.0%) |
| 18 to 19 Year Olds | 169 (100.0%) | 0 (0.0%) |
| 20 to 24 Year Olds | 188 (100.0%) | 0 (0.0%) |
| 25 to 34 Year Olds | 78 (84.8%) | 14 (15.2%) |
| 35 Years and over | 83 (82.2%) | 18 (17.8%) |
| Total | 2,774 (95.2%) | 140 (4.8%) |
Educational Attainment by Field of Study in Providence
Business (383 | 16.0%), social sciences (300 | 12.5%), education (271 | 11.3%), science & technology (257 | 10.7%), and arts & humanities (247 | 10.3%) are the most common fields of study among 2,394 individuals in Providence who have obtained a bachelor's degree or higher.
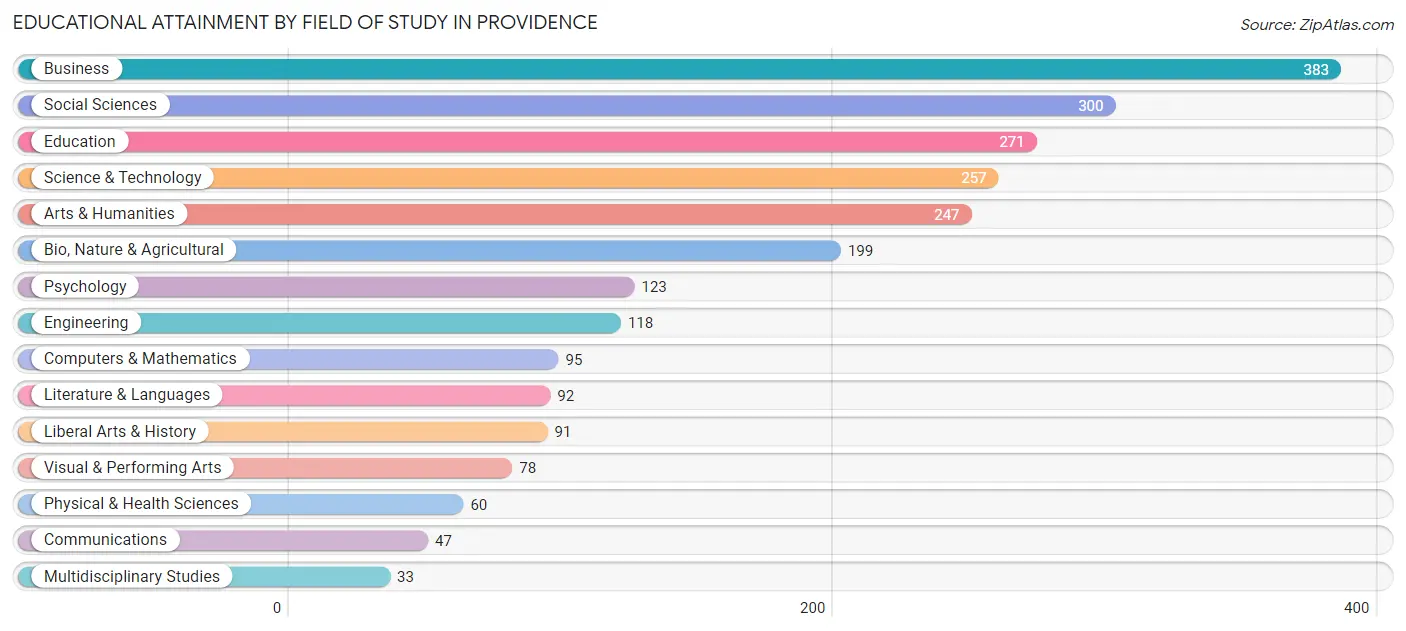
| Field of Study | # Graduates | % Graduates |
| Computers & Mathematics | 95 | 4.0% |
| Bio, Nature & Agricultural | 199 | 8.3% |
| Physical & Health Sciences | 60 | 2.5% |
| Psychology | 123 | 5.1% |
| Social Sciences | 300 | 12.5% |
| Engineering | 118 | 4.9% |
| Multidisciplinary Studies | 33 | 1.4% |
| Science & Technology | 257 | 10.7% |
| Business | 383 | 16.0% |
| Education | 271 | 11.3% |
| Literature & Languages | 92 | 3.8% |
| Liberal Arts & History | 91 | 3.8% |
| Visual & Performing Arts | 78 | 3.3% |
| Communications | 47 | 2.0% |
| Arts & Humanities | 247 | 10.3% |
| Total | 2,394 | 100.0% |
Transportation & Commute in Providence
Vehicle Availability by Sex in Providence
The most prevalent vehicle ownership categories in Providence are males with 2 vehicles (950, accounting for 49.3%) and females with 2 vehicles (822, making up 57.8%).
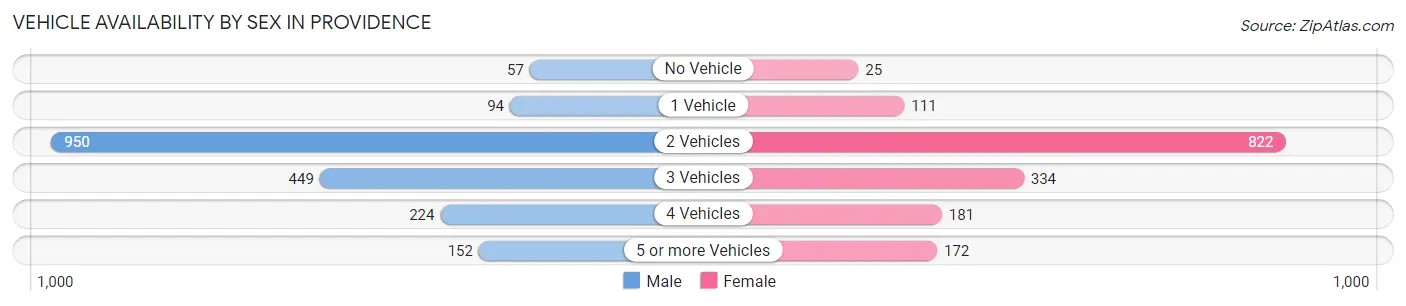
| Vehicles Available | Male | Female |
| No Vehicle | 57 (3.0%) | 25 (1.5%) |
| 1 Vehicle | 94 (4.9%) | 111 (6.8%) |
| 2 Vehicles | 950 (49.3%) | 822 (50.0%) |
| 3 Vehicles | 449 (23.3%) | 334 (20.3%) |
| 4 Vehicles | 224 (11.6%) | 181 (11.0%) |
| 5 or more Vehicles | 152 (7.9%) | 172 (10.5%) |
| Total | 1,926 (100.0%) | 1,645 (100.0%) |
Commute Time in Providence
The most frequently occuring commute durations in Providence are 10 to 14 minutes (924 commuters, 29.3%), 15 to 19 minutes (670 commuters, 21.3%), and 5 to 9 minutes (513 commuters, 16.3%).
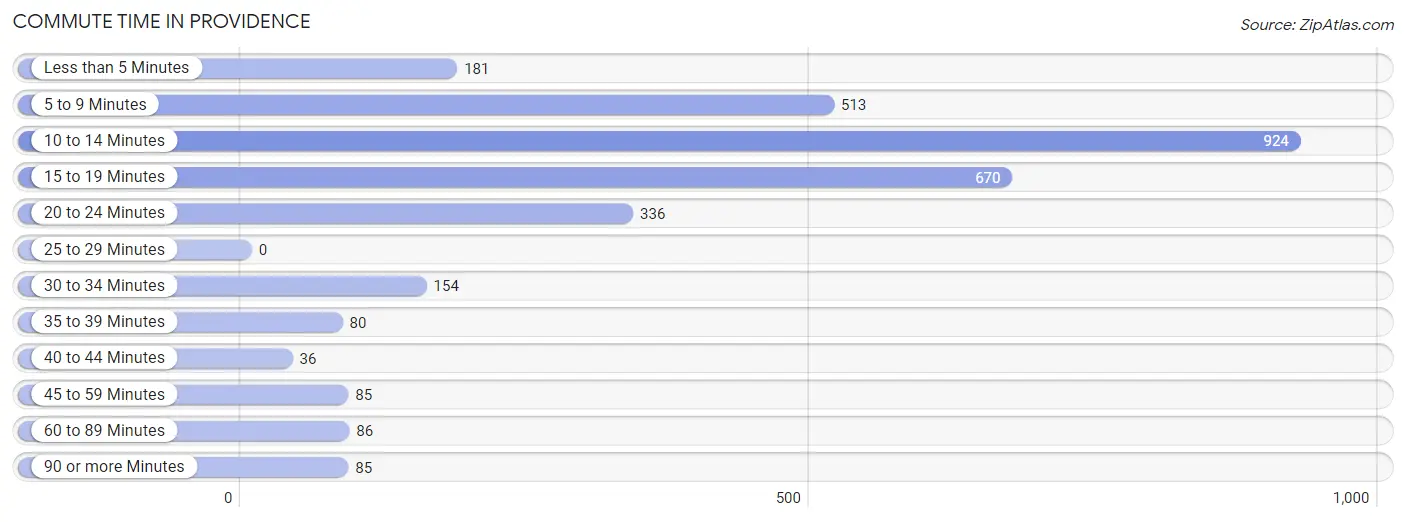
| Commute Time | # Commuters | % Commuters |
| Less than 5 Minutes | 181 | 5.8% |
| 5 to 9 Minutes | 513 | 16.3% |
| 10 to 14 Minutes | 924 | 29.3% |
| 15 to 19 Minutes | 670 | 21.3% |
| 20 to 24 Minutes | 336 | 10.7% |
| 25 to 29 Minutes | 0 | 0.0% |
| 30 to 34 Minutes | 154 | 4.9% |
| 35 to 39 Minutes | 80 | 2.5% |
| 40 to 44 Minutes | 36 | 1.1% |
| 45 to 59 Minutes | 85 | 2.7% |
| 60 to 89 Minutes | 86 | 2.7% |
| 90 or more Minutes | 85 | 2.7% |
Commute Time by Sex in Providence
The most common commute times in Providence are 10 to 14 minutes (408 commuters, 24.2%) for males and 10 to 14 minutes (516 commuters, 35.3%) for females.
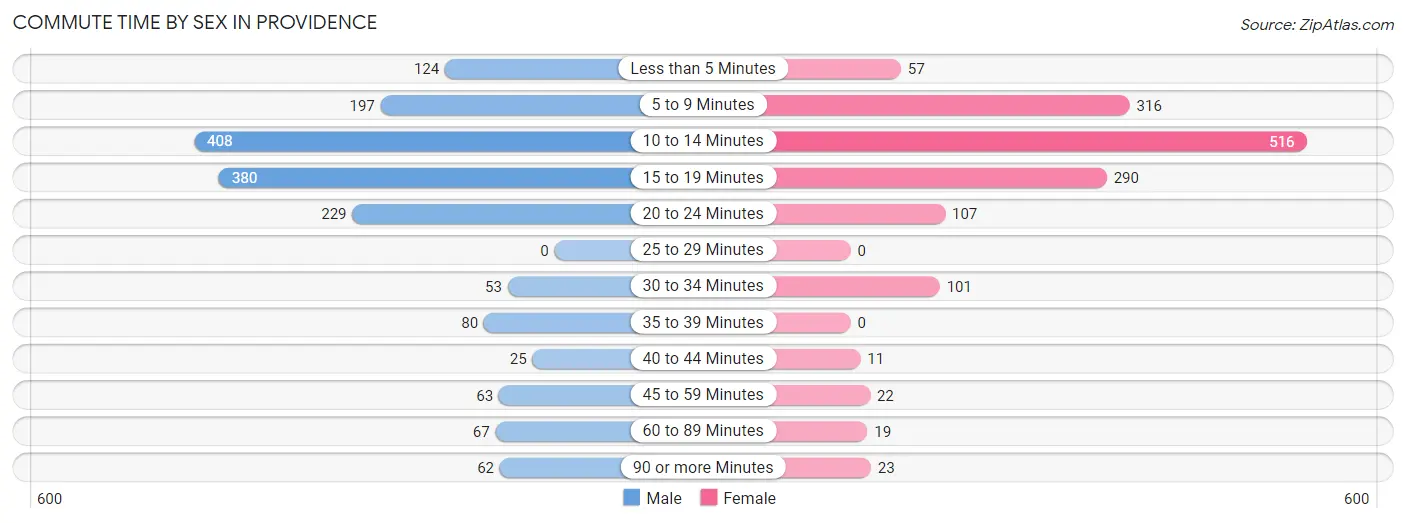
| Commute Time | Male | Female |
| Less than 5 Minutes | 124 (7.3%) | 57 (3.9%) |
| 5 to 9 Minutes | 197 (11.7%) | 316 (21.6%) |
| 10 to 14 Minutes | 408 (24.2%) | 516 (35.3%) |
| 15 to 19 Minutes | 380 (22.5%) | 290 (19.8%) |
| 20 to 24 Minutes | 229 (13.6%) | 107 (7.3%) |
| 25 to 29 Minutes | 0 (0.0%) | 0 (0.0%) |
| 30 to 34 Minutes | 53 (3.1%) | 101 (6.9%) |
| 35 to 39 Minutes | 80 (4.7%) | 0 (0.0%) |
| 40 to 44 Minutes | 25 (1.5%) | 11 (0.7%) |
| 45 to 59 Minutes | 63 (3.7%) | 22 (1.5%) |
| 60 to 89 Minutes | 67 (4.0%) | 19 (1.3%) |
| 90 or more Minutes | 62 (3.7%) | 23 (1.6%) |
Time of Departure to Work by Sex in Providence
The most frequent times of departure to work in Providence are 7:00 AM to 7:29 AM (243, 14.4%) for males and 7:30 AM to 7:59 AM (339, 23.2%) for females.
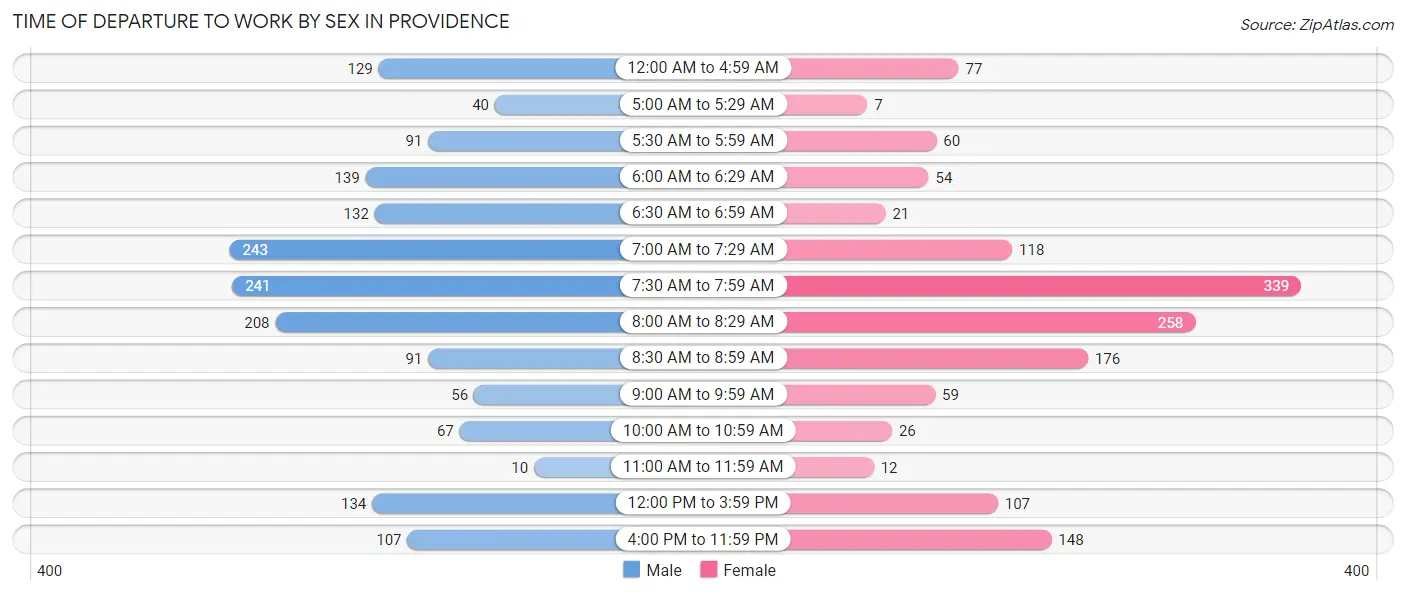
| Time of Departure | Male | Female |
| 12:00 AM to 4:59 AM | 129 (7.6%) | 77 (5.3%) |
| 5:00 AM to 5:29 AM | 40 (2.4%) | 7 (0.5%) |
| 5:30 AM to 5:59 AM | 91 (5.4%) | 60 (4.1%) |
| 6:00 AM to 6:29 AM | 139 (8.2%) | 54 (3.7%) |
| 6:30 AM to 6:59 AM | 132 (7.8%) | 21 (1.4%) |
| 7:00 AM to 7:29 AM | 243 (14.4%) | 118 (8.1%) |
| 7:30 AM to 7:59 AM | 241 (14.3%) | 339 (23.2%) |
| 8:00 AM to 8:29 AM | 208 (12.3%) | 258 (17.6%) |
| 8:30 AM to 8:59 AM | 91 (5.4%) | 176 (12.0%) |
| 9:00 AM to 9:59 AM | 56 (3.3%) | 59 (4.0%) |
| 10:00 AM to 10:59 AM | 67 (4.0%) | 26 (1.8%) |
| 11:00 AM to 11:59 AM | 10 (0.6%) | 12 (0.8%) |
| 12:00 PM to 3:59 PM | 134 (7.9%) | 107 (7.3%) |
| 4:00 PM to 11:59 PM | 107 (6.3%) | 148 (10.1%) |
| Total | 1,688 (100.0%) | 1,462 (100.0%) |
Housing Occupancy in Providence
Occupancy by Ownership in Providence
Of the total 2,581 dwellings in Providence, owner-occupied units account for 2,242 (86.9%), while renter-occupied units make up 339 (13.1%).
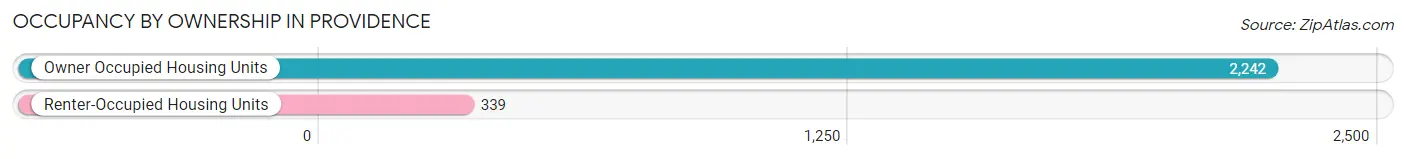
| Occupancy | # Housing Units | % Housing Units |
| Owner Occupied Housing Units | 2,242 | 86.9% |
| Renter-Occupied Housing Units | 339 | 13.1% |
| Total Occupied Housing Units | 2,581 | 100.0% |
Occupancy by Household Size in Providence
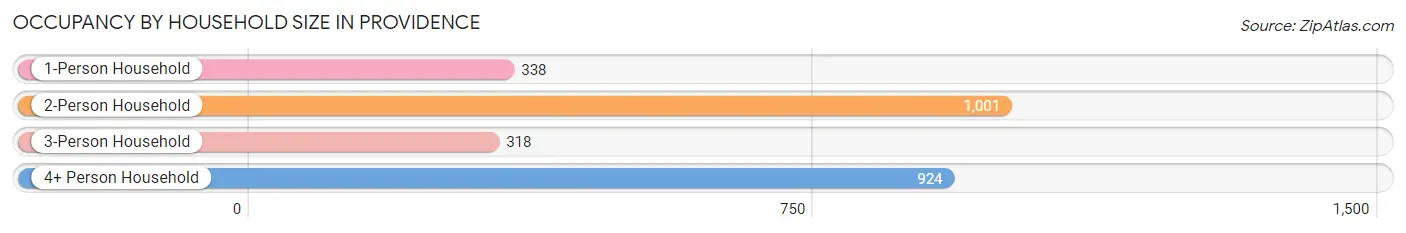
| Household Size | # Housing Units | % Housing Units |
| 1-Person Household | 338 | 13.1% |
| 2-Person Household | 1,001 | 38.8% |
| 3-Person Household | 318 | 12.3% |
| 4+ Person Household | 924 | 35.8% |
| Total Housing Units | 2,581 | 100.0% |
Occupancy by Ownership by Household Size in Providence
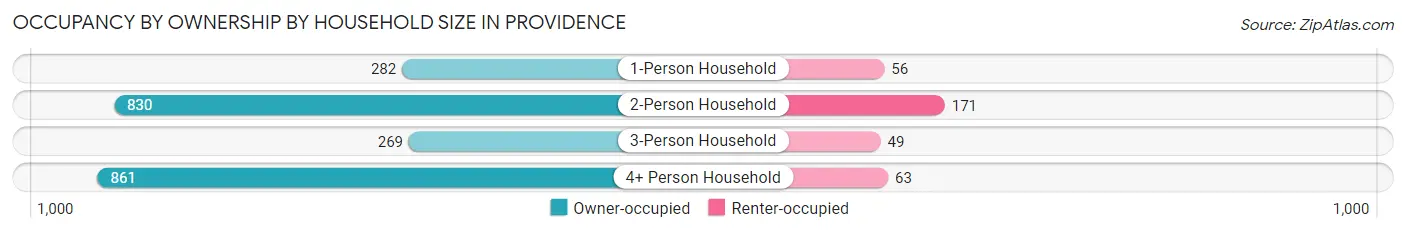
| Household Size | Owner-occupied | Renter-occupied |
| 1-Person Household | 282 (83.4%) | 56 (16.6%) |
| 2-Person Household | 830 (82.9%) | 171 (17.1%) |
| 3-Person Household | 269 (84.6%) | 49 (15.4%) |
| 4+ Person Household | 861 (93.2%) | 63 (6.8%) |
| Total Housing Units | 2,242 (86.9%) | 339 (13.1%) |
Occupancy by Educational Attainment in Providence
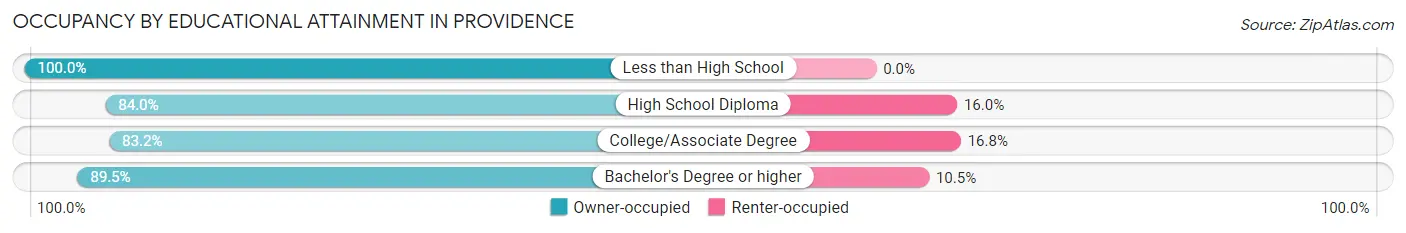
| Household Size | Owner-occupied | Renter-occupied |
| Less than High School | 17 (100.0%) | 0 (0.0%) |
| High School Diploma | 283 (84.0%) | 54 (16.0%) |
| College/Associate Degree | 685 (83.2%) | 138 (16.8%) |
| Bachelor's Degree or higher | 1,257 (89.5%) | 147 (10.5%) |
Occupancy by Age of Householder in Providence
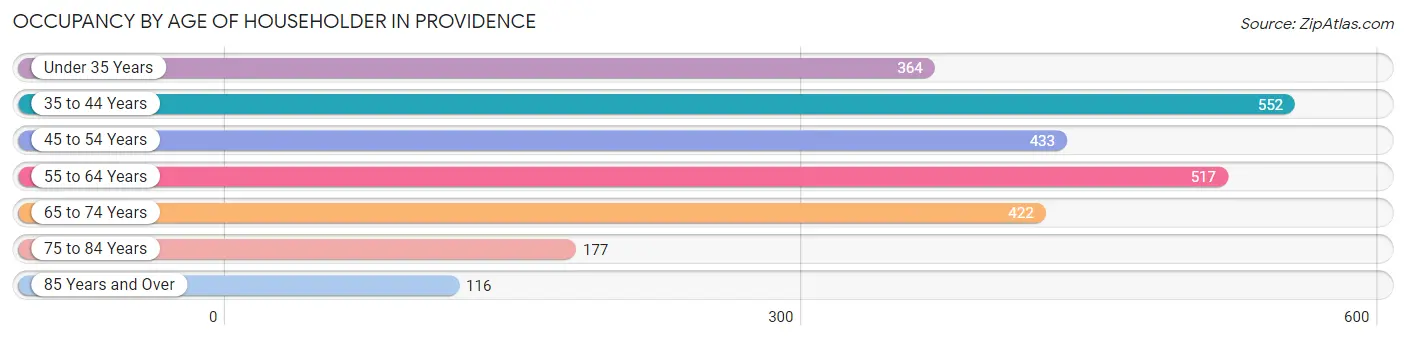
| Age Bracket | # Households | % Households |
| Under 35 Years | 364 | 14.1% |
| 35 to 44 Years | 552 | 21.4% |
| 45 to 54 Years | 433 | 16.8% |
| 55 to 64 Years | 517 | 20.0% |
| 65 to 74 Years | 422 | 16.4% |
| 75 to 84 Years | 177 | 6.9% |
| 85 Years and Over | 116 | 4.5% |
| Total | 2,581 | 100.0% |
Housing Finances in Providence
Median Income by Occupancy in Providence
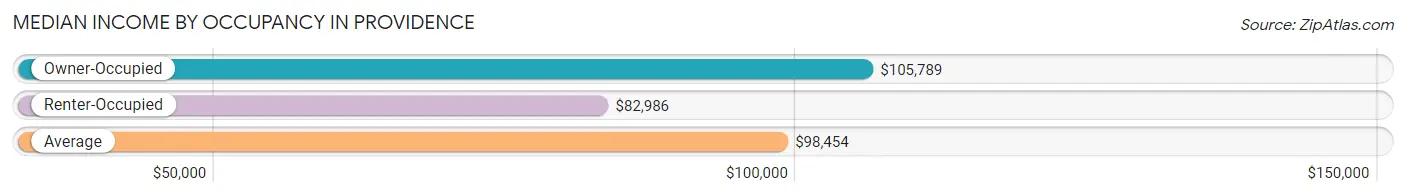
| Occupancy Type | # Households | Median Income |
| Owner-Occupied | 2,242 (86.9%) | $105,789 |
| Renter-Occupied | 339 (13.1%) | $82,986 |
| Average | 2,581 (100.0%) | $98,454 |
Occupancy by Householder Income Bracket in Providence
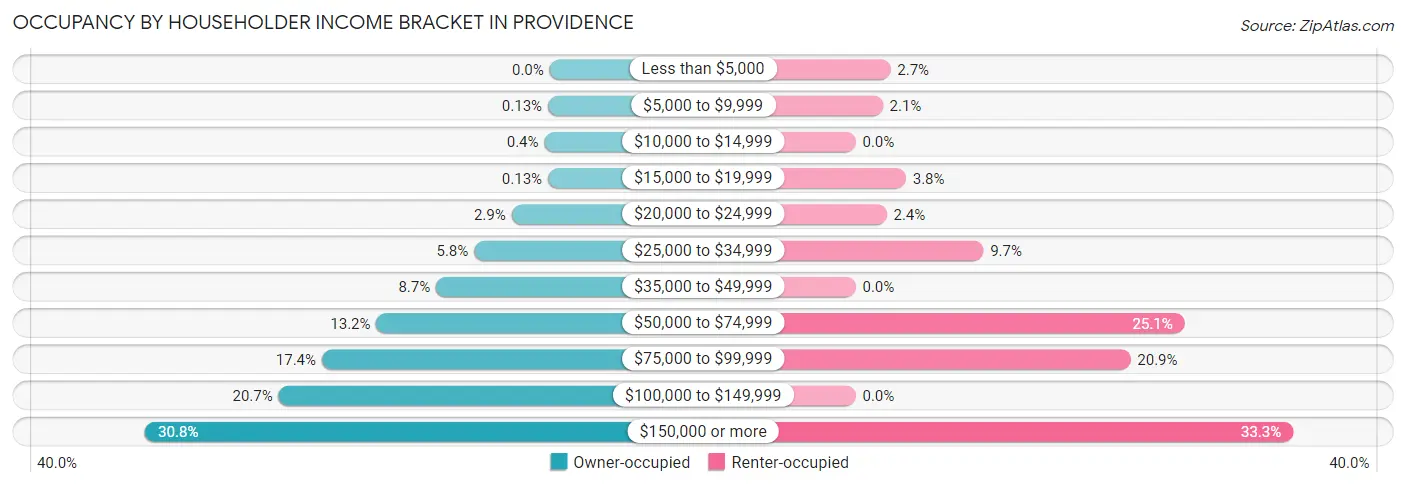
| Income Bracket | Owner-occupied | Renter-occupied |
| Less than $5,000 | 0 (0.0%) | 9 (2.6%) |
| $5,000 to $9,999 | 3 (0.1%) | 7 (2.1%) |
| $10,000 to $14,999 | 9 (0.4%) | 0 (0.0%) |
| $15,000 to $19,999 | 3 (0.1%) | 13 (3.8%) |
| $20,000 to $24,999 | 65 (2.9%) | 8 (2.4%) |
| $25,000 to $34,999 | 129 (5.8%) | 33 (9.7%) |
| $35,000 to $49,999 | 194 (8.6%) | 0 (0.0%) |
| $50,000 to $74,999 | 296 (13.2%) | 85 (25.1%) |
| $75,000 to $99,999 | 389 (17.3%) | 71 (20.9%) |
| $100,000 to $149,999 | 463 (20.6%) | 0 (0.0%) |
| $150,000 or more | 691 (30.8%) | 113 (33.3%) |
| Total | 2,242 (100.0%) | 339 (100.0%) |
Monthly Housing Cost Tiers in Providence
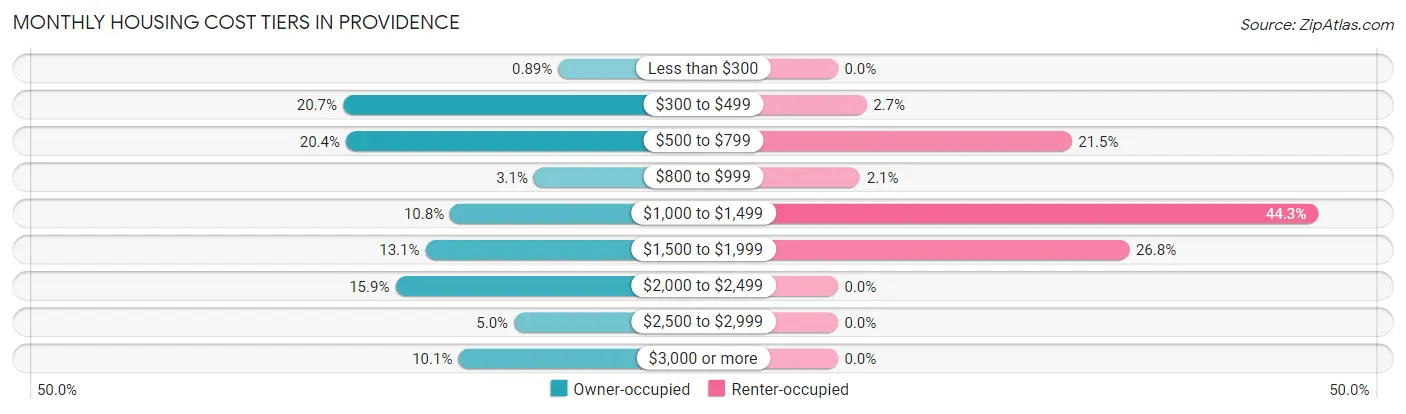
| Monthly Cost | Owner-occupied | Renter-occupied |
| Less than $300 | 20 (0.9%) | 0 (0.0%) |
| $300 to $499 | 464 (20.7%) | 9 (2.6%) |
| $500 to $799 | 458 (20.4%) | 73 (21.5%) |
| $800 to $999 | 70 (3.1%) | 7 (2.1%) |
| $1,000 to $1,499 | 243 (10.8%) | 150 (44.3%) |
| $1,500 to $1,999 | 294 (13.1%) | 91 (26.8%) |
| $2,000 to $2,499 | 356 (15.9%) | 0 (0.0%) |
| $2,500 to $2,999 | 111 (5.0%) | 0 (0.0%) |
| $3,000 or more | 226 (10.1%) | 0 (0.0%) |
| Total | 2,242 (100.0%) | 339 (100.0%) |
Physical Housing Characteristics in Providence
Housing Structures in Providence
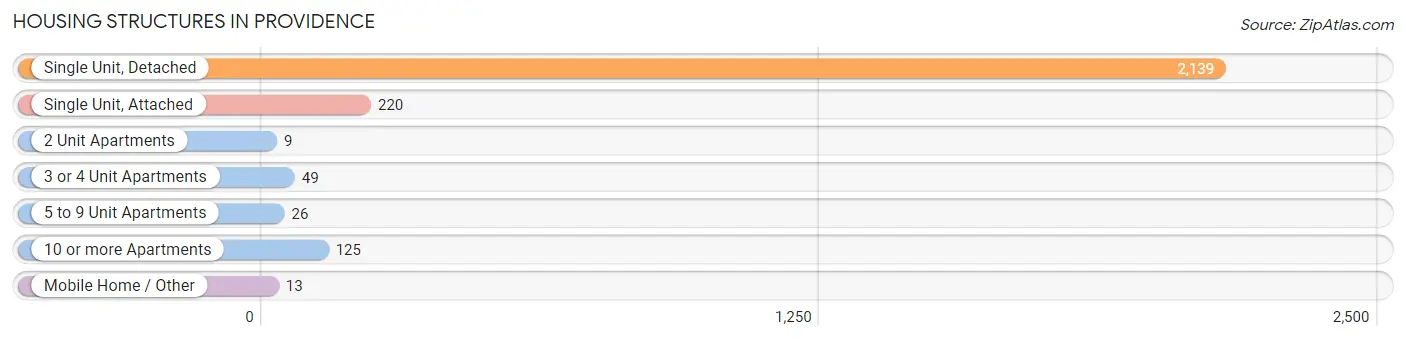
| Structure Type | # Housing Units | % Housing Units |
| Single Unit, Detached | 2,139 | 82.9% |
| Single Unit, Attached | 220 | 8.5% |
| 2 Unit Apartments | 9 | 0.4% |
| 3 or 4 Unit Apartments | 49 | 1.9% |
| 5 to 9 Unit Apartments | 26 | 1.0% |
| 10 or more Apartments | 125 | 4.8% |
| Mobile Home / Other | 13 | 0.5% |
| Total | 2,581 | 100.0% |
Housing Structures by Occupancy in Providence
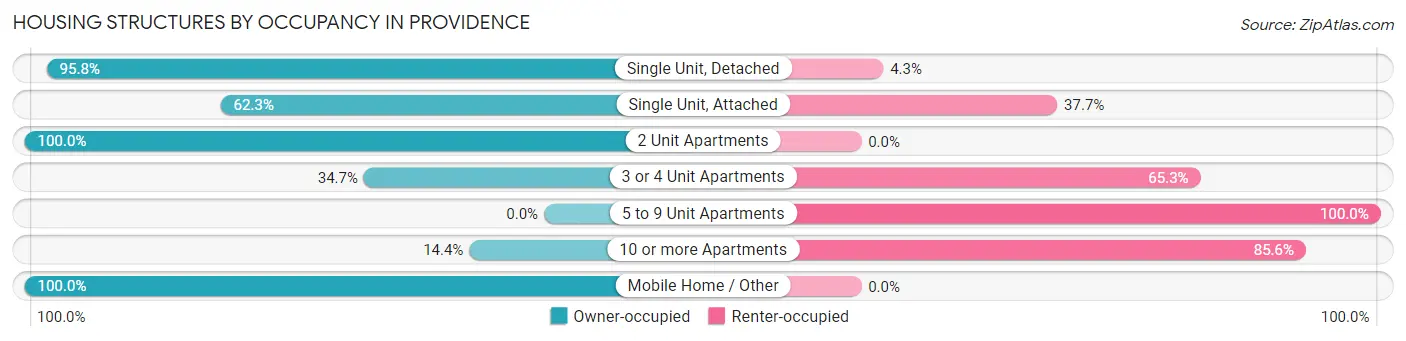
| Structure Type | Owner-occupied | Renter-occupied |
| Single Unit, Detached | 2,048 (95.8%) | 91 (4.3%) |
| Single Unit, Attached | 137 (62.3%) | 83 (37.7%) |
| 2 Unit Apartments | 9 (100.0%) | 0 (0.0%) |
| 3 or 4 Unit Apartments | 17 (34.7%) | 32 (65.3%) |
| 5 to 9 Unit Apartments | 0 (0.0%) | 26 (100.0%) |
| 10 or more Apartments | 18 (14.4%) | 107 (85.6%) |
| Mobile Home / Other | 13 (100.0%) | 0 (0.0%) |
| Total | 2,242 (86.9%) | 339 (13.1%) |
Housing Structures by Number of Rooms in Providence
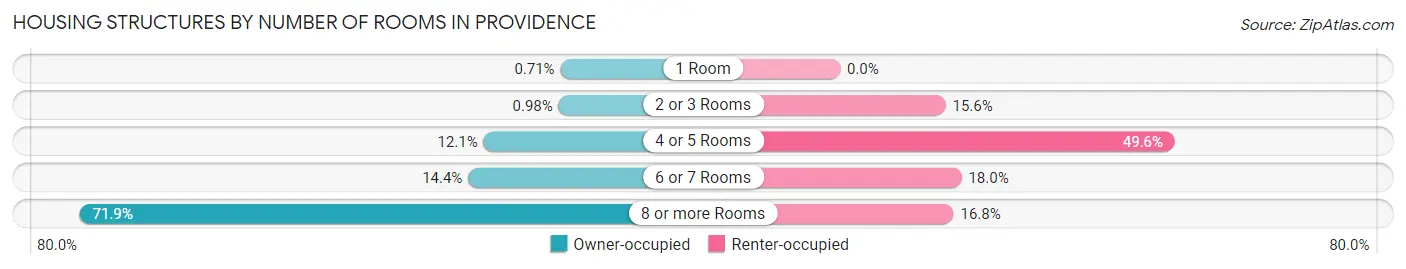
| Number of Rooms | Owner-occupied | Renter-occupied |
| 1 Room | 16 (0.7%) | 0 (0.0%) |
| 2 or 3 Rooms | 22 (1.0%) | 53 (15.6%) |
| 4 or 5 Rooms | 271 (12.1%) | 168 (49.6%) |
| 6 or 7 Rooms | 322 (14.4%) | 61 (18.0%) |
| 8 or more Rooms | 1,611 (71.9%) | 57 (16.8%) |
| Total | 2,242 (100.0%) | 339 (100.0%) |
Housing Structure by Heating Type in Providence
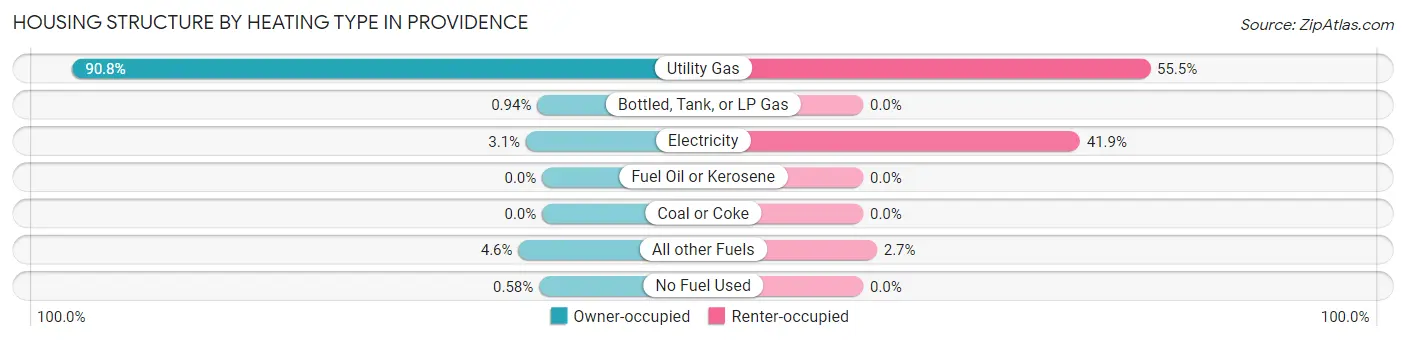
| Heating Type | Owner-occupied | Renter-occupied |
| Utility Gas | 2,035 (90.8%) | 188 (55.5%) |
| Bottled, Tank, or LP Gas | 21 (0.9%) | 0 (0.0%) |
| Electricity | 70 (3.1%) | 142 (41.9%) |
| Fuel Oil or Kerosene | 0 (0.0%) | 0 (0.0%) |
| Coal or Coke | 0 (0.0%) | 0 (0.0%) |
| All other Fuels | 103 (4.6%) | 9 (2.6%) |
| No Fuel Used | 13 (0.6%) | 0 (0.0%) |
| Total | 2,242 (100.0%) | 339 (100.0%) |
Household Vehicle Usage in Providence
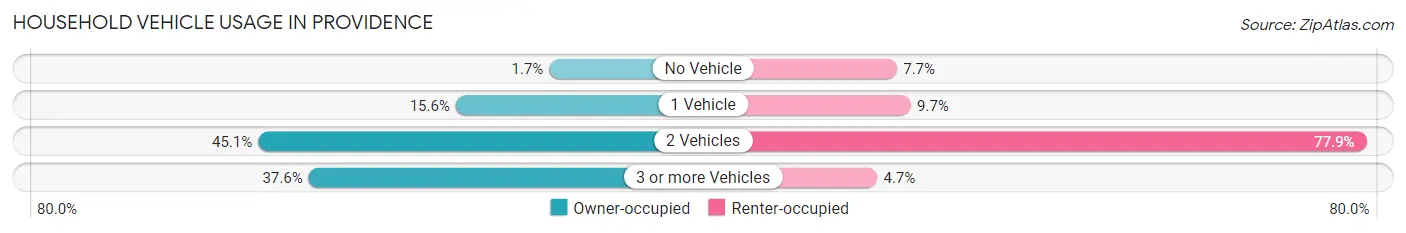
| Vehicles per Household | Owner-occupied | Renter-occupied |
| No Vehicle | 37 (1.7%) | 26 (7.7%) |
| 1 Vehicle | 350 (15.6%) | 33 (9.7%) |
| 2 Vehicles | 1,012 (45.1%) | 264 (77.9%) |
| 3 or more Vehicles | 843 (37.6%) | 16 (4.7%) |
| Total | 2,242 (100.0%) | 339 (100.0%) |
Real Estate & Mortgages in Providence
Real Estate and Mortgage Overview in Providence
| Characteristic | Without Mortgage | With Mortgage |
| Housing Units | 968 | 1,274 |
| Median Property Value | $386,900 | $435,500 |
| Median Household Income | $83,426 | $522 |
| Monthly Housing Costs | $504 | $226 |
| Real Estate Taxes | $2,020 | $0 |
Property Value by Mortgage Status in Providence
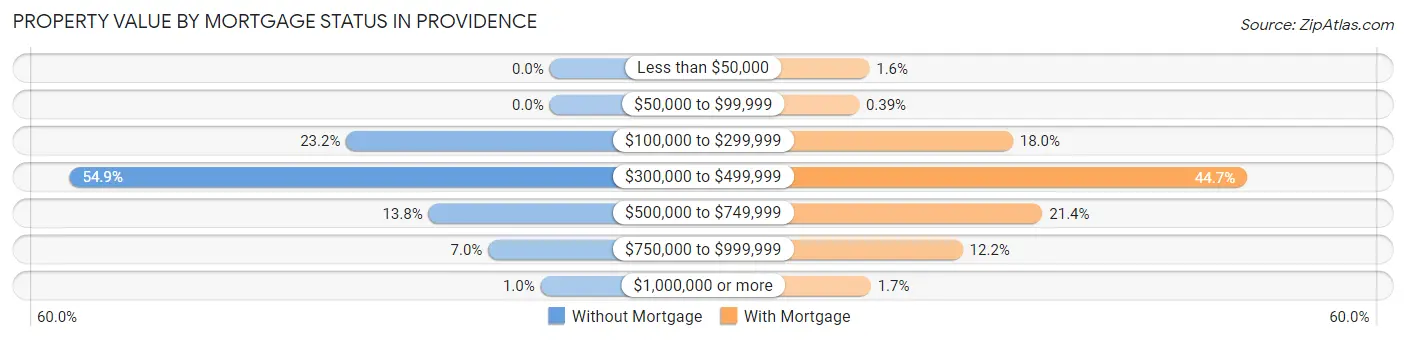
| Property Value | Without Mortgage | With Mortgage |
| Less than $50,000 | 0 (0.0%) | 20 (1.6%) |
| $50,000 to $99,999 | 0 (0.0%) | 5 (0.4%) |
| $100,000 to $299,999 | 225 (23.2%) | 229 (18.0%) |
| $300,000 to $499,999 | 531 (54.9%) | 570 (44.7%) |
| $500,000 to $749,999 | 134 (13.8%) | 272 (21.3%) |
| $750,000 to $999,999 | 68 (7.0%) | 156 (12.2%) |
| $1,000,000 or more | 10 (1.0%) | 22 (1.7%) |
| Total | 968 (100.0%) | 1,274 (100.0%) |
Household Income by Mortgage Status in Providence
| Household Income | Without Mortgage | With Mortgage |
| Less than $10,000 | 3 (0.3%) | 0 (0.0%) |
| $10,000 to $24,999 | 38 (3.9%) | 0 (0.0%) |
| $25,000 to $34,999 | 55 (5.7%) | 39 (3.1%) |
| $35,000 to $49,999 | 141 (14.6%) | 74 (5.8%) |
| $50,000 to $74,999 | 203 (21.0%) | 53 (4.2%) |
| $75,000 to $99,999 | 170 (17.6%) | 93 (7.3%) |
| $100,000 to $149,999 | 189 (19.5%) | 219 (17.2%) |
| $150,000 or more | 169 (17.5%) | 274 (21.5%) |
| Total | 968 (100.0%) | 1,274 (100.0%) |
Property Value to Household Income Ratio in Providence
| Value-to-Income Ratio | Without Mortgage | With Mortgage |
| Less than 2.0x | 86 (8.9%) | 123,611 (9,702.6%) |
| 2.0x to 2.9x | 160 (16.5%) | 210 (16.5%) |
| 3.0x to 3.9x | 150 (15.5%) | 246 (19.3%) |
| 4.0x or more | 572 (59.1%) | 225 (17.7%) |
| Total | 968 (100.0%) | 1,274 (100.0%) |
Real Estate Taxes by Mortgage Status in Providence
| Property Taxes | Without Mortgage | With Mortgage |
| Less than $800 | 0 (0.0%) | 0 (0.0%) |
| $800 to $1,499 | 180 (18.6%) | 74 (5.8%) |
| $800 to $1,499 | 771 (79.6%) | 195 (15.3%) |
| Total | 968 (100.0%) | 1,274 (100.0%) |
Health & Disability in Providence
Health Insurance Coverage by Age in Providence
| Age Bracket | With Coverage | Without Coverage |
| Under 6 Years | 760 (100.0%) | 0 (0.0%) |
| 6 to 18 Years | 2,295 (100.0%) | 0 (0.0%) |
| 19 to 25 Years | 524 (96.3%) | 20 (3.7%) |
| 26 to 34 Years | 683 (94.0%) | 44 (6.0%) |
| 35 to 44 Years | 1,099 (100.0%) | 0 (0.0%) |
| 45 to 54 Years | 926 (92.3%) | 77 (7.7%) |
| 55 to 64 Years | 789 (96.0%) | 33 (4.0%) |
| 65 to 74 Years | 740 (100.0%) | 0 (0.0%) |
| 75 Years and older | 426 (100.0%) | 0 (0.0%) |
| Total | 8,242 (97.9%) | 174 (2.1%) |
Health Insurance Coverage by Citizenship Status in Providence
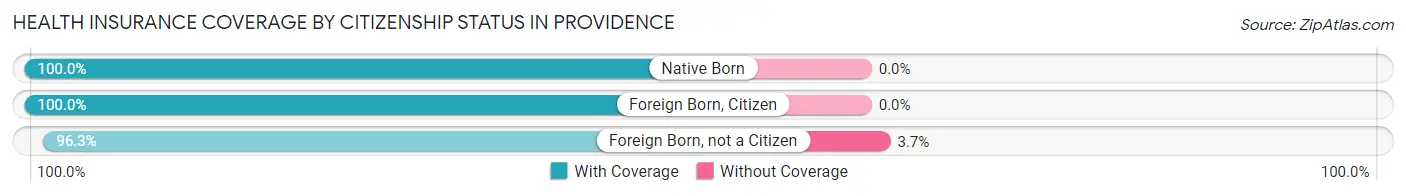
| Citizenship Status | With Coverage | Without Coverage |
| Native Born | 760 (100.0%) | 0 (0.0%) |
| Foreign Born, Citizen | 2,295 (100.0%) | 0 (0.0%) |
| Foreign Born, not a Citizen | 524 (96.3%) | 20 (3.7%) |
Health Insurance Coverage by Household Income in Providence
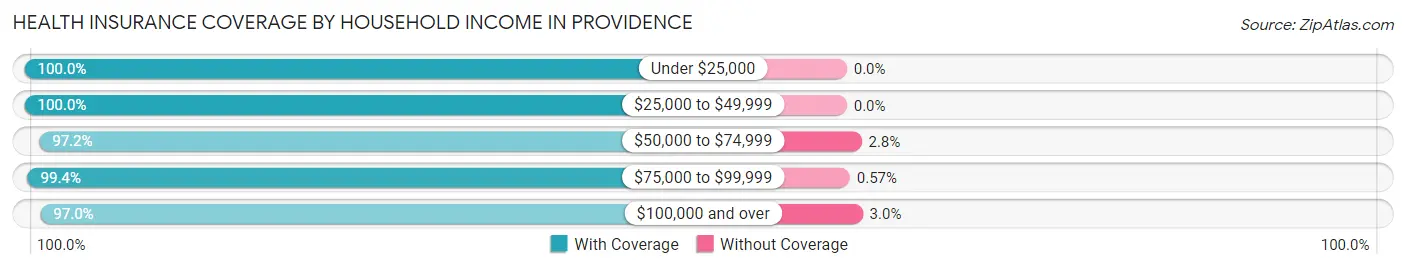
| Household Income | With Coverage | Without Coverage |
| Under $25,000 | 306 (100.0%) | 0 (0.0%) |
| $25,000 to $49,999 | 891 (100.0%) | 0 (0.0%) |
| $50,000 to $74,999 | 953 (97.2%) | 27 (2.8%) |
| $75,000 to $99,999 | 1,583 (99.4%) | 9 (0.6%) |
| $100,000 and over | 4,508 (97.0%) | 138 (3.0%) |
Public vs Private Health Insurance Coverage by Age in Providence
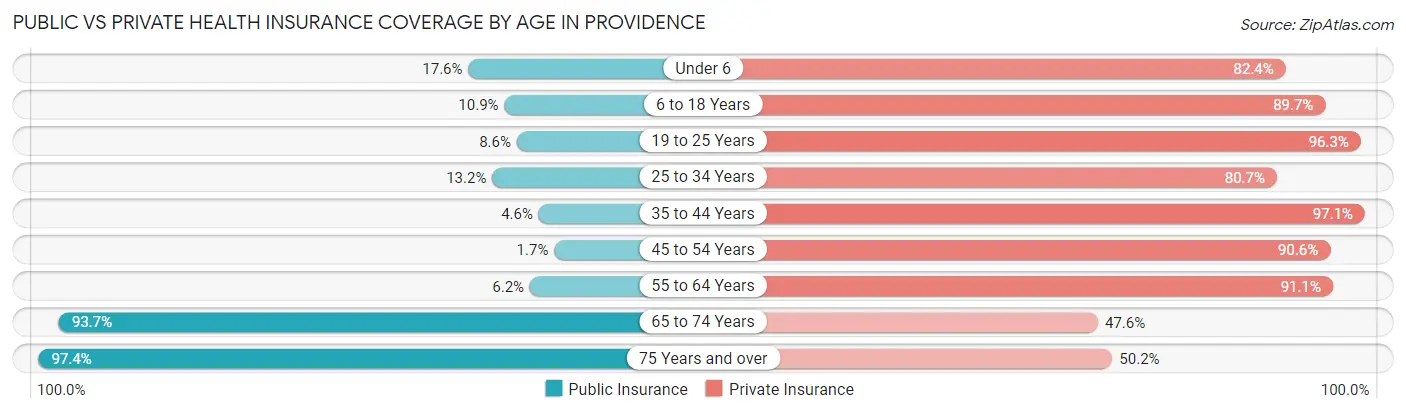
| Age Bracket | Public Insurance | Private Insurance |
| Under 6 | 134 (17.6%) | 626 (82.4%) |
| 6 to 18 Years | 251 (10.9%) | 2,059 (89.7%) |
| 19 to 25 Years | 47 (8.6%) | 524 (96.3%) |
| 25 to 34 Years | 96 (13.2%) | 587 (80.7%) |
| 35 to 44 Years | 50 (4.5%) | 1,067 (97.1%) |
| 45 to 54 Years | 17 (1.7%) | 909 (90.6%) |
| 55 to 64 Years | 51 (6.2%) | 749 (91.1%) |
| 65 to 74 Years | 693 (93.6%) | 352 (47.6%) |
| 75 Years and over | 415 (97.4%) | 214 (50.2%) |
| Total | 1,754 (20.8%) | 7,087 (84.2%) |
Disability Status by Sex by Age in Providence
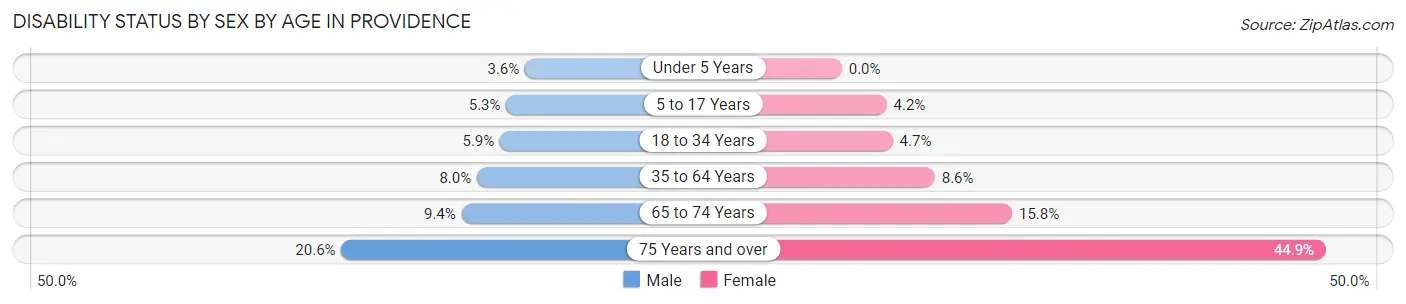
| Age Bracket | Male | Female |
| Under 5 Years | 13 (3.5%) | 0 (0.0%) |
| 5 to 17 Years | 68 (5.3%) | 42 (4.2%) |
| 18 to 34 Years | 39 (5.9%) | 36 (4.7%) |
| 35 to 64 Years | 108 (8.0%) | 136 (8.6%) |
| 65 to 74 Years | 37 (9.4%) | 55 (15.8%) |
| 75 Years and over | 41 (20.6%) | 102 (44.9%) |
Disability Class by Sex by Age in Providence
Disability Class: Hearing Difficulty
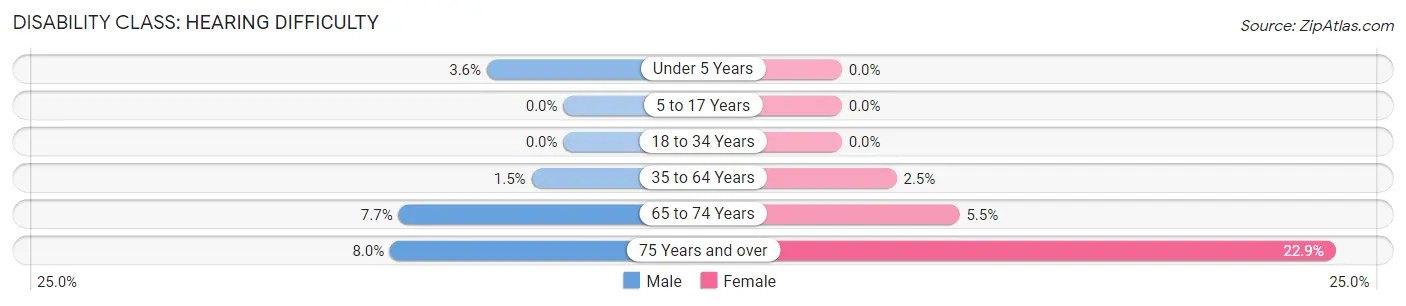
| Age Bracket | Male | Female |
| Under 5 Years | 13 (3.5%) | 0 (0.0%) |
| 5 to 17 Years | 0 (0.0%) | 0 (0.0%) |
| 18 to 34 Years | 0 (0.0%) | 0 (0.0%) |
| 35 to 64 Years | 20 (1.5%) | 40 (2.5%) |
| 65 to 74 Years | 30 (7.6%) | 19 (5.5%) |
| 75 Years and over | 16 (8.0%) | 52 (22.9%) |
Disability Class: Vision Difficulty
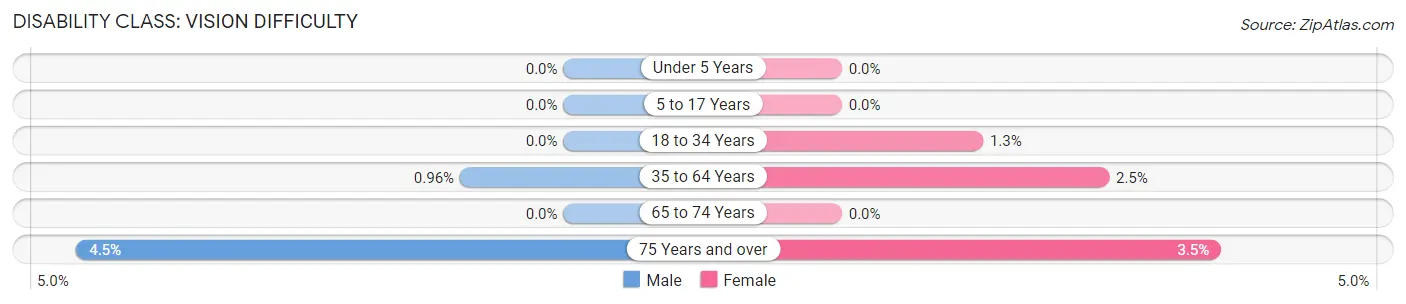
| Age Bracket | Male | Female |
| Under 5 Years | 0 (0.0%) | 0 (0.0%) |
| 5 to 17 Years | 0 (0.0%) | 0 (0.0%) |
| 18 to 34 Years | 0 (0.0%) | 10 (1.3%) |
| 35 to 64 Years | 13 (1.0%) | 39 (2.5%) |
| 65 to 74 Years | 0 (0.0%) | 0 (0.0%) |
| 75 Years and over | 9 (4.5%) | 8 (3.5%) |
Disability Class: Cognitive Difficulty
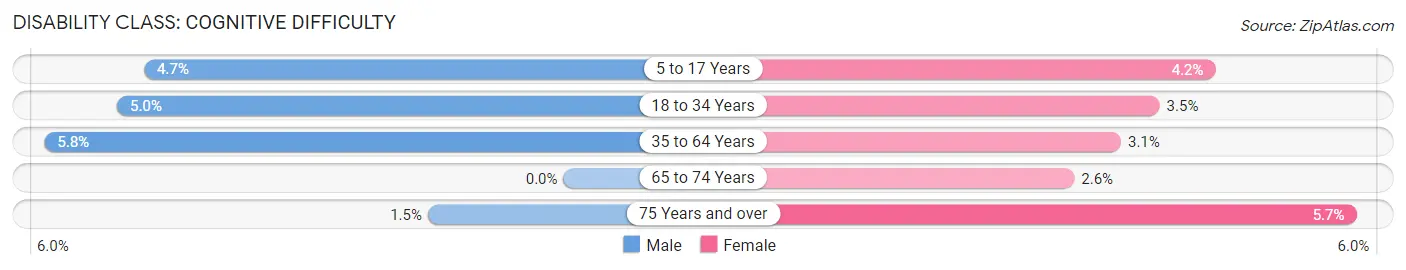
| Age Bracket | Male | Female |
| 5 to 17 Years | 60 (4.7%) | 42 (4.2%) |
| 18 to 34 Years | 33 (5.0%) | 27 (3.5%) |
| 35 to 64 Years | 78 (5.8%) | 49 (3.1%) |
| 65 to 74 Years | 0 (0.0%) | 9 (2.6%) |
| 75 Years and over | 3 (1.5%) | 13 (5.7%) |
Disability Class: Ambulatory Difficulty
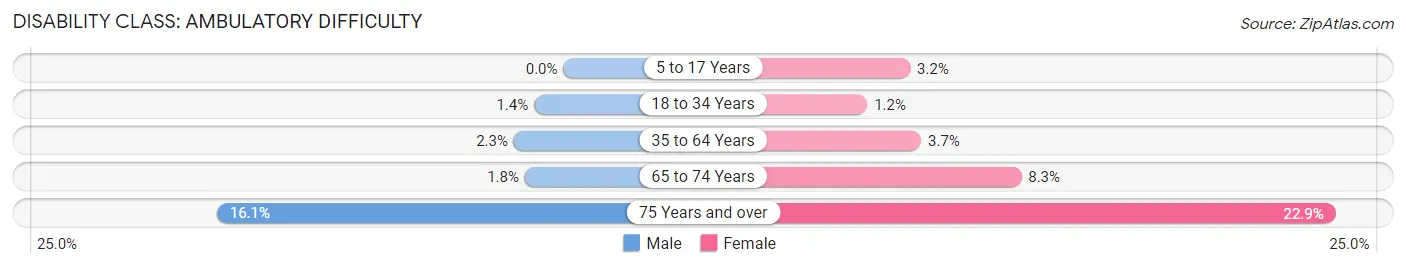
| Age Bracket | Male | Female |
| 5 to 17 Years | 0 (0.0%) | 32 (3.2%) |
| 18 to 34 Years | 9 (1.4%) | 9 (1.2%) |
| 35 to 64 Years | 31 (2.3%) | 58 (3.7%) |
| 65 to 74 Years | 7 (1.8%) | 29 (8.3%) |
| 75 Years and over | 32 (16.1%) | 52 (22.9%) |
Disability Class: Self-Care Difficulty
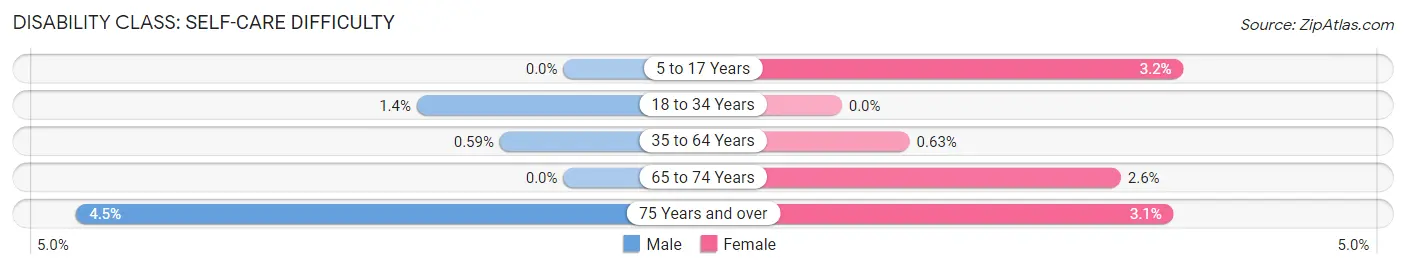
| Age Bracket | Male | Female |
| 5 to 17 Years | 0 (0.0%) | 32 (3.2%) |
| 18 to 34 Years | 9 (1.4%) | 0 (0.0%) |
| 35 to 64 Years | 8 (0.6%) | 10 (0.6%) |
| 65 to 74 Years | 0 (0.0%) | 9 (2.6%) |
| 75 Years and over | 9 (4.5%) | 7 (3.1%) |
Technology Access in Providence
Computing Device Access in Providence
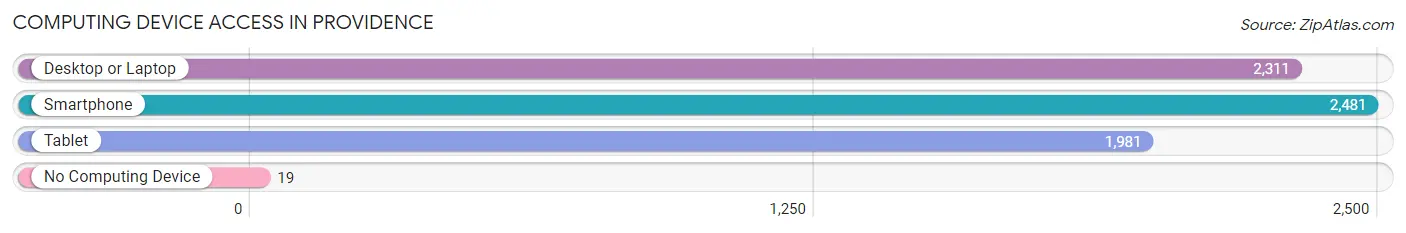
| Device Type | # Households | % Households |
| Desktop or Laptop | 2,311 | 89.5% |
| Smartphone | 2,481 | 96.1% |
| Tablet | 1,981 | 76.7% |
| No Computing Device | 19 | 0.7% |
| Total | 2,581 | 100.0% |
Internet Access in Providence
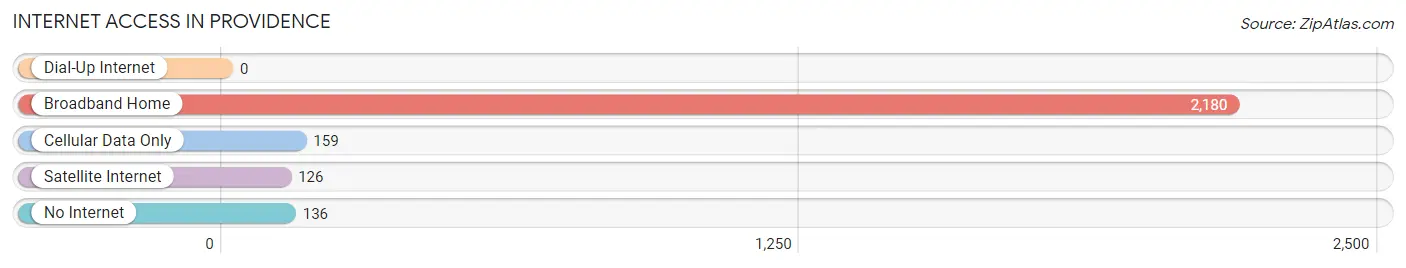
| Internet Type | # Households | % Households |
| Dial-Up Internet | 0 | 0.0% |
| Broadband Home | 2,180 | 84.5% |
| Cellular Data Only | 159 | 6.2% |
| Satellite Internet | 126 | 4.9% |
| No Internet | 136 | 5.3% |
| Total | 2,581 | 100.0% |
Providence Summary
Providence, Utah is a small city located in Cache County, Utah. It is part of the Logan metropolitan area and is located about 10 miles north of Logan. The city was founded in 1859 by a group of Mormon settlers and was named after the city of Providence, Rhode Island. As of the 2010 census, the population of Providence was 7,075.
Geography
Providence is located in northern Utah, in the Cache Valley. It is situated at an elevation of 4,521 feet above sea level. The city is bordered by the cities of North Logan to the south, Smithfield to the east, and Hyde Park to the west. The city is located in a valley surrounded by mountains, including the Wellsville Mountains to the east and the Wasatch Range to the west. The city is located in a semi-arid climate, with hot summers and cold winters.
Economy
The economy of Providence is largely based on agriculture and manufacturing. The city is home to several large agricultural operations, including dairy farms, beef farms, and vegetable farms. The city is also home to several manufacturing companies, including a plastics factory, a metal fabrication plant, and a food processing plant. The city is also home to several retail stores, restaurants, and other businesses.
Demographics
As of the 2010 census, the population of Providence was 7,075. The racial makeup of the city was 91.3% White, 0.7% African American, 0.4% Native American, 0.7% Asian, 0.1% Pacific Islander, 4.3% from other races, and 2.5% from two or more races. Hispanic or Latino of any race were 8.2% of the population.
The median income for a household in the city was $45,945, and the median income for a family was $51,945. The per capita income for the city was $20,945. About 8.2% of families and 10.2% of the population were below the poverty line, including 14.2% of those under age 18 and 6.2% of those age 65 or over.
Conclusion
Providence, Utah is a small city located in Cache County, Utah. It is part of the Logan metropolitan area and is located about 10 miles north of Logan. The city was founded in 1859 by a group of Mormon settlers and was named after the city of Providence, Rhode Island. As of the 2010 census, the population of Providence was 7,075. The economy of Providence is largely based on agriculture and manufacturing, and the city is home to several large agricultural operations and manufacturing companies. The racial makeup of the city was 91.3% White, 0.7% African American, 0.4% Native American, 0.7% Asian, 0.1% Pacific Islander, 4.3% from other races, and 2.5% from two or more races. The median income for a household in the city was $45,945, and the median income for a family was $51,945. About 8.2% of families and 10.2% of the population were below the poverty line.
Common Questions
What is Per Capita Income in Providence?
Per Capita income in Providence is $40,138.
What is the Median Family Income in Providence?
Median Family Income in Providence is $115,078.
What is the Median Household income in Providence?
Median Household Income in Providence is $98,454.
What is Income or Wage Gap in Providence?
Income or Wage Gap in Providence is 61.2%.
Women in Providence earn 38.8 cents for every dollar earned by a man.
What is Family Income Deficit in Providence?
Family Income Deficit in Providence is $12,402.
Families that are below poverty line in Providence earn $12,402 less on average than the poverty threshold level.
What is Inequality or Gini Index in Providence?
Inequality or Gini Index in Providence is 0.40.
What is the Total Population of Providence?
Total Population of Providence is 8,418.
What is the Total Male Population of Providence?
Total Male Population of Providence is 4,257.
What is the Total Female Population of Providence?
Total Female Population of Providence is 4,161.
What is the Ratio of Males per 100 Females in Providence?
There are 102.31 Males per 100 Females in Providence.
What is the Ratio of Females per 100 Males in Providence?
There are 97.74 Females per 100 Males in Providence.
What is the Median Population Age in Providence?
Median Population Age in Providence is 33.6 Years.
What is the Average Family Size in Providence
Average Family Size in Providence is 3.6 People.
What is the Average Household Size in Providence
Average Household Size in Providence is 3.3 People.
How Large is the Labor Force in Providence?
There are 3,703 People in the Labor Forcein in Providence.
What is the Percentage of People in the Labor Force in Providence?
64.2% of People are in the Labor Force in Providence.
What is the Unemployment Rate in Providence?
Unemployment Rate in Providence is 2.4%.