Zip Codes with the Highest Percentage of Population Employed in Legal Services & Support in Scranton, PA
RELATED REPORTS & OPTIONS
Legal Services & Support
Scranton
Compare Zip Codes
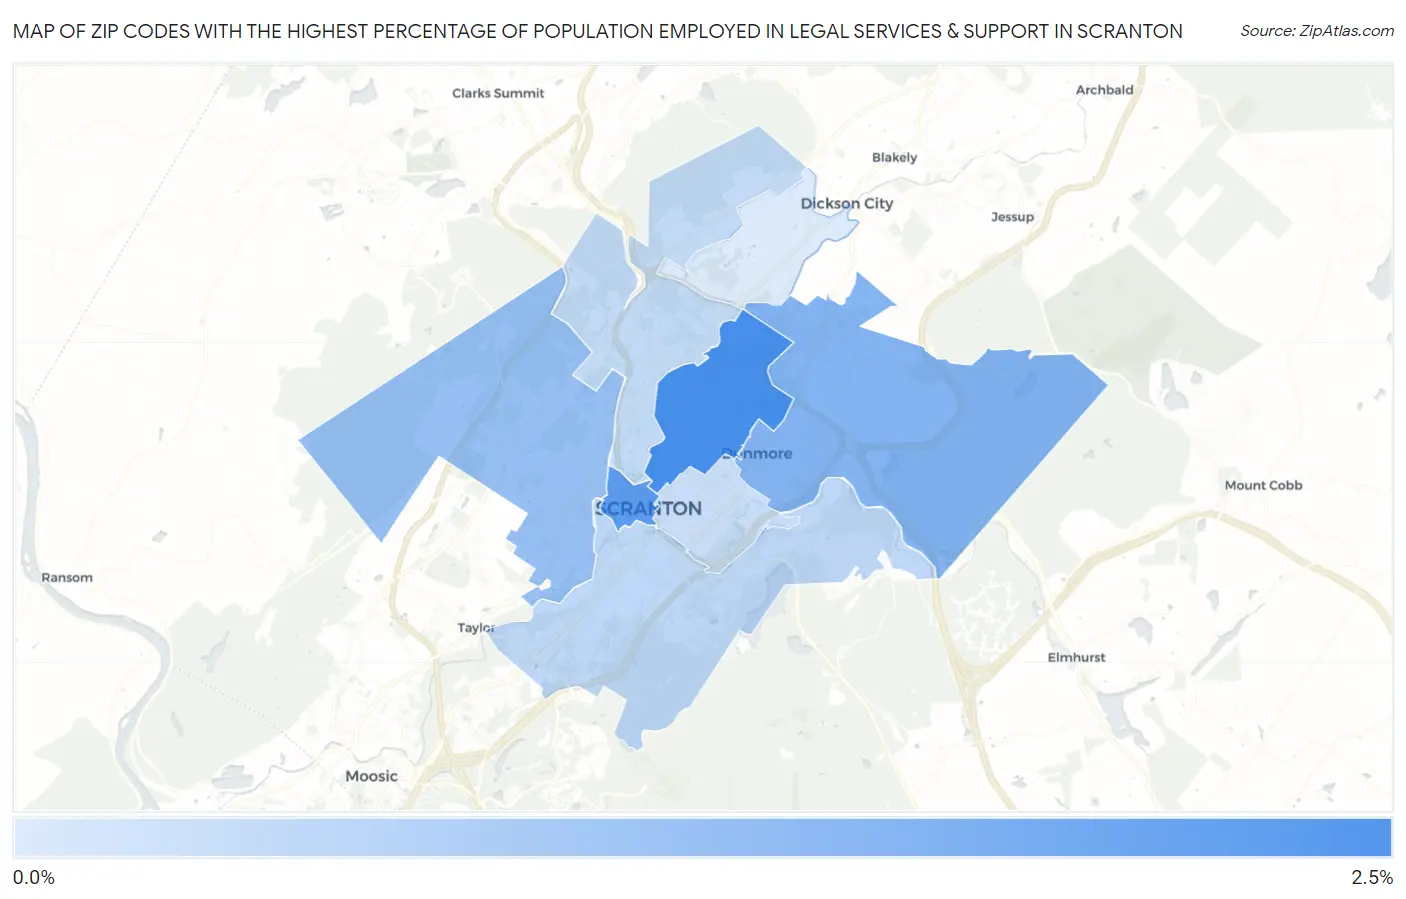
Map of Zip Codes with the Highest Percentage of Population Employed in Legal Services & Support in Scranton
0.43%
2.2%
Zip Codes with the Highest Percentage of Population Employed in Legal Services & Support in Scranton, PA
| Zip Code | % Employed | vs State | vs National | |
| 1. | 18509 | 2.2% | 1.1%(+1.07)#137 | 1.2%(+1.04)#2,997 |
| 2. | 18503 | 2.0% | 1.1%(+0.839)#158 | 1.2%(+0.803)#3,515 |
| 3. | 18512 | 1.5% | 1.1%(+0.359)#220 | 1.2%(+0.323)#5,024 |
| 4. | 18504 | 1.3% | 1.1%(+0.106)#278 | 1.2%(+0.069)#6,189 |
| 5. | 18505 | 0.78% | 1.1%(-0.371)#465 | 1.2%(-0.408)#9,678 |
| 6. | 18508 | 0.73% | 1.1%(-0.420)#497 | 1.2%(-0.456)#10,128 |
| 7. | 18510 | 0.65% | 1.1%(-0.502)#528 | 1.2%(-0.538)#10,977 |
| 8. | 18519 | 0.43% | 1.1%(-0.716)#672 | 1.2%(-0.752)#13,471 |
1
Common Questions
What are the Top 5 Zip Codes with the Highest Percentage of Population Employed in Legal Services & Support in Scranton, PA?
Top 5 Zip Codes with the Highest Percentage of Population Employed in Legal Services & Support in Scranton, PA are:
What zip code has the Highest Percentage of Population Employed in Legal Services & Support in Scranton, PA?
18509 has the Highest Percentage of Population Employed in Legal Services & Support in Scranton, PA with 2.2%.
What is the Percentage of Population Employed in Legal Services & Support in Scranton, PA?
Percentage of Population Employed in Legal Services & Support in Scranton is 0.95%.
What is the Percentage of Population Employed in Legal Services & Support in Pennsylvania?
Percentage of Population Employed in Legal Services & Support in Pennsylvania is 1.1%.
What is the Percentage of Population Employed in Legal Services & Support in the United States?
Percentage of Population Employed in Legal Services & Support in the United States is 1.2%.