Zip Codes with the Highest Percentage of Population Employed in Administrative & Support Services in Scranton, PA
RELATED REPORTS & OPTIONS
Administrative & Support Services
Scranton
Compare Zip Codes
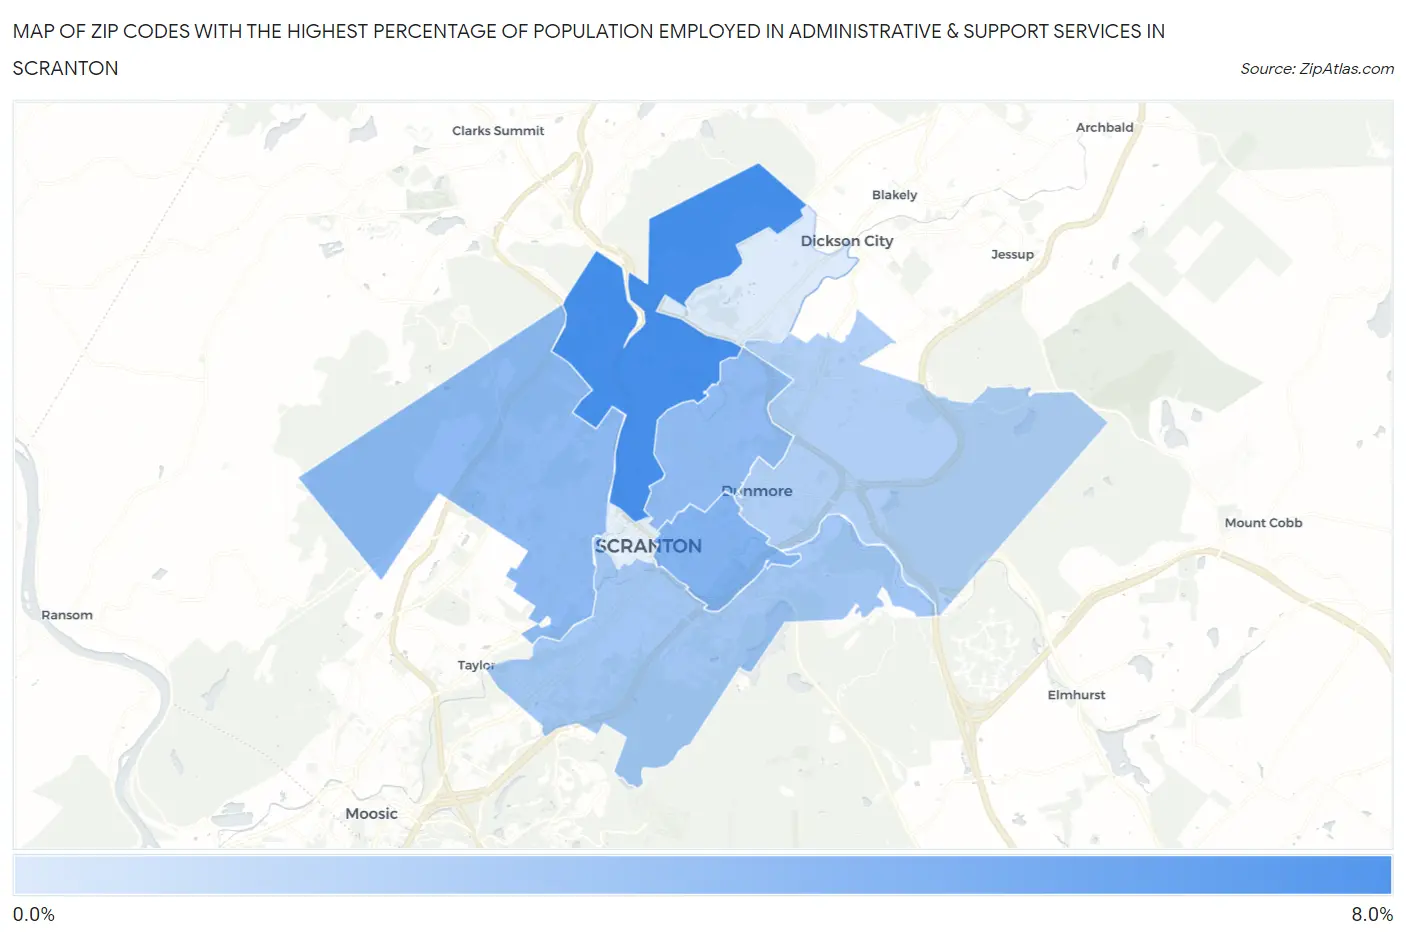
Map of Zip Codes with the Highest Percentage of Population Employed in Administrative & Support Services in Scranton
1.0%
6.6%
Zip Codes with the Highest Percentage of Population Employed in Administrative & Support Services in Scranton, PA
| Zip Code | % Employed | vs State | vs National | |
| 1. | 18508 | 6.6% | 3.6%(+3.04)#167 | 4.1%(+2.48)#3,726 |
| 2. | 18510 | 4.4% | 3.6%(+0.789)#424 | 4.1%(+0.225)#9,189 |
| 3. | 18504 | 4.0% | 3.6%(+0.376)#513 | 4.1%(-0.189)#10,856 |
| 4. | 18509 | 3.8% | 3.6%(+0.246)#542 | 4.1%(-0.318)#11,387 |
| 5. | 18505 | 3.2% | 3.6%(-0.402)#738 | 4.1%(-0.967)#14,555 |
| 6. | 18512 | 2.6% | 3.6%(-0.977)#948 | 4.1%(-1.54)#17,559 |
| 7. | 18519 | 1.0% | 3.6%(-2.55)#1,322 | 4.1%(-3.11)#24,371 |
1
Common Questions
What are the Top 5 Zip Codes with the Highest Percentage of Population Employed in Administrative & Support Services in Scranton, PA?
Top 5 Zip Codes with the Highest Percentage of Population Employed in Administrative & Support Services in Scranton, PA are:
What zip code has the Highest Percentage of Population Employed in Administrative & Support Services in Scranton, PA?
18508 has the Highest Percentage of Population Employed in Administrative & Support Services in Scranton, PA with 6.6%.
What is the Percentage of Population Employed in Administrative & Support Services in Scranton, PA?
Percentage of Population Employed in Administrative & Support Services in Scranton is 4.3%.
What is the Percentage of Population Employed in Administrative & Support Services in Pennsylvania?
Percentage of Population Employed in Administrative & Support Services in Pennsylvania is 3.6%.
What is the Percentage of Population Employed in Administrative & Support Services in the United States?
Percentage of Population Employed in Administrative & Support Services in the United States is 4.1%.