Zip Codes with the Highest Percentage of Households Without a Vehicle in Scranton, PA
RELATED REPORTS & OPTIONS
Households without a Cars
Scranton
Compare Zip Codes
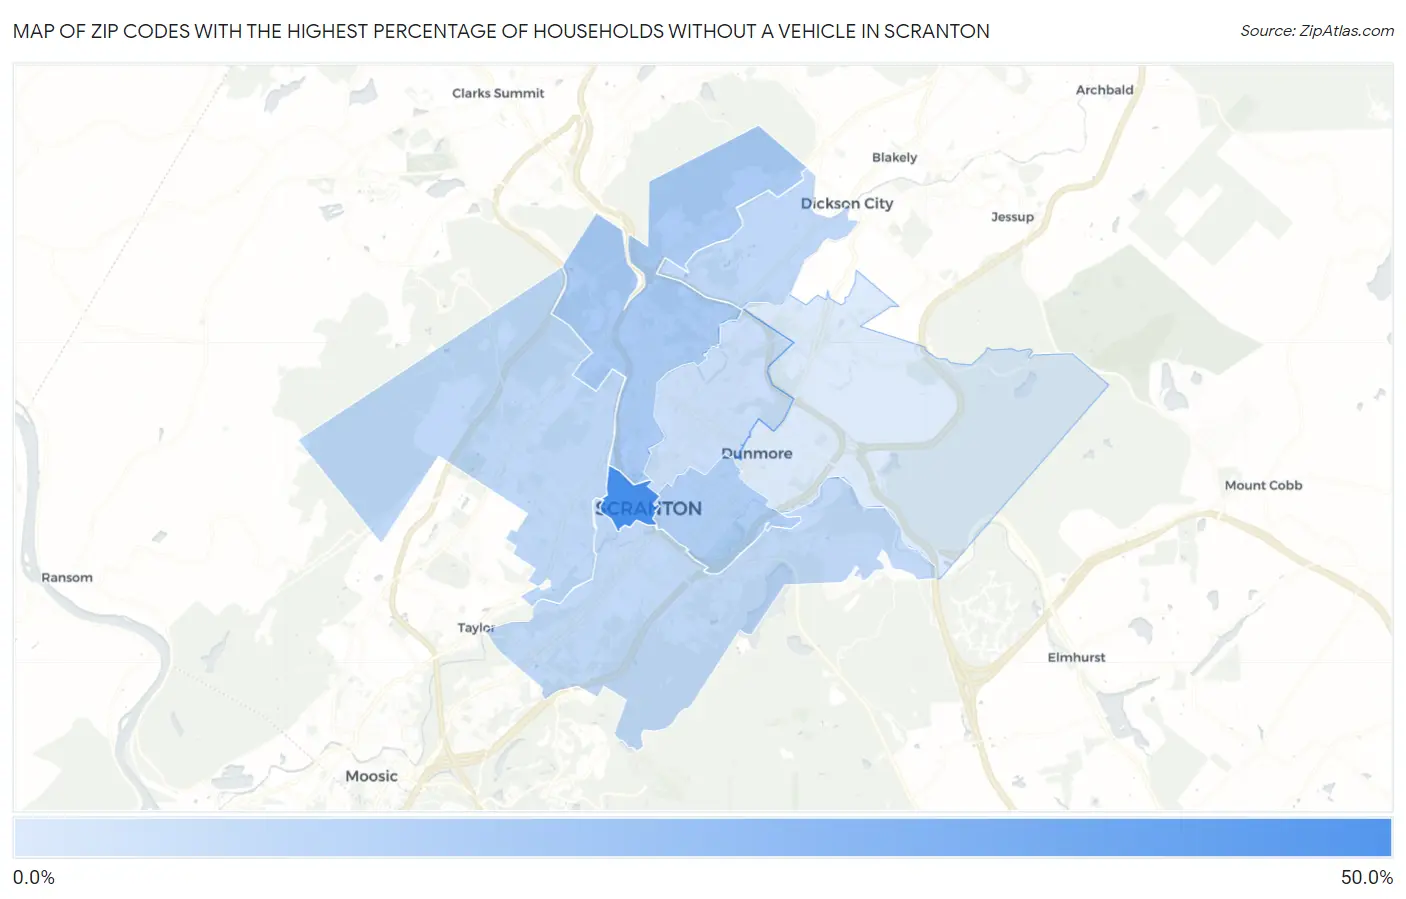
Map of Zip Codes with the Highest Percentage of Households Without a Vehicle in Scranton
6.1%
44.6%
Zip Codes with the Highest Percentage of Households Without a Vehicle in Scranton, PA
| Zip Code | Housholds Without a Car | vs State | vs National | |
| 1. | 18503 | 44.6% | 10.6%(+34.0)#25 | 8.3%(+36.3)#408 |
| 2. | 18508 | 17.7% | 10.6%(+7.10)#157 | 8.3%(+9.40)#1,839 |
| 3. | 18510 | 16.4% | 10.6%(+5.80)#174 | 8.3%(+8.10)#2,079 |
| 4. | 18504 | 12.9% | 10.6%(+2.30)#255 | 8.3%(+4.60)#3,140 |
| 5. | 18519 | 12.8% | 10.6%(+2.20)#259 | 8.3%(+4.50)#3,197 |
| 6. | 18505 | 12.4% | 10.6%(+1.80)#271 | 8.3%(+4.10)#3,364 |
| 7. | 18509 | 10.4% | 10.6%(-0.200)#360 | 8.3%(+2.10)#4,548 |
| 8. | 18512 | 6.1% | 10.6%(-4.50)#722 | 8.3%(-2.20)#10,259 |
1
Common Questions
What are the Top 5 Zip Codes with the Highest Percentage of Households Without a Vehicle in Scranton, PA?
Top 5 Zip Codes with the Highest Percentage of Households Without a Vehicle in Scranton, PA are:
What zip code has the Highest Percentage of Households Without a Vehicle in Scranton, PA?
18503 has the Highest Percentage of Households Without a Vehicle in Scranton, PA with 44.6%.
What is the Percentage of Households Without a Vehicle in Scranton, PA?
Percentage of Households Without a Vehicle in Scranton is 14.7%.
What is the Percentage of Households Without a Vehicle in Pennsylvania?
Percentage of Households Without a Vehicle in Pennsylvania is 10.6%.
What is the Percentage of Households Without a Vehicle in the United States?
Percentage of Households Without a Vehicle in the United States is 8.3%.