Zip Codes with the Highest Percentage of Population Employed in Health Diagnosing & Treating in Scranton, PA
RELATED REPORTS & OPTIONS
Health Diagnosing & Treating
Scranton
Compare Zip Codes
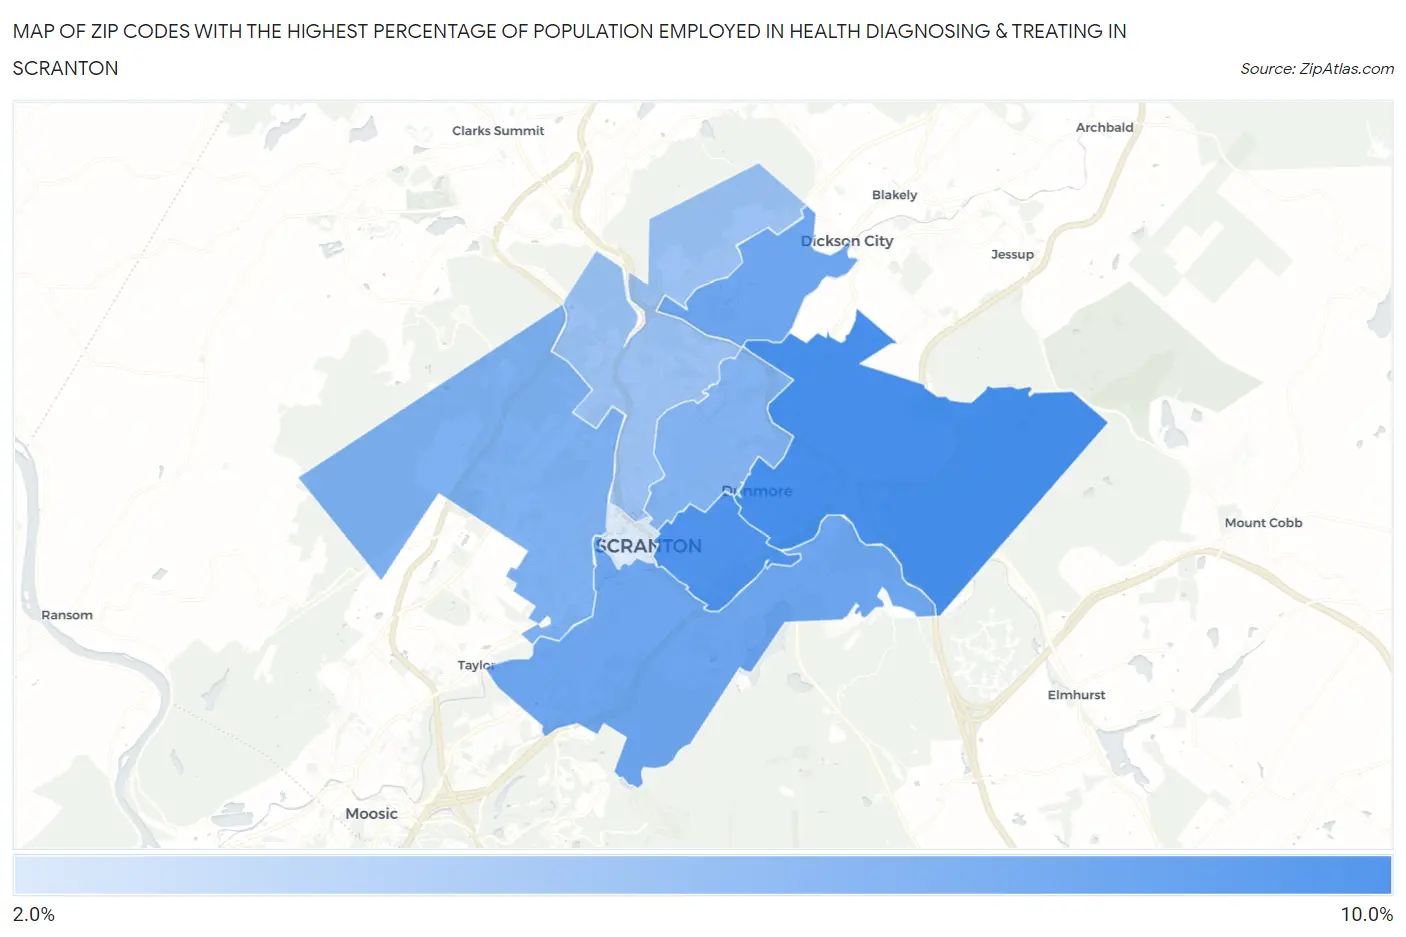
Map of Zip Codes with the Highest Percentage of Population Employed in Health Diagnosing & Treating in Scranton
2.4%
9.4%
Zip Codes with the Highest Percentage of Population Employed in Health Diagnosing & Treating in Scranton, PA
| Zip Code | % Employed | vs State | vs National | |
| 1. | 18512 | 9.4% | 7.4%(+2.08)#344 | 6.2%(+3.18)#4,643 |
| 2. | 18510 | 9.1% | 7.4%(+1.72)#381 | 6.2%(+2.83)#5,237 |
| 3. | 18505 | 7.6% | 7.4%(+0.224)#623 | 6.2%(+1.33)#8,576 |
| 4. | 18519 | 7.5% | 7.4%(+0.156)#639 | 6.2%(+1.26)#8,791 |
| 5. | 18504 | 6.8% | 7.4%(-0.597)#778 | 6.2%(+0.509)#11,141 |
| 6. | 18509 | 6.6% | 7.4%(-0.780)#832 | 6.2%(+0.326)#11,784 |
| 7. | 18508 | 5.5% | 7.4%(-1.82)#1,060 | 6.2%(-0.719)#15,693 |
| 8. | 18503 | 2.4% | 7.4%(-4.92)#1,471 | 6.2%(-3.82)#25,671 |
1
Common Questions
What are the Top 5 Zip Codes with the Highest Percentage of Population Employed in Health Diagnosing & Treating in Scranton, PA?
Top 5 Zip Codes with the Highest Percentage of Population Employed in Health Diagnosing & Treating in Scranton, PA are:
What zip code has the Highest Percentage of Population Employed in Health Diagnosing & Treating in Scranton, PA?
18512 has the Highest Percentage of Population Employed in Health Diagnosing & Treating in Scranton, PA with 9.4%.
What is the Percentage of Population Employed in Health Diagnosing & Treating in Scranton, PA?
Percentage of Population Employed in Health Diagnosing & Treating in Scranton is 6.7%.
What is the Percentage of Population Employed in Health Diagnosing & Treating in Pennsylvania?
Percentage of Population Employed in Health Diagnosing & Treating in Pennsylvania is 7.4%.
What is the Percentage of Population Employed in Health Diagnosing & Treating in the United States?
Percentage of Population Employed in Health Diagnosing & Treating in the United States is 6.2%.