Zip Codes with the Highest Percentage of Population Employed in Education Instruction & Library in Scranton, PA

RELATED REPORTS & OPTIONS

Education Instruction & Library
Population
Families and Households
Female Fertility
Female Fertility (Unmarried)
Race (Community Size)
Race (Percentage)
Ancestry (Community Size)
AfricanAlbanianAmericanArabArgentineanArmenianAustrianBhutaneseBrazilianBritishBulgarianBurmeseCanadianCentral AmericanCentral American IndianCherokeeChileanColombianCosta RicanCroatianCubanCzechCzechoslovakianDanishDominicanDutchEastern EuropeanEcuadorianEgyptianEnglishEuropeanFinnishFrenchFrench CanadianGermanGreekGuatemalanGuyaneseHonduranHungarianIndian (Asian)IranianIrishIroquoisIsraeliItalianJamaicanKoreanLaotianLebaneseLithuanianMalaysianMexicanNative HawaiianNavajoNicaraguanNigerianNorthern EuropeanNorwegianPanamanianPennsylvania GermanPeruvianPolishPortuguesePuerto RicanRomanianRussianSalvadoranSamoanScotch-IrishScottishSierra LeoneanSiouxSlavicSlovakSloveneSouth AfricanSouth AmericanSpaniardSpanishSri LankanSubsaharan AfricanSwedishSwissSyrianThaiTrinidadian and TobagonianTurkishUkrainianUruguayanVenezuelanWelshWest IndianYugoslavian
Ancestry (Percentage)
AfricanAlbanianAmericanArabArgentineanArmenianAustrianBhutaneseBrazilianBritishBulgarianBurmeseCanadianCentral AmericanCentral American IndianCherokeeChileanColombianCosta RicanCroatianCubanCzechCzechoslovakianDanishDominicanDutchEastern EuropeanEcuadorianEgyptianEnglishEuropeanFinnishFrenchFrench CanadianGermanGreekGuatemalanGuyaneseHonduranHungarianIndian (Asian)IranianIrishIroquoisIsraeliItalianJamaicanKoreanLaotianLebaneseLithuanianMalaysianMexicanNative HawaiianNavajoNicaraguanNigerianNorthern EuropeanNorwegianPanamanianPennsylvania GermanPeruvianPolishPortuguesePuerto RicanRomanianRussianSalvadoranSamoanScotch-IrishScottishSierra LeoneanSiouxSlavicSlovakSloveneSouth AfricanSouth AmericanSpaniardSpanishSri LankanSubsaharan AfricanSwedishSwissSyrianThaiTrinidadian and TobagonianTurkishUkrainianUruguayanVenezuelanWelshWest IndianYugoslavian
Immigrant Origin (Total)
Immigrant Origin (Percentage)
Income
Income (Families)
Income (Households)
Poverty
Poverty (Families)
Unemployment
Employment Occupations
Employment Industries
Employer Class
Commute Time
Commute Means
School Enrollment
Education by Degree Field
Occupancy
Finances
Physical Characteristics
Scranton
Compare Zip Codes
Comparison Subject

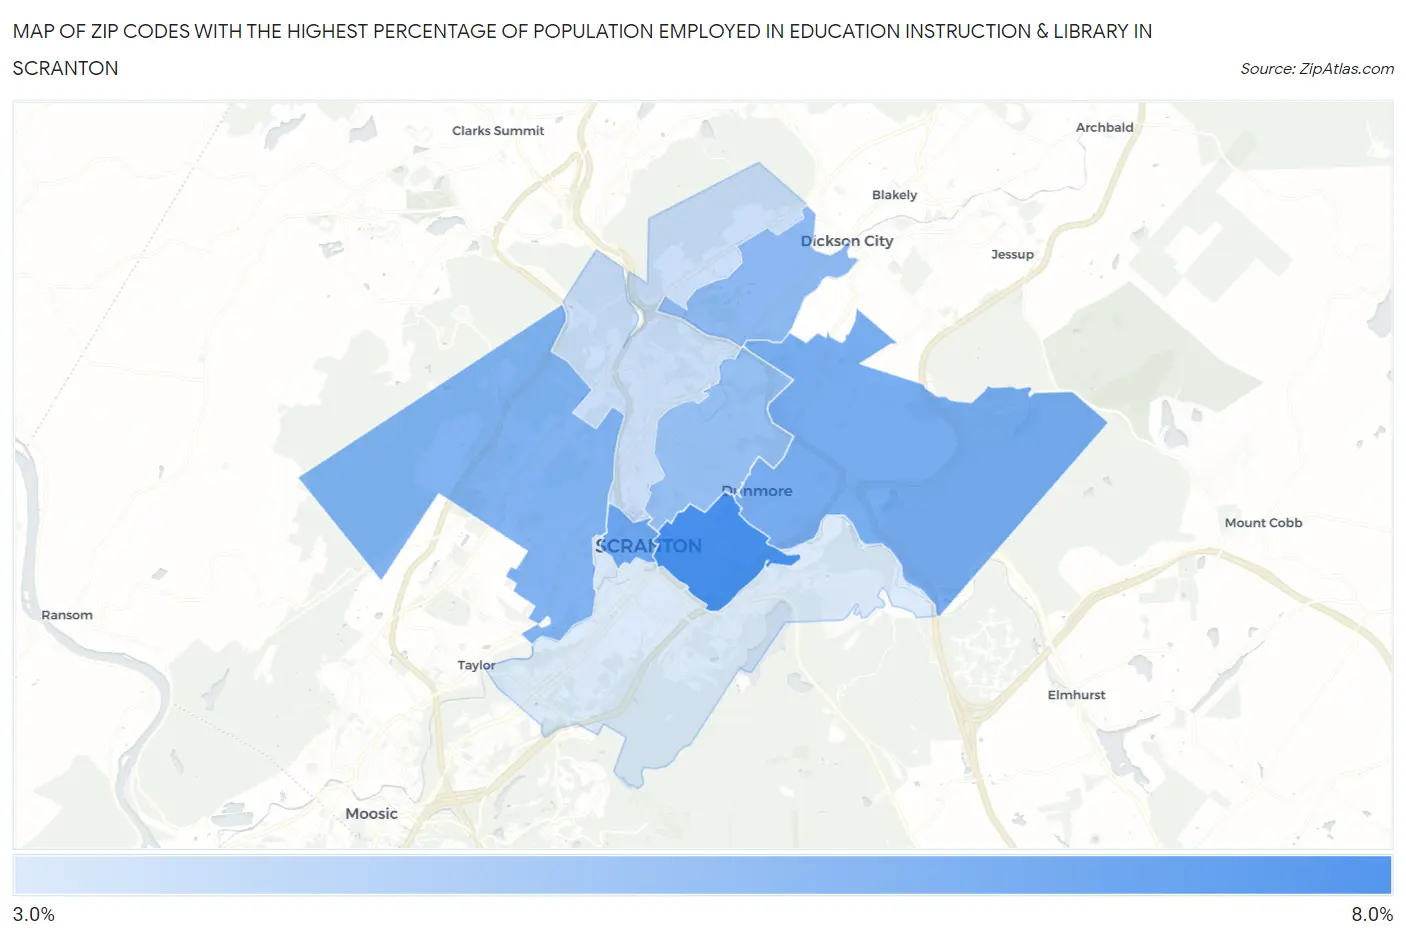
Map of Zip Codes with the Highest Percentage of Population Employed in Education Instruction & Library in Scranton

0.0%
8.0%
Zip Codes with the Highest Percentage of Population Employed in Education Instruction & Library in Scranton Map

Zip Codes with the Highest Percentage of Population Employed in Education Instruction & Library in Scranton, PA

Zip Code % Employed vs State vs National
1.185106.0%6.2%(-0.133)#5816.2%(-0.146)#13,347
2.185035.3%6.2%(-0.872)#7226.2%(-0.885)#16,390
3.185125.1%6.2%(-1.08)#7746.2%(-1.10)#17,261
4.185044.9%6.2%(-1.25)#8136.2%(-1.27)#17,979
5.185194.7%6.2%(-1.47)#8686.2%(-1.48)#18,904
6.185094.5%6.2%(-1.65)#9176.2%(-1.66)#19,627
7.185083.5%6.2%(-2.69)#1,1456.2%(-2.70)#23,427
8.185053.1%6.2%(-3.05)#1,2166.2%(-3.06)#24,540

Common Questions

What are the Top 5 Zip Codes with the Highest Percentage of Population Employed in Education Instruction & Library in Scranton, PA?
Top 5 Zip Codes with the Highest Percentage of Population Employed in Education Instruction & Library in Scranton, PA are:
#1
6.0%
#2
5.3%
#3
5.1%
#4
4.9%
#5
4.7%
What zip code has the Highest Percentage of Population Employed in Education Instruction & Library in Scranton, PA?
18510 has the Highest Percentage of Population Employed in Education Instruction & Library in Scranton, PA with 6.0%.
What is the Percentage of Population Employed in Education Instruction & Library in Scranton, PA?
Percentage of Population Employed in Education Instruction & Library in Scranton is 4.4%.
What is the Percentage of Population Employed in Education Instruction & Library in Pennsylvania?
Percentage of Population Employed in Education Instruction & Library in Pennsylvania is 6.2%.
What is the Percentage of Population Employed in Education Instruction & Library in the United States?
Percentage of Population Employed in Education Instruction & Library in the United States is 6.2%.