Zip Codes with the Highest Percentage of Population with a Degree in Visual and Performing Arts in Scranton, PA
RELATED REPORTS & OPTIONS
Visual and Performing Arts
Scranton
Compare Zip Codes
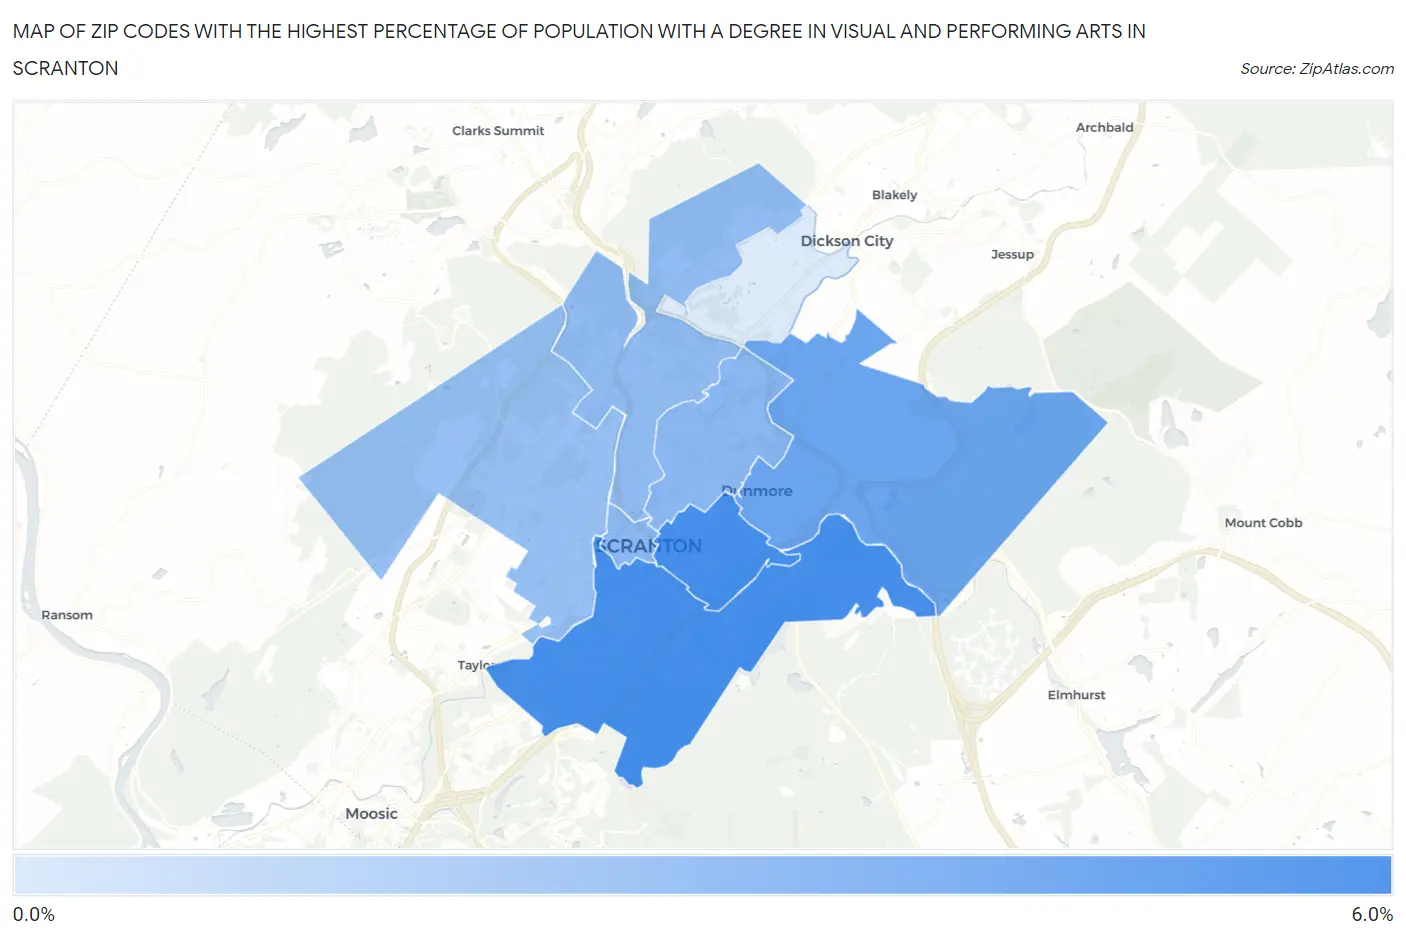
Map of Zip Codes with the Highest Percentage of Population with a Degree in Visual and Performing Arts in Scranton
0.36%
5.3%
Zip Codes with the Highest Percentage of Population with a Degree in Visual and Performing Arts in Scranton, PA
| Zip Code | % Graduates | vs State | vs National | |
| 1. | 18505 | 5.3% | 3.8%(+1.52)#280 | 4.3%(+1.09)#5,952 |
| 2. | 18510 | 5.3% | 3.8%(+1.52)#281 | 4.3%(+1.09)#5,973 |
| 3. | 18512 | 4.1% | 3.8%(+0.267)#418 | 4.3%(-0.162)#8,969 |
| 4. | 18509 | 3.1% | 3.8%(-0.747)#605 | 4.3%(-1.18)#12,432 |
| 5. | 18503 | 3.0% | 3.8%(-0.823)#617 | 4.3%(-1.25)#12,728 |
| 6. | 18508 | 2.9% | 3.8%(-0.931)#641 | 4.3%(-1.36)#13,137 |
| 7. | 18504 | 2.6% | 3.8%(-1.19)#703 | 4.3%(-1.62)#14,156 |
| 8. | 18519 | 0.36% | 3.8%(-3.47)#1,092 | 4.3%(-3.90)#21,012 |
1
Common Questions
What are the Top 5 Zip Codes with the Highest Percentage of Population with a Degree in Visual and Performing Arts in Scranton, PA?
Top 5 Zip Codes with the Highest Percentage of Population with a Degree in Visual and Performing Arts in Scranton, PA are:
What zip code has the Highest Percentage of Population with a Degree in Visual and Performing Arts in Scranton, PA?
18505 has the Highest Percentage of Population with a Degree in Visual and Performing Arts in Scranton, PA with 5.3%.
What is the Percentage of Population with a Degree in Visual and Performing Arts in Scranton, PA?
Percentage of Population with a Degree in Visual and Performing Arts in Scranton is 4.2%.
What is the Percentage of Population with a Degree in Visual and Performing Arts in Pennsylvania?
Percentage of Population with a Degree in Visual and Performing Arts in Pennsylvania is 3.8%.
What is the Percentage of Population with a Degree in Visual and Performing Arts in the United States?
Percentage of Population with a Degree in Visual and Performing Arts in the United States is 4.3%.