Zip Codes with the Highest Percentage of Population Employed in Arts, Media & Entertainment in Scranton, PA
RELATED REPORTS & OPTIONS
Arts, Media & Entertainment
Scranton
Compare Zip Codes
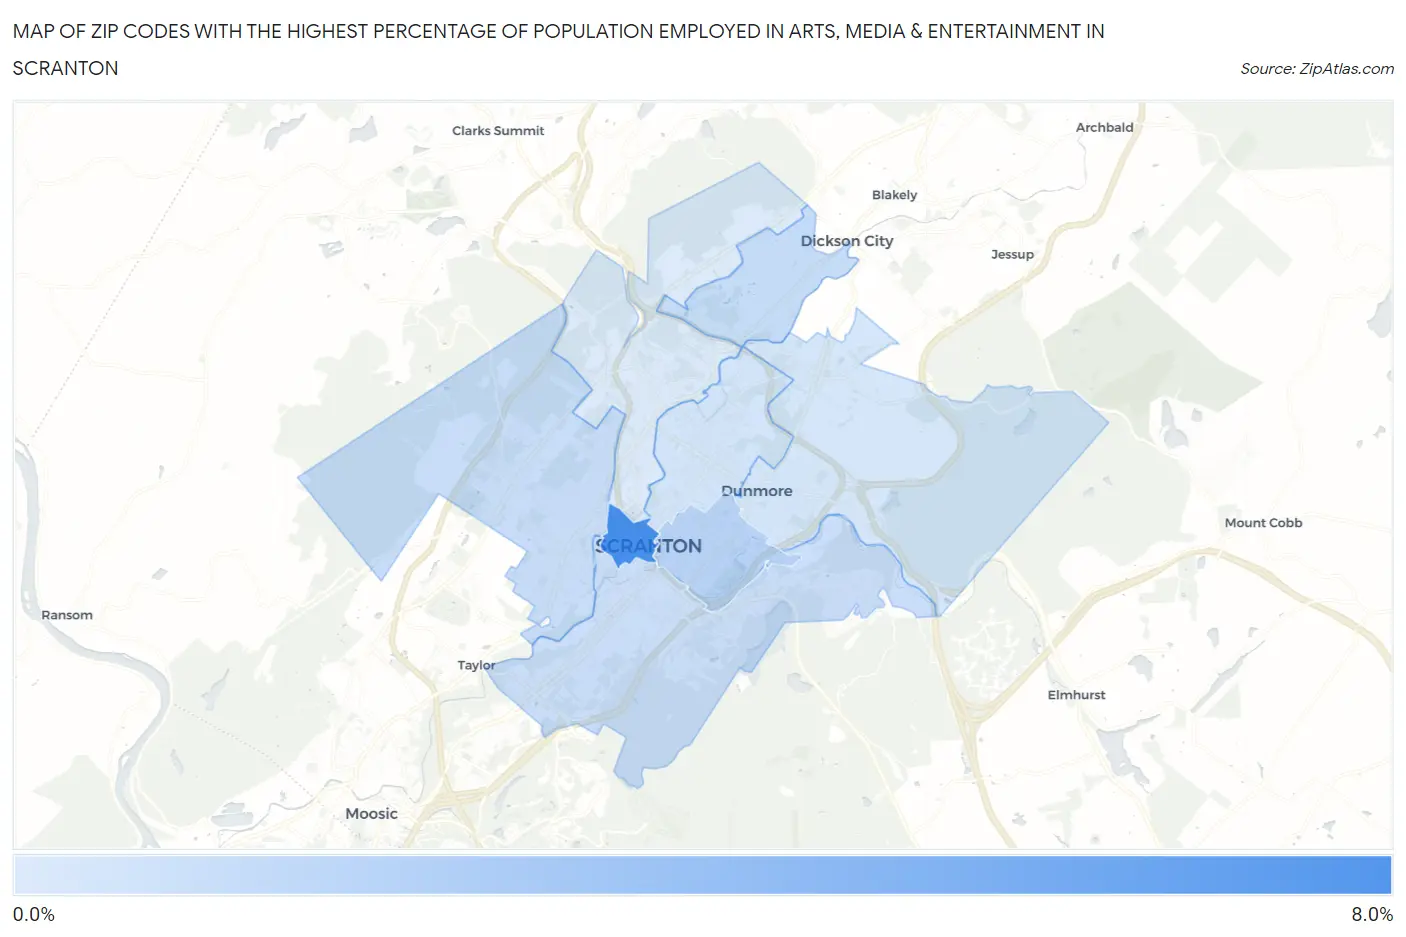
Map of Zip Codes with the Highest Percentage of Population Employed in Arts, Media & Entertainment in Scranton
0.81%
7.5%
Zip Codes with the Highest Percentage of Population Employed in Arts, Media & Entertainment in Scranton, PA
| Zip Code | % Employed | vs State | vs National | |
| 1. | 18503 | 7.5% | 1.8%(+5.75)#27 | 2.1%(+5.44)#647 |
| 2. | 18510 | 2.4% | 1.8%(+0.684)#245 | 2.1%(+0.377)#5,797 |
| 3. | 18519 | 1.8% | 1.8%(+0.015)#425 | 2.1%(-0.292)#9,163 |
| 4. | 18504 | 1.7% | 1.8%(-0.065)#453 | 2.1%(-0.372)#9,718 |
| 5. | 18505 | 1.6% | 1.8%(-0.172)#496 | 2.1%(-0.479)#10,447 |
| 6. | 18509 | 1.2% | 1.8%(-0.505)#637 | 2.1%(-0.813)#12,873 |
| 7. | 18512 | 1.1% | 1.8%(-0.652)#712 | 2.1%(-0.959)#13,991 |
| 8. | 18508 | 0.81% | 1.8%(-0.947)#857 | 2.1%(-1.25)#16,370 |
1
Common Questions
What are the Top 5 Zip Codes with the Highest Percentage of Population Employed in Arts, Media & Entertainment in Scranton, PA?
Top 5 Zip Codes with the Highest Percentage of Population Employed in Arts, Media & Entertainment in Scranton, PA are:
What zip code has the Highest Percentage of Population Employed in Arts, Media & Entertainment in Scranton, PA?
18503 has the Highest Percentage of Population Employed in Arts, Media & Entertainment in Scranton, PA with 7.5%.
What is the Percentage of Population Employed in Arts, Media & Entertainment in Scranton, PA?
Percentage of Population Employed in Arts, Media & Entertainment in Scranton is 1.7%.
What is the Percentage of Population Employed in Arts, Media & Entertainment in Pennsylvania?
Percentage of Population Employed in Arts, Media & Entertainment in Pennsylvania is 1.8%.
What is the Percentage of Population Employed in Arts, Media & Entertainment in the United States?
Percentage of Population Employed in Arts, Media & Entertainment in the United States is 2.1%.