Zip Codes with the Highest Percentage of Population Employed in Community & Social Service in Scranton, PA
RELATED REPORTS & OPTIONS
Community & Social Service
Scranton
Compare Zip Codes
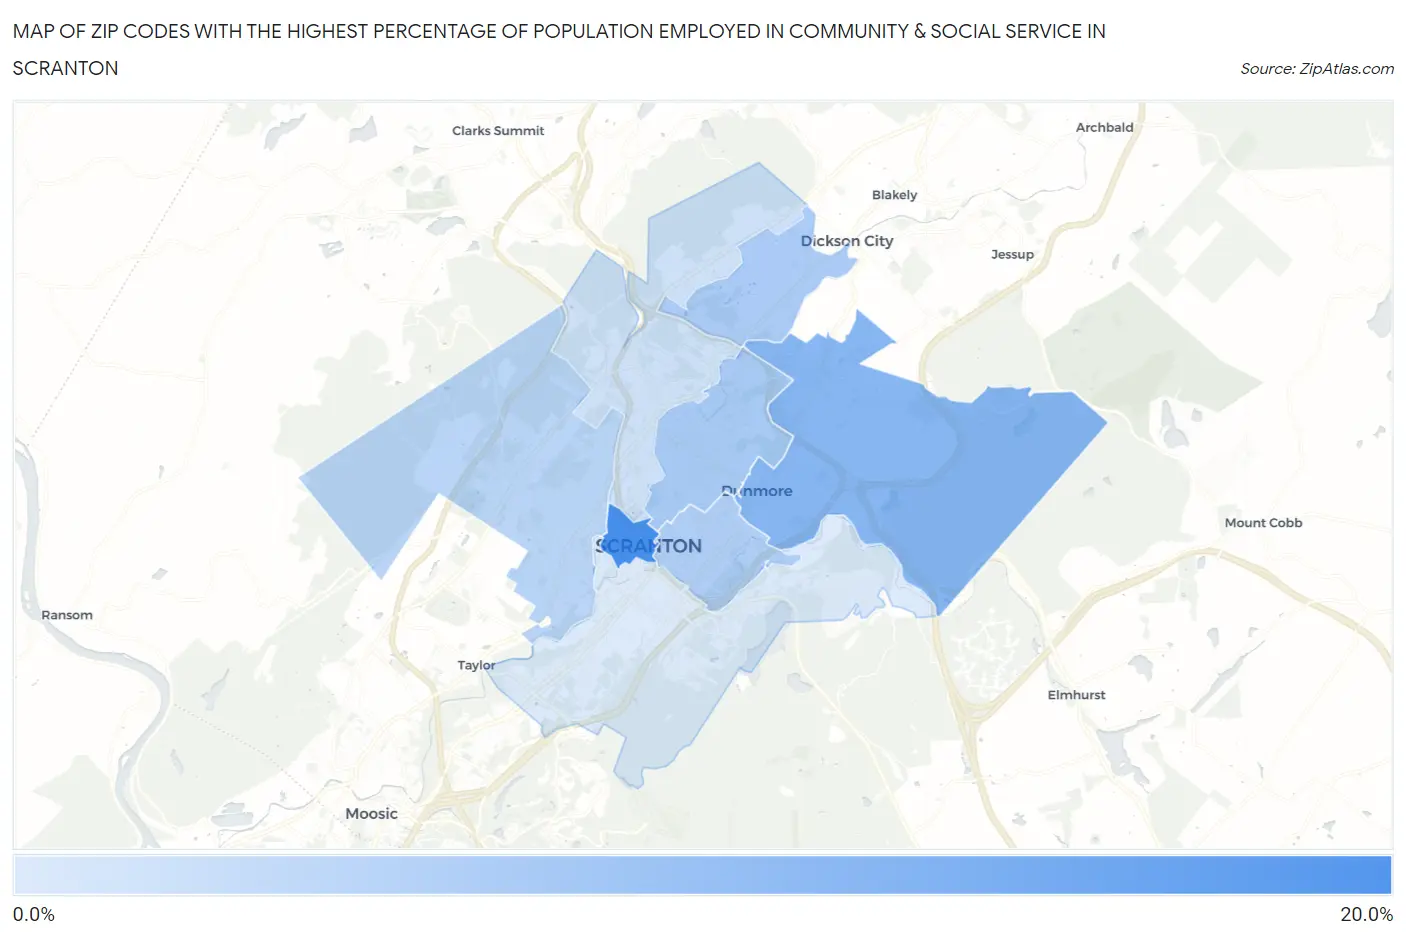
Map of Zip Codes with the Highest Percentage of Population Employed in Community & Social Service in Scranton
7.8%
18.5%
Zip Codes with the Highest Percentage of Population Employed in Community & Social Service in Scranton, PA
| Zip Code | % Employed | vs State | vs National | |
| 1. | 18503 | 18.5% | 11.2%(+7.37)#111 | 11.2%(+7.33)#2,581 |
| 2. | 18512 | 13.9% | 11.2%(+2.69)#263 | 11.2%(+2.65)#6,252 |
| 3. | 18509 | 11.4% | 11.2%(+0.232)#465 | 11.2%(+0.194)#10,647 |
| 4. | 18519 | 11.3% | 11.2%(+0.170)#475 | 11.2%(+0.132)#10,795 |
| 5. | 18510 | 11.0% | 11.2%(-0.216)#531 | 11.2%(-0.254)#11,737 |
| 6. | 18504 | 10.2% | 11.2%(-0.992)#622 | 11.2%(-1.03)#13,646 |
| 7. | 18508 | 8.7% | 11.2%(-2.48)#838 | 11.2%(-2.52)#17,652 |
| 8. | 18505 | 7.8% | 11.2%(-3.39)#981 | 11.2%(-3.42)#20,170 |
1
Common Questions
What are the Top 5 Zip Codes with the Highest Percentage of Population Employed in Community & Social Service in Scranton, PA?
Top 5 Zip Codes with the Highest Percentage of Population Employed in Community & Social Service in Scranton, PA are:
What zip code has the Highest Percentage of Population Employed in Community & Social Service in Scranton, PA?
18503 has the Highest Percentage of Population Employed in Community & Social Service in Scranton, PA with 18.5%.
What is the Percentage of Population Employed in Community & Social Service in Scranton, PA?
Percentage of Population Employed in Community & Social Service in Scranton is 9.6%.
What is the Percentage of Population Employed in Community & Social Service in Pennsylvania?
Percentage of Population Employed in Community & Social Service in Pennsylvania is 11.2%.
What is the Percentage of Population Employed in Community & Social Service in the United States?
Percentage of Population Employed in Community & Social Service in the United States is 11.2%.