Zip Codes with the Highest Percentage of Immigrants from Eastern Asia in Scranton, PA
RELATED REPORTS & OPTIONS
Eastern Asia
Scranton
Compare Zip Codes
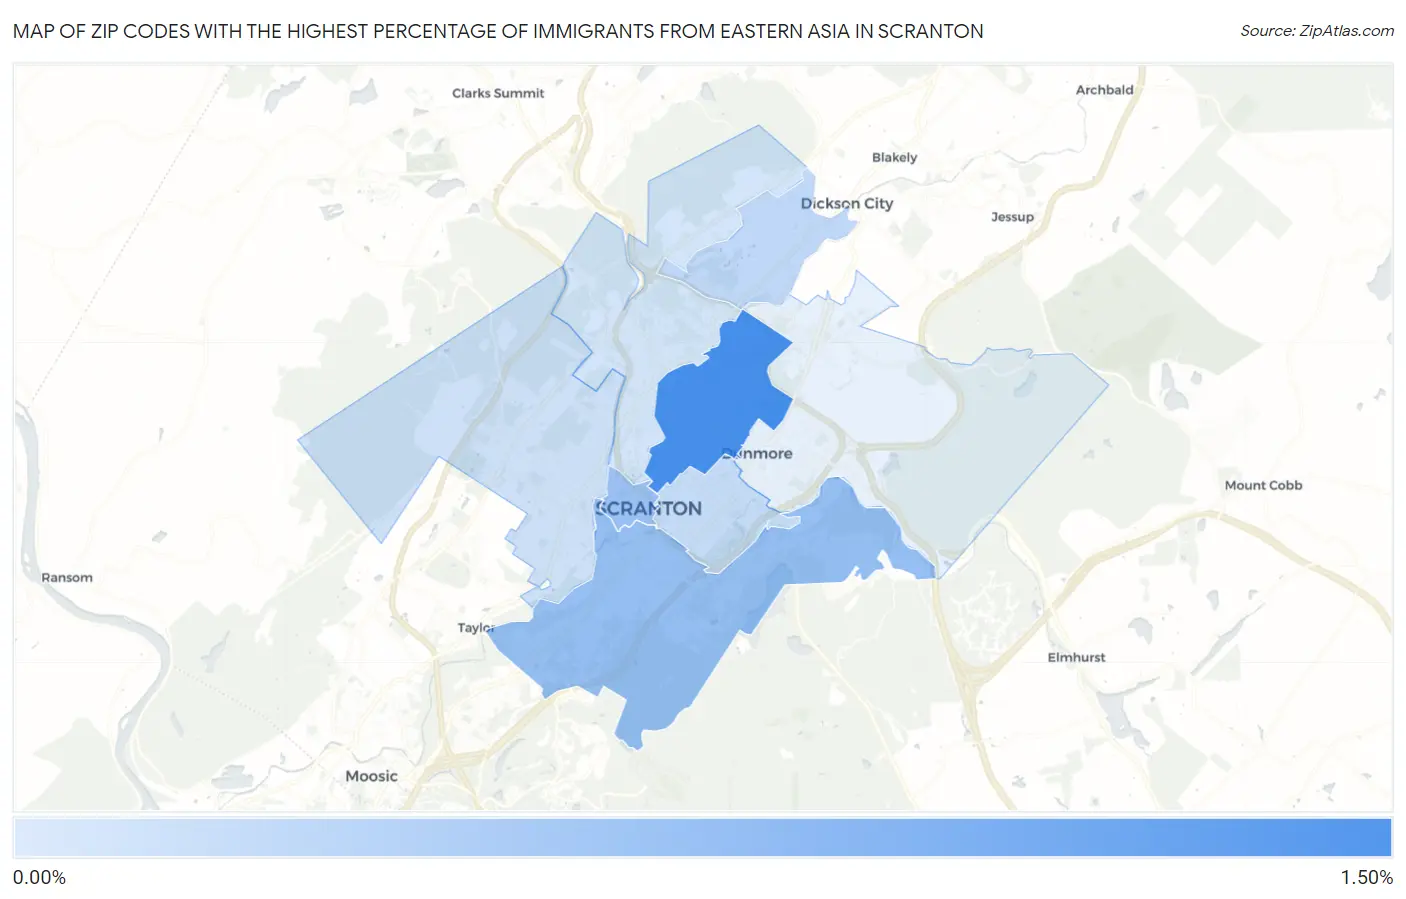
Map of Zip Codes with the Highest Percentage of Immigrants from Eastern Asia in Scranton
0.071%
1.20%
Zip Codes with the Highest Percentage of Immigrants from Eastern Asia in Scranton, PA
| Zip Code | Eastern Asia | vs State | vs National | |
| 1. | 18509 | 1.20% | 0.84%(+0.355)#150 | 1.28%(-0.078)#3,291 |
| 2. | 18505 | 0.57% | 0.84%(-0.268)#271 | 1.28%(-0.701)#6,015 |
| 3. | 18503 | 0.54% | 0.84%(-0.305)#288 | 1.28%(-0.738)#6,296 |
| 4. | 18519 | 0.23% | 0.84%(-0.608)#488 | 1.28%(-1.04)#9,727 |
| 5. | 18510 | 0.18% | 0.84%(-0.663)#552 | 1.28%(-1.10)#10,667 |
| 6. | 18504 | 0.10% | 0.84%(-0.740)#634 | 1.28%(-1.17)#12,109 |
| 7. | 18508 | 0.071% | 0.84%(-0.771)#671 | 1.28%(-1.20)#12,803 |
1
Common Questions
What are the Top 5 Zip Codes with the Highest Percentage of Immigrants from Eastern Asia in Scranton, PA?
Top 5 Zip Codes with the Highest Percentage of Immigrants from Eastern Asia in Scranton, PA are:
What zip code has the Highest Percentage of Immigrants from Eastern Asia in Scranton, PA?
18509 has the Highest Percentage of Immigrants from Eastern Asia in Scranton, PA with 1.20%.
What is the Percentage of Immigrants from Eastern Asia in Scranton, PA?
Percentage of Immigrants from Eastern Asia in Scranton is 0.40%.
What is the Percentage of Immigrants from Eastern Asia in Pennsylvania?
Percentage of Immigrants from Eastern Asia in Pennsylvania is 0.84%.
What is the Percentage of Immigrants from Eastern Asia in the United States?
Percentage of Immigrants from Eastern Asia in the United States is 1.28%.