Zip Codes with the Highest Percentage of Population Employed in Information in Scranton, PA
RELATED REPORTS & OPTIONS
Information & Technology
Scranton
Compare Zip Codes
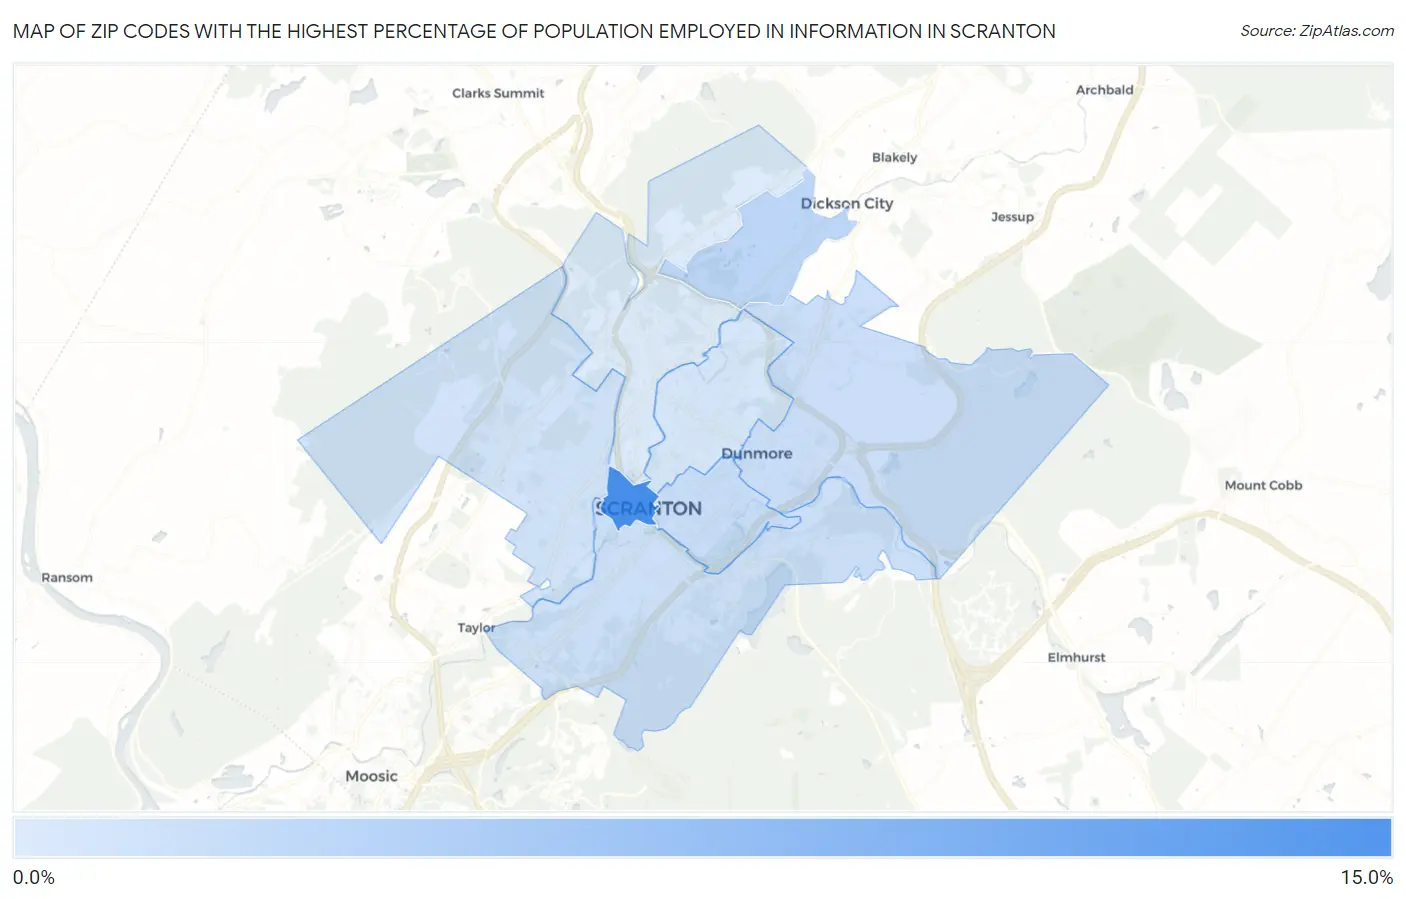
Map of Zip Codes with the Highest Percentage of Population Employed in Information in Scranton
0.63%
12.8%
Zip Codes with the Highest Percentage of Population Employed in Information in Scranton, PA
| Zip Code | % Employed | vs State | vs National | |
| 1. | 18503 | 12.8% | 1.5%(+11.3)#10 | 1.9%(+10.9)#206 |
| 2. | 18519 | 3.1% | 1.5%(+1.60)#136 | 1.9%(+1.25)#3,245 |
| 3. | 18510 | 2.2% | 1.5%(+0.632)#281 | 1.9%(+0.281)#6,223 |
| 4. | 18512 | 2.0% | 1.5%(+0.477)#317 | 1.9%(+0.127)#7,007 |
| 5. | 18505 | 1.8% | 1.5%(+0.290)#371 | 1.9%(-0.061)#8,089 |
| 6. | 18504 | 1.6% | 1.5%(+0.013)#467 | 1.9%(-0.337)#9,925 |
| 7. | 18509 | 1.1% | 1.5%(-0.421)#683 | 1.9%(-0.771)#13,588 |
| 8. | 18508 | 0.63% | 1.5%(-0.918)#928 | 1.9%(-1.27)#18,131 |
1
Common Questions
What are the Top 5 Zip Codes with the Highest Percentage of Population Employed in Information in Scranton, PA?
Top 5 Zip Codes with the Highest Percentage of Population Employed in Information in Scranton, PA are:
What zip code has the Highest Percentage of Population Employed in Information in Scranton, PA?
18503 has the Highest Percentage of Population Employed in Information in Scranton, PA with 12.8%.
What is the Percentage of Population Employed in Information in Scranton, PA?
Percentage of Population Employed in Information in Scranton is 1.6%.
What is the Percentage of Population Employed in Information in Pennsylvania?
Percentage of Population Employed in Information in Pennsylvania is 1.5%.
What is the Percentage of Population Employed in Information in the United States?
Percentage of Population Employed in Information in the United States is 1.9%.