Zip Codes with the Highest Percentage of Households with Income Above $100,000 in Scranton, PA
RELATED REPORTS & OPTIONS
Household Income | $100k+
Scranton
Compare Zip Codes
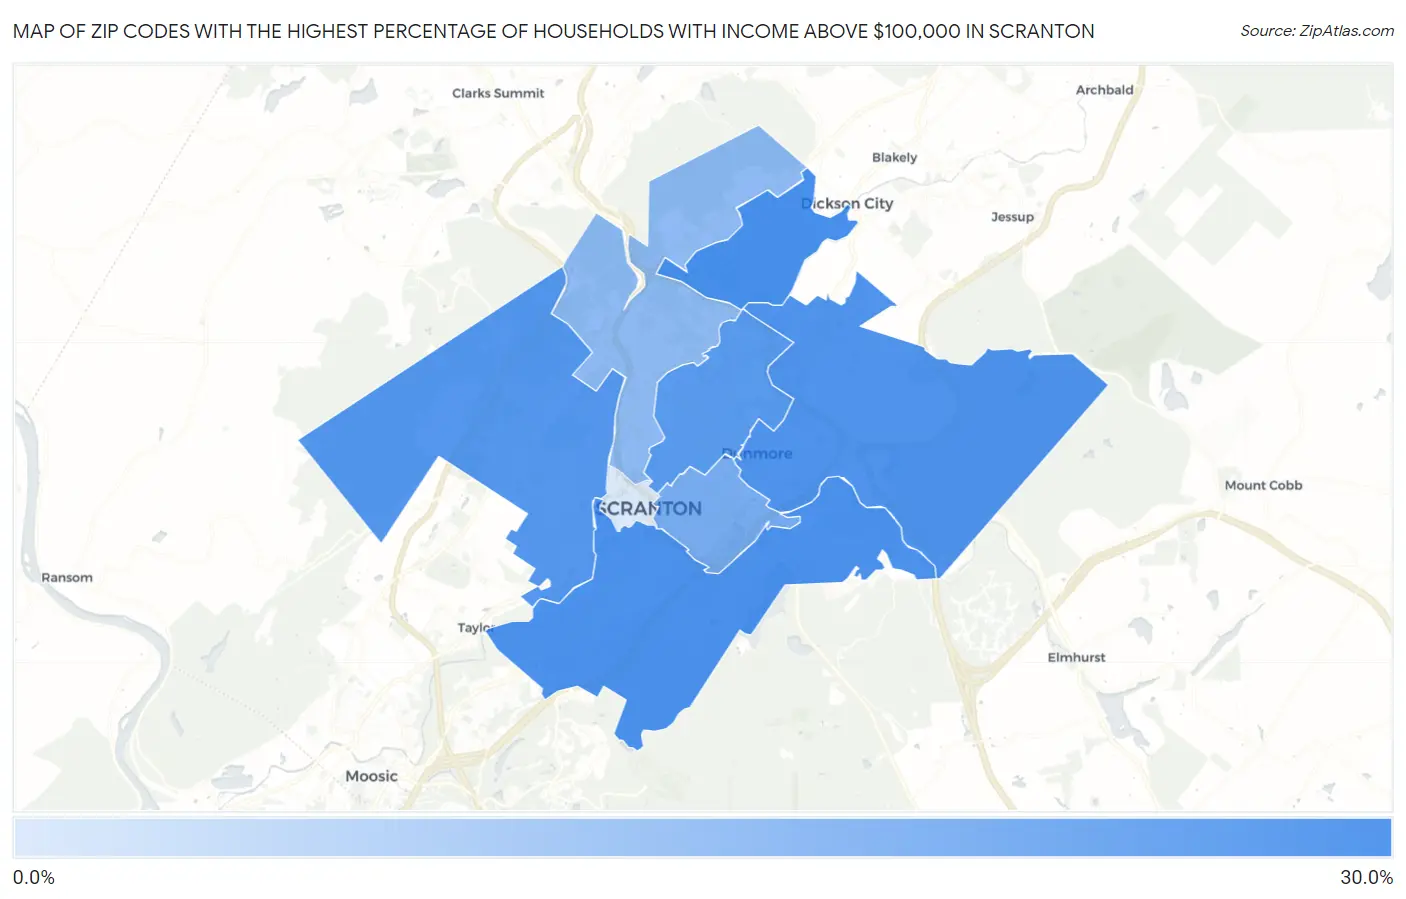
Map of Zip Codes with the Highest Percentage of Households with Income Above $100,000 in Scranton
5.1%
26.2%
Zip Codes with the Highest Percentage of Households with Income Above $100,000 in Scranton, PA
| Zip Code | Households with Income > $100k | vs State | vs National | |
| 1. | 18519 | 26.2% | 35.9%(-9.70)#1,066 | 37.3%(-11.1)#18,720 |
| 2. | 18505 | 25.5% | 35.9%(-10.4)#1,106 | 37.3%(-11.8)#19,325 |
| 3. | 18512 | 25.2% | 35.9%(-10.7)#1,124 | 37.3%(-12.1)#19,570 |
| 4. | 18504 | 24.1% | 35.9%(-11.8)#1,182 | 37.3%(-13.2)#20,577 |
| 5. | 18509 | 23.6% | 35.9%(-12.3)#1,207 | 37.3%(-13.7)#21,025 |
| 6. | 18510 | 19.1% | 35.9%(-16.8)#1,420 | 37.3%(-18.2)#24,755 |
| 7. | 18508 | 15.5% | 35.9%(-20.4)#1,539 | 37.3%(-21.8)#27,245 |
| 8. | 18503 | 5.1% | 35.9%(-30.8)#1,722 | 37.3%(-32.2)#31,048 |
1
Common Questions
What are the Top 5 Zip Codes with the Highest Percentage of Households with Income Above $100,000 in Scranton, PA?
Top 5 Zip Codes with the Highest Percentage of Households with Income Above $100,000 in Scranton, PA are:
What zip code has the Highest Percentage of Households with Income Above $100,000 in Scranton, PA?
18519 has the Highest Percentage of Households with Income Above $100,000 in Scranton, PA with 26.2%.
What is the Percentage of Households with Income Above $100,000 in Scranton, PA?
Percentage of Households with Income Above $100,000 in Scranton is 21.1%.
What is the Percentage of Households with Income Above $100,000 in Pennsylvania?
Percentage of Households with Income Above $100,000 in Pennsylvania is 35.9%.
What is the Percentage of Households with Income Above $100,000 in the United States?
Percentage of Households with Income Above $100,000 in the United States is 37.3%.