Zip Codes with the Highest Percentage of Population with a Degree in Social Sciences in Scranton, PA
RELATED REPORTS & OPTIONS
Social Sciences
Scranton
Compare Zip Codes
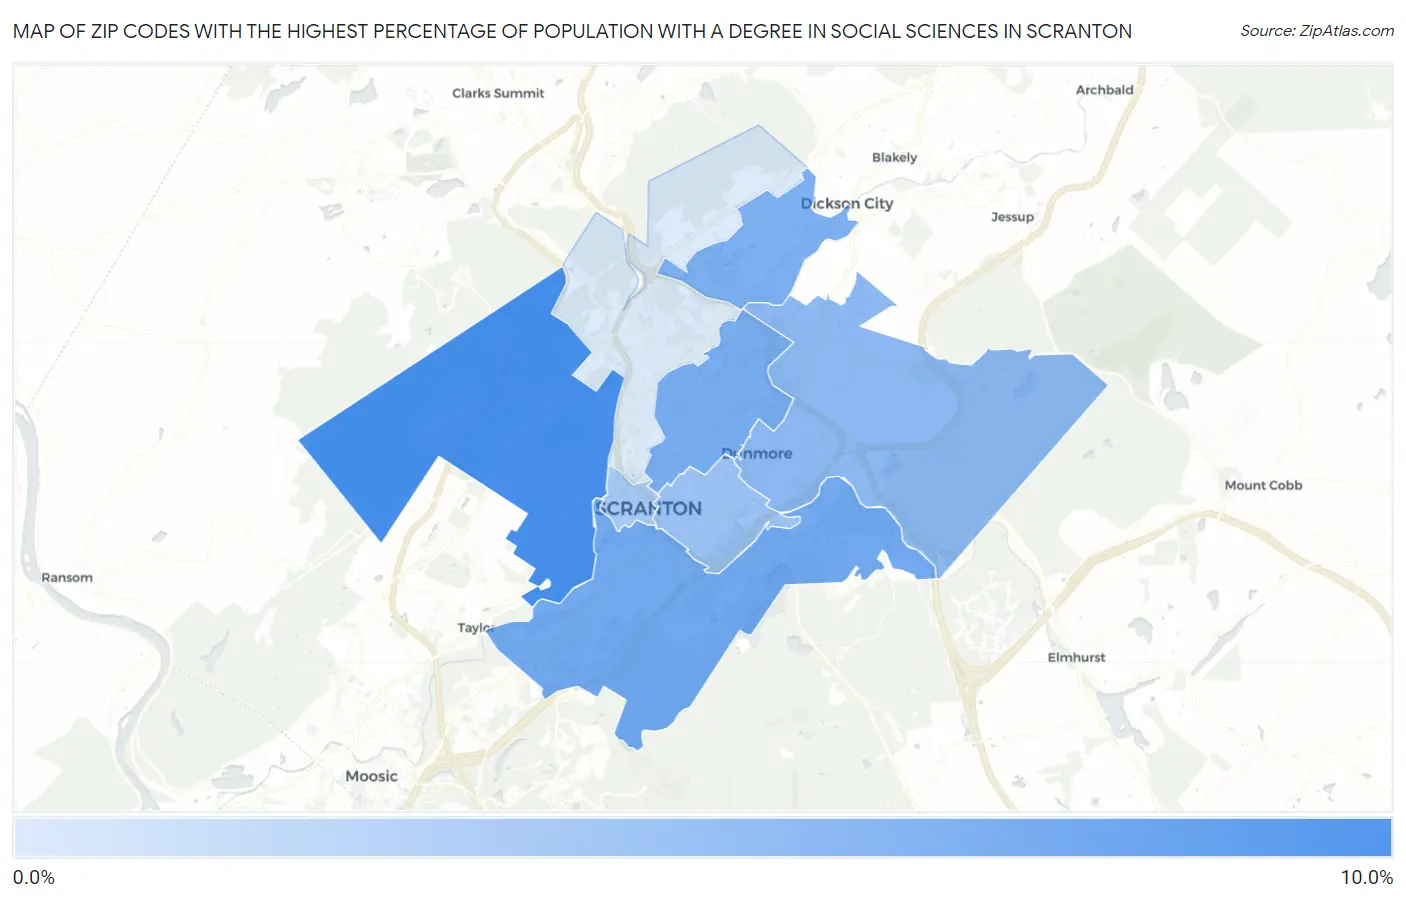
Map of Zip Codes with the Highest Percentage of Population with a Degree in Social Sciences in Scranton
2.0%
9.1%
Zip Codes with the Highest Percentage of Population with a Degree in Social Sciences in Scranton, PA
| Zip Code | % Graduates | vs State | vs National | |
| 1. | 18504 | 9.1% | 7.2%(+1.96)#322 | 8.1%(+1.05)#6,746 |
| 2. | 18505 | 7.0% | 7.2%(-0.176)#522 | 8.1%(-1.08)#10,927 |
| 3. | 18509 | 6.7% | 7.2%(-0.452)#560 | 8.1%(-1.36)#11,572 |
| 4. | 18519 | 6.5% | 7.2%(-0.654)#590 | 8.1%(-1.56)#12,073 |
| 5. | 18512 | 5.8% | 7.2%(-1.41)#708 | 8.1%(-2.32)#13,933 |
| 6. | 18510 | 4.9% | 7.2%(-2.23)#846 | 8.1%(-3.13)#15,988 |
| 7. | 18503 | 4.5% | 7.2%(-2.67)#918 | 8.1%(-3.57)#17,023 |
| 8. | 18508 | 2.0% | 7.2%(-5.20)#1,223 | 8.1%(-6.10)#22,229 |
1
Common Questions
What are the Top 5 Zip Codes with the Highest Percentage of Population with a Degree in Social Sciences in Scranton, PA?
Top 5 Zip Codes with the Highest Percentage of Population with a Degree in Social Sciences in Scranton, PA are:
What zip code has the Highest Percentage of Population with a Degree in Social Sciences in Scranton, PA?
18504 has the Highest Percentage of Population with a Degree in Social Sciences in Scranton, PA with 9.1%.
What is the Percentage of Population with a Degree in Social Sciences in Scranton, PA?
Percentage of Population with a Degree in Social Sciences in Scranton is 6.9%.
What is the Percentage of Population with a Degree in Social Sciences in Pennsylvania?
Percentage of Population with a Degree in Social Sciences in Pennsylvania is 7.2%.
What is the Percentage of Population with a Degree in Social Sciences in the United States?
Percentage of Population with a Degree in Social Sciences in the United States is 8.1%.