Zip Codes with the Highest Percentage of Population with a Degree in Science and Engineering in Scranton, PA
RELATED REPORTS & OPTIONS
Science and Engineering
Scranton
Compare Zip Codes
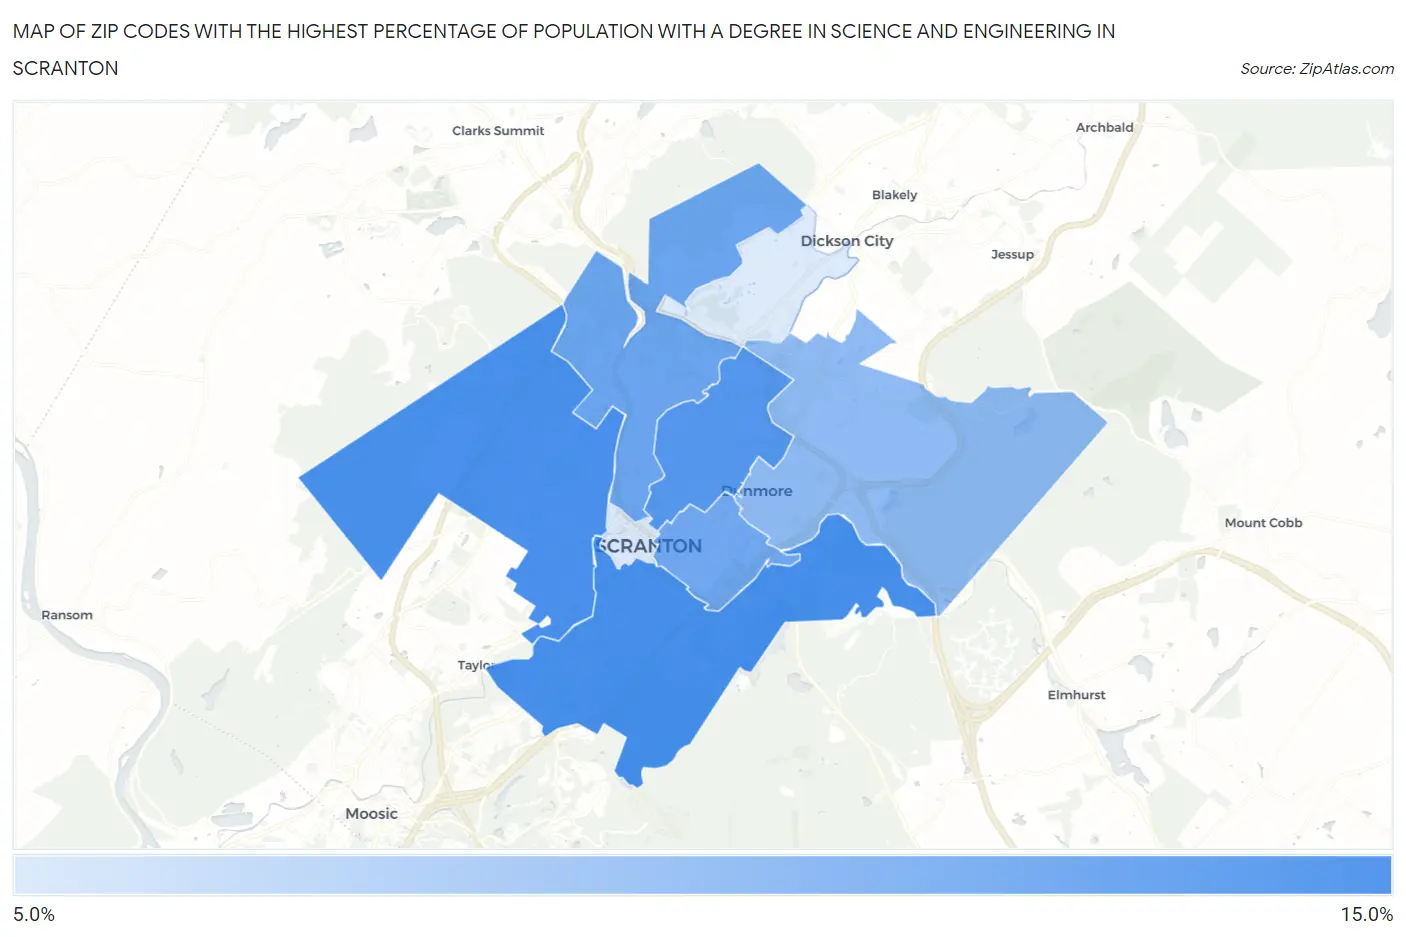
Map of Zip Codes with the Highest Percentage of Population with a Degree in Science and Engineering in Scranton
5.1%
14.0%
Zip Codes with the Highest Percentage of Population with a Degree in Science and Engineering in Scranton, PA
| Zip Code | % Graduates | vs State | vs National | |
| 1. | 18505 | 14.0% | 10.9%(+3.12)#561 | 9.8%(+4.20)#7,878 |
| 2. | 18504 | 13.8% | 10.9%(+2.95)#572 | 9.8%(+4.03)#8,109 |
| 3. | 18509 | 13.1% | 10.9%(+2.23)#637 | 9.8%(+3.31)#9,104 |
| 4. | 18508 | 11.8% | 10.9%(+0.892)#763 | 9.8%(+1.97)#11,371 |
| 5. | 18510 | 11.4% | 10.9%(+0.580)#801 | 9.8%(+1.66)#11,943 |
| 6. | 18512 | 9.7% | 10.9%(-1.16)#1,011 | 9.8%(-0.082)#15,709 |
| 7. | 18503 | 5.2% | 10.9%(-5.61)#1,375 | 9.8%(-4.53)#24,431 |
| 8. | 18519 | 5.1% | 10.9%(-5.78)#1,381 | 9.8%(-4.70)#24,640 |
1
Common Questions
What are the Top 5 Zip Codes with the Highest Percentage of Population with a Degree in Science and Engineering in Scranton, PA?
Top 5 Zip Codes with the Highest Percentage of Population with a Degree in Science and Engineering in Scranton, PA are:
What zip code has the Highest Percentage of Population with a Degree in Science and Engineering in Scranton, PA?
18505 has the Highest Percentage of Population with a Degree in Science and Engineering in Scranton, PA with 14.0%.
What is the Percentage of Population with a Degree in Science and Engineering in Scranton, PA?
Percentage of Population with a Degree in Science and Engineering in Scranton is 12.5%.
What is the Percentage of Population with a Degree in Science and Engineering in Pennsylvania?
Percentage of Population with a Degree in Science and Engineering in Pennsylvania is 10.9%.
What is the Percentage of Population with a Degree in Science and Engineering in the United States?
Percentage of Population with a Degree in Science and Engineering in the United States is 9.8%.