Zip Codes with the Highest Percentage of Population Employed in Education, Arts & Media in Scranton, PA
RELATED REPORTS & OPTIONS
Education, Arts & Media
Scranton
Compare Zip Codes
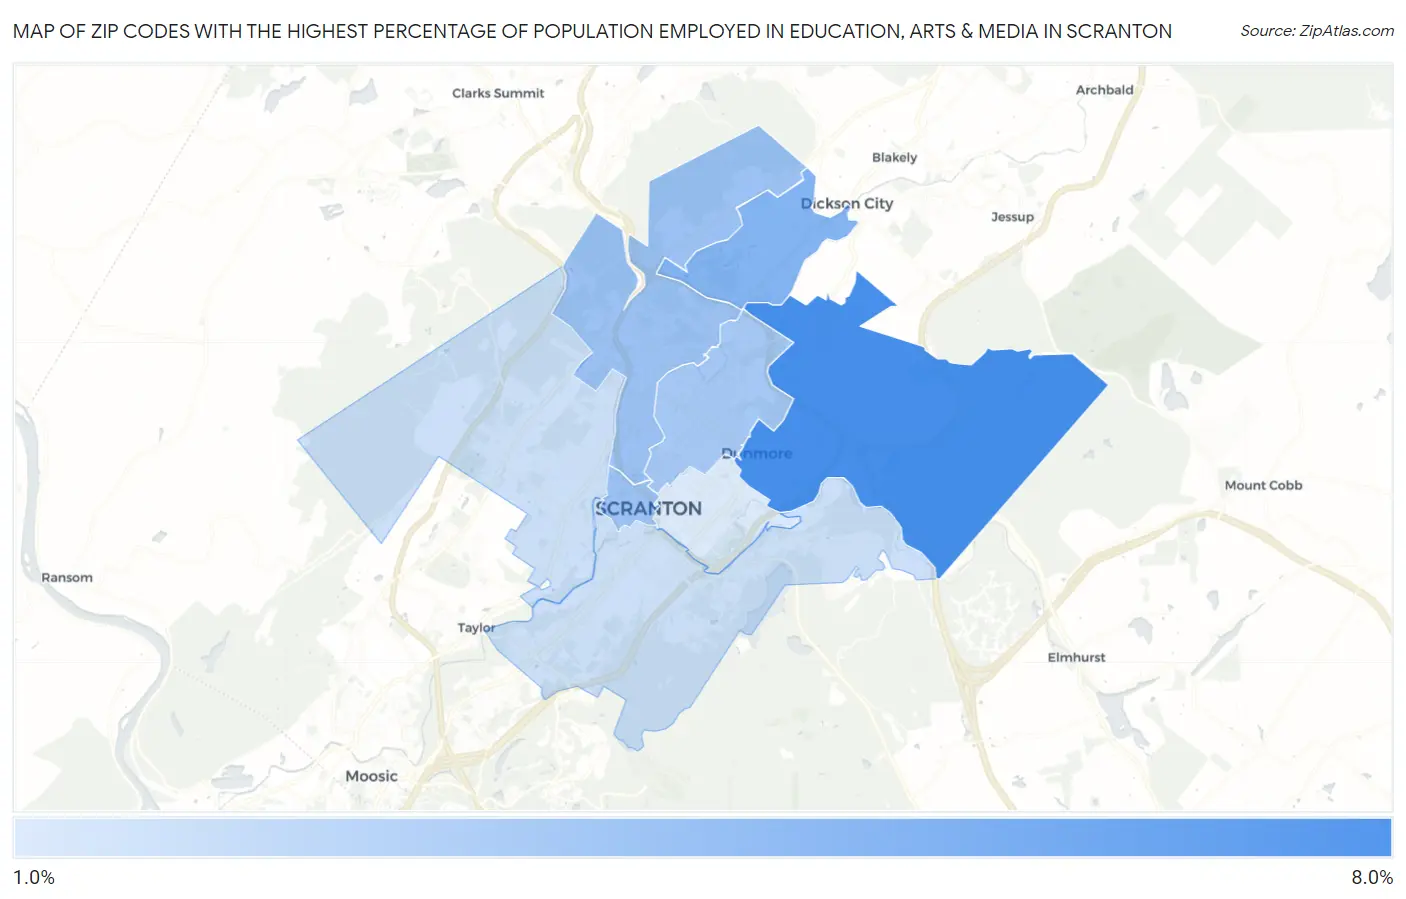
Map of Zip Codes with the Highest Percentage of Population Employed in Education, Arts & Media in Scranton
1.8%
6.2%
Zip Codes with the Highest Percentage of Population Employed in Education, Arts & Media in Scranton, PA
| Zip Code | % Employed | vs State | vs National | |
| 1. | 18512 | 6.2% | 2.1%(+4.07)#61 | 1.8%(+4.39)#1,023 |
| 2. | 18519 | 4.4% | 2.1%(+2.34)#115 | 1.8%(+2.66)#1,967 |
| 3. | 18503 | 3.8% | 2.1%(+1.65)#177 | 1.8%(+1.97)#2,838 |
| 4. | 18508 | 3.7% | 2.1%(+1.57)#186 | 1.8%(+1.89)#2,964 |
| 5. | 18509 | 3.4% | 2.1%(+1.31)#232 | 1.8%(+1.63)#3,435 |
| 6. | 18504 | 2.3% | 2.1%(+0.220)#473 | 1.8%(+0.540)#7,452 |
| 7. | 18505 | 2.3% | 2.1%(+0.203)#481 | 1.8%(+0.523)#7,563 |
| 8. | 18510 | 1.8% | 2.1%(-0.265)#682 | 1.8%(+0.054)#10,837 |
1
Common Questions
What are the Top 5 Zip Codes with the Highest Percentage of Population Employed in Education, Arts & Media in Scranton, PA?
Top 5 Zip Codes with the Highest Percentage of Population Employed in Education, Arts & Media in Scranton, PA are:
What zip code has the Highest Percentage of Population Employed in Education, Arts & Media in Scranton, PA?
18512 has the Highest Percentage of Population Employed in Education, Arts & Media in Scranton, PA with 6.2%.
What is the Percentage of Population Employed in Education, Arts & Media in Scranton, PA?
Percentage of Population Employed in Education, Arts & Media in Scranton is 2.5%.
What is the Percentage of Population Employed in Education, Arts & Media in Pennsylvania?
Percentage of Population Employed in Education, Arts & Media in Pennsylvania is 2.1%.
What is the Percentage of Population Employed in Education, Arts & Media in the United States?
Percentage of Population Employed in Education, Arts & Media in the United States is 1.8%.