Zip Codes with the Highest Percentage of Population Employed in Manufacturing in Scranton, PA
RELATED REPORTS & OPTIONS
Manufacturing
Scranton
Compare Zip Codes
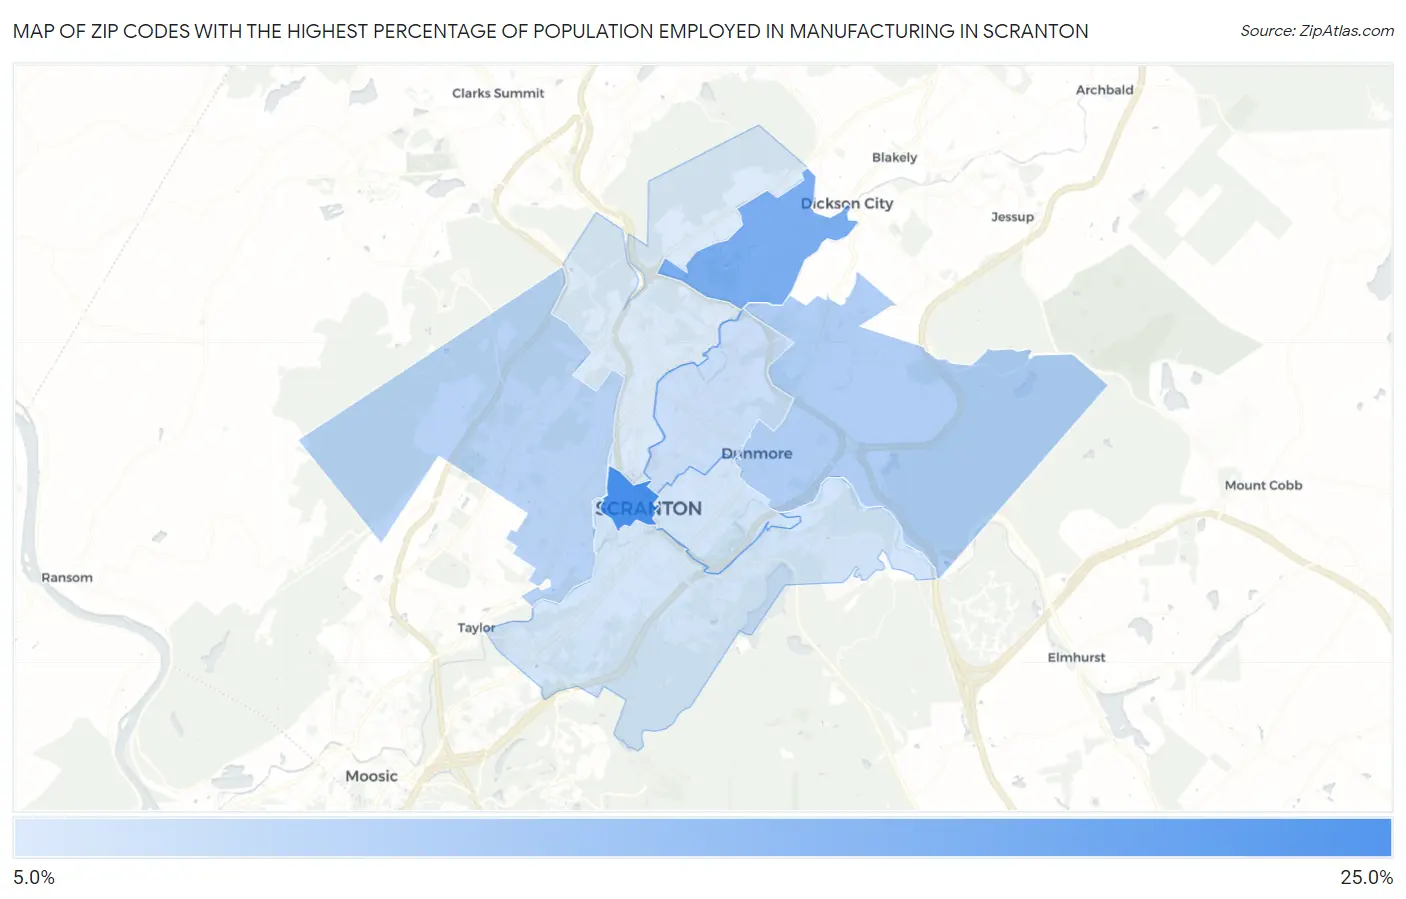
Map of Zip Codes with the Highest Percentage of Population Employed in Manufacturing in Scranton
7.3%
20.5%
Zip Codes with the Highest Percentage of Population Employed in Manufacturing in Scranton, PA
| Zip Code | % Employed | vs State | vs National | |
| 1. | 18503 | 20.5% | 11.6%(+8.97)#320 | 10.0%(+10.5)#4,543 |
| 2. | 18519 | 15.8% | 11.6%(+4.23)#596 | 10.0%(+5.80)#8,222 |
| 3. | 18512 | 11.1% | 11.6%(-0.431)#1,037 | 10.0%(+1.14)#13,969 |
| 4. | 18504 | 10.3% | 11.6%(-1.26)#1,117 | 10.0%(+0.310)#15,288 |
| 5. | 18509 | 8.7% | 11.6%(-2.82)#1,274 | 10.0%(-1.25)#17,865 |
| 6. | 18505 | 8.0% | 11.6%(-3.52)#1,346 | 10.0%(-1.95)#19,098 |
| 7. | 18510 | 8.0% | 11.6%(-3.60)#1,363 | 10.0%(-2.03)#19,246 |
| 8. | 18508 | 7.3% | 11.6%(-4.28)#1,410 | 10.0%(-2.71)#20,464 |
1
Common Questions
What are the Top 5 Zip Codes with the Highest Percentage of Population Employed in Manufacturing in Scranton, PA?
Top 5 Zip Codes with the Highest Percentage of Population Employed in Manufacturing in Scranton, PA are:
What zip code has the Highest Percentage of Population Employed in Manufacturing in Scranton, PA?
18503 has the Highest Percentage of Population Employed in Manufacturing in Scranton, PA with 20.5%.
What is the Percentage of Population Employed in Manufacturing in Scranton, PA?
Percentage of Population Employed in Manufacturing in Scranton is 8.8%.
What is the Percentage of Population Employed in Manufacturing in Pennsylvania?
Percentage of Population Employed in Manufacturing in Pennsylvania is 11.6%.
What is the Percentage of Population Employed in Manufacturing in the United States?
Percentage of Population Employed in Manufacturing in the United States is 10.0%.