Zip Codes with the Highest Percentage of Population Employed in Utilities in Scranton, PA
RELATED REPORTS & OPTIONS
Utilities
Scranton
Compare Zip Codes
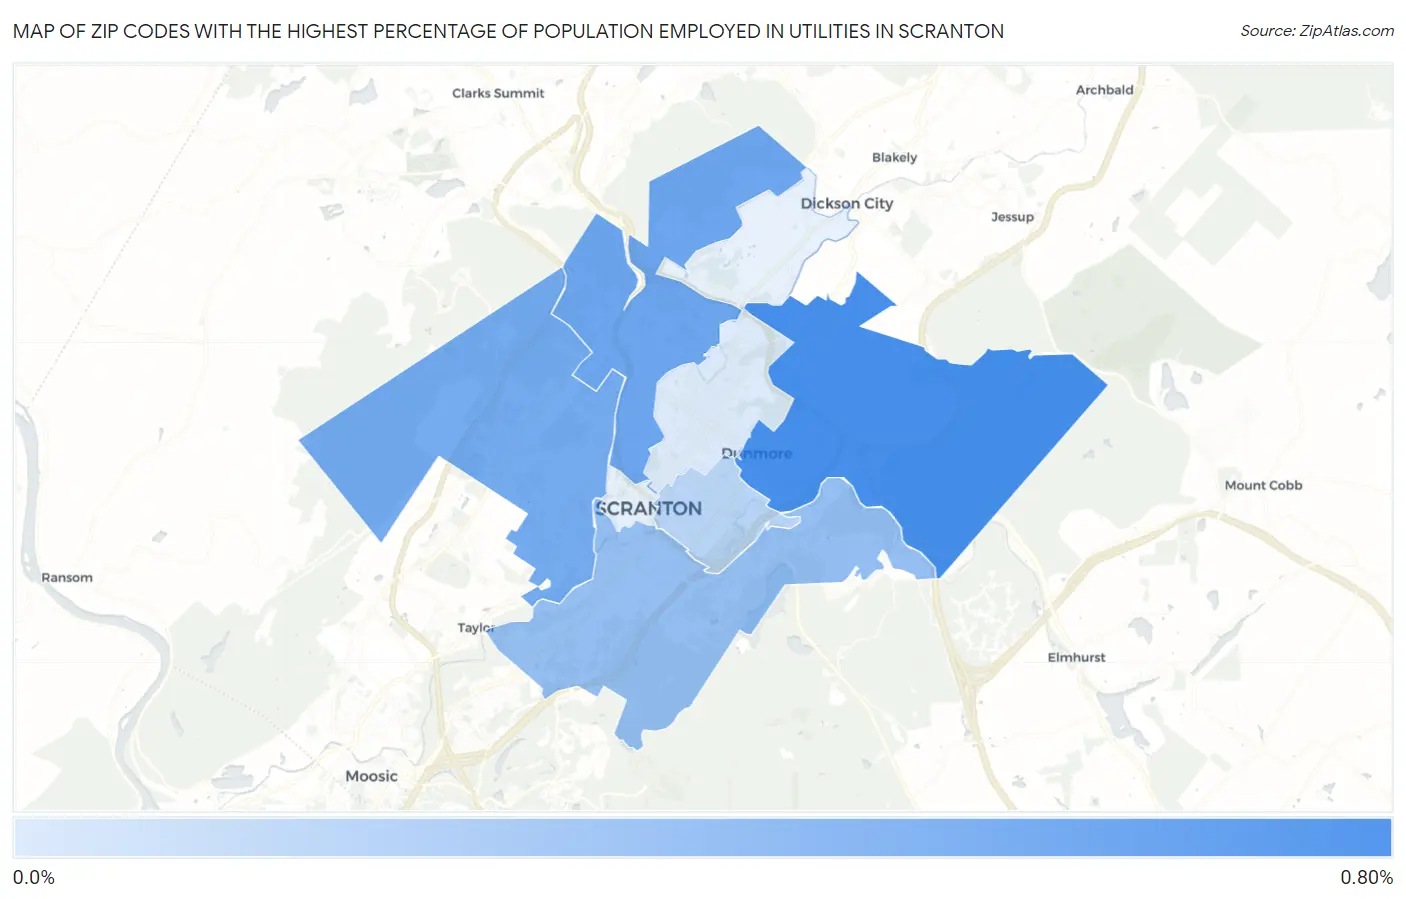
Map of Zip Codes with the Highest Percentage of Population Employed in Utilities in Scranton
0.14%
0.78%
Zip Codes with the Highest Percentage of Population Employed in Utilities in Scranton, PA
| Zip Code | % Employed | vs State | vs National | |
| 1. | 18512 | 0.78% | 0.91%(-0.128)#727 | 0.84%(-0.060)#12,626 |
| 2. | 18508 | 0.61% | 0.91%(-0.295)#827 | 0.84%(-0.227)#14,636 |
| 3. | 18504 | 0.58% | 0.91%(-0.321)#844 | 0.84%(-0.253)#14,966 |
| 4. | 18505 | 0.44% | 0.91%(-0.463)#938 | 0.84%(-0.395)#16,945 |
| 5. | 18510 | 0.29% | 0.91%(-0.615)#1,045 | 0.84%(-0.547)#19,107 |
| 6. | 18509 | 0.14% | 0.91%(-0.766)#1,120 | 0.84%(-0.698)#20,908 |
1
Common Questions
What are the Top 5 Zip Codes with the Highest Percentage of Population Employed in Utilities in Scranton, PA?
Top 5 Zip Codes with the Highest Percentage of Population Employed in Utilities in Scranton, PA are:
What zip code has the Highest Percentage of Population Employed in Utilities in Scranton, PA?
18512 has the Highest Percentage of Population Employed in Utilities in Scranton, PA with 0.78%.
What is the Percentage of Population Employed in Utilities in Scranton, PA?
Percentage of Population Employed in Utilities in Scranton is 0.38%.
What is the Percentage of Population Employed in Utilities in Pennsylvania?
Percentage of Population Employed in Utilities in Pennsylvania is 0.91%.
What is the Percentage of Population Employed in Utilities in the United States?
Percentage of Population Employed in Utilities in the United States is 0.84%.