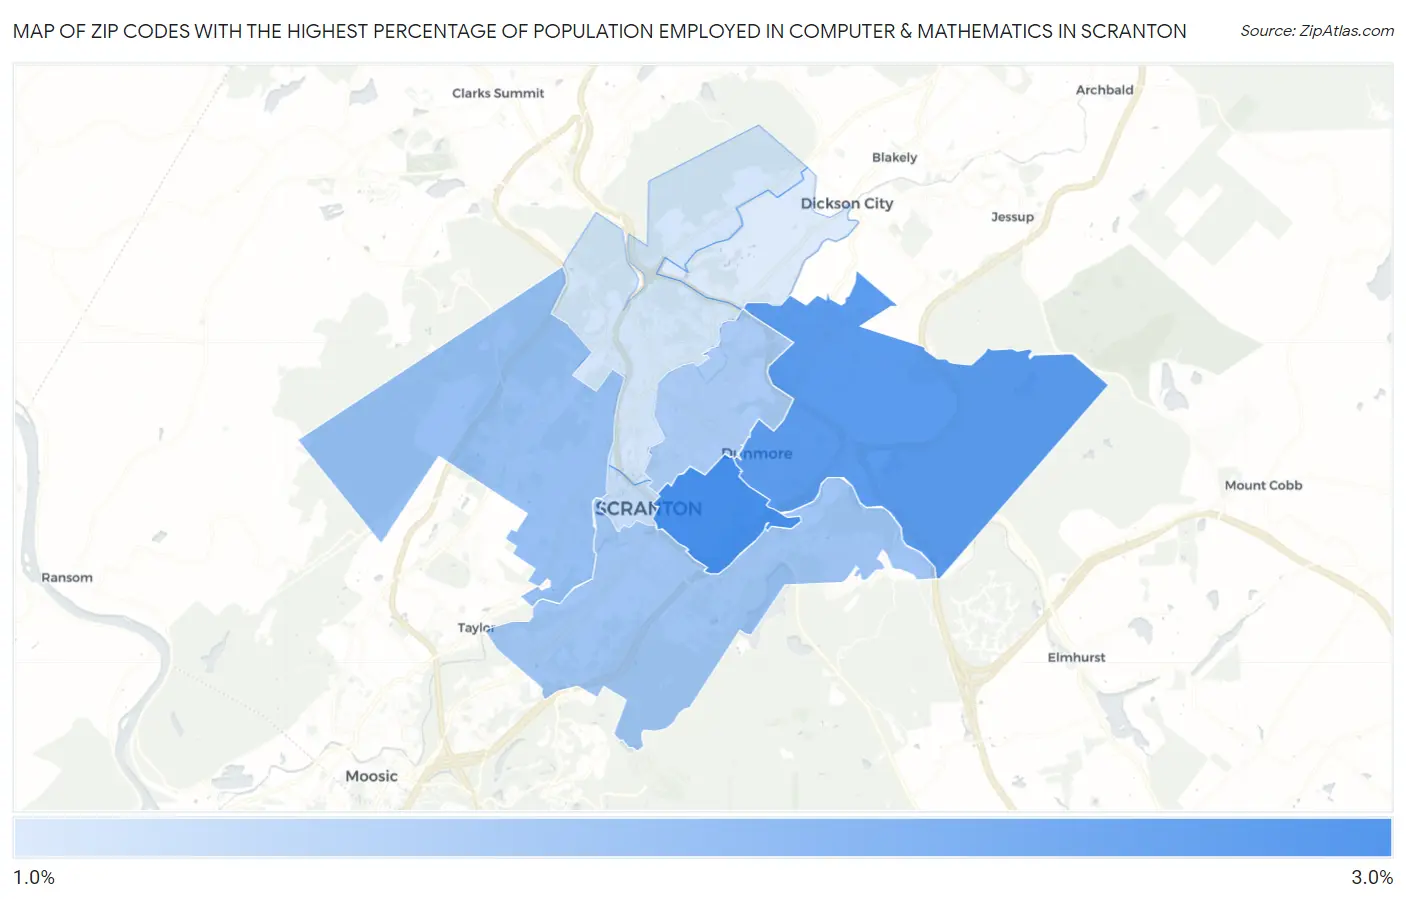
Zip Codes with the Highest Percentage of Population Employed in Computer & Mathematics in Scranton, PA
RELATED REPORTS & OPTIONS
Computer & Mathematics
Scranton
Compare Zip Codes
Map of Zip Codes with the Highest Percentage of Population Employed in Computer & Mathematics in Scranton
1.3%
3.0%
Zip Codes with the Highest Percentage of Population Employed in Computer & Mathematics in Scranton, PA
| Zip Code | % Employed | vs State | vs National | |
| 1. | 18510 | 3.0% | 3.3%(-0.290)#431 | 3.5%(-0.538)#7,794 |
| 2. | 18512 | 2.8% | 3.3%(-0.490)#471 | 3.5%(-0.738)#8,506 |
| 3. | 18504 | 2.1% | 3.3%(-1.20)#630 | 3.5%(-1.44)#11,427 |
| 4. | 18505 | 2.0% | 3.3%(-1.31)#658 | 3.5%(-1.56)#11,964 |
| 5. | 18509 | 1.9% | 3.3%(-1.42)#688 | 3.5%(-1.67)#12,506 |
| 6. | 18503 | 1.5% | 3.3%(-1.73)#769 | 3.5%(-1.98)#14,117 |
| 7. | 18508 | 1.4% | 3.3%(-1.88)#816 | 3.5%(-2.13)#14,977 |
| 8. | 18519 | 1.3% | 3.3%(-1.98)#862 | 3.5%(-2.23)#15,563 |
1
Common Questions
What are the Top 5 Zip Codes with the Highest Percentage of Population Employed in Computer & Mathematics in Scranton, PA?
Top 5 Zip Codes with the Highest Percentage of Population Employed in Computer & Mathematics in Scranton, PA are:
What zip code has the Highest Percentage of Population Employed in Computer & Mathematics in Scranton, PA?
18510 has the Highest Percentage of Population Employed in Computer & Mathematics in Scranton, PA with 3.0%.
What is the Percentage of Population Employed in Computer & Mathematics in Scranton, PA?
Percentage of Population Employed in Computer & Mathematics in Scranton is 1.8%.
What is the Percentage of Population Employed in Computer & Mathematics in Pennsylvania?
Percentage of Population Employed in Computer & Mathematics in Pennsylvania is 3.3%.
What is the Percentage of Population Employed in Computer & Mathematics in the United States?
Percentage of Population Employed in Computer & Mathematics in the United States is 3.5%.