West Glacier, MT Map & Demographics
West Glacier Map
West Glacier Overview
$40,913
PER CAPITA INCOME
$59,583
AVG FAMILY INCOME
$68,281
AVG HOUSEHOLD INCOME
6.0%
WAGE / INCOME GAP [ % ]
94.0¢/ $1
WAGE / INCOME GAP [ $ ]
0.25
INEQUALITY / GINI INDEX
174
TOTAL POPULATION
82
MALE POPULATION
92
FEMALE POPULATION
89.13
MALES / 100 FEMALES
112.20
FEMALES / 100 MALES
46.6
MEDIAN AGE
2.3
AVG FAMILY SIZE
1.8
AVG HOUSEHOLD SIZE
101
LABOR FORCE [ PEOPLE ]
62.7%
PERCENT IN LABOR FORCE
3.0%
UNEMPLOYMENT RATE
West Glacier Zip Codes
West Glacier Area Codes
Income in West Glacier
Income Overview in West Glacier
Per Capita Income in West Glacier is $40,913, while median incomes of families and households are $59,583 and $68,281 respectively.
| Characteristic | Number | Measure |
| Per Capita Income | 174 | $40,913 |
| Median Family Income | 49 | $59,583 |
| Mean Family Income | 49 | $78,129 |
| Median Household Income | 95 | $68,281 |
| Mean Household Income | 95 | $73,195 |
| Income Deficit | 49 | $0 |
| Wage / Income Gap (%) | 174 | 6.03% |
| Wage / Income Gap ($) | 174 | 93.97¢ per $1 |
| Gini / Inequality Index | 174 | 0.25 |
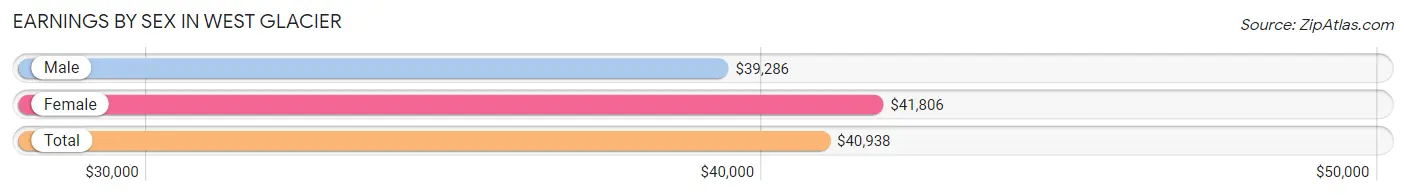
Earnings by Sex in West Glacier
Average Earnings in West Glacier are $40,938, $39,286 for men and $41,806 for women, a difference of 6.0%.
| Sex | Number | Average Earnings |
| Male | 54 (50.5%) | $39,286 |
| Female | 53 (49.5%) | $41,806 |
| Total | 107 (100.0%) | $40,938 |
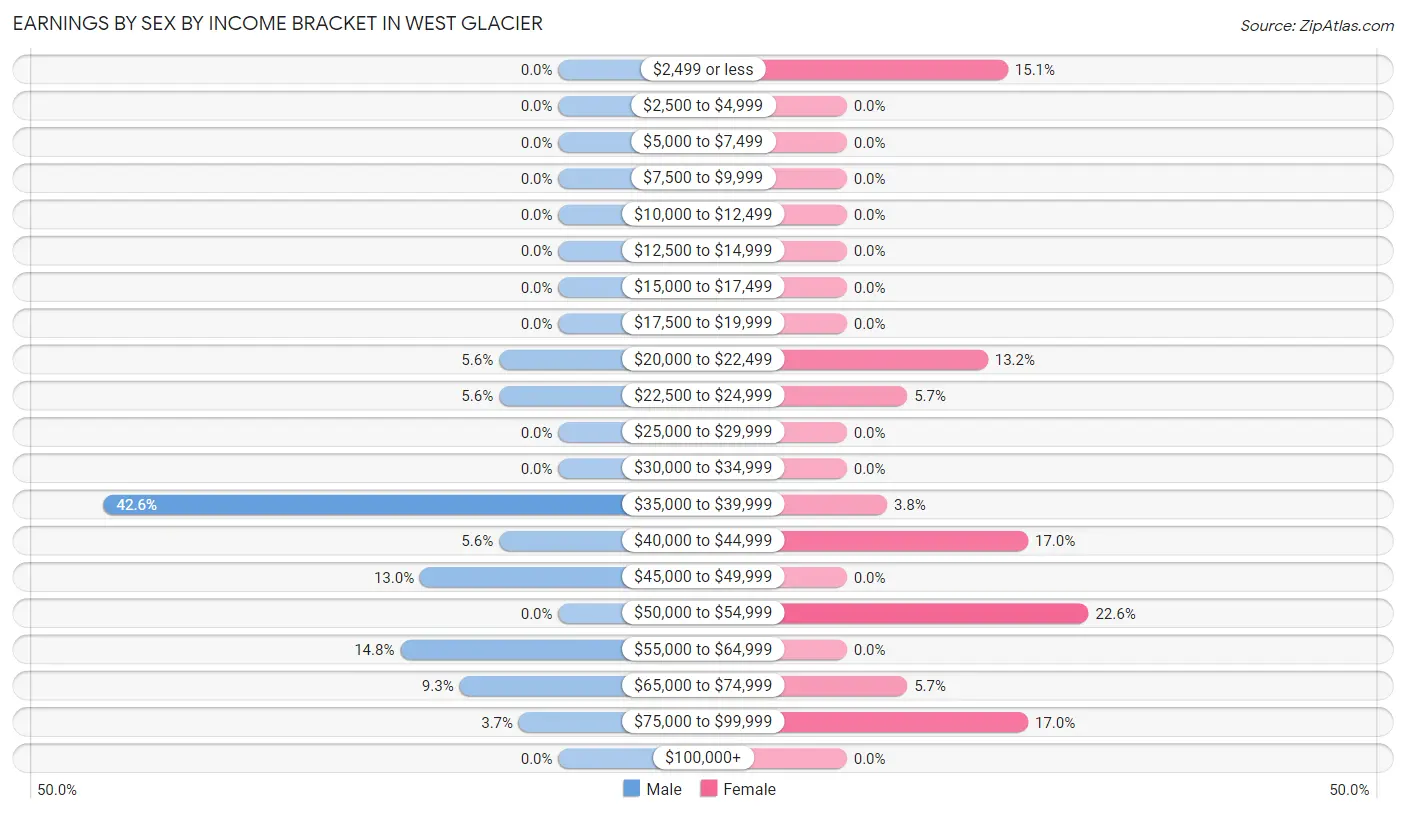
Earnings by Sex by Income Bracket in West Glacier
The most common earnings brackets in West Glacier are $35,000 to $39,999 for men (23 | 42.6%) and $50,000 to $54,999 for women (12 | 22.6%).
| Income | Male | Female |
| $2,499 or less | 0 (0.0%) | 8 (15.1%) |
| $2,500 to $4,999 | 0 (0.0%) | 0 (0.0%) |
| $5,000 to $7,499 | 0 (0.0%) | 0 (0.0%) |
| $7,500 to $9,999 | 0 (0.0%) | 0 (0.0%) |
| $10,000 to $12,499 | 0 (0.0%) | 0 (0.0%) |
| $12,500 to $14,999 | 0 (0.0%) | 0 (0.0%) |
| $15,000 to $17,499 | 0 (0.0%) | 0 (0.0%) |
| $17,500 to $19,999 | 0 (0.0%) | 0 (0.0%) |
| $20,000 to $22,499 | 3 (5.6%) | 7 (13.2%) |
| $22,500 to $24,999 | 3 (5.6%) | 3 (5.7%) |
| $25,000 to $29,999 | 0 (0.0%) | 0 (0.0%) |
| $30,000 to $34,999 | 0 (0.0%) | 0 (0.0%) |
| $35,000 to $39,999 | 23 (42.6%) | 2 (3.8%) |
| $40,000 to $44,999 | 3 (5.6%) | 9 (17.0%) |
| $45,000 to $49,999 | 7 (13.0%) | 0 (0.0%) |
| $50,000 to $54,999 | 0 (0.0%) | 12 (22.6%) |
| $55,000 to $64,999 | 8 (14.8%) | 0 (0.0%) |
| $65,000 to $74,999 | 5 (9.3%) | 3 (5.7%) |
| $75,000 to $99,999 | 2 (3.7%) | 9 (17.0%) |
| $100,000+ | 0 (0.0%) | 0 (0.0%) |
| Total | 54 (100.0%) | 53 (100.0%) |
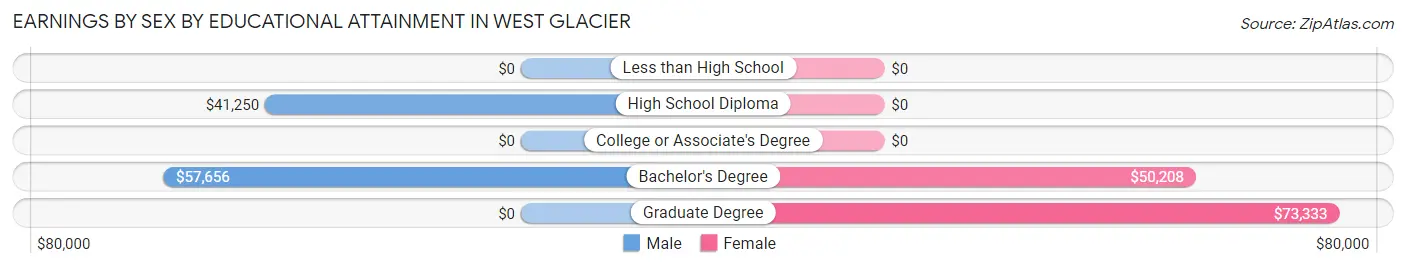
Earnings by Sex by Educational Attainment in West Glacier
Average earnings in West Glacier are $41,667 for men and $50,208 for women, a difference of 17.0%. Men with an educational attainment of bachelor's degree enjoy the highest average annual earnings of $57,656, while those with high school diploma education earn the least with $41,250. Women with an educational attainment of graduate degree earn the most with the average annual earnings of $73,333, while those with bachelor's degree education have the smallest earnings of $50,208.
| Educational Attainment | Male Income | Female Income |
| Less than High School | - | - |
| High School Diploma | $41,250 | $0 |
| College or Associate's Degree | - | - |
| Bachelor's Degree | $57,656 | $50,208 |
| Graduate Degree | - | - |
| Total | $41,667 | $50,208 |
Family Income in West Glacier
Family Income Brackets in West Glacier
According to the West Glacier family income data, there are 26 families falling into the $50,000 to $74,999 income range, which is the most common income bracket and makes up 53.1% of all families.
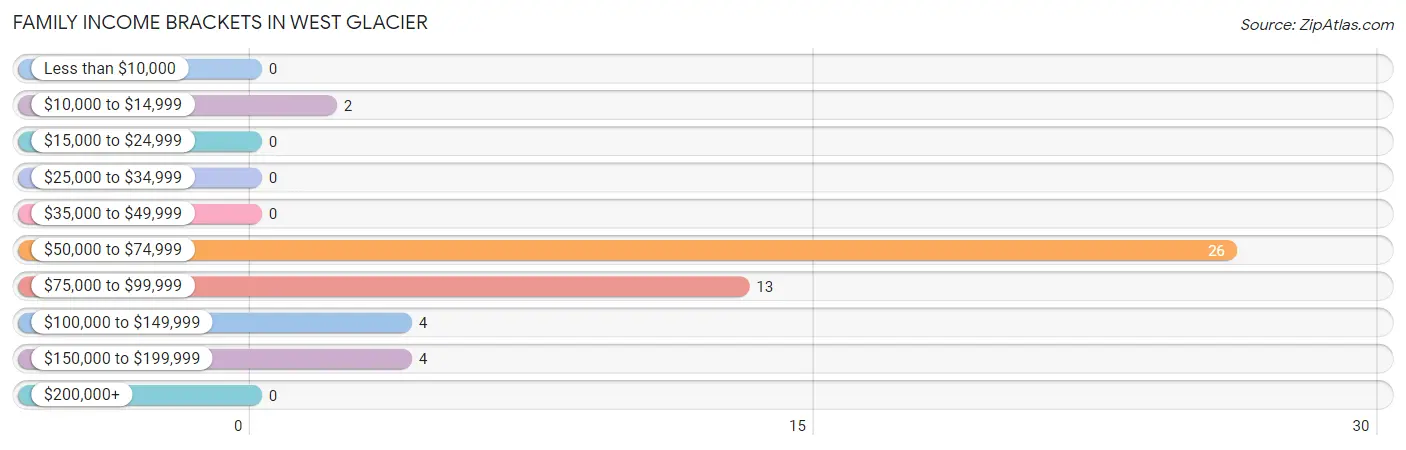
| Income Bracket | # Families | % Families |
| Less than $10,000 | 0 | 0.0% |
| $10,000 to $14,999 | 2 | 4.1% |
| $15,000 to $24,999 | 0 | 0.0% |
| $25,000 to $34,999 | 0 | 0.0% |
| $35,000 to $49,999 | 0 | 0.0% |
| $50,000 to $74,999 | 26 | 53.1% |
| $75,000 to $99,999 | 13 | 26.5% |
| $100,000 to $149,999 | 4 | 8.2% |
| $150,000 to $199,999 | 4 | 8.2% |
| $200,000+ | 0 | 0.0% |
Family Income by Famaliy Size in West Glacier
2-person families (41 | 83.7%) account for the highest median family income in West Glacier with $57,917 per family, while 2-person families (41 | 83.7%) have the highest median income of $28,958 per family member.
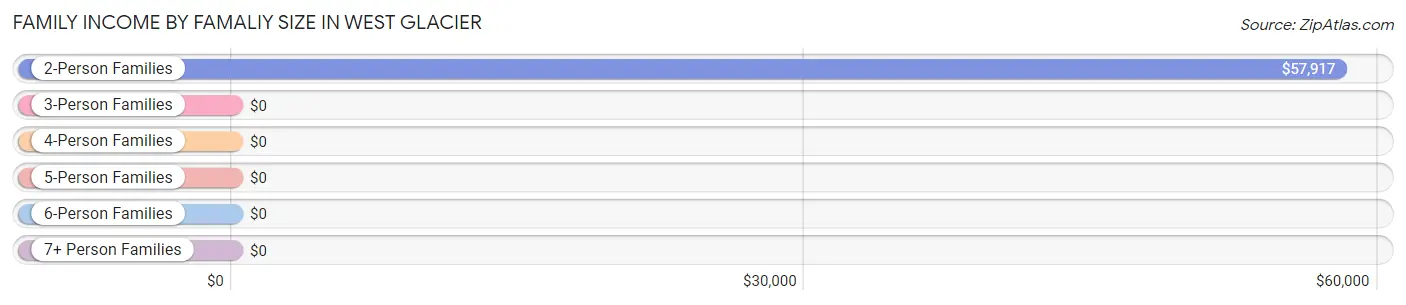
| Income Bracket | # Families | Median Income |
| 2-Person Families | 41 (83.7%) | $57,917 |
| 3-Person Families | 6 (12.2%) | $0 |
| 4-Person Families | 2 (4.1%) | $0 |
| 5-Person Families | 0 (0.0%) | $0 |
| 6-Person Families | 0 (0.0%) | $0 |
| 7+ Person Families | 0 (0.0%) | $0 |
| Total | 49 (100.0%) | $59,583 |
Family Income by Number of Earners in West Glacier
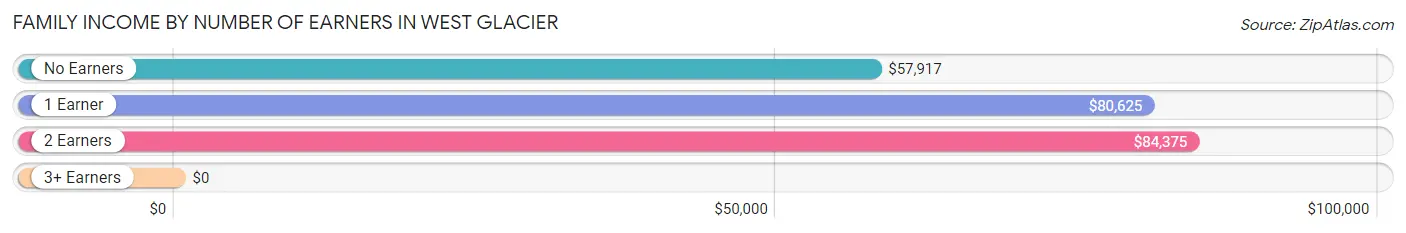
| Number of Earners | # Families | Median Income |
| No Earners | 11 (22.5%) | $57,917 |
| 1 Earner | 19 (38.8%) | $80,625 |
| 2 Earners | 19 (38.8%) | $84,375 |
| 3+ Earners | 0 (0.0%) | $0 |
| Total | 49 (100.0%) | $59,583 |
Household Income in West Glacier
Household Income Brackets in West Glacier
With 40 households falling in the category, the $50,000 to $74,999 income range is the most frequent in West Glacier, accounting for 42.1% of all households.
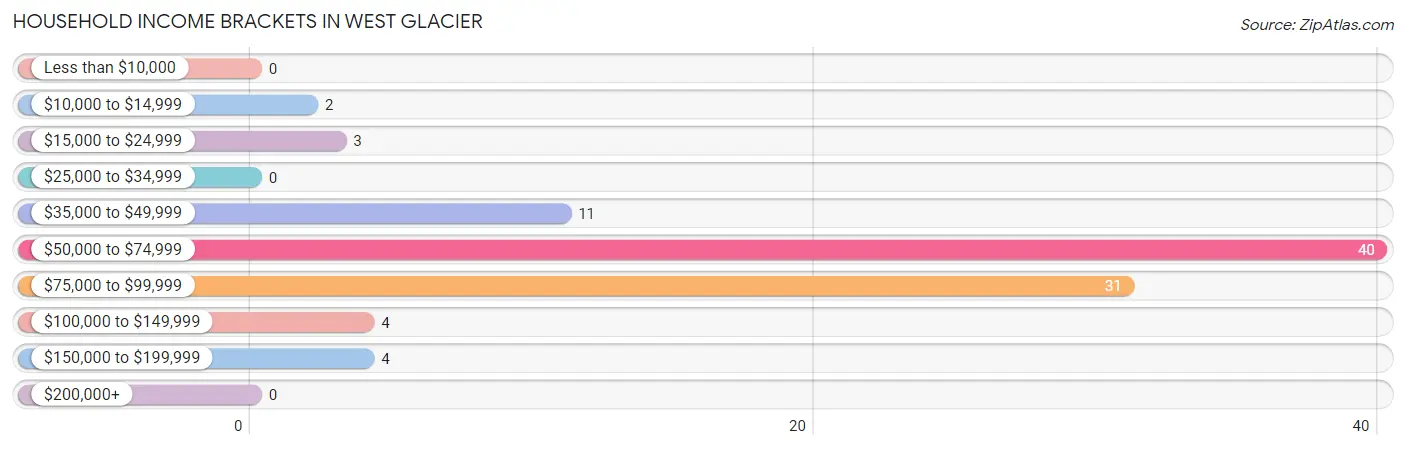
| Income Bracket | # Households | % Households |
| Less than $10,000 | 0 | 0.0% |
| $10,000 to $14,999 | 2 | 2.1% |
| $15,000 to $24,999 | 3 | 3.2% |
| $25,000 to $34,999 | 0 | 0.0% |
| $35,000 to $49,999 | 11 | 11.6% |
| $50,000 to $74,999 | 40 | 42.1% |
| $75,000 to $99,999 | 31 | 32.6% |
| $100,000 to $149,999 | 4 | 4.2% |
| $150,000 to $199,999 | 4 | 4.2% |
| $200,000+ | 0 | 0.0% |
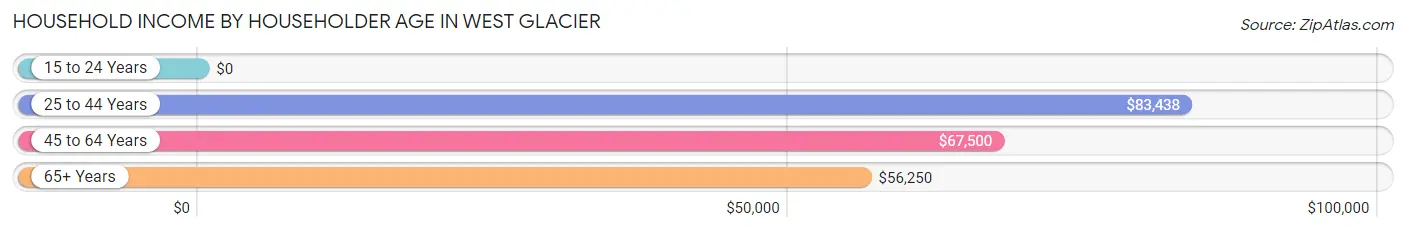
Household Income by Householder Age in West Glacier
The median household income in West Glacier is $68,281, with the highest median household income of $83,438 found in the 25 to 44 years age bracket for the primary householder. A total of 34 households (35.8%) fall into this category. Meanwhile, the 15 to 24 years age bracket for the primary householder has the lowest median household income of $0, with 8 households (8.4%) in this group.
| Income Bracket | # Households | Median Income |
| 15 to 24 Years | 8 (8.4%) | $0 |
| 25 to 44 Years | 34 (35.8%) | $83,438 |
| 45 to 64 Years | 22 (23.2%) | $67,500 |
| 65+ Years | 31 (32.6%) | $56,250 |
| Total | 95 (100.0%) | $68,281 |
Poverty in West Glacier
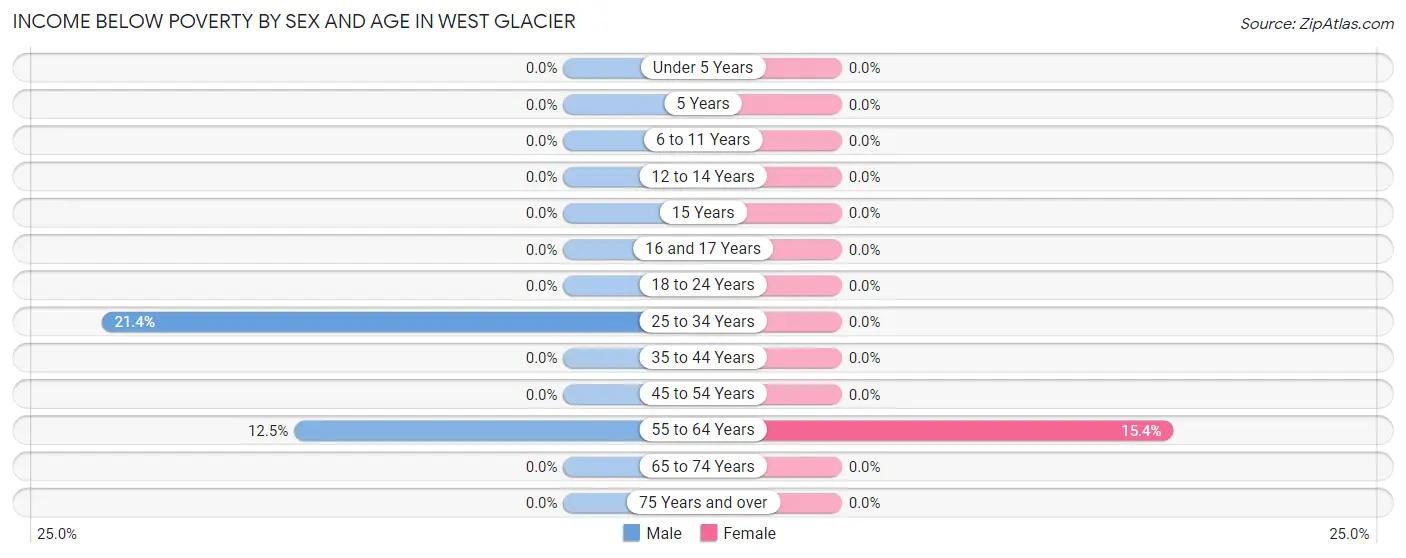
Income Below Poverty by Sex and Age in West Glacier
With 6.1% poverty level for males and 2.2% for females among the residents of West Glacier, 25 to 34 year old males and 55 to 64 year old females are the most vulnerable to poverty, with 3 males (21.4%) and 2 females (15.4%) in their respective age groups living below the poverty level.
| Age Bracket | Male | Female |
| Under 5 Years | 0 (0.0%) | 0 (0.0%) |
| 5 Years | 0 (0.0%) | 0 (0.0%) |
| 6 to 11 Years | 0 (0.0%) | 0 (0.0%) |
| 12 to 14 Years | 0 (0.0%) | 0 (0.0%) |
| 15 Years | 0 (0.0%) | 0 (0.0%) |
| 16 and 17 Years | 0 (0.0%) | 0 (0.0%) |
| 18 to 24 Years | 0 (0.0%) | 0 (0.0%) |
| 25 to 34 Years | 3 (21.4%) | 0 (0.0%) |
| 35 to 44 Years | 0 (0.0%) | 0 (0.0%) |
| 45 to 54 Years | 0 (0.0%) | 0 (0.0%) |
| 55 to 64 Years | 2 (12.5%) | 2 (15.4%) |
| 65 to 74 Years | 0 (0.0%) | 0 (0.0%) |
| 75 Years and over | 0 (0.0%) | 0 (0.0%) |
| Total | 5 (6.1%) | 2 (2.2%) |
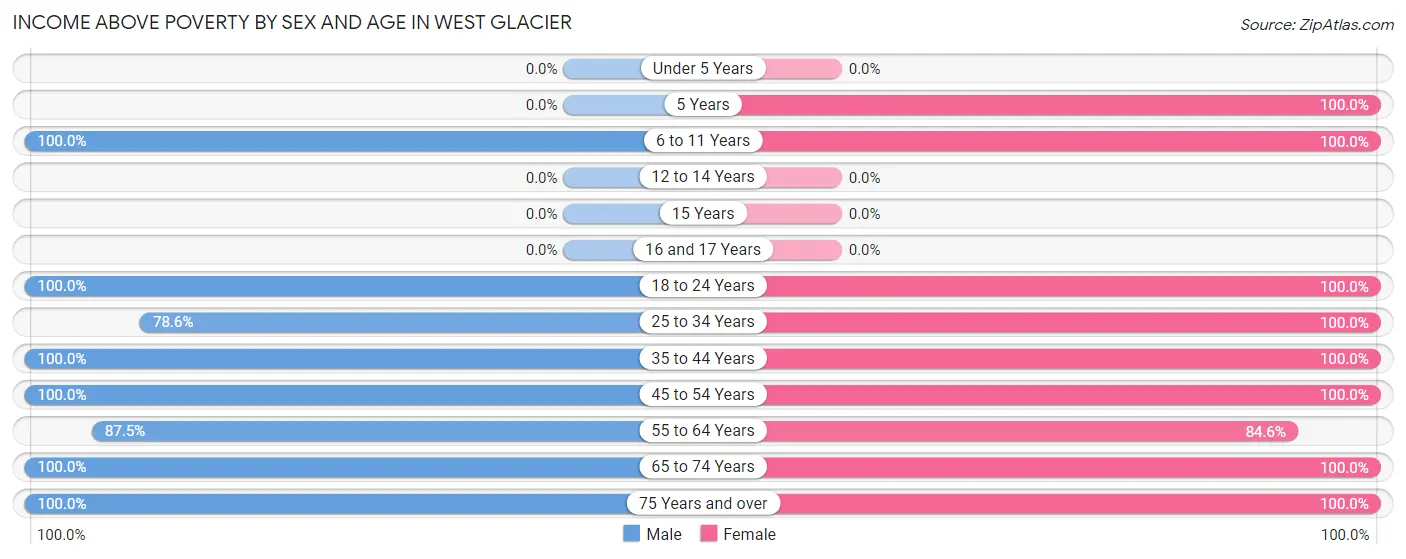
Income Above Poverty by Sex and Age in West Glacier
According to the poverty statistics in West Glacier, males aged 6 to 11 years and females aged 5 years are the age groups that are most secure financially, with 100.0% of males and 100.0% of females in these age groups living above the poverty line.
| Age Bracket | Male | Female |
| Under 5 Years | 0 (0.0%) | 0 (0.0%) |
| 5 Years | 0 (0.0%) | 2 (100.0%) |
| 6 to 11 Years | 5 (100.0%) | 6 (100.0%) |
| 12 to 14 Years | 0 (0.0%) | 0 (0.0%) |
| 15 Years | 0 (0.0%) | 0 (0.0%) |
| 16 and 17 Years | 0 (0.0%) | 0 (0.0%) |
| 18 to 24 Years | 8 (100.0%) | 7 (100.0%) |
| 25 to 34 Years | 11 (78.6%) | 11 (100.0%) |
| 35 to 44 Years | 8 (100.0%) | 19 (100.0%) |
| 45 to 54 Years | 9 (100.0%) | 12 (100.0%) |
| 55 to 64 Years | 14 (87.5%) | 11 (84.6%) |
| 65 to 74 Years | 11 (100.0%) | 12 (100.0%) |
| 75 Years and over | 11 (100.0%) | 10 (100.0%) |
| Total | 77 (93.9%) | 90 (97.8%) |
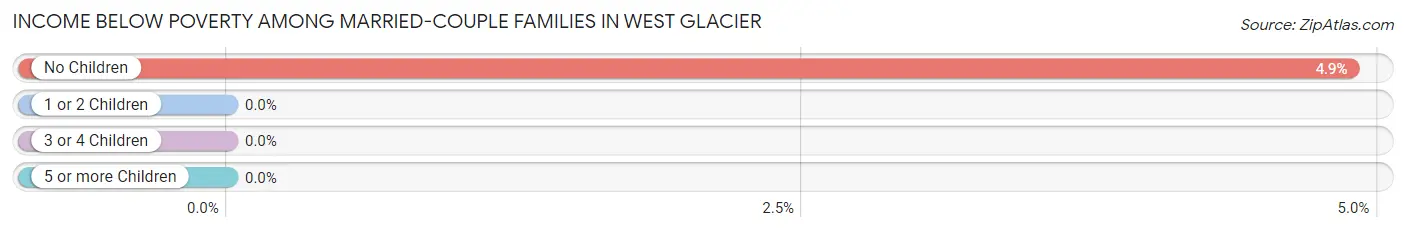
Income Below Poverty Among Married-Couple Families in West Glacier
The poverty statistics for married-couple families in West Glacier show that 4.6% or 2 of the total 43 families live below the poverty line. Families with no children have the highest poverty rate of 4.9%, comprising of 2 families. On the other hand, families with 1 or 2 children have the lowest poverty rate of 0.0%, which includes 0 families.
| Children | Above Poverty | Below Poverty |
| No Children | 39 (95.1%) | 2 (4.9%) |
| 1 or 2 Children | 2 (100.0%) | 0 (0.0%) |
| 3 or 4 Children | 0 (0.0%) | 0 (0.0%) |
| 5 or more Children | 0 (0.0%) | 0 (0.0%) |
| Total | 41 (95.4%) | 2 (4.6%) |
Income Below Poverty Among Single-Parent Households in West Glacier
| Children | Single Father | Single Mother |
| No Children | 0 (0.0%) | 0 (0.0%) |
| 1 or 2 Children | 0 (0.0%) | 0 (0.0%) |
| 3 or 4 Children | 0 (0.0%) | 0 (0.0%) |
| 5 or more Children | 0 (0.0%) | 0 (0.0%) |
| Total | 0 (0.0%) | 0 (0.0%) |
Income Below Poverty Among Married-Couple vs Single-Parent Households in West Glacier
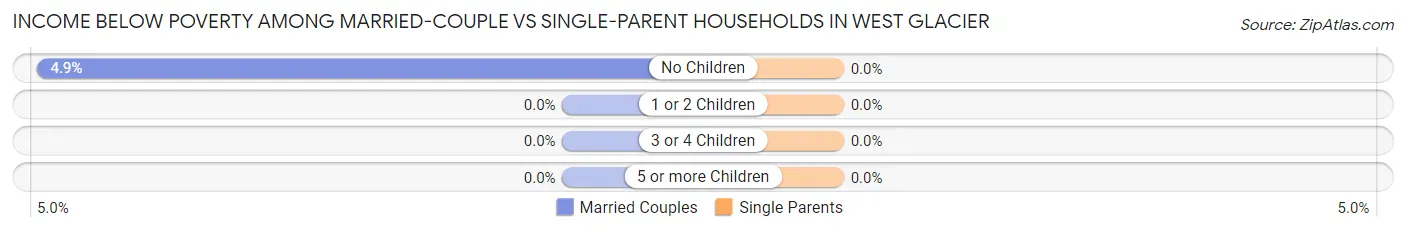
| Children | Married-Couple Families | Single-Parent Households |
| No Children | 2 (4.9%) | 0 (0.0%) |
| 1 or 2 Children | 0 (0.0%) | 0 (0.0%) |
| 3 or 4 Children | 0 (0.0%) | 0 (0.0%) |
| 5 or more Children | 0 (0.0%) | 0 (0.0%) |
| Total | 2 (4.6%) | 0 (0.0%) |
Race in West Glacier
The most populous races in West Glacier are White / Caucasian (165 | 94.8%), and Two or more Races (9 | 5.2%).
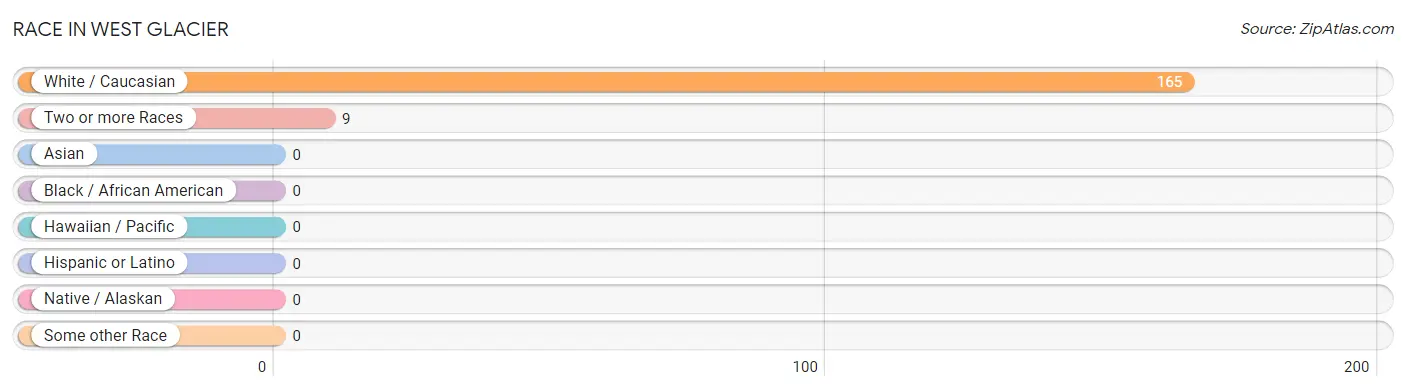
| Race | # Population | % Population |
| Asian | 0 | 0.0% |
| Black / African American | 0 | 0.0% |
| Hawaiian / Pacific | 0 | 0.0% |
| Hispanic or Latino | 0 | 0.0% |
| Native / Alaskan | 0 | 0.0% |
| White / Caucasian | 165 | 94.8% |
| Two or more Races | 9 | 5.2% |
| Some other Race | 0 | 0.0% |
| Total | 174 | 100.0% |
Ancestry in West Glacier
The most populous ancestries reported in West Glacier are Irish (45 | 25.9%), German (38 | 21.8%), English (21 | 12.1%), Italian (16 | 9.2%), and Polish (13 | 7.5%), together accounting for 76.4% of all West Glacier residents.
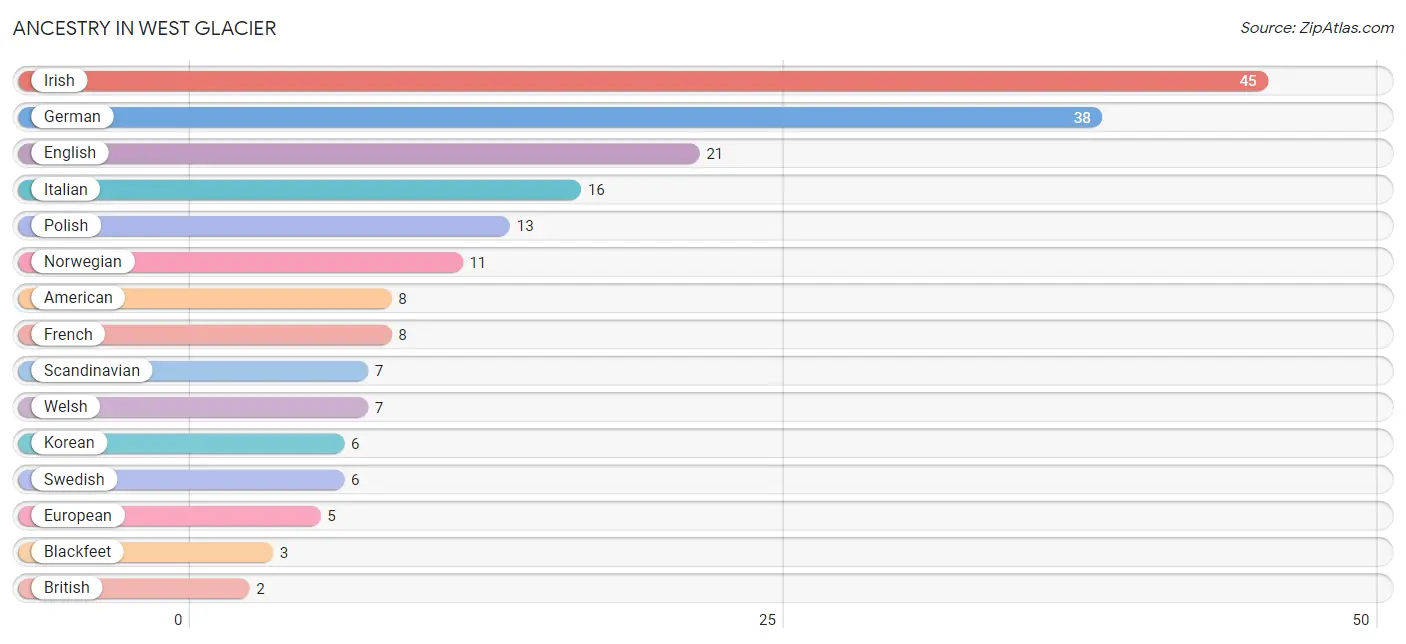
| Ancestry | # Population | % Population |
| American | 8 | 4.6% |
| Blackfeet | 3 | 1.7% |
| British | 2 | 1.1% |
| English | 21 | 12.1% |
| European | 5 | 2.9% |
| French | 8 | 4.6% |
| German | 38 | 21.8% |
| Irish | 45 | 25.9% |
| Italian | 16 | 9.2% |
| Korean | 6 | 3.5% |
| Norwegian | 11 | 6.3% |
| Polish | 13 | 7.5% |
| Scandinavian | 7 | 4.0% |
| Swedish | 6 | 3.5% |
| Welsh | 7 | 4.0% | View All 15 Rows |
Immigrants in West Glacier
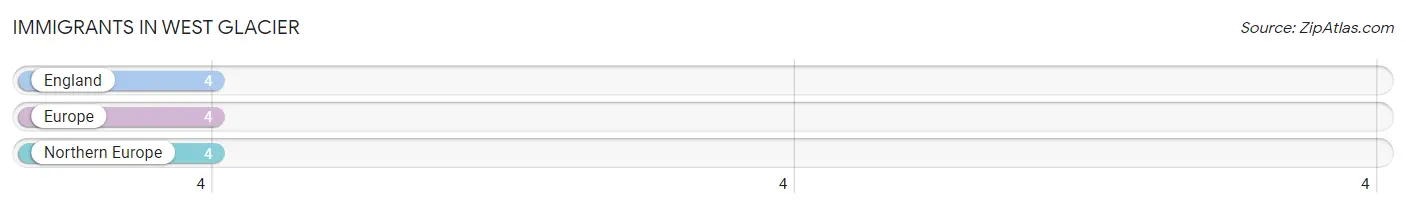
The most numerous immigrant groups reported in West Glacier came from England (4 | 2.3%), Europe (4 | 2.3%), and Northern Europe (4 | 2.3%), together accounting for 6.9% of all West Glacier residents.
| Immigration Origin | # Population | % Population |
| England | 4 | 2.3% |
| Europe | 4 | 2.3% |
| Northern Europe | 4 | 2.3% | View All 3 Rows |
Sex and Age in West Glacier
Sex and Age in West Glacier
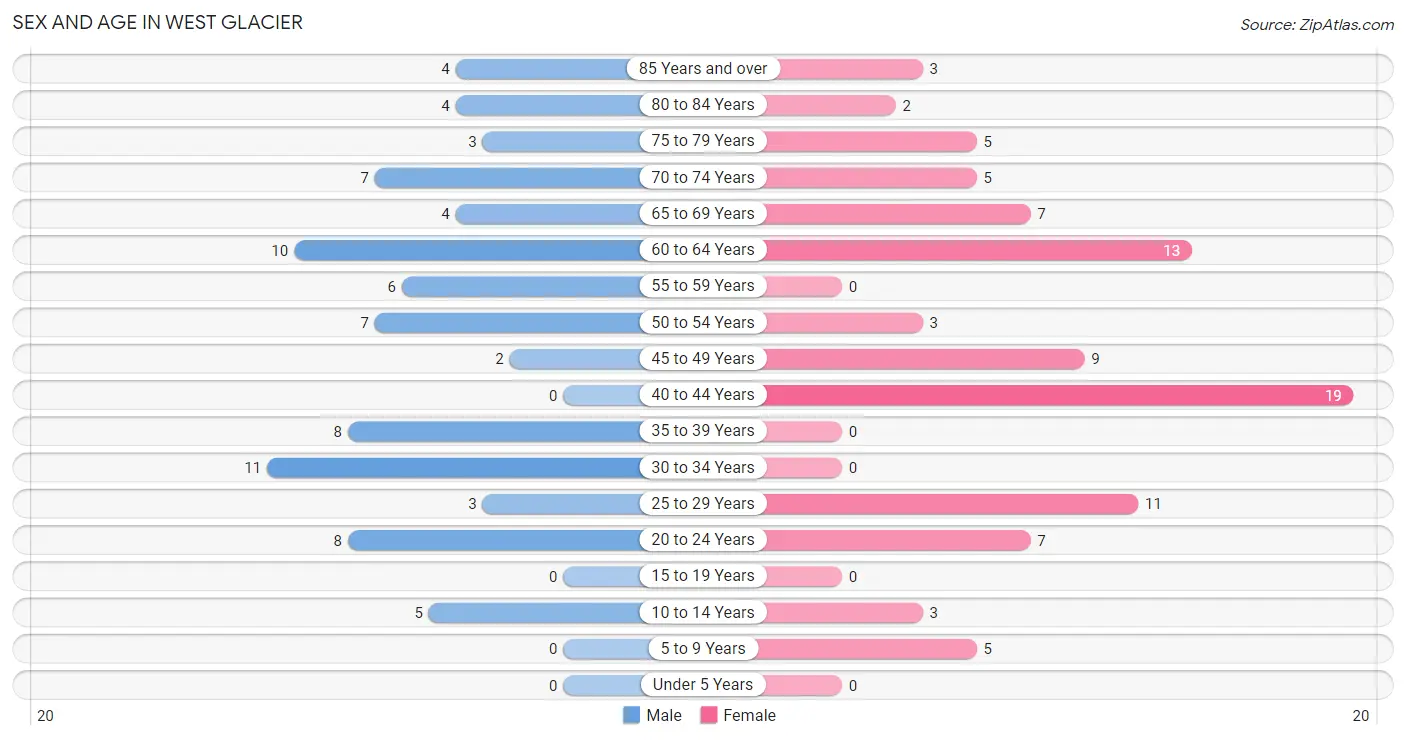
The most populous age groups in West Glacier are 30 to 34 Years (11 | 13.4%) for men and 40 to 44 Years (19 | 20.6%) for women.
| Age Bracket | Male | Female |
| Under 5 Years | 0 (0.0%) | 0 (0.0%) |
| 5 to 9 Years | 0 (0.0%) | 5 (5.4%) |
| 10 to 14 Years | 5 (6.1%) | 3 (3.3%) |
| 15 to 19 Years | 0 (0.0%) | 0 (0.0%) |
| 20 to 24 Years | 8 (9.8%) | 7 (7.6%) |
| 25 to 29 Years | 3 (3.7%) | 11 (12.0%) |
| 30 to 34 Years | 11 (13.4%) | 0 (0.0%) |
| 35 to 39 Years | 8 (9.8%) | 0 (0.0%) |
| 40 to 44 Years | 0 (0.0%) | 19 (20.6%) |
| 45 to 49 Years | 2 (2.4%) | 9 (9.8%) |
| 50 to 54 Years | 7 (8.5%) | 3 (3.3%) |
| 55 to 59 Years | 6 (7.3%) | 0 (0.0%) |
| 60 to 64 Years | 10 (12.2%) | 13 (14.1%) |
| 65 to 69 Years | 4 (4.9%) | 7 (7.6%) |
| 70 to 74 Years | 7 (8.5%) | 5 (5.4%) |
| 75 to 79 Years | 3 (3.7%) | 5 (5.4%) |
| 80 to 84 Years | 4 (4.9%) | 2 (2.2%) |
| 85 Years and over | 4 (4.9%) | 3 (3.3%) |
| Total | 82 (100.0%) | 92 (100.0%) |
Families and Households in West Glacier
Median Family Size in West Glacier
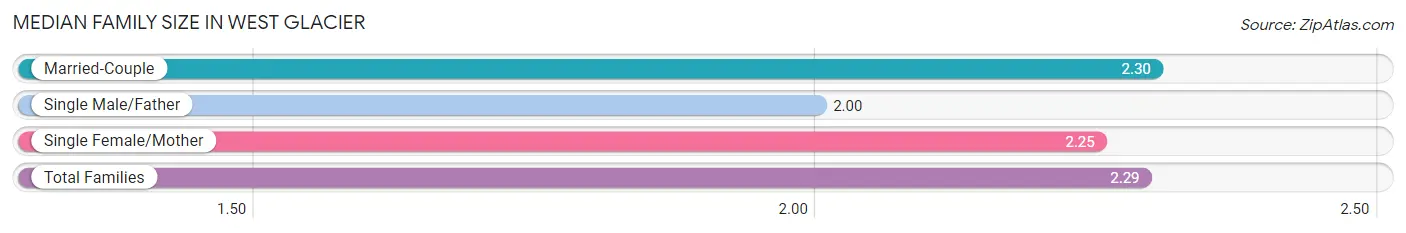
The median family size in West Glacier is 2.29 persons per family, with married-couple families (43 | 87.8%) accounting for the largest median family size of 2.3 persons per family. On the other hand, single male/father families (2 | 4.1%) represent the smallest median family size with 2.00 persons per family.
| Family Type | # Families | Family Size |
| Married-Couple | 43 (87.8%) | 2.30 |
| Single Male/Father | 2 (4.1%) | 2.00 |
| Single Female/Mother | 4 (8.2%) | 2.25 |
| Total Families | 49 (100.0%) | 2.29 |
Median Household Size in West Glacier
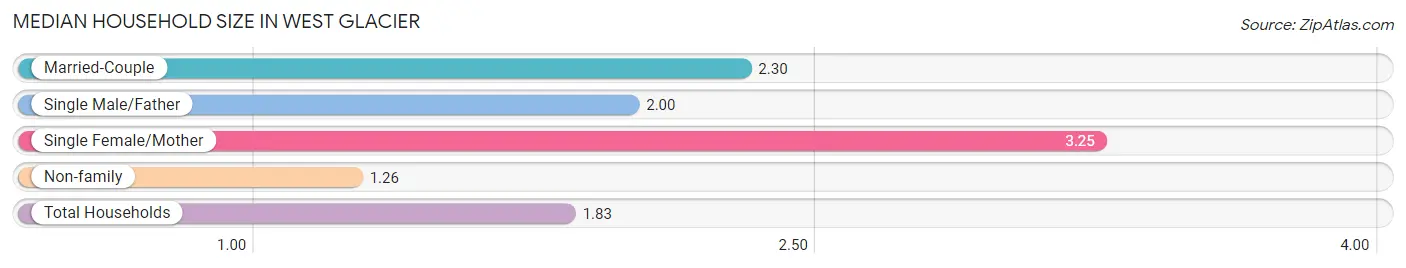
The median household size in West Glacier is 1.83 persons per household, with single female/mother households (4 | 4.2%) accounting for the largest median household size of 3.25 persons per household. non-family households (46 | 48.4%) represent the smallest median household size with 1.26 persons per household.
| Household Type | # Households | Household Size |
| Married-Couple | 43 (45.3%) | 2.30 |
| Single Male/Father | 2 (2.1%) | 2.00 |
| Single Female/Mother | 4 (4.2%) | 3.25 |
| Non-family | 46 (48.4%) | 1.26 |
| Total Households | 95 (100.0%) | 1.83 |
Household Size by Marriage Status in West Glacier
Out of a total of 95 households in West Glacier, 49 (51.6%) are family households, while 46 (48.4%) are nonfamily households. The most numerous type of family households are 2-person households, comprising 37, and the most common type of nonfamily households are 1-person households, comprising 32.
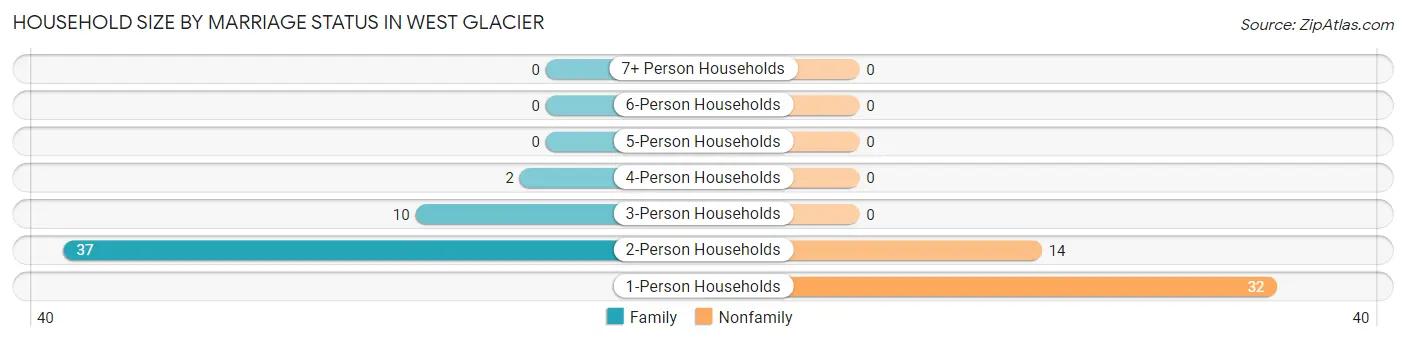
| Household Size | Family Households | Nonfamily Households |
| 1-Person Households | - | 32 (33.7%) |
| 2-Person Households | 37 (39.0%) | 14 (14.7%) |
| 3-Person Households | 10 (10.5%) | 0 (0.0%) |
| 4-Person Households | 2 (2.1%) | 0 (0.0%) |
| 5-Person Households | 0 (0.0%) | 0 (0.0%) |
| 6-Person Households | 0 (0.0%) | 0 (0.0%) |
| 7+ Person Households | 0 (0.0%) | 0 (0.0%) |
| Total | 49 (51.6%) | 46 (48.4%) |
Female Fertility in West Glacier
Fertility by Age in West Glacier
| Age Bracket | Women with Births | Births / 1,000 Women |
| 15 to 19 years | 0 (0.0%) | 0.0 |
| 20 to 34 years | 0 (0.0%) | 0.0 |
| 35 to 50 years | 0 (0.0%) | 0.0 |
| Total | 0 (0.0%) | 0.0 |
Fertility by Age by Marriage Status in West Glacier
| Age Bracket | Married | Unmarried |
| 15 to 19 years | 0 (0.0%) | 0 (0.0%) |
| 20 to 34 years | 0 (0.0%) | 0 (0.0%) |
| 35 to 50 years | 0 (0.0%) | 0 (0.0%) |
| Total | 0 (0.0%) | 0 (0.0%) |
Fertility by Education in West Glacier
| Educational Attainment | Women with Births | Births / 1,000 Women |
| Less than High School | 0 (0.0%) | 0.0 |
| High School Diploma | 0 (0.0%) | 0.0 |
| College or Associate's Degree | 0 (0.0%) | 0.0 |
| Bachelor's Degree | 0 (0.0%) | 0.0 |
| Graduate Degree | 0 (0.0%) | 0.0 |
| Total | 0 (0.0%) | 0.0 |
Fertility by Education by Marriage Status in West Glacier
| Educational Attainment | Married | Unmarried |
| Less than High School | 0 (0.0%) | 0 (0.0%) |
| High School Diploma | 0 (0.0%) | 0 (0.0%) |
| College or Associate's Degree | 0 (0.0%) | 0 (0.0%) |
| Bachelor's Degree | 0 (0.0%) | 0 (0.0%) |
| Graduate Degree | 0 (0.0%) | 0 (0.0%) |
| Total | 0 (0.0%) | 0 (0.0%) |
Employment Characteristics in West Glacier
Employment by Class of Employer in West Glacier
Among the 98 employed individuals in West Glacier, private company employees (42 | 42.9%), federal government employees (28 | 28.6%), and local government employees (16 | 16.3%) make up the most common classes of employment.
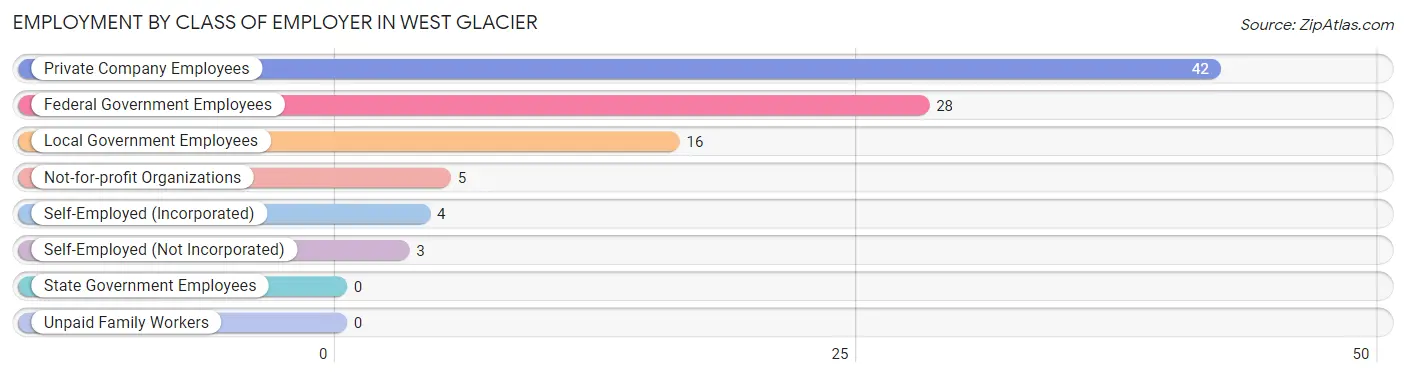
| Employer Class | # Employees | % Employees |
| Private Company Employees | 42 | 42.9% |
| Self-Employed (Incorporated) | 4 | 4.1% |
| Self-Employed (Not Incorporated) | 3 | 3.1% |
| Not-for-profit Organizations | 5 | 5.1% |
| Local Government Employees | 16 | 16.3% |
| State Government Employees | 0 | 0.0% |
| Federal Government Employees | 28 | 28.6% |
| Unpaid Family Workers | 0 | 0.0% |
| Total | 98 | 100.0% |
Employment Status by Age in West Glacier
According to the labor force statistics for West Glacier, out of the total population over 16 years of age (161), 62.7% or 101 individuals are in the labor force, with 3.0% or 3 of them unemployed. The age group with the highest labor force participation rate is 20 to 24 years, with 100.0% or 15 individuals in the labor force. Within the labor force, the 60 to 64 years age range has the highest percentage of unemployed individuals, with 20.0% or 3 of them being unemployed.
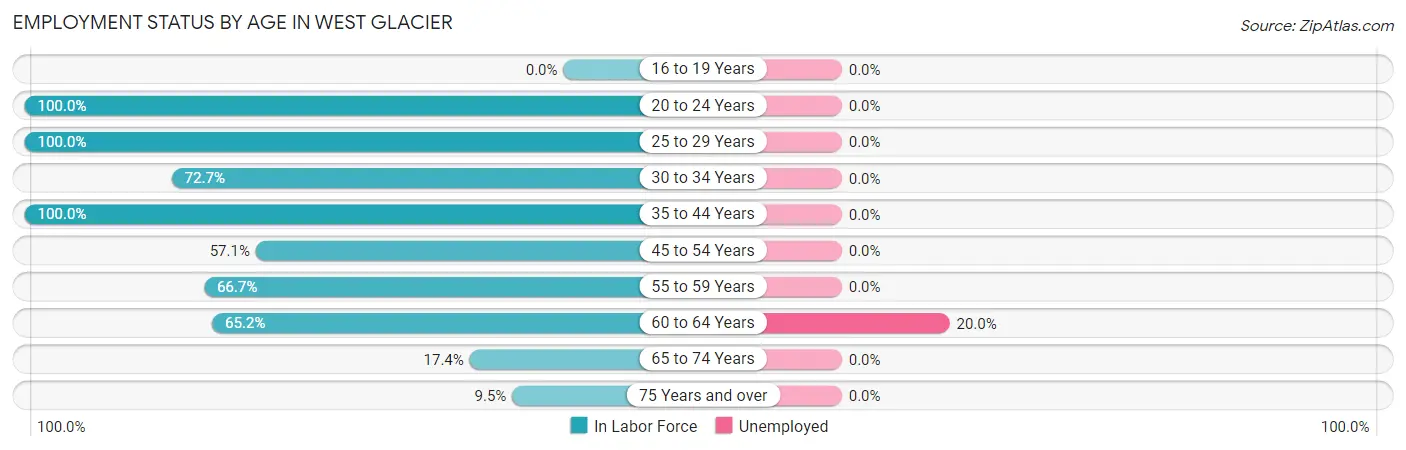
| Age Bracket | In Labor Force | Unemployed |
| 16 to 19 Years | 0 (0.0%) | 0 (0.0%) |
| 20 to 24 Years | 15 (100.0%) | 0 (0.0%) |
| 25 to 29 Years | 14 (100.0%) | 0 (0.0%) |
| 30 to 34 Years | 8 (72.7%) | 0 (0.0%) |
| 35 to 44 Years | 27 (100.0%) | 0 (0.0%) |
| 45 to 54 Years | 12 (57.1%) | 0 (0.0%) |
| 55 to 59 Years | 4 (66.7%) | 0 (0.0%) |
| 60 to 64 Years | 15 (65.2%) | 3 (20.0%) |
| 65 to 74 Years | 4 (17.4%) | 0 (0.0%) |
| 75 Years and over | 2 (9.5%) | 0 (0.0%) |
| Total | 101 (62.7%) | 3 (3.0%) |
Employment Status by Educational Attainment in West Glacier
According to labor force statistics for West Glacier, 78.4% of individuals (80) out of the total population between 25 and 64 years of age (102) are in the labor force, with 3.8% or 3 of them being unemployed. The group with the highest labor force participation rate are those with the educational attainment of less than high school, with 100.0% or 7 individuals in the labor force. Within the labor force, individuals with less than high school education have the highest percentage of unemployment, with 42.9% or 3 of them being unemployed.
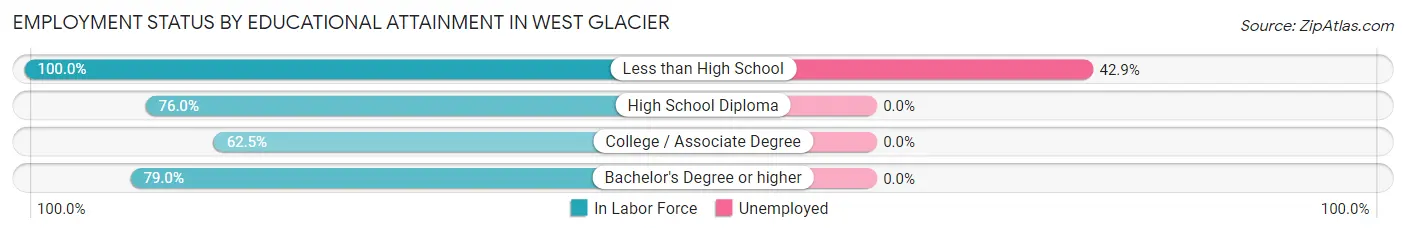
| Educational Attainment | In Labor Force | Unemployed |
| Less than High School | 7 (100.0%) | 3 (42.9%) |
| High School Diploma | 19 (76.0%) | 0 (0.0%) |
| College / Associate Degree | 5 (62.5%) | 0 (0.0%) |
| Bachelor's Degree or higher | 49 (79.0%) | 0 (0.0%) |
| Total | 80 (78.4%) | 4 (3.8%) |
Employment Occupations by Sex in West Glacier
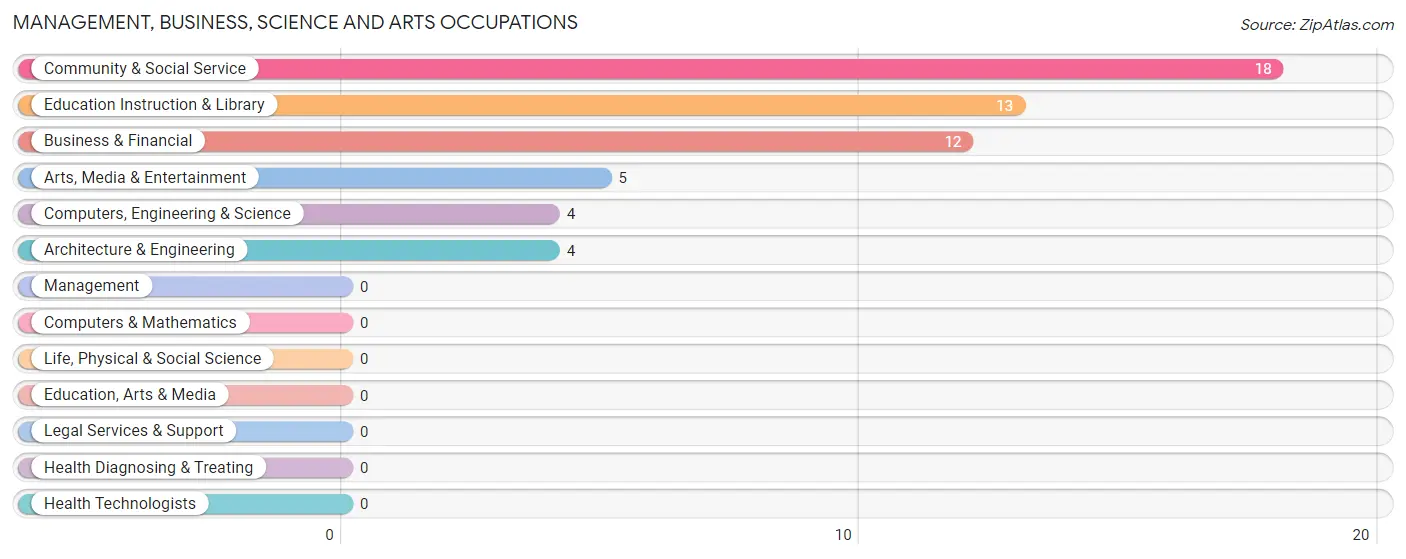
Management, Business, Science and Arts Occupations
The most common Management, Business, Science and Arts occupations in West Glacier are Community & Social Service (18 | 18.4%), Education Instruction & Library (13 | 13.3%), Business & Financial (12 | 12.2%), Arts, Media & Entertainment (5 | 5.1%), and Computers, Engineering & Science (4 | 4.1%).
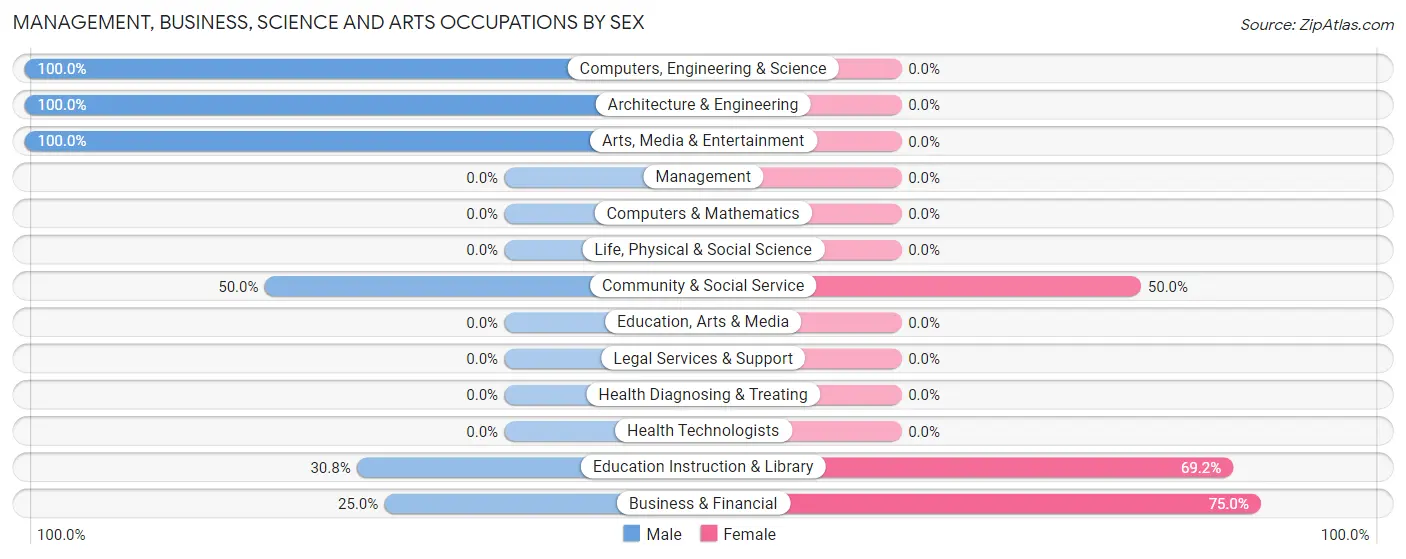
Management, Business, Science and Arts Occupations by Sex
Within the Management, Business, Science and Arts occupations in West Glacier, the most male-oriented occupations are Computers, Engineering & Science (100.0%), Architecture & Engineering (100.0%), and Arts, Media & Entertainment (100.0%), while the most female-oriented occupations are Business & Financial (75.0%), Education Instruction & Library (69.2%), and Community & Social Service (50.0%).
| Occupation | Male | Female |
| Management | 0 (0.0%) | 0 (0.0%) |
| Business & Financial | 3 (25.0%) | 9 (75.0%) |
| Computers, Engineering & Science | 4 (100.0%) | 0 (0.0%) |
| Computers & Mathematics | 0 (0.0%) | 0 (0.0%) |
| Architecture & Engineering | 4 (100.0%) | 0 (0.0%) |
| Life, Physical & Social Science | 0 (0.0%) | 0 (0.0%) |
| Community & Social Service | 9 (50.0%) | 9 (50.0%) |
| Education, Arts & Media | 0 (0.0%) | 0 (0.0%) |
| Legal Services & Support | 0 (0.0%) | 0 (0.0%) |
| Education Instruction & Library | 4 (30.8%) | 9 (69.2%) |
| Arts, Media & Entertainment | 5 (100.0%) | 0 (0.0%) |
| Health Diagnosing & Treating | 0 (0.0%) | 0 (0.0%) |
| Health Technologists | 0 (0.0%) | 0 (0.0%) |
| Total (Category) | 16 (47.1%) | 18 (52.9%) |
| Total (Overall) | 51 (52.0%) | 47 (48.0%) |
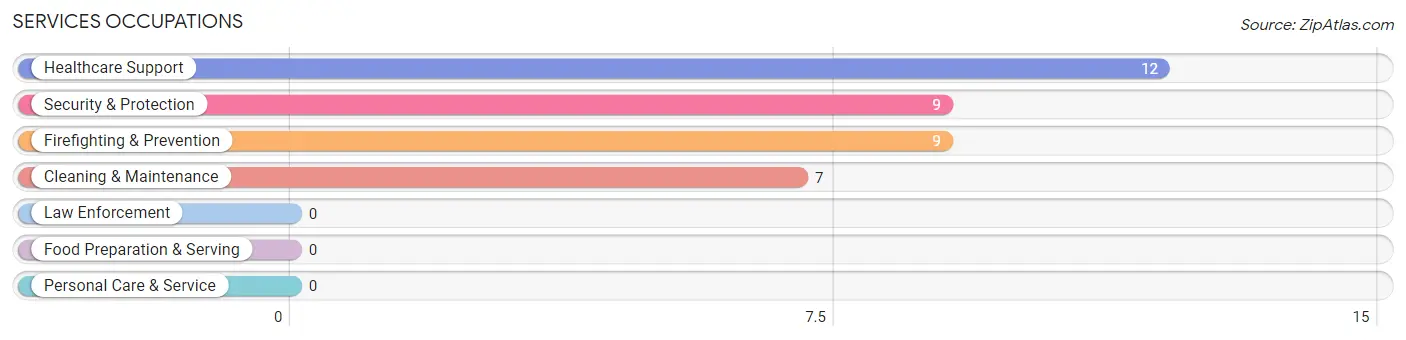
Services Occupations
The most common Services occupations in West Glacier are Healthcare Support (12 | 12.2%), Security & Protection (9 | 9.2%), Firefighting & Prevention (9 | 9.2%), and Cleaning & Maintenance (7 | 7.1%).
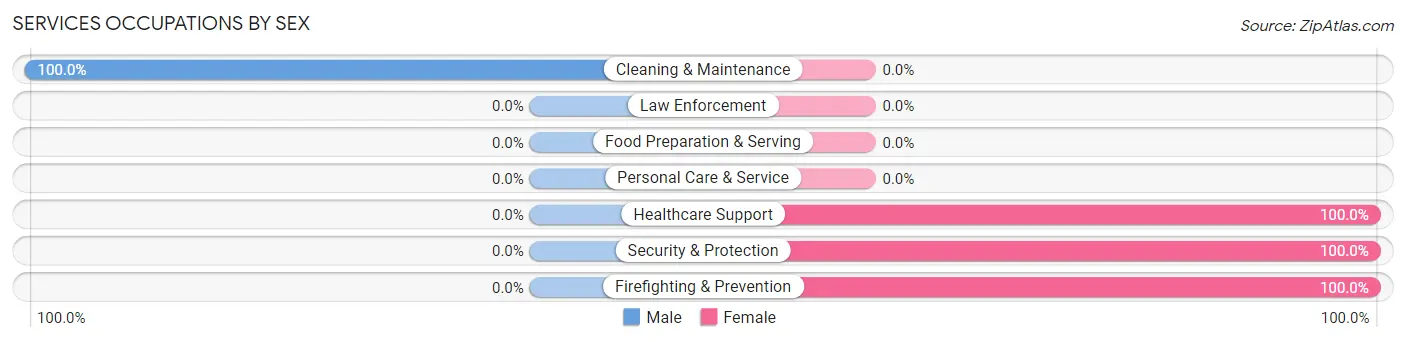
Services Occupations by Sex
| Occupation | Male | Female |
| Healthcare Support | 0 (0.0%) | 12 (100.0%) |
| Security & Protection | 0 (0.0%) | 9 (100.0%) |
| Firefighting & Prevention | 0 (0.0%) | 9 (100.0%) |
| Law Enforcement | 0 (0.0%) | 0 (0.0%) |
| Food Preparation & Serving | 0 (0.0%) | 0 (0.0%) |
| Cleaning & Maintenance | 7 (100.0%) | 0 (0.0%) |
| Personal Care & Service | 0 (0.0%) | 0 (0.0%) |
| Total (Category) | 7 (25.0%) | 21 (75.0%) |
| Total (Overall) | 51 (52.0%) | 47 (48.0%) |
Sales and Office Occupations
The most common Sales and Office occupations in West Glacier are Office & Administration (10 | 10.2%), and Sales & Related (9 | 9.2%).
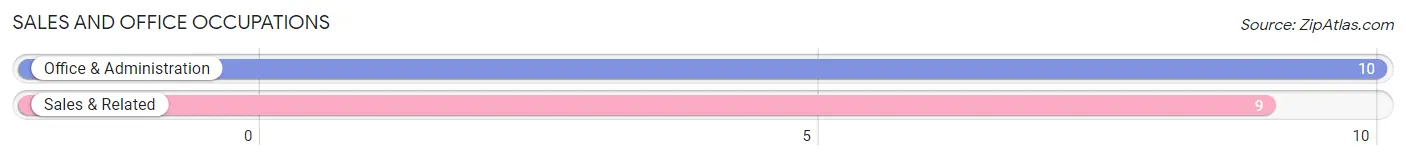
Sales and Office Occupations by Sex
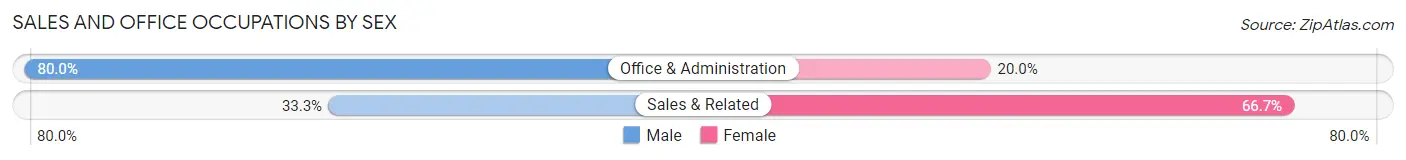
| Occupation | Male | Female |
| Sales & Related | 3 (33.3%) | 6 (66.7%) |
| Office & Administration | 8 (80.0%) | 2 (20.0%) |
| Total (Category) | 11 (57.9%) | 8 (42.1%) |
| Total (Overall) | 51 (52.0%) | 47 (48.0%) |
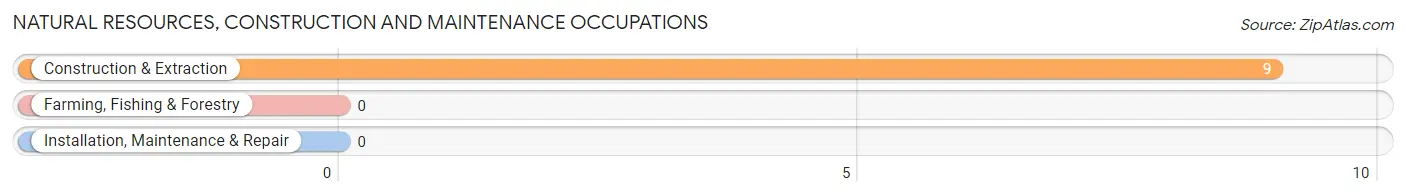
Natural Resources, Construction and Maintenance Occupations
The most common Natural Resources, Construction and Maintenance occupations in West Glacier are , and Construction & Extraction (9 | 9.2%).
Natural Resources, Construction and Maintenance Occupations by Sex
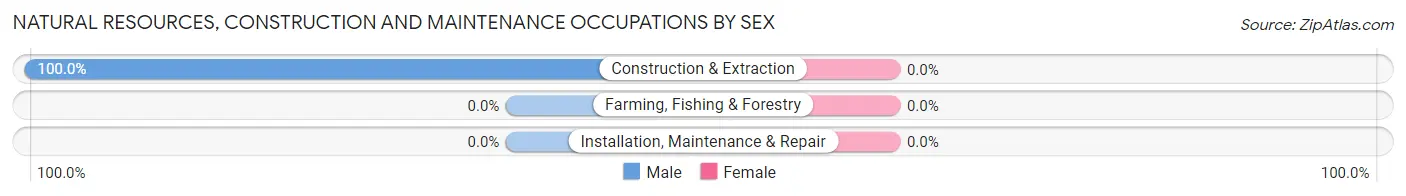
| Occupation | Male | Female |
| Farming, Fishing & Forestry | 0 (0.0%) | 0 (0.0%) |
| Construction & Extraction | 9 (100.0%) | 0 (0.0%) |
| Installation, Maintenance & Repair | 0 (0.0%) | 0 (0.0%) |
| Total (Category) | 9 (100.0%) | 0 (0.0%) |
| Total (Overall) | 51 (52.0%) | 47 (48.0%) |
Production, Transportation and Moving Occupations
The most common Production, Transportation and Moving occupations in West Glacier are , and Production (8 | 8.2%).
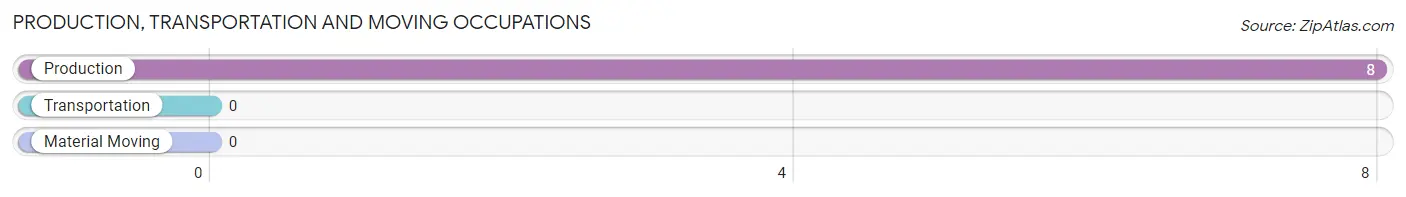
Production, Transportation and Moving Occupations by Sex
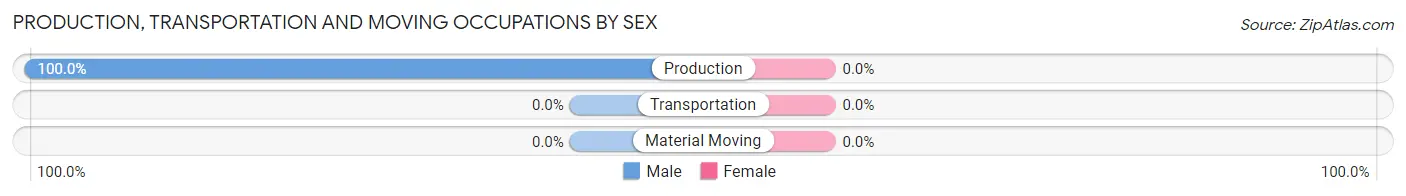
| Occupation | Male | Female |
| Production | 8 (100.0%) | 0 (0.0%) |
| Transportation | 0 (0.0%) | 0 (0.0%) |
| Material Moving | 0 (0.0%) | 0 (0.0%) |
| Total (Category) | 8 (100.0%) | 0 (0.0%) |
| Total (Overall) | 51 (52.0%) | 47 (48.0%) |
Employment Industries by Sex in West Glacier
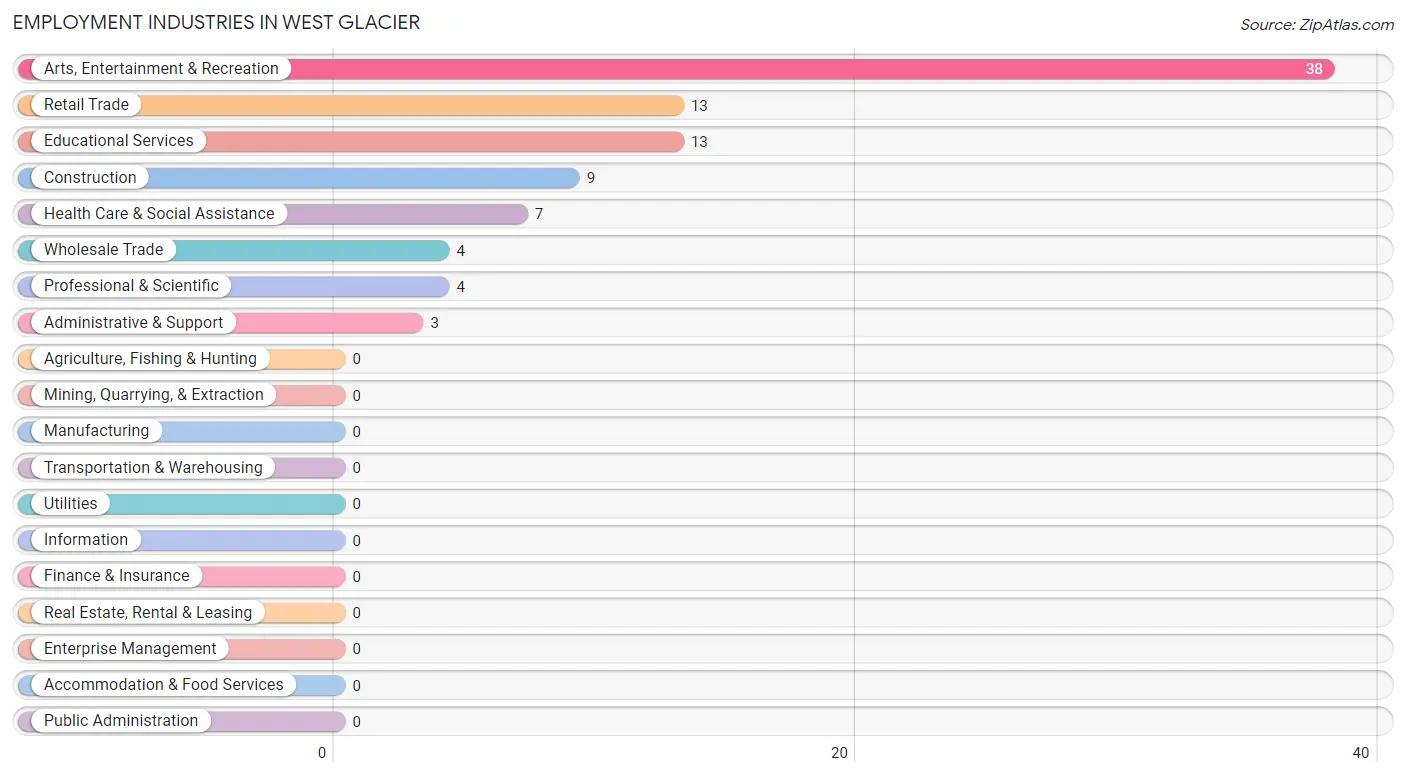
Employment Industries in West Glacier
The major employment industries in West Glacier include Arts, Entertainment & Recreation (38 | 38.8%), Retail Trade (13 | 13.3%), Educational Services (13 | 13.3%), Construction (9 | 9.2%), and Health Care & Social Assistance (7 | 7.1%).
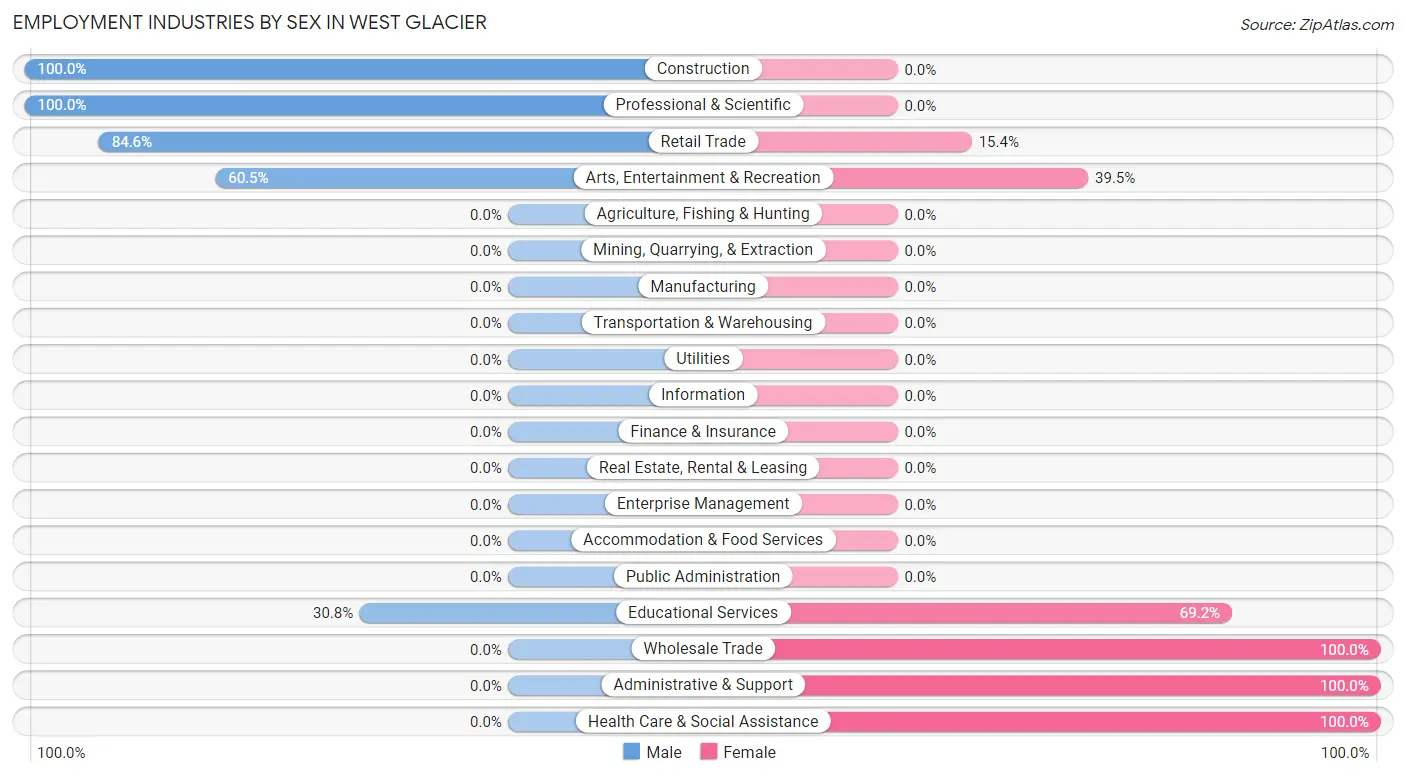
Employment Industries by Sex in West Glacier
The West Glacier industries that see more men than women are Construction (100.0%), Professional & Scientific (100.0%), and Retail Trade (84.6%), whereas the industries that tend to have a higher number of women are Wholesale Trade (100.0%), Administrative & Support (100.0%), and Health Care & Social Assistance (100.0%).
| Industry | Male | Female |
| Agriculture, Fishing & Hunting | 0 (0.0%) | 0 (0.0%) |
| Mining, Quarrying, & Extraction | 0 (0.0%) | 0 (0.0%) |
| Construction | 9 (100.0%) | 0 (0.0%) |
| Manufacturing | 0 (0.0%) | 0 (0.0%) |
| Wholesale Trade | 0 (0.0%) | 4 (100.0%) |
| Retail Trade | 11 (84.6%) | 2 (15.4%) |
| Transportation & Warehousing | 0 (0.0%) | 0 (0.0%) |
| Utilities | 0 (0.0%) | 0 (0.0%) |
| Information | 0 (0.0%) | 0 (0.0%) |
| Finance & Insurance | 0 (0.0%) | 0 (0.0%) |
| Real Estate, Rental & Leasing | 0 (0.0%) | 0 (0.0%) |
| Professional & Scientific | 4 (100.0%) | 0 (0.0%) |
| Enterprise Management | 0 (0.0%) | 0 (0.0%) |
| Administrative & Support | 0 (0.0%) | 3 (100.0%) |
| Educational Services | 4 (30.8%) | 9 (69.2%) |
| Health Care & Social Assistance | 0 (0.0%) | 7 (100.0%) |
| Arts, Entertainment & Recreation | 23 (60.5%) | 15 (39.5%) |
| Accommodation & Food Services | 0 (0.0%) | 0 (0.0%) |
| Public Administration | 0 (0.0%) | 0 (0.0%) |
| Total | 51 (52.0%) | 47 (48.0%) |
Education in West Glacier
School Enrollment in West Glacier
The most common levels of schooling among the 22 students in West Glacier are college / undergraduate (10 | 45.5%), elementary school (6 | 27.3%), and middle school (4 | 18.2%).
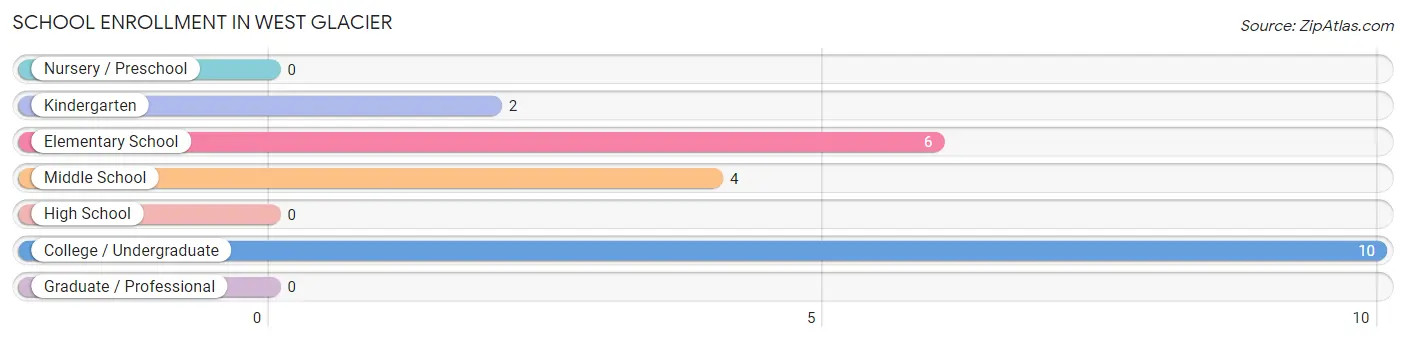
| School Level | # Students | % Students |
| Nursery / Preschool | 0 | 0.0% |
| Kindergarten | 2 | 9.1% |
| Elementary School | 6 | 27.3% |
| Middle School | 4 | 18.2% |
| High School | 0 | 0.0% |
| College / Undergraduate | 10 | 45.5% |
| Graduate / Professional | 0 | 0.0% |
| Total | 22 | 100.0% |
School Enrollment by Age by Funding Source in West Glacier
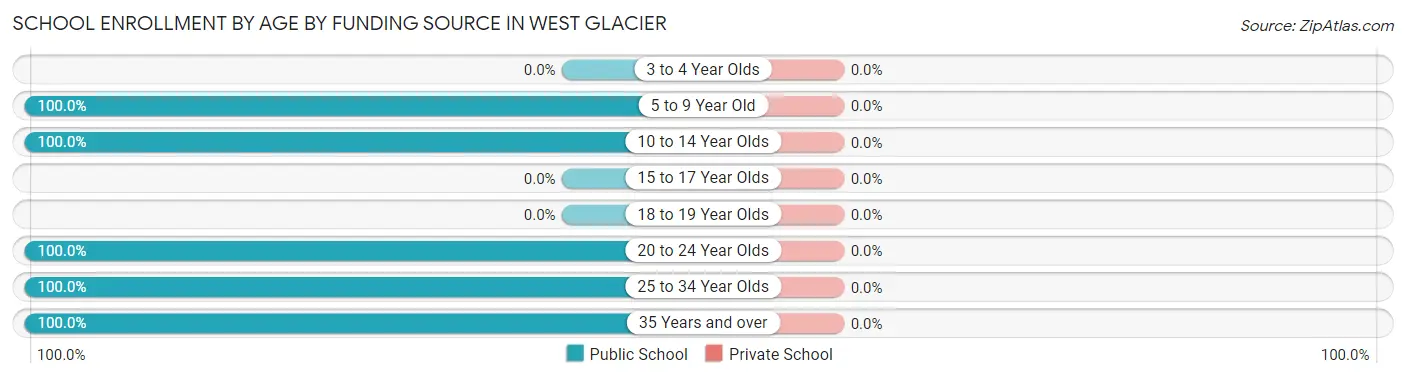
| Age Bracket | Public School | Private School |
| 3 to 4 Year Olds | 0 (0.0%) | 0 (0.0%) |
| 5 to 9 Year Old | 5 (100.0%) | 0 (0.0%) |
| 10 to 14 Year Olds | 3 (100.0%) | 0 (0.0%) |
| 15 to 17 Year Olds | 0 (0.0%) | 0 (0.0%) |
| 18 to 19 Year Olds | 0 (0.0%) | 0 (0.0%) |
| 20 to 24 Year Olds | 7 (100.0%) | 0 (0.0%) |
| 25 to 34 Year Olds | 3 (100.0%) | 0 (0.0%) |
| 35 Years and over | 4 (100.0%) | 0 (0.0%) |
| Total | 22 (100.0%) | 0 (0.0%) |
Educational Attainment by Field of Study in West Glacier
Bio, nature & agricultural (21 | 20.0%), education (20 | 19.1%), psychology (14 | 13.3%), literature & languages (11 | 10.5%), and arts & humanities (10 | 9.5%) are the most common fields of study among 105 individuals in West Glacier who have obtained a bachelor's degree or higher.
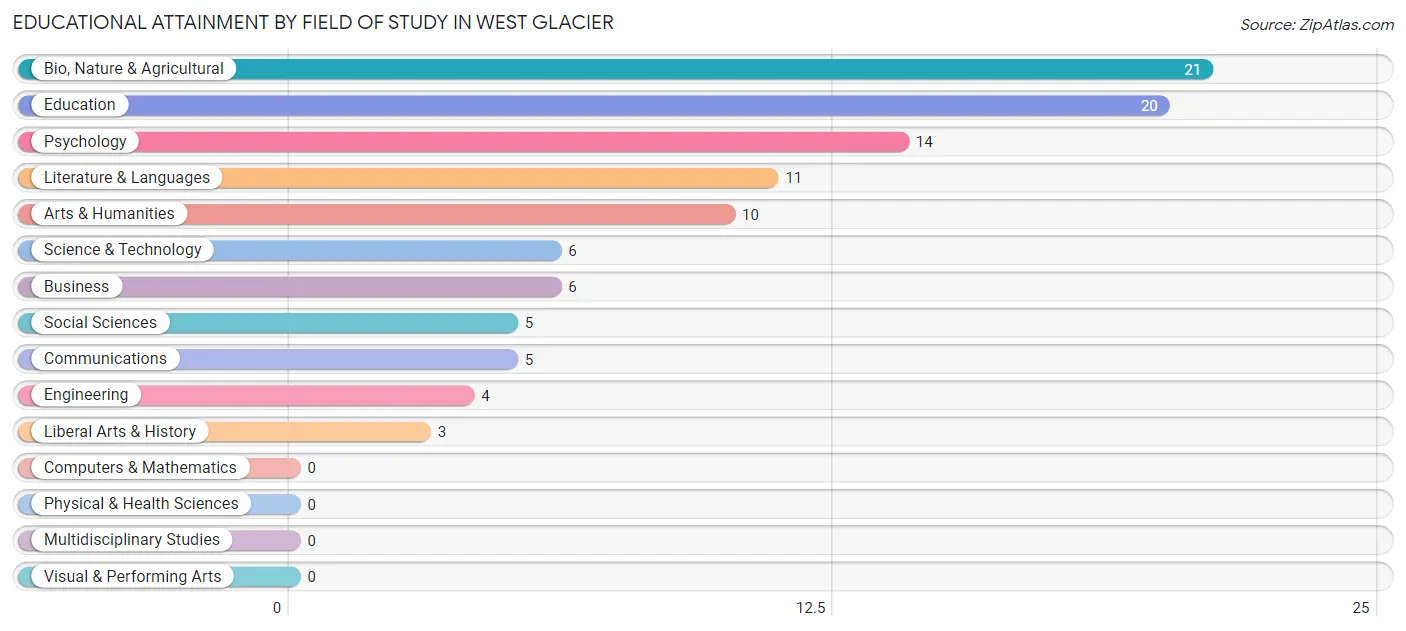
| Field of Study | # Graduates | % Graduates |
| Computers & Mathematics | 0 | 0.0% |
| Bio, Nature & Agricultural | 21 | 20.0% |
| Physical & Health Sciences | 0 | 0.0% |
| Psychology | 14 | 13.3% |
| Social Sciences | 5 | 4.8% |
| Engineering | 4 | 3.8% |
| Multidisciplinary Studies | 0 | 0.0% |
| Science & Technology | 6 | 5.7% |
| Business | 6 | 5.7% |
| Education | 20 | 19.1% |
| Literature & Languages | 11 | 10.5% |
| Liberal Arts & History | 3 | 2.9% |
| Visual & Performing Arts | 0 | 0.0% |
| Communications | 5 | 4.8% |
| Arts & Humanities | 10 | 9.5% |
| Total | 105 | 100.0% |
Transportation & Commute in West Glacier
Vehicle Availability by Sex in West Glacier
The most prevalent vehicle ownership categories in West Glacier are males with 2 vehicles (38, accounting for 74.5%) and females with 2 vehicles (35, making up 80.8%).
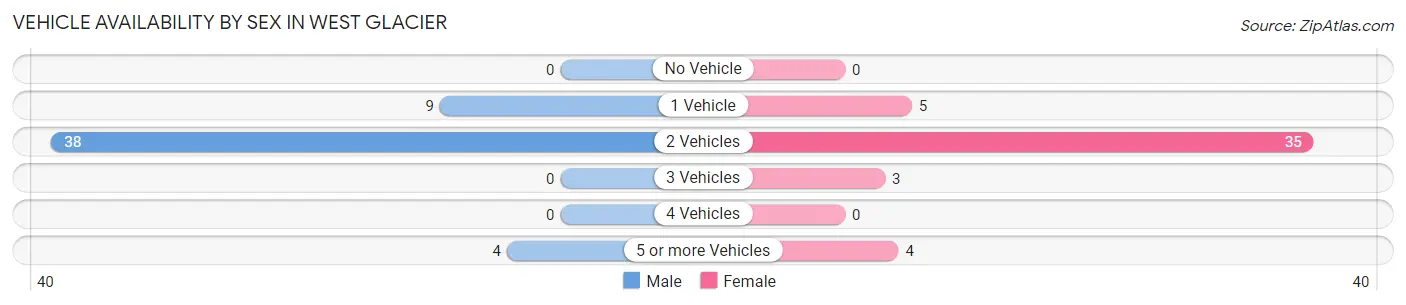
| Vehicles Available | Male | Female |
| No Vehicle | 0 (0.0%) | 0 (0.0%) |
| 1 Vehicle | 9 (17.6%) | 5 (10.6%) |
| 2 Vehicles | 38 (74.5%) | 35 (74.5%) |
| 3 Vehicles | 0 (0.0%) | 3 (6.4%) |
| 4 Vehicles | 0 (0.0%) | 0 (0.0%) |
| 5 or more Vehicles | 4 (7.8%) | 4 (8.5%) |
| Total | 51 (100.0%) | 47 (100.0%) |
Commute Time in West Glacier
The most frequently occuring commute durations in West Glacier are 10 to 14 minutes (33 commuters, 45.8%), 30 to 34 minutes (20 commuters, 27.8%), and 25 to 29 minutes (7 commuters, 9.7%).
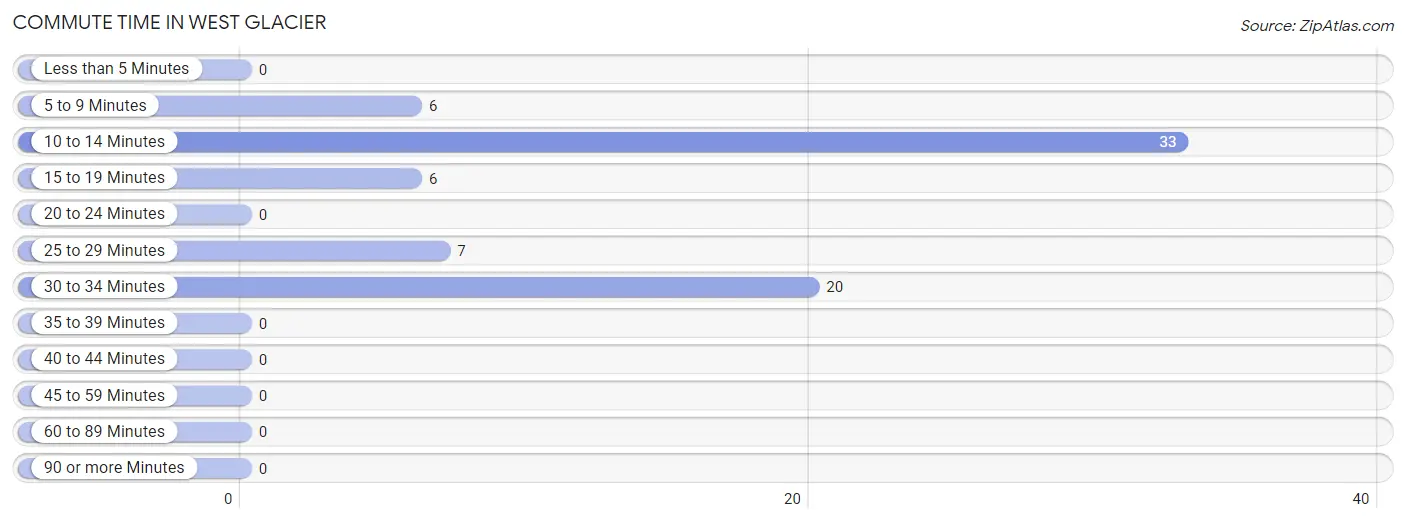
| Commute Time | # Commuters | % Commuters |
| Less than 5 Minutes | 0 | 0.0% |
| 5 to 9 Minutes | 6 | 8.3% |
| 10 to 14 Minutes | 33 | 45.8% |
| 15 to 19 Minutes | 6 | 8.3% |
| 20 to 24 Minutes | 0 | 0.0% |
| 25 to 29 Minutes | 7 | 9.7% |
| 30 to 34 Minutes | 20 | 27.8% |
| 35 to 39 Minutes | 0 | 0.0% |
| 40 to 44 Minutes | 0 | 0.0% |
| 45 to 59 Minutes | 0 | 0.0% |
| 60 to 89 Minutes | 0 | 0.0% |
| 90 or more Minutes | 0 | 0.0% |
Commute Time by Sex in West Glacier
The most common commute times in West Glacier are 10 to 14 minutes (24 commuters, 64.9%) for males and 10 to 14 minutes (9 commuters, 25.7%) for females.
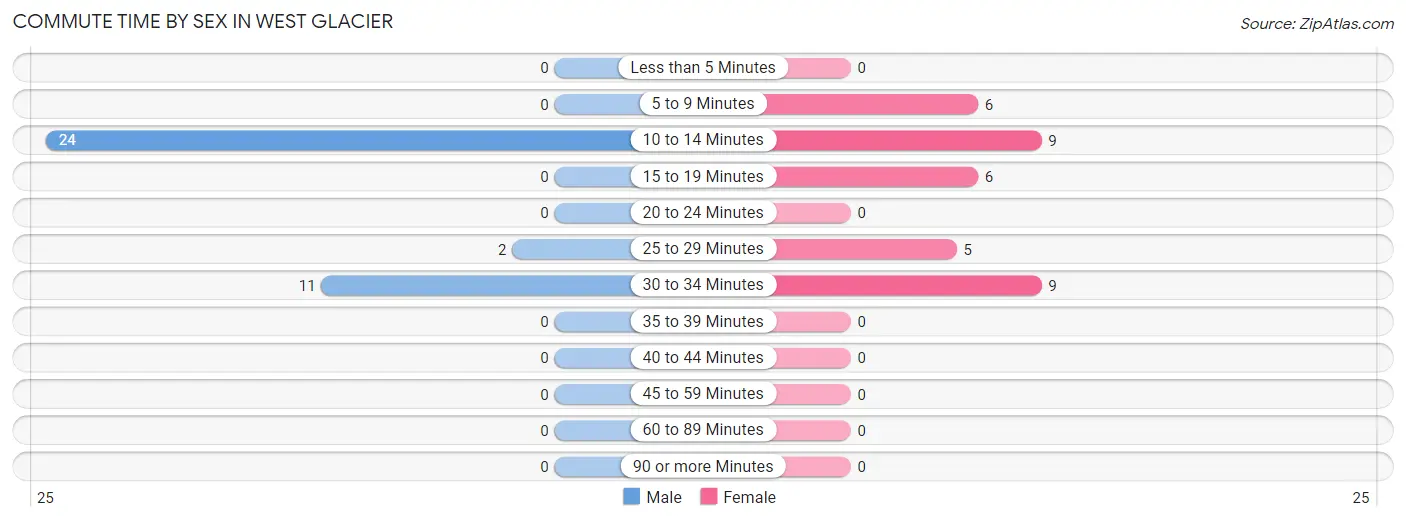
| Commute Time | Male | Female |
| Less than 5 Minutes | 0 (0.0%) | 0 (0.0%) |
| 5 to 9 Minutes | 0 (0.0%) | 6 (17.1%) |
| 10 to 14 Minutes | 24 (64.9%) | 9 (25.7%) |
| 15 to 19 Minutes | 0 (0.0%) | 6 (17.1%) |
| 20 to 24 Minutes | 0 (0.0%) | 0 (0.0%) |
| 25 to 29 Minutes | 2 (5.4%) | 5 (14.3%) |
| 30 to 34 Minutes | 11 (29.7%) | 9 (25.7%) |
| 35 to 39 Minutes | 0 (0.0%) | 0 (0.0%) |
| 40 to 44 Minutes | 0 (0.0%) | 0 (0.0%) |
| 45 to 59 Minutes | 0 (0.0%) | 0 (0.0%) |
| 60 to 89 Minutes | 0 (0.0%) | 0 (0.0%) |
| 90 or more Minutes | 0 (0.0%) | 0 (0.0%) |
Time of Departure to Work by Sex in West Glacier
The most frequent times of departure to work in West Glacier are 7:30 AM to 7:59 AM (12, 32.4%) for males and 8:00 AM to 8:29 AM (13, 37.1%) for females.
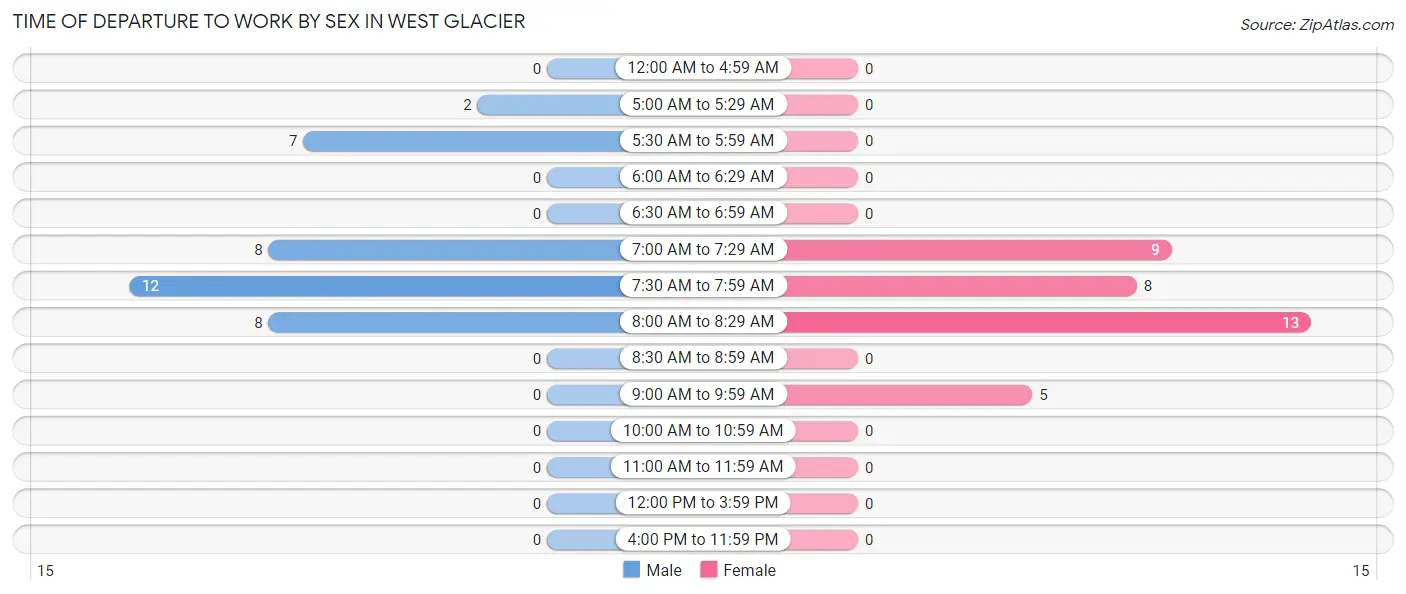
| Time of Departure | Male | Female |
| 12:00 AM to 4:59 AM | 0 (0.0%) | 0 (0.0%) |
| 5:00 AM to 5:29 AM | 2 (5.4%) | 0 (0.0%) |
| 5:30 AM to 5:59 AM | 7 (18.9%) | 0 (0.0%) |
| 6:00 AM to 6:29 AM | 0 (0.0%) | 0 (0.0%) |
| 6:30 AM to 6:59 AM | 0 (0.0%) | 0 (0.0%) |
| 7:00 AM to 7:29 AM | 8 (21.6%) | 9 (25.7%) |
| 7:30 AM to 7:59 AM | 12 (32.4%) | 8 (22.9%) |
| 8:00 AM to 8:29 AM | 8 (21.6%) | 13 (37.1%) |
| 8:30 AM to 8:59 AM | 0 (0.0%) | 0 (0.0%) |
| 9:00 AM to 9:59 AM | 0 (0.0%) | 5 (14.3%) |
| 10:00 AM to 10:59 AM | 0 (0.0%) | 0 (0.0%) |
| 11:00 AM to 11:59 AM | 0 (0.0%) | 0 (0.0%) |
| 12:00 PM to 3:59 PM | 0 (0.0%) | 0 (0.0%) |
| 4:00 PM to 11:59 PM | 0 (0.0%) | 0 (0.0%) |
| Total | 37 (100.0%) | 35 (100.0%) |
Housing Occupancy in West Glacier
Occupancy by Ownership in West Glacier
Of the total 95 dwellings in West Glacier, owner-occupied units account for 55 (57.9%), while renter-occupied units make up 40 (42.1%).
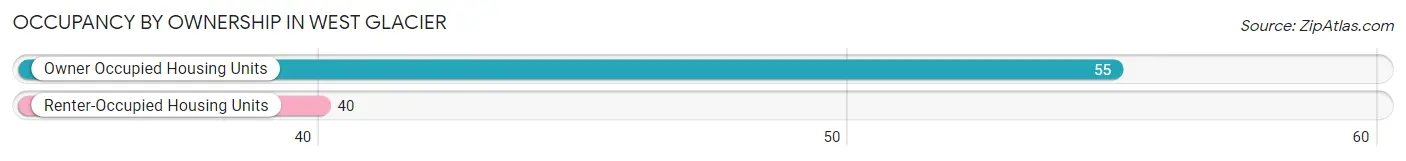
| Occupancy | # Housing Units | % Housing Units |
| Owner Occupied Housing Units | 55 | 57.9% |
| Renter-Occupied Housing Units | 40 | 42.1% |
| Total Occupied Housing Units | 95 | 100.0% |
Occupancy by Household Size in West Glacier
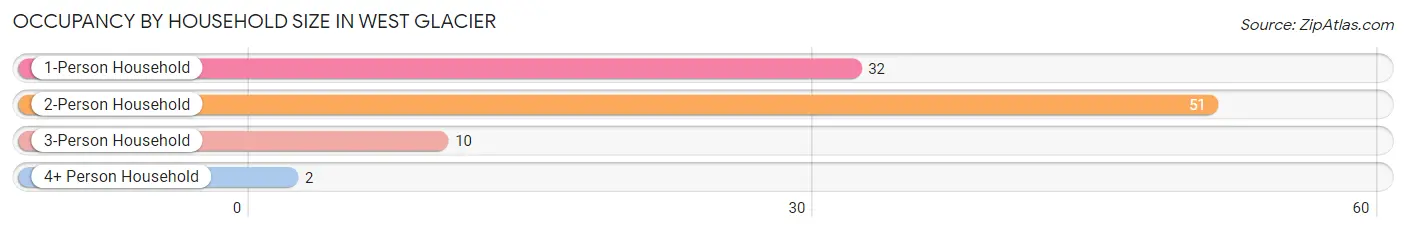
| Household Size | # Housing Units | % Housing Units |
| 1-Person Household | 32 | 33.7% |
| 2-Person Household | 51 | 53.7% |
| 3-Person Household | 10 | 10.5% |
| 4+ Person Household | 2 | 2.1% |
| Total Housing Units | 95 | 100.0% |
Occupancy by Ownership by Household Size in West Glacier
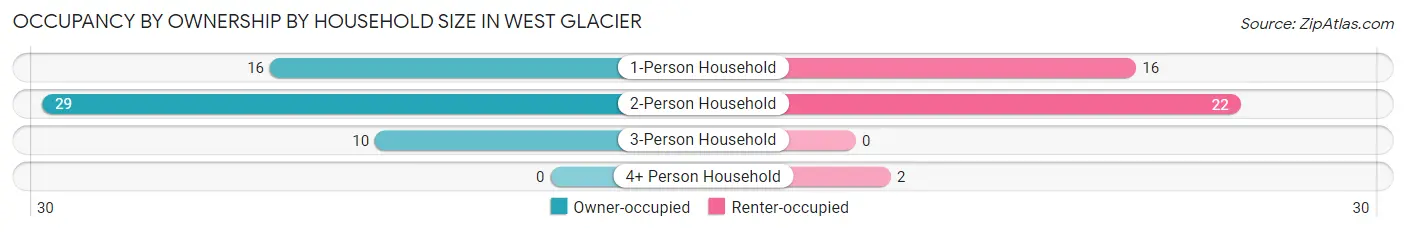
| Household Size | Owner-occupied | Renter-occupied |
| 1-Person Household | 16 (50.0%) | 16 (50.0%) |
| 2-Person Household | 29 (56.9%) | 22 (43.1%) |
| 3-Person Household | 10 (100.0%) | 0 (0.0%) |
| 4+ Person Household | 0 (0.0%) | 2 (100.0%) |
| Total Housing Units | 55 (57.9%) | 40 (42.1%) |
Occupancy by Educational Attainment in West Glacier
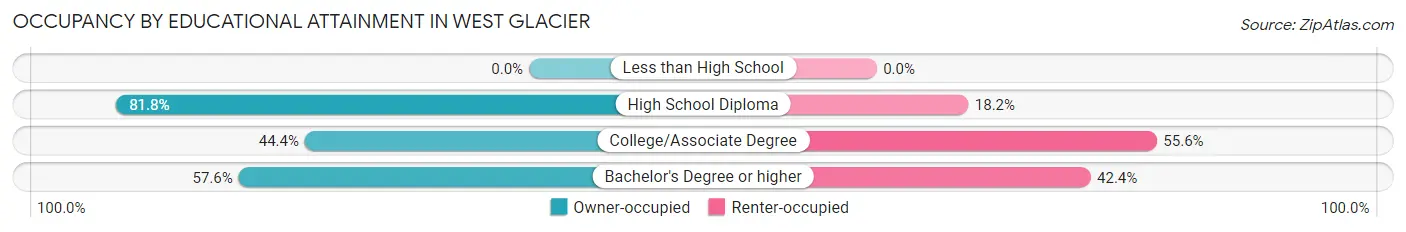
| Household Size | Owner-occupied | Renter-occupied |
| Less than High School | 0 (0.0%) | 0 (0.0%) |
| High School Diploma | 9 (81.8%) | 2 (18.2%) |
| College/Associate Degree | 8 (44.4%) | 10 (55.6%) |
| Bachelor's Degree or higher | 38 (57.6%) | 28 (42.4%) |
Occupancy by Age of Householder in West Glacier
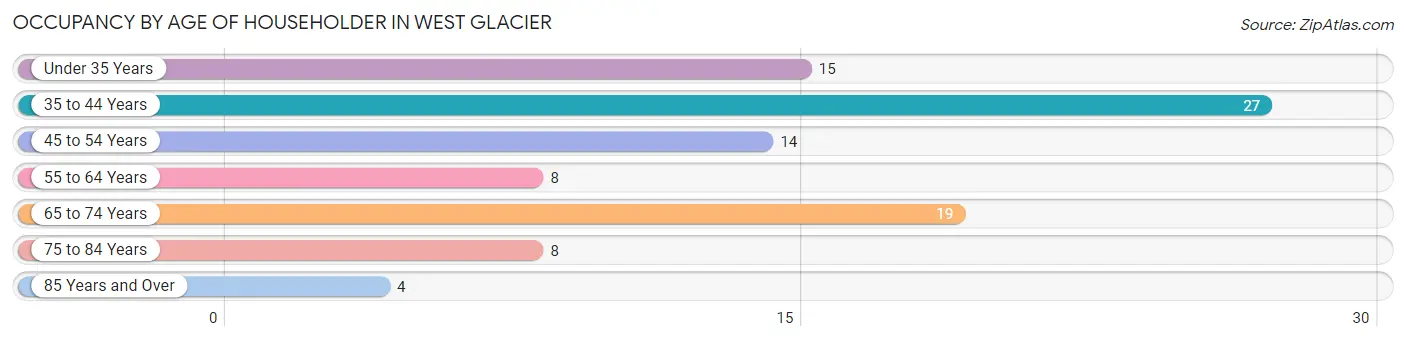
| Age Bracket | # Households | % Households |
| Under 35 Years | 15 | 15.8% |
| 35 to 44 Years | 27 | 28.4% |
| 45 to 54 Years | 14 | 14.7% |
| 55 to 64 Years | 8 | 8.4% |
| 65 to 74 Years | 19 | 20.0% |
| 75 to 84 Years | 8 | 8.4% |
| 85 Years and Over | 4 | 4.2% |
| Total | 95 | 100.0% |
Housing Finances in West Glacier
Median Income by Occupancy in West Glacier
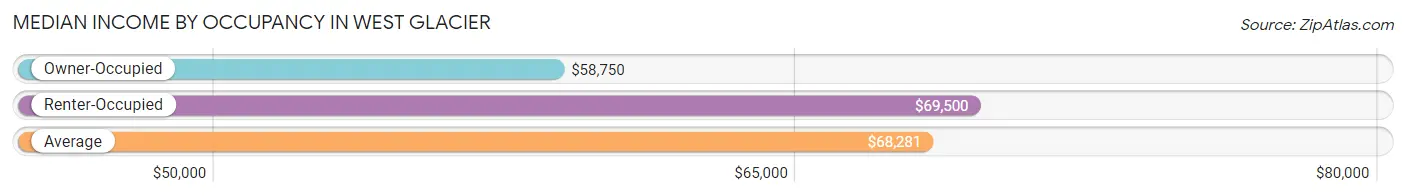
| Occupancy Type | # Households | Median Income |
| Owner-Occupied | 55 (57.9%) | $58,750 |
| Renter-Occupied | 40 (42.1%) | $69,500 |
| Average | 95 (100.0%) | $68,281 |
Occupancy by Householder Income Bracket in West Glacier
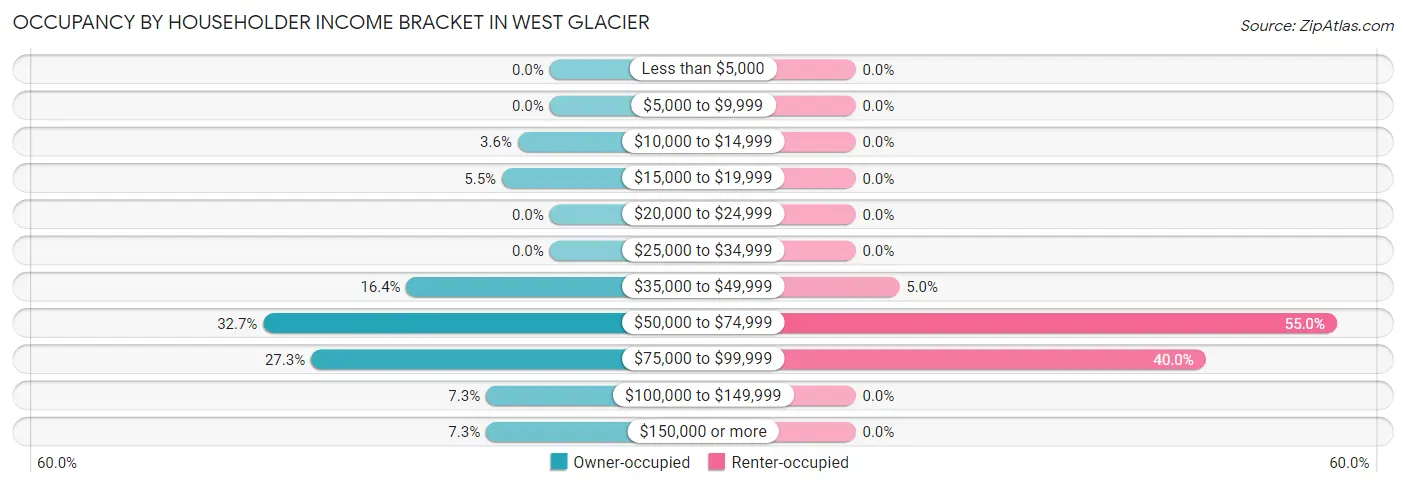
| Income Bracket | Owner-occupied | Renter-occupied |
| Less than $5,000 | 0 (0.0%) | 0 (0.0%) |
| $5,000 to $9,999 | 0 (0.0%) | 0 (0.0%) |
| $10,000 to $14,999 | 2 (3.6%) | 0 (0.0%) |
| $15,000 to $19,999 | 3 (5.4%) | 0 (0.0%) |
| $20,000 to $24,999 | 0 (0.0%) | 0 (0.0%) |
| $25,000 to $34,999 | 0 (0.0%) | 0 (0.0%) |
| $35,000 to $49,999 | 9 (16.4%) | 2 (5.0%) |
| $50,000 to $74,999 | 18 (32.7%) | 22 (55.0%) |
| $75,000 to $99,999 | 15 (27.3%) | 16 (40.0%) |
| $100,000 to $149,999 | 4 (7.3%) | 0 (0.0%) |
| $150,000 or more | 4 (7.3%) | 0 (0.0%) |
| Total | 55 (100.0%) | 40 (100.0%) |
Monthly Housing Cost Tiers in West Glacier
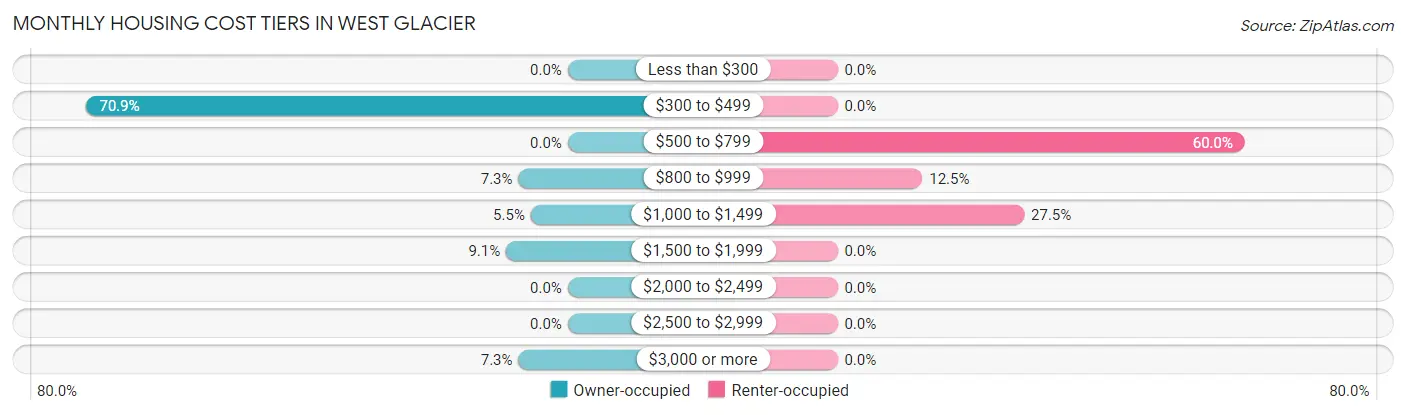
| Monthly Cost | Owner-occupied | Renter-occupied |
| Less than $300 | 0 (0.0%) | 0 (0.0%) |
| $300 to $499 | 39 (70.9%) | 0 (0.0%) |
| $500 to $799 | 0 (0.0%) | 24 (60.0%) |
| $800 to $999 | 4 (7.3%) | 5 (12.5%) |
| $1,000 to $1,499 | 3 (5.4%) | 11 (27.5%) |
| $1,500 to $1,999 | 5 (9.1%) | 0 (0.0%) |
| $2,000 to $2,499 | 0 (0.0%) | 0 (0.0%) |
| $2,500 to $2,999 | 0 (0.0%) | 0 (0.0%) |
| $3,000 or more | 4 (7.3%) | 0 (0.0%) |
| Total | 55 (100.0%) | 40 (100.0%) |
Physical Housing Characteristics in West Glacier
Housing Structures in West Glacier
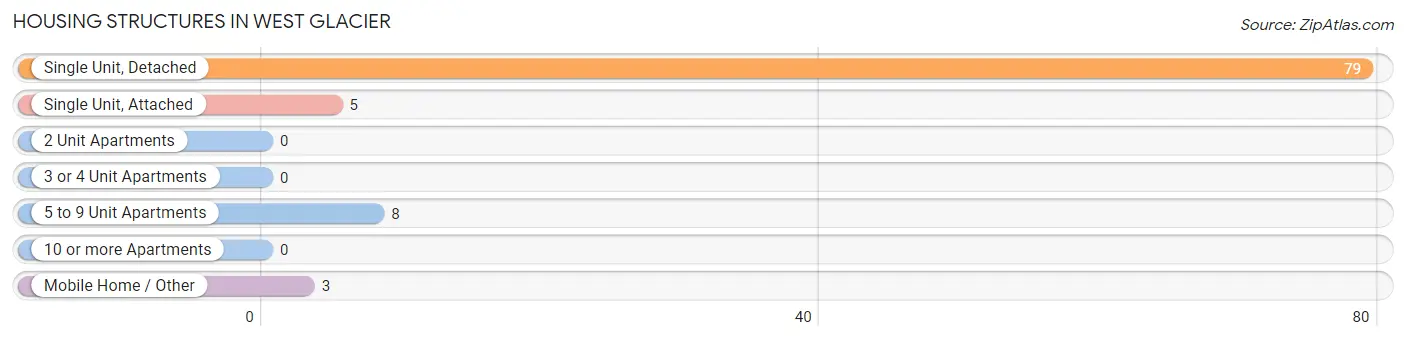
| Structure Type | # Housing Units | % Housing Units |
| Single Unit, Detached | 79 | 83.2% |
| Single Unit, Attached | 5 | 5.3% |
| 2 Unit Apartments | 0 | 0.0% |
| 3 or 4 Unit Apartments | 0 | 0.0% |
| 5 to 9 Unit Apartments | 8 | 8.4% |
| 10 or more Apartments | 0 | 0.0% |
| Mobile Home / Other | 3 | 3.2% |
| Total | 95 | 100.0% |
Housing Structures by Occupancy in West Glacier
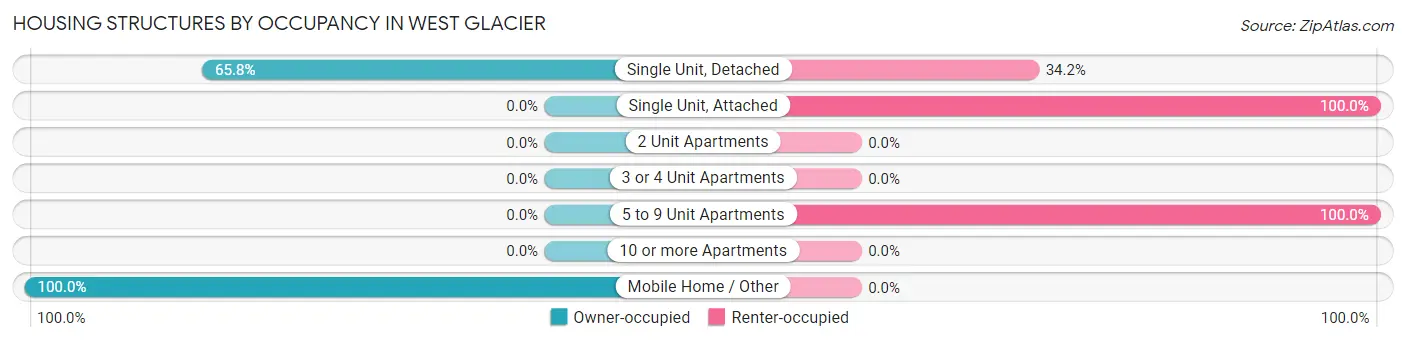
| Structure Type | Owner-occupied | Renter-occupied |
| Single Unit, Detached | 52 (65.8%) | 27 (34.2%) |
| Single Unit, Attached | 0 (0.0%) | 5 (100.0%) |
| 2 Unit Apartments | 0 (0.0%) | 0 (0.0%) |
| 3 or 4 Unit Apartments | 0 (0.0%) | 0 (0.0%) |
| 5 to 9 Unit Apartments | 0 (0.0%) | 8 (100.0%) |
| 10 or more Apartments | 0 (0.0%) | 0 (0.0%) |
| Mobile Home / Other | 3 (100.0%) | 0 (0.0%) |
| Total | 55 (57.9%) | 40 (42.1%) |
Housing Structures by Number of Rooms in West Glacier
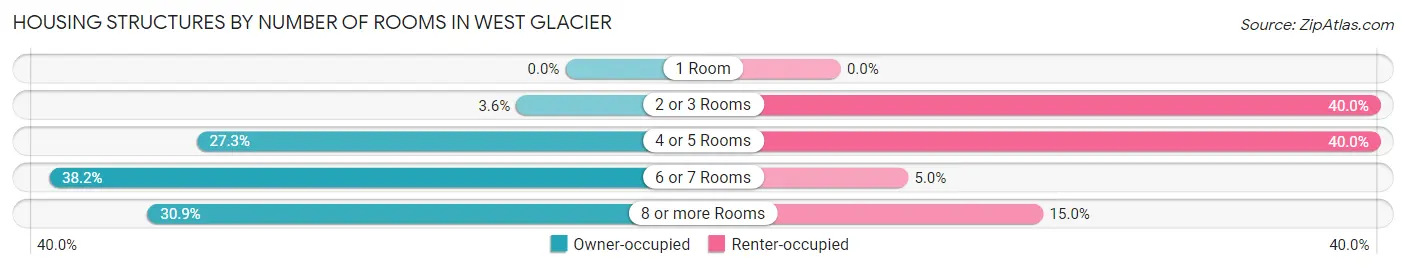
| Number of Rooms | Owner-occupied | Renter-occupied |
| 1 Room | 0 (0.0%) | 0 (0.0%) |
| 2 or 3 Rooms | 2 (3.6%) | 16 (40.0%) |
| 4 or 5 Rooms | 15 (27.3%) | 16 (40.0%) |
| 6 or 7 Rooms | 21 (38.2%) | 2 (5.0%) |
| 8 or more Rooms | 17 (30.9%) | 6 (15.0%) |
| Total | 55 (100.0%) | 40 (100.0%) |
Housing Structure by Heating Type in West Glacier
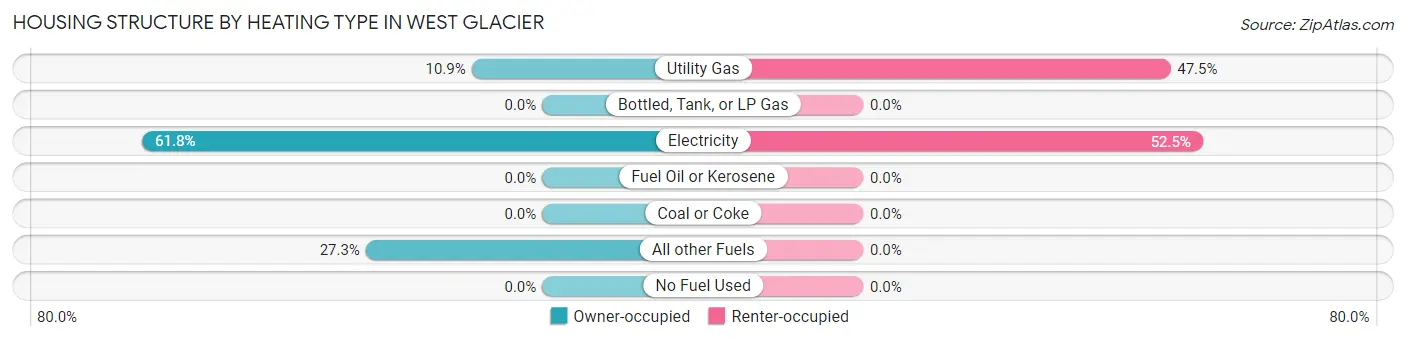
| Heating Type | Owner-occupied | Renter-occupied |
| Utility Gas | 6 (10.9%) | 19 (47.5%) |
| Bottled, Tank, or LP Gas | 0 (0.0%) | 0 (0.0%) |
| Electricity | 34 (61.8%) | 21 (52.5%) |
| Fuel Oil or Kerosene | 0 (0.0%) | 0 (0.0%) |
| Coal or Coke | 0 (0.0%) | 0 (0.0%) |
| All other Fuels | 15 (27.3%) | 0 (0.0%) |
| No Fuel Used | 0 (0.0%) | 0 (0.0%) |
| Total | 55 (100.0%) | 40 (100.0%) |
Household Vehicle Usage in West Glacier
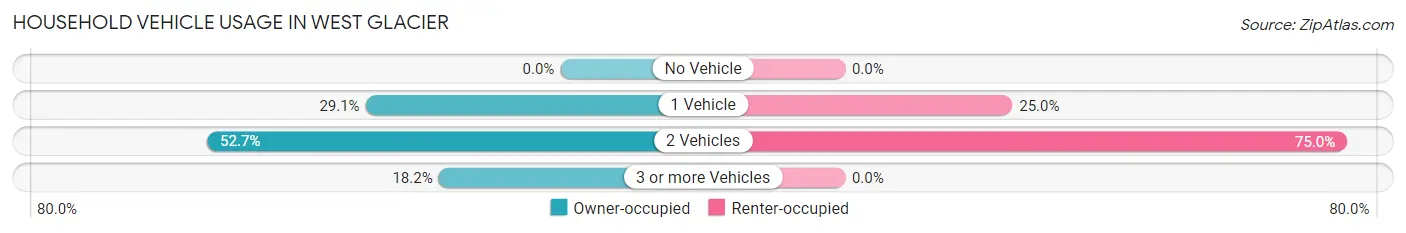
| Vehicles per Household | Owner-occupied | Renter-occupied |
| No Vehicle | 0 (0.0%) | 0 (0.0%) |
| 1 Vehicle | 16 (29.1%) | 10 (25.0%) |
| 2 Vehicles | 29 (52.7%) | 30 (75.0%) |
| 3 or more Vehicles | 10 (18.2%) | 0 (0.0%) |
| Total | 55 (100.0%) | 40 (100.0%) |
Real Estate & Mortgages in West Glacier
Real Estate and Mortgage Overview in West Glacier
| Characteristic | Without Mortgage | With Mortgage |
| Housing Units | 43 | 12 |
| Median Property Value | $536,800 | $650,000 |
| Median Household Income | $54,583 | $0 |
| Monthly Housing Costs | $347 | $4 |
| Real Estate Taxes | $2,396 | $0 |
Property Value by Mortgage Status in West Glacier

| Property Value | Without Mortgage | With Mortgage |
| Less than $50,000 | 0 (0.0%) | 0 (0.0%) |
| $50,000 to $99,999 | 0 (0.0%) | 0 (0.0%) |
| $100,000 to $299,999 | 0 (0.0%) | 3 (25.0%) |
| $300,000 to $499,999 | 19 (44.2%) | 0 (0.0%) |
| $500,000 to $749,999 | 17 (39.5%) | 5 (41.7%) |
| $750,000 to $999,999 | 7 (16.3%) | 0 (0.0%) |
| $1,000,000 or more | 0 (0.0%) | 4 (33.3%) |
| Total | 43 (100.0%) | 12 (100.0%) |
Household Income by Mortgage Status in West Glacier
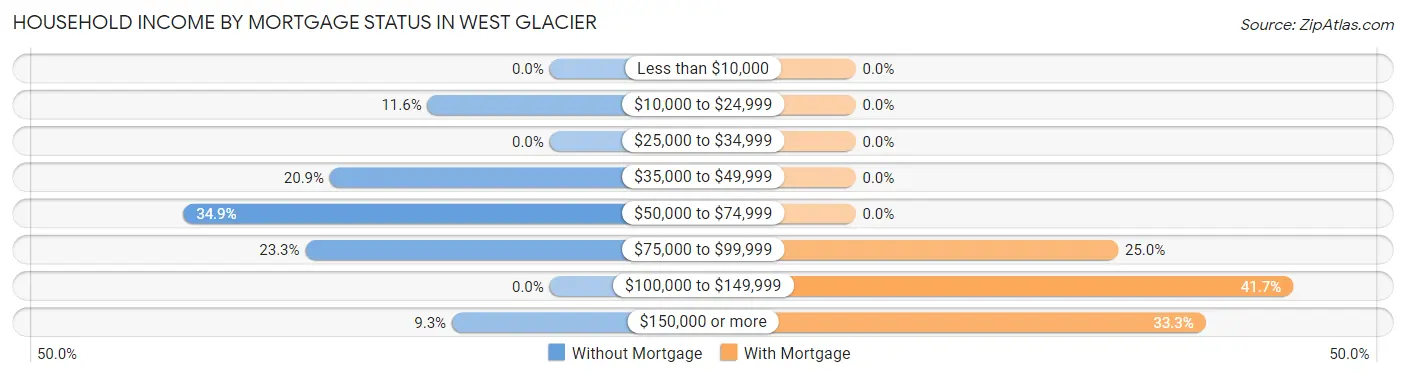
| Household Income | Without Mortgage | With Mortgage |
| Less than $10,000 | 0 (0.0%) | 0 (0.0%) |
| $10,000 to $24,999 | 5 (11.6%) | 0 (0.0%) |
| $25,000 to $34,999 | 0 (0.0%) | 0 (0.0%) |
| $35,000 to $49,999 | 9 (20.9%) | 0 (0.0%) |
| $50,000 to $74,999 | 15 (34.9%) | 0 (0.0%) |
| $75,000 to $99,999 | 10 (23.3%) | 3 (25.0%) |
| $100,000 to $149,999 | 0 (0.0%) | 5 (41.7%) |
| $150,000 or more | 4 (9.3%) | 4 (33.3%) |
| Total | 43 (100.0%) | 12 (100.0%) |
Property Value to Household Income Ratio in West Glacier
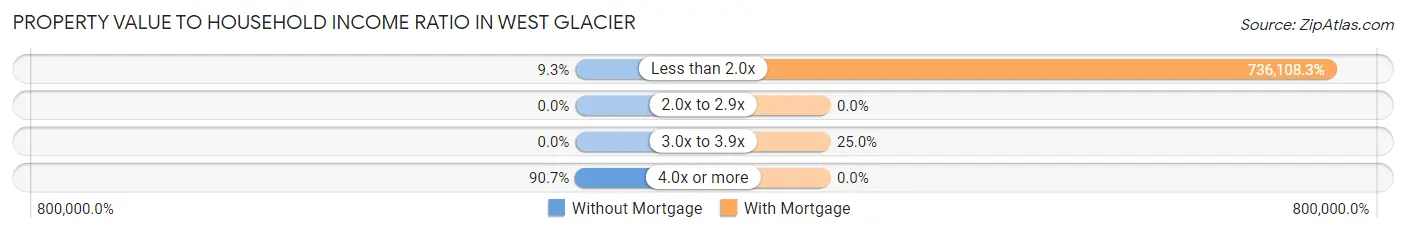
| Value-to-Income Ratio | Without Mortgage | With Mortgage |
| Less than 2.0x | 4 (9.3%) | 88,333 (736,108.3%) |
| 2.0x to 2.9x | 0 (0.0%) | 0 (0.0%) |
| 3.0x to 3.9x | 0 (0.0%) | 3 (25.0%) |
| 4.0x or more | 39 (90.7%) | 0 (0.0%) |
| Total | 43 (100.0%) | 12 (100.0%) |
Real Estate Taxes by Mortgage Status in West Glacier
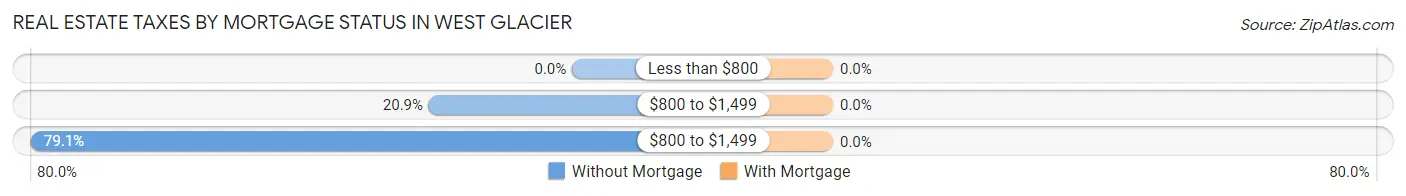
| Property Taxes | Without Mortgage | With Mortgage |
| Less than $800 | 0 (0.0%) | 0 (0.0%) |
| $800 to $1,499 | 9 (20.9%) | 0 (0.0%) |
| $800 to $1,499 | 34 (79.1%) | 0 (0.0%) |
| Total | 43 (100.0%) | 12 (100.0%) |
Health & Disability in West Glacier
Health Insurance Coverage by Age in West Glacier
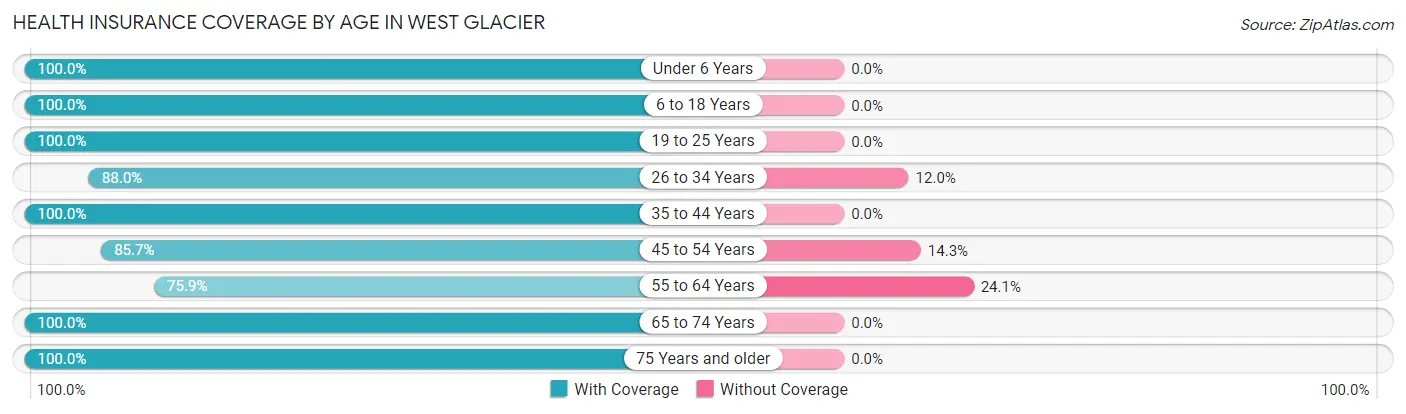
| Age Bracket | With Coverage | Without Coverage |
| Under 6 Years | 2 (100.0%) | 0 (0.0%) |
| 6 to 18 Years | 11 (100.0%) | 0 (0.0%) |
| 19 to 25 Years | 15 (100.0%) | 0 (0.0%) |
| 26 to 34 Years | 22 (88.0%) | 3 (12.0%) |
| 35 to 44 Years | 27 (100.0%) | 0 (0.0%) |
| 45 to 54 Years | 18 (85.7%) | 3 (14.3%) |
| 55 to 64 Years | 22 (75.9%) | 7 (24.1%) |
| 65 to 74 Years | 23 (100.0%) | 0 (0.0%) |
| 75 Years and older | 21 (100.0%) | 0 (0.0%) |
| Total | 161 (92.5%) | 13 (7.5%) |
Health Insurance Coverage by Citizenship Status in West Glacier
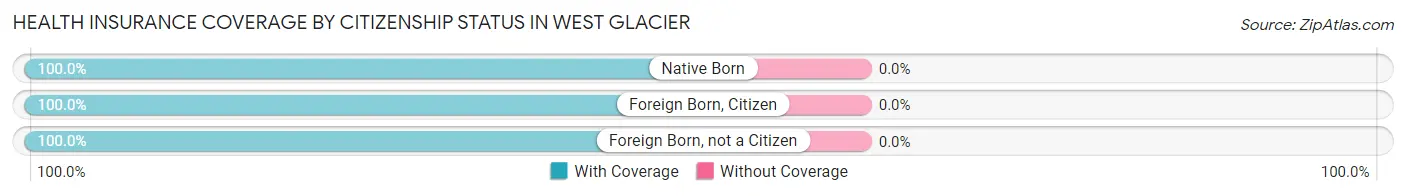
| Citizenship Status | With Coverage | Without Coverage |
| Native Born | 2 (100.0%) | 0 (0.0%) |
| Foreign Born, Citizen | 11 (100.0%) | 0 (0.0%) |
| Foreign Born, not a Citizen | 15 (100.0%) | 0 (0.0%) |
Health Insurance Coverage by Household Income in West Glacier
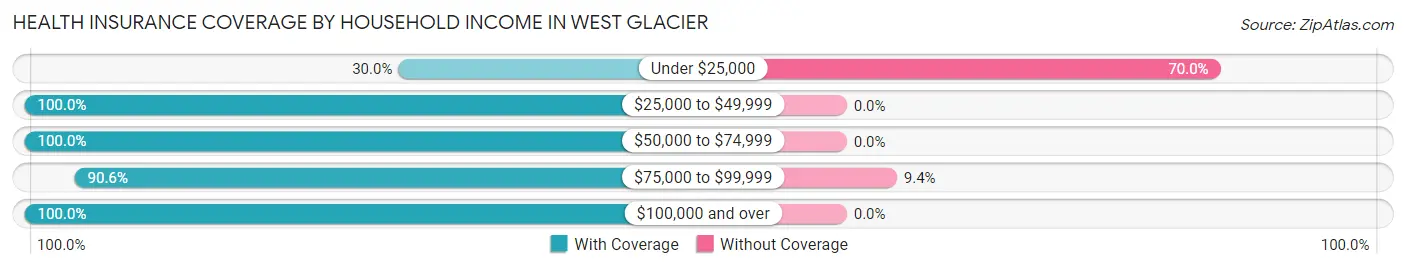
| Household Income | With Coverage | Without Coverage |
| Under $25,000 | 3 (30.0%) | 7 (70.0%) |
| $25,000 to $49,999 | 11 (100.0%) | 0 (0.0%) |
| $50,000 to $74,999 | 64 (100.0%) | 0 (0.0%) |
| $75,000 to $99,999 | 58 (90.6%) | 6 (9.4%) |
| $100,000 and over | 25 (100.0%) | 0 (0.0%) |
Public vs Private Health Insurance Coverage by Age in West Glacier
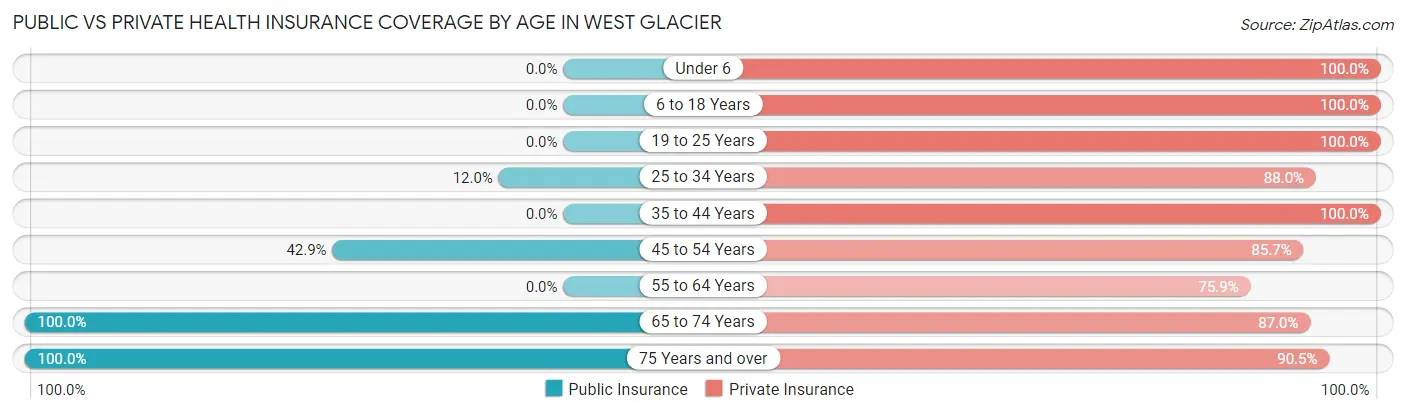
| Age Bracket | Public Insurance | Private Insurance |
| Under 6 | 0 (0.0%) | 2 (100.0%) |
| 6 to 18 Years | 0 (0.0%) | 11 (100.0%) |
| 19 to 25 Years | 0 (0.0%) | 15 (100.0%) |
| 25 to 34 Years | 3 (12.0%) | 22 (88.0%) |
| 35 to 44 Years | 0 (0.0%) | 27 (100.0%) |
| 45 to 54 Years | 9 (42.9%) | 18 (85.7%) |
| 55 to 64 Years | 0 (0.0%) | 22 (75.9%) |
| 65 to 74 Years | 23 (100.0%) | 20 (87.0%) |
| 75 Years and over | 21 (100.0%) | 19 (90.5%) |
| Total | 56 (32.2%) | 156 (89.7%) |
Disability Status by Sex by Age in West Glacier
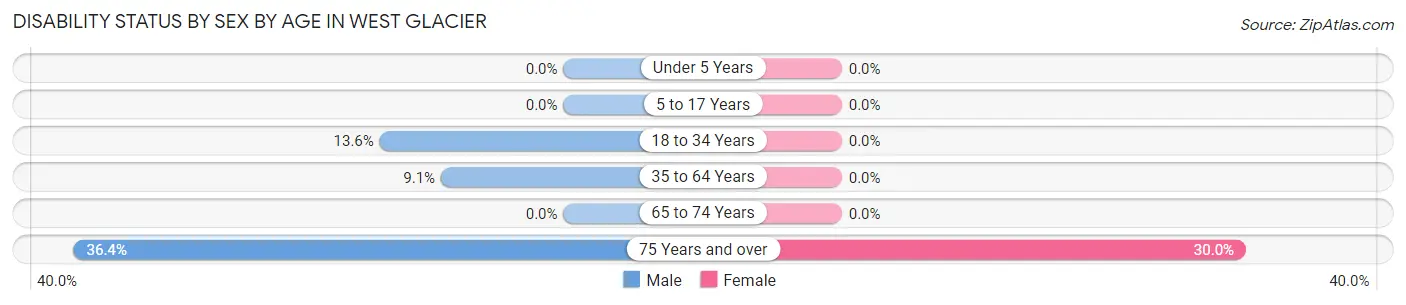
| Age Bracket | Male | Female |
| Under 5 Years | 0 (0.0%) | 0 (0.0%) |
| 5 to 17 Years | 0 (0.0%) | 0 (0.0%) |
| 18 to 34 Years | 3 (13.6%) | 0 (0.0%) |
| 35 to 64 Years | 3 (9.1%) | 0 (0.0%) |
| 65 to 74 Years | 0 (0.0%) | 0 (0.0%) |
| 75 Years and over | 4 (36.4%) | 3 (30.0%) |
Disability Class by Sex by Age in West Glacier
Disability Class: Hearing Difficulty
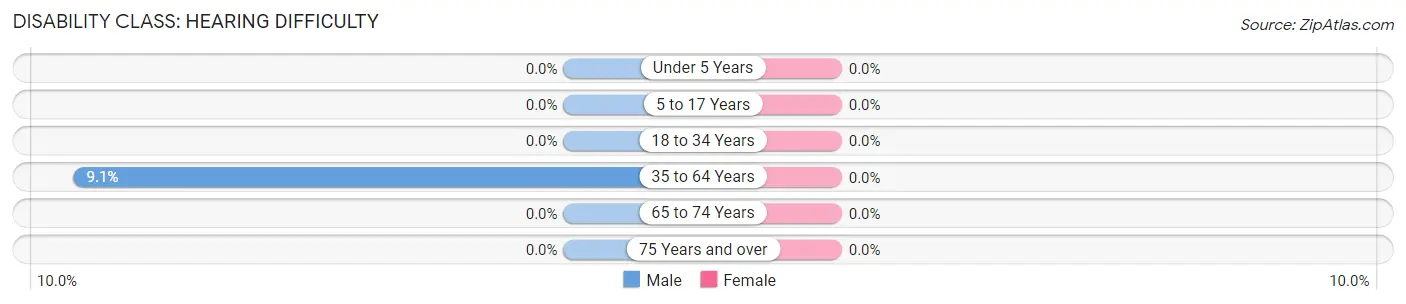
| Age Bracket | Male | Female |
| Under 5 Years | 0 (0.0%) | 0 (0.0%) |
| 5 to 17 Years | 0 (0.0%) | 0 (0.0%) |
| 18 to 34 Years | 0 (0.0%) | 0 (0.0%) |
| 35 to 64 Years | 3 (9.1%) | 0 (0.0%) |
| 65 to 74 Years | 0 (0.0%) | 0 (0.0%) |
| 75 Years and over | 0 (0.0%) | 0 (0.0%) |
Disability Class: Vision Difficulty

| Age Bracket | Male | Female |
| Under 5 Years | 0 (0.0%) | 0 (0.0%) |
| 5 to 17 Years | 0 (0.0%) | 0 (0.0%) |
| 18 to 34 Years | 0 (0.0%) | 0 (0.0%) |
| 35 to 64 Years | 3 (9.1%) | 0 (0.0%) |
| 65 to 74 Years | 0 (0.0%) | 0 (0.0%) |
| 75 Years and over | 0 (0.0%) | 0 (0.0%) |
Disability Class: Cognitive Difficulty
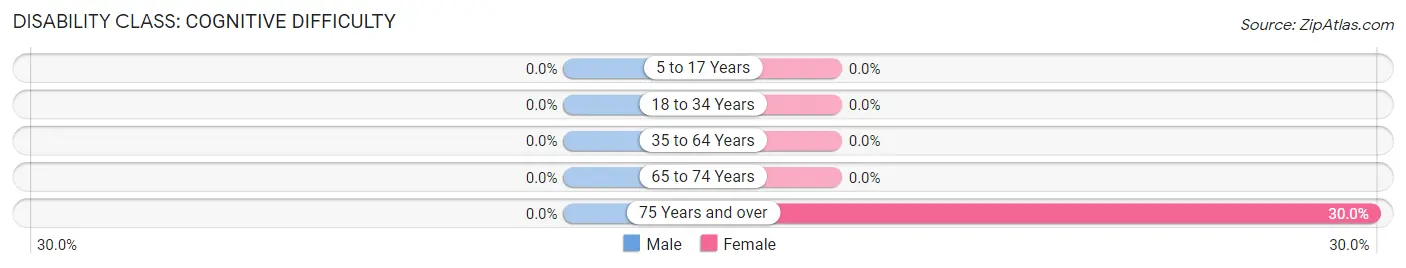
| Age Bracket | Male | Female |
| 5 to 17 Years | 0 (0.0%) | 0 (0.0%) |
| 18 to 34 Years | 0 (0.0%) | 0 (0.0%) |
| 35 to 64 Years | 0 (0.0%) | 0 (0.0%) |
| 65 to 74 Years | 0 (0.0%) | 0 (0.0%) |
| 75 Years and over | 0 (0.0%) | 3 (30.0%) |
Disability Class: Ambulatory Difficulty
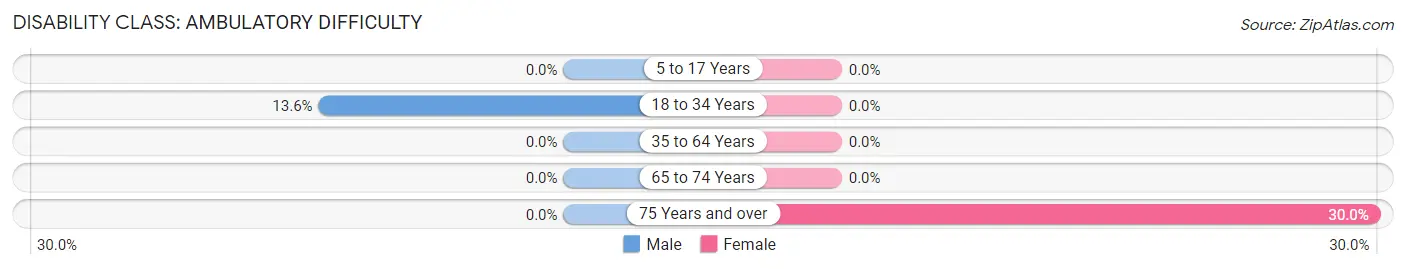
| Age Bracket | Male | Female |
| 5 to 17 Years | 0 (0.0%) | 0 (0.0%) |
| 18 to 34 Years | 3 (13.6%) | 0 (0.0%) |
| 35 to 64 Years | 0 (0.0%) | 0 (0.0%) |
| 65 to 74 Years | 0 (0.0%) | 0 (0.0%) |
| 75 Years and over | 0 (0.0%) | 3 (30.0%) |
Disability Class: Self-Care Difficulty
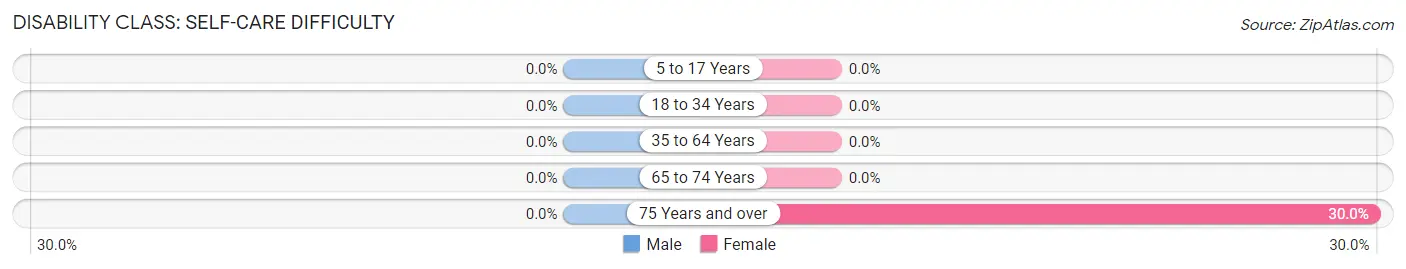
| Age Bracket | Male | Female |
| 5 to 17 Years | 0 (0.0%) | 0 (0.0%) |
| 18 to 34 Years | 0 (0.0%) | 0 (0.0%) |
| 35 to 64 Years | 0 (0.0%) | 0 (0.0%) |
| 65 to 74 Years | 0 (0.0%) | 0 (0.0%) |
| 75 Years and over | 0 (0.0%) | 3 (30.0%) |
Technology Access in West Glacier
Computing Device Access in West Glacier
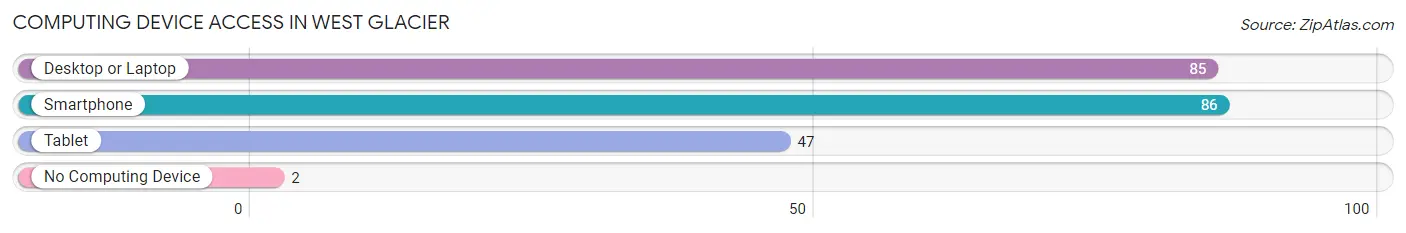
| Device Type | # Households | % Households |
| Desktop or Laptop | 85 | 89.5% |
| Smartphone | 86 | 90.5% |
| Tablet | 47 | 49.5% |
| No Computing Device | 2 | 2.1% |
| Total | 95 | 100.0% |
Internet Access in West Glacier
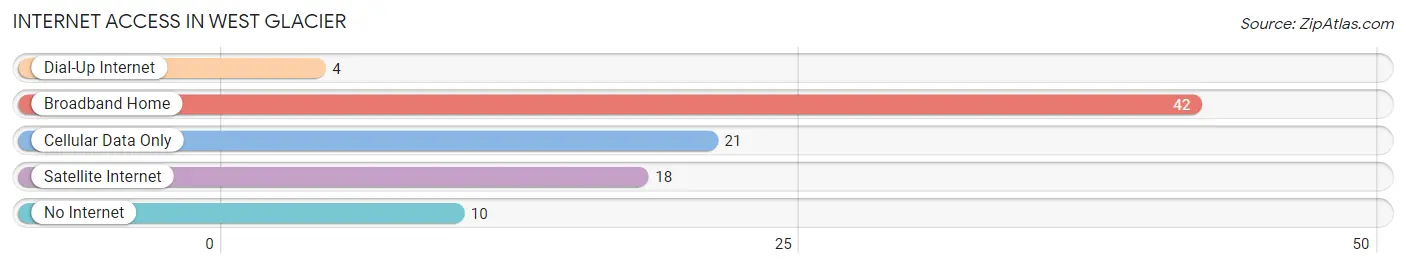
| Internet Type | # Households | % Households |
| Dial-Up Internet | 4 | 4.2% |
| Broadband Home | 42 | 44.2% |
| Cellular Data Only | 21 | 22.1% |
| Satellite Internet | 18 | 19.0% |
| No Internet | 10 | 10.5% |
| Total | 95 | 100.0% |
West Glacier Summary
History
West Glacier, Montana is a small unincorporated community located in Flathead County, Montana. It is situated on the western side of Glacier National Park, and is the gateway to the park for many visitors. The area was first inhabited by the Kootenai and Salish Native American tribes, who used the area for hunting and fishing. The first non-native settlers arrived in the area in the late 1800s, and the town was officially established in 1910.
The town was originally known as Belton, and was renamed West Glacier in 1921. The name was chosen to reflect the proximity of the town to Glacier National Park. The town was a popular destination for tourists visiting the park, and the local economy was largely based on tourism. The Great Northern Railway also ran through the town, providing transportation for visitors and goods.
Geography
West Glacier is located in Flathead County, Montana, in the northwestern part of the state. It is situated on the western side of Glacier National Park, and is the gateway to the park for many visitors. The town is located at an elevation of 3,000 feet, and is surrounded by the Rocky Mountains. The climate in the area is generally mild, with cold winters and warm summers.
The town is located on the banks of the Middle Fork of the Flathead River, and is surrounded by forests and mountains. The nearby mountains provide a variety of outdoor activities, including hiking, camping, fishing, and skiing. The nearby lakes and rivers also provide opportunities for boating and other water activities.
Economy
The economy of West Glacier is largely based on tourism. The town is the gateway to Glacier National Park, and is a popular destination for visitors to the park. The town is also home to several restaurants, hotels, and other businesses that cater to tourists. The town is also home to a number of small businesses, including a grocery store, a hardware store, and a gas station.
The town is also home to a number of small farms and ranches, which provide food and other products to the local community. The nearby forests and mountains also provide opportunities for logging and other forestry activities.
Demographics
As of the 2010 census, the population of West Glacier was 1,072. The population is largely white, with a small percentage of Native American and Hispanic residents. The median household income in the town is $37,500, and the median age is 44. The town is home to a number of small businesses, and the unemployment rate is 4.2%.
Common Questions
What is Per Capita Income in West Glacier?
Per Capita income in West Glacier is $40,913.
What is the Median Family Income in West Glacier?
Median Family Income in West Glacier is $59,583.
What is the Median Household income in West Glacier?
Median Household Income in West Glacier is $68,281.
What is Income or Wage Gap in West Glacier?
Income or Wage Gap in West Glacier is 6.0%.
Women in West Glacier earn 94.0 cents for every dollar earned by a man.
What is Inequality or Gini Index in West Glacier?
Inequality or Gini Index in West Glacier is 0.25.
What is the Total Population of West Glacier?
Total Population of West Glacier is 174.
What is the Total Male Population of West Glacier?
Total Male Population of West Glacier is 82.
What is the Total Female Population of West Glacier?
Total Female Population of West Glacier is 92.
What is the Ratio of Males per 100 Females in West Glacier?
There are 89.13 Males per 100 Females in West Glacier.
What is the Ratio of Females per 100 Males in West Glacier?
There are 112.20 Females per 100 Males in West Glacier.
What is the Median Population Age in West Glacier?
Median Population Age in West Glacier is 46.6 Years.
What is the Average Family Size in West Glacier
Average Family Size in West Glacier is 2.3 People.
What is the Average Household Size in West Glacier
Average Household Size in West Glacier is 1.8 People.
How Large is the Labor Force in West Glacier?
There are 101 People in the Labor Forcein in West Glacier.
What is the Percentage of People in the Labor Force in West Glacier?
62.7% of People are in the Labor Force in West Glacier.
What is the Unemployment Rate in West Glacier?
Unemployment Rate in West Glacier is 3.0%.