Townsend, MT Map & Demographics
Townsend Map
Townsend Overview
$34,236
PER CAPITA INCOME
$85,833
AVG FAMILY INCOME
$65,522
AVG HOUSEHOLD INCOME
27.8%
WAGE / INCOME GAP [ % ]
72.2¢/ $1
WAGE / INCOME GAP [ $ ]
0.38
INEQUALITY / GINI INDEX
2,176
TOTAL POPULATION
1,135
MALE POPULATION
1,041
FEMALE POPULATION
109.03
MALES / 100 FEMALES
91.72
FEMALES / 100 MALES
51.1
MEDIAN AGE
3.0
AVG FAMILY SIZE
2.3
AVG HOUSEHOLD SIZE
1,113
LABOR FORCE [ PEOPLE ]
59.5%
PERCENT IN LABOR FORCE
12.8%
UNEMPLOYMENT RATE
Townsend Zip Codes
Townsend Area Codes
Income in Townsend
Income Overview in Townsend
Per Capita Income in Townsend is $34,236, while median incomes of families and households are $85,833 and $65,522 respectively.
| Characteristic | Number | Measure |
| Per Capita Income | 2,176 | $34,236 |
| Median Family Income | 504 | $85,833 |
| Mean Family Income | 504 | $95,422 |
| Median Household Income | 918 | $65,522 |
| Mean Household Income | 918 | $76,075 |
| Income Deficit | 504 | $0 |
| Wage / Income Gap (%) | 2,176 | 27.76% |
| Wage / Income Gap ($) | 2,176 | 72.24¢ per $1 |
| Gini / Inequality Index | 2,176 | 0.38 |
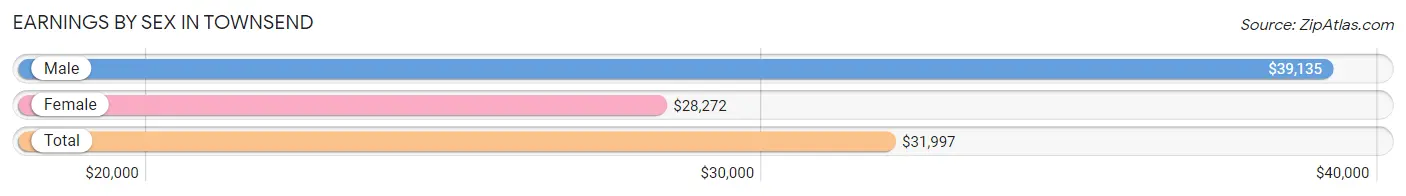
Earnings by Sex in Townsend
Average Earnings in Townsend are $31,997, $39,135 for men and $28,272 for women, a difference of 27.8%.
| Sex | Number | Average Earnings |
| Male | 664 (53.4%) | $39,135 |
| Female | 580 (46.6%) | $28,272 |
| Total | 1,244 (100.0%) | $31,997 |
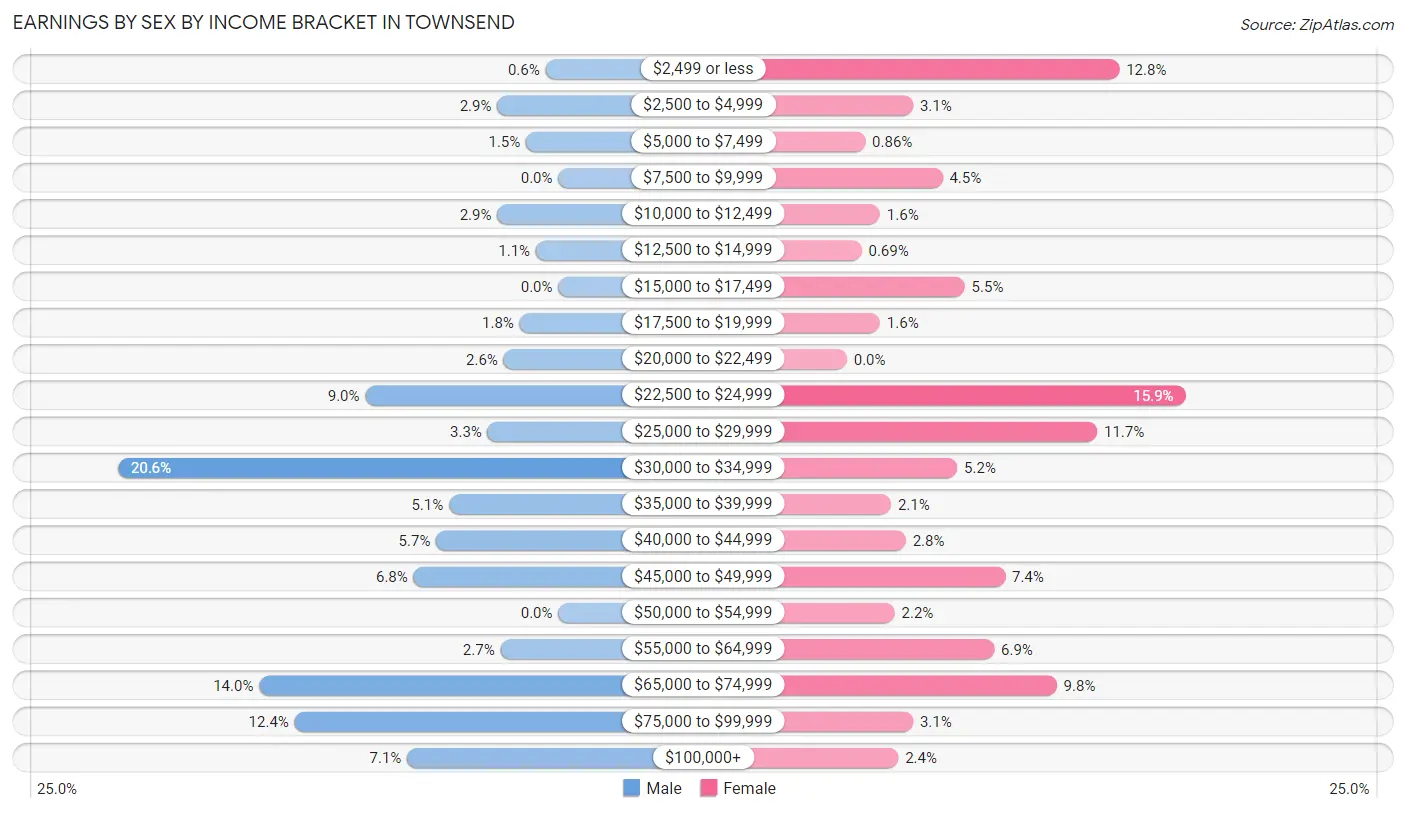
Earnings by Sex by Income Bracket in Townsend
The most common earnings brackets in Townsend are $30,000 to $34,999 for men (137 | 20.6%) and $22,500 to $24,999 for women (92 | 15.9%).
| Income | Male | Female |
| $2,499 or less | 4 (0.6%) | 74 (12.8%) |
| $2,500 to $4,999 | 19 (2.9%) | 18 (3.1%) |
| $5,000 to $7,499 | 10 (1.5%) | 5 (0.9%) |
| $7,500 to $9,999 | 0 (0.0%) | 26 (4.5%) |
| $10,000 to $12,499 | 19 (2.9%) | 9 (1.5%) |
| $12,500 to $14,999 | 7 (1.1%) | 4 (0.7%) |
| $15,000 to $17,499 | 0 (0.0%) | 32 (5.5%) |
| $17,500 to $19,999 | 12 (1.8%) | 9 (1.5%) |
| $20,000 to $22,499 | 17 (2.6%) | 0 (0.0%) |
| $22,500 to $24,999 | 60 (9.0%) | 92 (15.9%) |
| $25,000 to $29,999 | 22 (3.3%) | 68 (11.7%) |
| $30,000 to $34,999 | 137 (20.6%) | 30 (5.2%) |
| $35,000 to $39,999 | 34 (5.1%) | 12 (2.1%) |
| $40,000 to $44,999 | 38 (5.7%) | 16 (2.8%) |
| $45,000 to $49,999 | 45 (6.8%) | 43 (7.4%) |
| $50,000 to $54,999 | 0 (0.0%) | 13 (2.2%) |
| $55,000 to $64,999 | 18 (2.7%) | 40 (6.9%) |
| $65,000 to $74,999 | 93 (14.0%) | 57 (9.8%) |
| $75,000 to $99,999 | 82 (12.3%) | 18 (3.1%) |
| $100,000+ | 47 (7.1%) | 14 (2.4%) |
| Total | 664 (100.0%) | 580 (100.0%) |
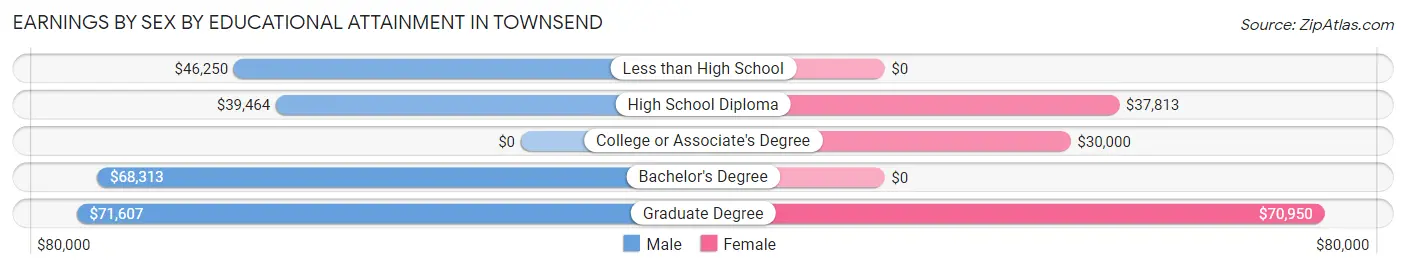
Earnings by Sex by Educational Attainment in Townsend
Average earnings in Townsend are $42,422 for men and $32,375 for women, a difference of 23.7%. Men with an educational attainment of graduate degree enjoy the highest average annual earnings of $71,607, while those with high school diploma education earn the least with $39,464. Women with an educational attainment of graduate degree earn the most with the average annual earnings of $70,950, while those with college or associate's degree education have the smallest earnings of $30,000.
| Educational Attainment | Male Income | Female Income |
| Less than High School | $46,250 | $0 |
| High School Diploma | $39,464 | $37,813 |
| College or Associate's Degree | - | - |
| Bachelor's Degree | $68,313 | $0 |
| Graduate Degree | $71,607 | $70,950 |
| Total | $42,422 | $32,375 |
Family Income in Townsend
Family Income Brackets in Townsend
According to the Townsend family income data, there are 138 families falling into the $100,000 to $149,999 income range, which is the most common income bracket and makes up 27.4% of all families. Conversely, the $25,000 to $34,999 income bracket is the least frequent group with only 7 families (1.4%) belonging to this category.
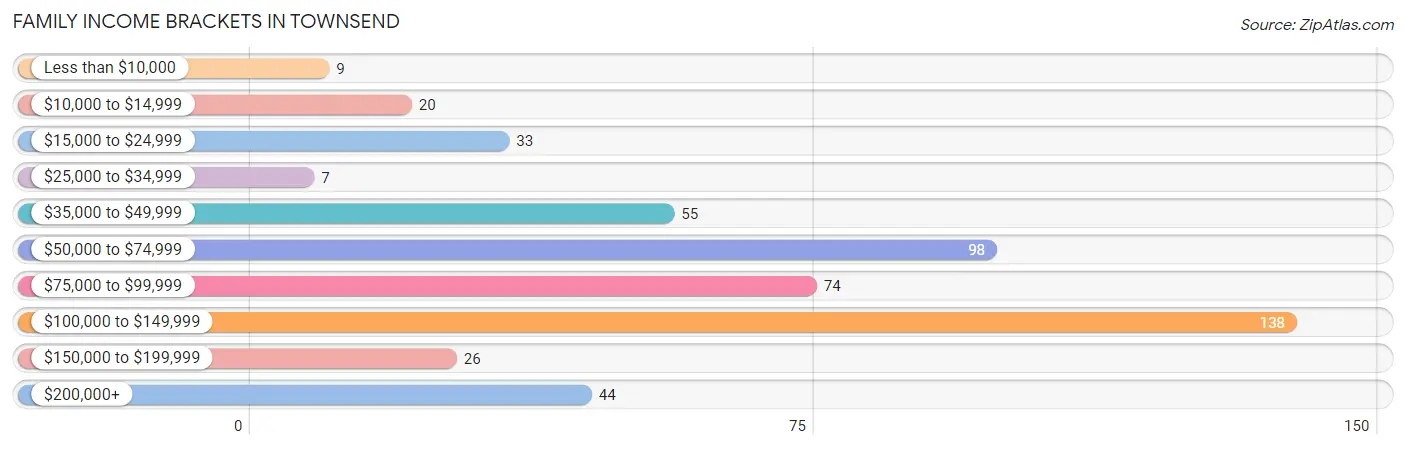
| Income Bracket | # Families | % Families |
| Less than $10,000 | 9 | 1.8% |
| $10,000 to $14,999 | 20 | 4.0% |
| $15,000 to $24,999 | 33 | 6.5% |
| $25,000 to $34,999 | 7 | 1.4% |
| $35,000 to $49,999 | 55 | 10.9% |
| $50,000 to $74,999 | 98 | 19.4% |
| $75,000 to $99,999 | 74 | 14.7% |
| $100,000 to $149,999 | 138 | 27.4% |
| $150,000 to $199,999 | 26 | 5.2% |
| $200,000+ | 44 | 8.7% |
Family Income by Famaliy Size in Townsend
5-person families (54 | 10.7%) account for the highest median family income in Townsend with $222,589 per family, while 5-person families (54 | 10.7%) have the highest median income of $44,518 per family member.
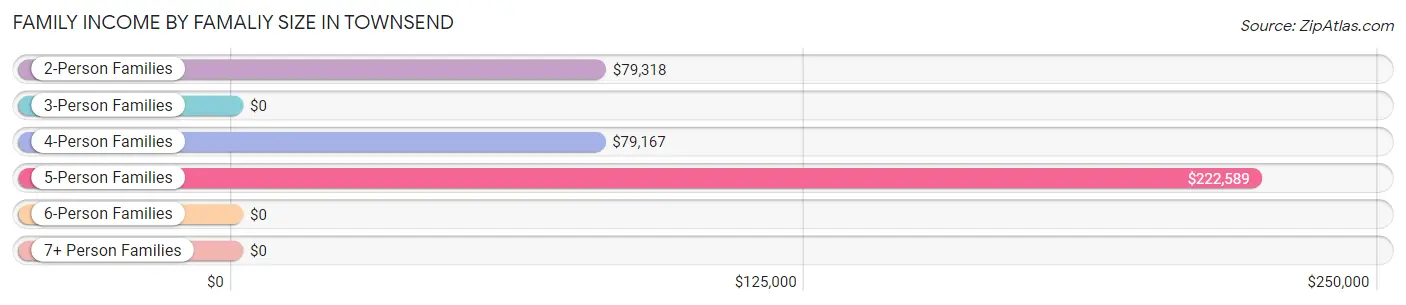
| Income Bracket | # Families | Median Income |
| 2-Person Families | 304 (60.3%) | $79,318 |
| 3-Person Families | 46 (9.1%) | $0 |
| 4-Person Families | 82 (16.3%) | $79,167 |
| 5-Person Families | 54 (10.7%) | $222,589 |
| 6-Person Families | 18 (3.6%) | $0 |
| 7+ Person Families | 0 (0.0%) | $0 |
| Total | 504 (100.0%) | $85,833 |
Family Income by Number of Earners in Townsend
The median family income in Townsend is $85,833, with families comprising 3+ earners (42) having the highest median family income of $156,842, while families with no earners (120) have the lowest median family income of $47,273, accounting for 8.3% and 23.8% of families, respectively.
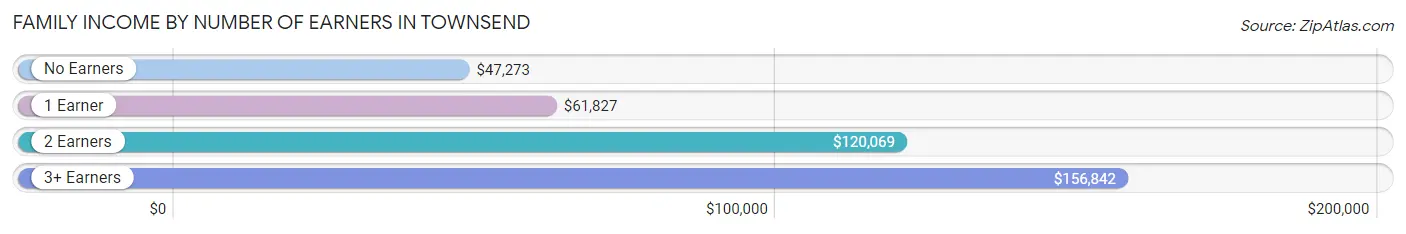
| Number of Earners | # Families | Median Income |
| No Earners | 120 (23.8%) | $47,273 |
| 1 Earner | 111 (22.0%) | $61,827 |
| 2 Earners | 231 (45.8%) | $120,069 |
| 3+ Earners | 42 (8.3%) | $156,842 |
| Total | 504 (100.0%) | $85,833 |
Household Income in Townsend
Household Income Brackets in Townsend
With 299 households falling in the category, the $50,000 to $74,999 income range is the most frequent in Townsend, accounting for 32.6% of all households. In contrast, only 30 households (3.3%) fall into the $150,000 to $199,999 income bracket, making it the least populous group.
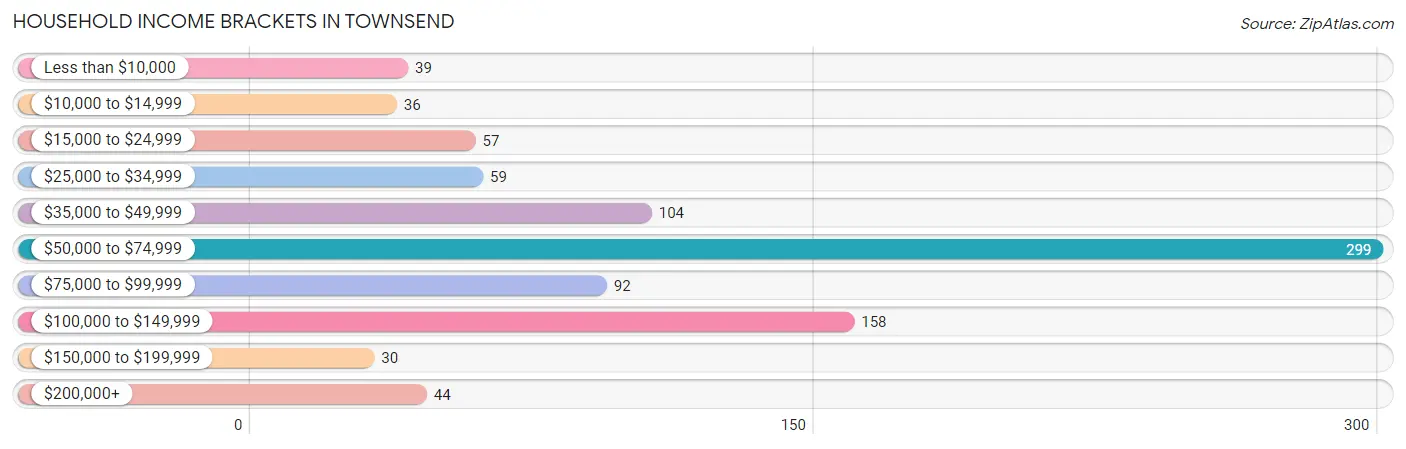
| Income Bracket | # Households | % Households |
| Less than $10,000 | 39 | 4.2% |
| $10,000 to $14,999 | 36 | 3.9% |
| $15,000 to $24,999 | 57 | 6.2% |
| $25,000 to $34,999 | 59 | 6.4% |
| $35,000 to $49,999 | 104 | 11.3% |
| $50,000 to $74,999 | 299 | 32.6% |
| $75,000 to $99,999 | 92 | 10.0% |
| $100,000 to $149,999 | 158 | 17.2% |
| $150,000 to $199,999 | 30 | 3.3% |
| $200,000+ | 44 | 4.8% |
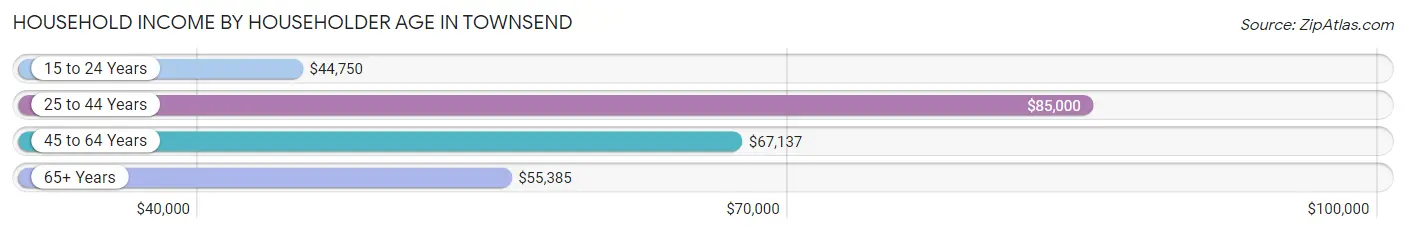
Household Income by Householder Age in Townsend
The median household income in Townsend is $65,522, with the highest median household income of $85,000 found in the 25 to 44 years age bracket for the primary householder. A total of 196 households (21.3%) fall into this category. Meanwhile, the 15 to 24 years age bracket for the primary householder has the lowest median household income of $44,750, with 23 households (2.5%) in this group.
| Income Bracket | # Households | Median Income |
| 15 to 24 Years | 23 (2.5%) | $44,750 |
| 25 to 44 Years | 196 (21.3%) | $85,000 |
| 45 to 64 Years | 415 (45.2%) | $67,137 |
| 65+ Years | 284 (30.9%) | $55,385 |
| Total | 918 (100.0%) | $65,522 |
Poverty in Townsend
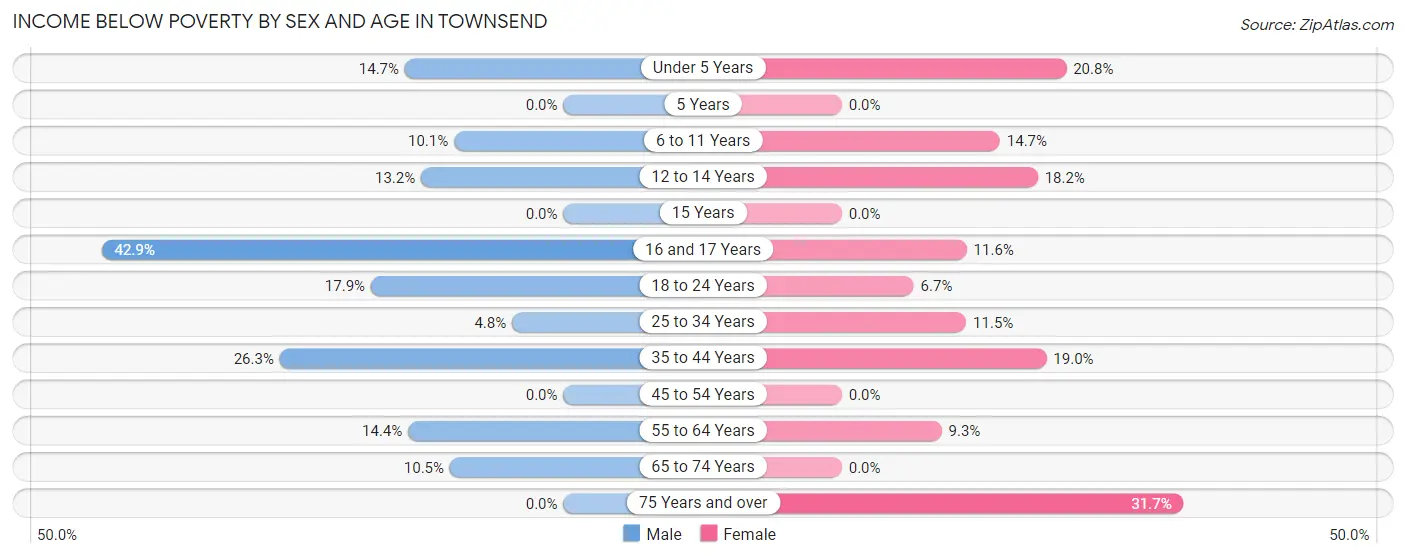
Income Below Poverty by Sex and Age in Townsend
With 10.0% poverty level for males and 10.0% for females among the residents of Townsend, 16 and 17 year old males and 75 year old and over females are the most vulnerable to poverty, with 6 males (42.9%) and 26 females (31.7%) in their respective age groups living below the poverty level.
| Age Bracket | Male | Female |
| Under 5 Years | 5 (14.7%) | 5 (20.8%) |
| 5 Years | 0 (0.0%) | 0 (0.0%) |
| 6 to 11 Years | 7 (10.1%) | 11 (14.7%) |
| 12 to 14 Years | 7 (13.2%) | 4 (18.2%) |
| 15 Years | 0 (0.0%) | 0 (0.0%) |
| 16 and 17 Years | 6 (42.9%) | 8 (11.6%) |
| 18 to 24 Years | 10 (17.9%) | 7 (6.7%) |
| 25 to 34 Years | 6 (4.8%) | 6 (11.5%) |
| 35 to 44 Years | 20 (26.3%) | 15 (19.0%) |
| 45 to 54 Years | 0 (0.0%) | 0 (0.0%) |
| 55 to 64 Years | 33 (14.4%) | 20 (9.3%) |
| 65 to 74 Years | 16 (10.5%) | 0 (0.0%) |
| 75 Years and over | 0 (0.0%) | 26 (31.7%) |
| Total | 110 (10.0%) | 102 (10.0%) |
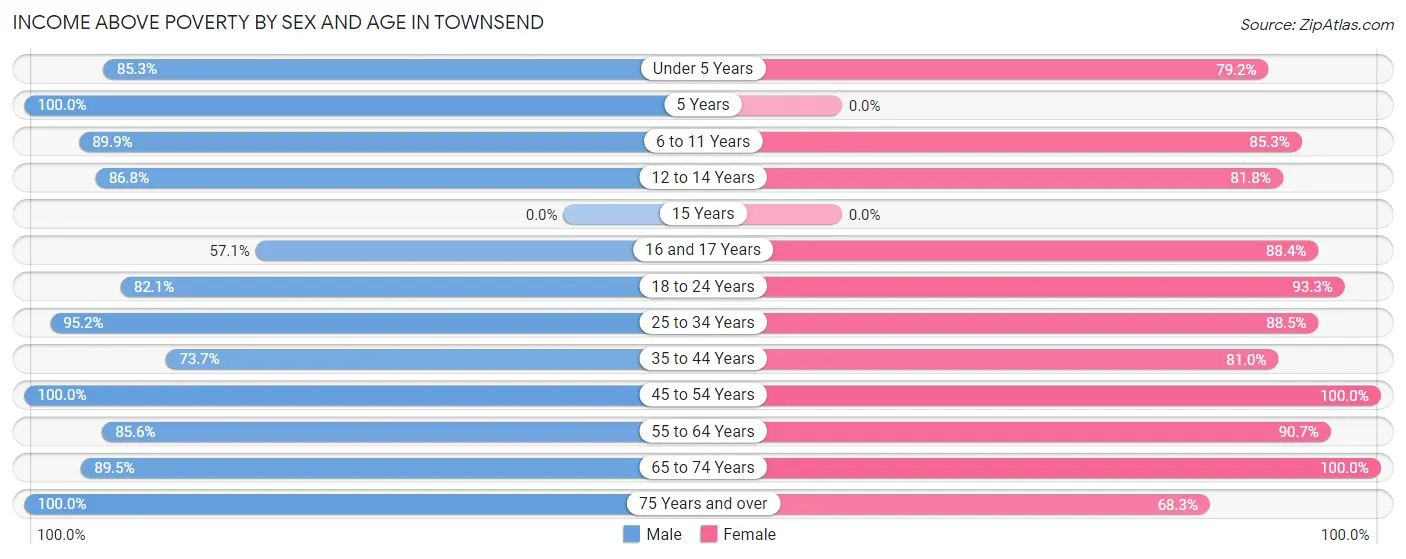
Income Above Poverty by Sex and Age in Townsend
According to the poverty statistics in Townsend, males aged 5 years and females aged 45 to 54 years are the age groups that are most secure financially, with 100.0% of males and 100.0% of females in these age groups living above the poverty line.
| Age Bracket | Male | Female |
| Under 5 Years | 29 (85.3%) | 19 (79.2%) |
| 5 Years | 29 (100.0%) | 0 (0.0%) |
| 6 to 11 Years | 62 (89.9%) | 64 (85.3%) |
| 12 to 14 Years | 46 (86.8%) | 18 (81.8%) |
| 15 Years | 0 (0.0%) | 0 (0.0%) |
| 16 and 17 Years | 8 (57.1%) | 61 (88.4%) |
| 18 to 24 Years | 46 (82.1%) | 98 (93.3%) |
| 25 to 34 Years | 120 (95.2%) | 46 (88.5%) |
| 35 to 44 Years | 56 (73.7%) | 64 (81.0%) |
| 45 to 54 Years | 184 (100.0%) | 172 (100.0%) |
| 55 to 64 Years | 196 (85.6%) | 196 (90.7%) |
| 65 to 74 Years | 136 (89.5%) | 122 (100.0%) |
| 75 Years and over | 82 (100.0%) | 56 (68.3%) |
| Total | 994 (90.0%) | 916 (90.0%) |
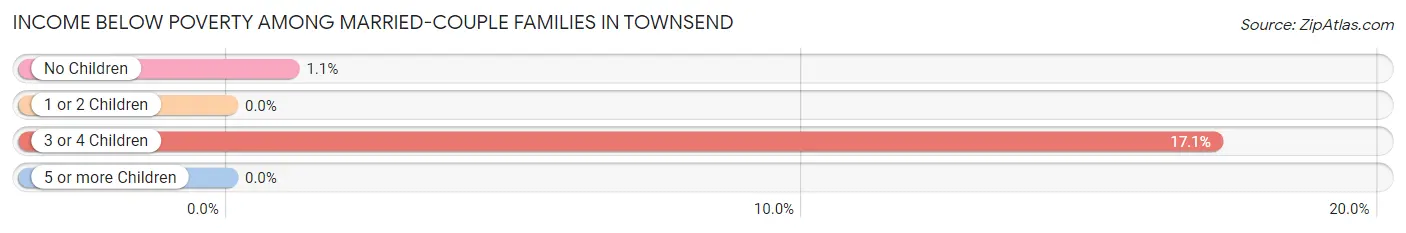
Income Below Poverty Among Married-Couple Families in Townsend
The poverty statistics for married-couple families in Townsend show that 3.7% or 15 of the total 408 families live below the poverty line. Families with 3 or 4 children have the highest poverty rate of 17.1%, comprising of 12 families. On the other hand, families with 1 or 2 children have the lowest poverty rate of 0.0%, which includes 0 families.
| Children | Above Poverty | Below Poverty |
| No Children | 277 (98.9%) | 3 (1.1%) |
| 1 or 2 Children | 58 (100.0%) | 0 (0.0%) |
| 3 or 4 Children | 58 (82.9%) | 12 (17.1%) |
| 5 or more Children | 0 (0.0%) | 0 (0.0%) |
| Total | 393 (96.3%) | 15 (3.7%) |
Income Below Poverty Among Single-Parent Households in Townsend
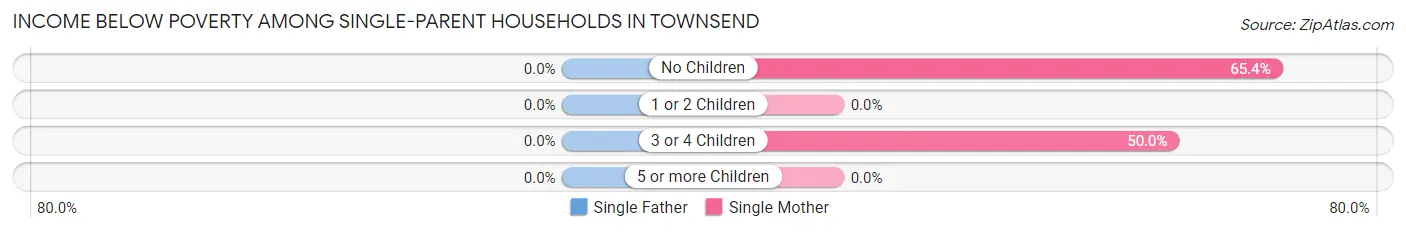
| Children | Single Father | Single Mother |
| No Children | 0 (0.0%) | 17 (65.4%) |
| 1 or 2 Children | 0 (0.0%) | 0 (0.0%) |
| 3 or 4 Children | 0 (0.0%) | 9 (50.0%) |
| 5 or more Children | 0 (0.0%) | 0 (0.0%) |
| Total | 0 (0.0%) | 26 (48.1%) |
Income Below Poverty Among Married-Couple vs Single-Parent Households in Townsend
The poverty data for Townsend shows that 15 of the married-couple family households (3.7%) and 26 of the single-parent households (27.1%) are living below the poverty level. Within the married-couple family households, those with 3 or 4 children have the highest poverty rate, with 12 households (17.1%) falling below the poverty line. Among the single-parent households, those with 3 or 4 children have the highest poverty rate, with 9 household (50.0%) living below poverty.
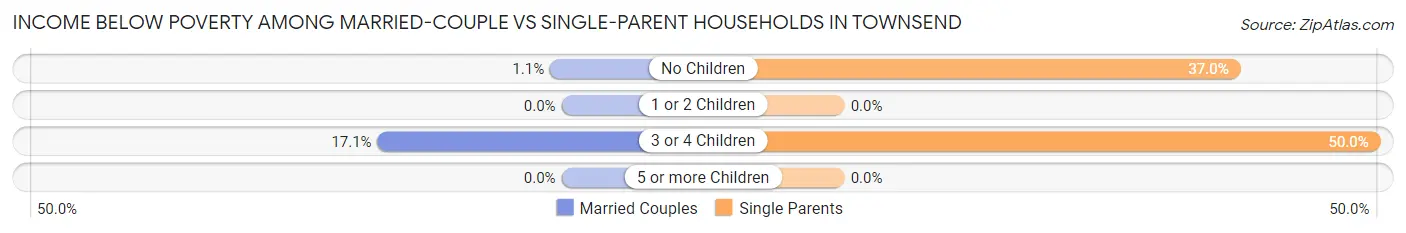
| Children | Married-Couple Families | Single-Parent Households |
| No Children | 3 (1.1%) | 17 (37.0%) |
| 1 or 2 Children | 0 (0.0%) | 0 (0.0%) |
| 3 or 4 Children | 12 (17.1%) | 9 (50.0%) |
| 5 or more Children | 0 (0.0%) | 0 (0.0%) |
| Total | 15 (3.7%) | 26 (27.1%) |
Race in Townsend
The most populous races in Townsend are White / Caucasian (1,961 | 90.1%), Two or more Races (119 | 5.5%), and Hispanic or Latino (64 | 2.9%).
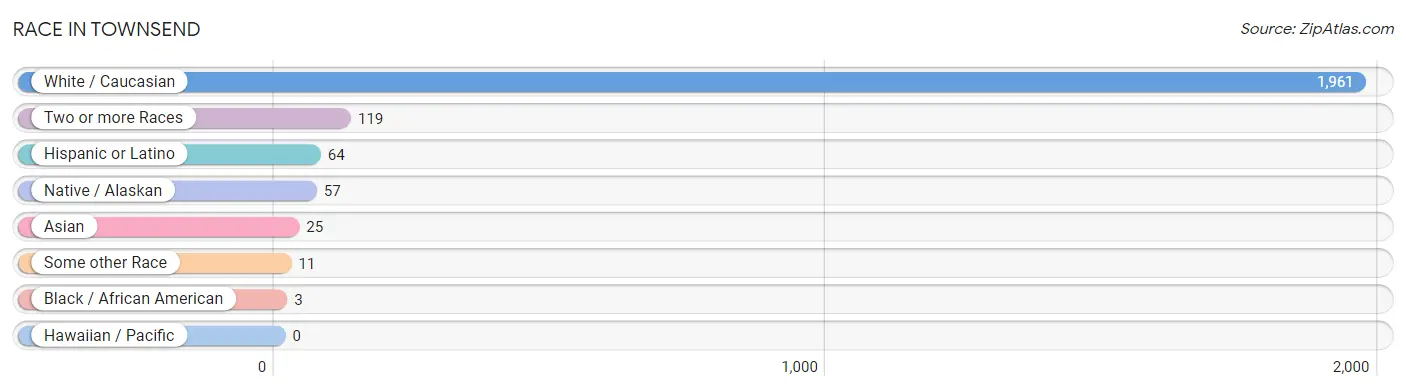
| Race | # Population | % Population |
| Asian | 25 | 1.1% |
| Black / African American | 3 | 0.1% |
| Hawaiian / Pacific | 0 | 0.0% |
| Hispanic or Latino | 64 | 2.9% |
| Native / Alaskan | 57 | 2.6% |
| White / Caucasian | 1,961 | 90.1% |
| Two or more Races | 119 | 5.5% |
| Some other Race | 11 | 0.5% |
| Total | 2,176 | 100.0% |
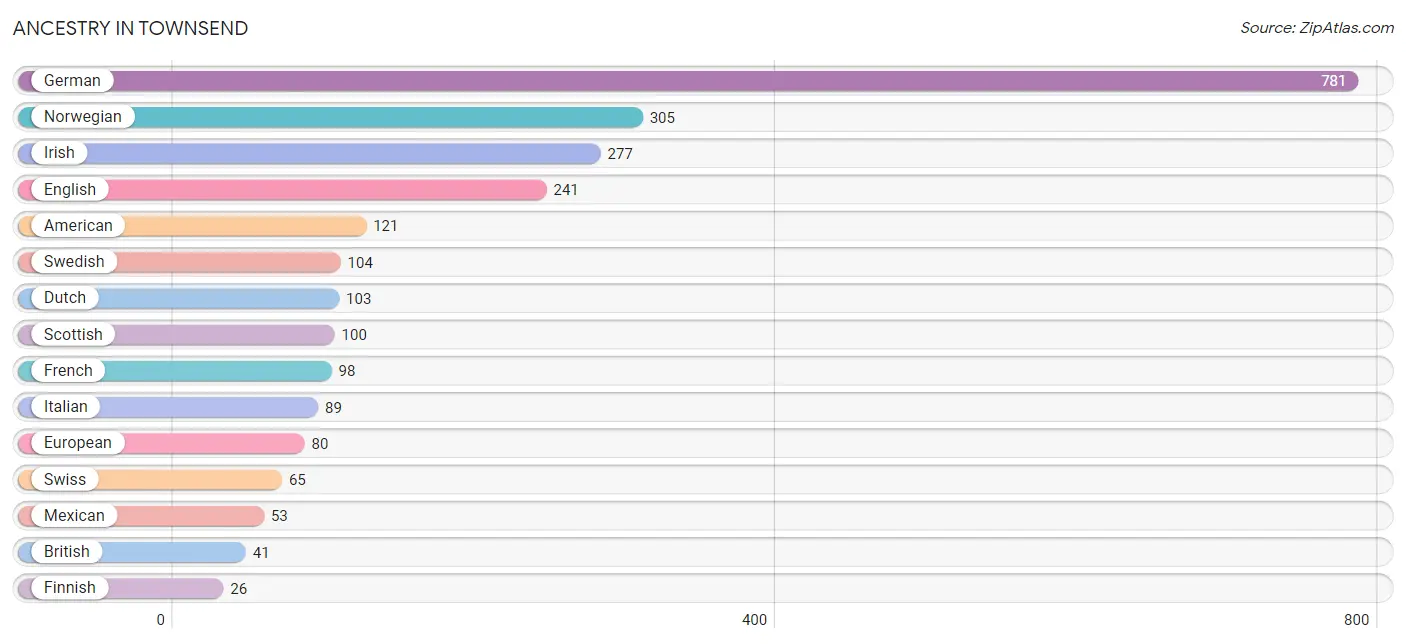
Ancestry in Townsend
The most populous ancestries reported in Townsend are German (781 | 35.9%), Norwegian (305 | 14.0%), Irish (277 | 12.7%), English (241 | 11.1%), and American (121 | 5.6%), together accounting for 79.3% of all Townsend residents.
| Ancestry | # Population | % Population |
| American | 121 | 5.6% |
| British | 41 | 1.9% |
| Central American | 11 | 0.5% |
| Chippewa | 9 | 0.4% |
| Czechoslovakian | 3 | 0.1% |
| Danish | 22 | 1.0% |
| Dutch | 103 | 4.7% |
| English | 241 | 11.1% |
| European | 80 | 3.7% |
| Finnish | 26 | 1.2% |
| French | 98 | 4.5% |
| French Canadian | 8 | 0.4% |
| German | 781 | 35.9% |
| Guatemalan | 11 | 0.5% |
| Hungarian | 13 | 0.6% |
| Indian (Asian) | 25 | 1.1% |
| Irish | 277 | 12.7% |
| Italian | 89 | 4.1% |
| Korean | 20 | 0.9% |
| Mexican | 53 | 2.4% |
| Norwegian | 305 | 14.0% |
| Polish | 6 | 0.3% |
| Russian | 16 | 0.7% |
| Scandinavian | 7 | 0.3% |
| Scotch-Irish | 1 | 0.1% |
| Scottish | 100 | 4.6% |
| Sioux | 11 | 0.5% |
| Slavic | 4 | 0.2% |
| Swedish | 104 | 4.8% |
| Swiss | 65 | 3.0% |
| Welsh | 12 | 0.5% | View All 31 Rows |
Immigrants in Townsend
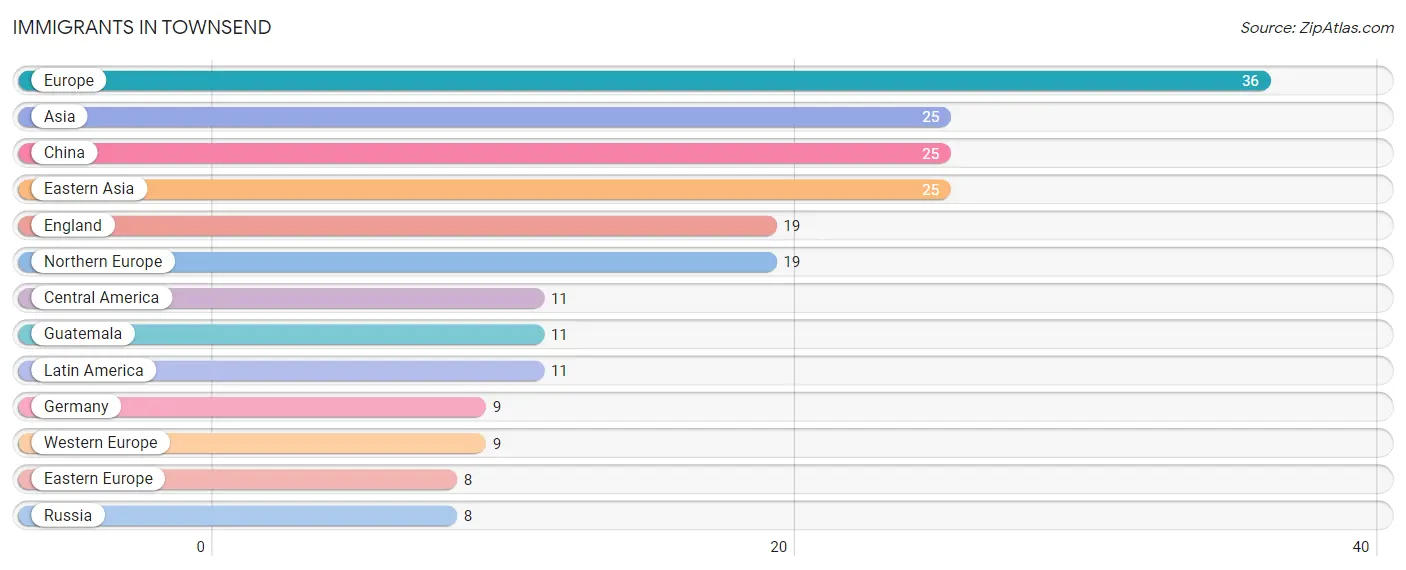
The most numerous immigrant groups reported in Townsend came from Europe (36 | 1.7%), Asia (25 | 1.1%), China (25 | 1.1%), Eastern Asia (25 | 1.1%), and England (19 | 0.9%), together accounting for 6.0% of all Townsend residents.
| Immigration Origin | # Population | % Population |
| Asia | 25 | 1.1% |
| Central America | 11 | 0.5% |
| China | 25 | 1.1% |
| Eastern Asia | 25 | 1.1% |
| Eastern Europe | 8 | 0.4% |
| England | 19 | 0.9% |
| Europe | 36 | 1.7% |
| Germany | 9 | 0.4% |
| Guatemala | 11 | 0.5% |
| Latin America | 11 | 0.5% |
| Northern Europe | 19 | 0.9% |
| Russia | 8 | 0.4% |
| Western Europe | 9 | 0.4% | View All 13 Rows |
Sex and Age in Townsend
Sex and Age in Townsend
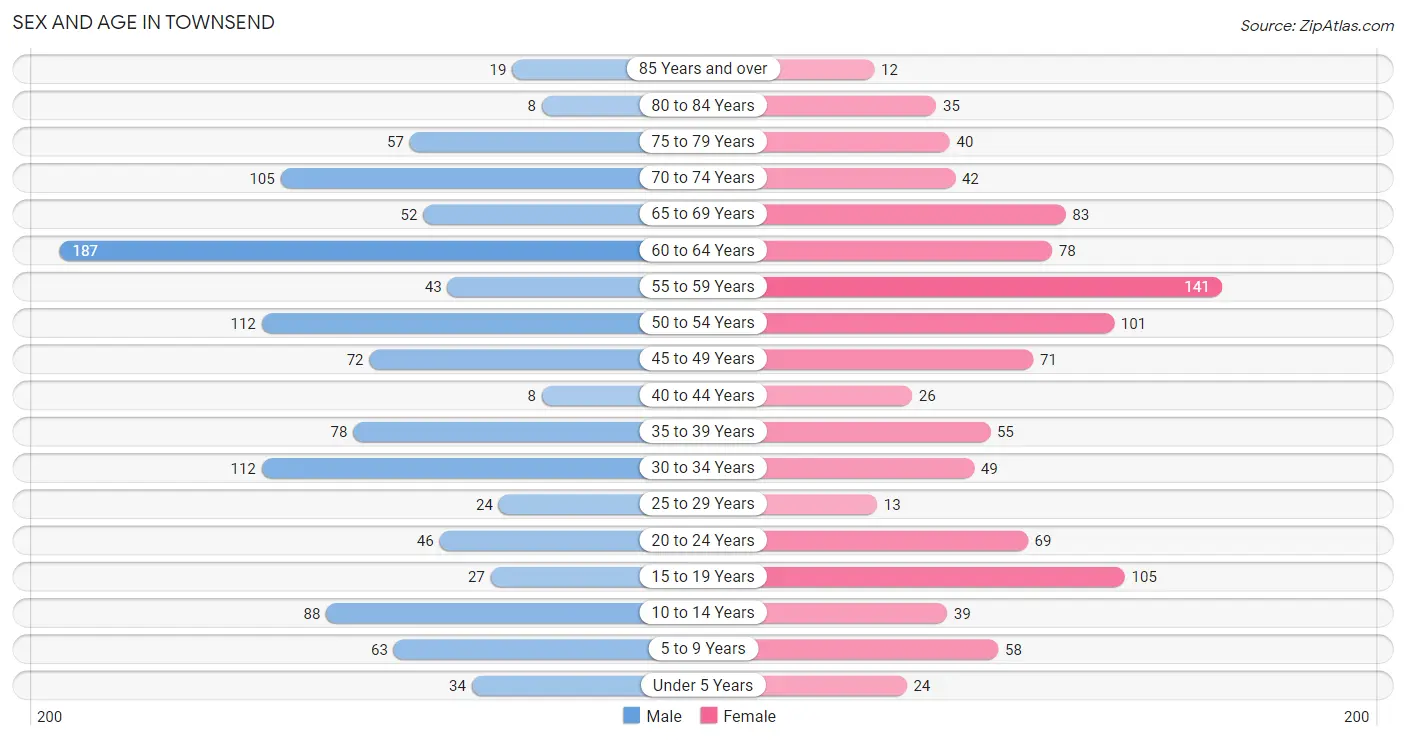
The most populous age groups in Townsend are 60 to 64 Years (187 | 16.5%) for men and 55 to 59 Years (141 | 13.5%) for women.
| Age Bracket | Male | Female |
| Under 5 Years | 34 (3.0%) | 24 (2.3%) |
| 5 to 9 Years | 63 (5.6%) | 58 (5.6%) |
| 10 to 14 Years | 88 (7.7%) | 39 (3.7%) |
| 15 to 19 Years | 27 (2.4%) | 105 (10.1%) |
| 20 to 24 Years | 46 (4.1%) | 69 (6.6%) |
| 25 to 29 Years | 24 (2.1%) | 13 (1.3%) |
| 30 to 34 Years | 112 (9.9%) | 49 (4.7%) |
| 35 to 39 Years | 78 (6.9%) | 55 (5.3%) |
| 40 to 44 Years | 8 (0.7%) | 26 (2.5%) |
| 45 to 49 Years | 72 (6.3%) | 71 (6.8%) |
| 50 to 54 Years | 112 (9.9%) | 101 (9.7%) |
| 55 to 59 Years | 43 (3.8%) | 141 (13.5%) |
| 60 to 64 Years | 187 (16.5%) | 78 (7.5%) |
| 65 to 69 Years | 52 (4.6%) | 83 (8.0%) |
| 70 to 74 Years | 105 (9.2%) | 42 (4.0%) |
| 75 to 79 Years | 57 (5.0%) | 40 (3.8%) |
| 80 to 84 Years | 8 (0.7%) | 35 (3.4%) |
| 85 Years and over | 19 (1.7%) | 12 (1.1%) |
| Total | 1,135 (100.0%) | 1,041 (100.0%) |
Families and Households in Townsend
Median Family Size in Townsend
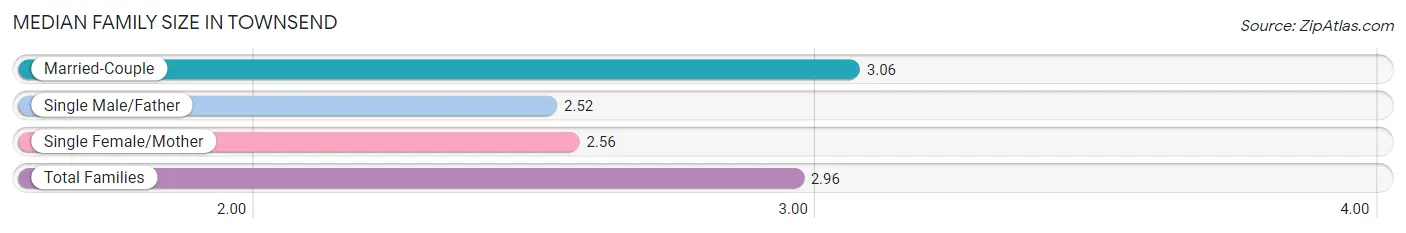
The median family size in Townsend is 2.96 persons per family, with married-couple families (408 | 80.9%) accounting for the largest median family size of 3.06 persons per family. On the other hand, single male/father families (42 | 8.3%) represent the smallest median family size with 2.52 persons per family.
| Family Type | # Families | Family Size |
| Married-Couple | 408 (80.9%) | 3.06 |
| Single Male/Father | 42 (8.3%) | 2.52 |
| Single Female/Mother | 54 (10.7%) | 2.56 |
| Total Families | 504 (100.0%) | 2.96 |
Median Household Size in Townsend
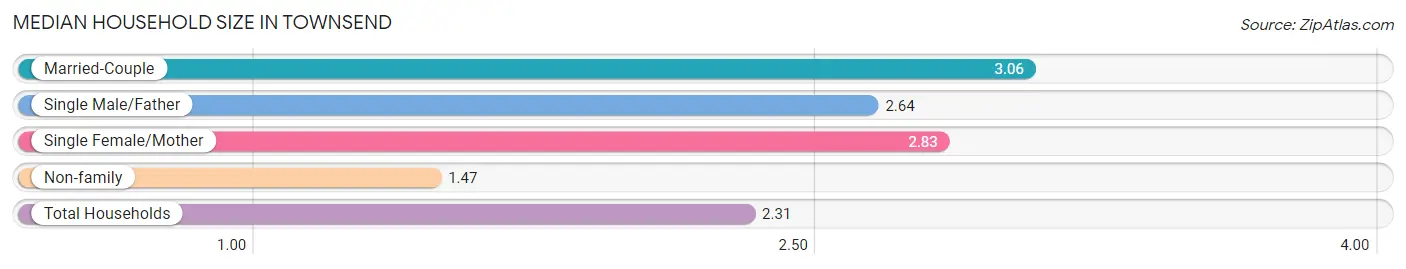
The median household size in Townsend is 2.31 persons per household, with married-couple households (408 | 44.4%) accounting for the largest median household size of 3.06 persons per household. non-family households (414 | 45.1%) represent the smallest median household size with 1.47 persons per household.
| Household Type | # Households | Household Size |
| Married-Couple | 408 (44.4%) | 3.06 |
| Single Male/Father | 42 (4.6%) | 2.64 |
| Single Female/Mother | 54 (5.9%) | 2.83 |
| Non-family | 414 (45.1%) | 1.47 |
| Total Households | 918 (100.0%) | 2.31 |
Household Size by Marriage Status in Townsend
Out of a total of 918 households in Townsend, 504 (54.9%) are family households, while 414 (45.1%) are nonfamily households. The most numerous type of family households are 2-person households, comprising 297, and the most common type of nonfamily households are 1-person households, comprising 243.
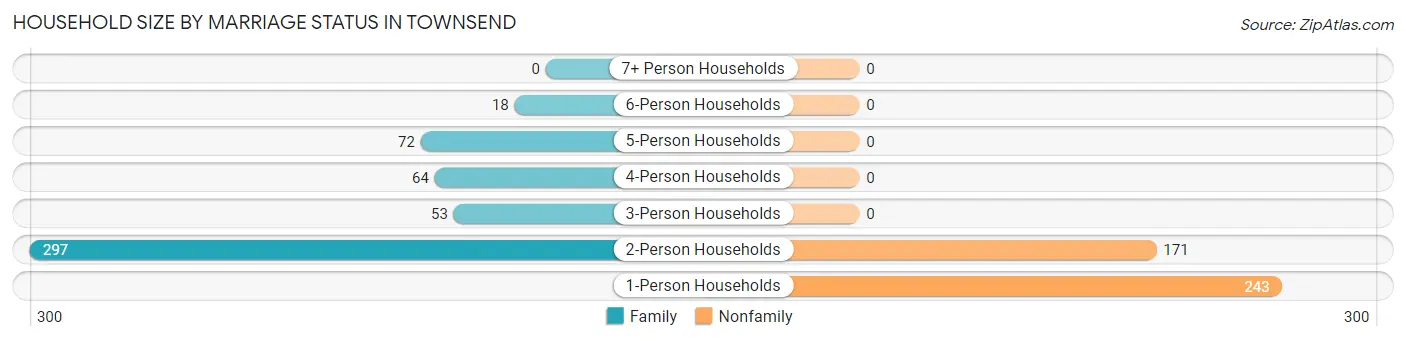
| Household Size | Family Households | Nonfamily Households |
| 1-Person Households | - | 243 (26.5%) |
| 2-Person Households | 297 (32.4%) | 171 (18.6%) |
| 3-Person Households | 53 (5.8%) | 0 (0.0%) |
| 4-Person Households | 64 (7.0%) | 0 (0.0%) |
| 5-Person Households | 72 (7.8%) | 0 (0.0%) |
| 6-Person Households | 18 (2.0%) | 0 (0.0%) |
| 7+ Person Households | 0 (0.0%) | 0 (0.0%) |
| Total | 504 (54.9%) | 414 (45.1%) |
Female Fertility in Townsend
Fertility by Age in Townsend
Average fertility rate in Townsend is 41.0 births per 1,000 women. Women in the age bracket of 20 to 34 years have the highest fertility rate with 61.0 births per 1,000 women. Women in the age bracket of 35 to 50 years acount for 52.9% of all women with births.
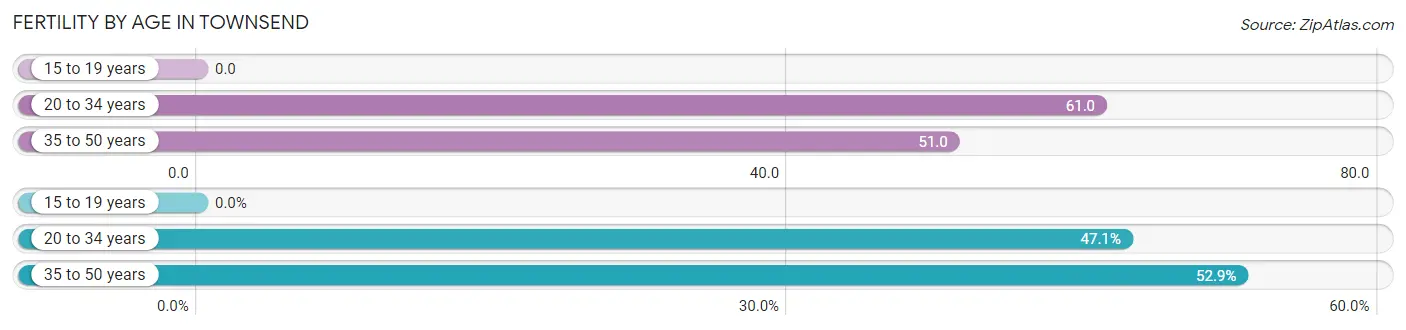
| Age Bracket | Women with Births | Births / 1,000 Women |
| 15 to 19 years | 0 (0.0%) | 0.0 |
| 20 to 34 years | 8 (47.1%) | 61.0 |
| 35 to 50 years | 9 (52.9%) | 51.0 |
| Total | 17 (100.0%) | 41.0 |
Fertility by Age by Marriage Status in Townsend
35.3% of women with births (17) in Townsend are married. The highest percentage of unmarried women with births falls into 35 to 50 years age bracket with 100.0% of them unmarried at the time of birth, while the lowest percentage of unmarried women with births belong to 20 to 34 years age bracket with 25.0% of them unmarried.
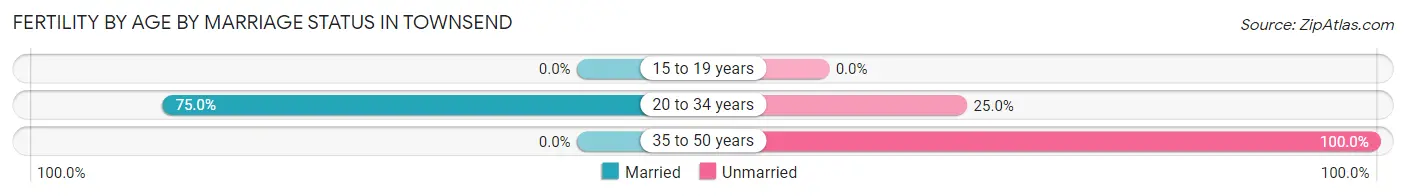
| Age Bracket | Married | Unmarried |
| 15 to 19 years | 0 (0.0%) | 0 (0.0%) |
| 20 to 34 years | 6 (75.0%) | 2 (25.0%) |
| 35 to 50 years | 0 (0.0%) | 9 (100.0%) |
| Total | 6 (35.3%) | 11 (64.7%) |
Fertility by Education in Townsend
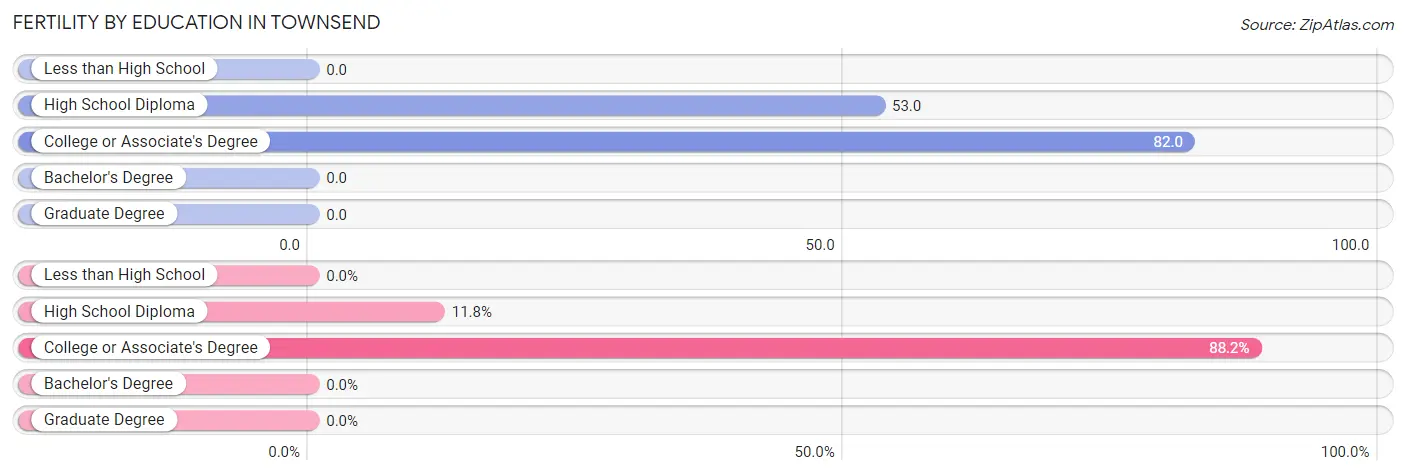
| Educational Attainment | Women with Births | Births / 1,000 Women |
| Less than High School | 0 (0.0%) | 0.0 |
| High School Diploma | 2 (11.8%) | 53.0 |
| College or Associate's Degree | 15 (88.2%) | 82.0 |
| Bachelor's Degree | 0 (0.0%) | 0.0 |
| Graduate Degree | 0 (0.0%) | 0.0 |
| Total | 17 (100.0%) | 41.0 |
Fertility by Education by Marriage Status in Townsend
64.7% of women with births in Townsend are unmarried. Women with the educational attainment of college or associate's degree are most likely to be married with 40.0% of them married at childbirth, while women with the educational attainment of high school diploma are least likely to be married with 100.0% of them unmarried at childbirth.
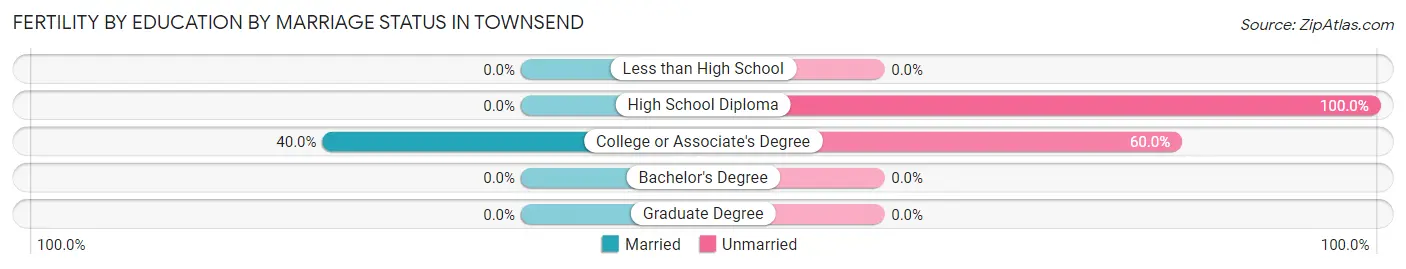
| Educational Attainment | Married | Unmarried |
| Less than High School | 0 (0.0%) | 0 (0.0%) |
| High School Diploma | 0 (0.0%) | 2 (100.0%) |
| College or Associate's Degree | 6 (40.0%) | 9 (60.0%) |
| Bachelor's Degree | 0 (0.0%) | 0 (0.0%) |
| Graduate Degree | 0 (0.0%) | 0 (0.0%) |
| Total | 6 (35.3%) | 11 (64.7%) |
Employment Characteristics in Townsend
Employment by Class of Employer in Townsend
Among the 966 employed individuals in Townsend, private company employees (629 | 65.1%), local government employees (89 | 9.2%), and state government employees (68 | 7.0%) make up the most common classes of employment.
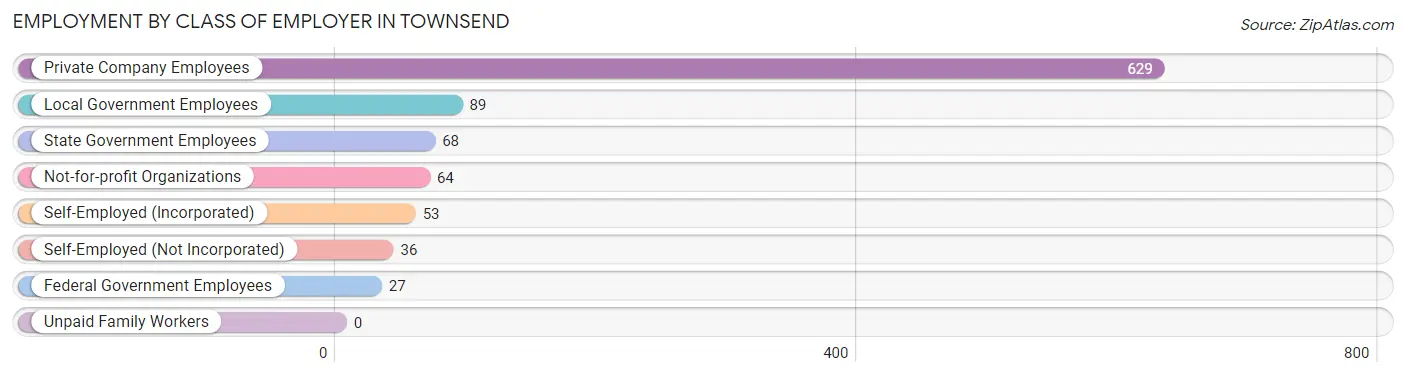
| Employer Class | # Employees | % Employees |
| Private Company Employees | 629 | 65.1% |
| Self-Employed (Incorporated) | 53 | 5.5% |
| Self-Employed (Not Incorporated) | 36 | 3.7% |
| Not-for-profit Organizations | 64 | 6.6% |
| Local Government Employees | 89 | 9.2% |
| State Government Employees | 68 | 7.0% |
| Federal Government Employees | 27 | 2.8% |
| Unpaid Family Workers | 0 | 0.0% |
| Total | 966 | 100.0% |
Employment Status by Age in Townsend
According to the labor force statistics for Townsend, out of the total population over 16 years of age (1,870), 59.5% or 1,113 individuals are in the labor force, with 12.8% or 142 of them unemployed. The age group with the highest labor force participation rate is 20 to 24 years, with 95.7% or 110 individuals in the labor force. Within the labor force, the 16 to 19 years age range has the highest percentage of unemployed individuals, with 89.2% or 33 of them being unemployed.
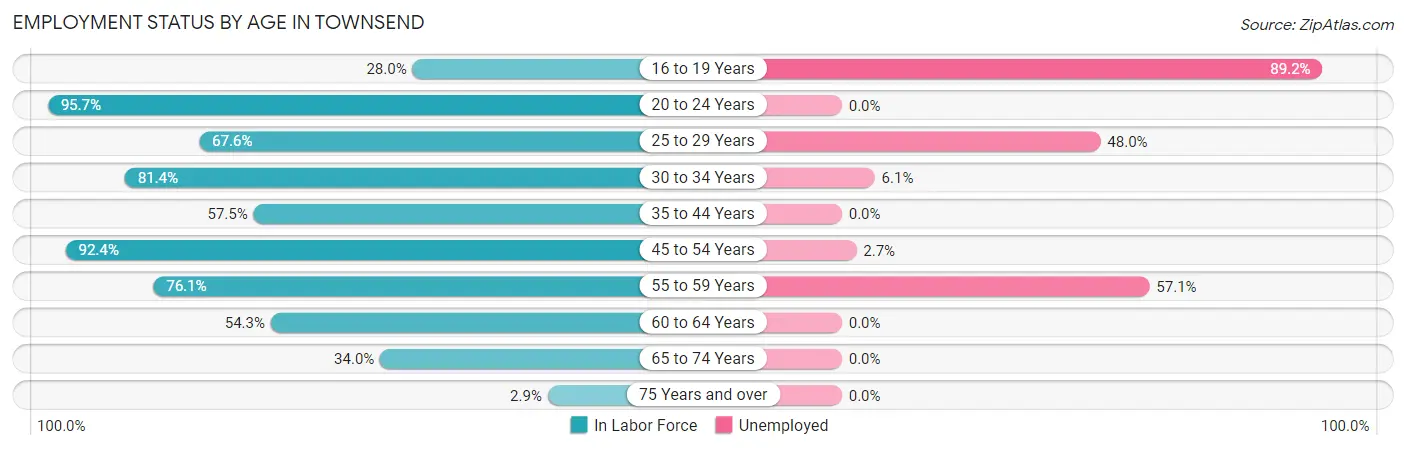
| Age Bracket | In Labor Force | Unemployed |
| 16 to 19 Years | 37 (28.0%) | 33 (89.2%) |
| 20 to 24 Years | 110 (95.7%) | 0 (0.0%) |
| 25 to 29 Years | 25 (67.6%) | 12 (48.0%) |
| 30 to 34 Years | 131 (81.4%) | 8 (6.1%) |
| 35 to 44 Years | 96 (57.5%) | 0 (0.0%) |
| 45 to 54 Years | 329 (92.4%) | 9 (2.7%) |
| 55 to 59 Years | 140 (76.1%) | 80 (57.1%) |
| 60 to 64 Years | 144 (54.3%) | 0 (0.0%) |
| 65 to 74 Years | 96 (34.0%) | 0 (0.0%) |
| 75 Years and over | 5 (2.9%) | 0 (0.0%) |
| Total | 1,113 (59.5%) | 142 (12.8%) |
Employment Status by Educational Attainment in Townsend
According to labor force statistics for Townsend, 73.9% of individuals (865) out of the total population between 25 and 64 years of age (1,170) are in the labor force, with 12.6% or 109 of them being unemployed. The group with the highest labor force participation rate are those with the educational attainment of college / associate degree, with 83.9% or 479 individuals in the labor force. Within the labor force, individuals with less than high school education have the highest percentage of unemployment, with 19.4% or 7 of them being unemployed.
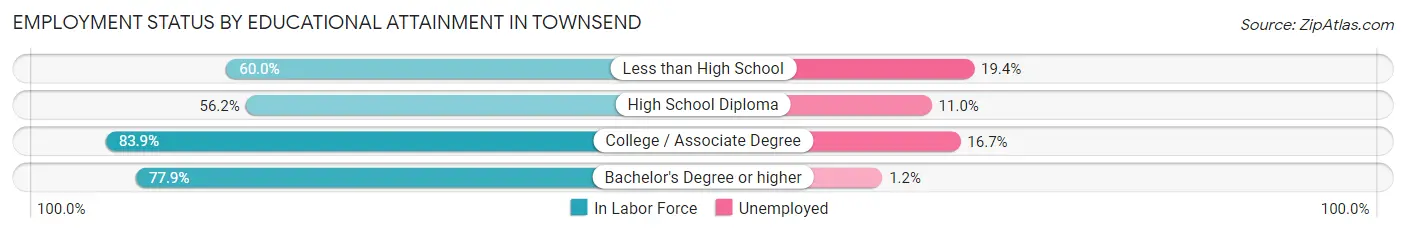
| Educational Attainment | In Labor Force | Unemployed |
| Less than High School | 36 (60.0%) | 12 (19.4%) |
| High School Diploma | 181 (56.2%) | 35 (11.0%) |
| College / Associate Degree | 479 (83.9%) | 95 (16.7%) |
| Bachelor's Degree or higher | 169 (77.9%) | 3 (1.2%) |
| Total | 865 (73.9%) | 147 (12.6%) |
Employment Occupations by Sex in Townsend
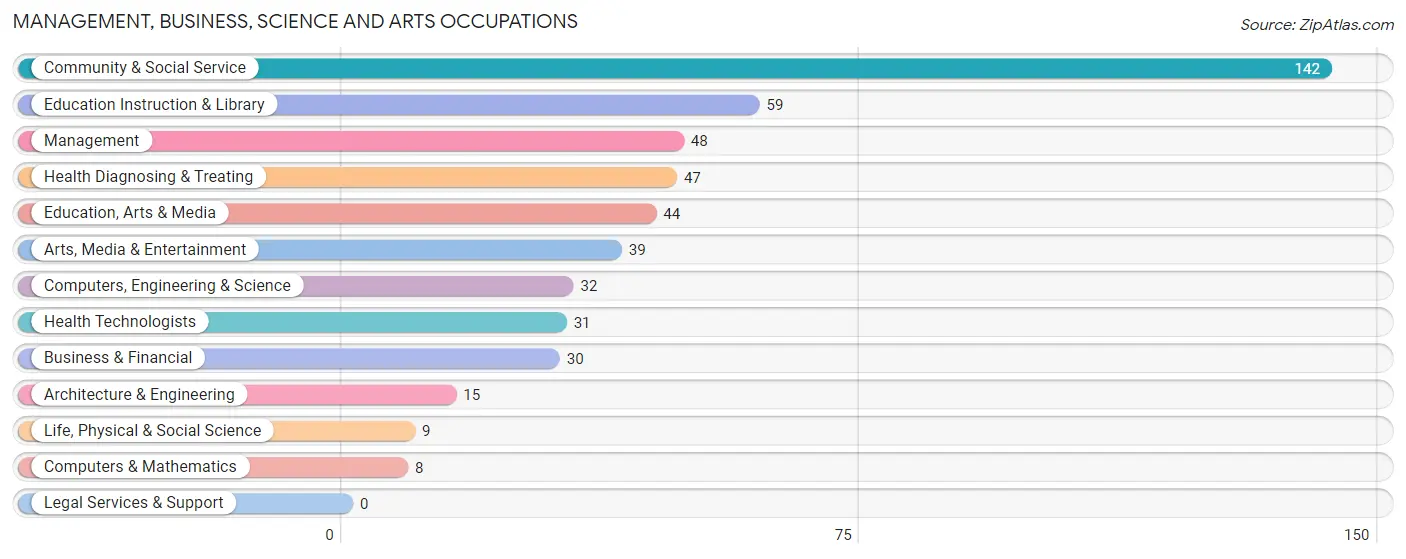
Management, Business, Science and Arts Occupations
The most common Management, Business, Science and Arts occupations in Townsend are Community & Social Service (142 | 14.6%), Education Instruction & Library (59 | 6.1%), Management (48 | 4.9%), Health Diagnosing & Treating (47 | 4.8%), and Education, Arts & Media (44 | 4.5%).
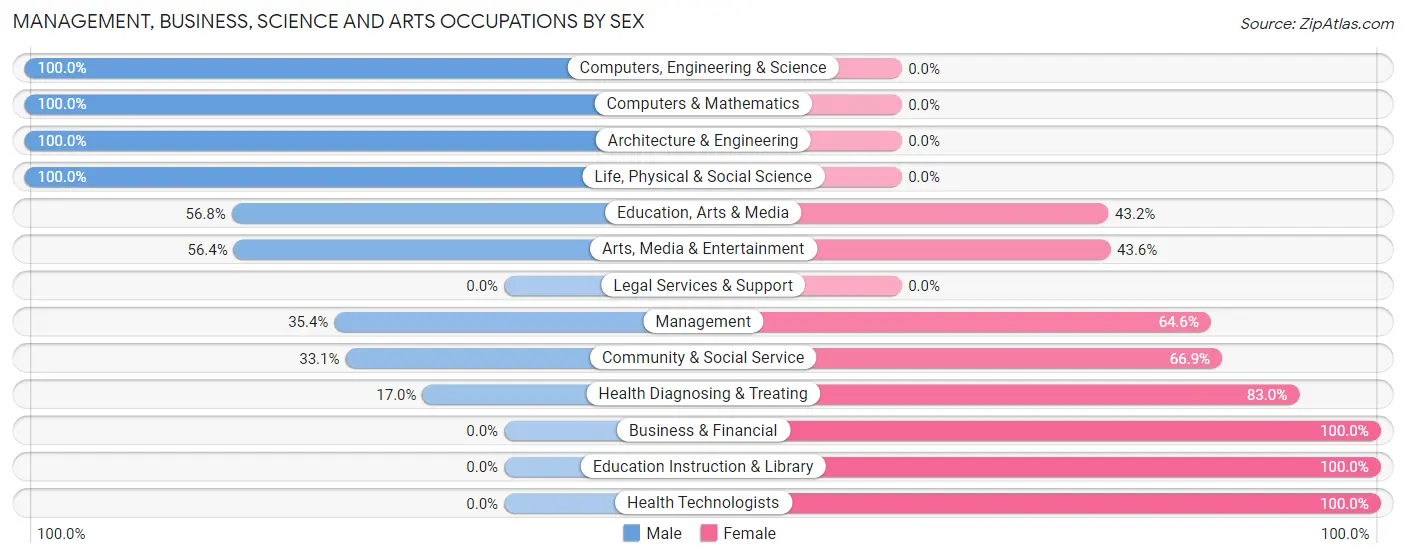
Management, Business, Science and Arts Occupations by Sex
Within the Management, Business, Science and Arts occupations in Townsend, the most male-oriented occupations are Computers, Engineering & Science (100.0%), Computers & Mathematics (100.0%), and Architecture & Engineering (100.0%), while the most female-oriented occupations are Business & Financial (100.0%), Education Instruction & Library (100.0%), and Health Technologists (100.0%).
| Occupation | Male | Female |
| Management | 17 (35.4%) | 31 (64.6%) |
| Business & Financial | 0 (0.0%) | 30 (100.0%) |
| Computers, Engineering & Science | 32 (100.0%) | 0 (0.0%) |
| Computers & Mathematics | 8 (100.0%) | 0 (0.0%) |
| Architecture & Engineering | 15 (100.0%) | 0 (0.0%) |
| Life, Physical & Social Science | 9 (100.0%) | 0 (0.0%) |
| Community & Social Service | 47 (33.1%) | 95 (66.9%) |
| Education, Arts & Media | 25 (56.8%) | 19 (43.2%) |
| Legal Services & Support | 0 (0.0%) | 0 (0.0%) |
| Education Instruction & Library | 0 (0.0%) | 59 (100.0%) |
| Arts, Media & Entertainment | 22 (56.4%) | 17 (43.6%) |
| Health Diagnosing & Treating | 8 (17.0%) | 39 (83.0%) |
| Health Technologists | 0 (0.0%) | 31 (100.0%) |
| Total (Category) | 104 (34.8%) | 195 (65.2%) |
| Total (Overall) | 589 (60.7%) | 382 (39.3%) |
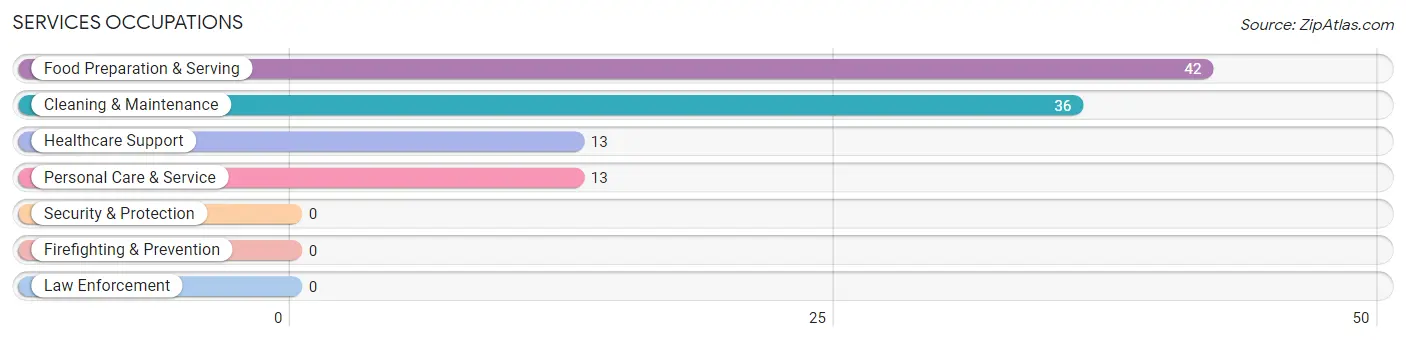
Services Occupations
The most common Services occupations in Townsend are Food Preparation & Serving (42 | 4.3%), Cleaning & Maintenance (36 | 3.7%), Healthcare Support (13 | 1.3%), and Personal Care & Service (13 | 1.3%).
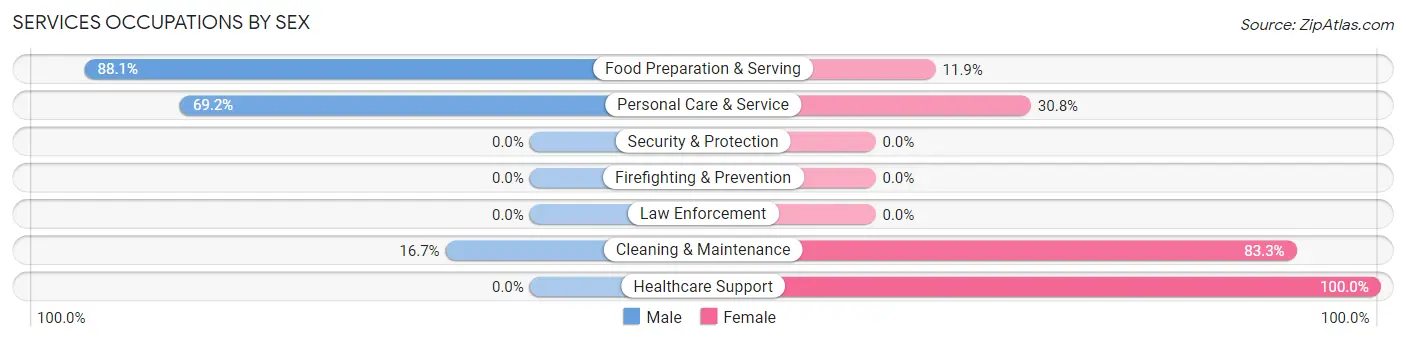
Services Occupations by Sex
Within the Services occupations in Townsend, the most male-oriented occupations are Food Preparation & Serving (88.1%), Personal Care & Service (69.2%), and Cleaning & Maintenance (16.7%), while the most female-oriented occupations are Healthcare Support (100.0%), Cleaning & Maintenance (83.3%), and Personal Care & Service (30.8%).
| Occupation | Male | Female |
| Healthcare Support | 0 (0.0%) | 13 (100.0%) |
| Security & Protection | 0 (0.0%) | 0 (0.0%) |
| Firefighting & Prevention | 0 (0.0%) | 0 (0.0%) |
| Law Enforcement | 0 (0.0%) | 0 (0.0%) |
| Food Preparation & Serving | 37 (88.1%) | 5 (11.9%) |
| Cleaning & Maintenance | 6 (16.7%) | 30 (83.3%) |
| Personal Care & Service | 9 (69.2%) | 4 (30.8%) |
| Total (Category) | 52 (50.0%) | 52 (50.0%) |
| Total (Overall) | 589 (60.7%) | 382 (39.3%) |
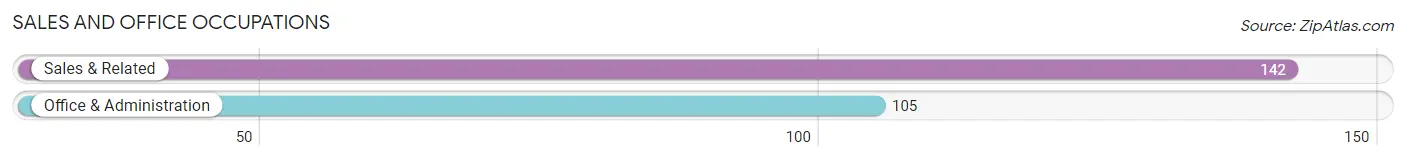
Sales and Office Occupations
The most common Sales and Office occupations in Townsend are Sales & Related (142 | 14.6%), and Office & Administration (105 | 10.8%).
Sales and Office Occupations by Sex
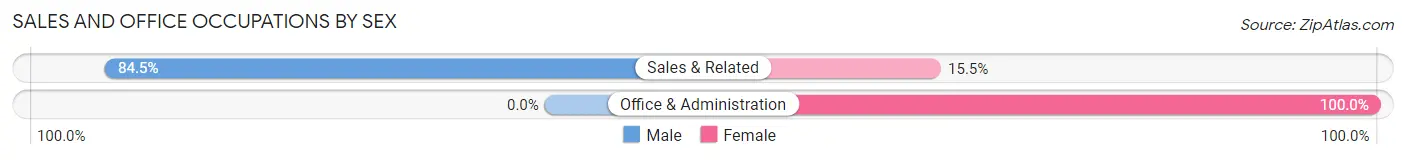
| Occupation | Male | Female |
| Sales & Related | 120 (84.5%) | 22 (15.5%) |
| Office & Administration | 0 (0.0%) | 105 (100.0%) |
| Total (Category) | 120 (48.6%) | 127 (51.4%) |
| Total (Overall) | 589 (60.7%) | 382 (39.3%) |
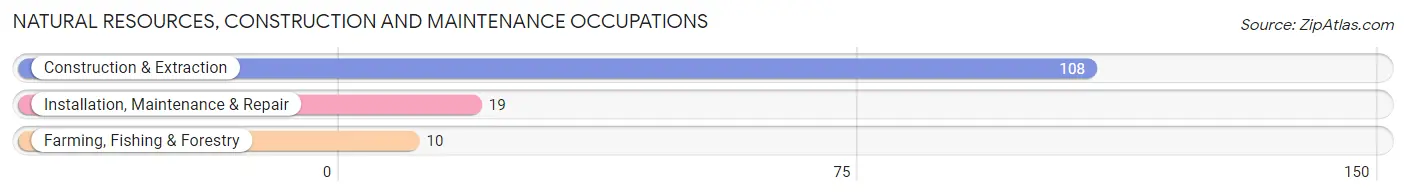
Natural Resources, Construction and Maintenance Occupations
The most common Natural Resources, Construction and Maintenance occupations in Townsend are Construction & Extraction (108 | 11.1%), Installation, Maintenance & Repair (19 | 2.0%), and Farming, Fishing & Forestry (10 | 1.0%).
Natural Resources, Construction and Maintenance Occupations by Sex
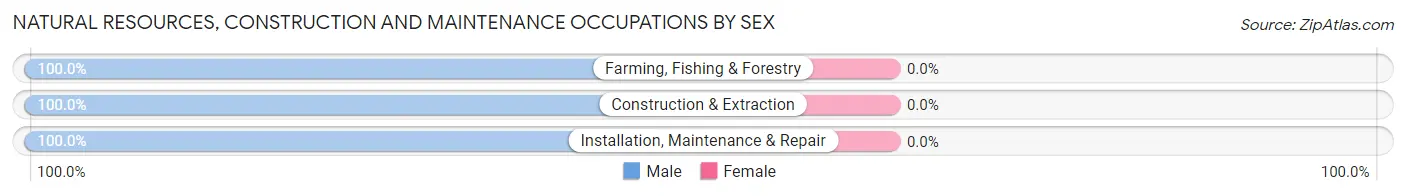
| Occupation | Male | Female |
| Farming, Fishing & Forestry | 10 (100.0%) | 0 (0.0%) |
| Construction & Extraction | 108 (100.0%) | 0 (0.0%) |
| Installation, Maintenance & Repair | 19 (100.0%) | 0 (0.0%) |
| Total (Category) | 137 (100.0%) | 0 (0.0%) |
| Total (Overall) | 589 (60.7%) | 382 (39.3%) |
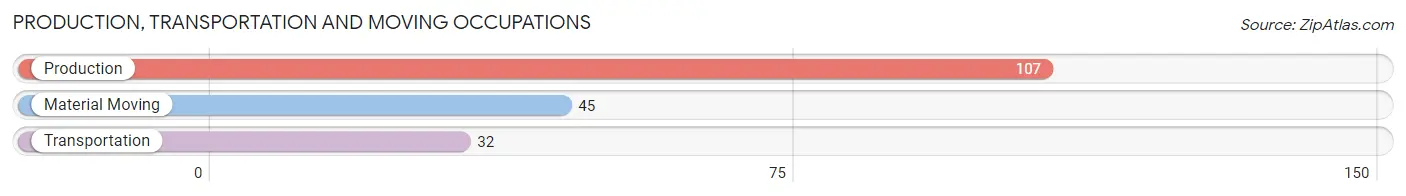
Production, Transportation and Moving Occupations
The most common Production, Transportation and Moving occupations in Townsend are Production (107 | 11.0%), Material Moving (45 | 4.6%), and Transportation (32 | 3.3%).
Production, Transportation and Moving Occupations by Sex
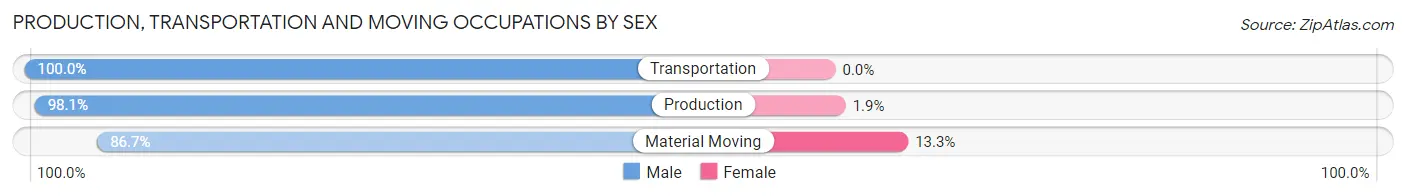
| Occupation | Male | Female |
| Production | 105 (98.1%) | 2 (1.9%) |
| Transportation | 32 (100.0%) | 0 (0.0%) |
| Material Moving | 39 (86.7%) | 6 (13.3%) |
| Total (Category) | 176 (95.7%) | 8 (4.3%) |
| Total (Overall) | 589 (60.7%) | 382 (39.3%) |
Employment Industries by Sex in Townsend
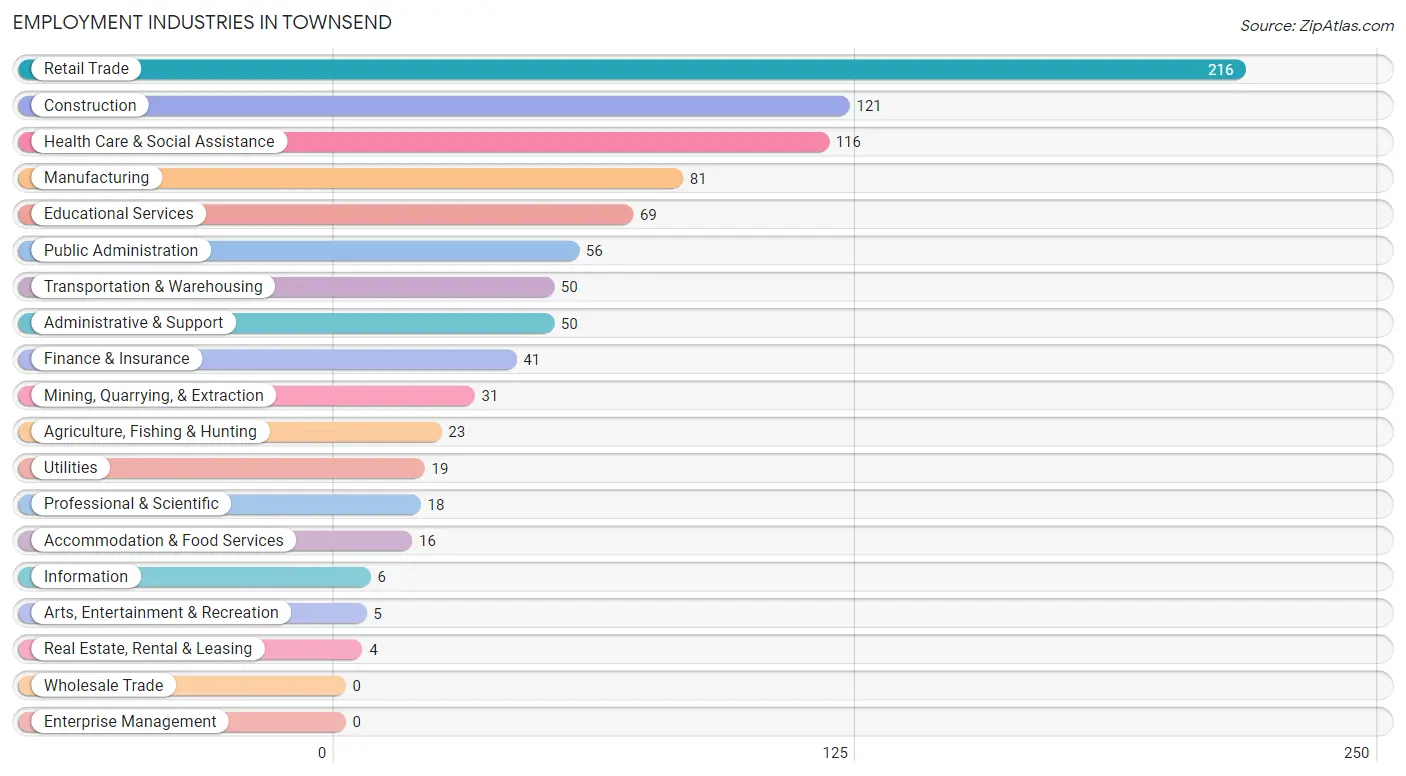
Employment Industries in Townsend
The major employment industries in Townsend include Retail Trade (216 | 22.3%), Construction (121 | 12.5%), Health Care & Social Assistance (116 | 11.9%), Manufacturing (81 | 8.3%), and Educational Services (69 | 7.1%).
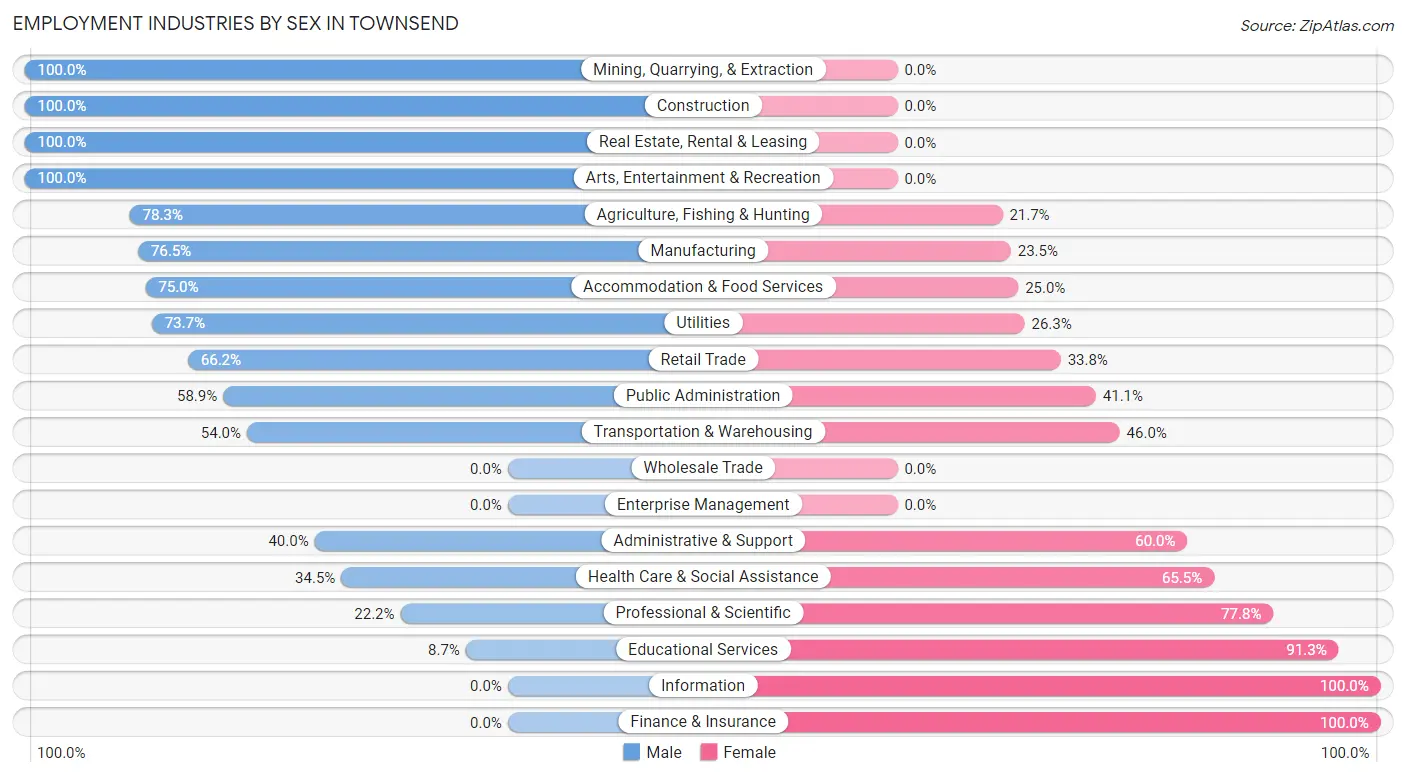
Employment Industries by Sex in Townsend
The Townsend industries that see more men than women are Mining, Quarrying, & Extraction (100.0%), Construction (100.0%), and Real Estate, Rental & Leasing (100.0%), whereas the industries that tend to have a higher number of women are Information (100.0%), Finance & Insurance (100.0%), and Educational Services (91.3%).
| Industry | Male | Female |
| Agriculture, Fishing & Hunting | 18 (78.3%) | 5 (21.7%) |
| Mining, Quarrying, & Extraction | 31 (100.0%) | 0 (0.0%) |
| Construction | 121 (100.0%) | 0 (0.0%) |
| Manufacturing | 62 (76.5%) | 19 (23.5%) |
| Wholesale Trade | 0 (0.0%) | 0 (0.0%) |
| Retail Trade | 143 (66.2%) | 73 (33.8%) |
| Transportation & Warehousing | 27 (54.0%) | 23 (46.0%) |
| Utilities | 14 (73.7%) | 5 (26.3%) |
| Information | 0 (0.0%) | 6 (100.0%) |
| Finance & Insurance | 0 (0.0%) | 41 (100.0%) |
| Real Estate, Rental & Leasing | 4 (100.0%) | 0 (0.0%) |
| Professional & Scientific | 4 (22.2%) | 14 (77.8%) |
| Enterprise Management | 0 (0.0%) | 0 (0.0%) |
| Administrative & Support | 20 (40.0%) | 30 (60.0%) |
| Educational Services | 6 (8.7%) | 63 (91.3%) |
| Health Care & Social Assistance | 40 (34.5%) | 76 (65.5%) |
| Arts, Entertainment & Recreation | 5 (100.0%) | 0 (0.0%) |
| Accommodation & Food Services | 12 (75.0%) | 4 (25.0%) |
| Public Administration | 33 (58.9%) | 23 (41.1%) |
| Total | 589 (60.7%) | 382 (39.3%) |
Education in Townsend
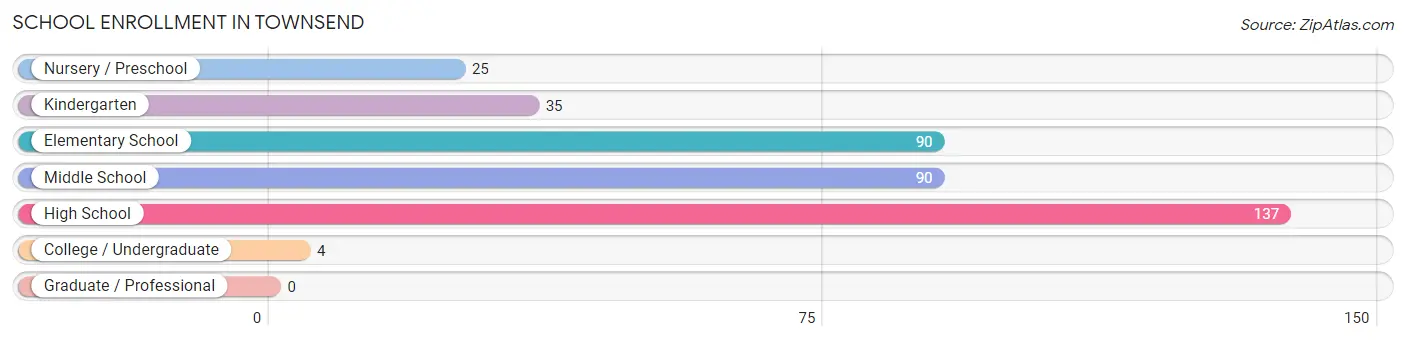
School Enrollment in Townsend
The most common levels of schooling among the 381 students in Townsend are high school (137 | 36.0%), elementary school (90 | 23.6%), and middle school (90 | 23.6%).
| School Level | # Students | % Students |
| Nursery / Preschool | 25 | 6.6% |
| Kindergarten | 35 | 9.2% |
| Elementary School | 90 | 23.6% |
| Middle School | 90 | 23.6% |
| High School | 137 | 36.0% |
| College / Undergraduate | 4 | 1.1% |
| Graduate / Professional | 0 | 0.0% |
| Total | 381 | 100.0% |
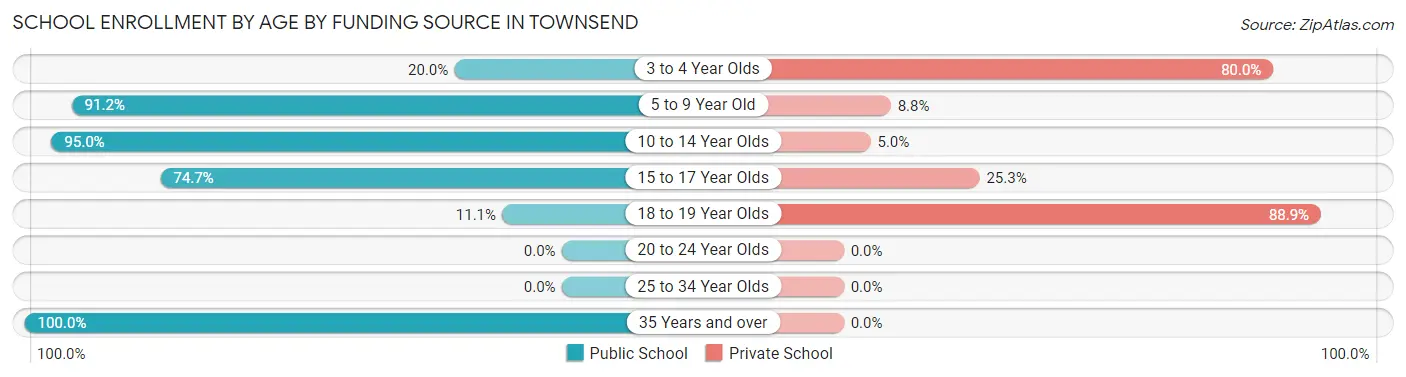
School Enrollment by Age by Funding Source in Townsend
Out of a total of 381 students who are enrolled in schools in Townsend, 89 (23.4%) attend a private institution, while the remaining 292 (76.6%) are enrolled in public schools. The age group of 18 to 19 year olds has the highest likelihood of being enrolled in private schools, with 32 (88.9% in the age bracket) enrolled. Conversely, the age group of 35 years and over has the lowest likelihood of being enrolled in a private school, with 3 (100.0% in the age bracket) attending a public institution.
| Age Bracket | Public School | Private School |
| 3 to 4 Year Olds | 5 (20.0%) | 20 (80.0%) |
| 5 to 9 Year Old | 104 (91.2%) | 10 (8.8%) |
| 10 to 14 Year Olds | 114 (95.0%) | 6 (5.0%) |
| 15 to 17 Year Olds | 62 (74.7%) | 21 (25.3%) |
| 18 to 19 Year Olds | 4 (11.1%) | 32 (88.9%) |
| 20 to 24 Year Olds | 0 (0.0%) | 0 (0.0%) |
| 25 to 34 Year Olds | 0 (0.0%) | 0 (0.0%) |
| 35 Years and over | 3 (100.0%) | 0 (0.0%) |
| Total | 292 (76.6%) | 89 (23.4%) |
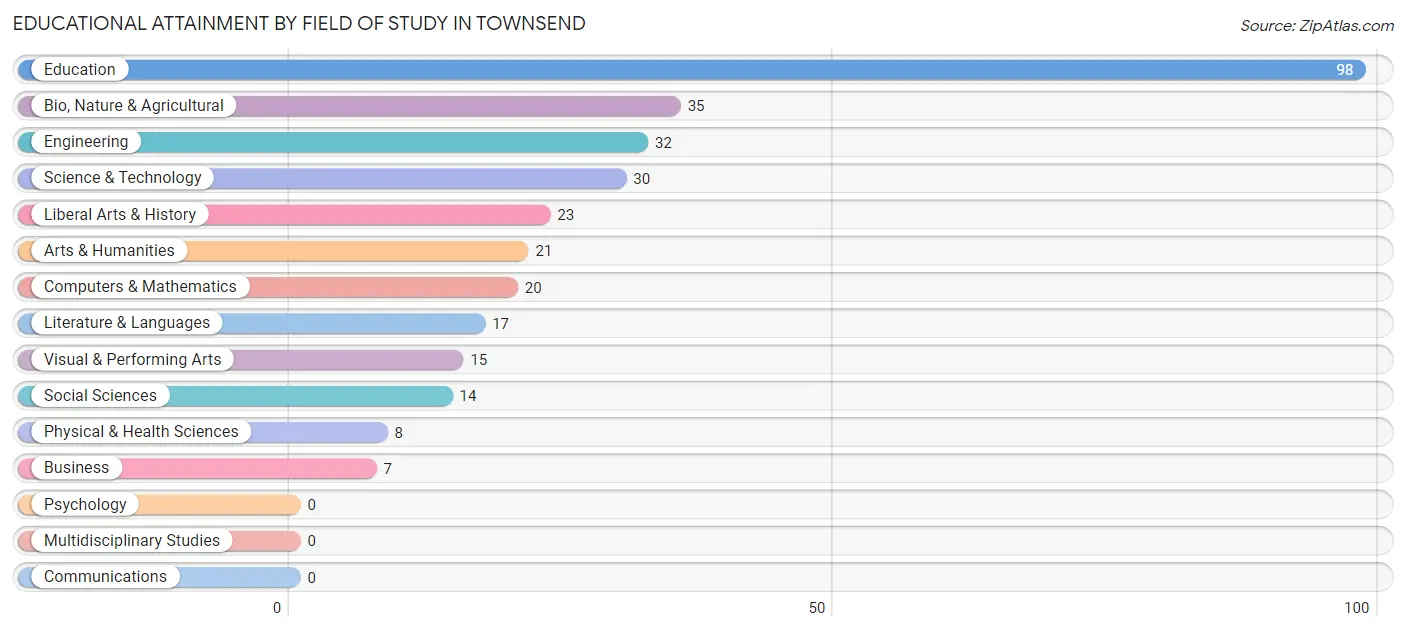
Educational Attainment by Field of Study in Townsend
Education (98 | 30.6%), bio, nature & agricultural (35 | 10.9%), engineering (32 | 10.0%), science & technology (30 | 9.4%), and liberal arts & history (23 | 7.2%) are the most common fields of study among 320 individuals in Townsend who have obtained a bachelor's degree or higher.
| Field of Study | # Graduates | % Graduates |
| Computers & Mathematics | 20 | 6.2% |
| Bio, Nature & Agricultural | 35 | 10.9% |
| Physical & Health Sciences | 8 | 2.5% |
| Psychology | 0 | 0.0% |
| Social Sciences | 14 | 4.4% |
| Engineering | 32 | 10.0% |
| Multidisciplinary Studies | 0 | 0.0% |
| Science & Technology | 30 | 9.4% |
| Business | 7 | 2.2% |
| Education | 98 | 30.6% |
| Literature & Languages | 17 | 5.3% |
| Liberal Arts & History | 23 | 7.2% |
| Visual & Performing Arts | 15 | 4.7% |
| Communications | 0 | 0.0% |
| Arts & Humanities | 21 | 6.6% |
| Total | 320 | 100.0% |
Transportation & Commute in Townsend
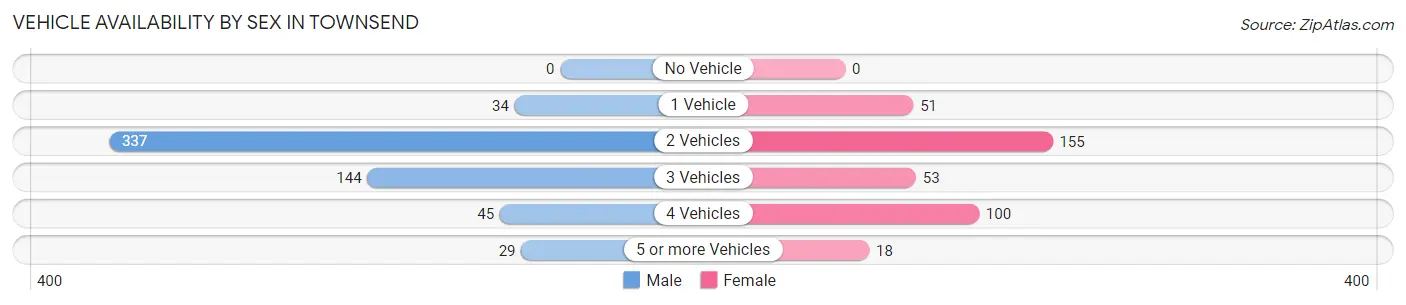
Vehicle Availability by Sex in Townsend
The most prevalent vehicle ownership categories in Townsend are males with 2 vehicles (337, accounting for 57.2%) and females with 2 vehicles (155, making up 89.4%).
| Vehicles Available | Male | Female |
| No Vehicle | 0 (0.0%) | 0 (0.0%) |
| 1 Vehicle | 34 (5.8%) | 51 (13.5%) |
| 2 Vehicles | 337 (57.2%) | 155 (41.1%) |
| 3 Vehicles | 144 (24.4%) | 53 (14.1%) |
| 4 Vehicles | 45 (7.6%) | 100 (26.5%) |
| 5 or more Vehicles | 29 (4.9%) | 18 (4.8%) |
| Total | 589 (100.0%) | 377 (100.0%) |
Commute Time in Townsend
The most frequently occuring commute durations in Townsend are less than 5 minutes (255 commuters, 28.9%), 5 to 9 minutes (146 commuters, 16.6%), and 40 to 44 minutes (105 commuters, 11.9%).
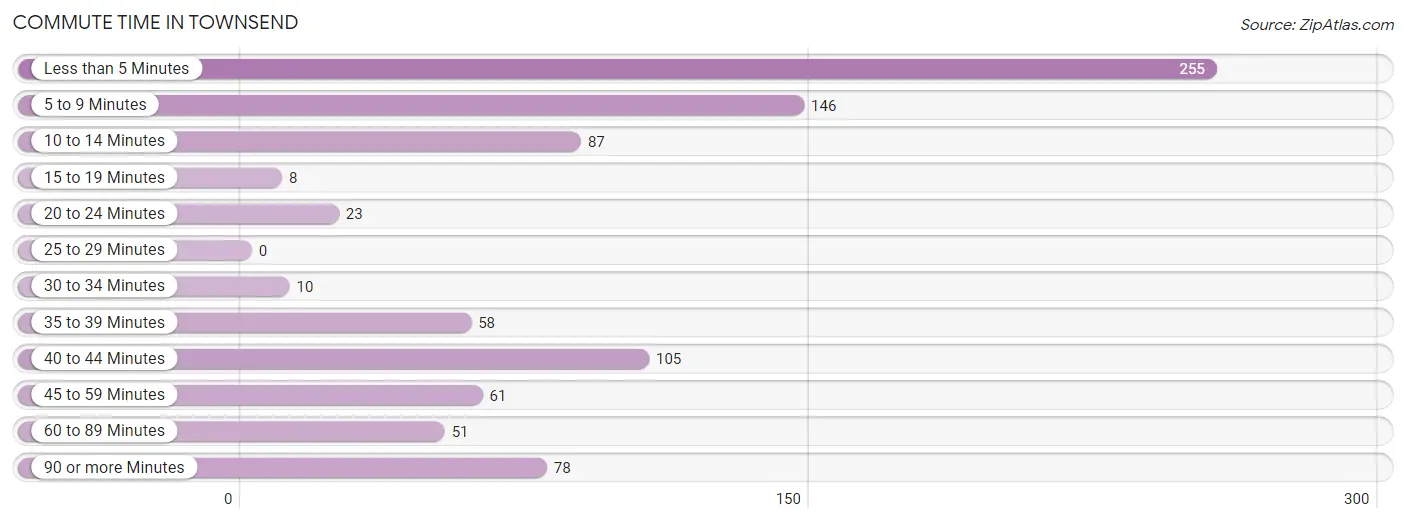
| Commute Time | # Commuters | % Commuters |
| Less than 5 Minutes | 255 | 28.9% |
| 5 to 9 Minutes | 146 | 16.6% |
| 10 to 14 Minutes | 87 | 9.9% |
| 15 to 19 Minutes | 8 | 0.9% |
| 20 to 24 Minutes | 23 | 2.6% |
| 25 to 29 Minutes | 0 | 0.0% |
| 30 to 34 Minutes | 10 | 1.1% |
| 35 to 39 Minutes | 58 | 6.6% |
| 40 to 44 Minutes | 105 | 11.9% |
| 45 to 59 Minutes | 61 | 6.9% |
| 60 to 89 Minutes | 51 | 5.8% |
| 90 or more Minutes | 78 | 8.8% |
Commute Time by Sex in Townsend
The most common commute times in Townsend are less than 5 minutes (167 commuters, 30.1%) for males and less than 5 minutes (88 commuters, 26.8%) for females.
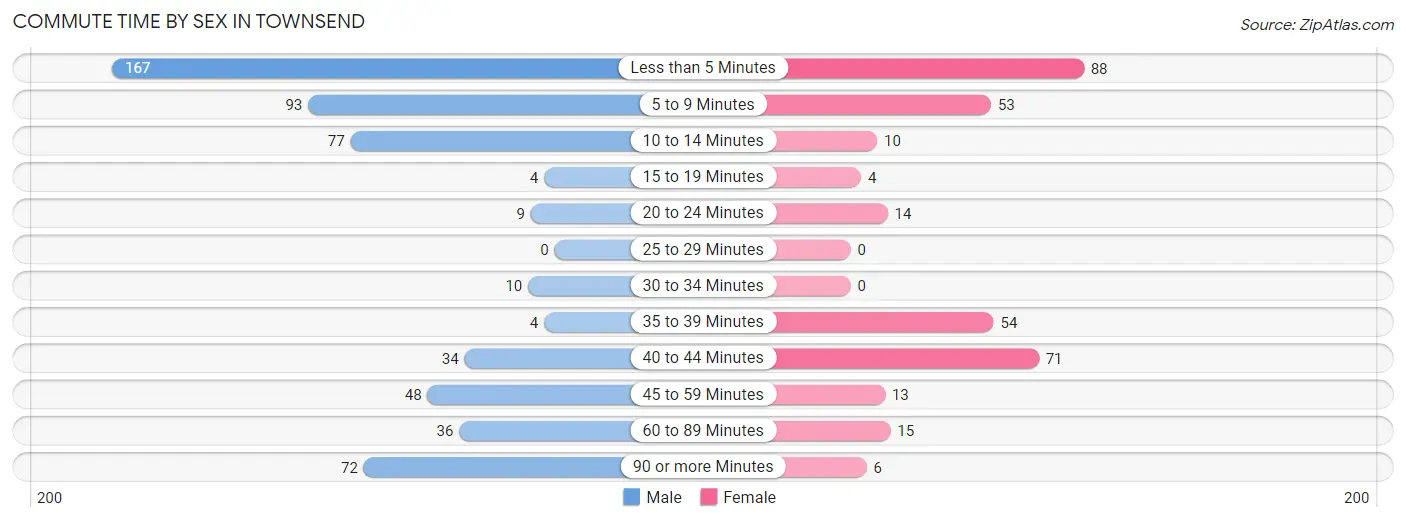
| Commute Time | Male | Female |
| Less than 5 Minutes | 167 (30.1%) | 88 (26.8%) |
| 5 to 9 Minutes | 93 (16.8%) | 53 (16.2%) |
| 10 to 14 Minutes | 77 (13.9%) | 10 (3.0%) |
| 15 to 19 Minutes | 4 (0.7%) | 4 (1.2%) |
| 20 to 24 Minutes | 9 (1.6%) | 14 (4.3%) |
| 25 to 29 Minutes | 0 (0.0%) | 0 (0.0%) |
| 30 to 34 Minutes | 10 (1.8%) | 0 (0.0%) |
| 35 to 39 Minutes | 4 (0.7%) | 54 (16.5%) |
| 40 to 44 Minutes | 34 (6.1%) | 71 (21.6%) |
| 45 to 59 Minutes | 48 (8.7%) | 13 (4.0%) |
| 60 to 89 Minutes | 36 (6.5%) | 15 (4.6%) |
| 90 or more Minutes | 72 (13.0%) | 6 (1.8%) |
Time of Departure to Work by Sex in Townsend
The most frequent times of departure to work in Townsend are 7:30 AM to 7:59 AM (138, 24.9%) for males and 7:00 AM to 7:29 AM (106, 32.3%) for females.
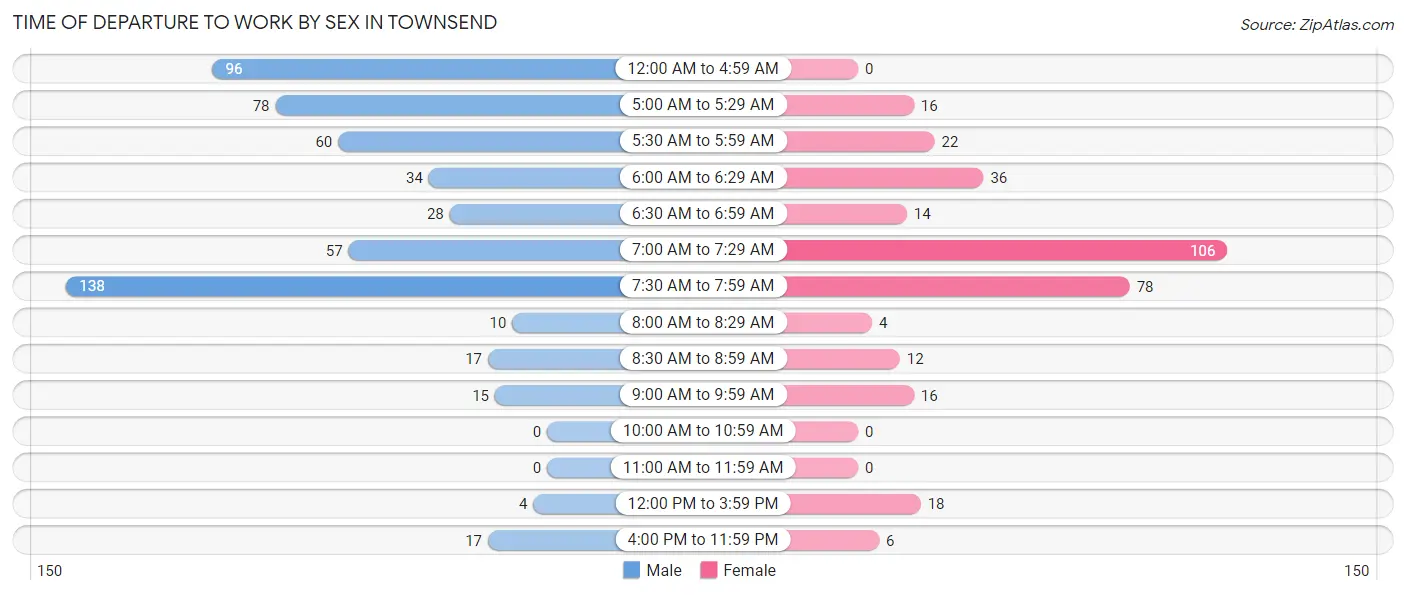
| Time of Departure | Male | Female |
| 12:00 AM to 4:59 AM | 96 (17.3%) | 0 (0.0%) |
| 5:00 AM to 5:29 AM | 78 (14.1%) | 16 (4.9%) |
| 5:30 AM to 5:59 AM | 60 (10.8%) | 22 (6.7%) |
| 6:00 AM to 6:29 AM | 34 (6.1%) | 36 (11.0%) |
| 6:30 AM to 6:59 AM | 28 (5.1%) | 14 (4.3%) |
| 7:00 AM to 7:29 AM | 57 (10.3%) | 106 (32.3%) |
| 7:30 AM to 7:59 AM | 138 (24.9%) | 78 (23.8%) |
| 8:00 AM to 8:29 AM | 10 (1.8%) | 4 (1.2%) |
| 8:30 AM to 8:59 AM | 17 (3.1%) | 12 (3.7%) |
| 9:00 AM to 9:59 AM | 15 (2.7%) | 16 (4.9%) |
| 10:00 AM to 10:59 AM | 0 (0.0%) | 0 (0.0%) |
| 11:00 AM to 11:59 AM | 0 (0.0%) | 0 (0.0%) |
| 12:00 PM to 3:59 PM | 4 (0.7%) | 18 (5.5%) |
| 4:00 PM to 11:59 PM | 17 (3.1%) | 6 (1.8%) |
| Total | 554 (100.0%) | 328 (100.0%) |
Housing Occupancy in Townsend
Occupancy by Ownership in Townsend
Of the total 918 dwellings in Townsend, owner-occupied units account for 660 (71.9%), while renter-occupied units make up 258 (28.1%).
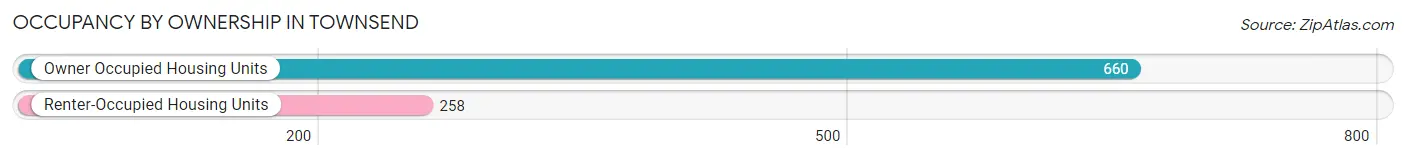
| Occupancy | # Housing Units | % Housing Units |
| Owner Occupied Housing Units | 660 | 71.9% |
| Renter-Occupied Housing Units | 258 | 28.1% |
| Total Occupied Housing Units | 918 | 100.0% |
Occupancy by Household Size in Townsend
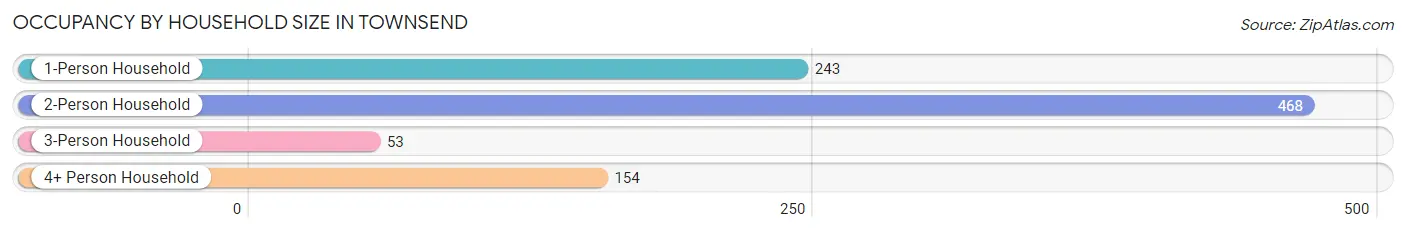
| Household Size | # Housing Units | % Housing Units |
| 1-Person Household | 243 | 26.5% |
| 2-Person Household | 468 | 51.0% |
| 3-Person Household | 53 | 5.8% |
| 4+ Person Household | 154 | 16.8% |
| Total Housing Units | 918 | 100.0% |
Occupancy by Ownership by Household Size in Townsend
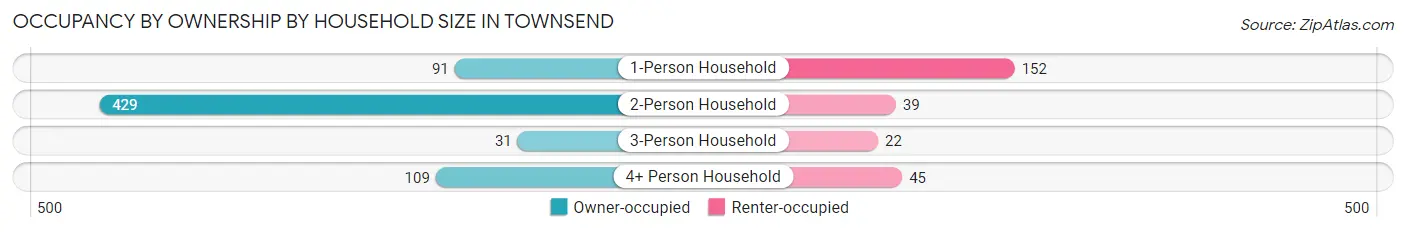
| Household Size | Owner-occupied | Renter-occupied |
| 1-Person Household | 91 (37.4%) | 152 (62.5%) |
| 2-Person Household | 429 (91.7%) | 39 (8.3%) |
| 3-Person Household | 31 (58.5%) | 22 (41.5%) |
| 4+ Person Household | 109 (70.8%) | 45 (29.2%) |
| Total Housing Units | 660 (71.9%) | 258 (28.1%) |
Occupancy by Educational Attainment in Townsend
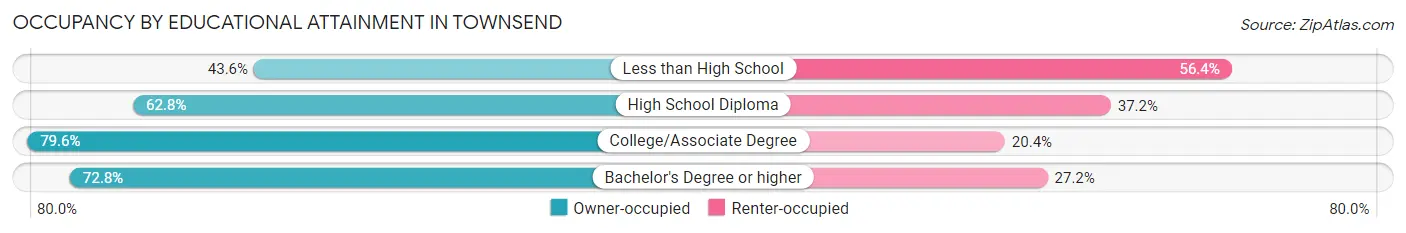
| Household Size | Owner-occupied | Renter-occupied |
| Less than High School | 24 (43.6%) | 31 (56.4%) |
| High School Diploma | 135 (62.8%) | 80 (37.2%) |
| College/Associate Degree | 343 (79.6%) | 88 (20.4%) |
| Bachelor's Degree or higher | 158 (72.8%) | 59 (27.2%) |
Occupancy by Age of Householder in Townsend
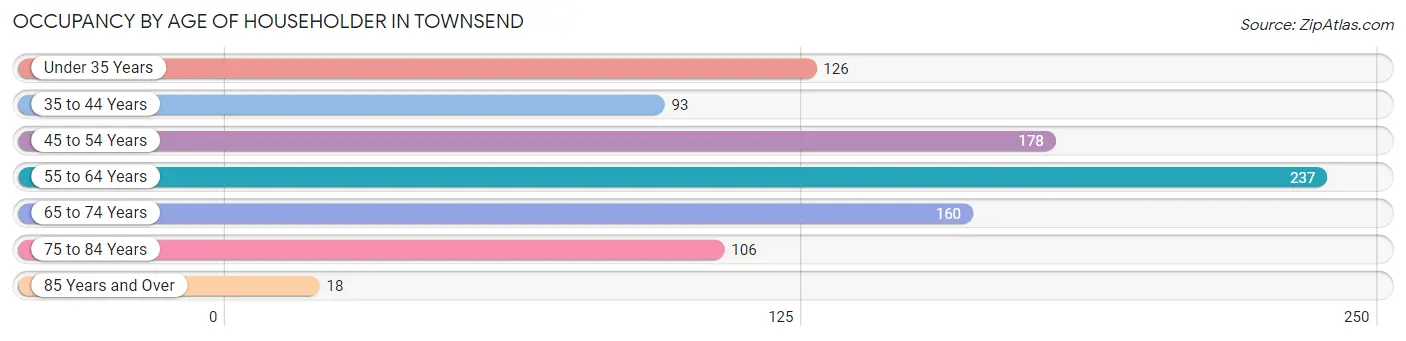
| Age Bracket | # Households | % Households |
| Under 35 Years | 126 | 13.7% |
| 35 to 44 Years | 93 | 10.1% |
| 45 to 54 Years | 178 | 19.4% |
| 55 to 64 Years | 237 | 25.8% |
| 65 to 74 Years | 160 | 17.4% |
| 75 to 84 Years | 106 | 11.6% |
| 85 Years and Over | 18 | 2.0% |
| Total | 918 | 100.0% |
Housing Finances in Townsend
Median Income by Occupancy in Townsend
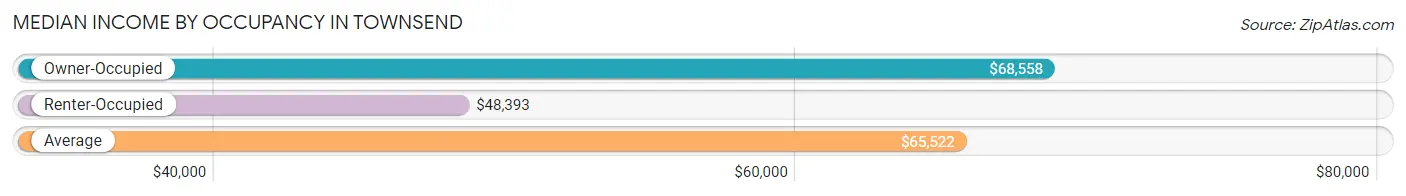
| Occupancy Type | # Households | Median Income |
| Owner-Occupied | 660 (71.9%) | $68,558 |
| Renter-Occupied | 258 (28.1%) | $48,393 |
| Average | 918 (100.0%) | $65,522 |
Occupancy by Householder Income Bracket in Townsend
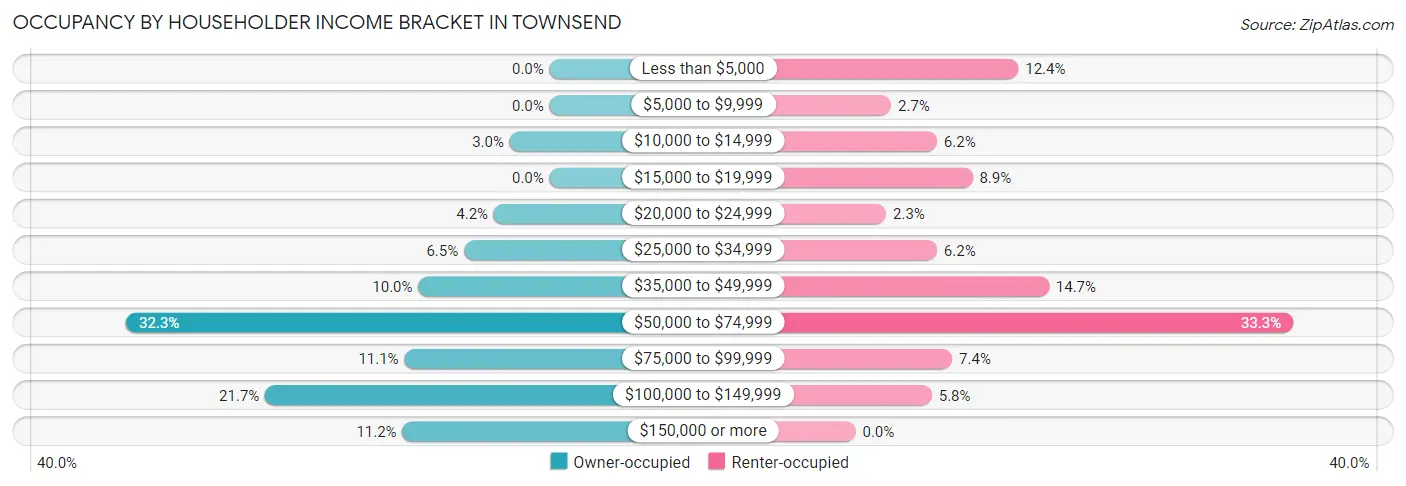
| Income Bracket | Owner-occupied | Renter-occupied |
| Less than $5,000 | 0 (0.0%) | 32 (12.4%) |
| $5,000 to $9,999 | 0 (0.0%) | 7 (2.7%) |
| $10,000 to $14,999 | 20 (3.0%) | 16 (6.2%) |
| $15,000 to $19,999 | 0 (0.0%) | 23 (8.9%) |
| $20,000 to $24,999 | 28 (4.2%) | 6 (2.3%) |
| $25,000 to $34,999 | 43 (6.5%) | 16 (6.2%) |
| $35,000 to $49,999 | 66 (10.0%) | 38 (14.7%) |
| $50,000 to $74,999 | 213 (32.3%) | 86 (33.3%) |
| $75,000 to $99,999 | 73 (11.1%) | 19 (7.4%) |
| $100,000 to $149,999 | 143 (21.7%) | 15 (5.8%) |
| $150,000 or more | 74 (11.2%) | 0 (0.0%) |
| Total | 660 (100.0%) | 258 (100.0%) |
Monthly Housing Cost Tiers in Townsend
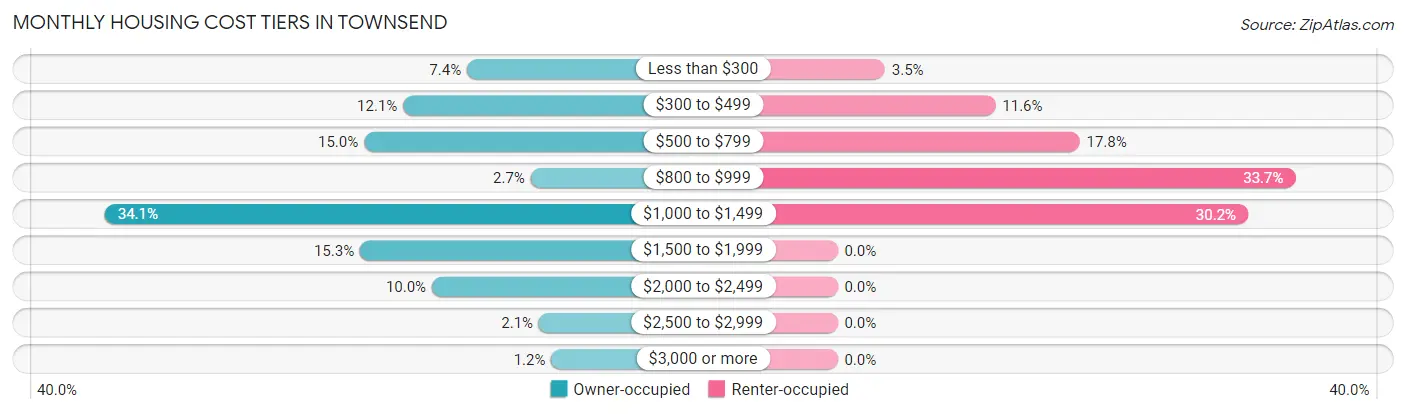
| Monthly Cost | Owner-occupied | Renter-occupied |
| Less than $300 | 49 (7.4%) | 9 (3.5%) |
| $300 to $499 | 80 (12.1%) | 30 (11.6%) |
| $500 to $799 | 99 (15.0%) | 46 (17.8%) |
| $800 to $999 | 18 (2.7%) | 87 (33.7%) |
| $1,000 to $1,499 | 225 (34.1%) | 78 (30.2%) |
| $1,500 to $1,999 | 101 (15.3%) | 0 (0.0%) |
| $2,000 to $2,499 | 66 (10.0%) | 0 (0.0%) |
| $2,500 to $2,999 | 14 (2.1%) | 0 (0.0%) |
| $3,000 or more | 8 (1.2%) | 0 (0.0%) |
| Total | 660 (100.0%) | 258 (100.0%) |
Physical Housing Characteristics in Townsend
Housing Structures in Townsend
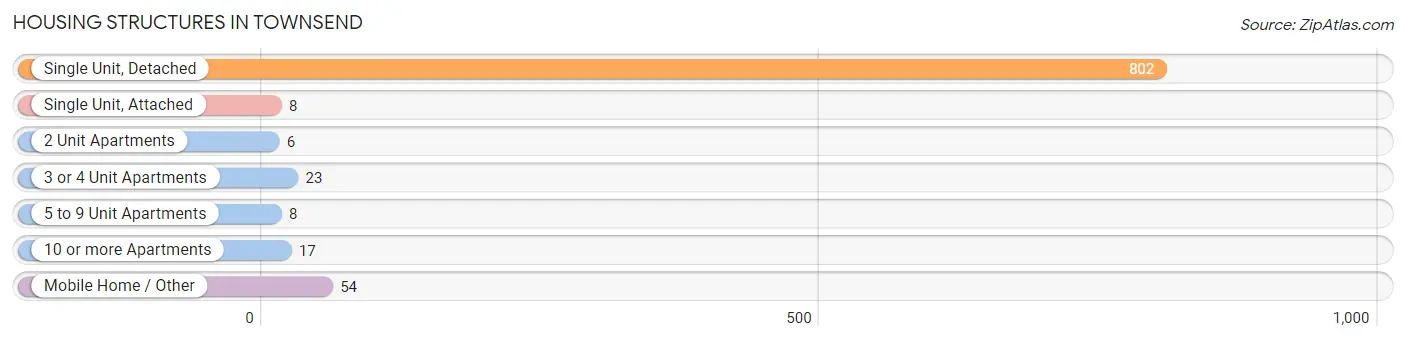
| Structure Type | # Housing Units | % Housing Units |
| Single Unit, Detached | 802 | 87.4% |
| Single Unit, Attached | 8 | 0.9% |
| 2 Unit Apartments | 6 | 0.6% |
| 3 or 4 Unit Apartments | 23 | 2.5% |
| 5 to 9 Unit Apartments | 8 | 0.9% |
| 10 or more Apartments | 17 | 1.8% |
| Mobile Home / Other | 54 | 5.9% |
| Total | 918 | 100.0% |
Housing Structures by Occupancy in Townsend
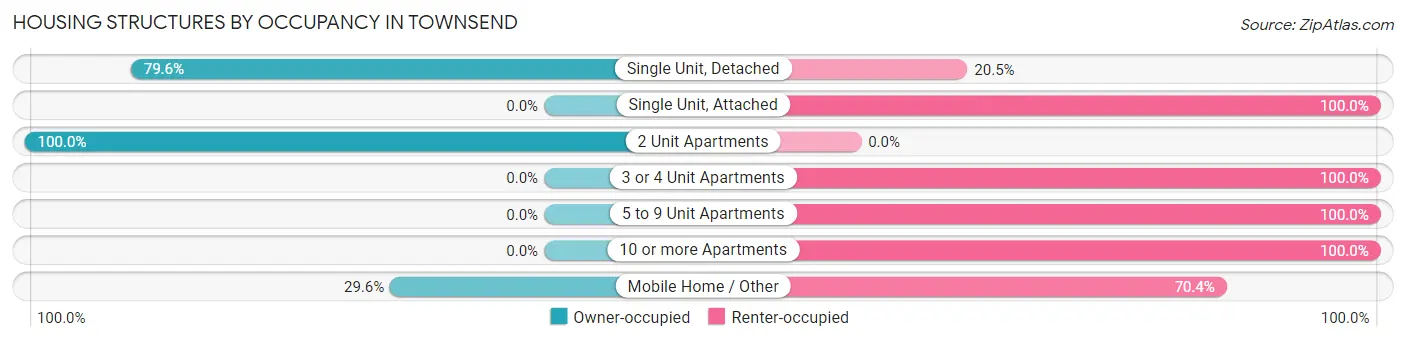
| Structure Type | Owner-occupied | Renter-occupied |
| Single Unit, Detached | 638 (79.5%) | 164 (20.4%) |
| Single Unit, Attached | 0 (0.0%) | 8 (100.0%) |
| 2 Unit Apartments | 6 (100.0%) | 0 (0.0%) |
| 3 or 4 Unit Apartments | 0 (0.0%) | 23 (100.0%) |
| 5 to 9 Unit Apartments | 0 (0.0%) | 8 (100.0%) |
| 10 or more Apartments | 0 (0.0%) | 17 (100.0%) |
| Mobile Home / Other | 16 (29.6%) | 38 (70.4%) |
| Total | 660 (71.9%) | 258 (28.1%) |
Housing Structures by Number of Rooms in Townsend
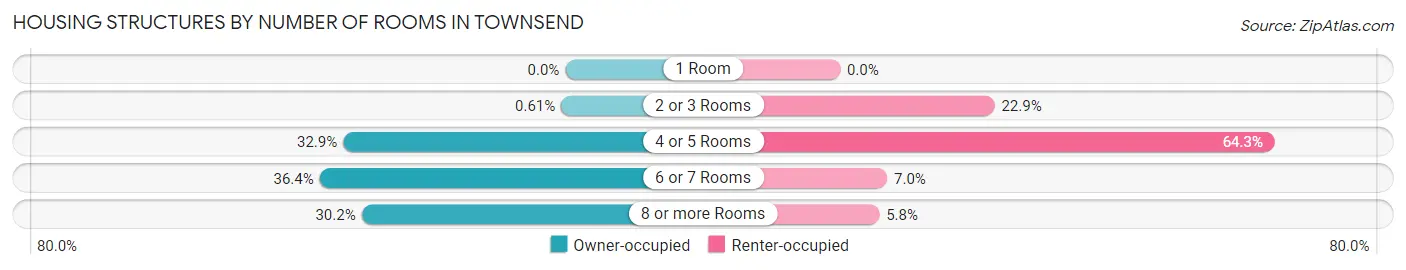
| Number of Rooms | Owner-occupied | Renter-occupied |
| 1 Room | 0 (0.0%) | 0 (0.0%) |
| 2 or 3 Rooms | 4 (0.6%) | 59 (22.9%) |
| 4 or 5 Rooms | 217 (32.9%) | 166 (64.3%) |
| 6 or 7 Rooms | 240 (36.4%) | 18 (7.0%) |
| 8 or more Rooms | 199 (30.1%) | 15 (5.8%) |
| Total | 660 (100.0%) | 258 (100.0%) |
Housing Structure by Heating Type in Townsend
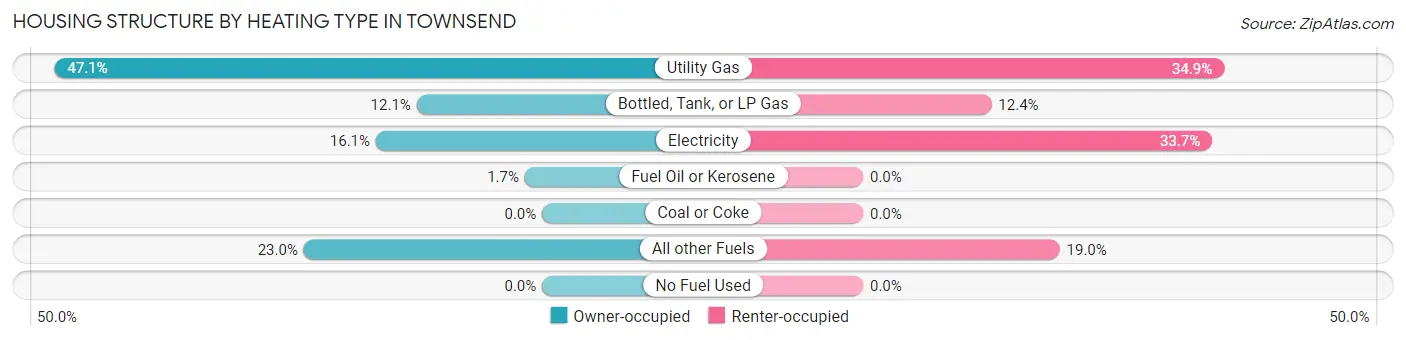
| Heating Type | Owner-occupied | Renter-occupied |
| Utility Gas | 311 (47.1%) | 90 (34.9%) |
| Bottled, Tank, or LP Gas | 80 (12.1%) | 32 (12.4%) |
| Electricity | 106 (16.1%) | 87 (33.7%) |
| Fuel Oil or Kerosene | 11 (1.7%) | 0 (0.0%) |
| Coal or Coke | 0 (0.0%) | 0 (0.0%) |
| All other Fuels | 152 (23.0%) | 49 (19.0%) |
| No Fuel Used | 0 (0.0%) | 0 (0.0%) |
| Total | 660 (100.0%) | 258 (100.0%) |
Household Vehicle Usage in Townsend
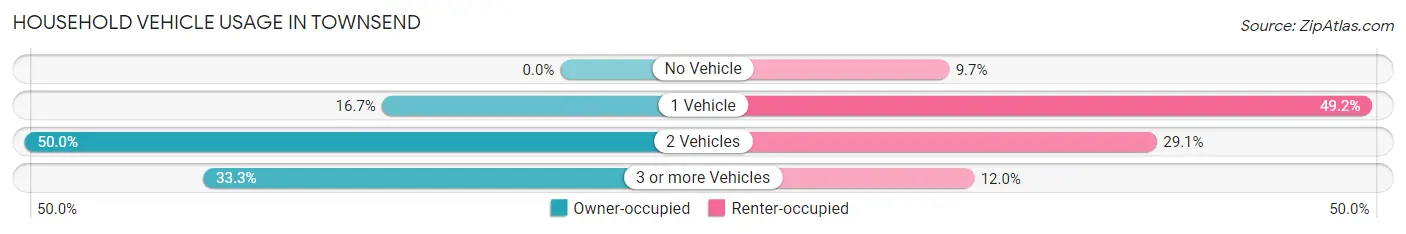
| Vehicles per Household | Owner-occupied | Renter-occupied |
| No Vehicle | 0 (0.0%) | 25 (9.7%) |
| 1 Vehicle | 110 (16.7%) | 127 (49.2%) |
| 2 Vehicles | 330 (50.0%) | 75 (29.1%) |
| 3 or more Vehicles | 220 (33.3%) | 31 (12.0%) |
| Total | 660 (100.0%) | 258 (100.0%) |
Real Estate & Mortgages in Townsend
Real Estate and Mortgage Overview in Townsend
| Characteristic | Without Mortgage | With Mortgage |
| Housing Units | 197 | 463 |
| Median Property Value | $194,400 | $220,100 |
| Median Household Income | $49,821 | $72 |
| Monthly Housing Costs | $440 | $8 |
| Real Estate Taxes | $1,253 | $0 |
Property Value by Mortgage Status in Townsend
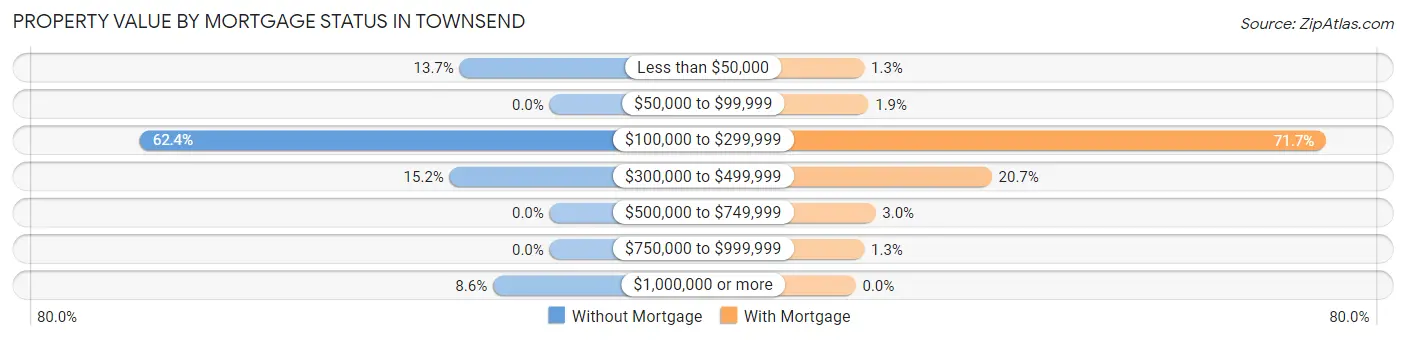
| Property Value | Without Mortgage | With Mortgage |
| Less than $50,000 | 27 (13.7%) | 6 (1.3%) |
| $50,000 to $99,999 | 0 (0.0%) | 9 (1.9%) |
| $100,000 to $299,999 | 123 (62.4%) | 332 (71.7%) |
| $300,000 to $499,999 | 30 (15.2%) | 96 (20.7%) |
| $500,000 to $749,999 | 0 (0.0%) | 14 (3.0%) |
| $750,000 to $999,999 | 0 (0.0%) | 6 (1.3%) |
| $1,000,000 or more | 17 (8.6%) | 0 (0.0%) |
| Total | 197 (100.0%) | 463 (100.0%) |
Household Income by Mortgage Status in Townsend
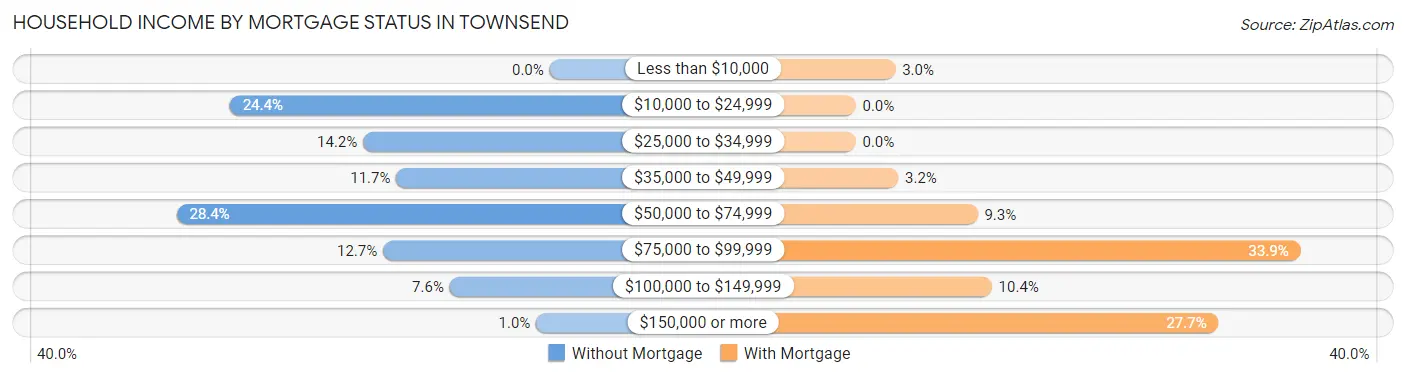
| Household Income | Without Mortgage | With Mortgage |
| Less than $10,000 | 0 (0.0%) | 14 (3.0%) |
| $10,000 to $24,999 | 48 (24.4%) | 0 (0.0%) |
| $25,000 to $34,999 | 28 (14.2%) | 0 (0.0%) |
| $35,000 to $49,999 | 23 (11.7%) | 15 (3.2%) |
| $50,000 to $74,999 | 56 (28.4%) | 43 (9.3%) |
| $75,000 to $99,999 | 25 (12.7%) | 157 (33.9%) |
| $100,000 to $149,999 | 15 (7.6%) | 48 (10.4%) |
| $150,000 or more | 2 (1.0%) | 128 (27.7%) |
| Total | 197 (100.0%) | 463 (100.0%) |
Property Value to Household Income Ratio in Townsend
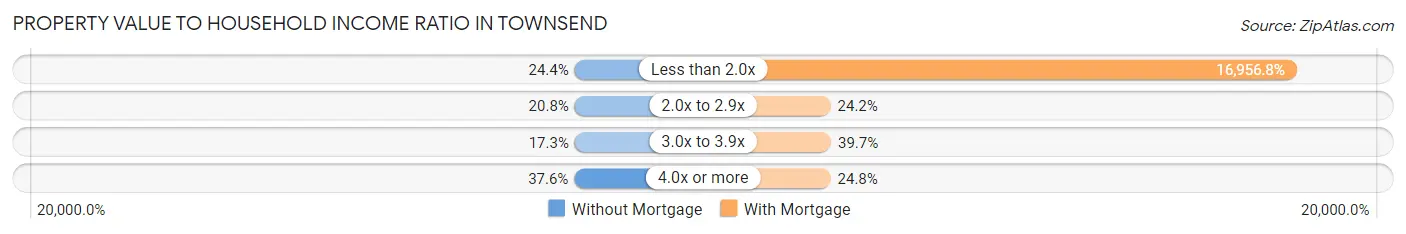
| Value-to-Income Ratio | Without Mortgage | With Mortgage |
| Less than 2.0x | 48 (24.4%) | 78,510 (16,956.8%) |
| 2.0x to 2.9x | 41 (20.8%) | 112 (24.2%) |
| 3.0x to 3.9x | 34 (17.3%) | 184 (39.7%) |
| 4.0x or more | 74 (37.6%) | 115 (24.8%) |
| Total | 197 (100.0%) | 463 (100.0%) |
Real Estate Taxes by Mortgage Status in Townsend
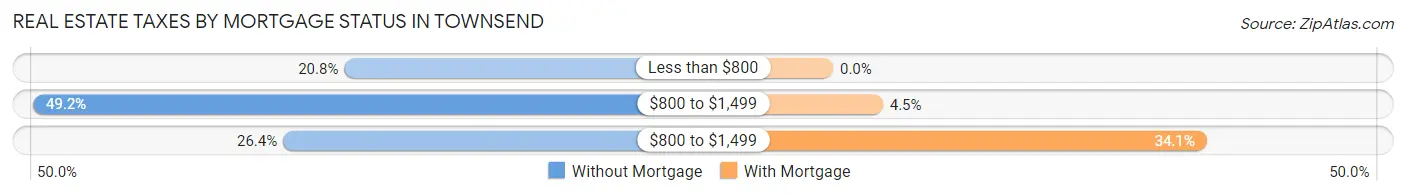
| Property Taxes | Without Mortgage | With Mortgage |
| Less than $800 | 41 (20.8%) | 0 (0.0%) |
| $800 to $1,499 | 97 (49.2%) | 21 (4.5%) |
| $800 to $1,499 | 52 (26.4%) | 158 (34.1%) |
| Total | 197 (100.0%) | 463 (100.0%) |
Health & Disability in Townsend
Health Insurance Coverage by Age in Townsend
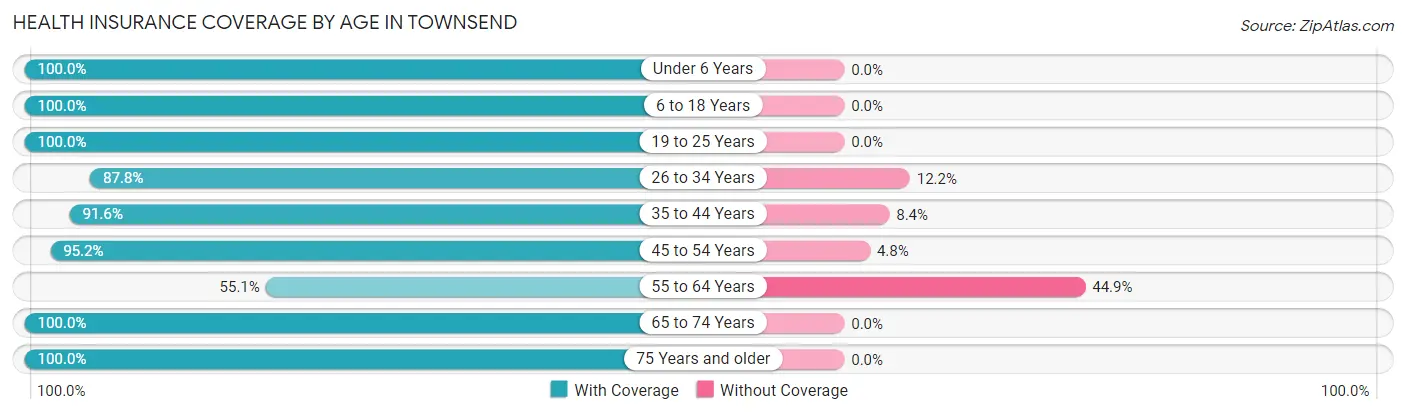
| Age Bracket | With Coverage | Without Coverage |
| Under 6 Years | 87 (100.0%) | 0 (0.0%) |
| 6 to 18 Years | 344 (100.0%) | 0 (0.0%) |
| 19 to 25 Years | 125 (100.0%) | 0 (0.0%) |
| 26 to 34 Years | 151 (87.8%) | 21 (12.2%) |
| 35 to 44 Years | 142 (91.6%) | 13 (8.4%) |
| 45 to 54 Years | 339 (95.2%) | 17 (4.8%) |
| 55 to 64 Years | 245 (55.1%) | 200 (44.9%) |
| 65 to 74 Years | 274 (100.0%) | 0 (0.0%) |
| 75 Years and older | 164 (100.0%) | 0 (0.0%) |
| Total | 1,871 (88.2%) | 251 (11.8%) |
Health Insurance Coverage by Citizenship Status in Townsend
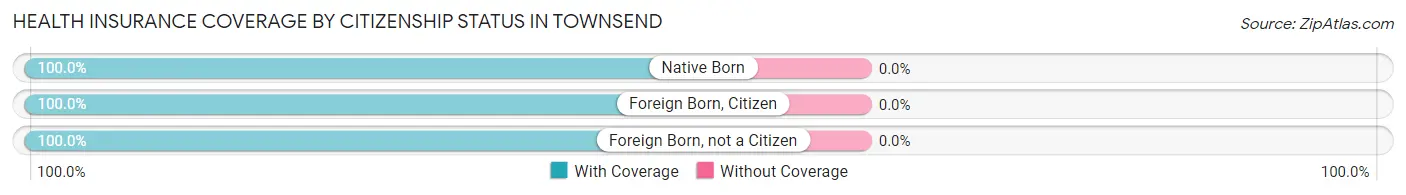
| Citizenship Status | With Coverage | Without Coverage |
| Native Born | 87 (100.0%) | 0 (0.0%) |
| Foreign Born, Citizen | 344 (100.0%) | 0 (0.0%) |
| Foreign Born, not a Citizen | 125 (100.0%) | 0 (0.0%) |
Health Insurance Coverage by Household Income in Townsend
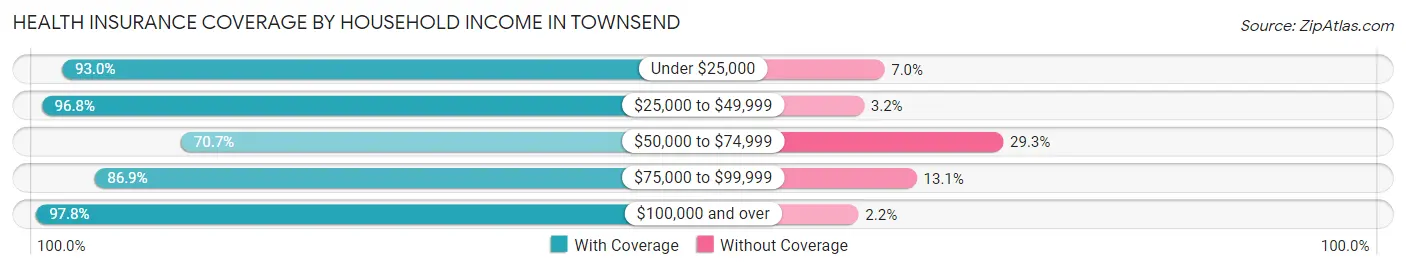
| Household Income | With Coverage | Without Coverage |
| Under $25,000 | 212 (93.0%) | 16 (7.0%) |
| $25,000 to $49,999 | 273 (96.8%) | 9 (3.2%) |
| $50,000 to $74,999 | 437 (70.7%) | 181 (29.3%) |
| $75,000 to $99,999 | 186 (86.9%) | 28 (13.1%) |
| $100,000 and over | 763 (97.8%) | 17 (2.2%) |
Public vs Private Health Insurance Coverage by Age in Townsend
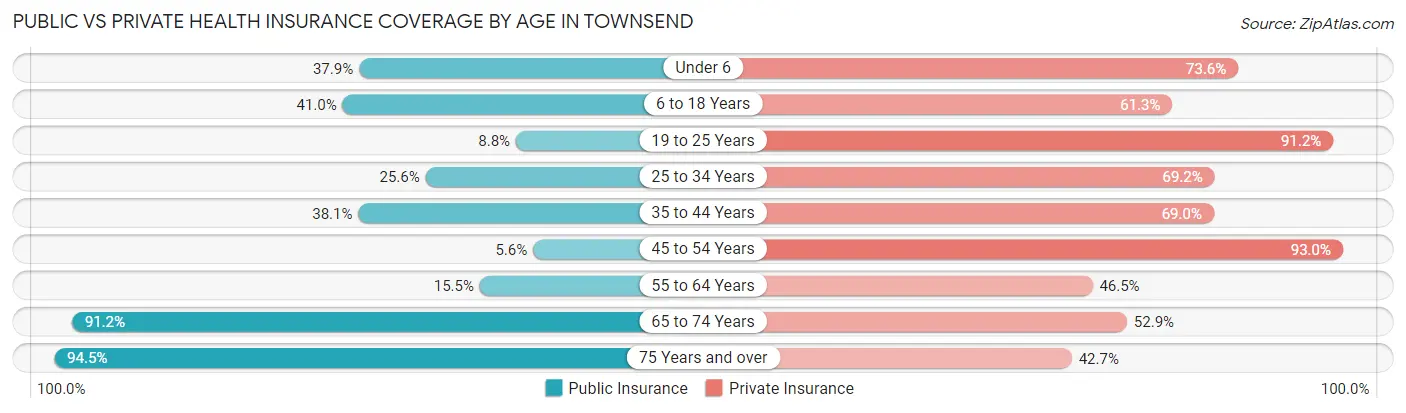
| Age Bracket | Public Insurance | Private Insurance |
| Under 6 | 33 (37.9%) | 64 (73.6%) |
| 6 to 18 Years | 141 (41.0%) | 211 (61.3%) |
| 19 to 25 Years | 11 (8.8%) | 114 (91.2%) |
| 25 to 34 Years | 44 (25.6%) | 119 (69.2%) |
| 35 to 44 Years | 59 (38.1%) | 107 (69.0%) |
| 45 to 54 Years | 20 (5.6%) | 331 (93.0%) |
| 55 to 64 Years | 69 (15.5%) | 207 (46.5%) |
| 65 to 74 Years | 250 (91.2%) | 145 (52.9%) |
| 75 Years and over | 155 (94.5%) | 70 (42.7%) |
| Total | 782 (36.8%) | 1,368 (64.5%) |
Disability Status by Sex by Age in Townsend
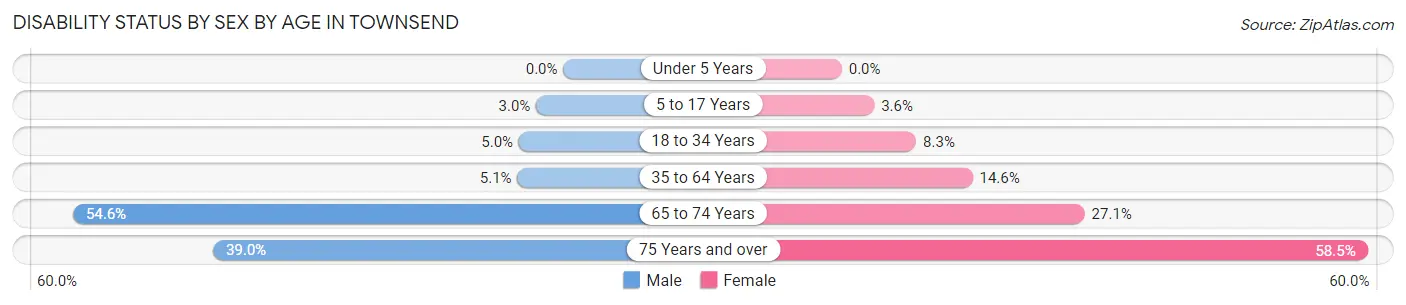
| Age Bracket | Male | Female |
| Under 5 Years | 0 (0.0%) | 0 (0.0%) |
| 5 to 17 Years | 5 (3.0%) | 6 (3.6%) |
| 18 to 34 Years | 9 (5.0%) | 13 (8.3%) |
| 35 to 64 Years | 25 (5.1%) | 68 (14.6%) |
| 65 to 74 Years | 83 (54.6%) | 33 (27.1%) |
| 75 Years and over | 32 (39.0%) | 48 (58.5%) |
Disability Class by Sex by Age in Townsend
Disability Class: Hearing Difficulty
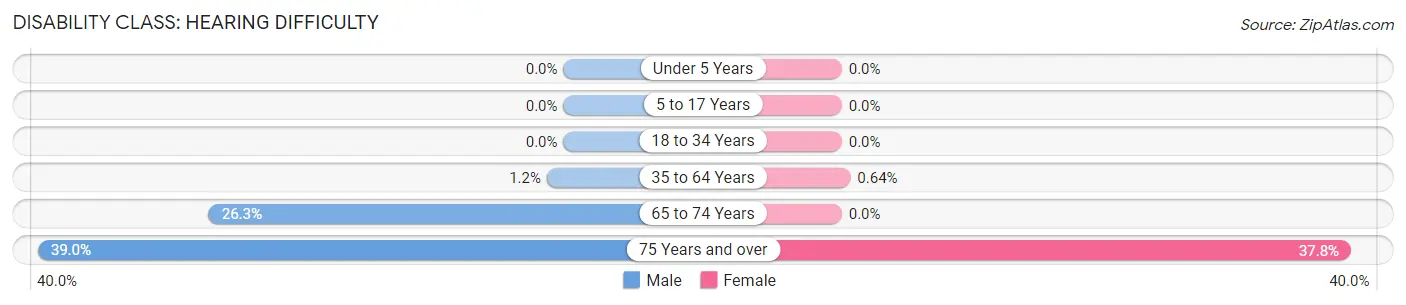
| Age Bracket | Male | Female |
| Under 5 Years | 0 (0.0%) | 0 (0.0%) |
| 5 to 17 Years | 0 (0.0%) | 0 (0.0%) |
| 18 to 34 Years | 0 (0.0%) | 0 (0.0%) |
| 35 to 64 Years | 6 (1.2%) | 3 (0.6%) |
| 65 to 74 Years | 40 (26.3%) | 0 (0.0%) |
| 75 Years and over | 32 (39.0%) | 31 (37.8%) |
Disability Class: Vision Difficulty
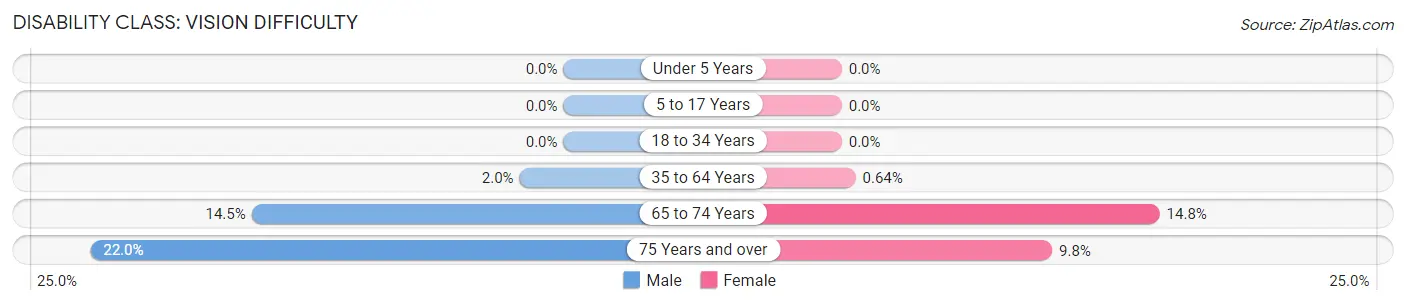
| Age Bracket | Male | Female |
| Under 5 Years | 0 (0.0%) | 0 (0.0%) |
| 5 to 17 Years | 0 (0.0%) | 0 (0.0%) |
| 18 to 34 Years | 0 (0.0%) | 0 (0.0%) |
| 35 to 64 Years | 10 (2.0%) | 3 (0.6%) |
| 65 to 74 Years | 22 (14.5%) | 18 (14.7%) |
| 75 Years and over | 18 (22.0%) | 8 (9.8%) |
Disability Class: Cognitive Difficulty
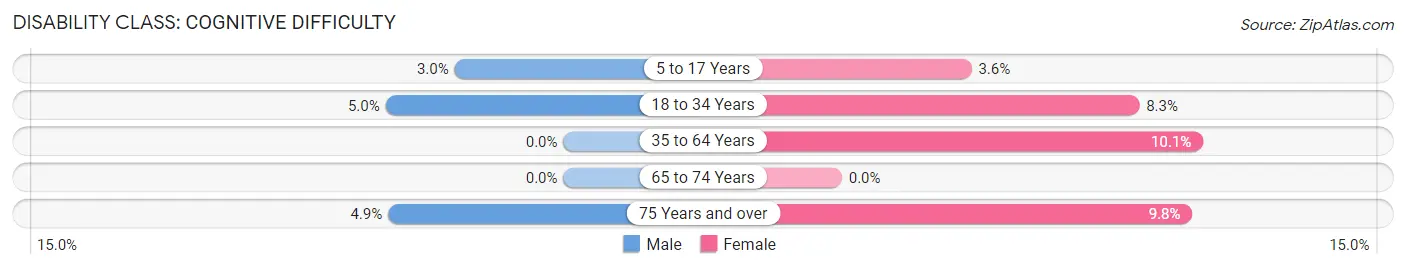
| Age Bracket | Male | Female |
| 5 to 17 Years | 5 (3.0%) | 6 (3.6%) |
| 18 to 34 Years | 9 (5.0%) | 13 (8.3%) |
| 35 to 64 Years | 0 (0.0%) | 47 (10.1%) |
| 65 to 74 Years | 0 (0.0%) | 0 (0.0%) |
| 75 Years and over | 4 (4.9%) | 8 (9.8%) |
Disability Class: Ambulatory Difficulty
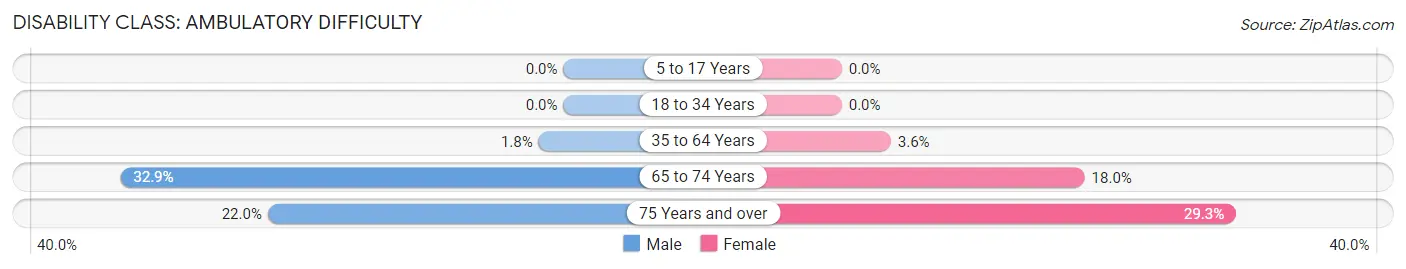
| Age Bracket | Male | Female |
| 5 to 17 Years | 0 (0.0%) | 0 (0.0%) |
| 18 to 34 Years | 0 (0.0%) | 0 (0.0%) |
| 35 to 64 Years | 9 (1.8%) | 17 (3.6%) |
| 65 to 74 Years | 50 (32.9%) | 22 (18.0%) |
| 75 Years and over | 18 (22.0%) | 24 (29.3%) |
Disability Class: Self-Care Difficulty
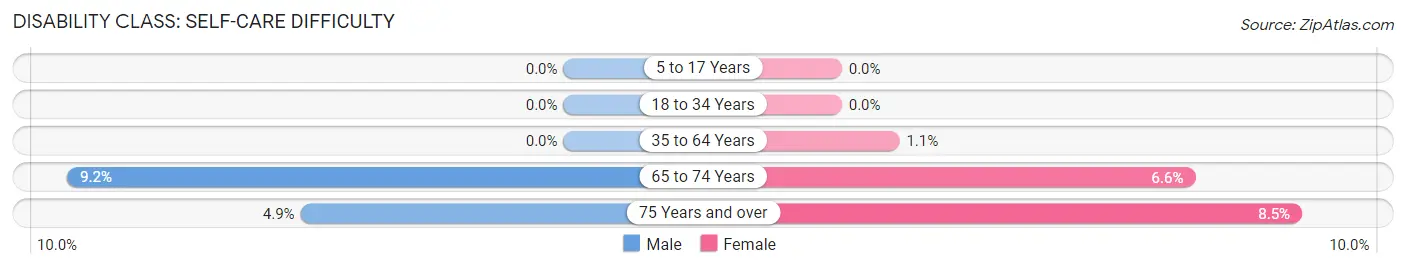
| Age Bracket | Male | Female |
| 5 to 17 Years | 0 (0.0%) | 0 (0.0%) |
| 18 to 34 Years | 0 (0.0%) | 0 (0.0%) |
| 35 to 64 Years | 0 (0.0%) | 5 (1.1%) |
| 65 to 74 Years | 14 (9.2%) | 8 (6.6%) |
| 75 Years and over | 4 (4.9%) | 7 (8.5%) |
Technology Access in Townsend
Computing Device Access in Townsend
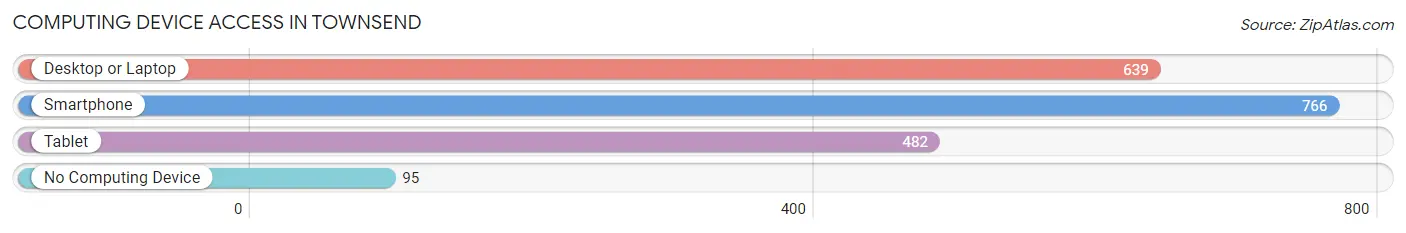
| Device Type | # Households | % Households |
| Desktop or Laptop | 639 | 69.6% |
| Smartphone | 766 | 83.4% |
| Tablet | 482 | 52.5% |
| No Computing Device | 95 | 10.3% |
| Total | 918 | 100.0% |
Internet Access in Townsend
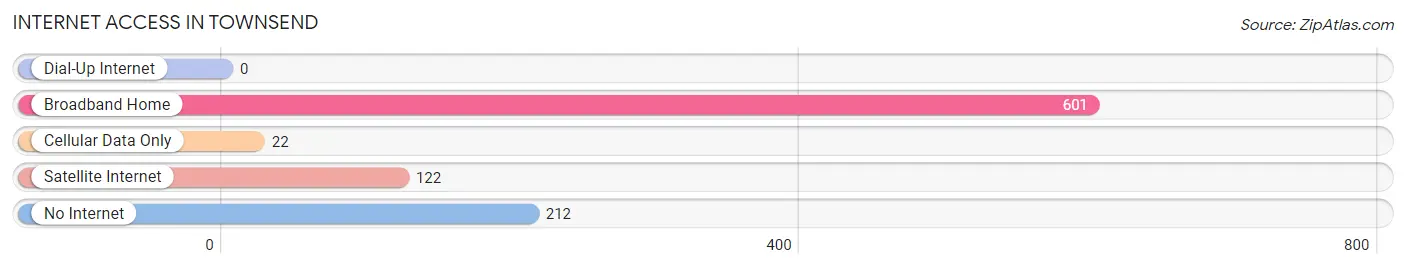
| Internet Type | # Households | % Households |
| Dial-Up Internet | 0 | 0.0% |
| Broadband Home | 601 | 65.5% |
| Cellular Data Only | 22 | 2.4% |
| Satellite Internet | 122 | 13.3% |
| No Internet | 212 | 23.1% |
| Total | 918 | 100.0% |
Townsend Summary
Townsend, Montana is a small town located in Broadwater County, Montana. It is situated along the banks of the Missouri River, approximately 30 miles north of Helena, the state capital. The town was founded in 1864 and has a population of approximately 1,500 people.
History
Townsend was founded in 1864 by a group of miners who were searching for gold in the area. The town was named after the first postmaster, William Townsend. The town quickly grew and by 1868, it had become a bustling center of commerce and industry. The town was home to a number of businesses, including a hotel, a general store, a blacksmith shop, and a saloon.
In 1883, the Northern Pacific Railroad arrived in Townsend, connecting the town to the rest of the country. This allowed for the growth of the town and the development of new businesses. By the early 1900s, Townsend had become a major agricultural center, with a number of farms and ranches in the area.
Geography
Townsend is located in the foothills of the Rocky Mountains, approximately 30 miles north of Helena. The town is situated along the banks of the Missouri River, which provides a number of recreational opportunities, including fishing, boating, and camping. The town is surrounded by rolling hills and grasslands, providing a beautiful backdrop for the town.
Economy
The economy of Townsend is largely based on agriculture and tourism. The town is home to a number of farms and ranches, which produce a variety of crops, including wheat, barley, and hay. The town is also home to a number of tourist attractions, including the Missouri River, the Lewis and Clark Trail, and the nearby Helena National Forest.
Demographics
As of the 2010 census, the population of Townsend was 1,500 people. The town is predominantly white, with approximately 95% of the population identifying as Caucasian. The median household income in Townsend is $41,000, and the median home value is $150,000.
Conclusion
Townsend, Montana is a small town located in Broadwater County, Montana. It was founded in 1864 and has a population of approximately 1,500 people. The town is situated along the banks of the Missouri River and is surrounded by rolling hills and grasslands. The economy of Townsend is largely based on agriculture and tourism, and the town is home to a number of farms and ranches, as well as tourist attractions. The population of Townsend is predominantly white, with a median household income of $41,000 and a median home value of $150,000.
Common Questions
What is Per Capita Income in Townsend?
Per Capita income in Townsend is $34,236.
What is the Median Family Income in Townsend?
Median Family Income in Townsend is $85,833.
What is the Median Household income in Townsend?
Median Household Income in Townsend is $65,522.
What is Income or Wage Gap in Townsend?
Income or Wage Gap in Townsend is 27.8%.
Women in Townsend earn 72.2 cents for every dollar earned by a man.
What is Inequality or Gini Index in Townsend?
Inequality or Gini Index in Townsend is 0.38.
What is the Total Population of Townsend?
Total Population of Townsend is 2,176.
What is the Total Male Population of Townsend?
Total Male Population of Townsend is 1,135.
What is the Total Female Population of Townsend?
Total Female Population of Townsend is 1,041.
What is the Ratio of Males per 100 Females in Townsend?
There are 109.03 Males per 100 Females in Townsend.
What is the Ratio of Females per 100 Males in Townsend?
There are 91.72 Females per 100 Males in Townsend.
What is the Median Population Age in Townsend?
Median Population Age in Townsend is 51.1 Years.
What is the Average Family Size in Townsend
Average Family Size in Townsend is 3.0 People.
What is the Average Household Size in Townsend
Average Household Size in Townsend is 2.3 People.
How Large is the Labor Force in Townsend?
There are 1,113 People in the Labor Forcein in Townsend.
What is the Percentage of People in the Labor Force in Townsend?
59.5% of People are in the Labor Force in Townsend.
What is the Unemployment Rate in Townsend?
Unemployment Rate in Townsend is 12.8%.