Lolo, MT Map & Demographics
Lolo Map
Lolo Overview
$33,259
PER CAPITA INCOME
$83,380
AVG FAMILY INCOME
$69,035
AVG HOUSEHOLD INCOME
38.0%
WAGE / INCOME GAP [ % ]
62.0¢/ $1
WAGE / INCOME GAP [ $ ]
0.40
INEQUALITY / GINI INDEX
4,573
TOTAL POPULATION
2,449
MALE POPULATION
2,124
FEMALE POPULATION
115.30
MALES / 100 FEMALES
86.73
FEMALES / 100 MALES
31.5
MEDIAN AGE
3.0
AVG FAMILY SIZE
2.5
AVG HOUSEHOLD SIZE
2,289
LABOR FORCE [ PEOPLE ]
69.5%
PERCENT IN LABOR FORCE
1.0%
UNEMPLOYMENT RATE
Lolo Zip Codes
Lolo Area Codes
Income in Lolo
Income Overview in Lolo
Per Capita Income in Lolo is $33,259, while median incomes of families and households are $83,380 and $69,035 respectively.
| Characteristic | Number | Measure |
| Per Capita Income | 4,573 | $33,259 |
| Median Family Income | 1,263 | $83,380 |
| Mean Family Income | 1,263 | $95,101 |
| Median Household Income | 1,828 | $69,035 |
| Mean Household Income | 1,828 | $82,093 |
| Income Deficit | 1,263 | $0 |
| Wage / Income Gap (%) | 4,573 | 38.00% |
| Wage / Income Gap ($) | 4,573 | 62.00¢ per $1 |
| Gini / Inequality Index | 4,573 | 0.40 |
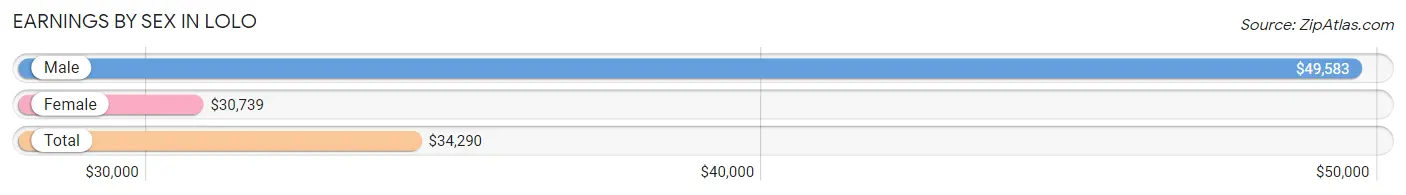
Earnings by Sex in Lolo
Average Earnings in Lolo are $34,290, $49,583 for men and $30,739 for women, a difference of 38.0%.
| Sex | Number | Average Earnings |
| Male | 1,473 (55.0%) | $49,583 |
| Female | 1,203 (45.0%) | $30,739 |
| Total | 2,676 (100.0%) | $34,290 |
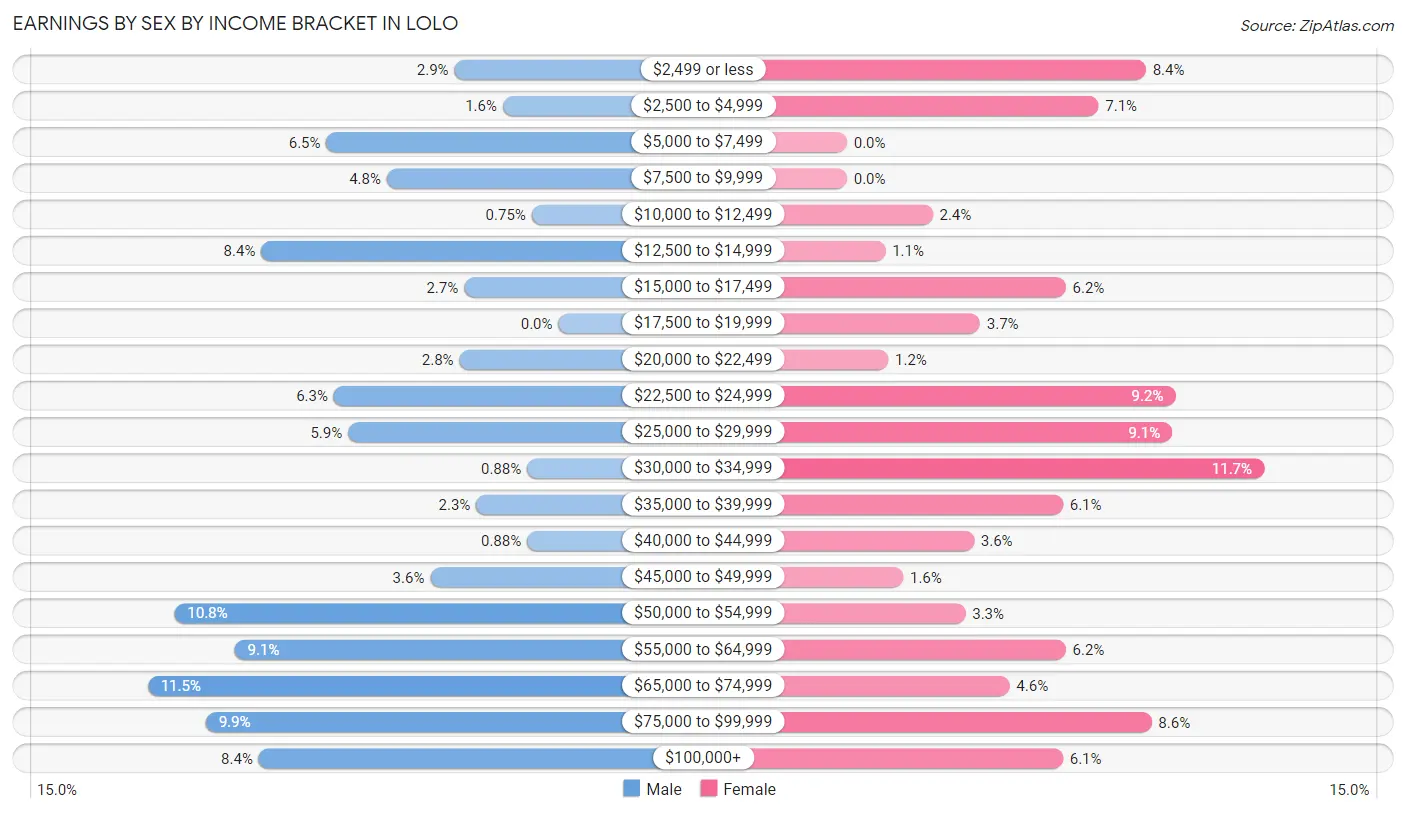
Earnings by Sex by Income Bracket in Lolo
The most common earnings brackets in Lolo are $65,000 to $74,999 for men (170 | 11.5%) and $30,000 to $34,999 for women (141 | 11.7%).
| Income | Male | Female |
| $2,499 or less | 43 (2.9%) | 101 (8.4%) |
| $2,500 to $4,999 | 23 (1.6%) | 85 (7.1%) |
| $5,000 to $7,499 | 96 (6.5%) | 0 (0.0%) |
| $7,500 to $9,999 | 71 (4.8%) | 0 (0.0%) |
| $10,000 to $12,499 | 11 (0.7%) | 29 (2.4%) |
| $12,500 to $14,999 | 123 (8.4%) | 13 (1.1%) |
| $15,000 to $17,499 | 39 (2.6%) | 74 (6.1%) |
| $17,500 to $19,999 | 0 (0.0%) | 45 (3.7%) |
| $20,000 to $22,499 | 41 (2.8%) | 14 (1.2%) |
| $22,500 to $24,999 | 93 (6.3%) | 111 (9.2%) |
| $25,000 to $29,999 | 87 (5.9%) | 110 (9.1%) |
| $30,000 to $34,999 | 13 (0.9%) | 141 (11.7%) |
| $35,000 to $39,999 | 34 (2.3%) | 73 (6.1%) |
| $40,000 to $44,999 | 13 (0.9%) | 43 (3.6%) |
| $45,000 to $49,999 | 53 (3.6%) | 19 (1.6%) |
| $50,000 to $54,999 | 159 (10.8%) | 40 (3.3%) |
| $55,000 to $64,999 | 134 (9.1%) | 74 (6.1%) |
| $65,000 to $74,999 | 170 (11.5%) | 55 (4.6%) |
| $75,000 to $99,999 | 146 (9.9%) | 103 (8.6%) |
| $100,000+ | 124 (8.4%) | 73 (6.1%) |
| Total | 1,473 (100.0%) | 1,203 (100.0%) |
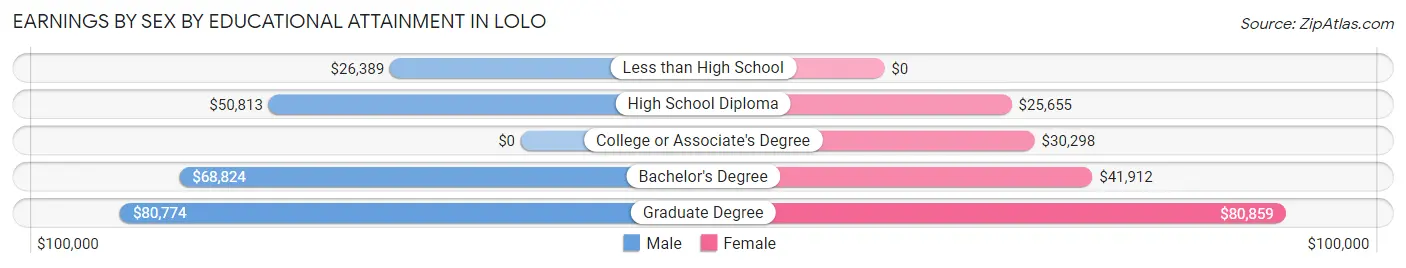
Earnings by Sex by Educational Attainment in Lolo
Average earnings in Lolo are $54,065 for men and $33,217 for women, a difference of 38.6%. Men with an educational attainment of graduate degree enjoy the highest average annual earnings of $80,774, while those with less than high school education earn the least with $26,389. Women with an educational attainment of graduate degree earn the most with the average annual earnings of $80,859, while those with high school diploma education have the smallest earnings of $25,655.
| Educational Attainment | Male Income | Female Income |
| Less than High School | $26,389 | $0 |
| High School Diploma | $50,813 | $25,655 |
| College or Associate's Degree | - | - |
| Bachelor's Degree | $68,824 | $41,912 |
| Graduate Degree | $80,774 | $80,859 |
| Total | $54,065 | $33,217 |
Family Income in Lolo
Family Income Brackets in Lolo
According to the Lolo family income data, there are 314 families falling into the $100,000 to $149,999 income range, which is the most common income bracket and makes up 24.9% of all families.
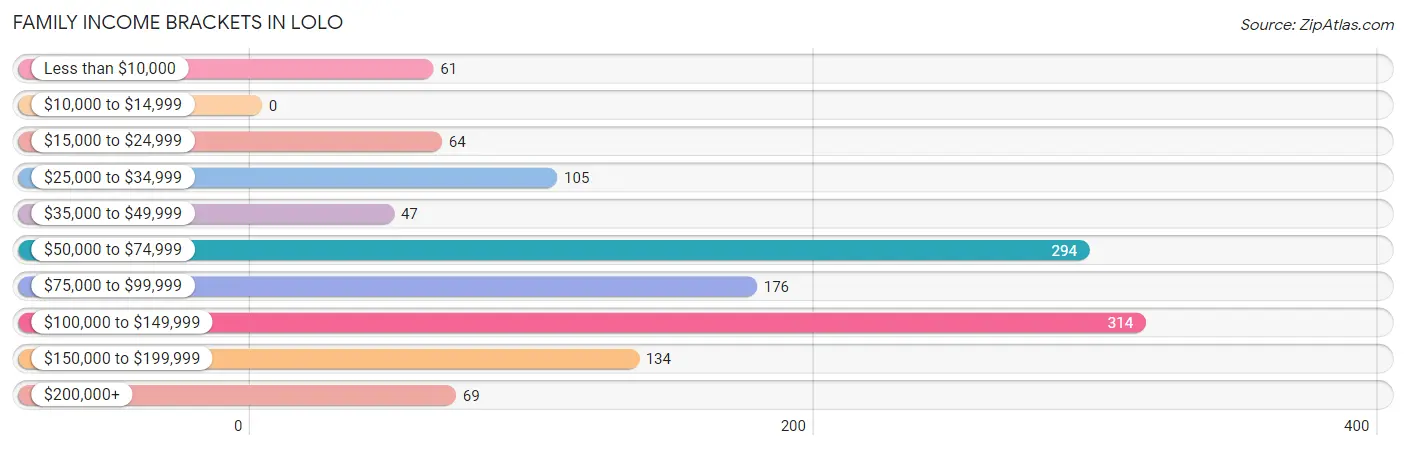
| Income Bracket | # Families | % Families |
| Less than $10,000 | 61 | 4.8% |
| $10,000 to $14,999 | 0 | 0.0% |
| $15,000 to $24,999 | 64 | 5.1% |
| $25,000 to $34,999 | 105 | 8.3% |
| $35,000 to $49,999 | 47 | 3.7% |
| $50,000 to $74,999 | 294 | 23.3% |
| $75,000 to $99,999 | 176 | 13.9% |
| $100,000 to $149,999 | 314 | 24.9% |
| $150,000 to $199,999 | 134 | 10.6% |
| $200,000+ | 69 | 5.5% |
Family Income by Famaliy Size in Lolo
2-person families (609 | 48.2%) account for the highest median family income in Lolo with $90,565 per family, while 2-person families (609 | 48.2%) have the highest median income of $45,282 per family member.
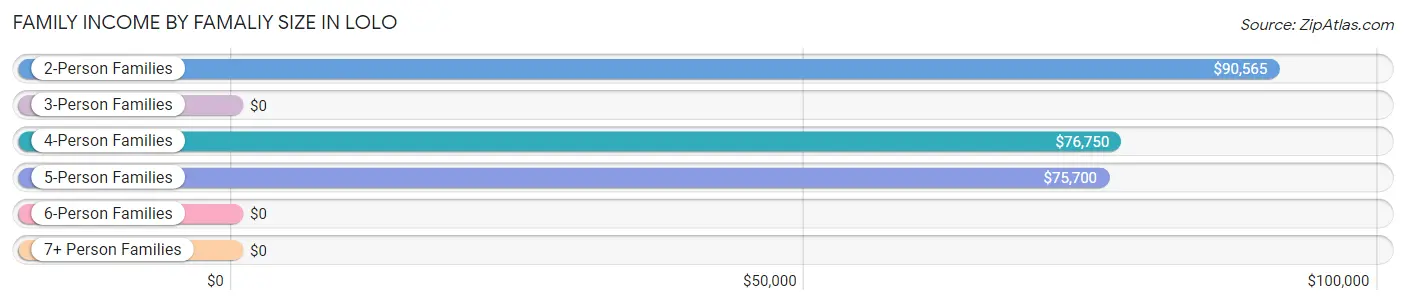
| Income Bracket | # Families | Median Income |
| 2-Person Families | 609 (48.2%) | $90,565 |
| 3-Person Families | 315 (24.9%) | $0 |
| 4-Person Families | 253 (20.0%) | $76,750 |
| 5-Person Families | 80 (6.3%) | $75,700 |
| 6-Person Families | 6 (0.5%) | $0 |
| 7+ Person Families | 0 (0.0%) | $0 |
| Total | 1,263 (100.0%) | $83,380 |
Family Income by Number of Earners in Lolo
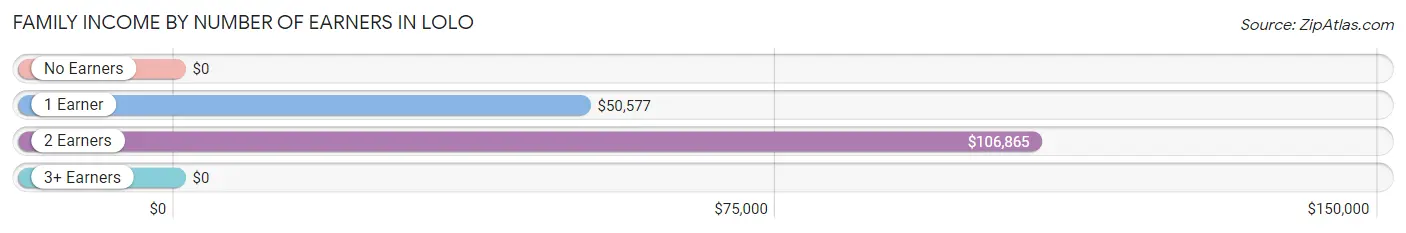
| Number of Earners | # Families | Median Income |
| No Earners | 62 (4.9%) | $0 |
| 1 Earner | 402 (31.8%) | $50,577 |
| 2 Earners | 751 (59.5%) | $106,865 |
| 3+ Earners | 48 (3.8%) | $0 |
| Total | 1,263 (100.0%) | $83,380 |
Household Income in Lolo
Household Income Brackets in Lolo
With 442 households falling in the category, the $50,000 to $74,999 income range is the most frequent in Lolo, accounting for 24.2% of all households. In contrast, only 80 households (4.4%) fall into the $200,000+ income bracket, making it the least populous group.
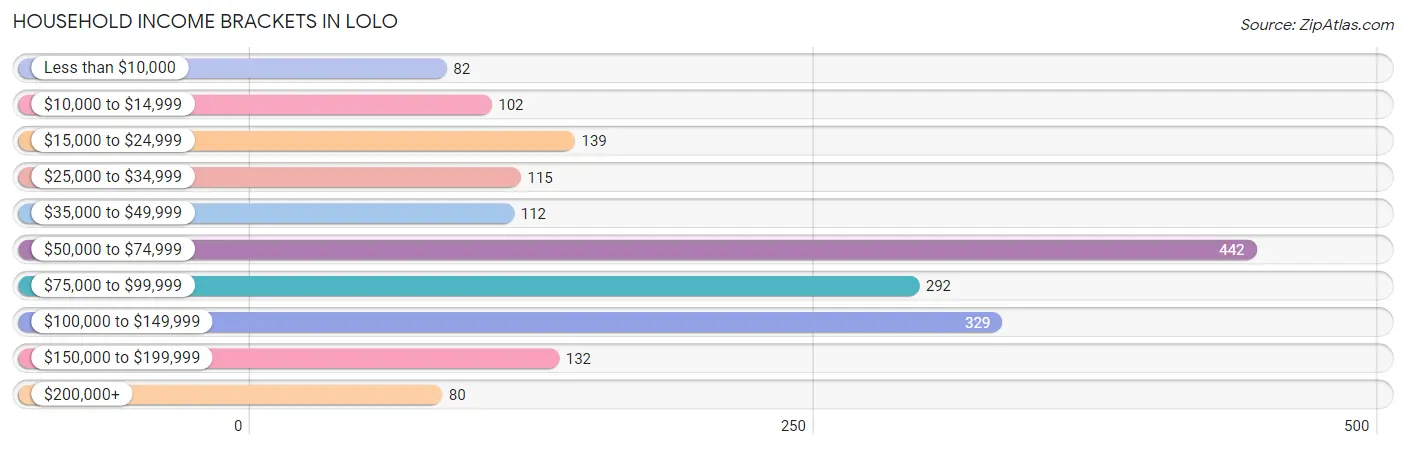
| Income Bracket | # Households | % Households |
| Less than $10,000 | 82 | 4.5% |
| $10,000 to $14,999 | 102 | 5.6% |
| $15,000 to $24,999 | 139 | 7.6% |
| $25,000 to $34,999 | 115 | 6.3% |
| $35,000 to $49,999 | 112 | 6.1% |
| $50,000 to $74,999 | 442 | 24.2% |
| $75,000 to $99,999 | 292 | 16.0% |
| $100,000 to $149,999 | 329 | 18.0% |
| $150,000 to $199,999 | 132 | 7.2% |
| $200,000+ | 80 | 4.4% |
Household Income by Householder Age in Lolo
The median household income in Lolo is $69,035, with the highest median household income of $105,040 found in the 45 to 64 years age bracket for the primary householder. A total of 634 households (34.7%) fall into this category. Meanwhile, the 15 to 24 years age bracket for the primary householder has the lowest median household income of $0, with 177 households (9.7%) in this group.
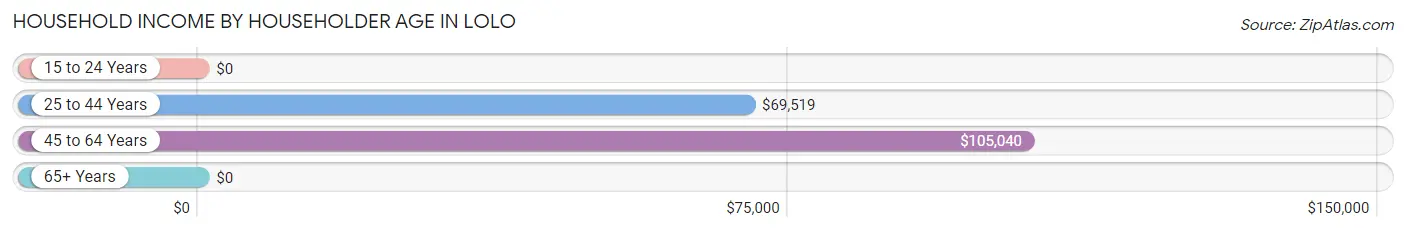
| Income Bracket | # Households | Median Income |
| 15 to 24 Years | 177 (9.7%) | $0 |
| 25 to 44 Years | 771 (42.2%) | $69,519 |
| 45 to 64 Years | 634 (34.7%) | $105,040 |
| 65+ Years | 246 (13.5%) | $0 |
| Total | 1,828 (100.0%) | $69,035 |
Poverty in Lolo
Income Below Poverty by Sex and Age in Lolo
With 10.1% poverty level for males and 7.6% for females among the residents of Lolo, 18 to 24 year old males and 75 year old and over females are the most vulnerable to poverty, with 193 males (88.9%) and 23 females (20.3%) in their respective age groups living below the poverty level.
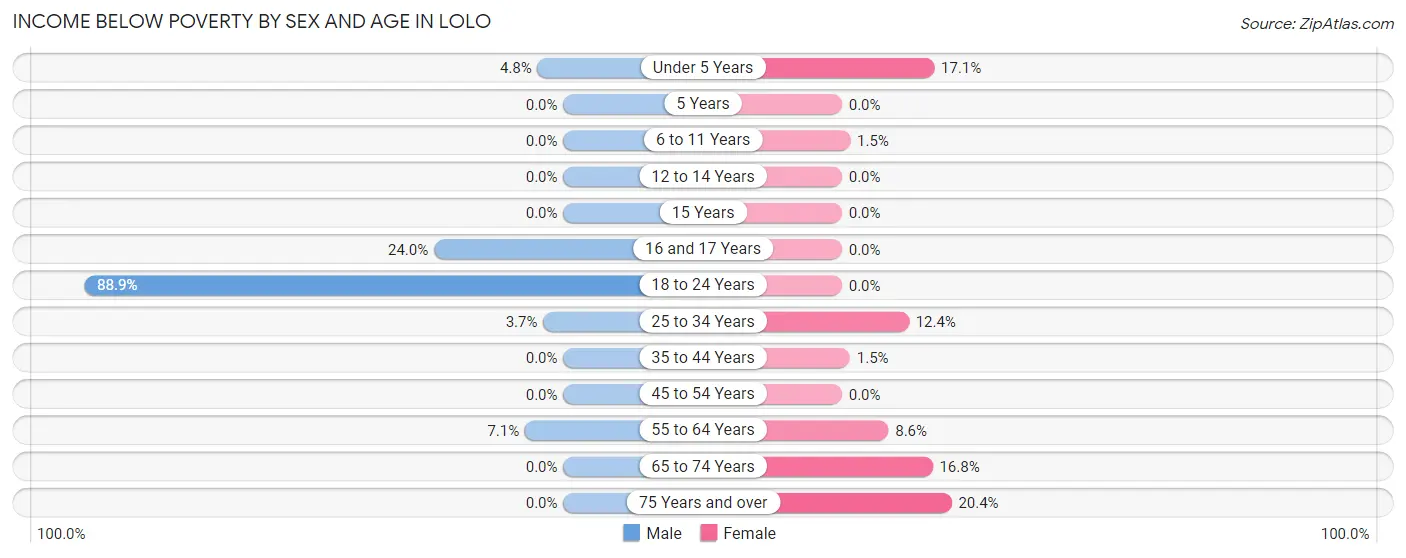
| Age Bracket | Male | Female |
| Under 5 Years | 15 (4.8%) | 36 (17.1%) |
| 5 Years | 0 (0.0%) | 0 (0.0%) |
| 6 to 11 Years | 0 (0.0%) | 4 (1.5%) |
| 12 to 14 Years | 0 (0.0%) | 0 (0.0%) |
| 15 Years | 0 (0.0%) | 0 (0.0%) |
| 16 and 17 Years | 6 (24.0%) | 0 (0.0%) |
| 18 to 24 Years | 193 (88.9%) | 0 (0.0%) |
| 25 to 34 Years | 17 (3.7%) | 60 (12.4%) |
| 35 to 44 Years | 0 (0.0%) | 4 (1.5%) |
| 45 to 54 Years | 0 (0.0%) | 0 (0.0%) |
| 55 to 64 Years | 17 (7.1%) | 17 (8.6%) |
| 65 to 74 Years | 0 (0.0%) | 17 (16.8%) |
| 75 Years and over | 0 (0.0%) | 23 (20.3%) |
| Total | 248 (10.1%) | 161 (7.6%) |
Income Above Poverty by Sex and Age in Lolo
According to the poverty statistics in Lolo, males aged 5 years and females aged 5 years are the age groups that are most secure financially, with 100.0% of males and 100.0% of females in these age groups living above the poverty line.
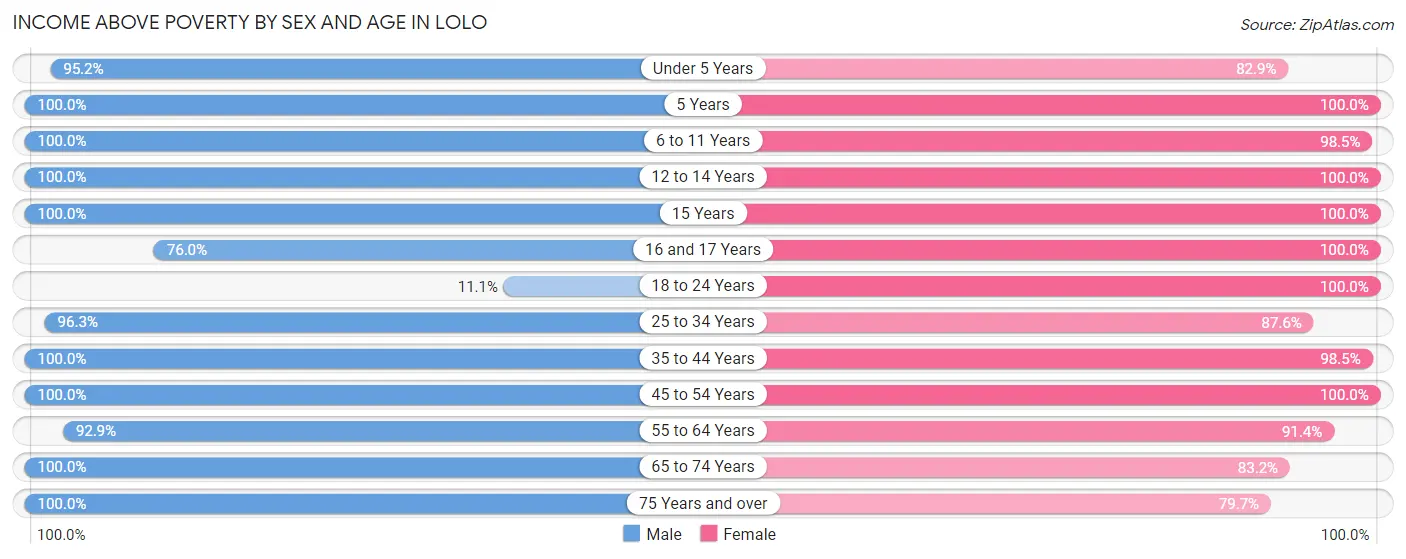
| Age Bracket | Male | Female |
| Under 5 Years | 299 (95.2%) | 174 (82.9%) |
| 5 Years | 44 (100.0%) | 37 (100.0%) |
| 6 to 11 Years | 95 (100.0%) | 256 (98.5%) |
| 12 to 14 Years | 140 (100.0%) | 69 (100.0%) |
| 15 Years | 49 (100.0%) | 61 (100.0%) |
| 16 and 17 Years | 19 (76.0%) | 29 (100.0%) |
| 18 to 24 Years | 24 (11.1%) | 150 (100.0%) |
| 25 to 34 Years | 439 (96.3%) | 423 (87.6%) |
| 35 to 44 Years | 330 (100.0%) | 263 (98.5%) |
| 45 to 54 Years | 361 (100.0%) | 147 (100.0%) |
| 55 to 64 Years | 222 (92.9%) | 180 (91.4%) |
| 65 to 74 Years | 93 (100.0%) | 84 (83.2%) |
| 75 Years and over | 86 (100.0%) | 90 (79.6%) |
| Total | 2,201 (89.9%) | 1,963 (92.4%) |
Income Below Poverty Among Married-Couple Families in Lolo
The poverty statistics for married-couple families in Lolo show that 1.8% or 17 of the total 932 families live below the poverty line. Families with no children have the highest poverty rate of 3.5%, comprising of 17 families. On the other hand, families with 1 or 2 children have the lowest poverty rate of 0.0%, which includes 0 families.
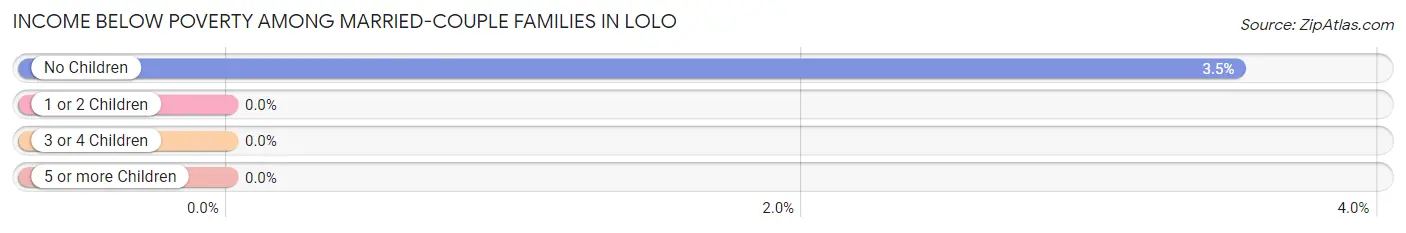
| Children | Above Poverty | Below Poverty |
| No Children | 468 (96.5%) | 17 (3.5%) |
| 1 or 2 Children | 366 (100.0%) | 0 (0.0%) |
| 3 or 4 Children | 81 (100.0%) | 0 (0.0%) |
| 5 or more Children | 0 (0.0%) | 0 (0.0%) |
| Total | 915 (98.2%) | 17 (1.8%) |
Income Below Poverty Among Single-Parent Households in Lolo
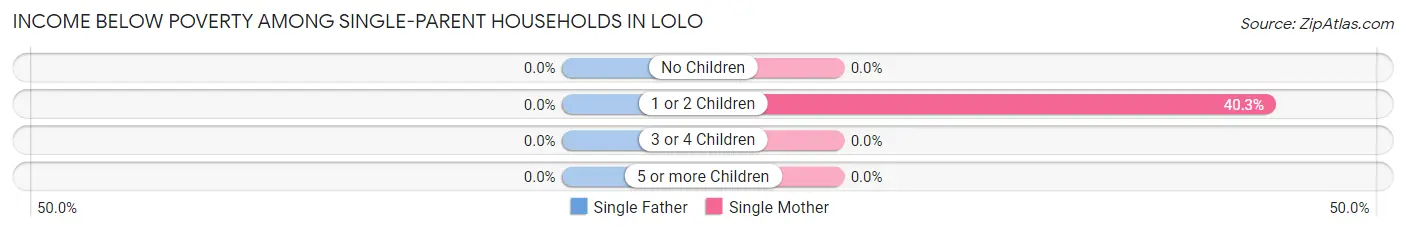
| Children | Single Father | Single Mother |
| No Children | 0 (0.0%) | 0 (0.0%) |
| 1 or 2 Children | 0 (0.0%) | 64 (40.3%) |
| 3 or 4 Children | 0 (0.0%) | 0 (0.0%) |
| 5 or more Children | 0 (0.0%) | 0 (0.0%) |
| Total | 0 (0.0%) | 64 (25.3%) |
Income Below Poverty Among Married-Couple vs Single-Parent Households in Lolo
The poverty data for Lolo shows that 17 of the married-couple family households (1.8%) and 64 of the single-parent households (19.3%) are living below the poverty level. Within the married-couple family households, those with no children have the highest poverty rate, with 17 households (3.5%) falling below the poverty line. Among the single-parent households, those with 1 or 2 children have the highest poverty rate, with 64 household (31.4%) living below poverty.
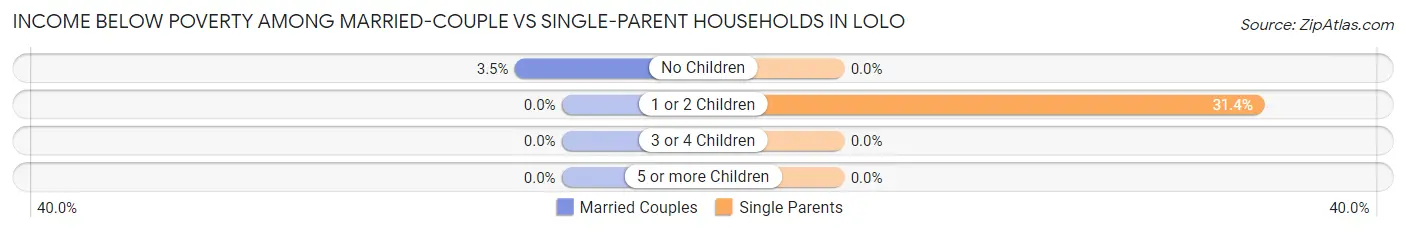
| Children | Married-Couple Families | Single-Parent Households |
| No Children | 17 (3.5%) | 0 (0.0%) |
| 1 or 2 Children | 0 (0.0%) | 64 (31.4%) |
| 3 or 4 Children | 0 (0.0%) | 0 (0.0%) |
| 5 or more Children | 0 (0.0%) | 0 (0.0%) |
| Total | 17 (1.8%) | 64 (19.3%) |
Race in Lolo
The most populous races in Lolo are White / Caucasian (4,388 | 96.0%), Two or more Races (137 | 3.0%), and Hispanic or Latino (94 | 2.1%).
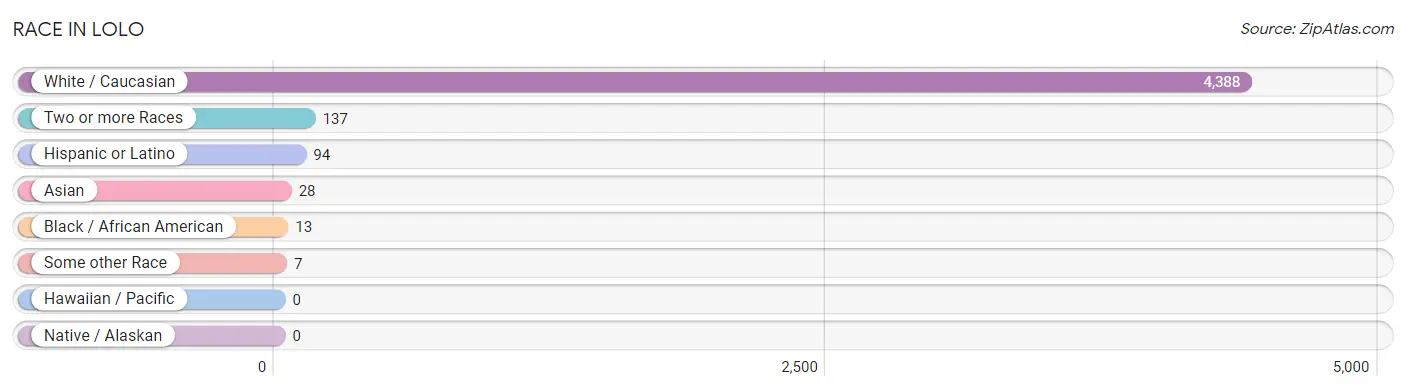
| Race | # Population | % Population |
| Asian | 28 | 0.6% |
| Black / African American | 13 | 0.3% |
| Hawaiian / Pacific | 0 | 0.0% |
| Hispanic or Latino | 94 | 2.1% |
| Native / Alaskan | 0 | 0.0% |
| White / Caucasian | 4,388 | 96.0% |
| Two or more Races | 137 | 3.0% |
| Some other Race | 7 | 0.2% |
| Total | 4,573 | 100.0% |
Ancestry in Lolo
The most populous ancestries reported in Lolo are German (1,032 | 22.6%), Irish (756 | 16.5%), English (565 | 12.4%), Scottish (307 | 6.7%), and Norwegian (255 | 5.6%), together accounting for 63.8% of all Lolo residents.
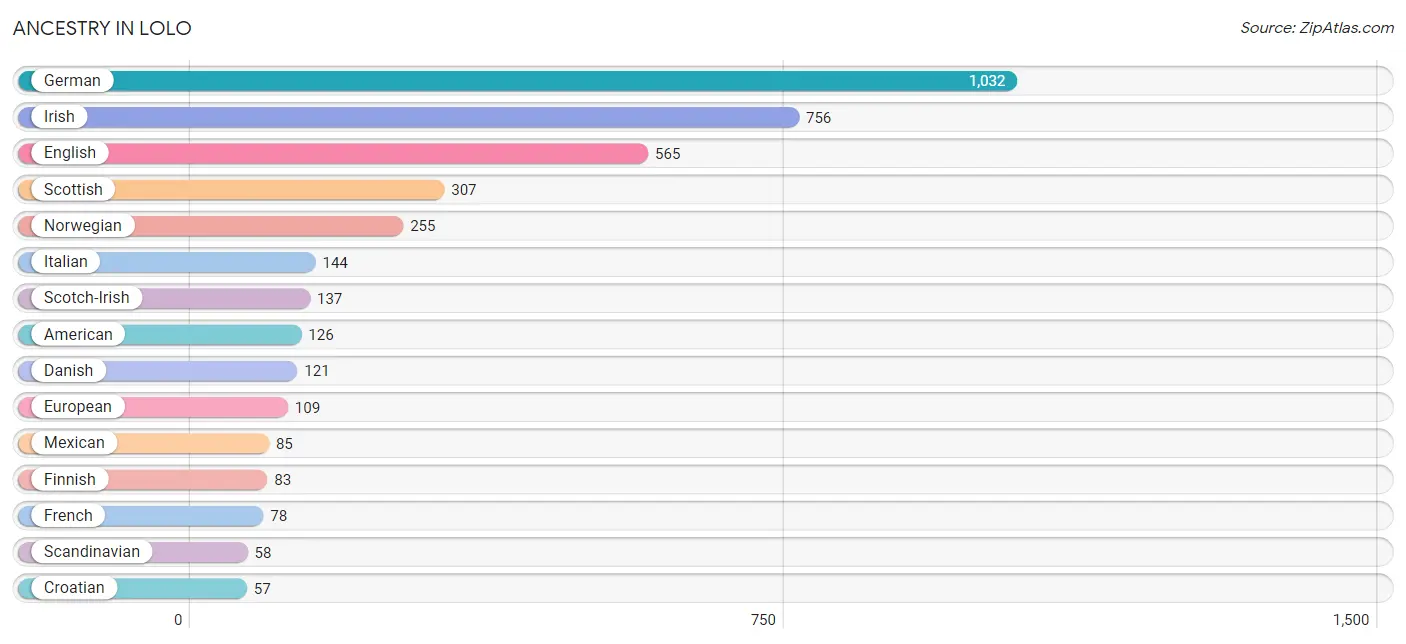
| Ancestry | # Population | % Population |
| American | 126 | 2.8% |
| Armenian | 30 | 0.7% |
| Australian | 9 | 0.2% |
| Bhutanese | 38 | 0.8% |
| Cherokee | 40 | 0.9% |
| Croatian | 57 | 1.3% |
| Danish | 121 | 2.6% |
| Dutch | 50 | 1.1% |
| English | 565 | 12.4% |
| European | 109 | 2.4% |
| Finnish | 83 | 1.8% |
| French | 78 | 1.7% |
| German | 1,032 | 22.6% |
| Greek | 32 | 0.7% |
| Irish | 756 | 16.5% |
| Italian | 144 | 3.2% |
| Korean | 28 | 0.6% |
| Maltese | 10 | 0.2% |
| Mexican | 85 | 1.9% |
| Navajo | 28 | 0.6% |
| Norwegian | 255 | 5.6% |
| Polish | 38 | 0.8% |
| Scandinavian | 58 | 1.3% |
| Scotch-Irish | 137 | 3.0% |
| Scottish | 307 | 6.7% |
| Spanish | 9 | 0.2% |
| Swedish | 54 | 1.2% |
| Swiss | 10 | 0.2% |
| Ukrainian | 20 | 0.4% |
| Welsh | 42 | 0.9% |
| Yakama | 11 | 0.2% | View All 31 Rows |
Immigrants in Lolo
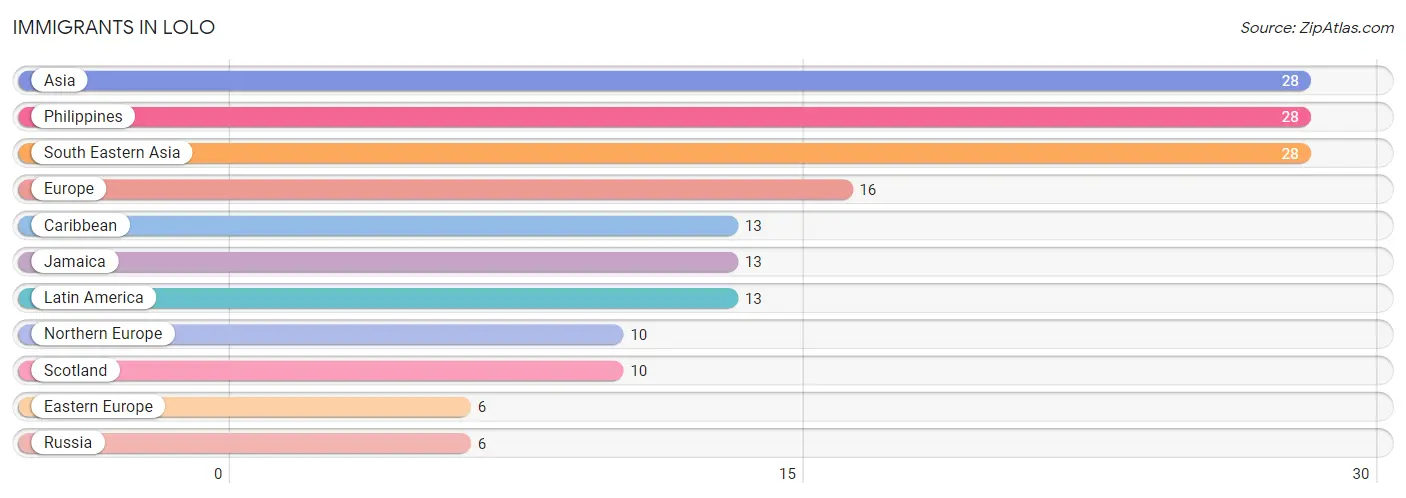
The most numerous immigrant groups reported in Lolo came from Asia (28 | 0.6%), Philippines (28 | 0.6%), South Eastern Asia (28 | 0.6%), Europe (16 | 0.4%), and Caribbean (13 | 0.3%), together accounting for 2.5% of all Lolo residents.
| Immigration Origin | # Population | % Population |
| Asia | 28 | 0.6% |
| Caribbean | 13 | 0.3% |
| Eastern Europe | 6 | 0.1% |
| Europe | 16 | 0.4% |
| Jamaica | 13 | 0.3% |
| Latin America | 13 | 0.3% |
| Northern Europe | 10 | 0.2% |
| Philippines | 28 | 0.6% |
| Russia | 6 | 0.1% |
| Scotland | 10 | 0.2% |
| South Eastern Asia | 28 | 0.6% | View All 11 Rows |
Sex and Age in Lolo
Sex and Age in Lolo
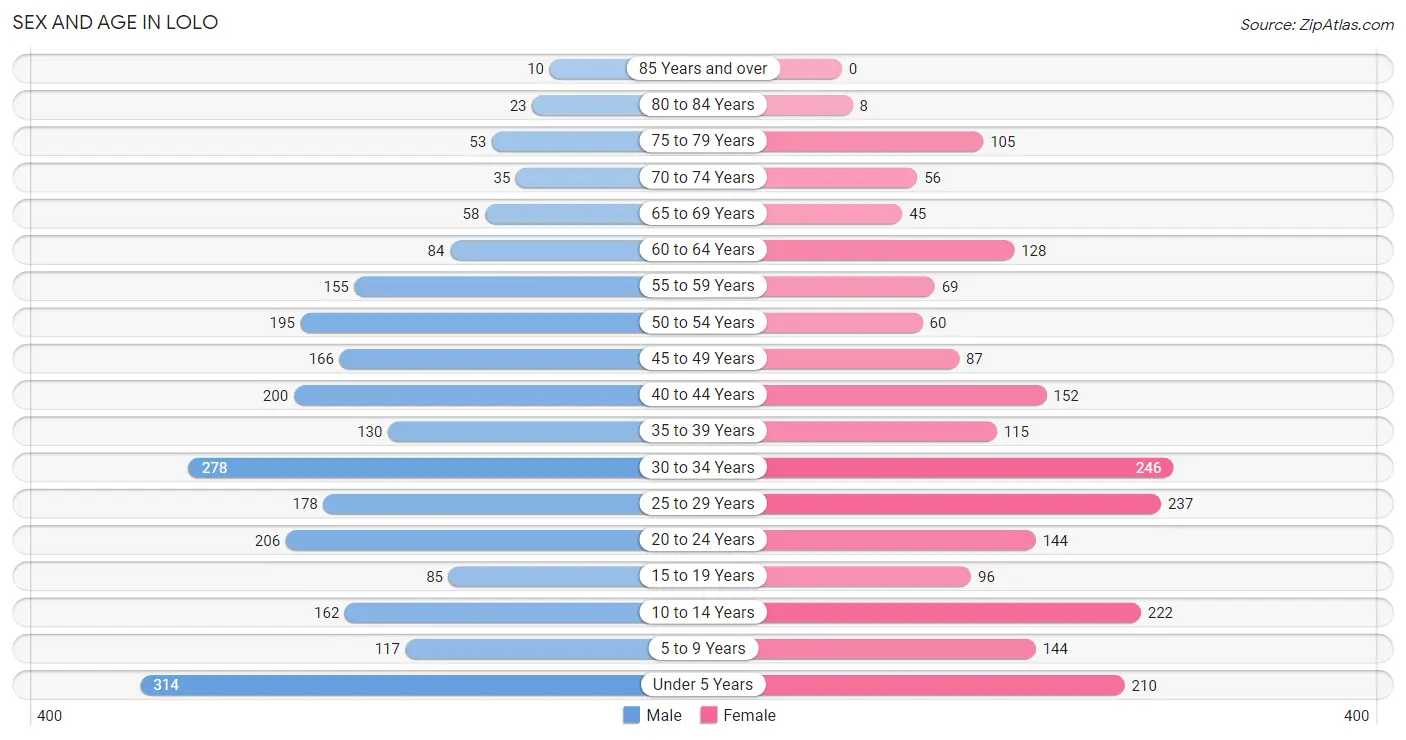
The most populous age groups in Lolo are Under 5 Years (314 | 12.8%) for men and 30 to 34 Years (246 | 11.6%) for women.
| Age Bracket | Male | Female |
| Under 5 Years | 314 (12.8%) | 210 (9.9%) |
| 5 to 9 Years | 117 (4.8%) | 144 (6.8%) |
| 10 to 14 Years | 162 (6.6%) | 222 (10.4%) |
| 15 to 19 Years | 85 (3.5%) | 96 (4.5%) |
| 20 to 24 Years | 206 (8.4%) | 144 (6.8%) |
| 25 to 29 Years | 178 (7.3%) | 237 (11.2%) |
| 30 to 34 Years | 278 (11.4%) | 246 (11.6%) |
| 35 to 39 Years | 130 (5.3%) | 115 (5.4%) |
| 40 to 44 Years | 200 (8.2%) | 152 (7.2%) |
| 45 to 49 Years | 166 (6.8%) | 87 (4.1%) |
| 50 to 54 Years | 195 (8.0%) | 60 (2.8%) |
| 55 to 59 Years | 155 (6.3%) | 69 (3.3%) |
| 60 to 64 Years | 84 (3.4%) | 128 (6.0%) |
| 65 to 69 Years | 58 (2.4%) | 45 (2.1%) |
| 70 to 74 Years | 35 (1.4%) | 56 (2.6%) |
| 75 to 79 Years | 53 (2.2%) | 105 (4.9%) |
| 80 to 84 Years | 23 (0.9%) | 8 (0.4%) |
| 85 Years and over | 10 (0.4%) | 0 (0.0%) |
| Total | 2,449 (100.0%) | 2,124 (100.0%) |
Families and Households in Lolo
Median Family Size in Lolo
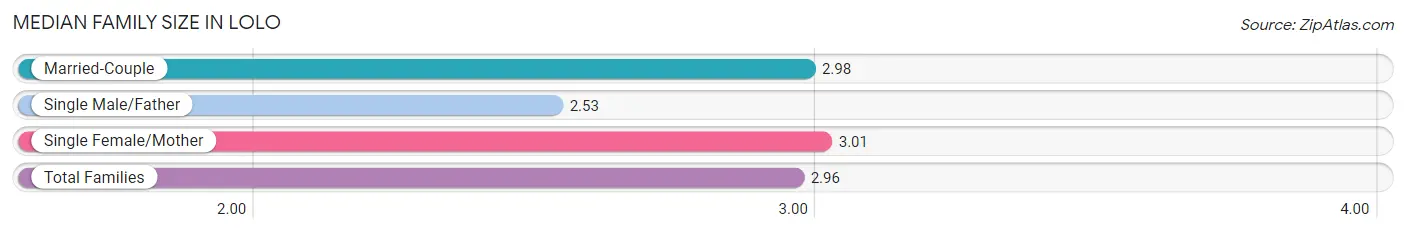
The median family size in Lolo is 2.96 persons per family, with single female/mother families (253 | 20.0%) accounting for the largest median family size of 3.01 persons per family. On the other hand, single male/father families (78 | 6.2%) represent the smallest median family size with 2.53 persons per family.
| Family Type | # Families | Family Size |
| Married-Couple | 932 (73.8%) | 2.98 |
| Single Male/Father | 78 (6.2%) | 2.53 |
| Single Female/Mother | 253 (20.0%) | 3.01 |
| Total Families | 1,263 (100.0%) | 2.96 |
Median Household Size in Lolo
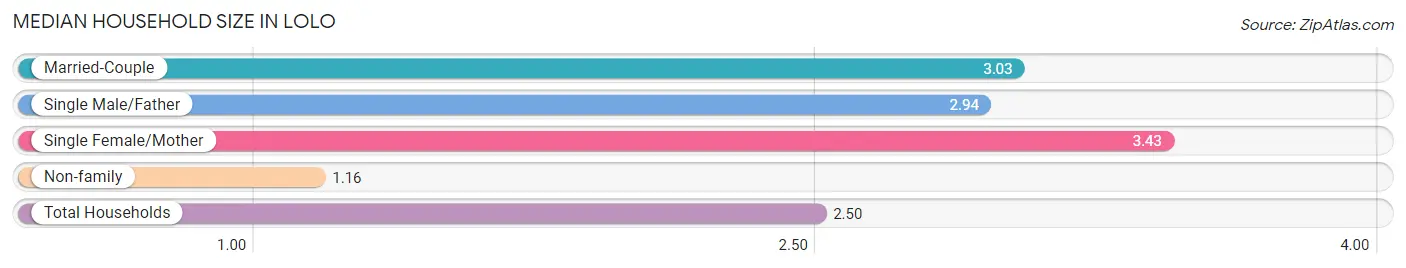
The median household size in Lolo is 2.50 persons per household, with single female/mother households (253 | 13.8%) accounting for the largest median household size of 3.43 persons per household. non-family households (565 | 30.9%) represent the smallest median household size with 1.16 persons per household.
| Household Type | # Households | Household Size |
| Married-Couple | 932 (51.0%) | 3.03 |
| Single Male/Father | 78 (4.3%) | 2.94 |
| Single Female/Mother | 253 (13.8%) | 3.43 |
| Non-family | 565 (30.9%) | 1.16 |
| Total Households | 1,828 (100.0%) | 2.50 |
Household Size by Marriage Status in Lolo
Out of a total of 1,828 households in Lolo, 1,263 (69.1%) are family households, while 565 (30.9%) are nonfamily households. The most numerous type of family households are 2-person households, comprising 583, and the most common type of nonfamily households are 1-person households, comprising 491.
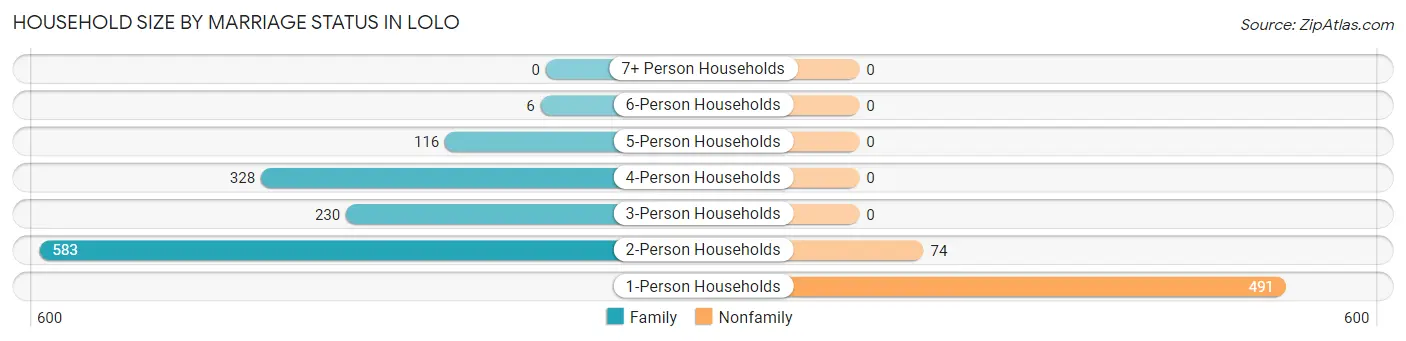
| Household Size | Family Households | Nonfamily Households |
| 1-Person Households | - | 491 (26.9%) |
| 2-Person Households | 583 (31.9%) | 74 (4.1%) |
| 3-Person Households | 230 (12.6%) | 0 (0.0%) |
| 4-Person Households | 328 (17.9%) | 0 (0.0%) |
| 5-Person Households | 116 (6.4%) | 0 (0.0%) |
| 6-Person Households | 6 (0.3%) | 0 (0.0%) |
| 7+ Person Households | 0 (0.0%) | 0 (0.0%) |
| Total | 1,263 (69.1%) | 565 (30.9%) |
Female Fertility in Lolo
Fertility by Age in Lolo
Average fertility rate in Lolo is 132.0 births per 1,000 women. Women in the age bracket of 20 to 34 years have the highest fertility rate with 215.0 births per 1,000 women. Women in the age bracket of 20 to 34 years acount for 91.2% of all women with births.
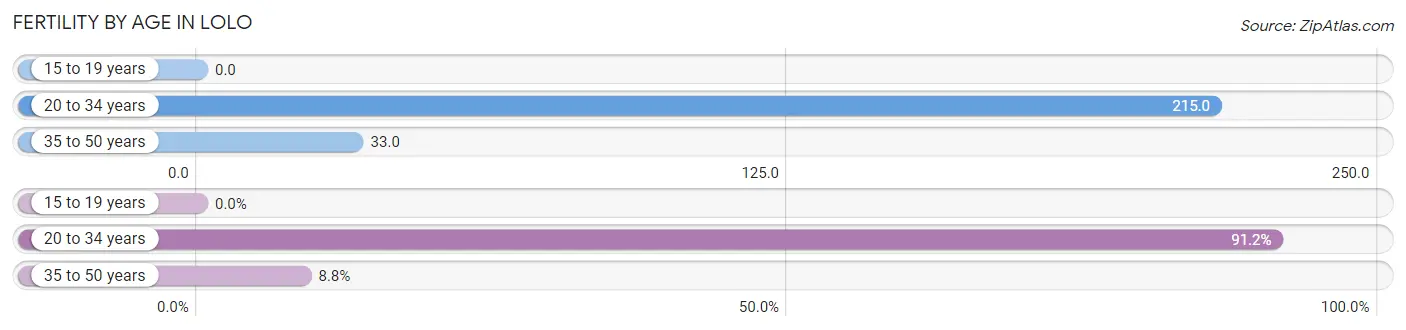
| Age Bracket | Women with Births | Births / 1,000 Women |
| 15 to 19 years | 0 (0.0%) | 0.0 |
| 20 to 34 years | 135 (91.2%) | 215.0 |
| 35 to 50 years | 13 (8.8%) | 33.0 |
| Total | 148 (100.0%) | 132.0 |
Fertility by Age by Marriage Status in Lolo
37.2% of women with births (148) in Lolo are married. The highest percentage of unmarried women with births falls into 35 to 50 years age bracket with 100.0% of them unmarried at the time of birth, while the lowest percentage of unmarried women with births belong to 20 to 34 years age bracket with 59.3% of them unmarried.
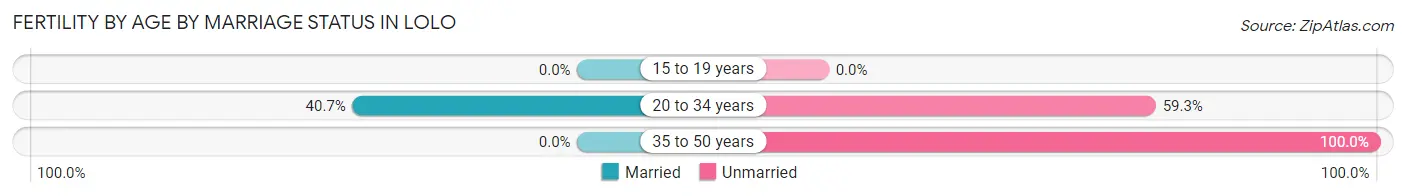
| Age Bracket | Married | Unmarried |
| 15 to 19 years | 0 (0.0%) | 0 (0.0%) |
| 20 to 34 years | 55 (40.7%) | 80 (59.3%) |
| 35 to 50 years | 0 (0.0%) | 13 (100.0%) |
| Total | 55 (37.2%) | 93 (62.8%) |
Fertility by Education in Lolo
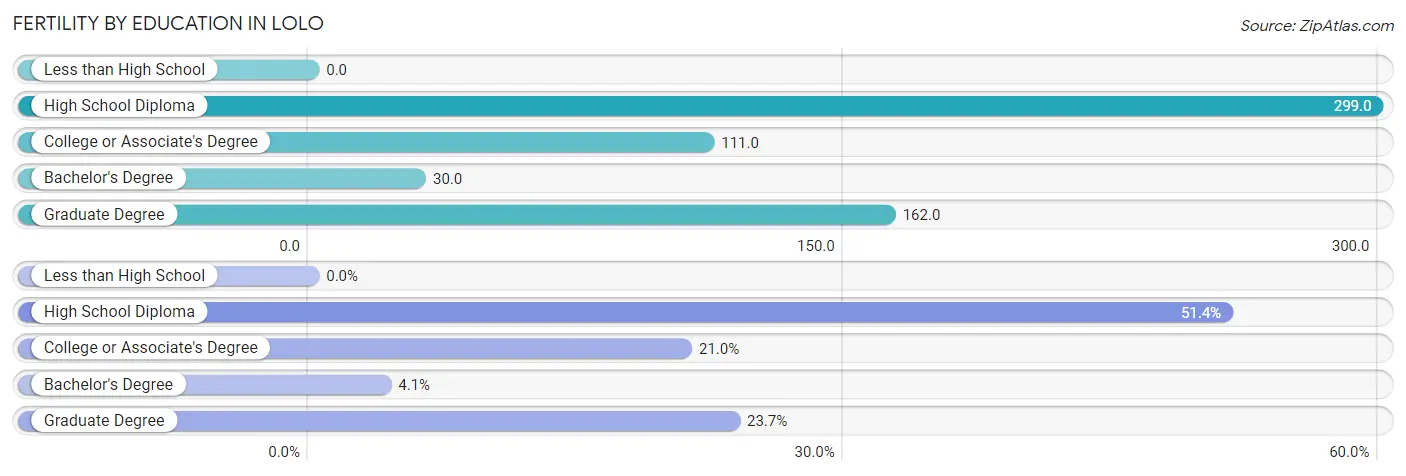
| Educational Attainment | Women with Births | Births / 1,000 Women |
| Less than High School | 0 (0.0%) | 0.0 |
| High School Diploma | 76 (51.3%) | 299.0 |
| College or Associate's Degree | 31 (20.9%) | 111.0 |
| Bachelor's Degree | 6 (4.1%) | 30.0 |
| Graduate Degree | 35 (23.6%) | 162.0 |
| Total | 148 (100.0%) | 132.0 |
Fertility by Education by Marriage Status in Lolo
62.8% of women with births in Lolo are unmarried. Women with the educational attainment of college or associate's degree are most likely to be married with 100.0% of them married at childbirth, while women with the educational attainment of high school diploma are least likely to be married with 100.0% of them unmarried at childbirth.
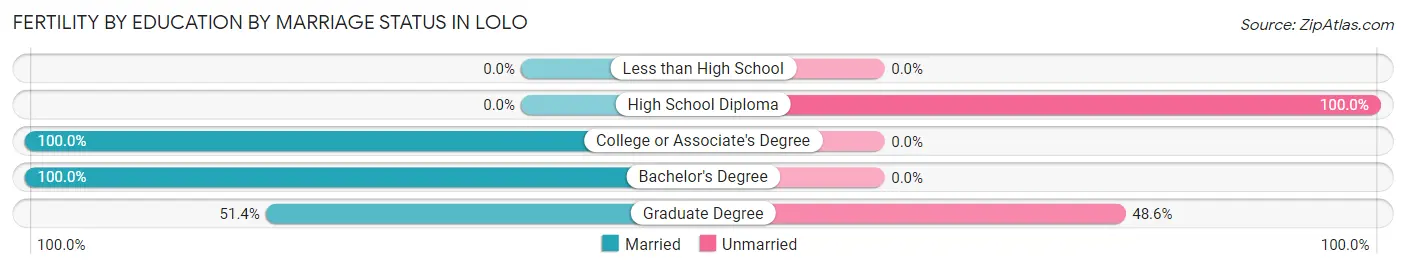
| Educational Attainment | Married | Unmarried |
| Less than High School | 0 (0.0%) | 0 (0.0%) |
| High School Diploma | 0 (0.0%) | 76 (100.0%) |
| College or Associate's Degree | 31 (100.0%) | 0 (0.0%) |
| Bachelor's Degree | 6 (100.0%) | 0 (0.0%) |
| Graduate Degree | 18 (51.4%) | 17 (48.6%) |
| Total | 55 (37.2%) | 93 (62.8%) |
Employment Characteristics in Lolo
Employment by Class of Employer in Lolo
Among the 2,250 employed individuals in Lolo, private company employees (1,536 | 68.3%), local government employees (204 | 9.1%), and state government employees (172 | 7.6%) make up the most common classes of employment.
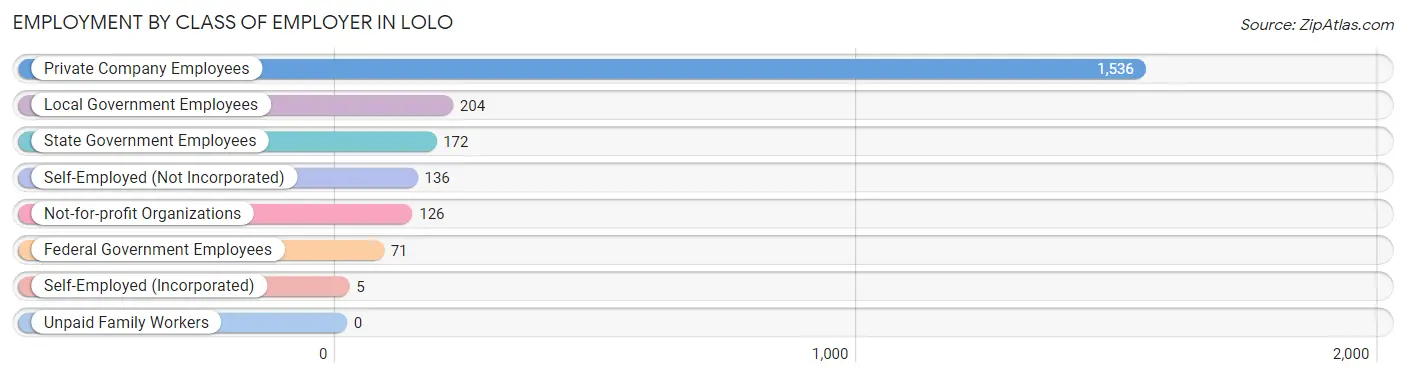
| Employer Class | # Employees | % Employees |
| Private Company Employees | 1,536 | 68.3% |
| Self-Employed (Incorporated) | 5 | 0.2% |
| Self-Employed (Not Incorporated) | 136 | 6.0% |
| Not-for-profit Organizations | 126 | 5.6% |
| Local Government Employees | 204 | 9.1% |
| State Government Employees | 172 | 7.6% |
| Federal Government Employees | 71 | 3.2% |
| Unpaid Family Workers | 0 | 0.0% |
| Total | 2,250 | 100.0% |
Employment Status by Age in Lolo
According to the labor force statistics for Lolo, out of the total population over 16 years of age (3,294), 69.5% or 2,289 individuals are in the labor force, with 1.0% or 23 of them unemployed. The age group with the highest labor force participation rate is 25 to 29 years, with 98.8% or 410 individuals in the labor force. Within the labor force, the 20 to 24 years age range has the highest percentage of unemployed individuals, with 15.3% or 24 of them being unemployed.
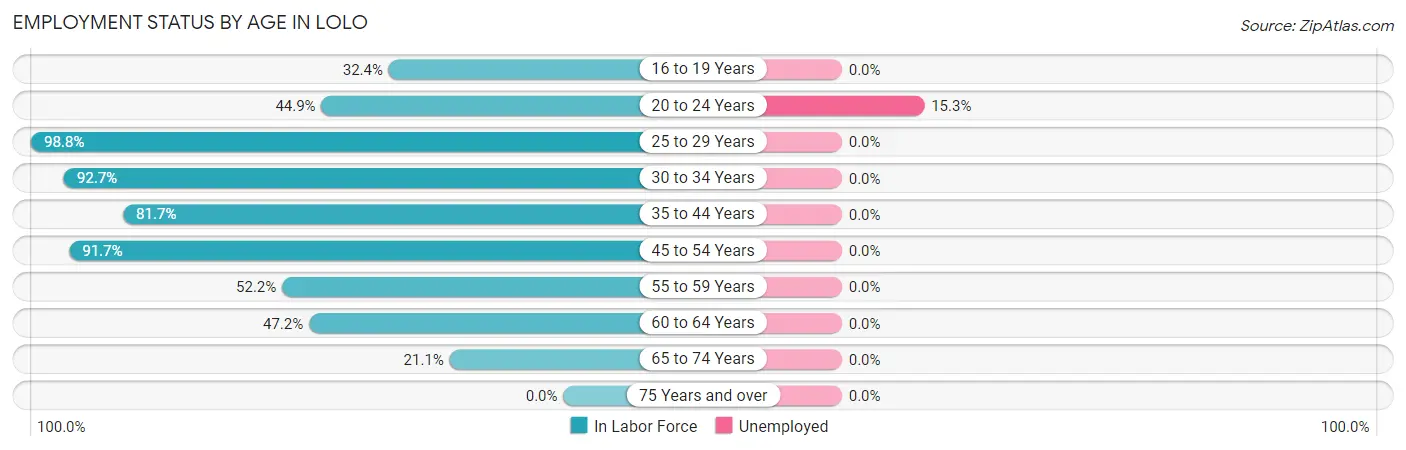
| Age Bracket | In Labor Force | Unemployed |
| 16 to 19 Years | 23 (32.4%) | 0 (0.0%) |
| 20 to 24 Years | 157 (44.9%) | 24 (15.3%) |
| 25 to 29 Years | 410 (98.8%) | 0 (0.0%) |
| 30 to 34 Years | 486 (92.7%) | 0 (0.0%) |
| 35 to 44 Years | 488 (81.7%) | 0 (0.0%) |
| 45 to 54 Years | 466 (91.7%) | 0 (0.0%) |
| 55 to 59 Years | 117 (52.2%) | 0 (0.0%) |
| 60 to 64 Years | 100 (47.2%) | 0 (0.0%) |
| 65 to 74 Years | 41 (21.1%) | 0 (0.0%) |
| 75 Years and over | 0 (0.0%) | 0 (0.0%) |
| Total | 2,289 (69.5%) | 23 (1.0%) |
Employment Status by Educational Attainment in Lolo
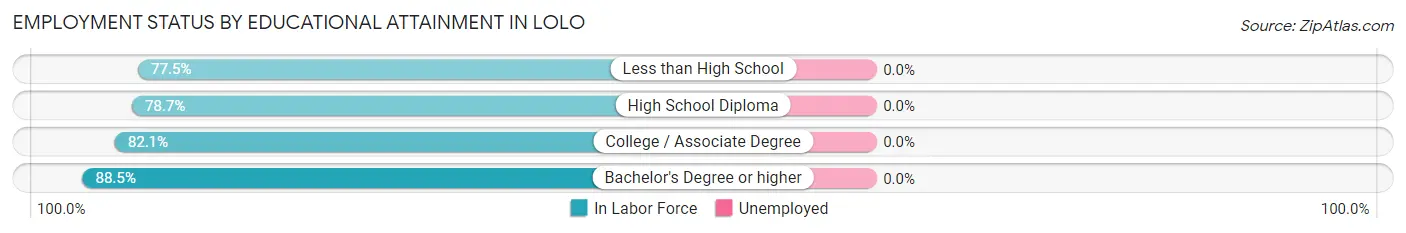
| Educational Attainment | In Labor Force | Unemployed |
| Less than High School | 158 (77.5%) | 0 (0.0%) |
| High School Diploma | 425 (78.7%) | 0 (0.0%) |
| College / Associate Degree | 670 (82.1%) | 0 (0.0%) |
| Bachelor's Degree or higher | 814 (88.5%) | 0 (0.0%) |
| Total | 2,066 (83.3%) | 0 (0.0%) |
Employment Occupations by Sex in Lolo
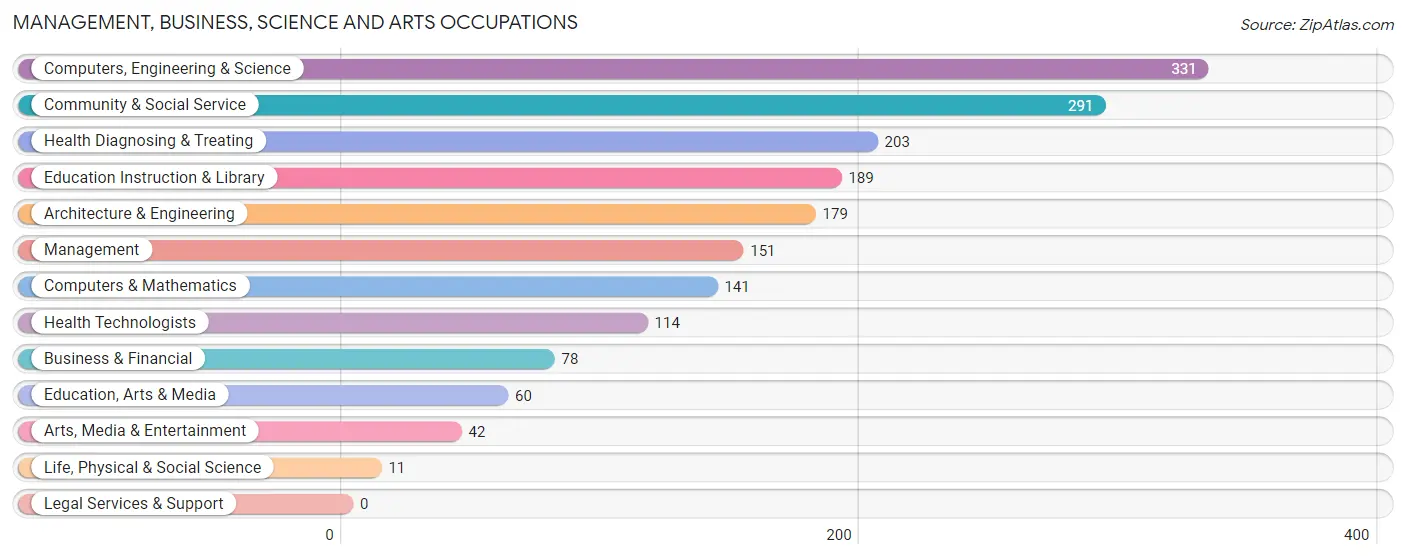
Management, Business, Science and Arts Occupations
The most common Management, Business, Science and Arts occupations in Lolo are Computers, Engineering & Science (331 | 14.6%), Community & Social Service (291 | 12.9%), Health Diagnosing & Treating (203 | 9.0%), Education Instruction & Library (189 | 8.4%), and Architecture & Engineering (179 | 7.9%).
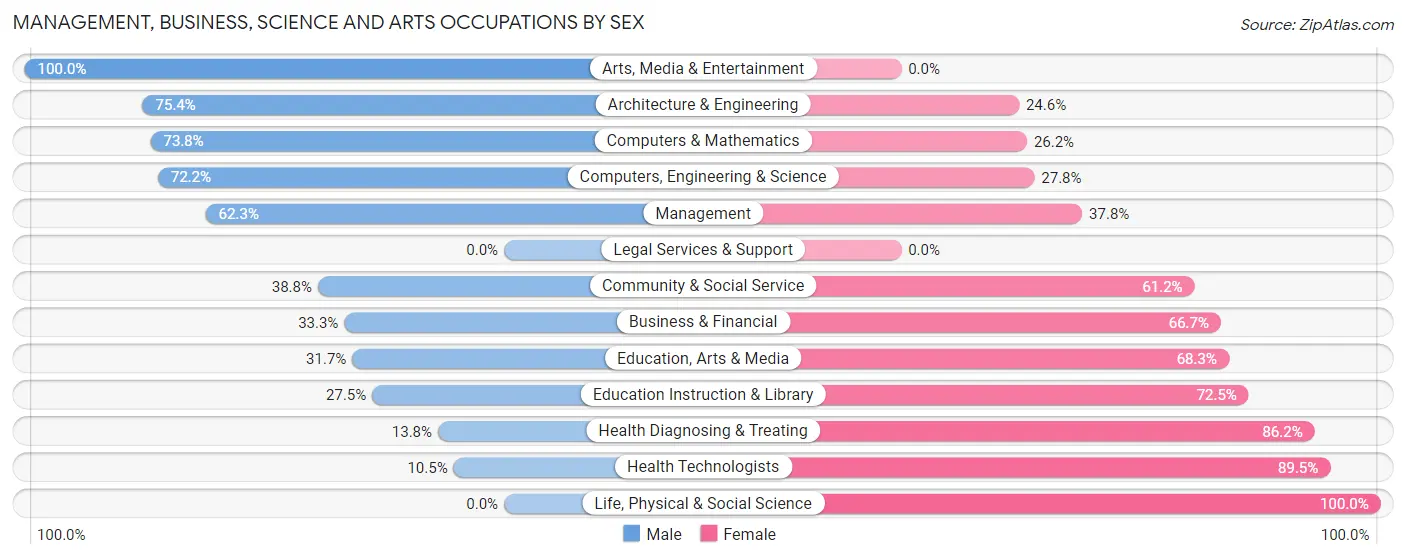
Management, Business, Science and Arts Occupations by Sex
Within the Management, Business, Science and Arts occupations in Lolo, the most male-oriented occupations are Arts, Media & Entertainment (100.0%), Architecture & Engineering (75.4%), and Computers & Mathematics (73.8%), while the most female-oriented occupations are Life, Physical & Social Science (100.0%), Health Technologists (89.5%), and Health Diagnosing & Treating (86.2%).
| Occupation | Male | Female |
| Management | 94 (62.3%) | 57 (37.8%) |
| Business & Financial | 26 (33.3%) | 52 (66.7%) |
| Computers, Engineering & Science | 239 (72.2%) | 92 (27.8%) |
| Computers & Mathematics | 104 (73.8%) | 37 (26.2%) |
| Architecture & Engineering | 135 (75.4%) | 44 (24.6%) |
| Life, Physical & Social Science | 0 (0.0%) | 11 (100.0%) |
| Community & Social Service | 113 (38.8%) | 178 (61.2%) |
| Education, Arts & Media | 19 (31.7%) | 41 (68.3%) |
| Legal Services & Support | 0 (0.0%) | 0 (0.0%) |
| Education Instruction & Library | 52 (27.5%) | 137 (72.5%) |
| Arts, Media & Entertainment | 42 (100.0%) | 0 (0.0%) |
| Health Diagnosing & Treating | 28 (13.8%) | 175 (86.2%) |
| Health Technologists | 12 (10.5%) | 102 (89.5%) |
| Total (Category) | 500 (47.4%) | 554 (52.6%) |
| Total (Overall) | 1,175 (51.9%) | 1,089 (48.1%) |
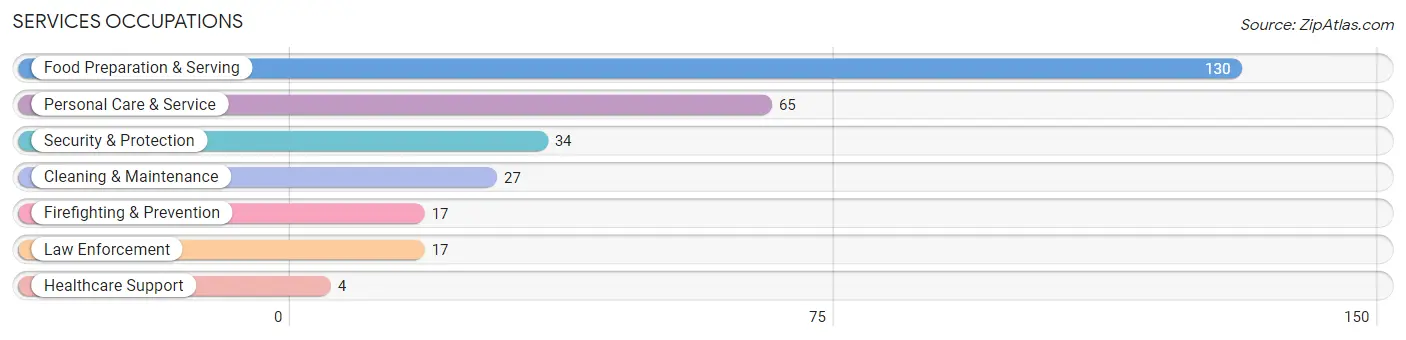
Services Occupations
The most common Services occupations in Lolo are Food Preparation & Serving (130 | 5.7%), Personal Care & Service (65 | 2.9%), Security & Protection (34 | 1.5%), Cleaning & Maintenance (27 | 1.2%), and Firefighting & Prevention (17 | 0.7%).
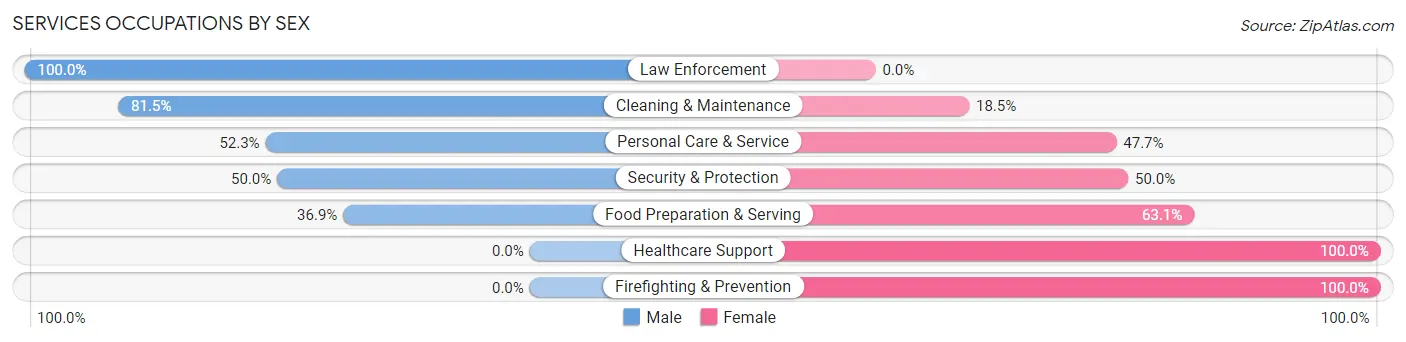
Services Occupations by Sex
Within the Services occupations in Lolo, the most male-oriented occupations are Law Enforcement (100.0%), Cleaning & Maintenance (81.5%), and Personal Care & Service (52.3%), while the most female-oriented occupations are Healthcare Support (100.0%), Firefighting & Prevention (100.0%), and Food Preparation & Serving (63.1%).
| Occupation | Male | Female |
| Healthcare Support | 0 (0.0%) | 4 (100.0%) |
| Security & Protection | 17 (50.0%) | 17 (50.0%) |
| Firefighting & Prevention | 0 (0.0%) | 17 (100.0%) |
| Law Enforcement | 17 (100.0%) | 0 (0.0%) |
| Food Preparation & Serving | 48 (36.9%) | 82 (63.1%) |
| Cleaning & Maintenance | 22 (81.5%) | 5 (18.5%) |
| Personal Care & Service | 34 (52.3%) | 31 (47.7%) |
| Total (Category) | 121 (46.5%) | 139 (53.5%) |
| Total (Overall) | 1,175 (51.9%) | 1,089 (48.1%) |
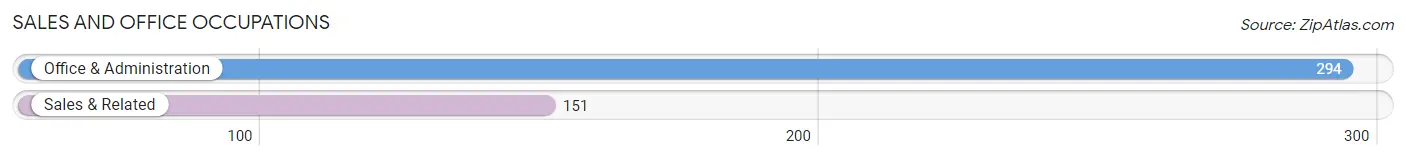
Sales and Office Occupations
The most common Sales and Office occupations in Lolo are Office & Administration (294 | 13.0%), and Sales & Related (151 | 6.7%).
Sales and Office Occupations by Sex
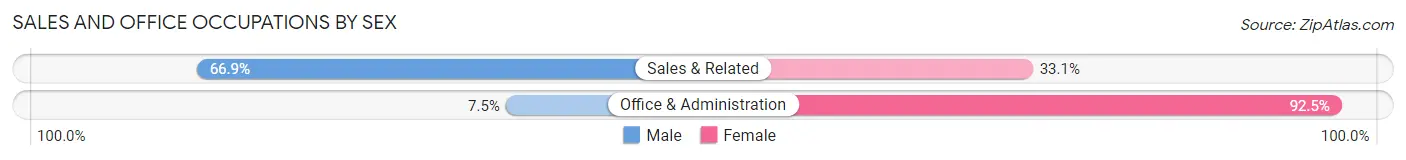
| Occupation | Male | Female |
| Sales & Related | 101 (66.9%) | 50 (33.1%) |
| Office & Administration | 22 (7.5%) | 272 (92.5%) |
| Total (Category) | 123 (27.6%) | 322 (72.4%) |
| Total (Overall) | 1,175 (51.9%) | 1,089 (48.1%) |
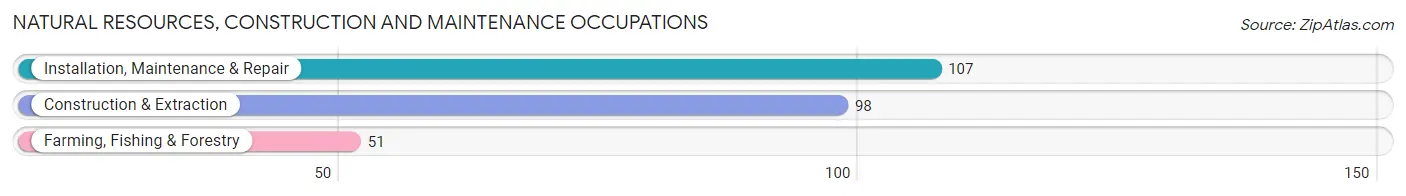
Natural Resources, Construction and Maintenance Occupations
The most common Natural Resources, Construction and Maintenance occupations in Lolo are Installation, Maintenance & Repair (107 | 4.7%), Construction & Extraction (98 | 4.3%), and Farming, Fishing & Forestry (51 | 2.2%).
Natural Resources, Construction and Maintenance Occupations by Sex
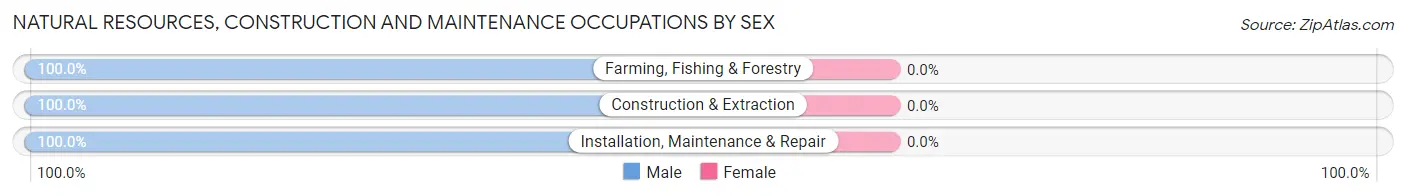
| Occupation | Male | Female |
| Farming, Fishing & Forestry | 51 (100.0%) | 0 (0.0%) |
| Construction & Extraction | 98 (100.0%) | 0 (0.0%) |
| Installation, Maintenance & Repair | 107 (100.0%) | 0 (0.0%) |
| Total (Category) | 256 (100.0%) | 0 (0.0%) |
| Total (Overall) | 1,175 (51.9%) | 1,089 (48.1%) |
Production, Transportation and Moving Occupations
The most common Production, Transportation and Moving occupations in Lolo are Transportation (96 | 4.2%), Production (93 | 4.1%), and Material Moving (60 | 2.6%).
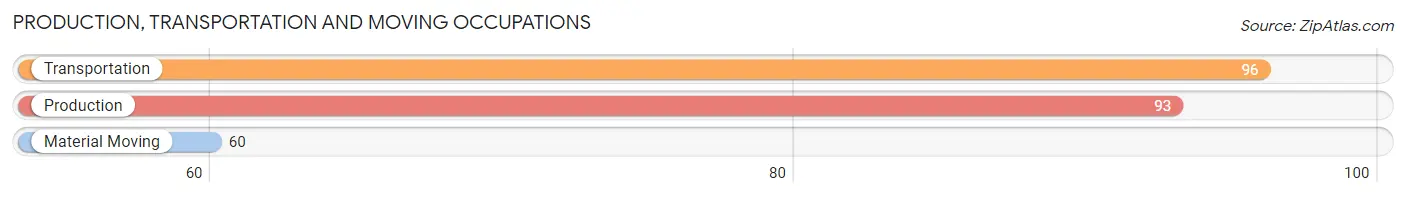
Production, Transportation and Moving Occupations by Sex
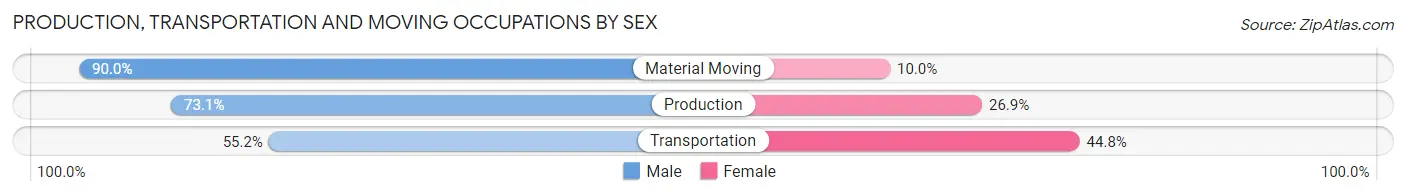
| Occupation | Male | Female |
| Production | 68 (73.1%) | 25 (26.9%) |
| Transportation | 53 (55.2%) | 43 (44.8%) |
| Material Moving | 54 (90.0%) | 6 (10.0%) |
| Total (Category) | 175 (70.3%) | 74 (29.7%) |
| Total (Overall) | 1,175 (51.9%) | 1,089 (48.1%) |
Employment Industries by Sex in Lolo
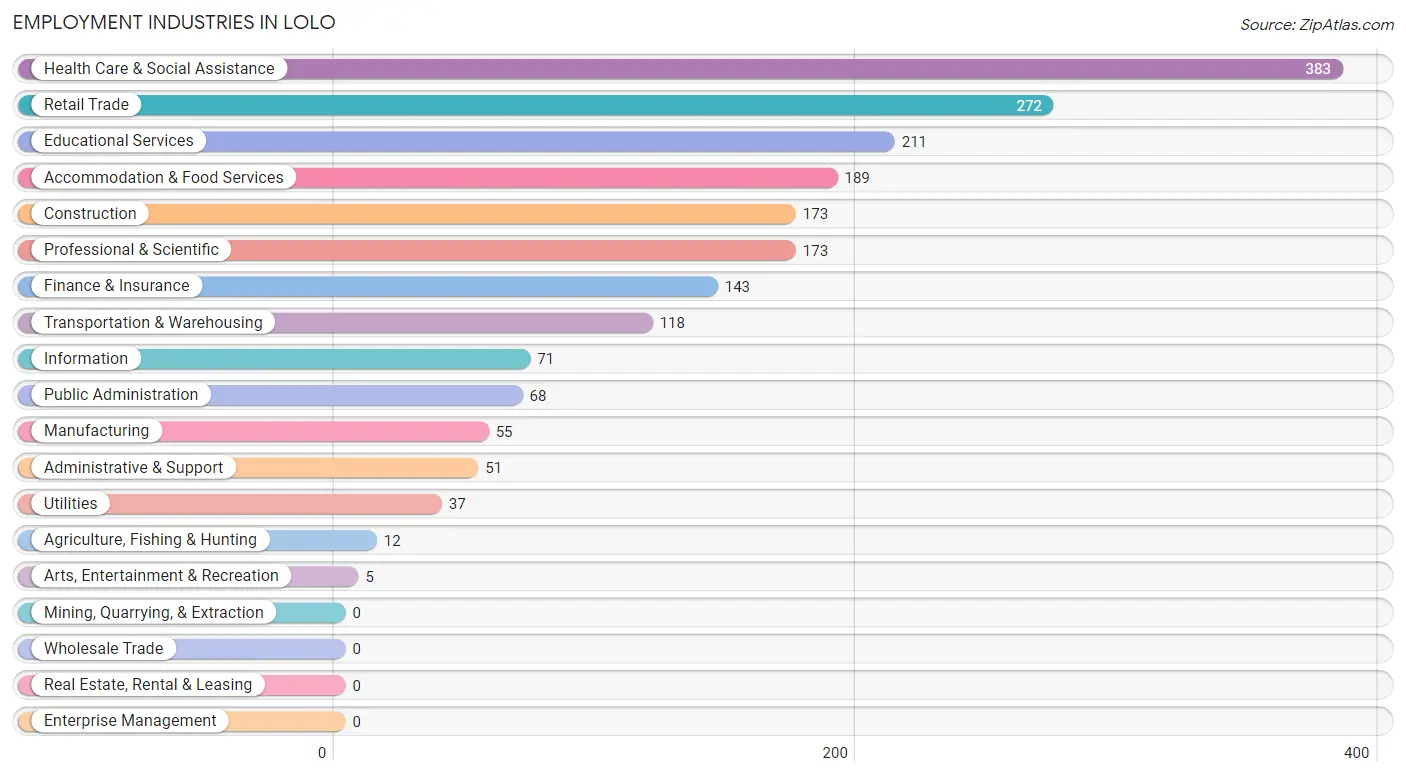
Employment Industries in Lolo
The major employment industries in Lolo include Health Care & Social Assistance (383 | 16.9%), Retail Trade (272 | 12.0%), Educational Services (211 | 9.3%), Accommodation & Food Services (189 | 8.4%), and Construction (173 | 7.6%).
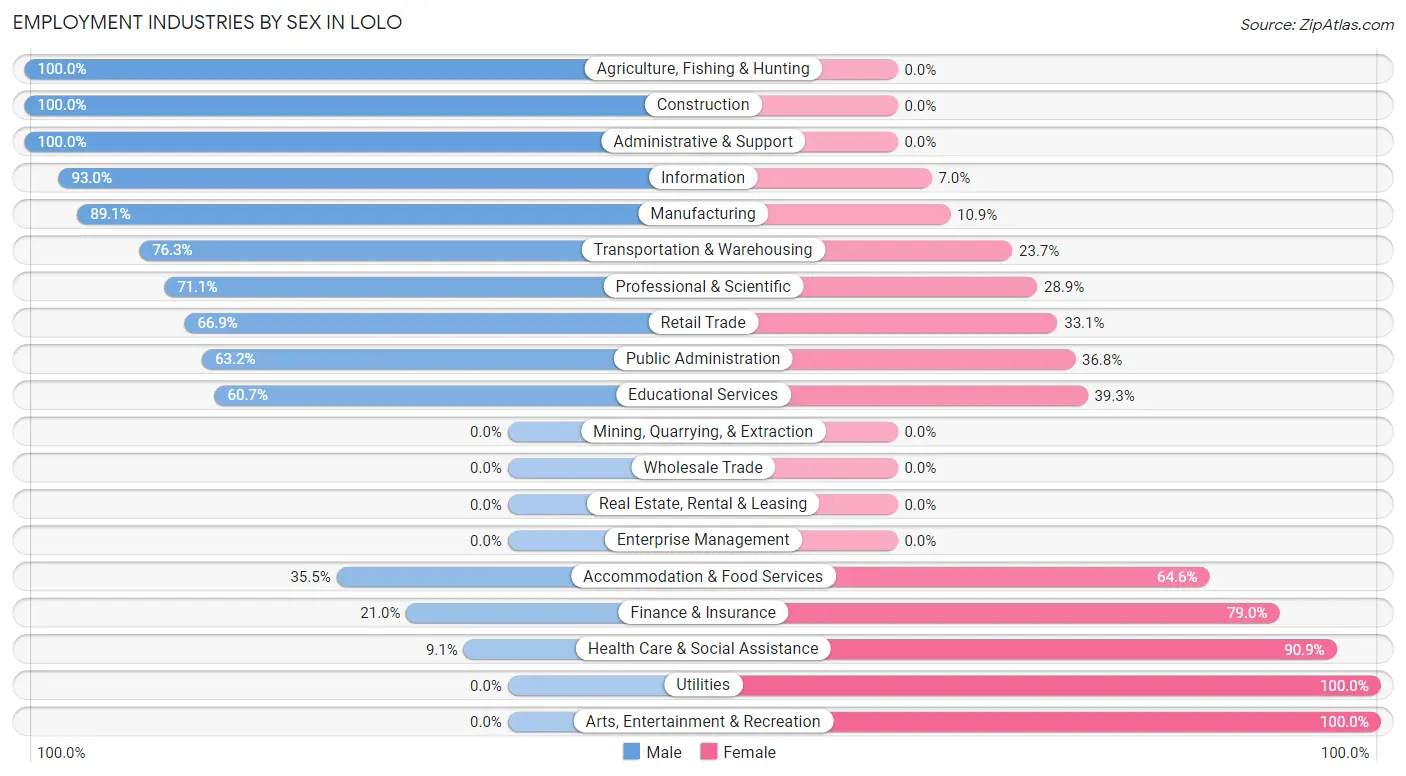
Employment Industries by Sex in Lolo
The Lolo industries that see more men than women are Agriculture, Fishing & Hunting (100.0%), Construction (100.0%), and Administrative & Support (100.0%), whereas the industries that tend to have a higher number of women are Utilities (100.0%), Arts, Entertainment & Recreation (100.0%), and Health Care & Social Assistance (90.9%).
| Industry | Male | Female |
| Agriculture, Fishing & Hunting | 12 (100.0%) | 0 (0.0%) |
| Mining, Quarrying, & Extraction | 0 (0.0%) | 0 (0.0%) |
| Construction | 173 (100.0%) | 0 (0.0%) |
| Manufacturing | 49 (89.1%) | 6 (10.9%) |
| Wholesale Trade | 0 (0.0%) | 0 (0.0%) |
| Retail Trade | 182 (66.9%) | 90 (33.1%) |
| Transportation & Warehousing | 90 (76.3%) | 28 (23.7%) |
| Utilities | 0 (0.0%) | 37 (100.0%) |
| Information | 66 (93.0%) | 5 (7.0%) |
| Finance & Insurance | 30 (21.0%) | 113 (79.0%) |
| Real Estate, Rental & Leasing | 0 (0.0%) | 0 (0.0%) |
| Professional & Scientific | 123 (71.1%) | 50 (28.9%) |
| Enterprise Management | 0 (0.0%) | 0 (0.0%) |
| Administrative & Support | 51 (100.0%) | 0 (0.0%) |
| Educational Services | 128 (60.7%) | 83 (39.3%) |
| Health Care & Social Assistance | 35 (9.1%) | 348 (90.9%) |
| Arts, Entertainment & Recreation | 0 (0.0%) | 5 (100.0%) |
| Accommodation & Food Services | 67 (35.4%) | 122 (64.5%) |
| Public Administration | 43 (63.2%) | 25 (36.8%) |
| Total | 1,175 (51.9%) | 1,089 (48.1%) |
Education in Lolo
School Enrollment in Lolo
The most common levels of schooling among the 1,145 students in Lolo are middle school (413 | 36.1%), college / undergraduate (215 | 18.8%), and high school (169 | 14.8%).
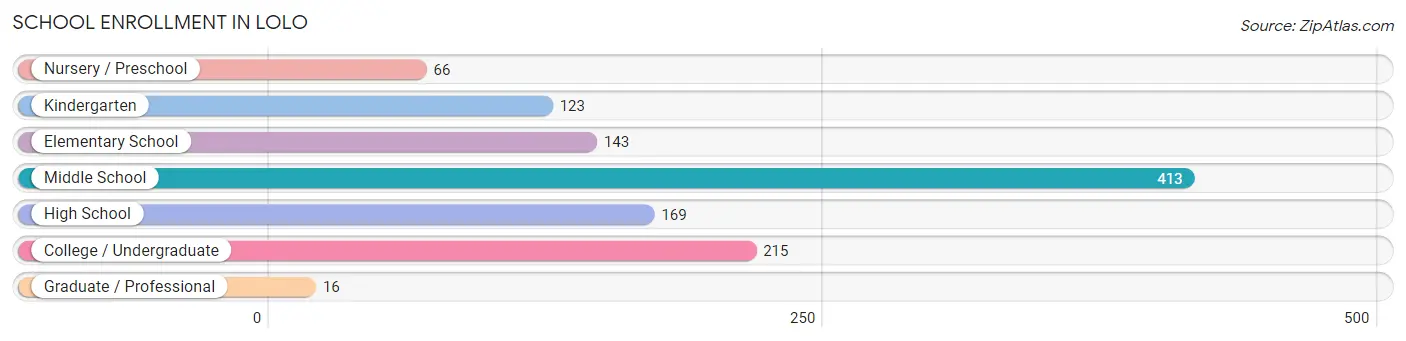
| School Level | # Students | % Students |
| Nursery / Preschool | 66 | 5.8% |
| Kindergarten | 123 | 10.7% |
| Elementary School | 143 | 12.5% |
| Middle School | 413 | 36.1% |
| High School | 169 | 14.8% |
| College / Undergraduate | 215 | 18.8% |
| Graduate / Professional | 16 | 1.4% |
| Total | 1,145 | 100.0% |
School Enrollment by Age by Funding Source in Lolo
Out of a total of 1,145 students who are enrolled in schools in Lolo, 137 (12.0%) attend a private institution, while the remaining 1,008 (88.0%) are enrolled in public schools. The age group of 3 to 4 year olds has the highest likelihood of being enrolled in private schools, with 60 (100.0% in the age bracket) enrolled. Conversely, the age group of 15 to 17 year olds has the lowest likelihood of being enrolled in a private school, with 158 (100.0% in the age bracket) attending a public institution.
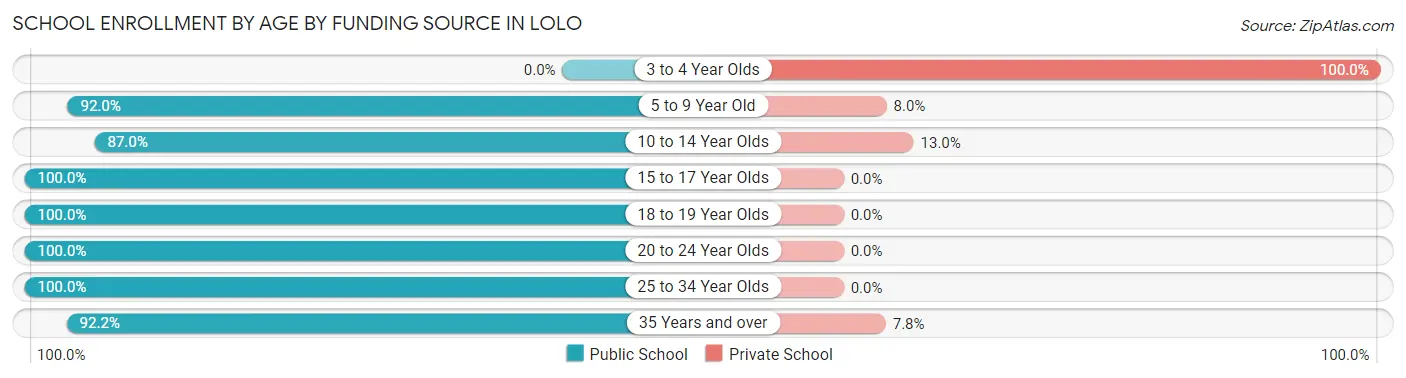
| Age Bracket | Public School | Private School |
| 3 to 4 Year Olds | 0 (0.0%) | 60 (100.0%) |
| 5 to 9 Year Old | 230 (92.0%) | 20 (8.0%) |
| 10 to 14 Year Olds | 327 (87.0%) | 49 (13.0%) |
| 15 to 17 Year Olds | 158 (100.0%) | 0 (0.0%) |
| 18 to 19 Year Olds | 6 (100.0%) | 0 (0.0%) |
| 20 to 24 Year Olds | 114 (100.0%) | 0 (0.0%) |
| 25 to 34 Year Olds | 79 (100.0%) | 0 (0.0%) |
| 35 Years and over | 94 (92.2%) | 8 (7.8%) |
| Total | 1,008 (88.0%) | 137 (12.0%) |
Educational Attainment by Field of Study in Lolo
Business (144 | 12.4%), engineering (123 | 10.6%), education (109 | 9.4%), social sciences (107 | 9.2%), and science & technology (106 | 9.1%) are the most common fields of study among 1,163 individuals in Lolo who have obtained a bachelor's degree or higher.
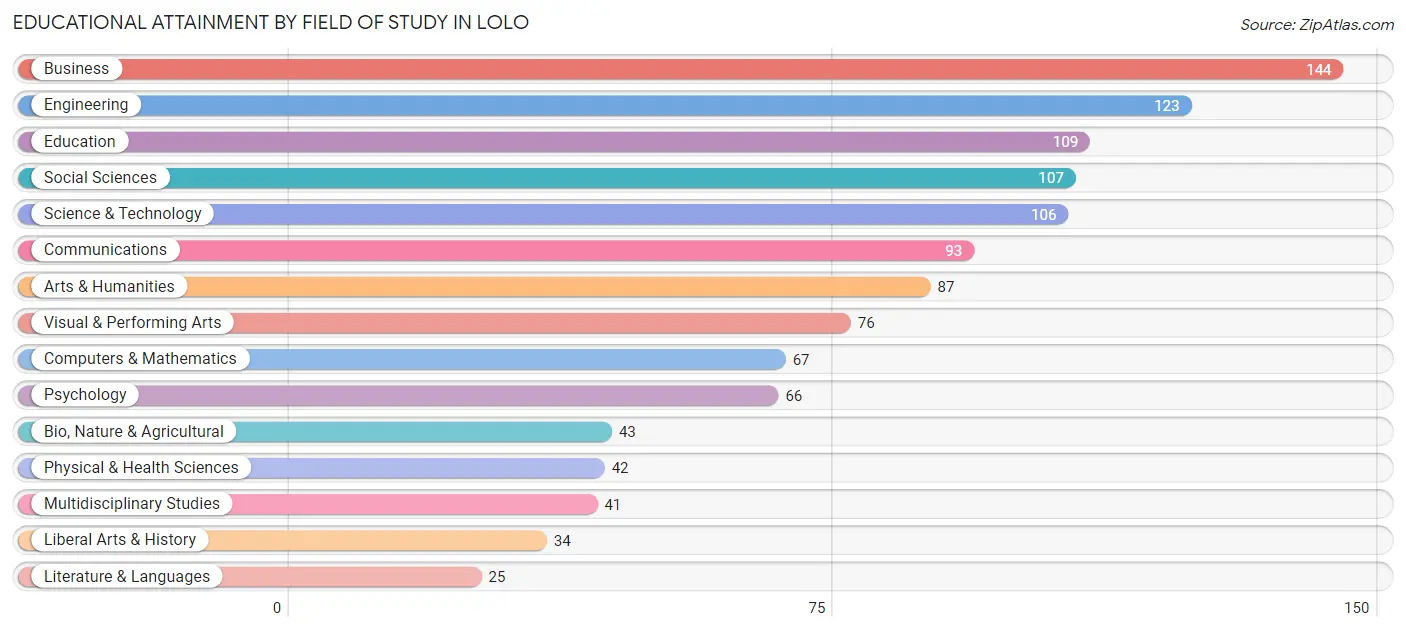
| Field of Study | # Graduates | % Graduates |
| Computers & Mathematics | 67 | 5.8% |
| Bio, Nature & Agricultural | 43 | 3.7% |
| Physical & Health Sciences | 42 | 3.6% |
| Psychology | 66 | 5.7% |
| Social Sciences | 107 | 9.2% |
| Engineering | 123 | 10.6% |
| Multidisciplinary Studies | 41 | 3.5% |
| Science & Technology | 106 | 9.1% |
| Business | 144 | 12.4% |
| Education | 109 | 9.4% |
| Literature & Languages | 25 | 2.1% |
| Liberal Arts & History | 34 | 2.9% |
| Visual & Performing Arts | 76 | 6.5% |
| Communications | 93 | 8.0% |
| Arts & Humanities | 87 | 7.5% |
| Total | 1,163 | 100.0% |
Transportation & Commute in Lolo
Vehicle Availability by Sex in Lolo
The most prevalent vehicle ownership categories in Lolo are males with 2 vehicles (612, accounting for 52.1%) and females with 2 vehicles (604, making up 56.9%).
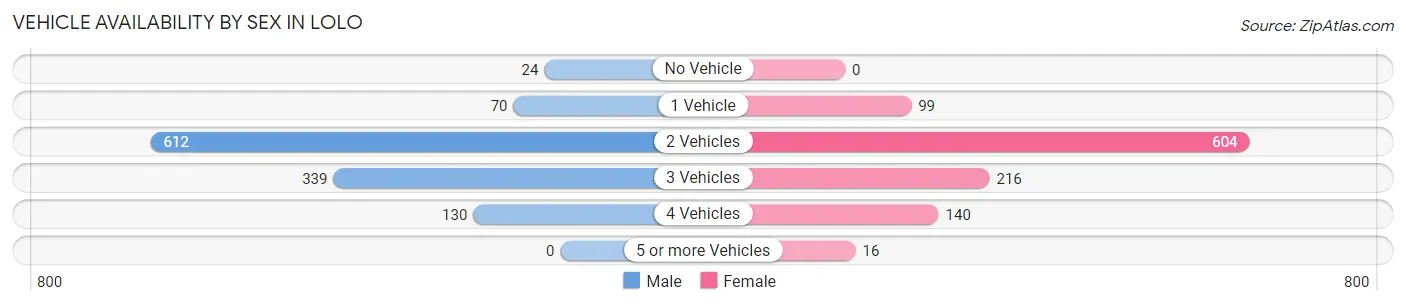
| Vehicles Available | Male | Female |
| No Vehicle | 24 (2.0%) | 0 (0.0%) |
| 1 Vehicle | 70 (6.0%) | 99 (9.2%) |
| 2 Vehicles | 612 (52.1%) | 604 (56.2%) |
| 3 Vehicles | 339 (28.8%) | 216 (20.1%) |
| 4 Vehicles | 130 (11.1%) | 140 (13.0%) |
| 5 or more Vehicles | 0 (0.0%) | 16 (1.5%) |
| Total | 1,175 (100.0%) | 1,075 (100.0%) |
Commute Time in Lolo
The most frequently occuring commute durations in Lolo are 20 to 24 minutes (712 commuters, 34.1%), 15 to 19 minutes (336 commuters, 16.1%), and 30 to 34 minutes (322 commuters, 15.4%).
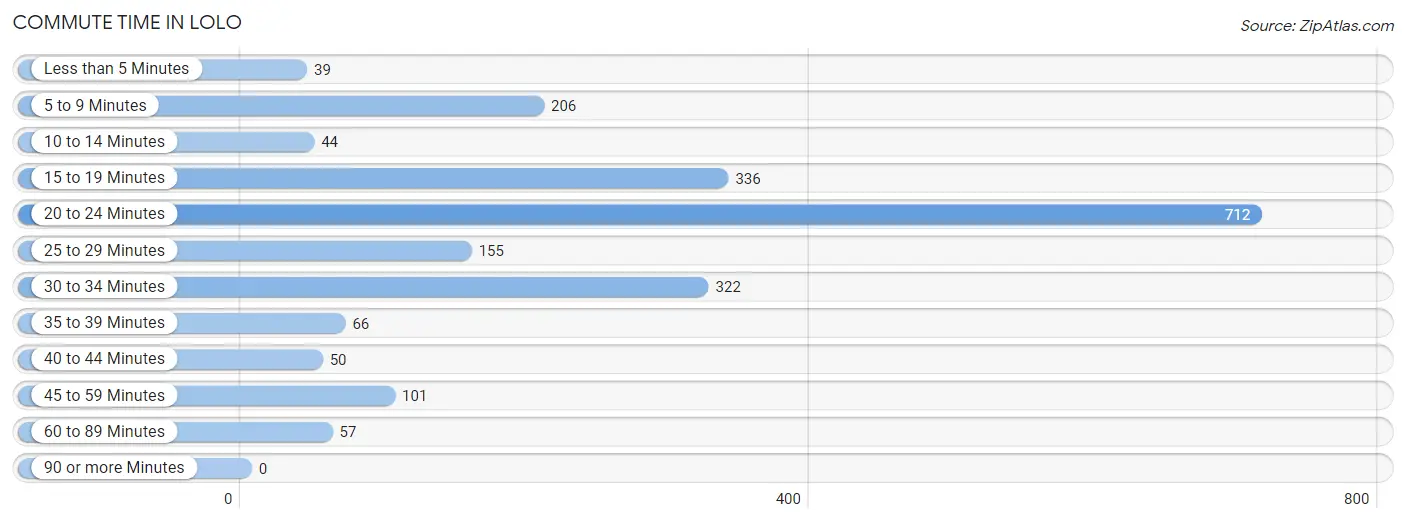
| Commute Time | # Commuters | % Commuters |
| Less than 5 Minutes | 39 | 1.9% |
| 5 to 9 Minutes | 206 | 9.9% |
| 10 to 14 Minutes | 44 | 2.1% |
| 15 to 19 Minutes | 336 | 16.1% |
| 20 to 24 Minutes | 712 | 34.1% |
| 25 to 29 Minutes | 155 | 7.4% |
| 30 to 34 Minutes | 322 | 15.4% |
| 35 to 39 Minutes | 66 | 3.2% |
| 40 to 44 Minutes | 50 | 2.4% |
| 45 to 59 Minutes | 101 | 4.8% |
| 60 to 89 Minutes | 57 | 2.7% |
| 90 or more Minutes | 0 | 0.0% |
Commute Time by Sex in Lolo
The most common commute times in Lolo are 20 to 24 minutes (402 commuters, 37.5%) for males and 20 to 24 minutes (310 commuters, 30.5%) for females.
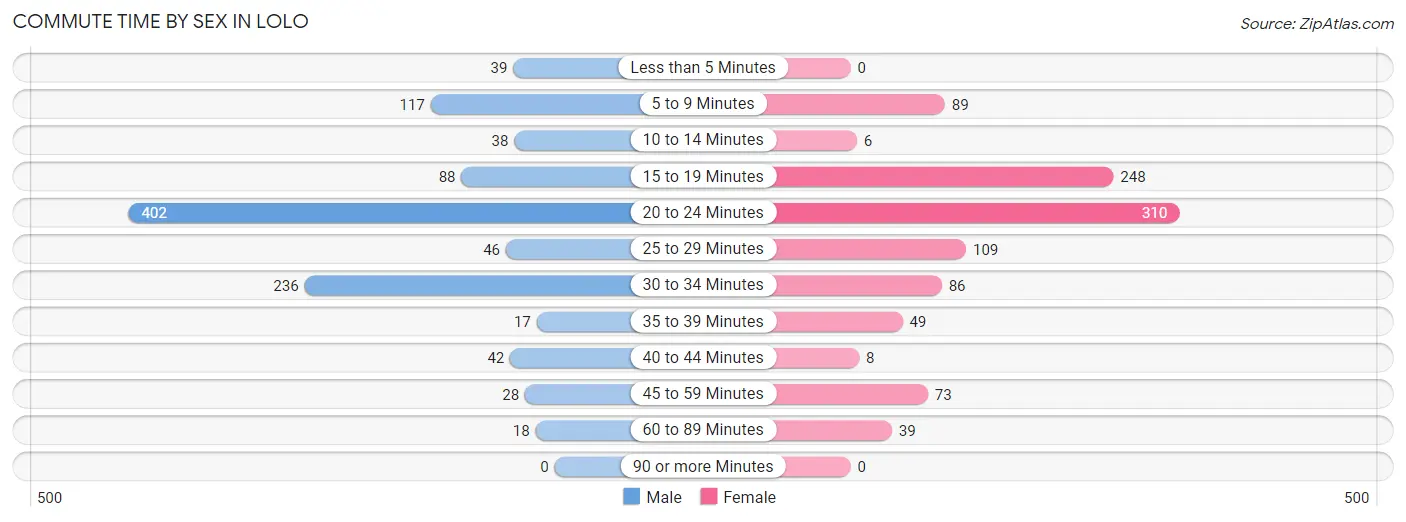
| Commute Time | Male | Female |
| Less than 5 Minutes | 39 (3.6%) | 0 (0.0%) |
| 5 to 9 Minutes | 117 (10.9%) | 89 (8.7%) |
| 10 to 14 Minutes | 38 (3.5%) | 6 (0.6%) |
| 15 to 19 Minutes | 88 (8.2%) | 248 (24.4%) |
| 20 to 24 Minutes | 402 (37.5%) | 310 (30.5%) |
| 25 to 29 Minutes | 46 (4.3%) | 109 (10.7%) |
| 30 to 34 Minutes | 236 (22.0%) | 86 (8.5%) |
| 35 to 39 Minutes | 17 (1.6%) | 49 (4.8%) |
| 40 to 44 Minutes | 42 (3.9%) | 8 (0.8%) |
| 45 to 59 Minutes | 28 (2.6%) | 73 (7.2%) |
| 60 to 89 Minutes | 18 (1.7%) | 39 (3.8%) |
| 90 or more Minutes | 0 (0.0%) | 0 (0.0%) |
Time of Departure to Work by Sex in Lolo
The most frequent times of departure to work in Lolo are 7:30 AM to 7:59 AM (203, 19.0%) for males and 8:00 AM to 8:29 AM (208, 20.4%) for females.
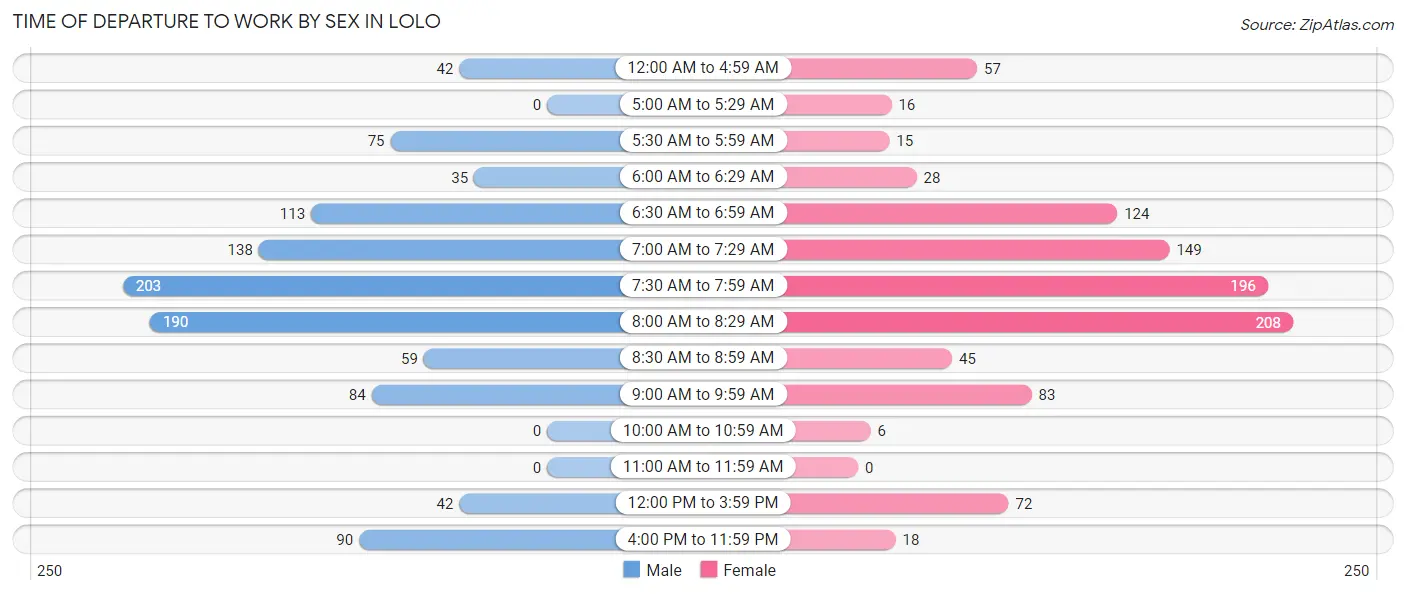
| Time of Departure | Male | Female |
| 12:00 AM to 4:59 AM | 42 (3.9%) | 57 (5.6%) |
| 5:00 AM to 5:29 AM | 0 (0.0%) | 16 (1.6%) |
| 5:30 AM to 5:59 AM | 75 (7.0%) | 15 (1.5%) |
| 6:00 AM to 6:29 AM | 35 (3.3%) | 28 (2.8%) |
| 6:30 AM to 6:59 AM | 113 (10.5%) | 124 (12.2%) |
| 7:00 AM to 7:29 AM | 138 (12.9%) | 149 (14.6%) |
| 7:30 AM to 7:59 AM | 203 (19.0%) | 196 (19.3%) |
| 8:00 AM to 8:29 AM | 190 (17.7%) | 208 (20.4%) |
| 8:30 AM to 8:59 AM | 59 (5.5%) | 45 (4.4%) |
| 9:00 AM to 9:59 AM | 84 (7.8%) | 83 (8.2%) |
| 10:00 AM to 10:59 AM | 0 (0.0%) | 6 (0.6%) |
| 11:00 AM to 11:59 AM | 0 (0.0%) | 0 (0.0%) |
| 12:00 PM to 3:59 PM | 42 (3.9%) | 72 (7.1%) |
| 4:00 PM to 11:59 PM | 90 (8.4%) | 18 (1.8%) |
| Total | 1,071 (100.0%) | 1,017 (100.0%) |
Housing Occupancy in Lolo
Occupancy by Ownership in Lolo
Of the total 1,828 dwellings in Lolo, owner-occupied units account for 1,460 (79.9%), while renter-occupied units make up 368 (20.1%).
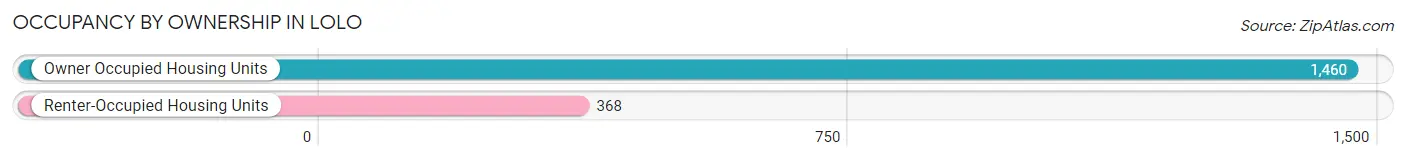
| Occupancy | # Housing Units | % Housing Units |
| Owner Occupied Housing Units | 1,460 | 79.9% |
| Renter-Occupied Housing Units | 368 | 20.1% |
| Total Occupied Housing Units | 1,828 | 100.0% |
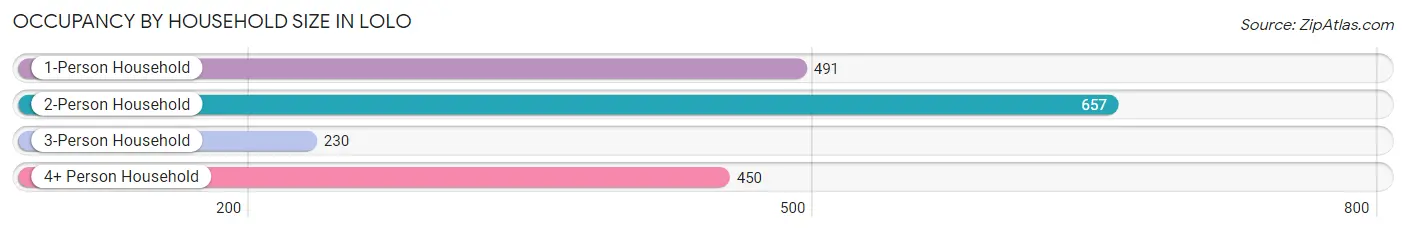
Occupancy by Household Size in Lolo
| Household Size | # Housing Units | % Housing Units |
| 1-Person Household | 491 | 26.9% |
| 2-Person Household | 657 | 35.9% |
| 3-Person Household | 230 | 12.6% |
| 4+ Person Household | 450 | 24.6% |
| Total Housing Units | 1,828 | 100.0% |
Occupancy by Ownership by Household Size in Lolo
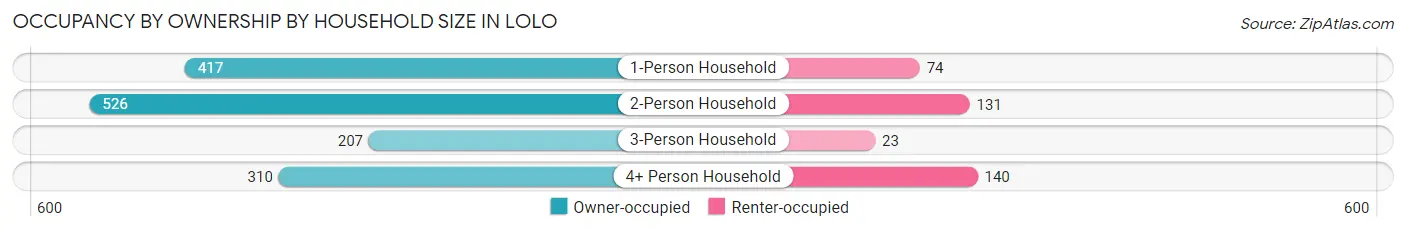
| Household Size | Owner-occupied | Renter-occupied |
| 1-Person Household | 417 (84.9%) | 74 (15.1%) |
| 2-Person Household | 526 (80.1%) | 131 (19.9%) |
| 3-Person Household | 207 (90.0%) | 23 (10.0%) |
| 4+ Person Household | 310 (68.9%) | 140 (31.1%) |
| Total Housing Units | 1,460 (79.9%) | 368 (20.1%) |
Occupancy by Educational Attainment in Lolo
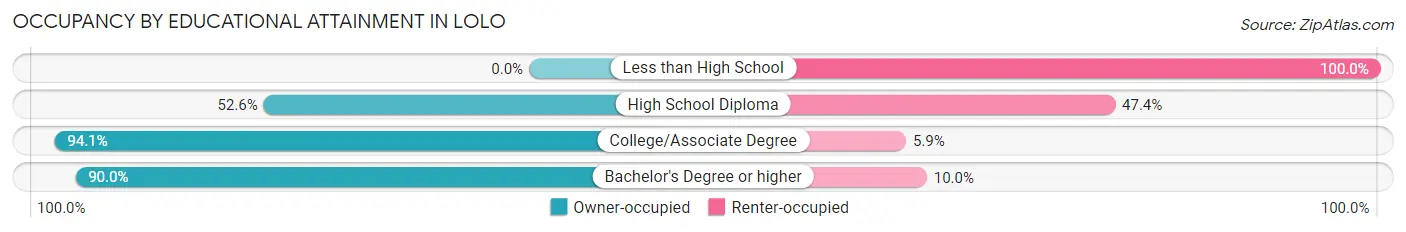
| Household Size | Owner-occupied | Renter-occupied |
| Less than High School | 0 (0.0%) | 54 (100.0%) |
| High School Diploma | 230 (52.6%) | 207 (47.4%) |
| College/Associate Degree | 621 (94.1%) | 39 (5.9%) |
| Bachelor's Degree or higher | 609 (90.0%) | 68 (10.0%) |
Occupancy by Age of Householder in Lolo
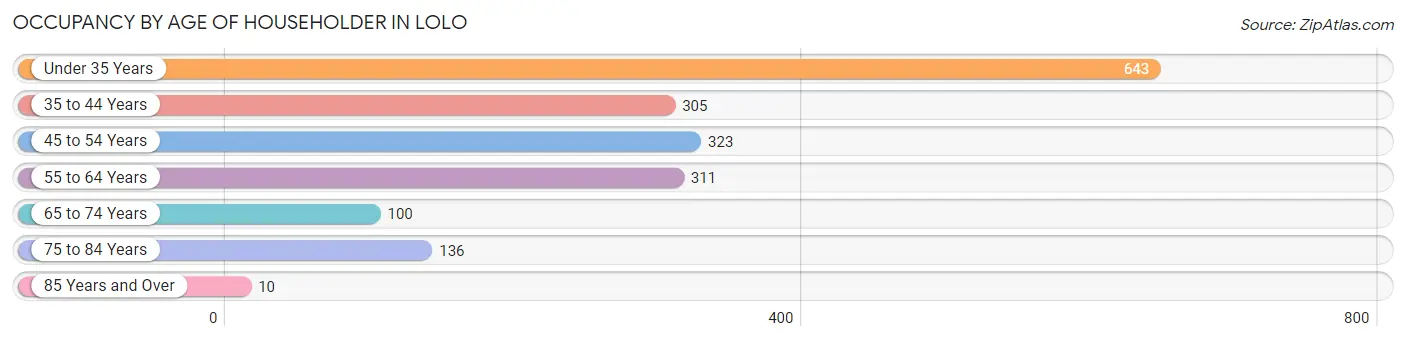
| Age Bracket | # Households | % Households |
| Under 35 Years | 643 | 35.2% |
| 35 to 44 Years | 305 | 16.7% |
| 45 to 54 Years | 323 | 17.7% |
| 55 to 64 Years | 311 | 17.0% |
| 65 to 74 Years | 100 | 5.5% |
| 75 to 84 Years | 136 | 7.4% |
| 85 Years and Over | 10 | 0.5% |
| Total | 1,828 | 100.0% |
Housing Finances in Lolo
Median Income by Occupancy in Lolo
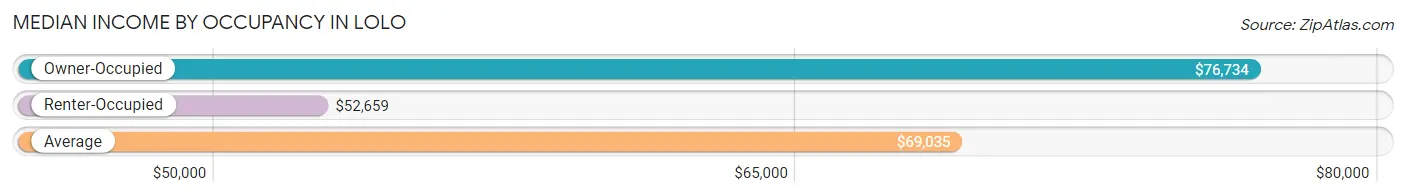
| Occupancy Type | # Households | Median Income |
| Owner-Occupied | 1,460 (79.9%) | $76,734 |
| Renter-Occupied | 368 (20.1%) | $52,659 |
| Average | 1,828 (100.0%) | $69,035 |
Occupancy by Householder Income Bracket in Lolo
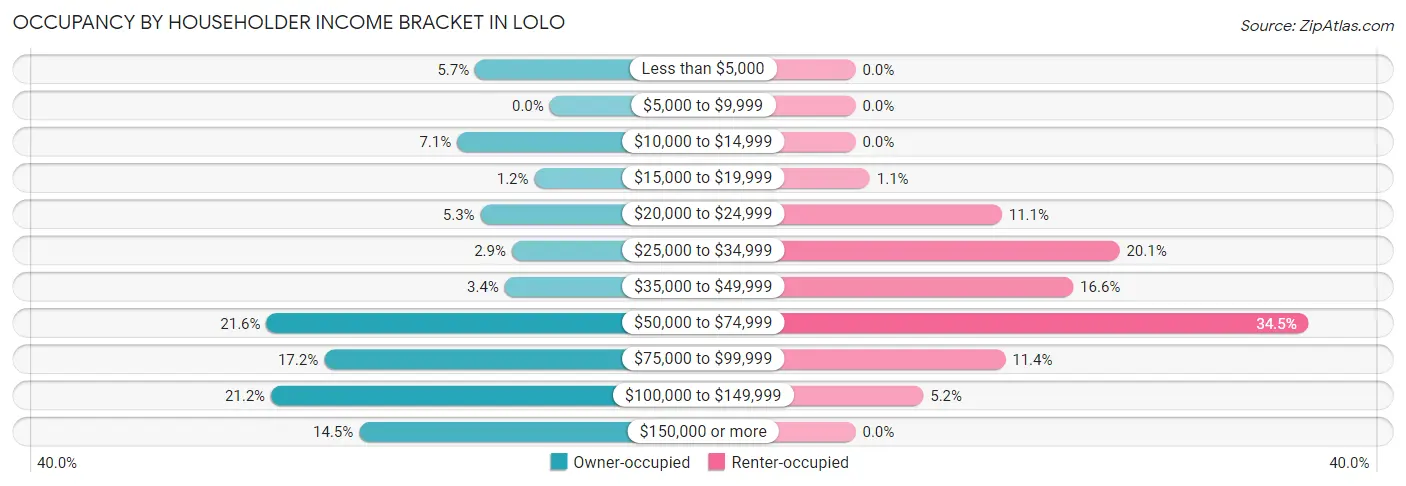
| Income Bracket | Owner-occupied | Renter-occupied |
| Less than $5,000 | 83 (5.7%) | 0 (0.0%) |
| $5,000 to $9,999 | 0 (0.0%) | 0 (0.0%) |
| $10,000 to $14,999 | 103 (7.0%) | 0 (0.0%) |
| $15,000 to $19,999 | 17 (1.2%) | 4 (1.1%) |
| $20,000 to $24,999 | 77 (5.3%) | 41 (11.1%) |
| $25,000 to $34,999 | 42 (2.9%) | 74 (20.1%) |
| $35,000 to $49,999 | 50 (3.4%) | 61 (16.6%) |
| $50,000 to $74,999 | 315 (21.6%) | 127 (34.5%) |
| $75,000 to $99,999 | 251 (17.2%) | 42 (11.4%) |
| $100,000 to $149,999 | 310 (21.2%) | 19 (5.2%) |
| $150,000 or more | 212 (14.5%) | 0 (0.0%) |
| Total | 1,460 (100.0%) | 368 (100.0%) |
Monthly Housing Cost Tiers in Lolo
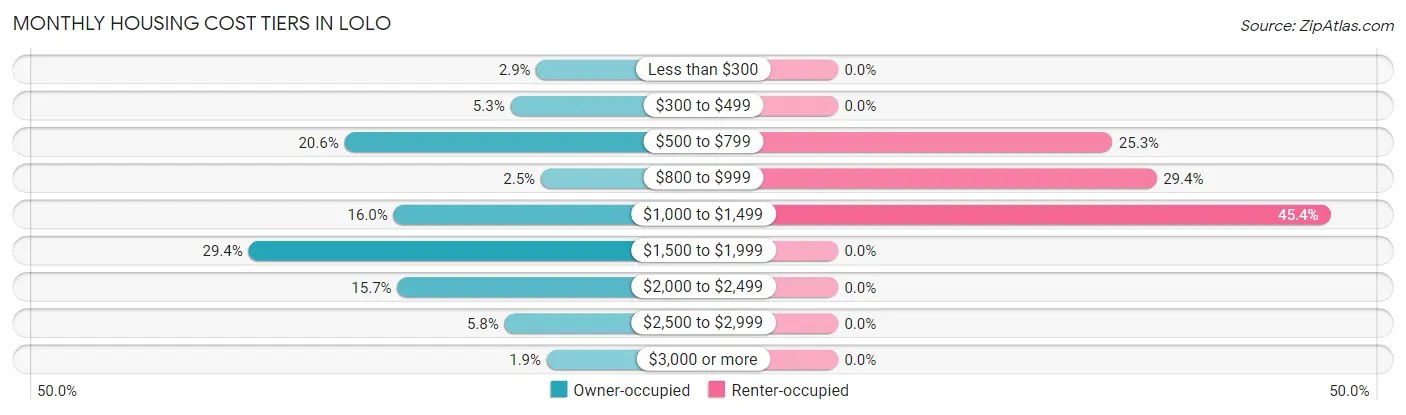
| Monthly Cost | Owner-occupied | Renter-occupied |
| Less than $300 | 42 (2.9%) | 0 (0.0%) |
| $300 to $499 | 77 (5.3%) | 0 (0.0%) |
| $500 to $799 | 300 (20.5%) | 93 (25.3%) |
| $800 to $999 | 36 (2.5%) | 108 (29.3%) |
| $1,000 to $1,499 | 234 (16.0%) | 167 (45.4%) |
| $1,500 to $1,999 | 429 (29.4%) | 0 (0.0%) |
| $2,000 to $2,499 | 229 (15.7%) | 0 (0.0%) |
| $2,500 to $2,999 | 85 (5.8%) | 0 (0.0%) |
| $3,000 or more | 28 (1.9%) | 0 (0.0%) |
| Total | 1,460 (100.0%) | 368 (100.0%) |
Physical Housing Characteristics in Lolo
Housing Structures in Lolo
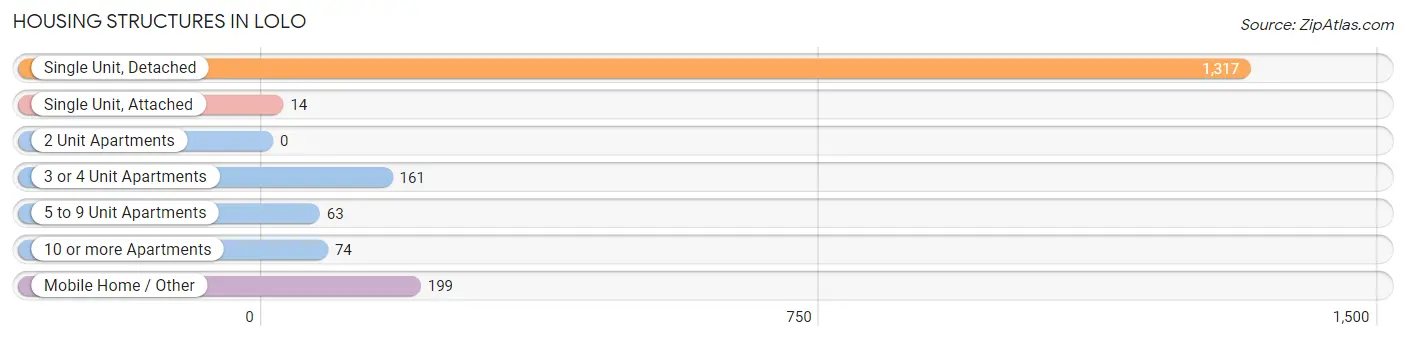
| Structure Type | # Housing Units | % Housing Units |
| Single Unit, Detached | 1,317 | 72.1% |
| Single Unit, Attached | 14 | 0.8% |
| 2 Unit Apartments | 0 | 0.0% |
| 3 or 4 Unit Apartments | 161 | 8.8% |
| 5 to 9 Unit Apartments | 63 | 3.5% |
| 10 or more Apartments | 74 | 4.1% |
| Mobile Home / Other | 199 | 10.9% |
| Total | 1,828 | 100.0% |
Housing Structures by Occupancy in Lolo
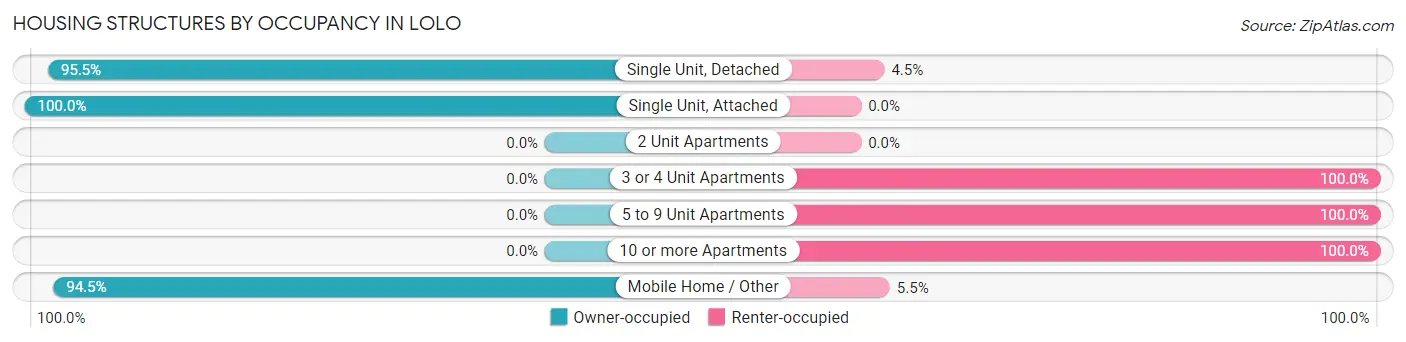
| Structure Type | Owner-occupied | Renter-occupied |
| Single Unit, Detached | 1,258 (95.5%) | 59 (4.5%) |
| Single Unit, Attached | 14 (100.0%) | 0 (0.0%) |
| 2 Unit Apartments | 0 (0.0%) | 0 (0.0%) |
| 3 or 4 Unit Apartments | 0 (0.0%) | 161 (100.0%) |
| 5 to 9 Unit Apartments | 0 (0.0%) | 63 (100.0%) |
| 10 or more Apartments | 0 (0.0%) | 74 (100.0%) |
| Mobile Home / Other | 188 (94.5%) | 11 (5.5%) |
| Total | 1,460 (79.9%) | 368 (20.1%) |
Housing Structures by Number of Rooms in Lolo
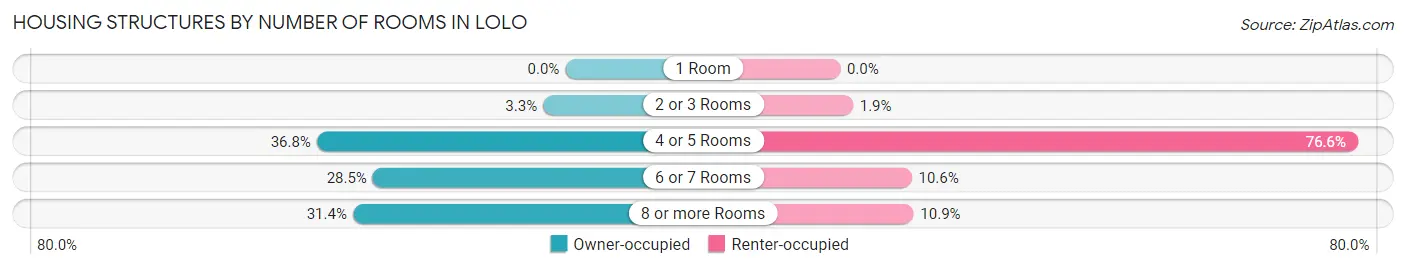
| Number of Rooms | Owner-occupied | Renter-occupied |
| 1 Room | 0 (0.0%) | 0 (0.0%) |
| 2 or 3 Rooms | 48 (3.3%) | 7 (1.9%) |
| 4 or 5 Rooms | 537 (36.8%) | 282 (76.6%) |
| 6 or 7 Rooms | 416 (28.5%) | 39 (10.6%) |
| 8 or more Rooms | 459 (31.4%) | 40 (10.9%) |
| Total | 1,460 (100.0%) | 368 (100.0%) |
Housing Structure by Heating Type in Lolo
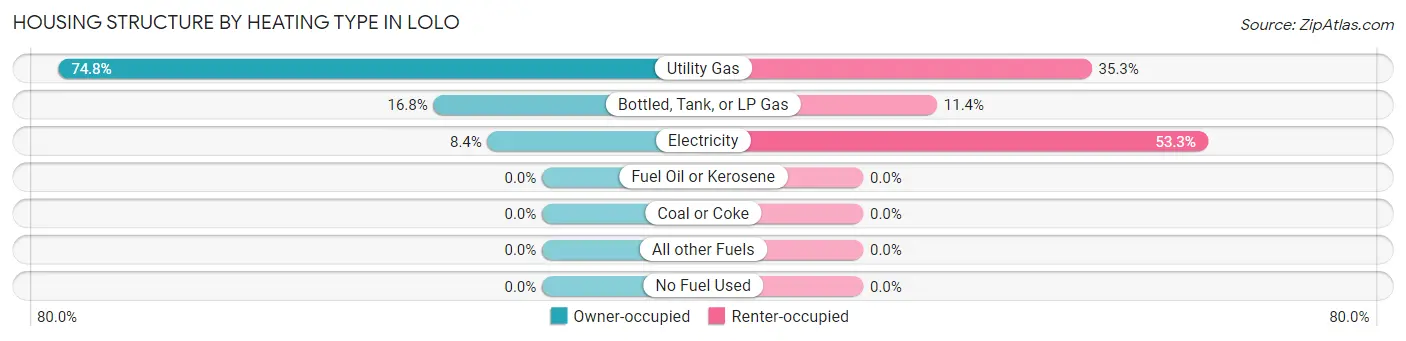
| Heating Type | Owner-occupied | Renter-occupied |
| Utility Gas | 1,092 (74.8%) | 130 (35.3%) |
| Bottled, Tank, or LP Gas | 245 (16.8%) | 42 (11.4%) |
| Electricity | 123 (8.4%) | 196 (53.3%) |
| Fuel Oil or Kerosene | 0 (0.0%) | 0 (0.0%) |
| Coal or Coke | 0 (0.0%) | 0 (0.0%) |
| All other Fuels | 0 (0.0%) | 0 (0.0%) |
| No Fuel Used | 0 (0.0%) | 0 (0.0%) |
| Total | 1,460 (100.0%) | 368 (100.0%) |
Household Vehicle Usage in Lolo
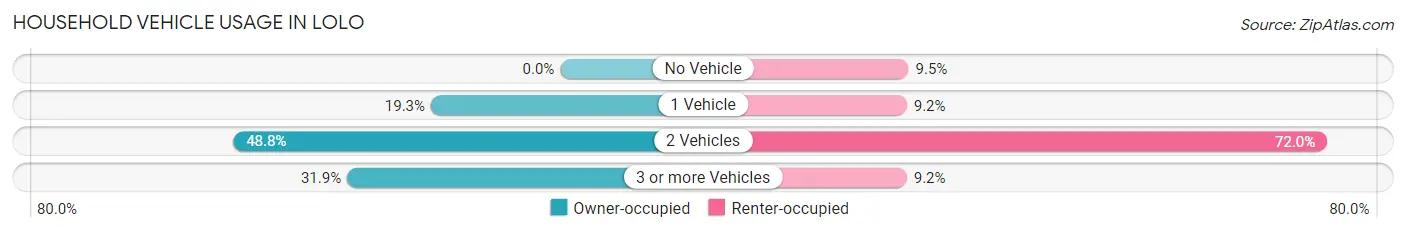
| Vehicles per Household | Owner-occupied | Renter-occupied |
| No Vehicle | 0 (0.0%) | 35 (9.5%) |
| 1 Vehicle | 282 (19.3%) | 34 (9.2%) |
| 2 Vehicles | 713 (48.8%) | 265 (72.0%) |
| 3 or more Vehicles | 465 (31.9%) | 34 (9.2%) |
| Total | 1,460 (100.0%) | 368 (100.0%) |
Real Estate & Mortgages in Lolo
Real Estate and Mortgage Overview in Lolo
| Characteristic | Without Mortgage | With Mortgage |
| Housing Units | 431 | 1,029 |
| Median Property Value | - | - |
| Median Household Income | $24,725 | $212 |
| Monthly Housing Costs | $544 | $28 |
| Real Estate Taxes | $3,398 | $18 |
Property Value by Mortgage Status in Lolo
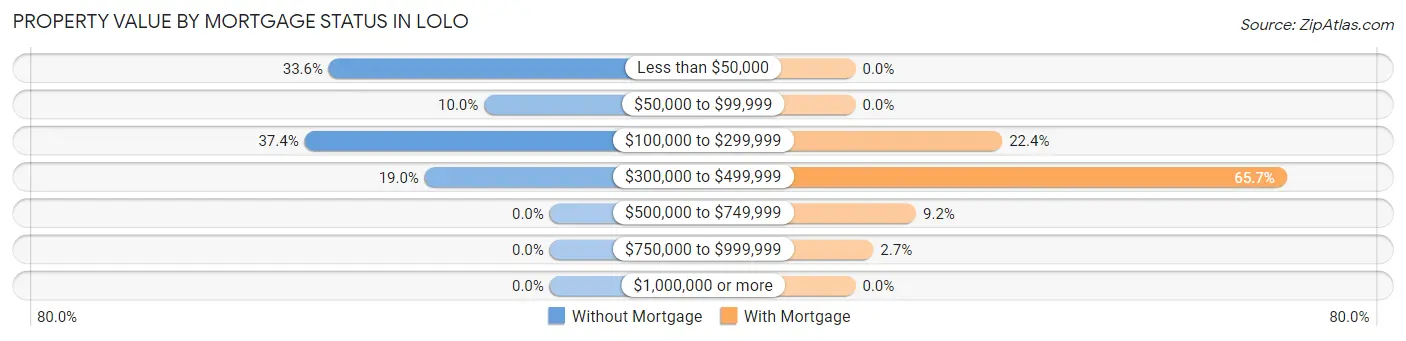
| Property Value | Without Mortgage | With Mortgage |
| Less than $50,000 | 145 (33.6%) | 0 (0.0%) |
| $50,000 to $99,999 | 43 (10.0%) | 0 (0.0%) |
| $100,000 to $299,999 | 161 (37.3%) | 230 (22.4%) |
| $300,000 to $499,999 | 82 (19.0%) | 676 (65.7%) |
| $500,000 to $749,999 | 0 (0.0%) | 95 (9.2%) |
| $750,000 to $999,999 | 0 (0.0%) | 28 (2.7%) |
| $1,000,000 or more | 0 (0.0%) | 0 (0.0%) |
| Total | 431 (100.0%) | 1,029 (100.0%) |
Household Income by Mortgage Status in Lolo
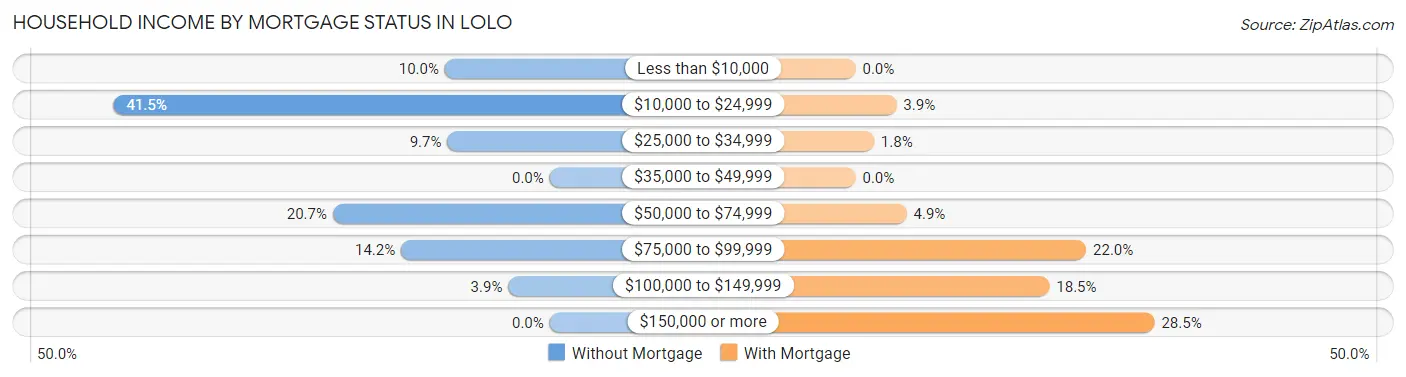
| Household Income | Without Mortgage | With Mortgage |
| Less than $10,000 | 43 (10.0%) | 0 (0.0%) |
| $10,000 to $24,999 | 179 (41.5%) | 40 (3.9%) |
| $25,000 to $34,999 | 42 (9.7%) | 18 (1.8%) |
| $35,000 to $49,999 | 0 (0.0%) | 0 (0.0%) |
| $50,000 to $74,999 | 89 (20.6%) | 50 (4.9%) |
| $75,000 to $99,999 | 61 (14.1%) | 226 (22.0%) |
| $100,000 to $149,999 | 17 (3.9%) | 190 (18.5%) |
| $150,000 or more | 0 (0.0%) | 293 (28.5%) |
| Total | 431 (100.0%) | 1,029 (100.0%) |
Property Value to Household Income Ratio in Lolo
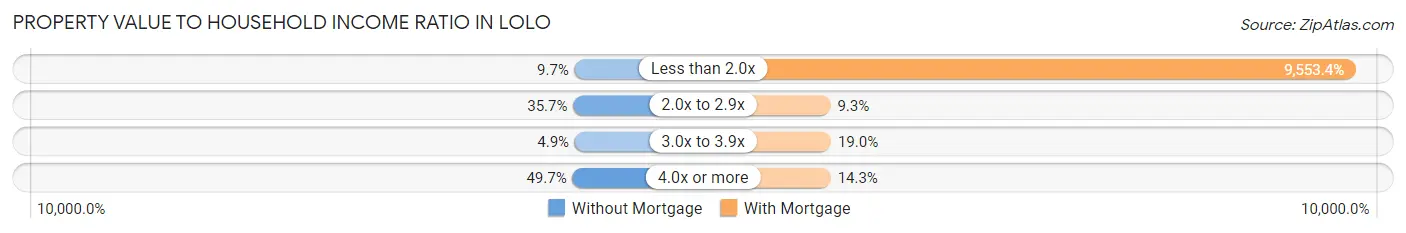
| Value-to-Income Ratio | Without Mortgage | With Mortgage |
| Less than 2.0x | 42 (9.7%) | 98,304 (9,553.4%) |
| 2.0x to 2.9x | 154 (35.7%) | 96 (9.3%) |
| 3.0x to 3.9x | 21 (4.9%) | 195 (19.0%) |
| 4.0x or more | 214 (49.6%) | 147 (14.3%) |
| Total | 431 (100.0%) | 1,029 (100.0%) |
Real Estate Taxes by Mortgage Status in Lolo
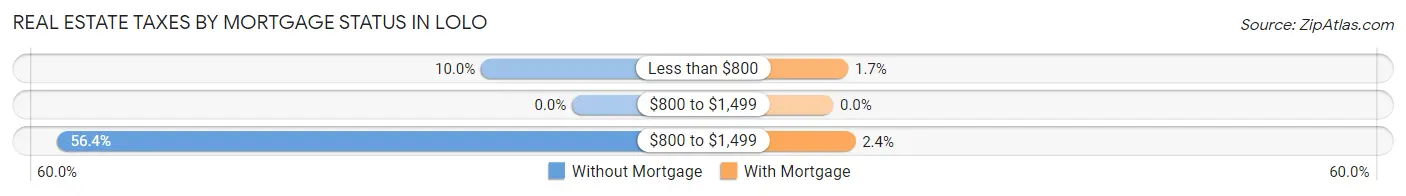
| Property Taxes | Without Mortgage | With Mortgage |
| Less than $800 | 43 (10.0%) | 17 (1.7%) |
| $800 to $1,499 | 0 (0.0%) | 0 (0.0%) |
| $800 to $1,499 | 243 (56.4%) | 25 (2.4%) |
| Total | 431 (100.0%) | 1,029 (100.0%) |
Health & Disability in Lolo
Health Insurance Coverage by Age in Lolo
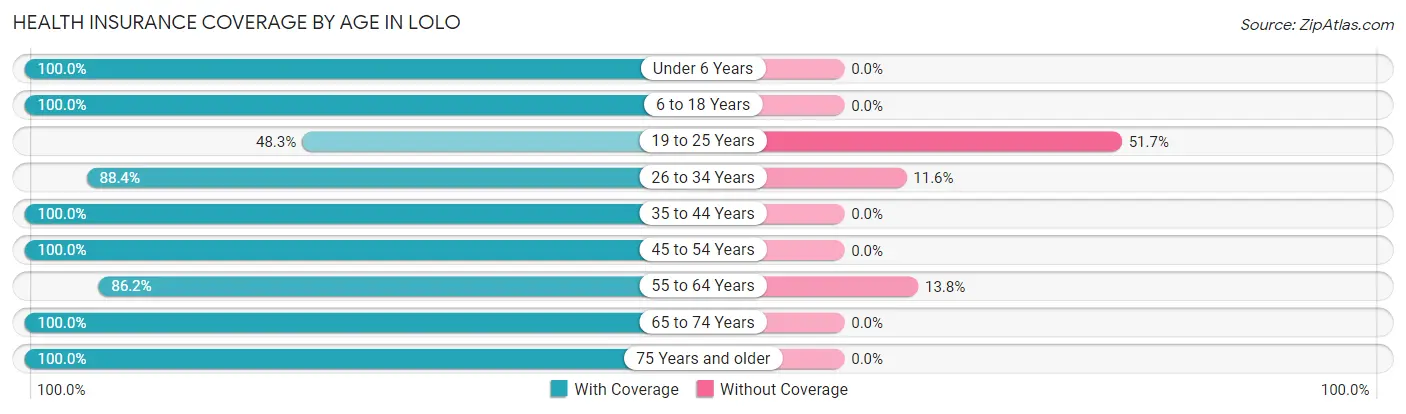
| Age Bracket | With Coverage | Without Coverage |
| Under 6 Years | 605 (100.0%) | 0 (0.0%) |
| 6 to 18 Years | 739 (100.0%) | 0 (0.0%) |
| 19 to 25 Years | 208 (48.3%) | 223 (51.7%) |
| 26 to 34 Years | 764 (88.4%) | 100 (11.6%) |
| 35 to 44 Years | 597 (100.0%) | 0 (0.0%) |
| 45 to 54 Years | 508 (100.0%) | 0 (0.0%) |
| 55 to 64 Years | 376 (86.2%) | 60 (13.8%) |
| 65 to 74 Years | 194 (100.0%) | 0 (0.0%) |
| 75 Years and older | 199 (100.0%) | 0 (0.0%) |
| Total | 4,190 (91.6%) | 383 (8.4%) |
Health Insurance Coverage by Citizenship Status in Lolo
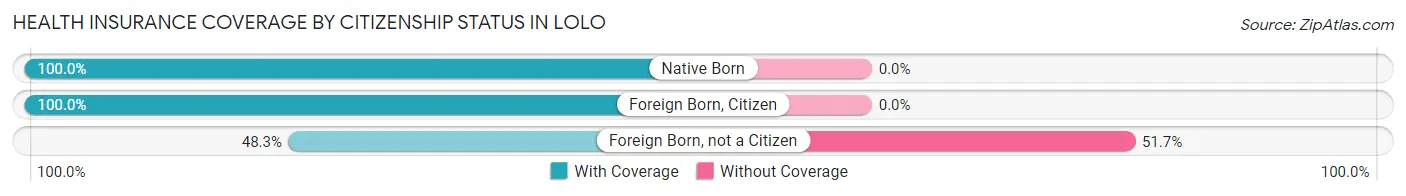
| Citizenship Status | With Coverage | Without Coverage |
| Native Born | 605 (100.0%) | 0 (0.0%) |
| Foreign Born, Citizen | 739 (100.0%) | 0 (0.0%) |
| Foreign Born, not a Citizen | 208 (48.3%) | 223 (51.7%) |
Health Insurance Coverage by Household Income in Lolo
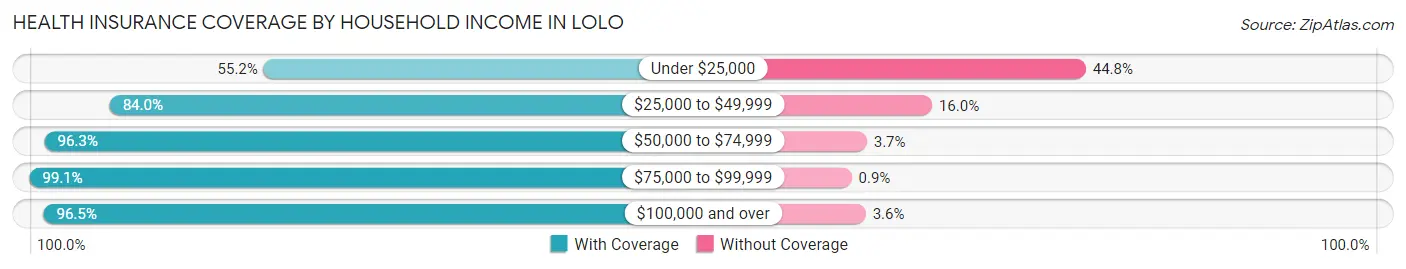
| Household Income | With Coverage | Without Coverage |
| Under $25,000 | 222 (55.2%) | 180 (44.8%) |
| $25,000 to $49,999 | 474 (84.0%) | 90 (16.0%) |
| $50,000 to $74,999 | 1,288 (96.3%) | 50 (3.7%) |
| $75,000 to $99,999 | 658 (99.1%) | 6 (0.9%) |
| $100,000 and over | 1,548 (96.5%) | 57 (3.5%) |
Public vs Private Health Insurance Coverage by Age in Lolo
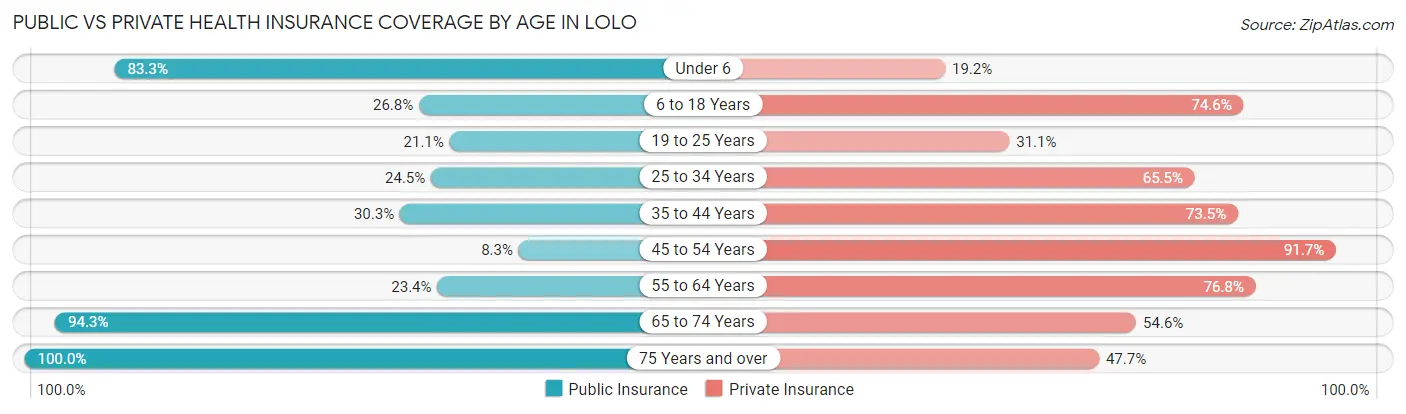
| Age Bracket | Public Insurance | Private Insurance |
| Under 6 | 504 (83.3%) | 116 (19.2%) |
| 6 to 18 Years | 198 (26.8%) | 551 (74.6%) |
| 19 to 25 Years | 91 (21.1%) | 134 (31.1%) |
| 25 to 34 Years | 212 (24.5%) | 566 (65.5%) |
| 35 to 44 Years | 181 (30.3%) | 439 (73.5%) |
| 45 to 54 Years | 42 (8.3%) | 466 (91.7%) |
| 55 to 64 Years | 102 (23.4%) | 335 (76.8%) |
| 65 to 74 Years | 183 (94.3%) | 106 (54.6%) |
| 75 Years and over | 199 (100.0%) | 95 (47.7%) |
| Total | 1,712 (37.4%) | 2,808 (61.4%) |
Disability Status by Sex by Age in Lolo
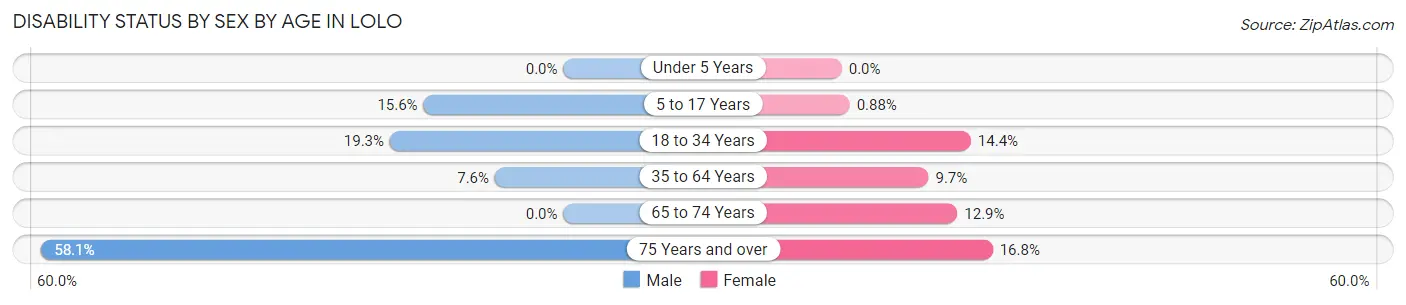
| Age Bracket | Male | Female |
| Under 5 Years | 0 (0.0%) | 0 (0.0%) |
| 5 to 17 Years | 55 (15.6%) | 4 (0.9%) |
| 18 to 34 Years | 130 (19.3%) | 91 (14.4%) |
| 35 to 64 Years | 71 (7.6%) | 59 (9.7%) |
| 65 to 74 Years | 0 (0.0%) | 13 (12.9%) |
| 75 Years and over | 50 (58.1%) | 19 (16.8%) |
Disability Class by Sex by Age in Lolo
Disability Class: Hearing Difficulty
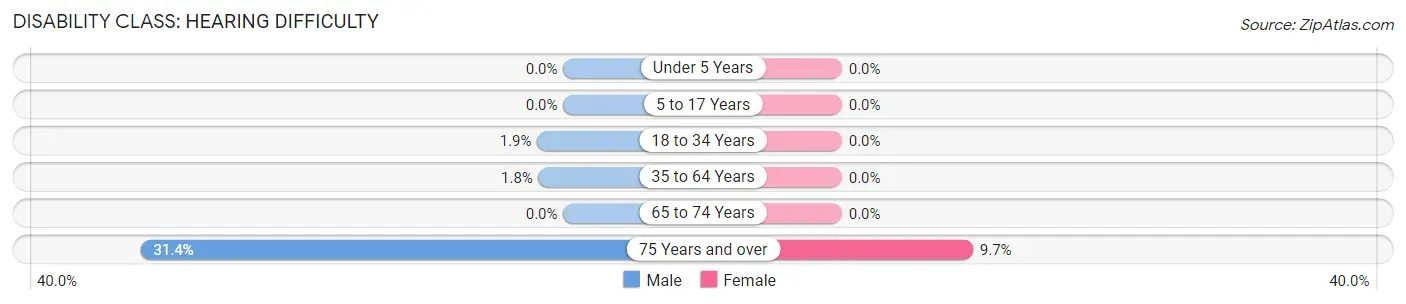
| Age Bracket | Male | Female |
| Under 5 Years | 0 (0.0%) | 0 (0.0%) |
| 5 to 17 Years | 0 (0.0%) | 0 (0.0%) |
| 18 to 34 Years | 13 (1.9%) | 0 (0.0%) |
| 35 to 64 Years | 17 (1.8%) | 0 (0.0%) |
| 65 to 74 Years | 0 (0.0%) | 0 (0.0%) |
| 75 Years and over | 27 (31.4%) | 11 (9.7%) |
Disability Class: Vision Difficulty
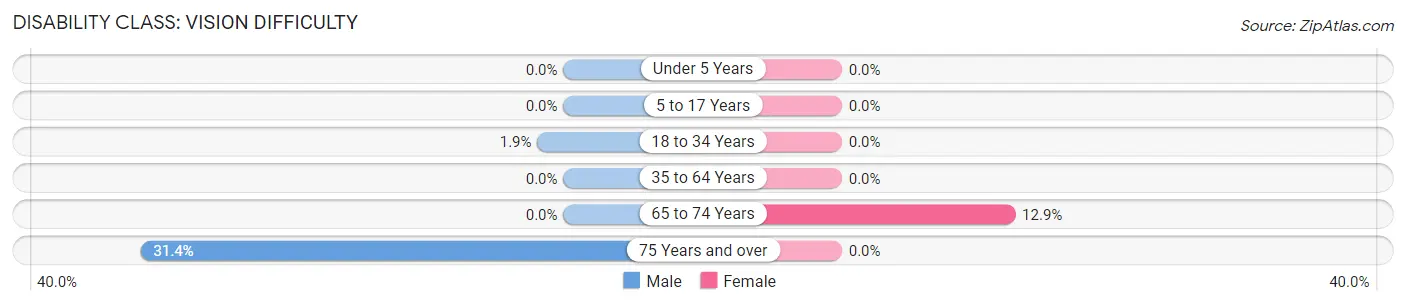
| Age Bracket | Male | Female |
| Under 5 Years | 0 (0.0%) | 0 (0.0%) |
| 5 to 17 Years | 0 (0.0%) | 0 (0.0%) |
| 18 to 34 Years | 13 (1.9%) | 0 (0.0%) |
| 35 to 64 Years | 0 (0.0%) | 0 (0.0%) |
| 65 to 74 Years | 0 (0.0%) | 13 (12.9%) |
| 75 Years and over | 27 (31.4%) | 0 (0.0%) |
Disability Class: Cognitive Difficulty
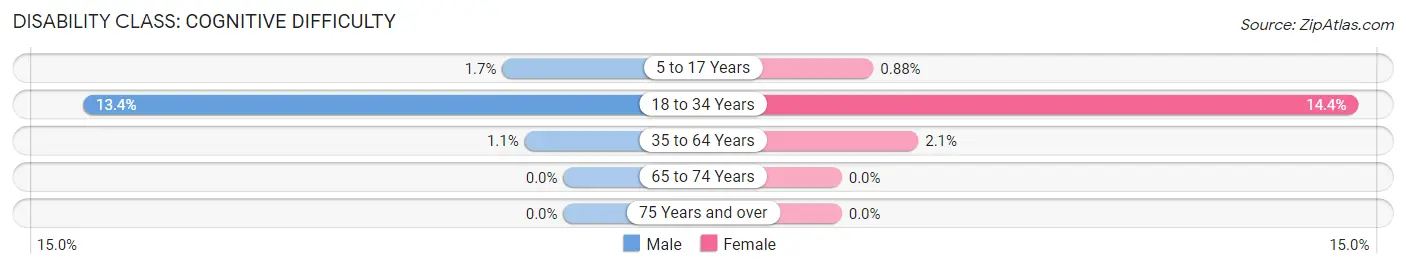
| Age Bracket | Male | Female |
| 5 to 17 Years | 6 (1.7%) | 4 (0.9%) |
| 18 to 34 Years | 90 (13.4%) | 91 (14.4%) |
| 35 to 64 Years | 10 (1.1%) | 13 (2.1%) |
| 65 to 74 Years | 0 (0.0%) | 0 (0.0%) |
| 75 Years and over | 0 (0.0%) | 0 (0.0%) |
Disability Class: Ambulatory Difficulty
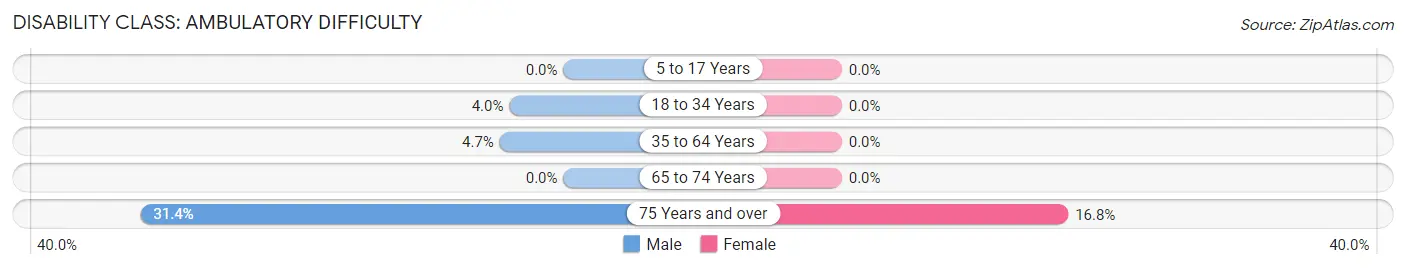
| Age Bracket | Male | Female |
| 5 to 17 Years | 0 (0.0%) | 0 (0.0%) |
| 18 to 34 Years | 27 (4.0%) | 0 (0.0%) |
| 35 to 64 Years | 44 (4.7%) | 0 (0.0%) |
| 65 to 74 Years | 0 (0.0%) | 0 (0.0%) |
| 75 Years and over | 27 (31.4%) | 19 (16.8%) |
Disability Class: Self-Care Difficulty
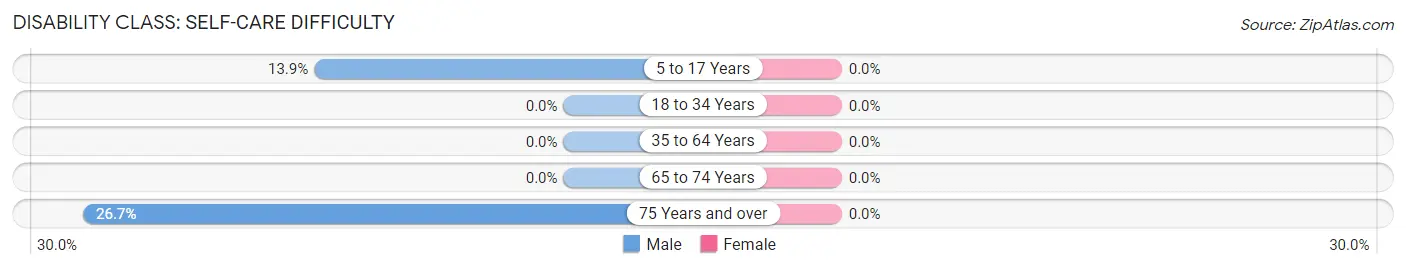
| Age Bracket | Male | Female |
| 5 to 17 Years | 49 (13.9%) | 0 (0.0%) |
| 18 to 34 Years | 0 (0.0%) | 0 (0.0%) |
| 35 to 64 Years | 0 (0.0%) | 0 (0.0%) |
| 65 to 74 Years | 0 (0.0%) | 0 (0.0%) |
| 75 Years and over | 23 (26.7%) | 0 (0.0%) |
Technology Access in Lolo
Computing Device Access in Lolo
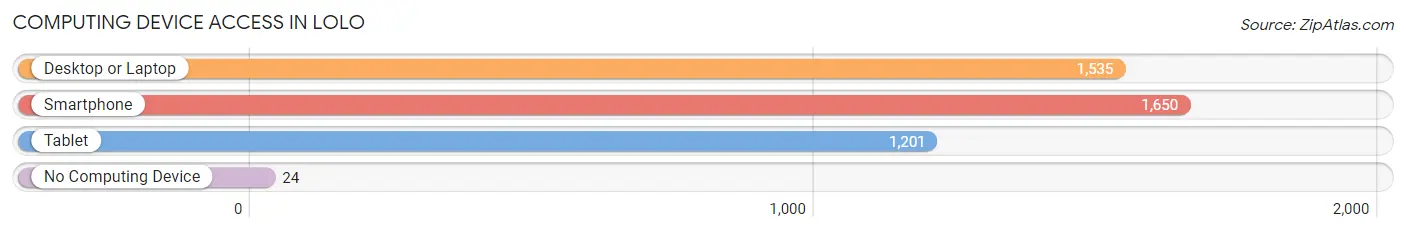
| Device Type | # Households | % Households |
| Desktop or Laptop | 1,535 | 84.0% |
| Smartphone | 1,650 | 90.3% |
| Tablet | 1,201 | 65.7% |
| No Computing Device | 24 | 1.3% |
| Total | 1,828 | 100.0% |
Internet Access in Lolo
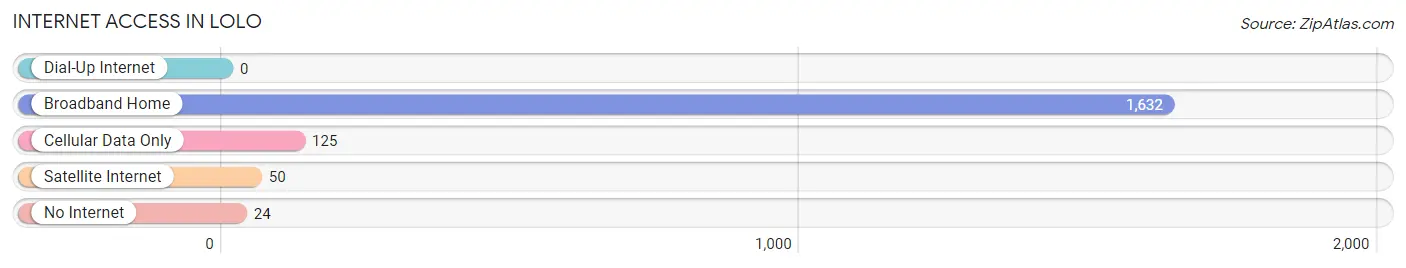
| Internet Type | # Households | % Households |
| Dial-Up Internet | 0 | 0.0% |
| Broadband Home | 1,632 | 89.3% |
| Cellular Data Only | 125 | 6.8% |
| Satellite Internet | 50 | 2.7% |
| No Internet | 24 | 1.3% |
| Total | 1,828 | 100.0% |
Lolo Summary
Lolo, Montana is a small town located in Missoula County, Montana. It is situated in the western part of the state, just south of Missoula. The town was founded in 1877 and is named after the Lolo Creek, which runs through the area. The population of Lolo was 1,845 in the 2010 census.
History
Lolo was founded in 1877 by a group of settlers from the Midwest. The town was originally called “Lolo Creek” after the creek that runs through the area. The name was later changed to Lolo. The town was originally a farming community, but it soon became a logging town as well. The first sawmill was built in 1883 and the first railroad line was built in 1887.
The town grew steadily throughout the late 19th and early 20th centuries. In the 1920s, the town was home to a number of businesses, including a hotel, a bank, a movie theater, and a variety of stores. The town also had a school, a post office, and a library.
Geography
Lolo is located in western Montana, just south of Missoula. The town is situated in the Bitterroot Valley, which is surrounded by the Bitterroot Mountains. The town is located at an elevation of 3,400 feet. The climate in Lolo is generally mild, with hot summers and cold winters.
The town is located along the Lolo Creek, which is a tributary of the Clark Fork River. The creek is a popular spot for fishing and other recreational activities. The town is also located near the Lolo National Forest, which is a popular destination for camping, hiking, and other outdoor activities.
Economy
The economy of Lolo is largely based on agriculture and tourism. The town is home to a number of farms, which produce a variety of crops, including wheat, barley, oats, and hay. The town is also home to a number of tourist attractions, including the Lolo National Forest, the Lolo Creek, and the Bitterroot Valley.
The town is also home to a number of businesses, including restaurants, hotels, and stores. The town is also home to a number of manufacturing companies, which produce a variety of products, including furniture, clothing, and electronics.
Demographics
The population of Lolo was 1,845 in the 2010 census. The town is predominantly white, with 95.3% of the population identifying as white. The town is also home to a small Hispanic population, with 4.2% of the population identifying as Hispanic or Latino. The town is also home to a small Native American population, with 0.5% of the population identifying as Native American.
The median household income in Lolo is $45,813, which is slightly lower than the national median of $50,221. The median home value in Lolo is $179,400, which is slightly higher than the national median of $176,700. The town has a poverty rate of 11.2%, which is slightly higher than the national average of 10.5%.
Conclusion
Lolo, Montana is a small town located in Missoula County, Montana. The town was founded in 1877 and is named after the Lolo Creek, which runs through the area. The town is largely based on agriculture and tourism, and is home to a number of businesses, including restaurants, hotels, and stores. The population of Lolo was 1,845 in the 2010 census, and the town is predominantly white, with 95.3% of the population identifying as white. The median household income in Lolo is $45,813, and the median home value is $179,400. The town has a poverty rate of 11.2%.
Common Questions
What is Per Capita Income in Lolo?
Per Capita income in Lolo is $33,259.
What is the Median Family Income in Lolo?
Median Family Income in Lolo is $83,380.
What is the Median Household income in Lolo?
Median Household Income in Lolo is $69,035.
What is Income or Wage Gap in Lolo?
Income or Wage Gap in Lolo is 38.0%.
Women in Lolo earn 62.0 cents for every dollar earned by a man.
What is Inequality or Gini Index in Lolo?
Inequality or Gini Index in Lolo is 0.40.
What is the Total Population of Lolo?
Total Population of Lolo is 4,573.
What is the Total Male Population of Lolo?
Total Male Population of Lolo is 2,449.
What is the Total Female Population of Lolo?
Total Female Population of Lolo is 2,124.
What is the Ratio of Males per 100 Females in Lolo?
There are 115.30 Males per 100 Females in Lolo.
What is the Ratio of Females per 100 Males in Lolo?
There are 86.73 Females per 100 Males in Lolo.
What is the Median Population Age in Lolo?
Median Population Age in Lolo is 31.5 Years.
What is the Average Family Size in Lolo
Average Family Size in Lolo is 3.0 People.
What is the Average Household Size in Lolo
Average Household Size in Lolo is 2.5 People.
How Large is the Labor Force in Lolo?
There are 2,289 People in the Labor Forcein in Lolo.
What is the Percentage of People in the Labor Force in Lolo?
69.5% of People are in the Labor Force in Lolo.
What is the Unemployment Rate in Lolo?
Unemployment Rate in Lolo is 1.0%.