Big Sandy, MT Map & Demographics
Big Sandy Map
Big Sandy Overview
$26,656
PER CAPITA INCOME
$87,250
AVG FAMILY INCOME
$47,169
AVG HOUSEHOLD INCOME
1.1%
WAGE / INCOME GAP [ % ]
98.9¢/ $1
WAGE / INCOME GAP [ $ ]
0.42
INEQUALITY / GINI INDEX
798
TOTAL POPULATION
329
MALE POPULATION
469
FEMALE POPULATION
70.15
MALES / 100 FEMALES
142.55
FEMALES / 100 MALES
43.5
MEDIAN AGE
4.0
AVG FAMILY SIZE
2.7
AVG HOUSEHOLD SIZE
367
LABOR FORCE [ PEOPLE ]
58.3%
PERCENT IN LABOR FORCE
11.7%
UNEMPLOYMENT RATE
Big Sandy Zip Codes
Big Sandy Area Codes
Income in Big Sandy
Income Overview in Big Sandy
Per Capita Income in Big Sandy is $26,656, while median incomes of families and households are $87,250 and $47,169 respectively.
| Characteristic | Number | Measure |
| Per Capita Income | 798 | $26,656 |
| Median Family Income | 160 | $87,250 |
| Mean Family Income | 160 | $90,271 |
| Median Household Income | 289 | $47,169 |
| Mean Household Income | 289 | $68,500 |
| Income Deficit | 160 | $0 |
| Wage / Income Gap (%) | 798 | 1.15% |
| Wage / Income Gap ($) | 798 | 98.85¢ per $1 |
| Gini / Inequality Index | 798 | 0.42 |
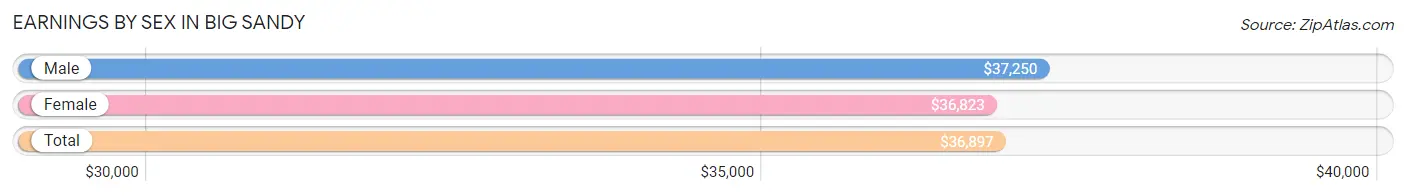
Earnings by Sex in Big Sandy
Average Earnings in Big Sandy are $36,897, $37,250 for men and $36,823 for women, a difference of 1.1%.
| Sex | Number | Average Earnings |
| Male | 155 (45.6%) | $37,250 |
| Female | 185 (54.4%) | $36,823 |
| Total | 340 (100.0%) | $36,897 |
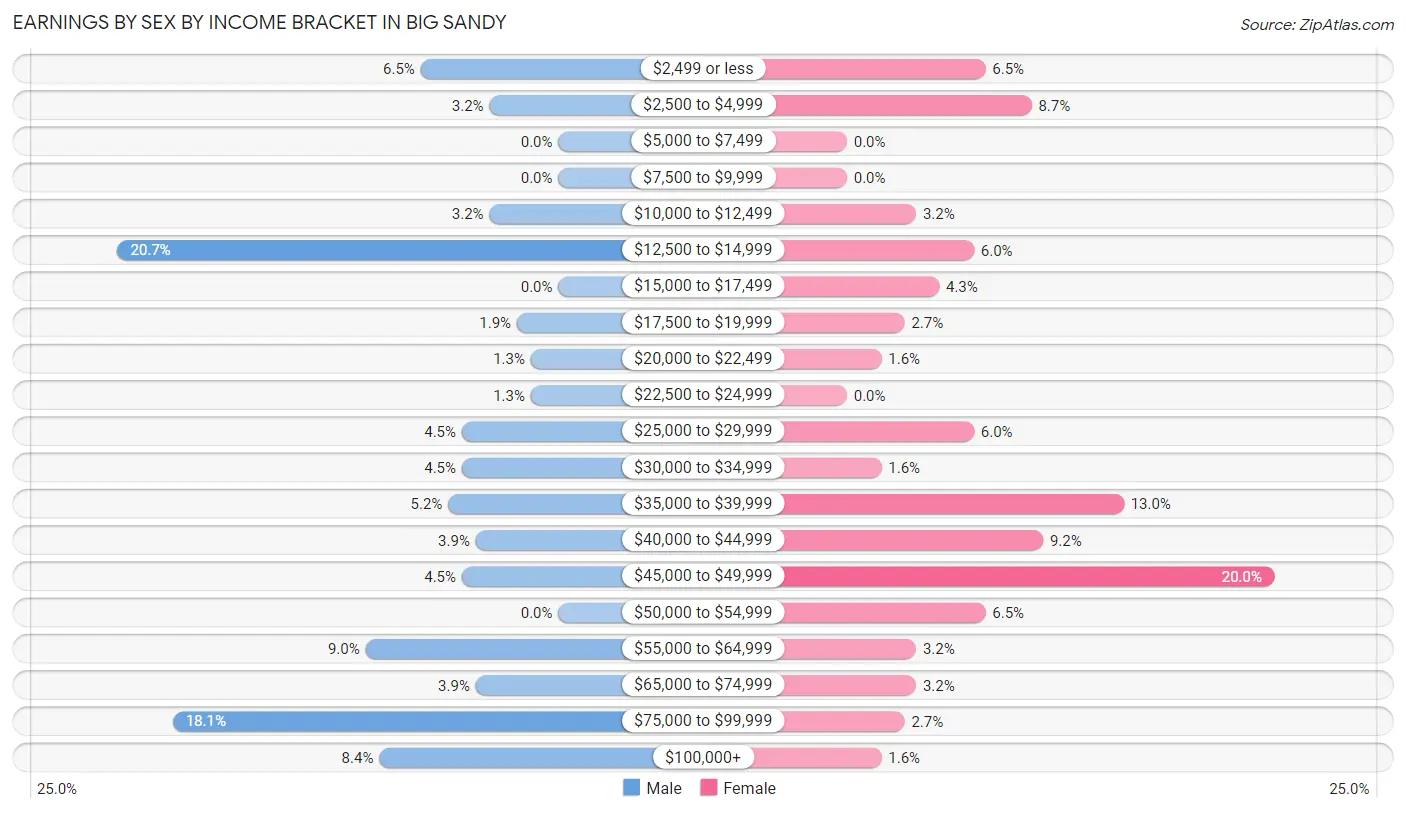
Earnings by Sex by Income Bracket in Big Sandy
The most common earnings brackets in Big Sandy are $12,500 to $14,999 for men (32 | 20.6%) and $45,000 to $49,999 for women (37 | 20.0%).
| Income | Male | Female |
| $2,499 or less | 10 (6.5%) | 12 (6.5%) |
| $2,500 to $4,999 | 5 (3.2%) | 16 (8.6%) |
| $5,000 to $7,499 | 0 (0.0%) | 0 (0.0%) |
| $7,500 to $9,999 | 0 (0.0%) | 0 (0.0%) |
| $10,000 to $12,499 | 5 (3.2%) | 6 (3.2%) |
| $12,500 to $14,999 | 32 (20.6%) | 11 (5.9%) |
| $15,000 to $17,499 | 0 (0.0%) | 8 (4.3%) |
| $17,500 to $19,999 | 3 (1.9%) | 5 (2.7%) |
| $20,000 to $22,499 | 2 (1.3%) | 3 (1.6%) |
| $22,500 to $24,999 | 2 (1.3%) | 0 (0.0%) |
| $25,000 to $29,999 | 7 (4.5%) | 11 (5.9%) |
| $30,000 to $34,999 | 7 (4.5%) | 3 (1.6%) |
| $35,000 to $39,999 | 8 (5.2%) | 24 (13.0%) |
| $40,000 to $44,999 | 6 (3.9%) | 17 (9.2%) |
| $45,000 to $49,999 | 7 (4.5%) | 37 (20.0%) |
| $50,000 to $54,999 | 0 (0.0%) | 12 (6.5%) |
| $55,000 to $64,999 | 14 (9.0%) | 6 (3.2%) |
| $65,000 to $74,999 | 6 (3.9%) | 6 (3.2%) |
| $75,000 to $99,999 | 28 (18.1%) | 5 (2.7%) |
| $100,000+ | 13 (8.4%) | 3 (1.6%) |
| Total | 155 (100.0%) | 185 (100.0%) |
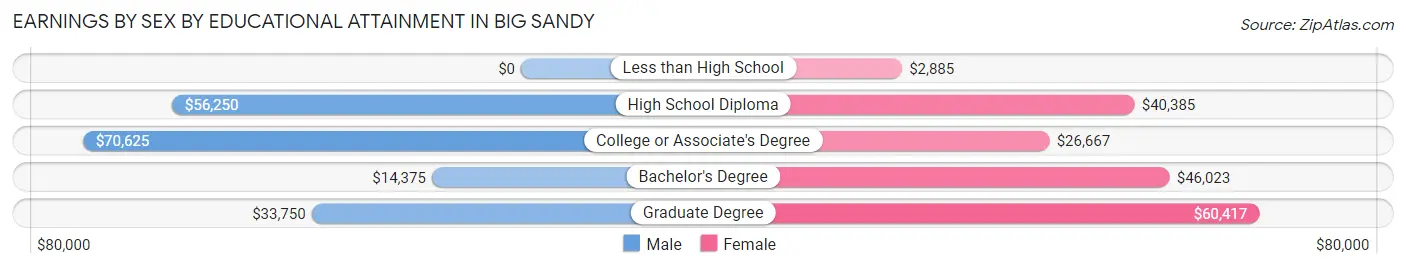
Earnings by Sex by Educational Attainment in Big Sandy
Average earnings in Big Sandy are $47,143 for men and $37,216 for women, a difference of 21.1%. Men with an educational attainment of college or associate's degree enjoy the highest average annual earnings of $70,625, while those with bachelor's degree education earn the least with $14,375. Women with an educational attainment of graduate degree earn the most with the average annual earnings of $60,417, while those with less than high school education have the smallest earnings of $2,885.
| Educational Attainment | Male Income | Female Income |
| Less than High School | - | - |
| High School Diploma | $56,250 | $40,385 |
| College or Associate's Degree | $70,625 | $26,667 |
| Bachelor's Degree | $14,375 | $46,023 |
| Graduate Degree | $33,750 | $60,417 |
| Total | $47,143 | $37,216 |
Family Income in Big Sandy
Family Income Brackets in Big Sandy
According to the Big Sandy family income data, there are 61 families falling into the $100,000 to $149,999 income range, which is the most common income bracket and makes up 38.1% of all families.
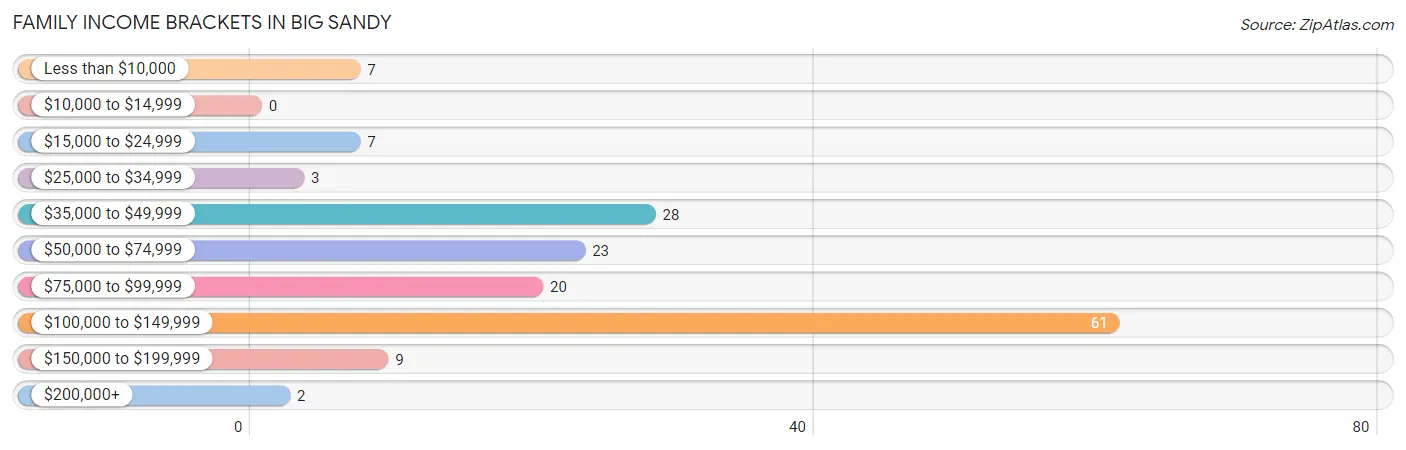
| Income Bracket | # Families | % Families |
| Less than $10,000 | 7 | 4.4% |
| $10,000 to $14,999 | 0 | 0.0% |
| $15,000 to $24,999 | 7 | 4.4% |
| $25,000 to $34,999 | 3 | 1.9% |
| $35,000 to $49,999 | 28 | 17.5% |
| $50,000 to $74,999 | 23 | 14.4% |
| $75,000 to $99,999 | 20 | 12.5% |
| $100,000 to $149,999 | 61 | 38.1% |
| $150,000 to $199,999 | 9 | 5.6% |
| $200,000+ | 2 | 1.3% |
Family Income by Famaliy Size in Big Sandy
6-person families (21 | 13.1%) account for the highest median family income in Big Sandy with $116,094 per family, while 3-person families (23 | 14.4%) have the highest median income of $35,365 per family member.
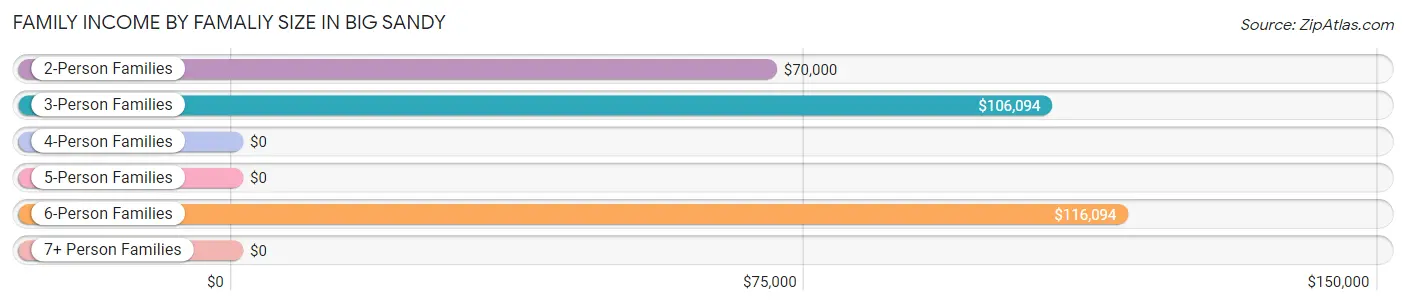
| Income Bracket | # Families | Median Income |
| 2-Person Families | 64 (40.0%) | $70,000 |
| 3-Person Families | 23 (14.4%) | $106,094 |
| 4-Person Families | 27 (16.9%) | $0 |
| 5-Person Families | 25 (15.6%) | $0 |
| 6-Person Families | 21 (13.1%) | $116,094 |
| 7+ Person Families | 0 (0.0%) | $0 |
| Total | 160 (100.0%) | $87,250 |
Family Income by Number of Earners in Big Sandy
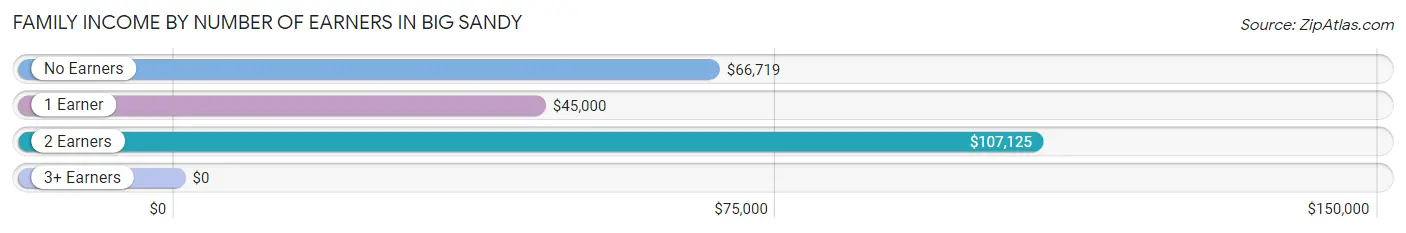
| Number of Earners | # Families | Median Income |
| No Earners | 31 (19.4%) | $66,719 |
| 1 Earner | 36 (22.5%) | $45,000 |
| 2 Earners | 89 (55.6%) | $107,125 |
| 3+ Earners | 4 (2.5%) | $0 |
| Total | 160 (100.0%) | $87,250 |
Household Income in Big Sandy
Household Income Brackets in Big Sandy
With 63 households falling in the category, the $100,000 to $149,999 income range is the most frequent in Big Sandy, accounting for 21.8% of all households. In contrast, only 3 households (1.0%) fall into the $200,000+ income bracket, making it the least populous group.
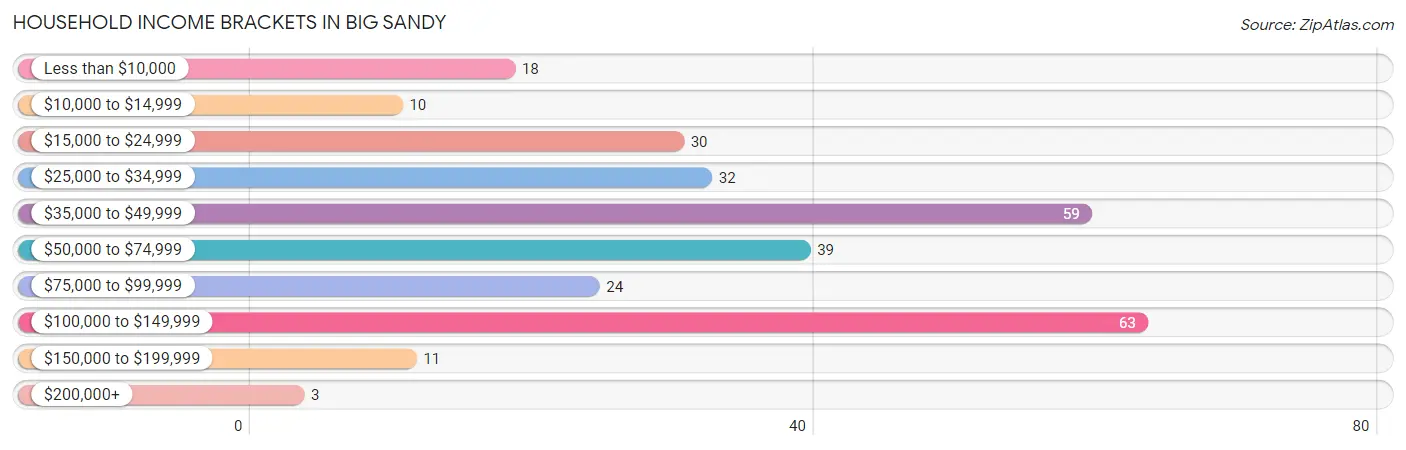
| Income Bracket | # Households | % Households |
| Less than $10,000 | 18 | 6.2% |
| $10,000 to $14,999 | 10 | 3.5% |
| $15,000 to $24,999 | 30 | 10.4% |
| $25,000 to $34,999 | 32 | 11.1% |
| $35,000 to $49,999 | 59 | 20.4% |
| $50,000 to $74,999 | 39 | 13.5% |
| $75,000 to $99,999 | 24 | 8.3% |
| $100,000 to $149,999 | 63 | 21.8% |
| $150,000 to $199,999 | 11 | 3.8% |
| $200,000+ | 3 | 1.0% |
Household Income by Householder Age in Big Sandy
The median household income in Big Sandy is $47,169, with the highest median household income of $53,750 found in the 65+ years age bracket for the primary householder. A total of 93 households (32.2%) fall into this category. Meanwhile, the 15 to 24 years age bracket for the primary householder has the lowest median household income of $0, with 2 households (0.7%) in this group.
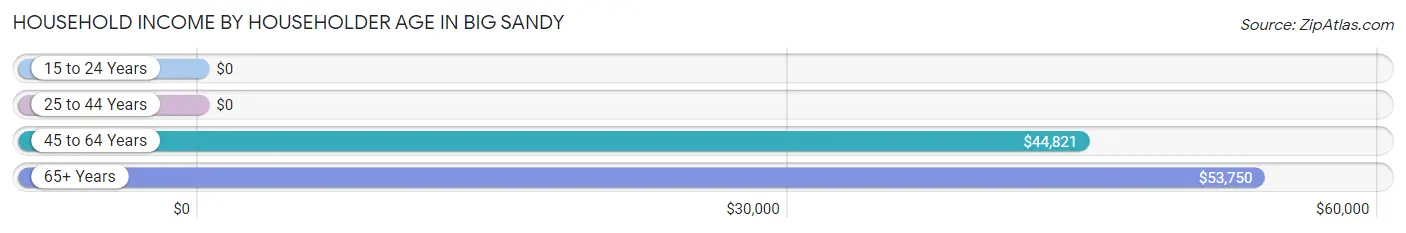
| Income Bracket | # Households | Median Income |
| 15 to 24 Years | 2 (0.7%) | $0 |
| 25 to 44 Years | 103 (35.6%) | $0 |
| 45 to 64 Years | 91 (31.5%) | $44,821 |
| 65+ Years | 93 (32.2%) | $53,750 |
| Total | 289 (100.0%) | $47,169 |
Poverty in Big Sandy
Income Below Poverty by Sex and Age in Big Sandy
With 8.2% poverty level for males and 11.9% for females among the residents of Big Sandy, 16 and 17 year old males and under 5 year old females are the most vulnerable to poverty, with 5 males (71.4%) and 6 females (100.0%) in their respective age groups living below the poverty level.
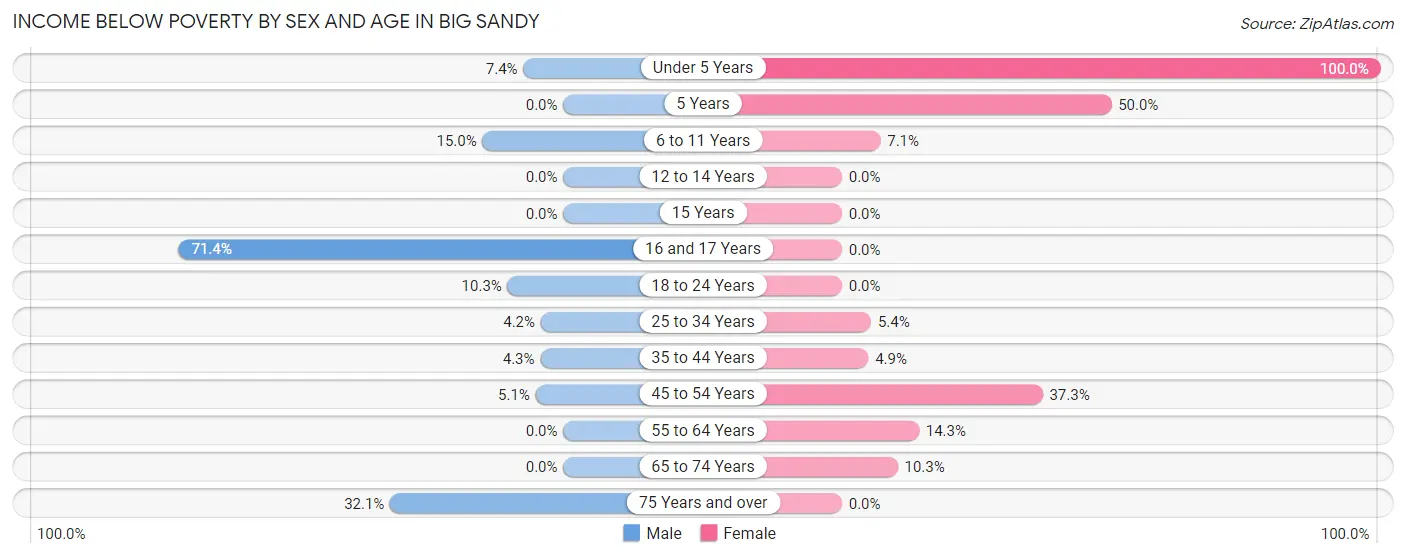
| Age Bracket | Male | Female |
| Under 5 Years | 2 (7.4%) | 6 (100.0%) |
| 5 Years | 0 (0.0%) | 4 (50.0%) |
| 6 to 11 Years | 3 (15.0%) | 4 (7.1%) |
| 12 to 14 Years | 0 (0.0%) | 0 (0.0%) |
| 15 Years | 0 (0.0%) | 0 (0.0%) |
| 16 and 17 Years | 5 (71.4%) | 0 (0.0%) |
| 18 to 24 Years | 3 (10.3%) | 0 (0.0%) |
| 25 to 34 Years | 1 (4.2%) | 2 (5.4%) |
| 35 to 44 Years | 2 (4.3%) | 5 (4.9%) |
| 45 to 54 Years | 2 (5.1%) | 19 (37.2%) |
| 55 to 64 Years | 0 (0.0%) | 10 (14.3%) |
| 65 to 74 Years | 0 (0.0%) | 6 (10.3%) |
| 75 Years and over | 9 (32.1%) | 0 (0.0%) |
| Total | 27 (8.2%) | 56 (11.9%) |
Income Above Poverty by Sex and Age in Big Sandy
According to the poverty statistics in Big Sandy, males aged 5 years and females aged 12 to 14 years are the age groups that are most secure financially, with 100.0% of males and 100.0% of females in these age groups living above the poverty line.
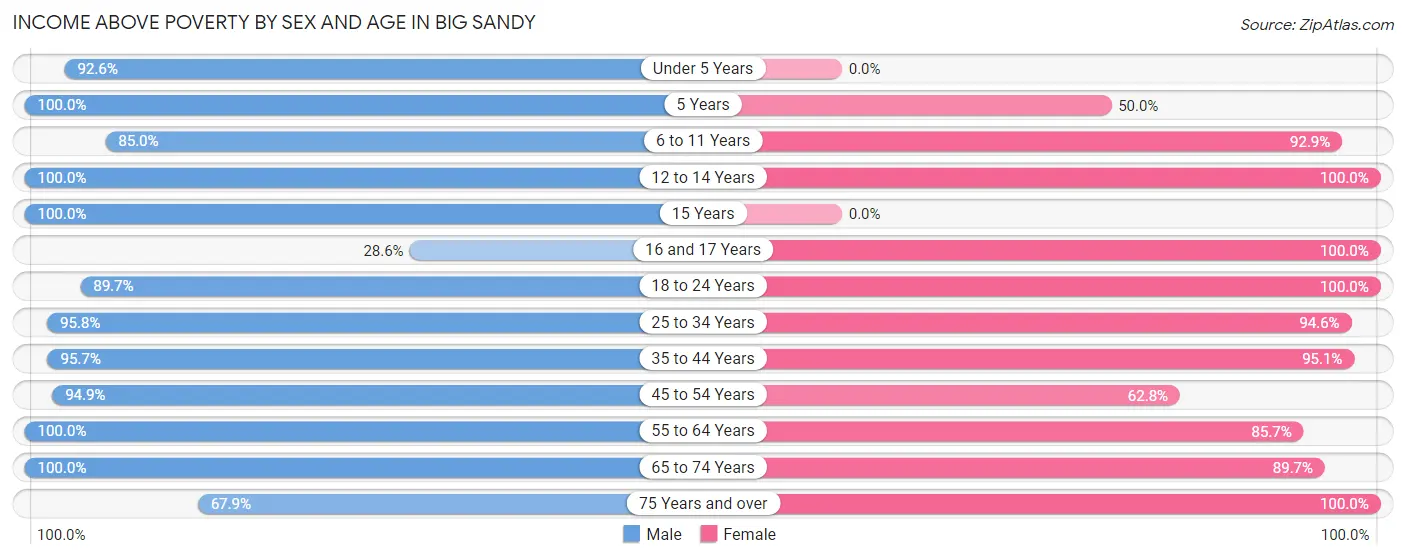
| Age Bracket | Male | Female |
| Under 5 Years | 25 (92.6%) | 0 (0.0%) |
| 5 Years | 5 (100.0%) | 4 (50.0%) |
| 6 to 11 Years | 17 (85.0%) | 52 (92.9%) |
| 12 to 14 Years | 13 (100.0%) | 27 (100.0%) |
| 15 Years | 7 (100.0%) | 0 (0.0%) |
| 16 and 17 Years | 2 (28.6%) | 25 (100.0%) |
| 18 to 24 Years | 26 (89.7%) | 8 (100.0%) |
| 25 to 34 Years | 23 (95.8%) | 35 (94.6%) |
| 35 to 44 Years | 45 (95.7%) | 97 (95.1%) |
| 45 to 54 Years | 37 (94.9%) | 32 (62.7%) |
| 55 to 64 Years | 39 (100.0%) | 60 (85.7%) |
| 65 to 74 Years | 44 (100.0%) | 52 (89.7%) |
| 75 Years and over | 19 (67.9%) | 21 (100.0%) |
| Total | 302 (91.8%) | 413 (88.1%) |
Income Below Poverty Among Married-Couple Families in Big Sandy
The poverty statistics for married-couple families in Big Sandy show that 6.1% or 8 of the total 130 families live below the poverty line. Families with 3 or 4 children have the highest poverty rate of 17.6%, comprising of 3 families. On the other hand, families with 1 or 2 children have the lowest poverty rate of 0.0%, which includes 0 families.

| Children | Above Poverty | Below Poverty |
| No Children | 56 (91.8%) | 5 (8.2%) |
| 1 or 2 Children | 52 (100.0%) | 0 (0.0%) |
| 3 or 4 Children | 14 (82.4%) | 3 (17.6%) |
| 5 or more Children | 0 (0.0%) | 0 (0.0%) |
| Total | 122 (93.9%) | 8 (6.1%) |
Income Below Poverty Among Single-Parent Households in Big Sandy
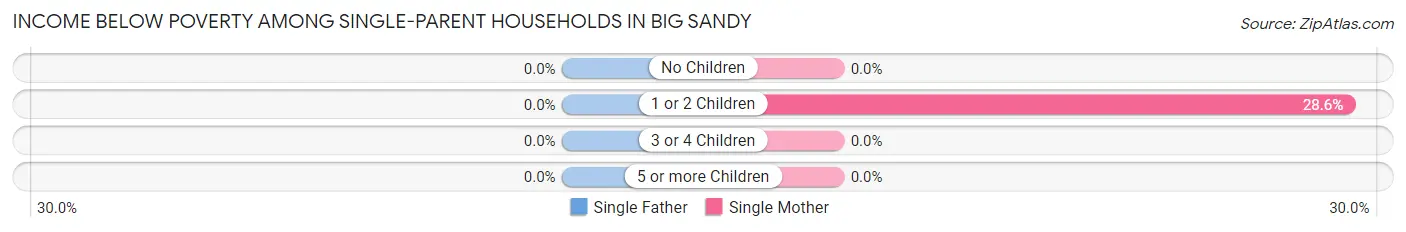
| Children | Single Father | Single Mother |
| No Children | 0 (0.0%) | 0 (0.0%) |
| 1 or 2 Children | 0 (0.0%) | 4 (28.6%) |
| 3 or 4 Children | 0 (0.0%) | 0 (0.0%) |
| 5 or more Children | 0 (0.0%) | 0 (0.0%) |
| Total | 0 (0.0%) | 4 (28.6%) |
Income Below Poverty Among Married-Couple vs Single-Parent Households in Big Sandy
The poverty data for Big Sandy shows that 8 of the married-couple family households (6.1%) and 4 of the single-parent households (13.3%) are living below the poverty level. Within the married-couple family households, those with 3 or 4 children have the highest poverty rate, with 3 households (17.6%) falling below the poverty line. Among the single-parent households, those with 1 or 2 children have the highest poverty rate, with 4 household (28.6%) living below poverty.
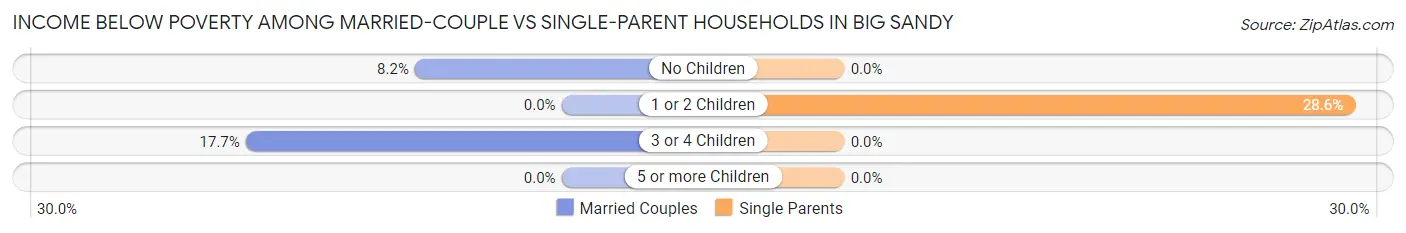
| Children | Married-Couple Families | Single-Parent Households |
| No Children | 5 (8.2%) | 0 (0.0%) |
| 1 or 2 Children | 0 (0.0%) | 4 (28.6%) |
| 3 or 4 Children | 3 (17.6%) | 0 (0.0%) |
| 5 or more Children | 0 (0.0%) | 0 (0.0%) |
| Total | 8 (6.1%) | 4 (13.3%) |
Race in Big Sandy
The most populous races in Big Sandy are White / Caucasian (647 | 81.1%), Two or more Races (93 | 11.7%), and Native / Alaskan (33 | 4.1%).
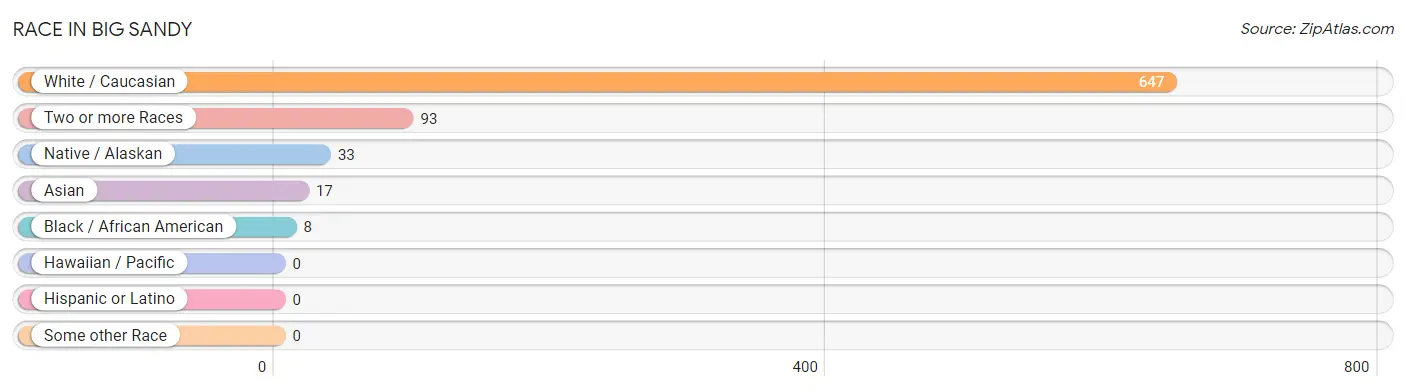
| Race | # Population | % Population |
| Asian | 17 | 2.1% |
| Black / African American | 8 | 1.0% |
| Hawaiian / Pacific | 0 | 0.0% |
| Hispanic or Latino | 0 | 0.0% |
| Native / Alaskan | 33 | 4.1% |
| White / Caucasian | 647 | 81.1% |
| Two or more Races | 93 | 11.7% |
| Some other Race | 0 | 0.0% |
| Total | 798 | 100.0% |
Ancestry in Big Sandy
The most populous ancestries reported in Big Sandy are German (148 | 18.5%), American (120 | 15.0%), Norwegian (112 | 14.0%), Irish (70 | 8.8%), and English (50 | 6.3%), together accounting for 62.7% of all Big Sandy residents.
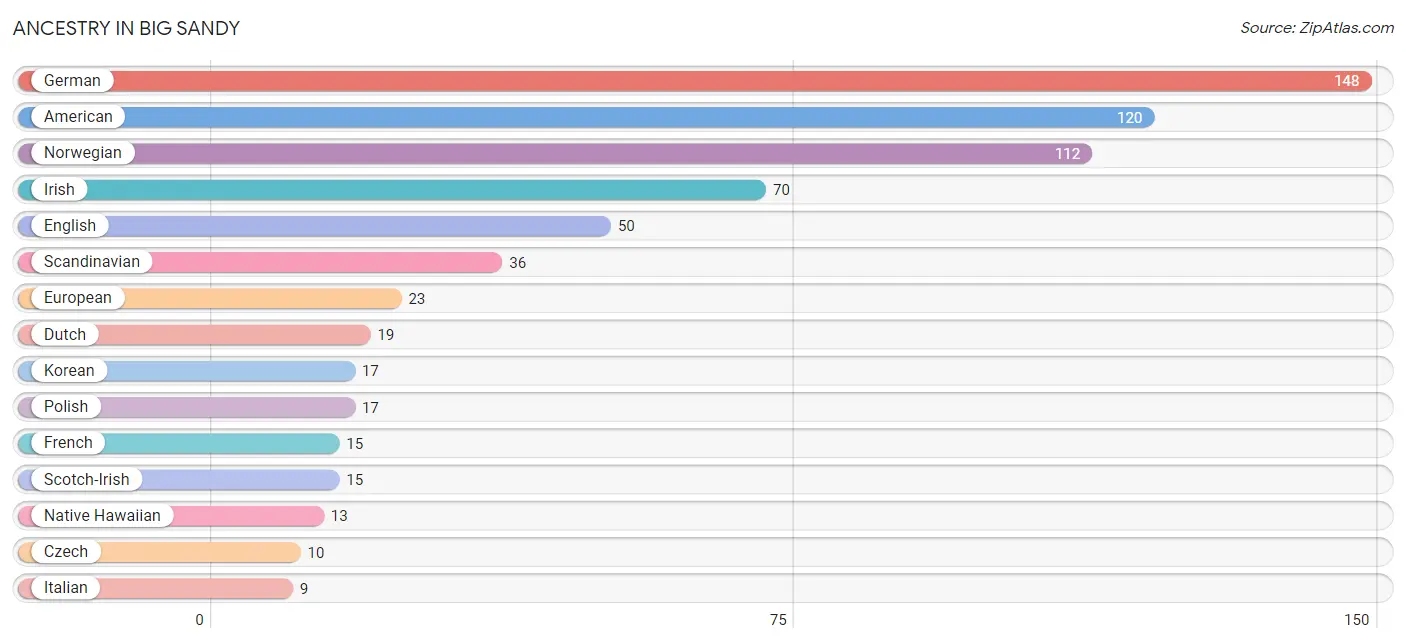
| Ancestry | # Population | % Population |
| American | 120 | 15.0% |
| British | 2 | 0.3% |
| Czech | 10 | 1.3% |
| Czechoslovakian | 2 | 0.3% |
| Danish | 5 | 0.6% |
| Dutch | 19 | 2.4% |
| English | 50 | 6.3% |
| European | 23 | 2.9% |
| French | 15 | 1.9% |
| German | 148 | 18.5% |
| Indian (Asian) | 2 | 0.3% |
| Irish | 70 | 8.8% |
| Italian | 9 | 1.1% |
| Korean | 17 | 2.1% |
| Native Hawaiian | 13 | 1.6% |
| Norwegian | 112 | 14.0% |
| Polish | 17 | 2.1% |
| Scandinavian | 36 | 4.5% |
| Scotch-Irish | 15 | 1.9% |
| Scottish | 8 | 1.0% |
| Slovene | 3 | 0.4% |
| Swedish | 2 | 0.3% |
| Swiss | 1 | 0.1% | View All 23 Rows |
Immigrants in Big Sandy
The most numerous immigrant groups reported in Big Sandy came from Asia (15 | 1.9%), South Eastern Asia (15 | 1.9%), Canada (13 | 1.6%), Philippines (13 | 1.6%), and Europe (2 | 0.3%), together accounting for 7.3% of all Big Sandy residents.
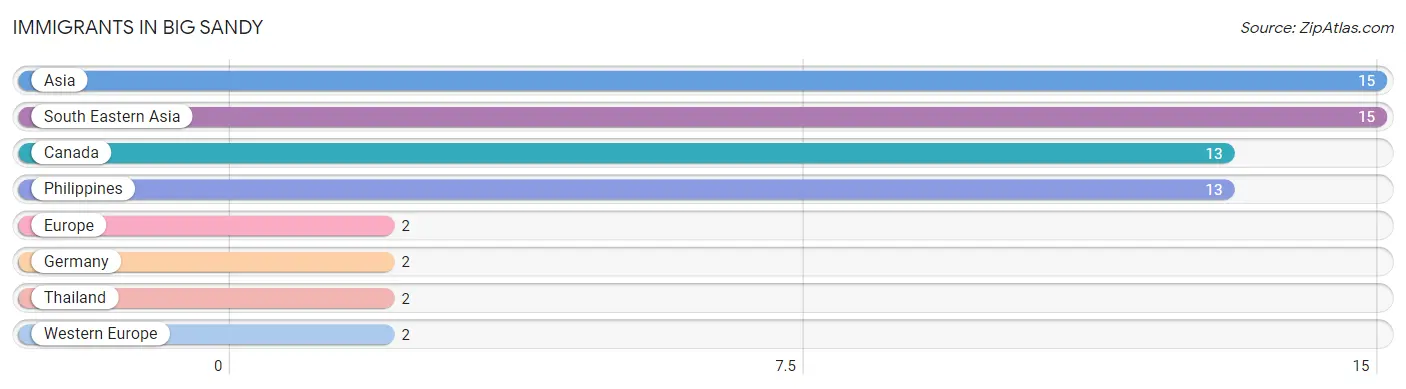
| Immigration Origin | # Population | % Population |
| Asia | 15 | 1.9% |
| Canada | 13 | 1.6% |
| Europe | 2 | 0.3% |
| Germany | 2 | 0.3% |
| Philippines | 13 | 1.6% |
| South Eastern Asia | 15 | 1.9% |
| Thailand | 2 | 0.3% |
| Western Europe | 2 | 0.3% | View All 8 Rows |
Sex and Age in Big Sandy
Sex and Age in Big Sandy
The most populous age groups in Big Sandy are 70 to 74 Years (34 | 10.3%) for men and 40 to 44 Years (70 | 14.9%) for women.
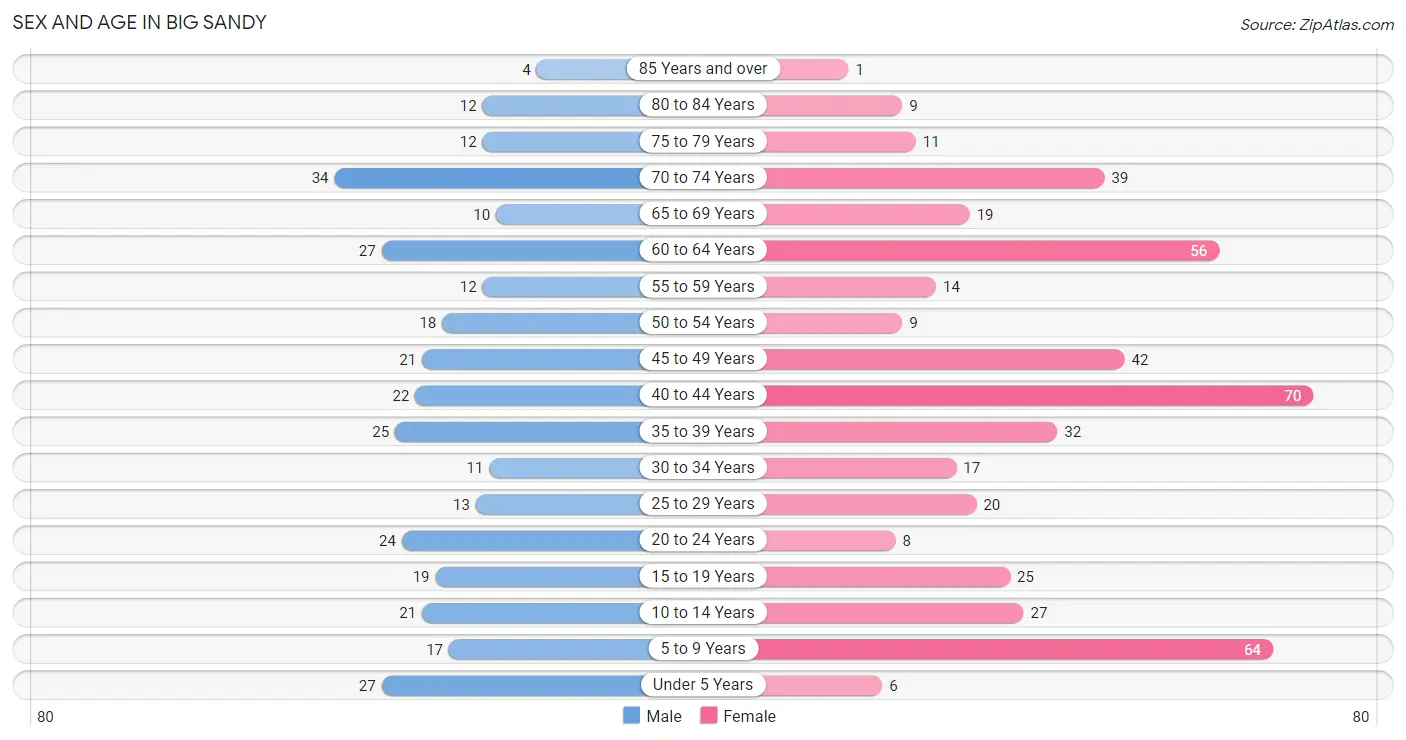
| Age Bracket | Male | Female |
| Under 5 Years | 27 (8.2%) | 6 (1.3%) |
| 5 to 9 Years | 17 (5.2%) | 64 (13.7%) |
| 10 to 14 Years | 21 (6.4%) | 27 (5.8%) |
| 15 to 19 Years | 19 (5.8%) | 25 (5.3%) |
| 20 to 24 Years | 24 (7.3%) | 8 (1.7%) |
| 25 to 29 Years | 13 (4.0%) | 20 (4.3%) |
| 30 to 34 Years | 11 (3.3%) | 17 (3.6%) |
| 35 to 39 Years | 25 (7.6%) | 32 (6.8%) |
| 40 to 44 Years | 22 (6.7%) | 70 (14.9%) |
| 45 to 49 Years | 21 (6.4%) | 42 (9.0%) |
| 50 to 54 Years | 18 (5.5%) | 9 (1.9%) |
| 55 to 59 Years | 12 (3.6%) | 14 (3.0%) |
| 60 to 64 Years | 27 (8.2%) | 56 (11.9%) |
| 65 to 69 Years | 10 (3.0%) | 19 (4.1%) |
| 70 to 74 Years | 34 (10.3%) | 39 (8.3%) |
| 75 to 79 Years | 12 (3.6%) | 11 (2.4%) |
| 80 to 84 Years | 12 (3.6%) | 9 (1.9%) |
| 85 Years and over | 4 (1.2%) | 1 (0.2%) |
| Total | 329 (100.0%) | 469 (100.0%) |
Families and Households in Big Sandy
Median Family Size in Big Sandy
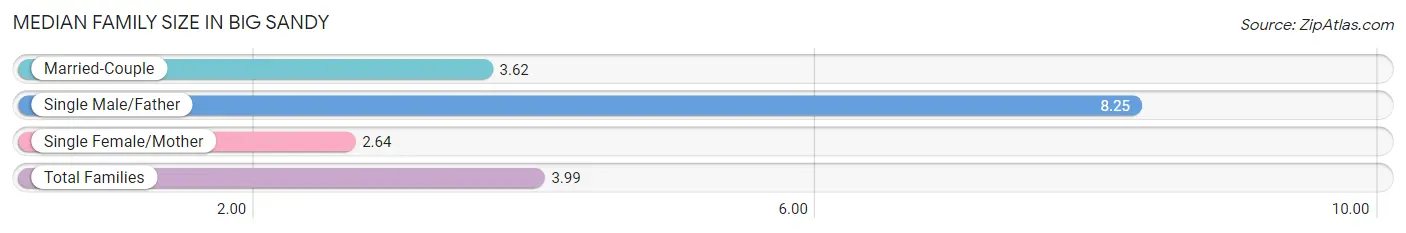
The median family size in Big Sandy is 3.99 persons per family, with single male/father families (16 | 10.0%) accounting for the largest median family size of 8.25 persons per family. On the other hand, single female/mother families (14 | 8.7%) represent the smallest median family size with 2.64 persons per family.
| Family Type | # Families | Family Size |
| Married-Couple | 130 (81.2%) | 3.62 |
| Single Male/Father | 16 (10.0%) | 8.25 |
| Single Female/Mother | 14 (8.7%) | 2.64 |
| Total Families | 160 (100.0%) | 3.99 |
Median Household Size in Big Sandy
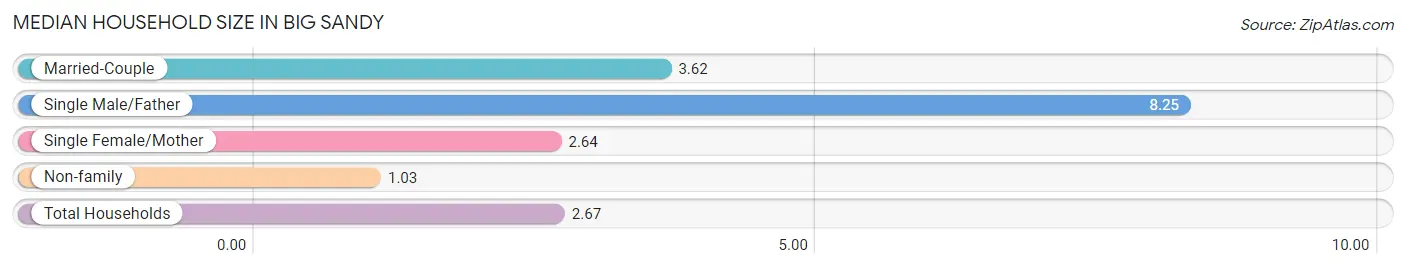
The median household size in Big Sandy is 2.67 persons per household, with single male/father households (16 | 5.5%) accounting for the largest median household size of 8.25 persons per household. non-family households (129 | 44.6%) represent the smallest median household size with 1.03 persons per household.
| Household Type | # Households | Household Size |
| Married-Couple | 130 (45.0%) | 3.62 |
| Single Male/Father | 16 (5.5%) | 8.25 |
| Single Female/Mother | 14 (4.8%) | 2.64 |
| Non-family | 129 (44.6%) | 1.03 |
| Total Households | 289 (100.0%) | 2.67 |
Household Size by Marriage Status in Big Sandy
Out of a total of 289 households in Big Sandy, 160 (55.4%) are family households, while 129 (44.6%) are nonfamily households. The most numerous type of family households are 2-person households, comprising 64, and the most common type of nonfamily households are 1-person households, comprising 125.
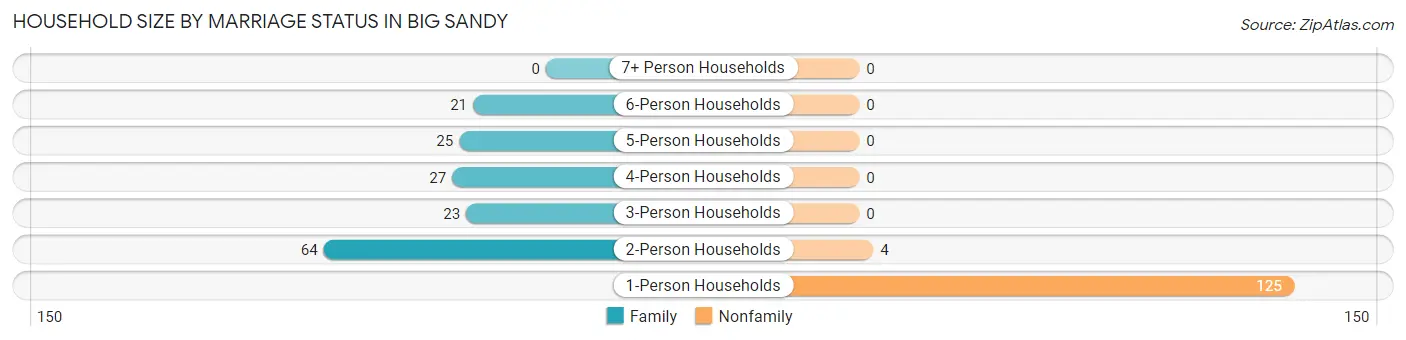
| Household Size | Family Households | Nonfamily Households |
| 1-Person Households | - | 125 (43.2%) |
| 2-Person Households | 64 (22.2%) | 4 (1.4%) |
| 3-Person Households | 23 (8.0%) | 0 (0.0%) |
| 4-Person Households | 27 (9.3%) | 0 (0.0%) |
| 5-Person Households | 25 (8.6%) | 0 (0.0%) |
| 6-Person Households | 21 (7.3%) | 0 (0.0%) |
| 7+ Person Households | 0 (0.0%) | 0 (0.0%) |
| Total | 160 (55.4%) | 129 (44.6%) |
Female Fertility in Big Sandy
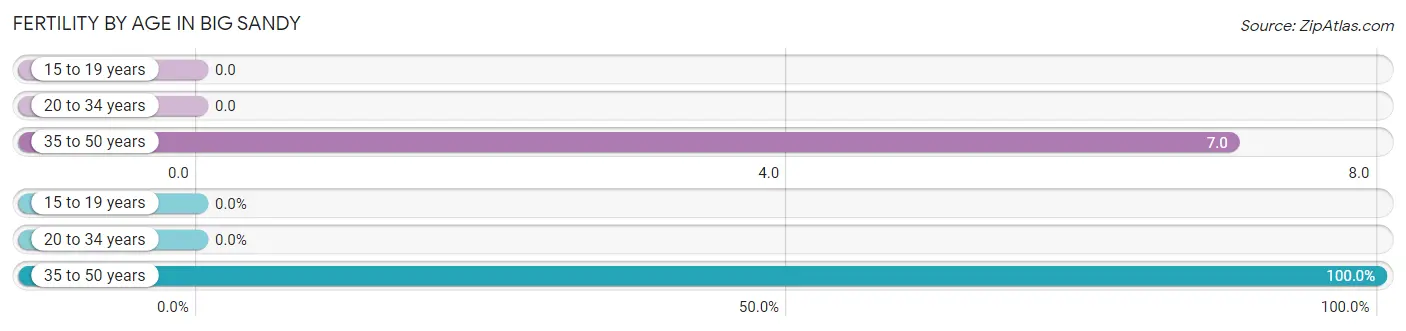
Fertility by Age in Big Sandy
Average fertility rate in Big Sandy is 5.0 births per 1,000 women. Women in the age bracket of 35 to 50 years have the highest fertility rate with 7.0 births per 1,000 women. Women in the age bracket of 35 to 50 years acount for 100.0% of all women with births.
| Age Bracket | Women with Births | Births / 1,000 Women |
| 15 to 19 years | 0 (0.0%) | 0.0 |
| 20 to 34 years | 0 (0.0%) | 0.0 |
| 35 to 50 years | 1 (100.0%) | 7.0 |
| Total | 1 (100.0%) | 5.0 |
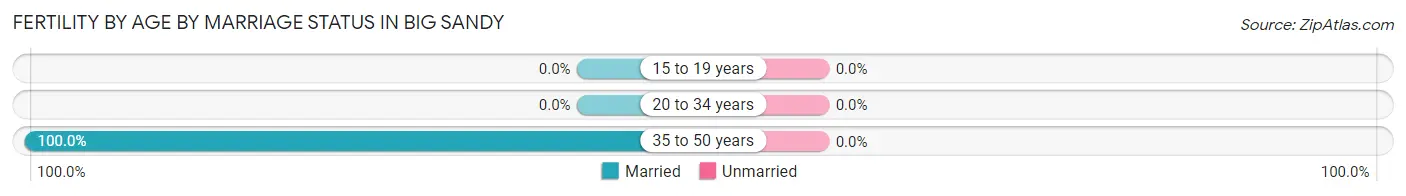
Fertility by Age by Marriage Status in Big Sandy
| Age Bracket | Married | Unmarried |
| 15 to 19 years | 0 (0.0%) | 0 (0.0%) |
| 20 to 34 years | 0 (0.0%) | 0 (0.0%) |
| 35 to 50 years | 1 (100.0%) | 0 (0.0%) |
| Total | 1 (100.0%) | 0 (0.0%) |
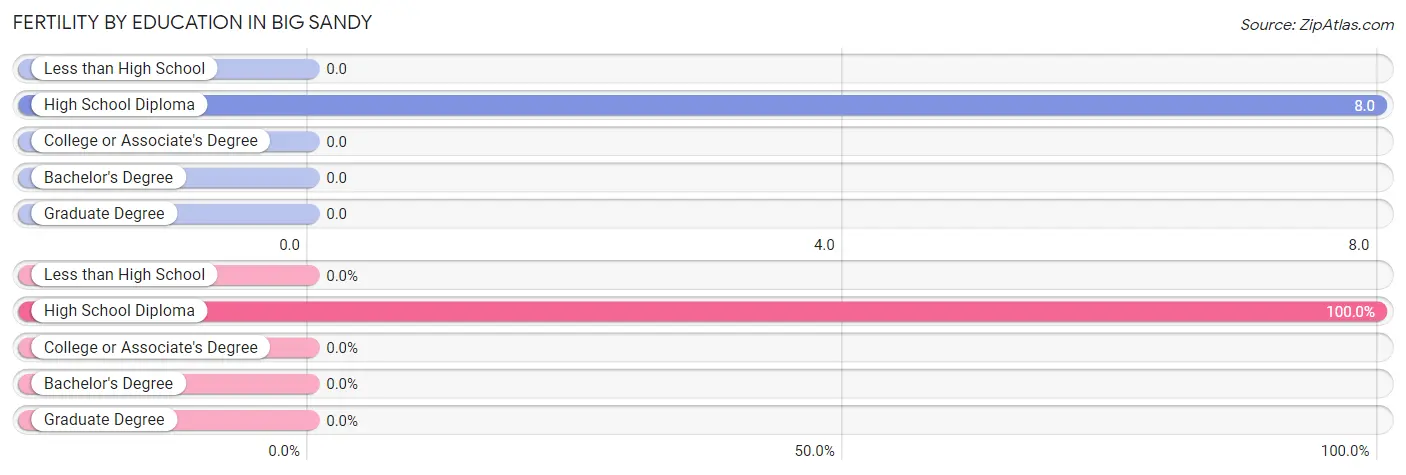
Fertility by Education in Big Sandy
| Educational Attainment | Women with Births | Births / 1,000 Women |
| Less than High School | 0 (0.0%) | 0.0 |
| High School Diploma | 1 (100.0%) | 8.0 |
| College or Associate's Degree | 0 (0.0%) | 0.0 |
| Bachelor's Degree | 0 (0.0%) | 0.0 |
| Graduate Degree | 0 (0.0%) | 0.0 |
| Total | 1 (100.0%) | 5.0 |
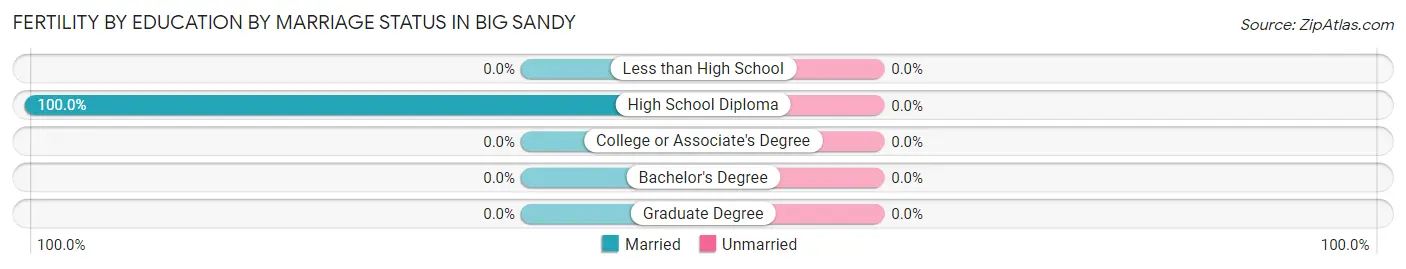
Fertility by Education by Marriage Status in Big Sandy
| Educational Attainment | Married | Unmarried |
| Less than High School | 0 (0.0%) | 0 (0.0%) |
| High School Diploma | 1 (100.0%) | 0 (0.0%) |
| College or Associate's Degree | 0 (0.0%) | 0 (0.0%) |
| Bachelor's Degree | 0 (0.0%) | 0 (0.0%) |
| Graduate Degree | 0 (0.0%) | 0 (0.0%) |
| Total | 1 (100.0%) | 0 (0.0%) |
Employment Characteristics in Big Sandy
Employment by Class of Employer in Big Sandy
Among the 320 employed individuals in Big Sandy, private company employees (119 | 37.2%), not-for-profit organizations (64 | 20.0%), and local government employees (50 | 15.6%) make up the most common classes of employment.
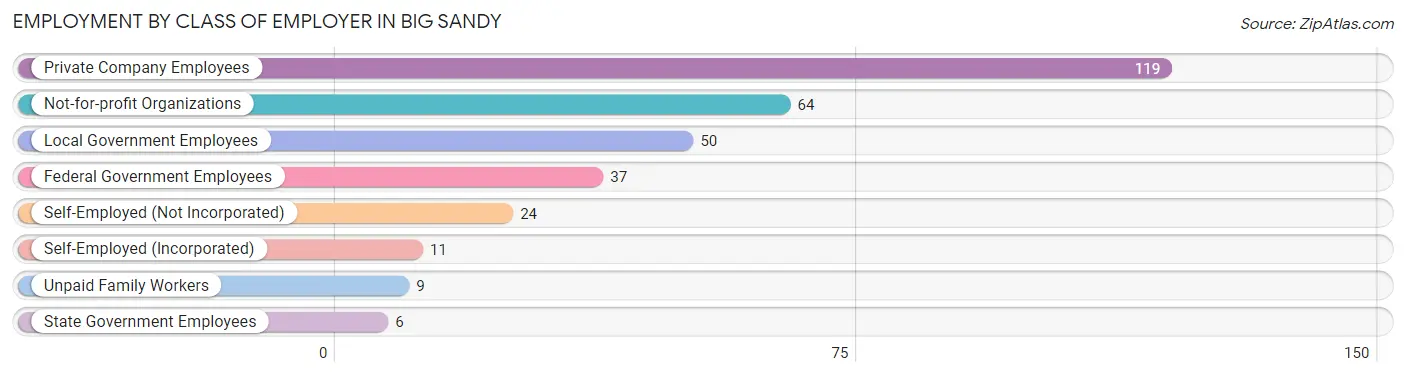
| Employer Class | # Employees | % Employees |
| Private Company Employees | 119 | 37.2% |
| Self-Employed (Incorporated) | 11 | 3.4% |
| Self-Employed (Not Incorporated) | 24 | 7.5% |
| Not-for-profit Organizations | 64 | 20.0% |
| Local Government Employees | 50 | 15.6% |
| State Government Employees | 6 | 1.9% |
| Federal Government Employees | 37 | 11.6% |
| Unpaid Family Workers | 9 | 2.8% |
| Total | 320 | 100.0% |
Employment Status by Age in Big Sandy
According to the labor force statistics for Big Sandy, out of the total population over 16 years of age (629), 58.3% or 367 individuals are in the labor force, with 11.7% or 43 of them unemployed. The age group with the highest labor force participation rate is 25 to 29 years, with 100.0% or 33 individuals in the labor force. Within the labor force, the 35 to 44 years age range has the highest percentage of unemployed individuals, with 28.6% or 40 of them being unemployed.
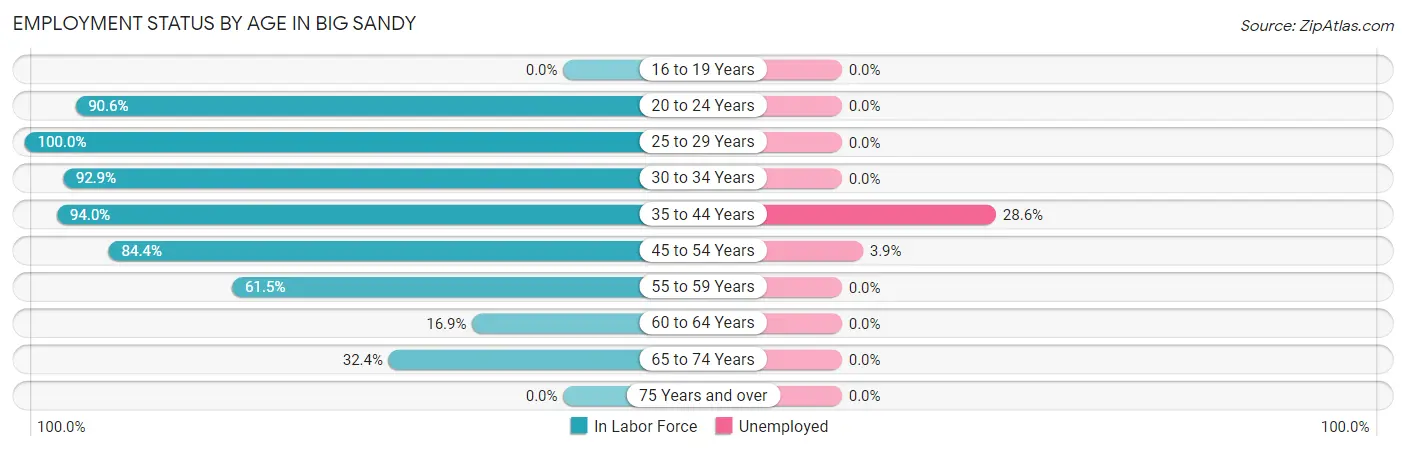
| Age Bracket | In Labor Force | Unemployed |
| 16 to 19 Years | 0 (0.0%) | 0 (0.0%) |
| 20 to 24 Years | 29 (90.6%) | 0 (0.0%) |
| 25 to 29 Years | 33 (100.0%) | 0 (0.0%) |
| 30 to 34 Years | 26 (92.9%) | 0 (0.0%) |
| 35 to 44 Years | 140 (94.0%) | 40 (28.6%) |
| 45 to 54 Years | 76 (84.4%) | 3 (3.9%) |
| 55 to 59 Years | 16 (61.5%) | 0 (0.0%) |
| 60 to 64 Years | 14 (16.9%) | 0 (0.0%) |
| 65 to 74 Years | 33 (32.4%) | 0 (0.0%) |
| 75 Years and over | 0 (0.0%) | 0 (0.0%) |
| Total | 367 (58.3%) | 43 (11.7%) |
Employment Status by Educational Attainment in Big Sandy
According to labor force statistics for Big Sandy, 74.6% of individuals (305) out of the total population between 25 and 64 years of age (409) are in the labor force, with 14.1% or 43 of them being unemployed. The group with the highest labor force participation rate are those with the educational attainment of college / associate degree, with 96.8% or 60 individuals in the labor force. Within the labor force, individuals with high school diploma education have the highest percentage of unemployment, with 24.4% or 40 of them being unemployed.
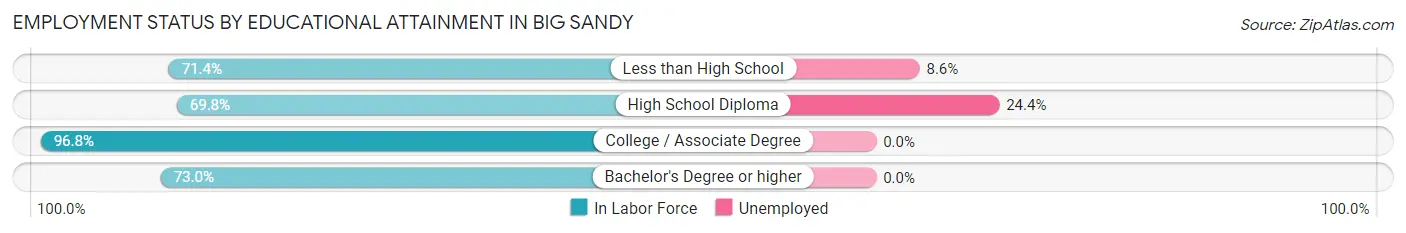
| Educational Attainment | In Labor Force | Unemployed |
| Less than High School | 35 (71.4%) | 4 (8.6%) |
| High School Diploma | 164 (69.8%) | 57 (24.4%) |
| College / Associate Degree | 60 (96.8%) | 0 (0.0%) |
| Bachelor's Degree or higher | 46 (73.0%) | 0 (0.0%) |
| Total | 305 (74.6%) | 58 (14.1%) |
Employment Occupations by Sex in Big Sandy
Management, Business, Science and Arts Occupations
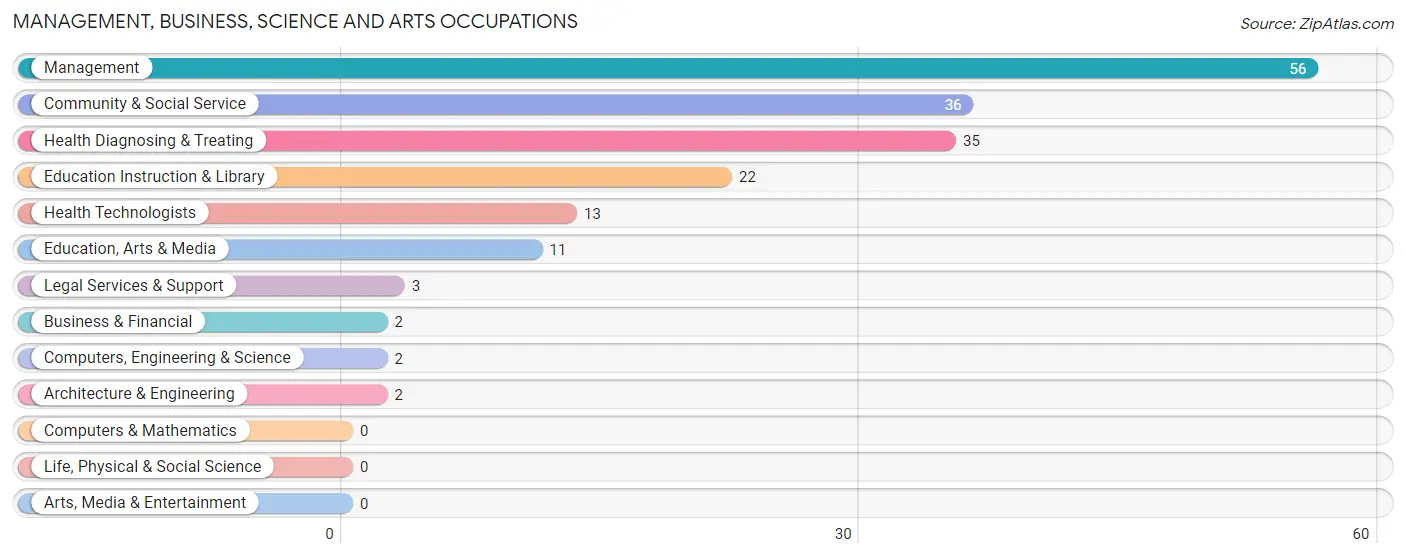
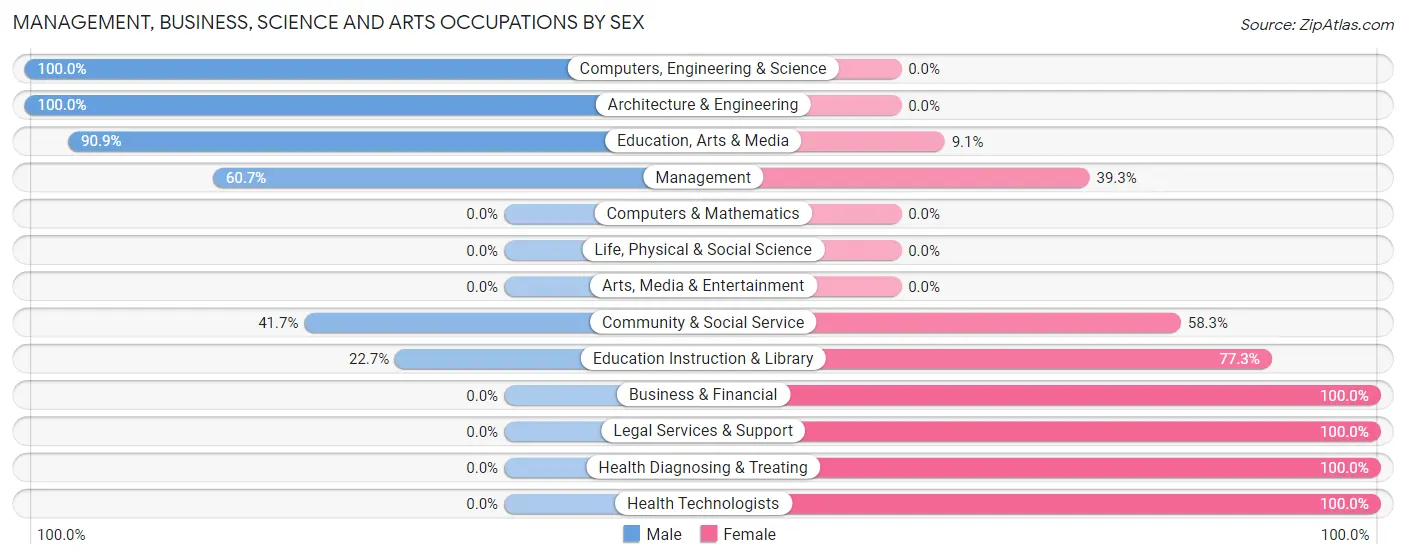
The most common Management, Business, Science and Arts occupations in Big Sandy are Management (56 | 17.3%), Community & Social Service (36 | 11.1%), Health Diagnosing & Treating (35 | 10.8%), Education Instruction & Library (22 | 6.8%), and Health Technologists (13 | 4.0%).
Management, Business, Science and Arts Occupations by Sex
Within the Management, Business, Science and Arts occupations in Big Sandy, the most male-oriented occupations are Computers, Engineering & Science (100.0%), Architecture & Engineering (100.0%), and Education, Arts & Media (90.9%), while the most female-oriented occupations are Business & Financial (100.0%), Legal Services & Support (100.0%), and Health Diagnosing & Treating (100.0%).
| Occupation | Male | Female |
| Management | 34 (60.7%) | 22 (39.3%) |
| Business & Financial | 0 (0.0%) | 2 (100.0%) |
| Computers, Engineering & Science | 2 (100.0%) | 0 (0.0%) |
| Computers & Mathematics | 0 (0.0%) | 0 (0.0%) |
| Architecture & Engineering | 2 (100.0%) | 0 (0.0%) |
| Life, Physical & Social Science | 0 (0.0%) | 0 (0.0%) |
| Community & Social Service | 15 (41.7%) | 21 (58.3%) |
| Education, Arts & Media | 10 (90.9%) | 1 (9.1%) |
| Legal Services & Support | 0 (0.0%) | 3 (100.0%) |
| Education Instruction & Library | 5 (22.7%) | 17 (77.3%) |
| Arts, Media & Entertainment | 0 (0.0%) | 0 (0.0%) |
| Health Diagnosing & Treating | 0 (0.0%) | 35 (100.0%) |
| Health Technologists | 0 (0.0%) | 13 (100.0%) |
| Total (Category) | 51 (38.9%) | 80 (61.1%) |
| Total (Overall) | 145 (44.8%) | 179 (55.2%) |
Services Occupations
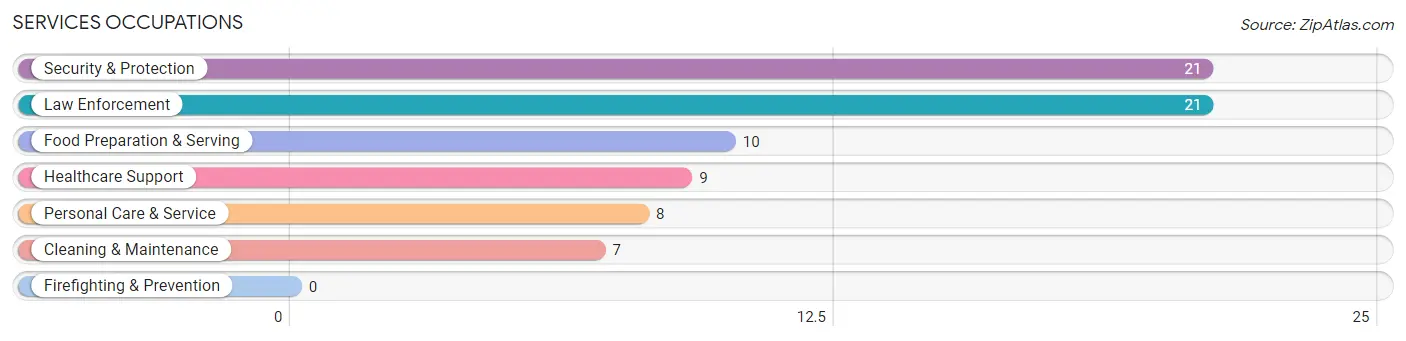
The most common Services occupations in Big Sandy are Security & Protection (21 | 6.5%), Law Enforcement (21 | 6.5%), Food Preparation & Serving (10 | 3.1%), Healthcare Support (9 | 2.8%), and Personal Care & Service (8 | 2.5%).
Services Occupations by Sex
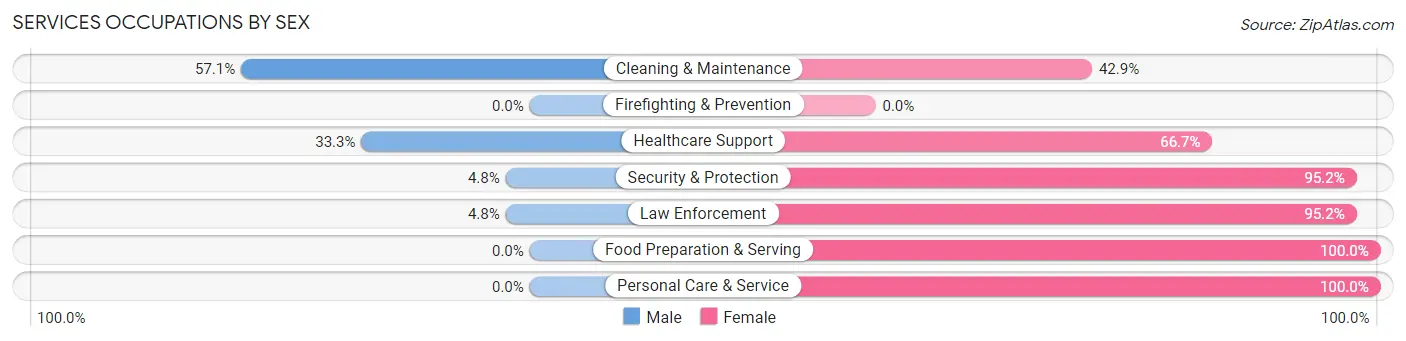
Within the Services occupations in Big Sandy, the most male-oriented occupations are Cleaning & Maintenance (57.1%), Healthcare Support (33.3%), and Security & Protection (4.8%), while the most female-oriented occupations are Food Preparation & Serving (100.0%), Personal Care & Service (100.0%), and Security & Protection (95.2%).
| Occupation | Male | Female |
| Healthcare Support | 3 (33.3%) | 6 (66.7%) |
| Security & Protection | 1 (4.8%) | 20 (95.2%) |
| Firefighting & Prevention | 0 (0.0%) | 0 (0.0%) |
| Law Enforcement | 1 (4.8%) | 20 (95.2%) |
| Food Preparation & Serving | 0 (0.0%) | 10 (100.0%) |
| Cleaning & Maintenance | 4 (57.1%) | 3 (42.9%) |
| Personal Care & Service | 0 (0.0%) | 8 (100.0%) |
| Total (Category) | 8 (14.5%) | 47 (85.5%) |
| Total (Overall) | 145 (44.8%) | 179 (55.2%) |
Sales and Office Occupations
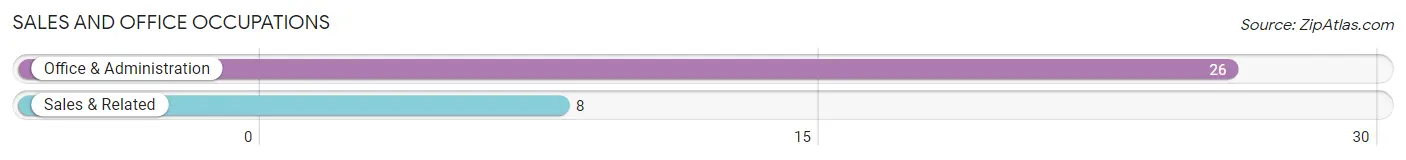
The most common Sales and Office occupations in Big Sandy are Office & Administration (26 | 8.0%), and Sales & Related (8 | 2.5%).
Sales and Office Occupations by Sex
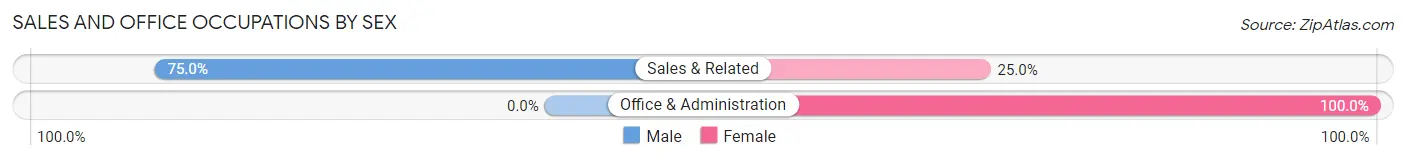
| Occupation | Male | Female |
| Sales & Related | 6 (75.0%) | 2 (25.0%) |
| Office & Administration | 0 (0.0%) | 26 (100.0%) |
| Total (Category) | 6 (17.6%) | 28 (82.4%) |
| Total (Overall) | 145 (44.8%) | 179 (55.2%) |
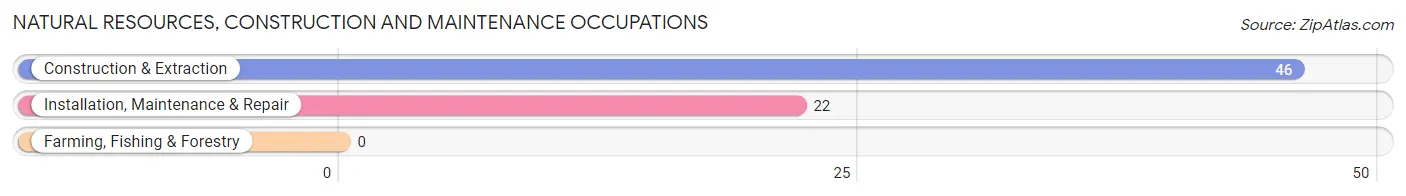
Natural Resources, Construction and Maintenance Occupations
The most common Natural Resources, Construction and Maintenance occupations in Big Sandy are Construction & Extraction (46 | 14.2%), and Installation, Maintenance & Repair (22 | 6.8%).
Natural Resources, Construction and Maintenance Occupations by Sex
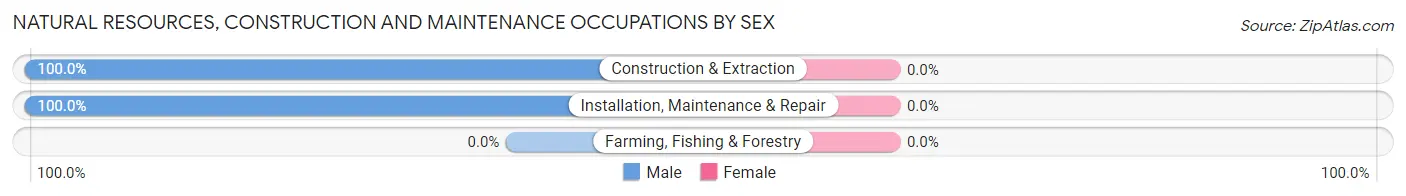
| Occupation | Male | Female |
| Farming, Fishing & Forestry | 0 (0.0%) | 0 (0.0%) |
| Construction & Extraction | 46 (100.0%) | 0 (0.0%) |
| Installation, Maintenance & Repair | 22 (100.0%) | 0 (0.0%) |
| Total (Category) | 68 (100.0%) | 0 (0.0%) |
| Total (Overall) | 145 (44.8%) | 179 (55.2%) |
Production, Transportation and Moving Occupations
The most common Production, Transportation and Moving occupations in Big Sandy are Production (31 | 9.6%), Transportation (3 | 0.9%), and Material Moving (2 | 0.6%).
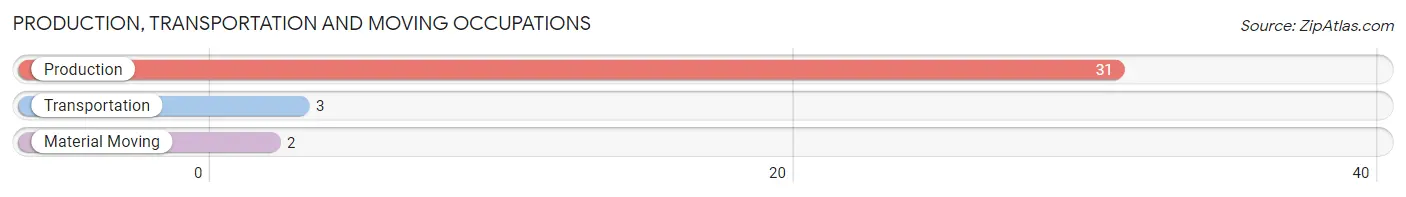
Production, Transportation and Moving Occupations by Sex
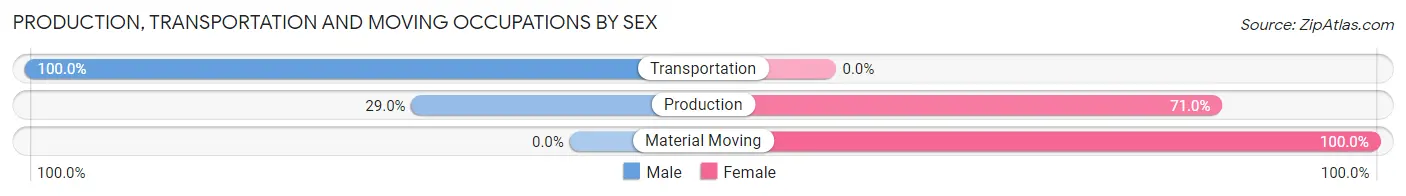
| Occupation | Male | Female |
| Production | 9 (29.0%) | 22 (71.0%) |
| Transportation | 3 (100.0%) | 0 (0.0%) |
| Material Moving | 0 (0.0%) | 2 (100.0%) |
| Total (Category) | 12 (33.3%) | 24 (66.7%) |
| Total (Overall) | 145 (44.8%) | 179 (55.2%) |
Employment Industries by Sex in Big Sandy
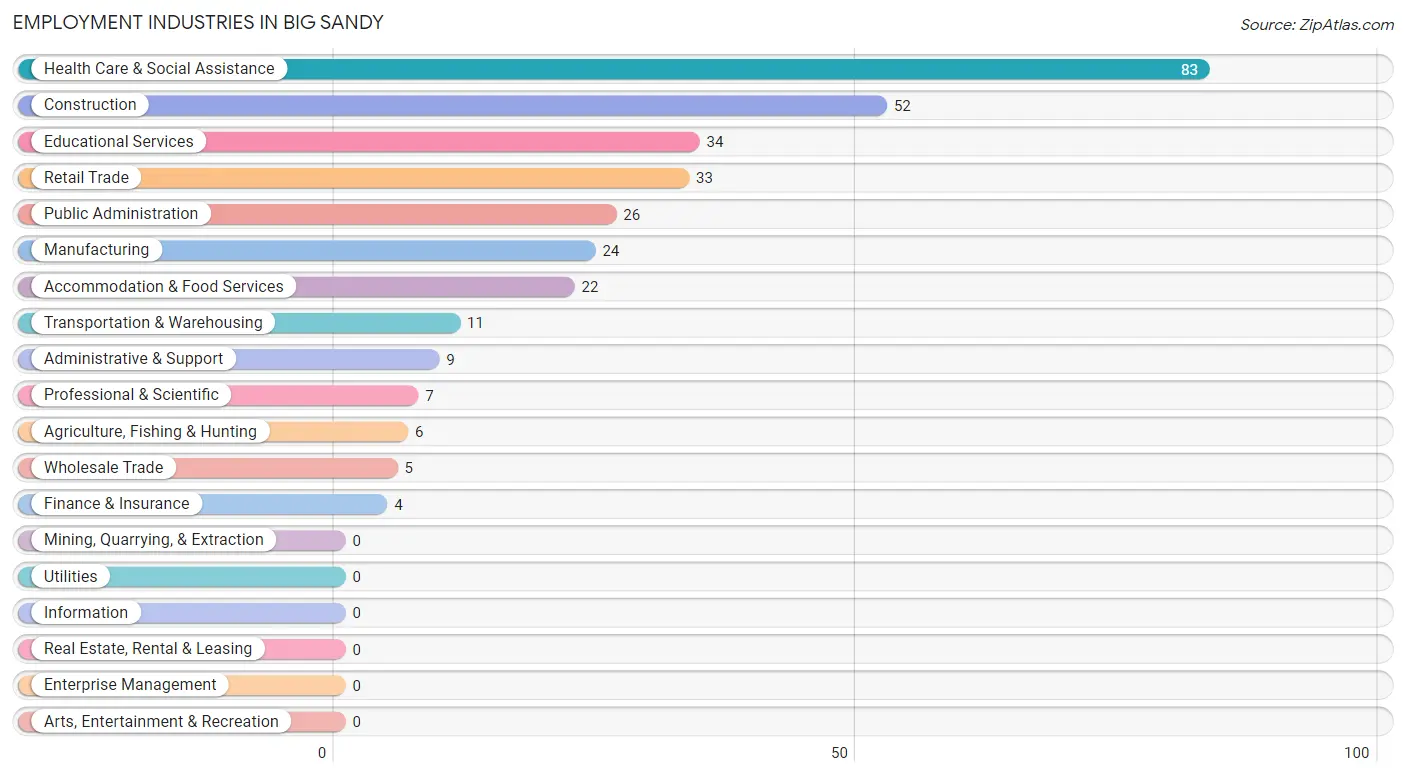
Employment Industries in Big Sandy
The major employment industries in Big Sandy include Health Care & Social Assistance (83 | 25.6%), Construction (52 | 16.1%), Educational Services (34 | 10.5%), Retail Trade (33 | 10.2%), and Public Administration (26 | 8.0%).
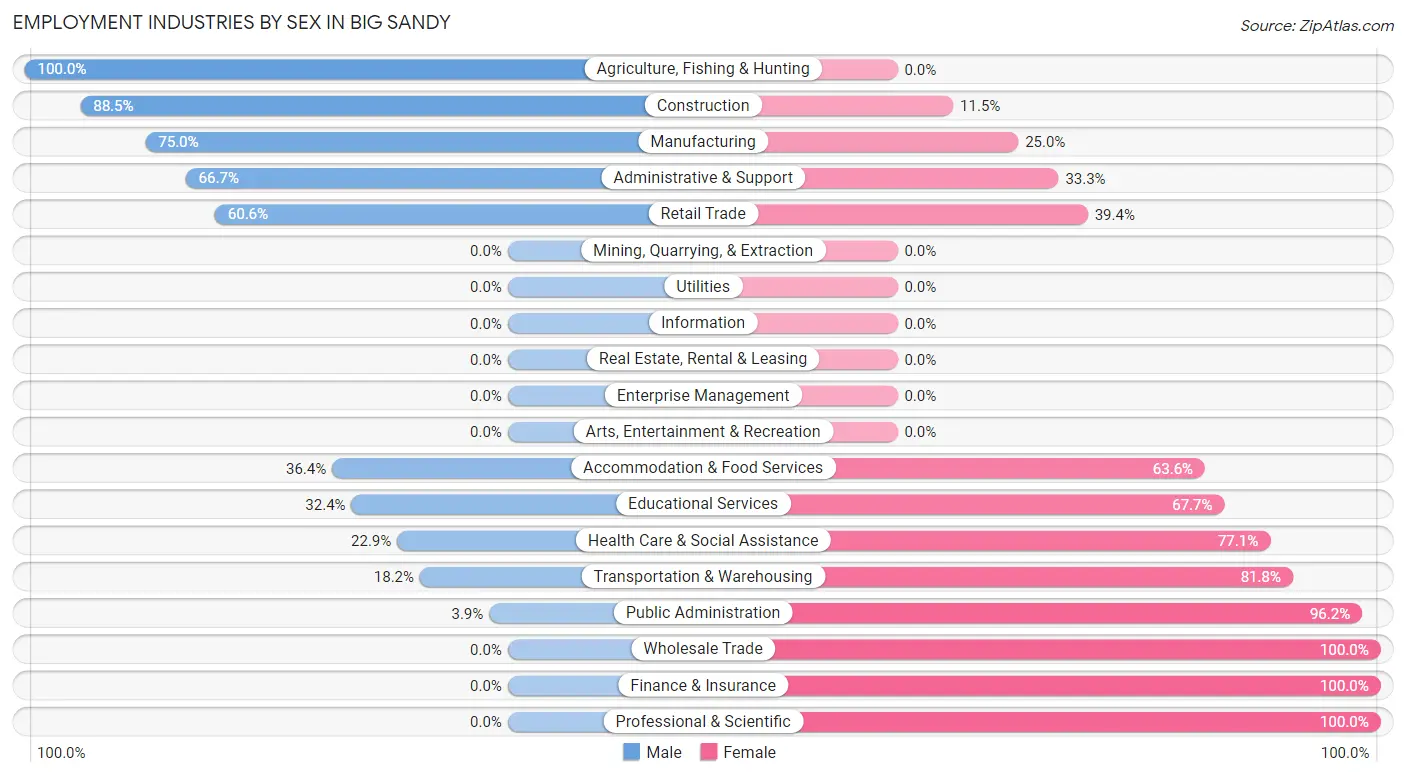
Employment Industries by Sex in Big Sandy
The Big Sandy industries that see more men than women are Agriculture, Fishing & Hunting (100.0%), Construction (88.5%), and Manufacturing (75.0%), whereas the industries that tend to have a higher number of women are Wholesale Trade (100.0%), Finance & Insurance (100.0%), and Professional & Scientific (100.0%).
| Industry | Male | Female |
| Agriculture, Fishing & Hunting | 6 (100.0%) | 0 (0.0%) |
| Mining, Quarrying, & Extraction | 0 (0.0%) | 0 (0.0%) |
| Construction | 46 (88.5%) | 6 (11.5%) |
| Manufacturing | 18 (75.0%) | 6 (25.0%) |
| Wholesale Trade | 0 (0.0%) | 5 (100.0%) |
| Retail Trade | 20 (60.6%) | 13 (39.4%) |
| Transportation & Warehousing | 2 (18.2%) | 9 (81.8%) |
| Utilities | 0 (0.0%) | 0 (0.0%) |
| Information | 0 (0.0%) | 0 (0.0%) |
| Finance & Insurance | 0 (0.0%) | 4 (100.0%) |
| Real Estate, Rental & Leasing | 0 (0.0%) | 0 (0.0%) |
| Professional & Scientific | 0 (0.0%) | 7 (100.0%) |
| Enterprise Management | 0 (0.0%) | 0 (0.0%) |
| Administrative & Support | 6 (66.7%) | 3 (33.3%) |
| Educational Services | 11 (32.4%) | 23 (67.6%) |
| Health Care & Social Assistance | 19 (22.9%) | 64 (77.1%) |
| Arts, Entertainment & Recreation | 0 (0.0%) | 0 (0.0%) |
| Accommodation & Food Services | 8 (36.4%) | 14 (63.6%) |
| Public Administration | 1 (3.8%) | 25 (96.2%) |
| Total | 145 (44.8%) | 179 (55.2%) |
Education in Big Sandy
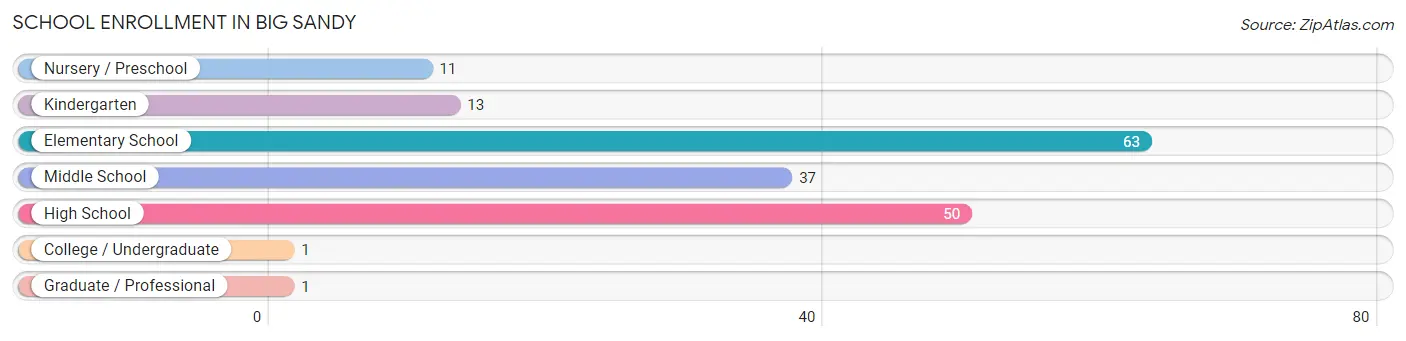
School Enrollment in Big Sandy
The most common levels of schooling among the 176 students in Big Sandy are elementary school (63 | 35.8%), high school (50 | 28.4%), and middle school (37 | 21.0%).
| School Level | # Students | % Students |
| Nursery / Preschool | 11 | 6.2% |
| Kindergarten | 13 | 7.4% |
| Elementary School | 63 | 35.8% |
| Middle School | 37 | 21.0% |
| High School | 50 | 28.4% |
| College / Undergraduate | 1 | 0.6% |
| Graduate / Professional | 1 | 0.6% |
| Total | 176 | 100.0% |
School Enrollment by Age by Funding Source in Big Sandy
Out of a total of 176 students who are enrolled in schools in Big Sandy, 22 (12.5%) attend a private institution, while the remaining 154 (87.5%) are enrolled in public schools. The age group of 25 to 34 year olds has the highest likelihood of being enrolled in private schools, with 2 (100.0% in the age bracket) enrolled. Conversely, the age group of 3 to 4 year olds has the lowest likelihood of being enrolled in a private school, with 6 (100.0% in the age bracket) attending a public institution.
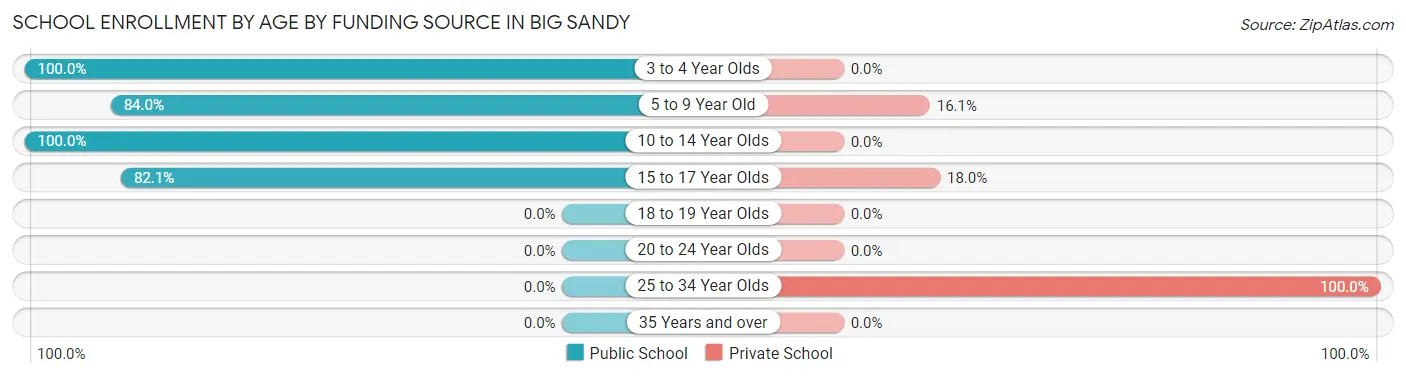
| Age Bracket | Public School | Private School |
| 3 to 4 Year Olds | 6 (100.0%) | 0 (0.0%) |
| 5 to 9 Year Old | 68 (84.0%) | 13 (16.1%) |
| 10 to 14 Year Olds | 48 (100.0%) | 0 (0.0%) |
| 15 to 17 Year Olds | 32 (82.1%) | 7 (17.9%) |
| 18 to 19 Year Olds | 0 (0.0%) | 0 (0.0%) |
| 20 to 24 Year Olds | 0 (0.0%) | 0 (0.0%) |
| 25 to 34 Year Olds | 0 (0.0%) | 2 (100.0%) |
| 35 Years and over | 0 (0.0%) | 0 (0.0%) |
| Total | 154 (87.5%) | 22 (12.5%) |
Educational Attainment by Field of Study in Big Sandy
Education (47 | 38.5%), science & technology (23 | 18.9%), bio, nature & agricultural (15 | 12.3%), physical & health sciences (8 | 6.6%), and engineering (8 | 6.6%) are the most common fields of study among 122 individuals in Big Sandy who have obtained a bachelor's degree or higher.
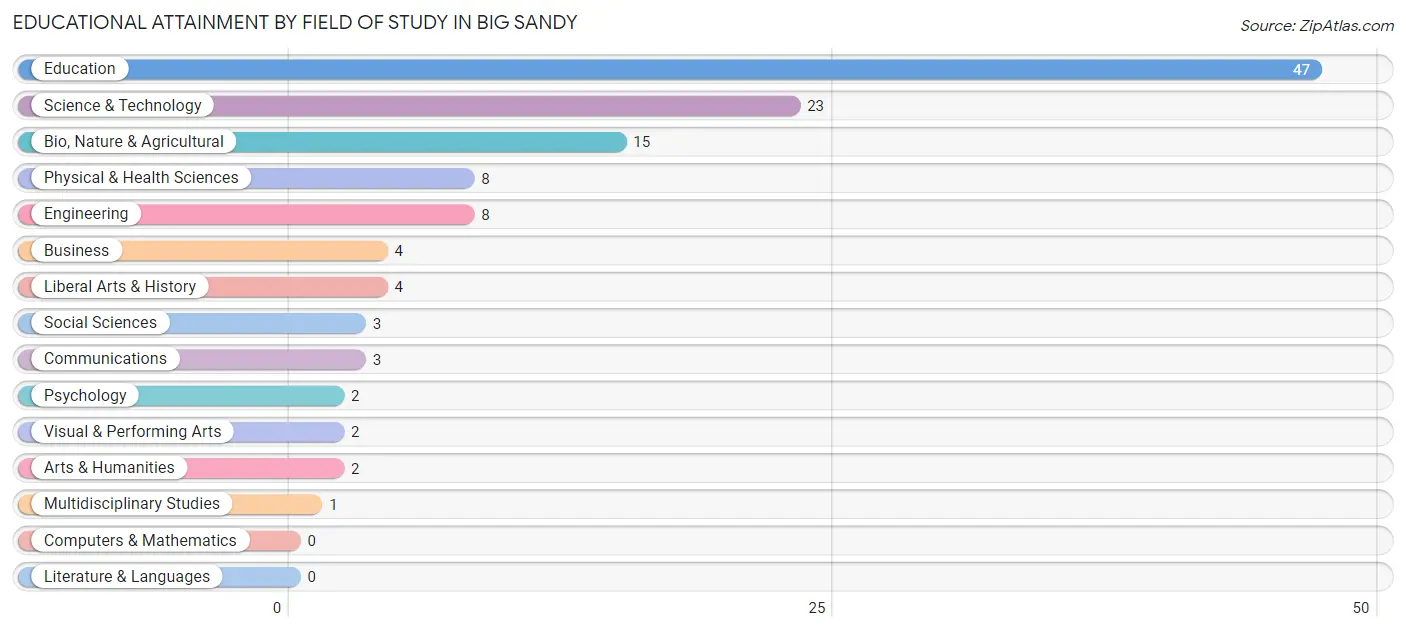
| Field of Study | # Graduates | % Graduates |
| Computers & Mathematics | 0 | 0.0% |
| Bio, Nature & Agricultural | 15 | 12.3% |
| Physical & Health Sciences | 8 | 6.6% |
| Psychology | 2 | 1.6% |
| Social Sciences | 3 | 2.5% |
| Engineering | 8 | 6.6% |
| Multidisciplinary Studies | 1 | 0.8% |
| Science & Technology | 23 | 18.9% |
| Business | 4 | 3.3% |
| Education | 47 | 38.5% |
| Literature & Languages | 0 | 0.0% |
| Liberal Arts & History | 4 | 3.3% |
| Visual & Performing Arts | 2 | 1.6% |
| Communications | 3 | 2.5% |
| Arts & Humanities | 2 | 1.6% |
| Total | 122 | 100.0% |
Transportation & Commute in Big Sandy
Vehicle Availability by Sex in Big Sandy
The most prevalent vehicle ownership categories in Big Sandy are males with 1 vehicle (42, accounting for 30.7%) and females with 1 vehicle (39, making up 26.3%).
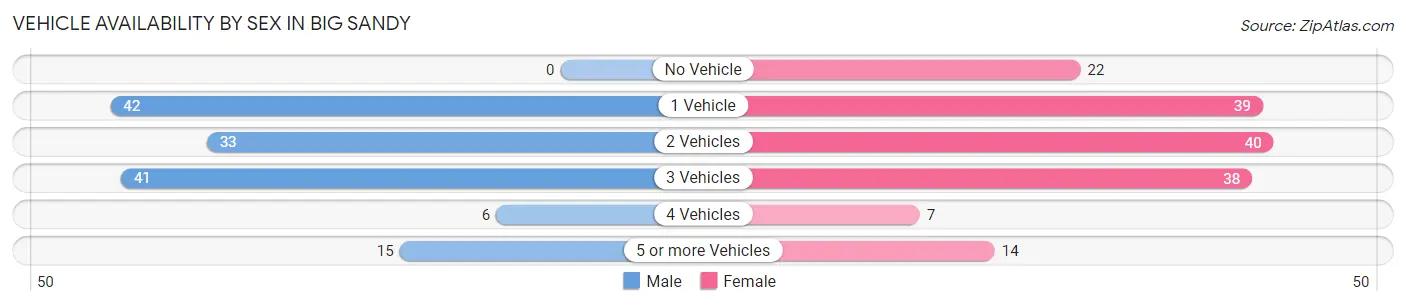
| Vehicles Available | Male | Female |
| No Vehicle | 0 (0.0%) | 22 (13.8%) |
| 1 Vehicle | 42 (30.7%) | 39 (24.4%) |
| 2 Vehicles | 33 (24.1%) | 40 (25.0%) |
| 3 Vehicles | 41 (29.9%) | 38 (23.7%) |
| 4 Vehicles | 6 (4.4%) | 7 (4.4%) |
| 5 or more Vehicles | 15 (11.0%) | 14 (8.7%) |
| Total | 137 (100.0%) | 160 (100.0%) |
Commute Time in Big Sandy
The most frequently occuring commute durations in Big Sandy are 5 to 9 minutes (56 commuters, 20.7%), 10 to 14 minutes (41 commuters, 15.1%), and 20 to 24 minutes (39 commuters, 14.4%).
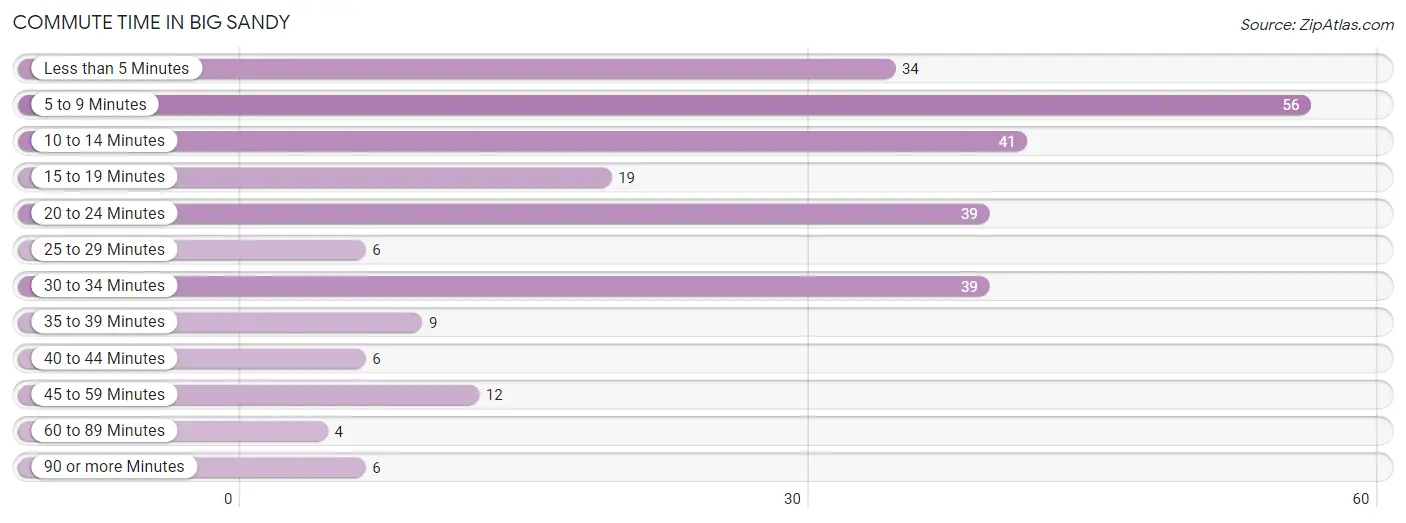
| Commute Time | # Commuters | % Commuters |
| Less than 5 Minutes | 34 | 12.6% |
| 5 to 9 Minutes | 56 | 20.7% |
| 10 to 14 Minutes | 41 | 15.1% |
| 15 to 19 Minutes | 19 | 7.0% |
| 20 to 24 Minutes | 39 | 14.4% |
| 25 to 29 Minutes | 6 | 2.2% |
| 30 to 34 Minutes | 39 | 14.4% |
| 35 to 39 Minutes | 9 | 3.3% |
| 40 to 44 Minutes | 6 | 2.2% |
| 45 to 59 Minutes | 12 | 4.4% |
| 60 to 89 Minutes | 4 | 1.5% |
| 90 or more Minutes | 6 | 2.2% |
Commute Time by Sex in Big Sandy
The most common commute times in Big Sandy are 5 to 9 minutes (32 commuters, 22.7%) for males and 10 to 14 minutes (39 commuters, 30.0%) for females.
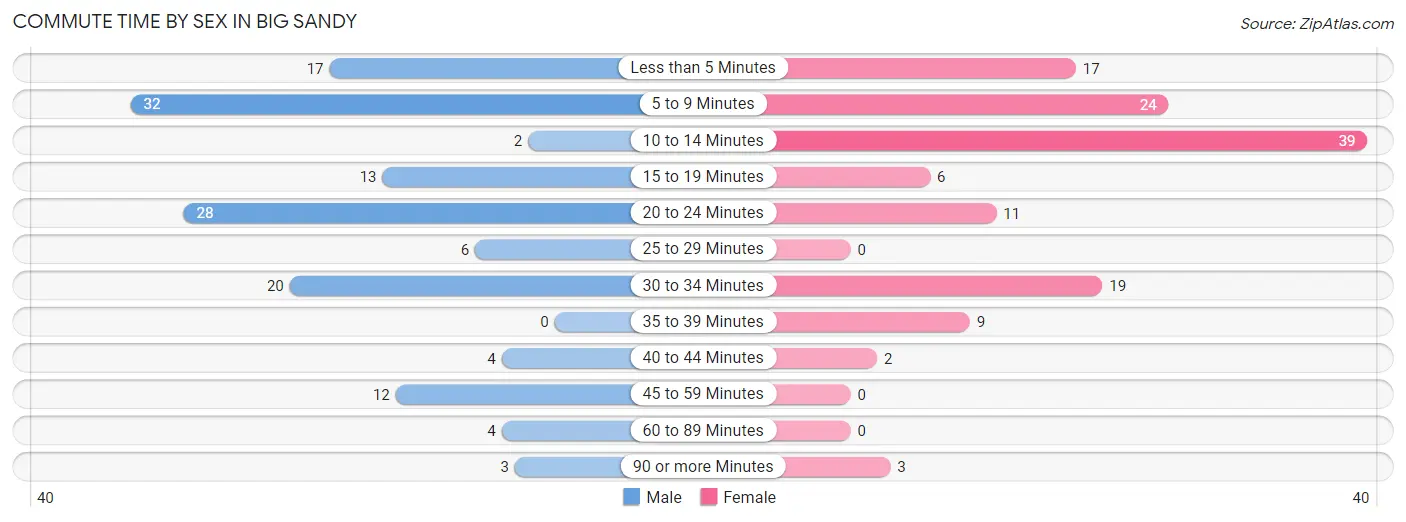
| Commute Time | Male | Female |
| Less than 5 Minutes | 17 (12.1%) | 17 (13.1%) |
| 5 to 9 Minutes | 32 (22.7%) | 24 (18.5%) |
| 10 to 14 Minutes | 2 (1.4%) | 39 (30.0%) |
| 15 to 19 Minutes | 13 (9.2%) | 6 (4.6%) |
| 20 to 24 Minutes | 28 (19.9%) | 11 (8.5%) |
| 25 to 29 Minutes | 6 (4.3%) | 0 (0.0%) |
| 30 to 34 Minutes | 20 (14.2%) | 19 (14.6%) |
| 35 to 39 Minutes | 0 (0.0%) | 9 (6.9%) |
| 40 to 44 Minutes | 4 (2.8%) | 2 (1.5%) |
| 45 to 59 Minutes | 12 (8.5%) | 0 (0.0%) |
| 60 to 89 Minutes | 4 (2.8%) | 0 (0.0%) |
| 90 or more Minutes | 3 (2.1%) | 3 (2.3%) |
Time of Departure to Work by Sex in Big Sandy
The most frequent times of departure to work in Big Sandy are 8:00 AM to 8:29 AM (48, 34.0%) for males and 7:30 AM to 7:59 AM (45, 34.6%) for females.
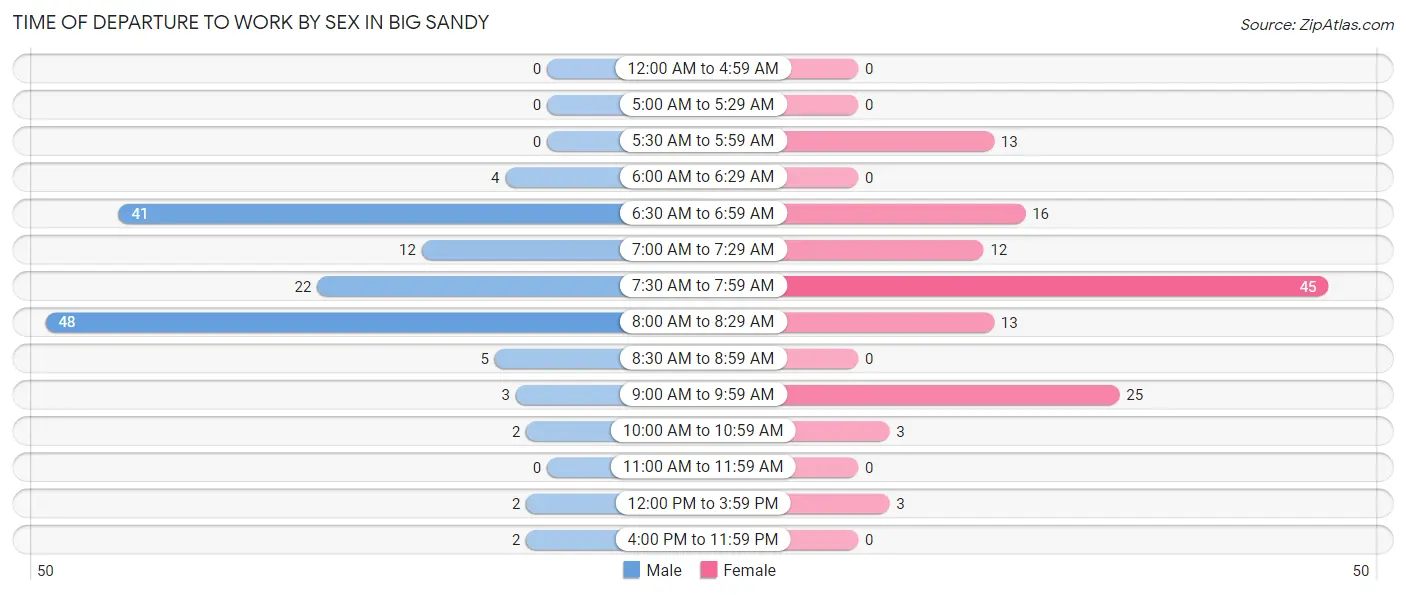
| Time of Departure | Male | Female |
| 12:00 AM to 4:59 AM | 0 (0.0%) | 0 (0.0%) |
| 5:00 AM to 5:29 AM | 0 (0.0%) | 0 (0.0%) |
| 5:30 AM to 5:59 AM | 0 (0.0%) | 13 (10.0%) |
| 6:00 AM to 6:29 AM | 4 (2.8%) | 0 (0.0%) |
| 6:30 AM to 6:59 AM | 41 (29.1%) | 16 (12.3%) |
| 7:00 AM to 7:29 AM | 12 (8.5%) | 12 (9.2%) |
| 7:30 AM to 7:59 AM | 22 (15.6%) | 45 (34.6%) |
| 8:00 AM to 8:29 AM | 48 (34.0%) | 13 (10.0%) |
| 8:30 AM to 8:59 AM | 5 (3.5%) | 0 (0.0%) |
| 9:00 AM to 9:59 AM | 3 (2.1%) | 25 (19.2%) |
| 10:00 AM to 10:59 AM | 2 (1.4%) | 3 (2.3%) |
| 11:00 AM to 11:59 AM | 0 (0.0%) | 0 (0.0%) |
| 12:00 PM to 3:59 PM | 2 (1.4%) | 3 (2.3%) |
| 4:00 PM to 11:59 PM | 2 (1.4%) | 0 (0.0%) |
| Total | 141 (100.0%) | 130 (100.0%) |
Housing Occupancy in Big Sandy
Occupancy by Ownership in Big Sandy
Of the total 289 dwellings in Big Sandy, owner-occupied units account for 207 (71.6%), while renter-occupied units make up 82 (28.4%).
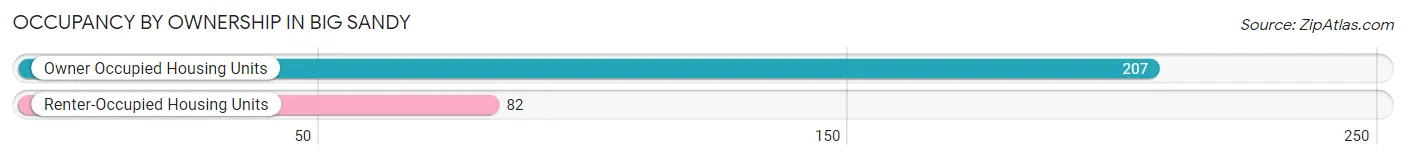
| Occupancy | # Housing Units | % Housing Units |
| Owner Occupied Housing Units | 207 | 71.6% |
| Renter-Occupied Housing Units | 82 | 28.4% |
| Total Occupied Housing Units | 289 | 100.0% |
Occupancy by Household Size in Big Sandy
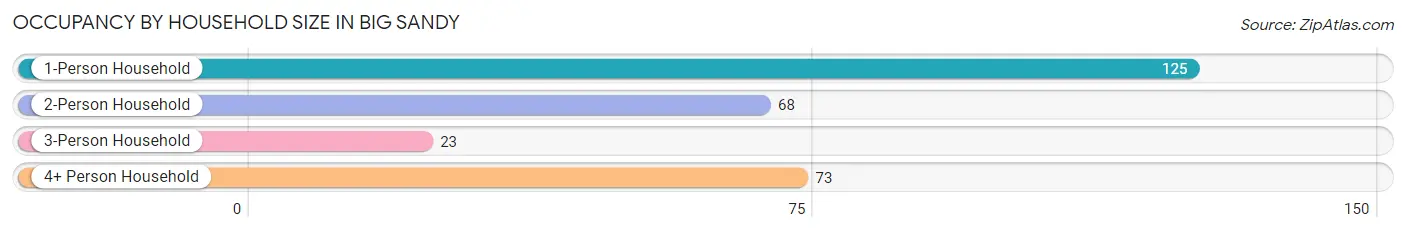
| Household Size | # Housing Units | % Housing Units |
| 1-Person Household | 125 | 43.2% |
| 2-Person Household | 68 | 23.5% |
| 3-Person Household | 23 | 8.0% |
| 4+ Person Household | 73 | 25.3% |
| Total Housing Units | 289 | 100.0% |
Occupancy by Ownership by Household Size in Big Sandy
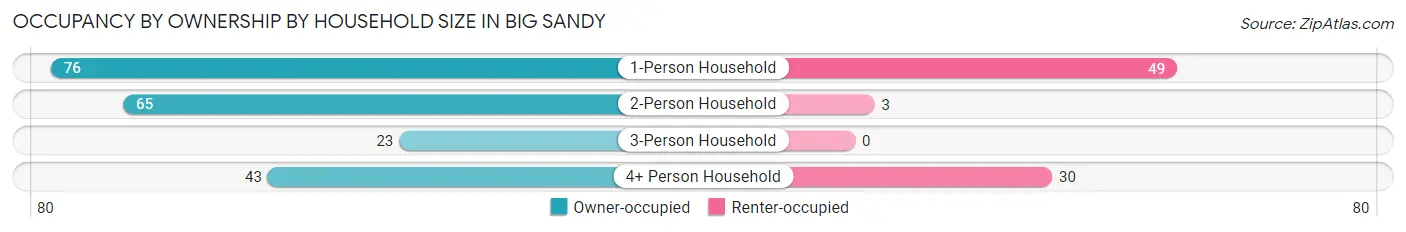
| Household Size | Owner-occupied | Renter-occupied |
| 1-Person Household | 76 (60.8%) | 49 (39.2%) |
| 2-Person Household | 65 (95.6%) | 3 (4.4%) |
| 3-Person Household | 23 (100.0%) | 0 (0.0%) |
| 4+ Person Household | 43 (58.9%) | 30 (41.1%) |
| Total Housing Units | 207 (71.6%) | 82 (28.4%) |
Occupancy by Educational Attainment in Big Sandy
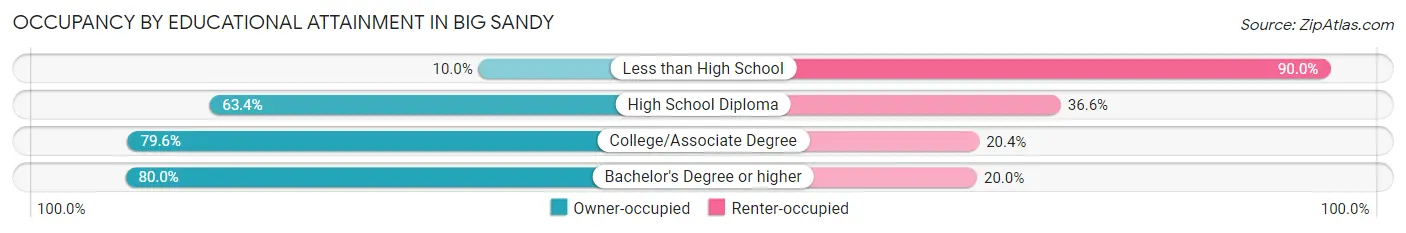
| Household Size | Owner-occupied | Renter-occupied |
| Less than High School | 1 (10.0%) | 9 (90.0%) |
| High School Diploma | 64 (63.4%) | 37 (36.6%) |
| College/Associate Degree | 74 (79.6%) | 19 (20.4%) |
| Bachelor's Degree or higher | 68 (80.0%) | 17 (20.0%) |
Occupancy by Age of Householder in Big Sandy
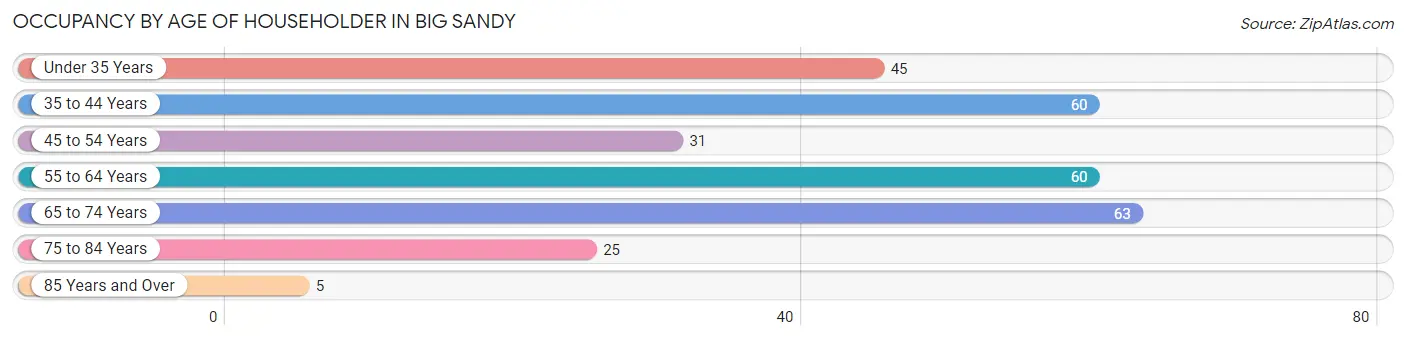
| Age Bracket | # Households | % Households |
| Under 35 Years | 45 | 15.6% |
| 35 to 44 Years | 60 | 20.8% |
| 45 to 54 Years | 31 | 10.7% |
| 55 to 64 Years | 60 | 20.8% |
| 65 to 74 Years | 63 | 21.8% |
| 75 to 84 Years | 25 | 8.6% |
| 85 Years and Over | 5 | 1.7% |
| Total | 289 | 100.0% |
Housing Finances in Big Sandy
Median Income by Occupancy in Big Sandy
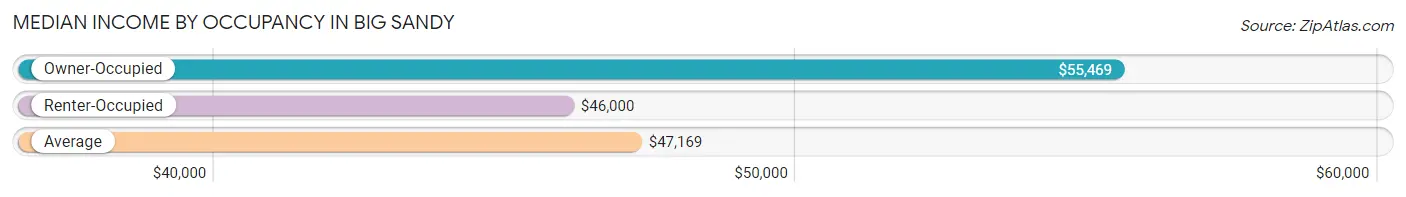
| Occupancy Type | # Households | Median Income |
| Owner-Occupied | 207 (71.6%) | $55,469 |
| Renter-Occupied | 82 (28.4%) | $46,000 |
| Average | 289 (100.0%) | $47,169 |
Occupancy by Householder Income Bracket in Big Sandy
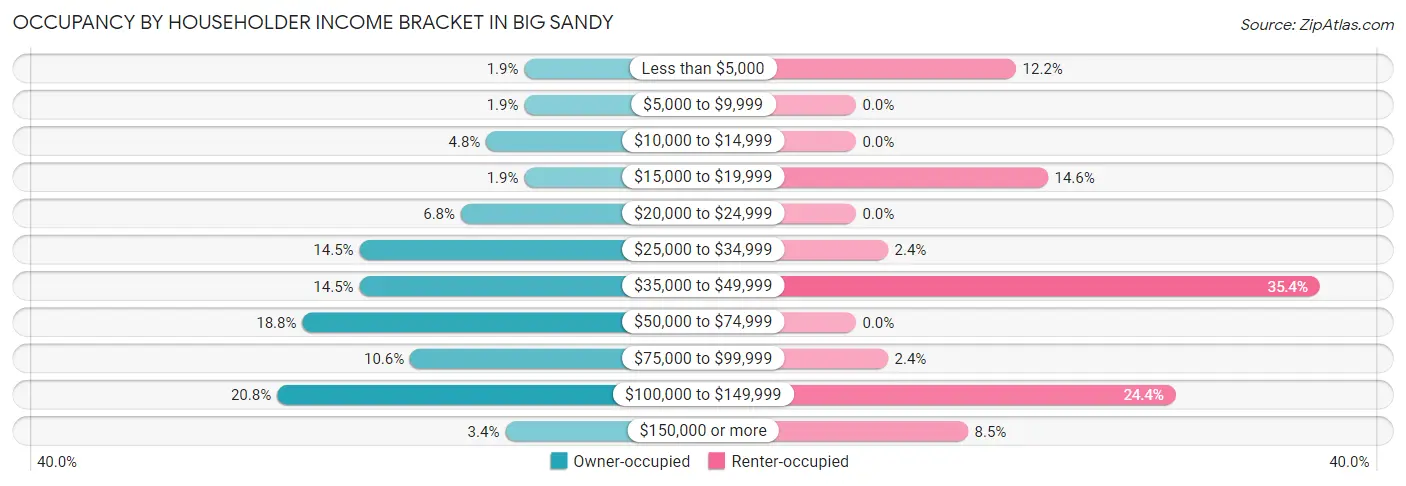
| Income Bracket | Owner-occupied | Renter-occupied |
| Less than $5,000 | 4 (1.9%) | 10 (12.2%) |
| $5,000 to $9,999 | 4 (1.9%) | 0 (0.0%) |
| $10,000 to $14,999 | 10 (4.8%) | 0 (0.0%) |
| $15,000 to $19,999 | 4 (1.9%) | 12 (14.6%) |
| $20,000 to $24,999 | 14 (6.8%) | 0 (0.0%) |
| $25,000 to $34,999 | 30 (14.5%) | 2 (2.4%) |
| $35,000 to $49,999 | 30 (14.5%) | 29 (35.4%) |
| $50,000 to $74,999 | 39 (18.8%) | 0 (0.0%) |
| $75,000 to $99,999 | 22 (10.6%) | 2 (2.4%) |
| $100,000 to $149,999 | 43 (20.8%) | 20 (24.4%) |
| $150,000 or more | 7 (3.4%) | 7 (8.5%) |
| Total | 207 (100.0%) | 82 (100.0%) |
Monthly Housing Cost Tiers in Big Sandy
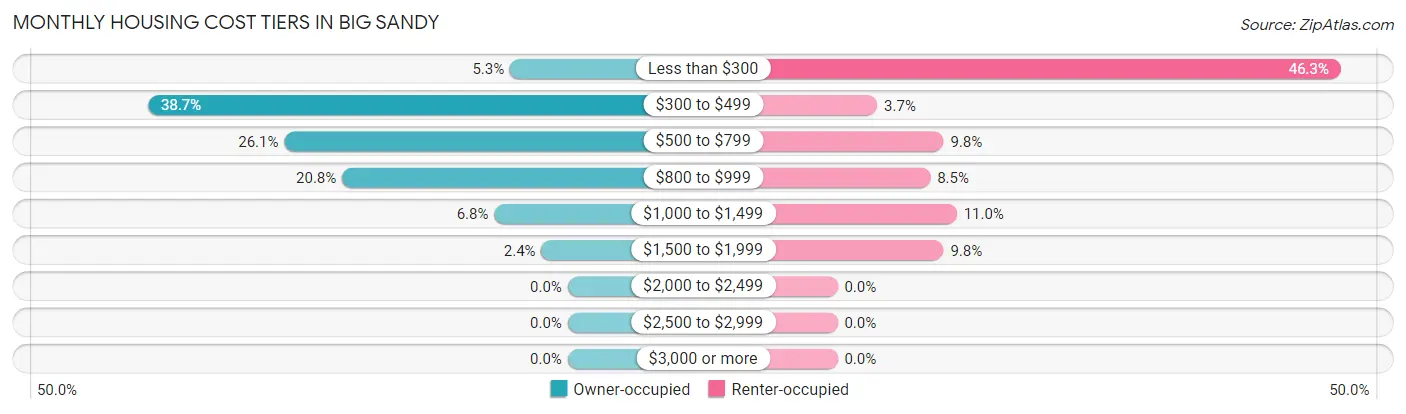
| Monthly Cost | Owner-occupied | Renter-occupied |
| Less than $300 | 11 (5.3%) | 38 (46.3%) |
| $300 to $499 | 80 (38.7%) | 3 (3.7%) |
| $500 to $799 | 54 (26.1%) | 8 (9.8%) |
| $800 to $999 | 43 (20.8%) | 7 (8.5%) |
| $1,000 to $1,499 | 14 (6.8%) | 9 (11.0%) |
| $1,500 to $1,999 | 5 (2.4%) | 8 (9.8%) |
| $2,000 to $2,499 | 0 (0.0%) | 0 (0.0%) |
| $2,500 to $2,999 | 0 (0.0%) | 0 (0.0%) |
| $3,000 or more | 0 (0.0%) | 0 (0.0%) |
| Total | 207 (100.0%) | 82 (100.0%) |
Physical Housing Characteristics in Big Sandy
Housing Structures in Big Sandy
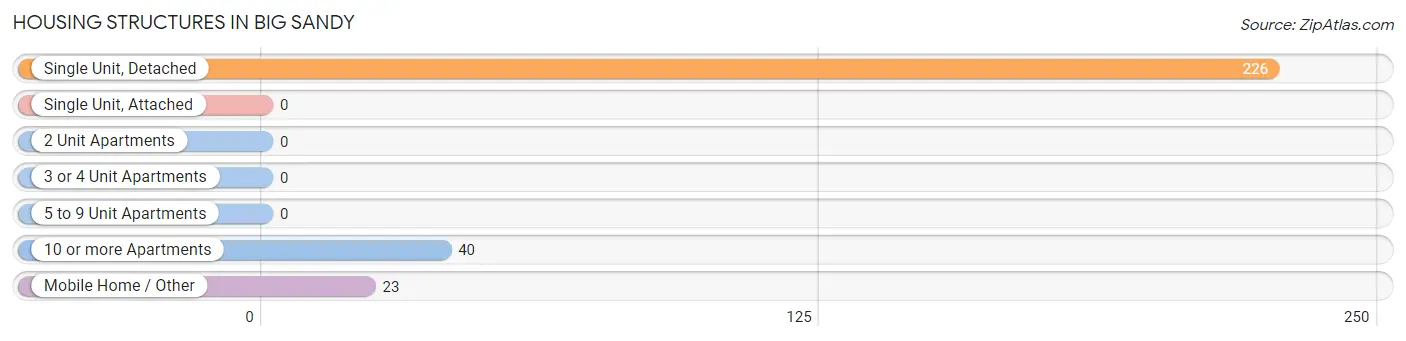
| Structure Type | # Housing Units | % Housing Units |
| Single Unit, Detached | 226 | 78.2% |
| Single Unit, Attached | 0 | 0.0% |
| 2 Unit Apartments | 0 | 0.0% |
| 3 or 4 Unit Apartments | 0 | 0.0% |
| 5 to 9 Unit Apartments | 0 | 0.0% |
| 10 or more Apartments | 40 | 13.8% |
| Mobile Home / Other | 23 | 8.0% |
| Total | 289 | 100.0% |
Housing Structures by Occupancy in Big Sandy
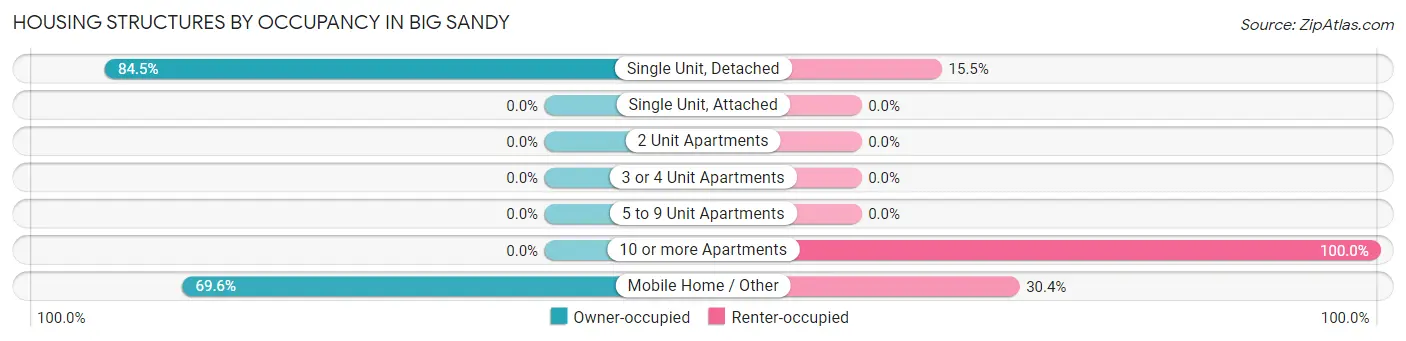
| Structure Type | Owner-occupied | Renter-occupied |
| Single Unit, Detached | 191 (84.5%) | 35 (15.5%) |
| Single Unit, Attached | 0 (0.0%) | 0 (0.0%) |
| 2 Unit Apartments | 0 (0.0%) | 0 (0.0%) |
| 3 or 4 Unit Apartments | 0 (0.0%) | 0 (0.0%) |
| 5 to 9 Unit Apartments | 0 (0.0%) | 0 (0.0%) |
| 10 or more Apartments | 0 (0.0%) | 40 (100.0%) |
| Mobile Home / Other | 16 (69.6%) | 7 (30.4%) |
| Total | 207 (71.6%) | 82 (28.4%) |
Housing Structures by Number of Rooms in Big Sandy
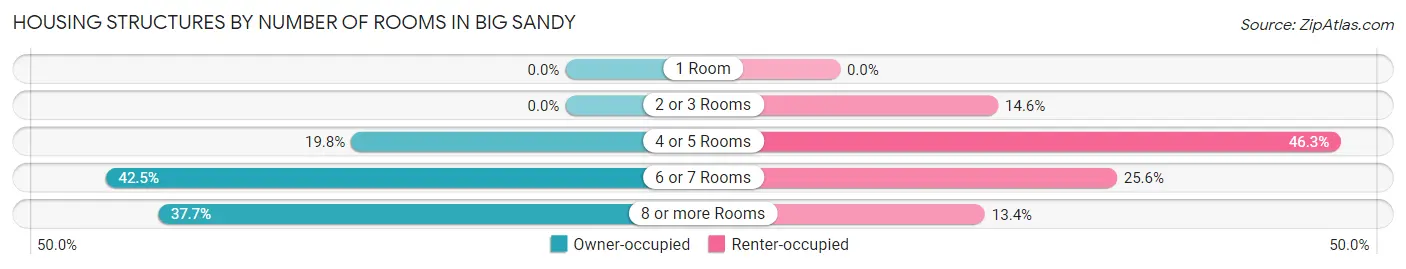
| Number of Rooms | Owner-occupied | Renter-occupied |
| 1 Room | 0 (0.0%) | 0 (0.0%) |
| 2 or 3 Rooms | 0 (0.0%) | 12 (14.6%) |
| 4 or 5 Rooms | 41 (19.8%) | 38 (46.3%) |
| 6 or 7 Rooms | 88 (42.5%) | 21 (25.6%) |
| 8 or more Rooms | 78 (37.7%) | 11 (13.4%) |
| Total | 207 (100.0%) | 82 (100.0%) |
Housing Structure by Heating Type in Big Sandy
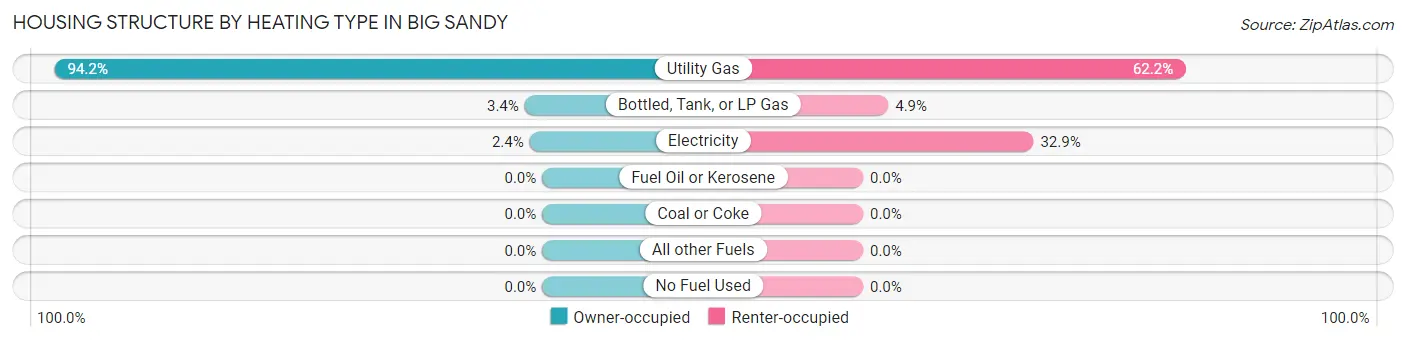
| Heating Type | Owner-occupied | Renter-occupied |
| Utility Gas | 195 (94.2%) | 51 (62.2%) |
| Bottled, Tank, or LP Gas | 7 (3.4%) | 4 (4.9%) |
| Electricity | 5 (2.4%) | 27 (32.9%) |
| Fuel Oil or Kerosene | 0 (0.0%) | 0 (0.0%) |
| Coal or Coke | 0 (0.0%) | 0 (0.0%) |
| All other Fuels | 0 (0.0%) | 0 (0.0%) |
| No Fuel Used | 0 (0.0%) | 0 (0.0%) |
| Total | 207 (100.0%) | 82 (100.0%) |
Household Vehicle Usage in Big Sandy
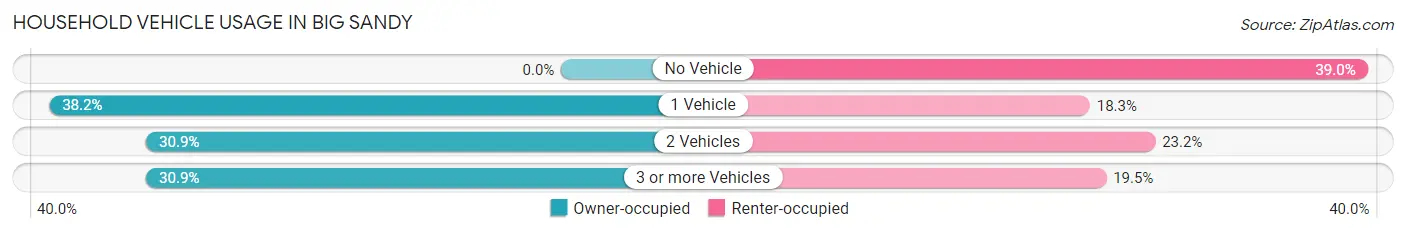
| Vehicles per Household | Owner-occupied | Renter-occupied |
| No Vehicle | 0 (0.0%) | 32 (39.0%) |
| 1 Vehicle | 79 (38.2%) | 15 (18.3%) |
| 2 Vehicles | 64 (30.9%) | 19 (23.2%) |
| 3 or more Vehicles | 64 (30.9%) | 16 (19.5%) |
| Total | 207 (100.0%) | 82 (100.0%) |
Real Estate & Mortgages in Big Sandy
Real Estate and Mortgage Overview in Big Sandy
| Characteristic | Without Mortgage | With Mortgage |
| Housing Units | 129 | 78 |
| Median Property Value | $148,100 | $103,600 |
| Median Household Income | $56,012 | $3 |
| Monthly Housing Costs | $459 | $0 |
| Real Estate Taxes | $1,320 | $0 |
Property Value by Mortgage Status in Big Sandy
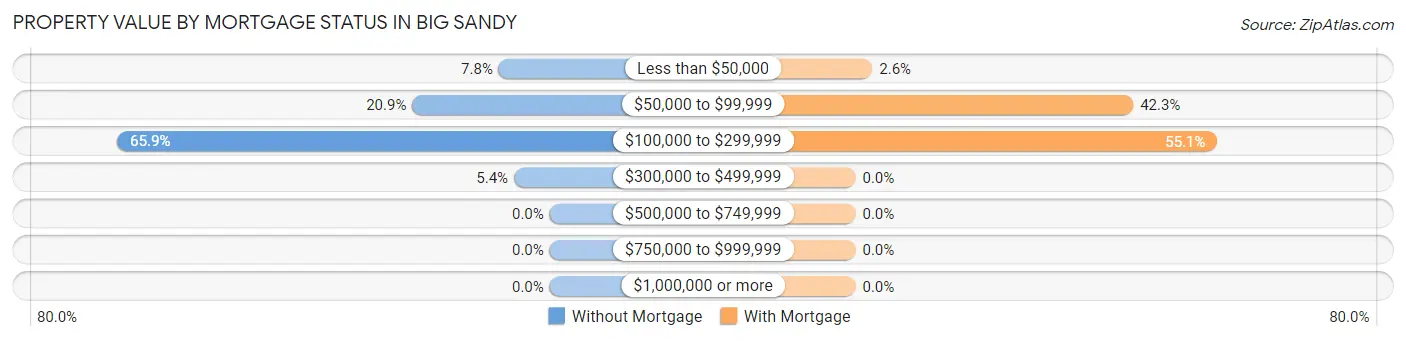
| Property Value | Without Mortgage | With Mortgage |
| Less than $50,000 | 10 (7.7%) | 2 (2.6%) |
| $50,000 to $99,999 | 27 (20.9%) | 33 (42.3%) |
| $100,000 to $299,999 | 85 (65.9%) | 43 (55.1%) |
| $300,000 to $499,999 | 7 (5.4%) | 0 (0.0%) |
| $500,000 to $749,999 | 0 (0.0%) | 0 (0.0%) |
| $750,000 to $999,999 | 0 (0.0%) | 0 (0.0%) |
| $1,000,000 or more | 0 (0.0%) | 0 (0.0%) |
| Total | 129 (100.0%) | 78 (100.0%) |
Household Income by Mortgage Status in Big Sandy
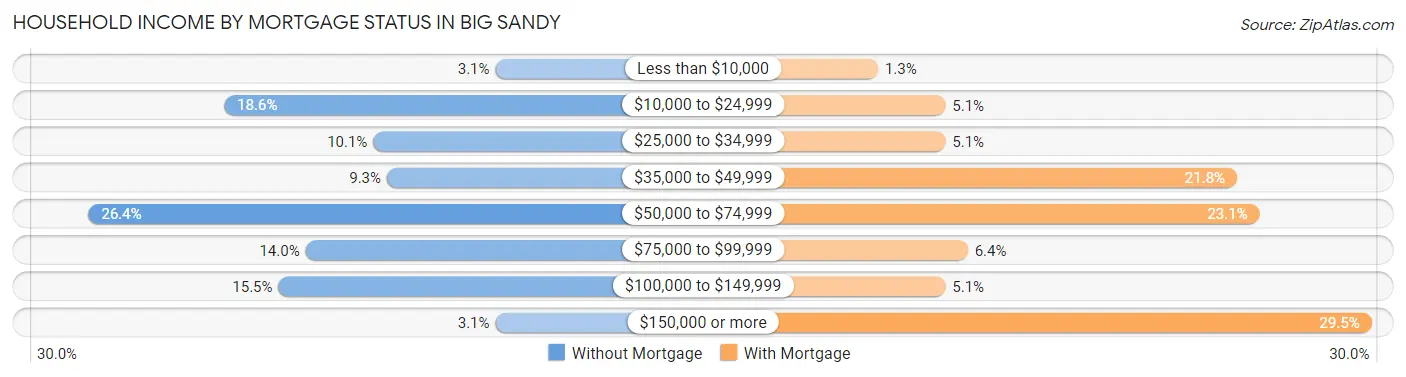
| Household Income | Without Mortgage | With Mortgage |
| Less than $10,000 | 4 (3.1%) | 1 (1.3%) |
| $10,000 to $24,999 | 24 (18.6%) | 4 (5.1%) |
| $25,000 to $34,999 | 13 (10.1%) | 4 (5.1%) |
| $35,000 to $49,999 | 12 (9.3%) | 17 (21.8%) |
| $50,000 to $74,999 | 34 (26.4%) | 18 (23.1%) |
| $75,000 to $99,999 | 18 (14.0%) | 5 (6.4%) |
| $100,000 to $149,999 | 20 (15.5%) | 4 (5.1%) |
| $150,000 or more | 4 (3.1%) | 23 (29.5%) |
| Total | 129 (100.0%) | 78 (100.0%) |
Property Value to Household Income Ratio in Big Sandy
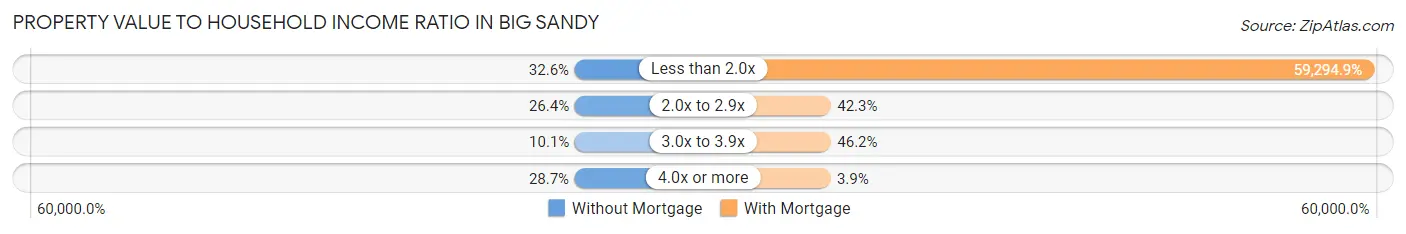
| Value-to-Income Ratio | Without Mortgage | With Mortgage |
| Less than 2.0x | 42 (32.6%) | 46,250 (59,294.9%) |
| 2.0x to 2.9x | 34 (26.4%) | 33 (42.3%) |
| 3.0x to 3.9x | 13 (10.1%) | 36 (46.2%) |
| 4.0x or more | 37 (28.7%) | 3 (3.8%) |
| Total | 129 (100.0%) | 78 (100.0%) |
Real Estate Taxes by Mortgage Status in Big Sandy
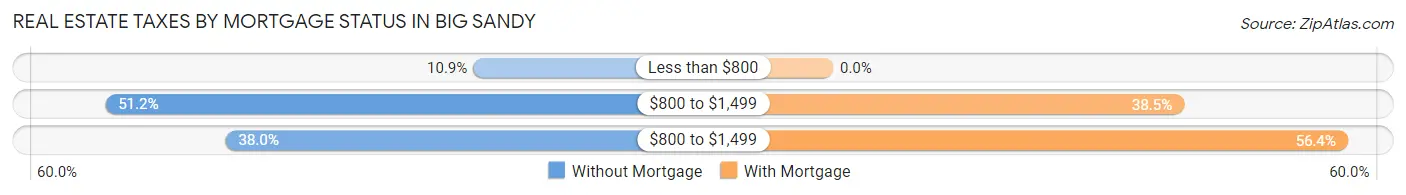
| Property Taxes | Without Mortgage | With Mortgage |
| Less than $800 | 14 (10.8%) | 0 (0.0%) |
| $800 to $1,499 | 66 (51.2%) | 30 (38.5%) |
| $800 to $1,499 | 49 (38.0%) | 44 (56.4%) |
| Total | 129 (100.0%) | 78 (100.0%) |
Health & Disability in Big Sandy
Health Insurance Coverage by Age in Big Sandy
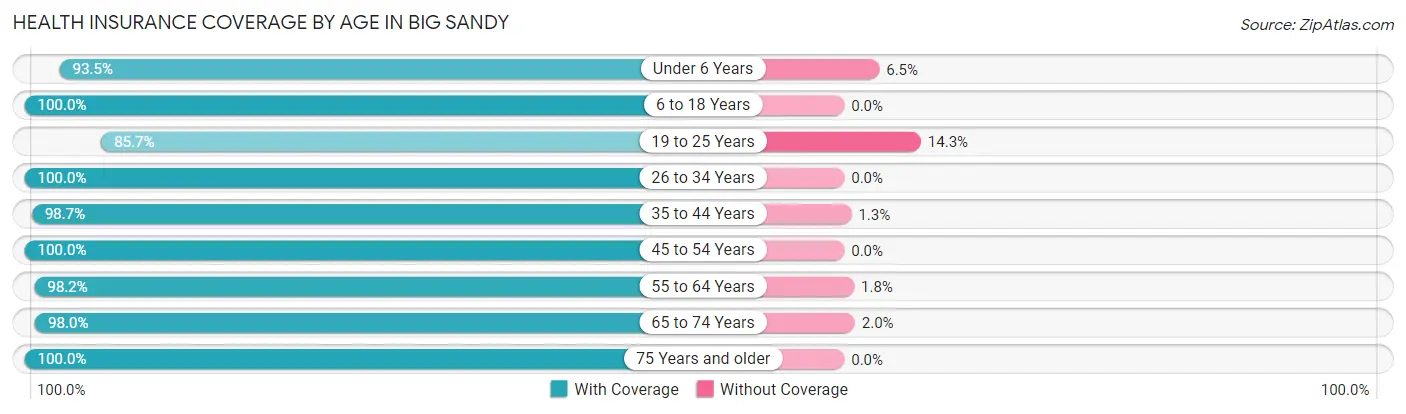
| Age Bracket | With Coverage | Without Coverage |
| Under 6 Years | 43 (93.5%) | 3 (6.5%) |
| 6 to 18 Years | 160 (100.0%) | 0 (0.0%) |
| 19 to 25 Years | 54 (85.7%) | 9 (14.3%) |
| 26 to 34 Years | 30 (100.0%) | 0 (0.0%) |
| 35 to 44 Years | 147 (98.7%) | 2 (1.3%) |
| 45 to 54 Years | 90 (100.0%) | 0 (0.0%) |
| 55 to 64 Years | 107 (98.2%) | 2 (1.8%) |
| 65 to 74 Years | 100 (98.0%) | 2 (2.0%) |
| 75 Years and older | 49 (100.0%) | 0 (0.0%) |
| Total | 780 (97.7%) | 18 (2.3%) |
Health Insurance Coverage by Citizenship Status in Big Sandy
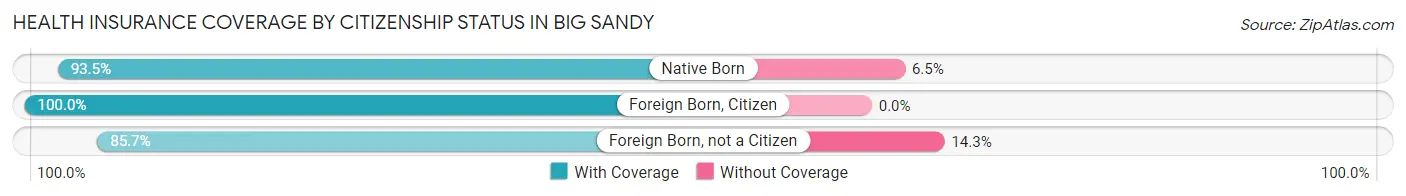
| Citizenship Status | With Coverage | Without Coverage |
| Native Born | 43 (93.5%) | 3 (6.5%) |
| Foreign Born, Citizen | 160 (100.0%) | 0 (0.0%) |
| Foreign Born, not a Citizen | 54 (85.7%) | 9 (14.3%) |
Health Insurance Coverage by Household Income in Big Sandy
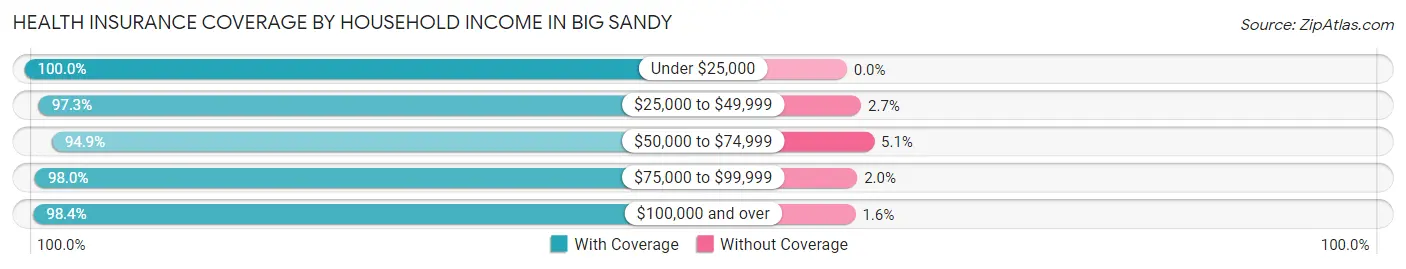
| Household Income | With Coverage | Without Coverage |
| Under $25,000 | 78 (100.0%) | 0 (0.0%) |
| $25,000 to $49,999 | 145 (97.3%) | 4 (2.7%) |
| $50,000 to $74,999 | 130 (94.9%) | 7 (5.1%) |
| $75,000 to $99,999 | 100 (98.0%) | 2 (2.0%) |
| $100,000 and over | 301 (98.4%) | 5 (1.6%) |
Public vs Private Health Insurance Coverage by Age in Big Sandy
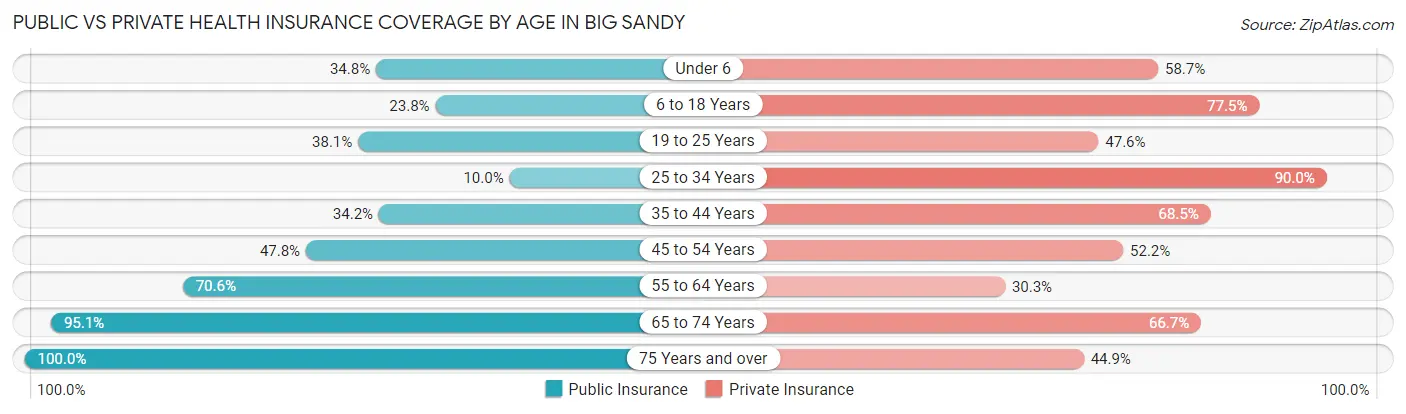
| Age Bracket | Public Insurance | Private Insurance |
| Under 6 | 16 (34.8%) | 27 (58.7%) |
| 6 to 18 Years | 38 (23.7%) | 124 (77.5%) |
| 19 to 25 Years | 24 (38.1%) | 30 (47.6%) |
| 25 to 34 Years | 3 (10.0%) | 27 (90.0%) |
| 35 to 44 Years | 51 (34.2%) | 102 (68.5%) |
| 45 to 54 Years | 43 (47.8%) | 47 (52.2%) |
| 55 to 64 Years | 77 (70.6%) | 33 (30.3%) |
| 65 to 74 Years | 97 (95.1%) | 68 (66.7%) |
| 75 Years and over | 49 (100.0%) | 22 (44.9%) |
| Total | 398 (49.9%) | 480 (60.2%) |
Disability Status by Sex by Age in Big Sandy
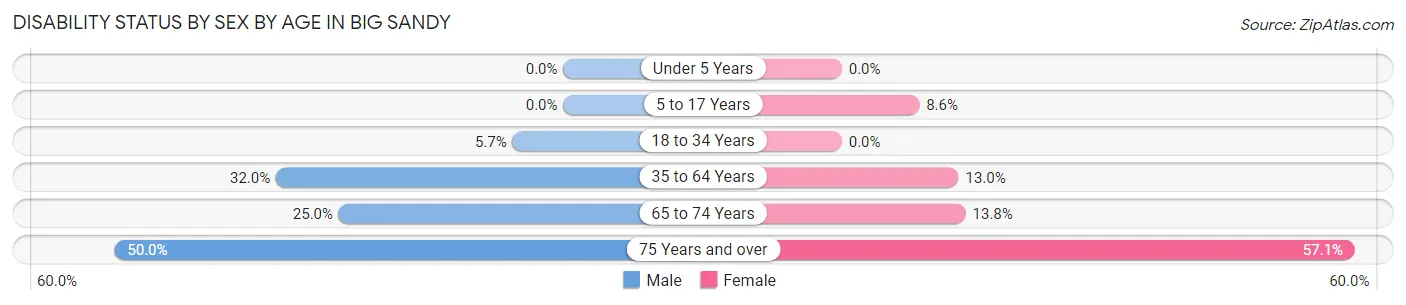
| Age Bracket | Male | Female |
| Under 5 Years | 0 (0.0%) | 0 (0.0%) |
| 5 to 17 Years | 0 (0.0%) | 10 (8.6%) |
| 18 to 34 Years | 3 (5.7%) | 0 (0.0%) |
| 35 to 64 Years | 40 (32.0%) | 29 (13.0%) |
| 65 to 74 Years | 11 (25.0%) | 8 (13.8%) |
| 75 Years and over | 14 (50.0%) | 12 (57.1%) |
Disability Class by Sex by Age in Big Sandy
Disability Class: Hearing Difficulty
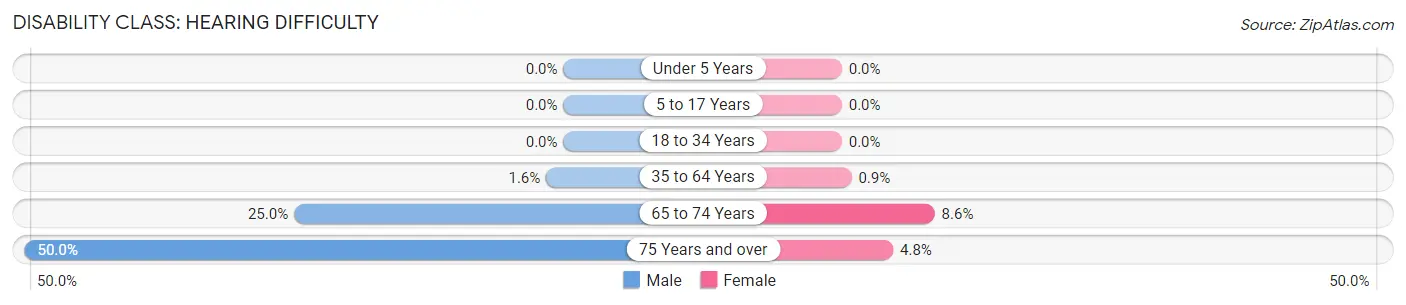
| Age Bracket | Male | Female |
| Under 5 Years | 0 (0.0%) | 0 (0.0%) |
| 5 to 17 Years | 0 (0.0%) | 0 (0.0%) |
| 18 to 34 Years | 0 (0.0%) | 0 (0.0%) |
| 35 to 64 Years | 2 (1.6%) | 2 (0.9%) |
| 65 to 74 Years | 11 (25.0%) | 5 (8.6%) |
| 75 Years and over | 14 (50.0%) | 1 (4.8%) |
Disability Class: Vision Difficulty
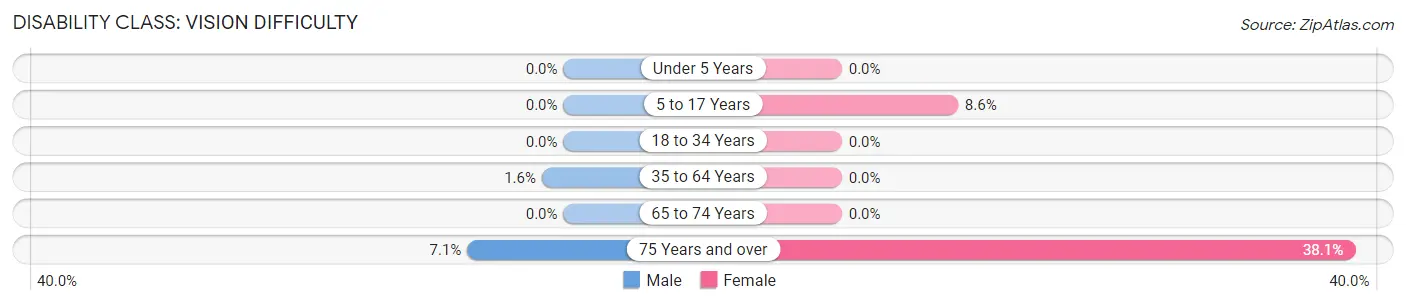
| Age Bracket | Male | Female |
| Under 5 Years | 0 (0.0%) | 0 (0.0%) |
| 5 to 17 Years | 0 (0.0%) | 10 (8.6%) |
| 18 to 34 Years | 0 (0.0%) | 0 (0.0%) |
| 35 to 64 Years | 2 (1.6%) | 0 (0.0%) |
| 65 to 74 Years | 0 (0.0%) | 0 (0.0%) |
| 75 Years and over | 2 (7.1%) | 8 (38.1%) |
Disability Class: Cognitive Difficulty
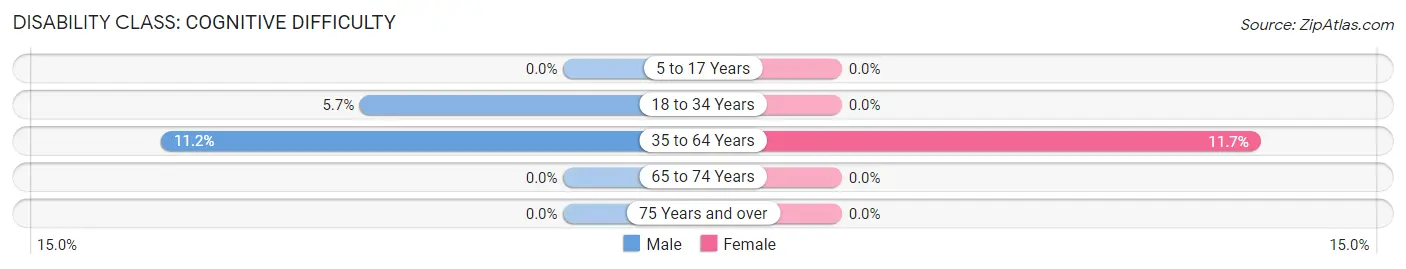
| Age Bracket | Male | Female |
| 5 to 17 Years | 0 (0.0%) | 0 (0.0%) |
| 18 to 34 Years | 3 (5.7%) | 0 (0.0%) |
| 35 to 64 Years | 14 (11.2%) | 26 (11.7%) |
| 65 to 74 Years | 0 (0.0%) | 0 (0.0%) |
| 75 Years and over | 0 (0.0%) | 0 (0.0%) |
Disability Class: Ambulatory Difficulty
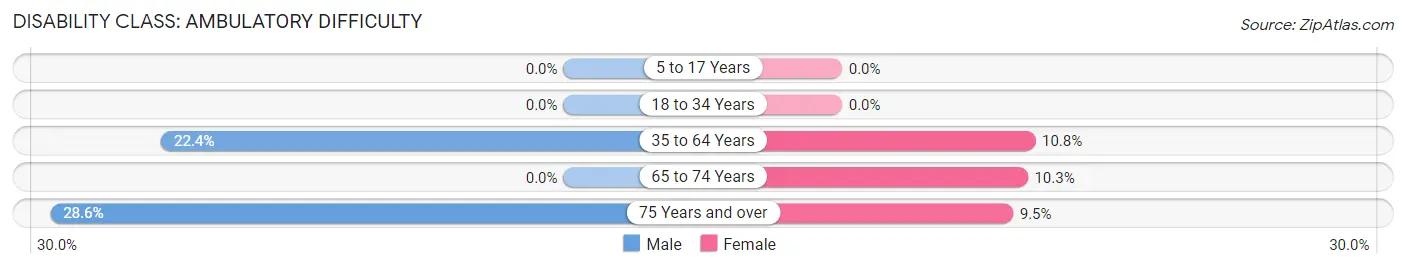
| Age Bracket | Male | Female |
| 5 to 17 Years | 0 (0.0%) | 0 (0.0%) |
| 18 to 34 Years | 0 (0.0%) | 0 (0.0%) |
| 35 to 64 Years | 28 (22.4%) | 24 (10.8%) |
| 65 to 74 Years | 0 (0.0%) | 6 (10.3%) |
| 75 Years and over | 8 (28.6%) | 2 (9.5%) |
Disability Class: Self-Care Difficulty
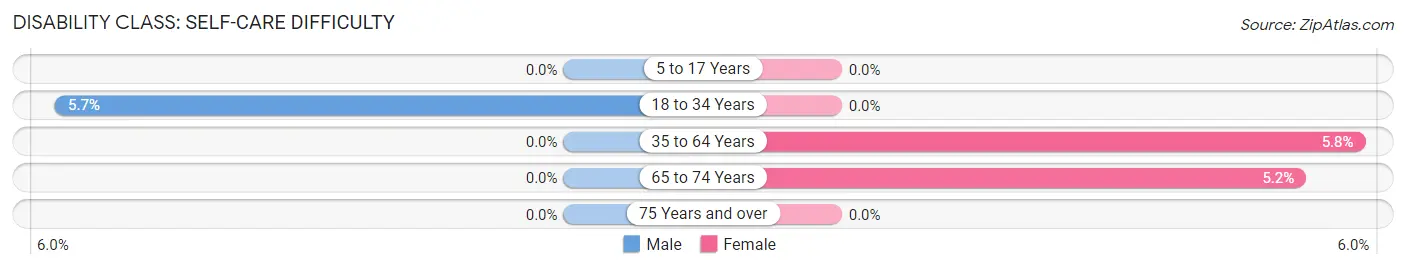
| Age Bracket | Male | Female |
| 5 to 17 Years | 0 (0.0%) | 0 (0.0%) |
| 18 to 34 Years | 3 (5.7%) | 0 (0.0%) |
| 35 to 64 Years | 0 (0.0%) | 13 (5.8%) |
| 65 to 74 Years | 0 (0.0%) | 3 (5.2%) |
| 75 Years and over | 0 (0.0%) | 0 (0.0%) |
Technology Access in Big Sandy
Computing Device Access in Big Sandy
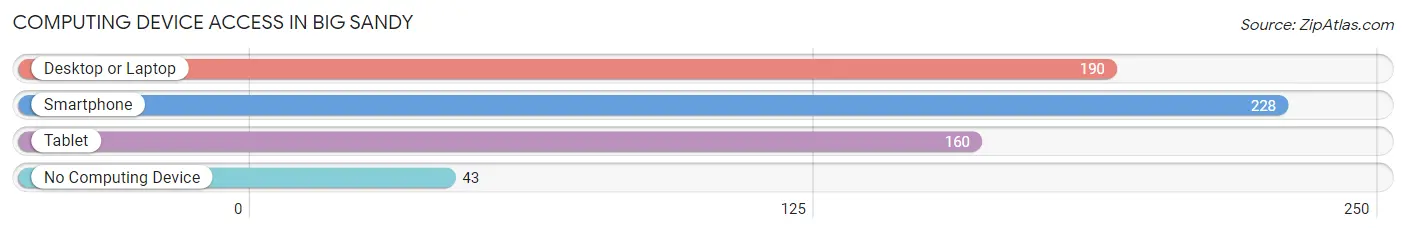
| Device Type | # Households | % Households |
| Desktop or Laptop | 190 | 65.7% |
| Smartphone | 228 | 78.9% |
| Tablet | 160 | 55.4% |
| No Computing Device | 43 | 14.9% |
| Total | 289 | 100.0% |
Internet Access in Big Sandy
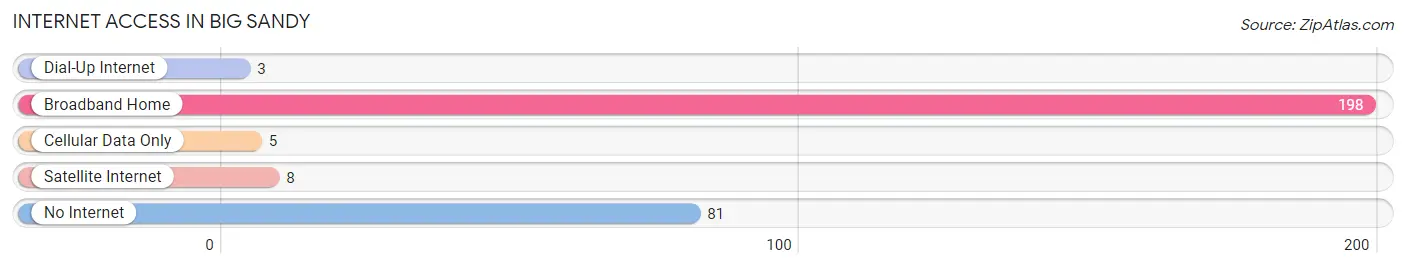
| Internet Type | # Households | % Households |
| Dial-Up Internet | 3 | 1.0% |
| Broadband Home | 198 | 68.5% |
| Cellular Data Only | 5 | 1.7% |
| Satellite Internet | 8 | 2.8% |
| No Internet | 81 | 28.0% |
| Total | 289 | 100.0% |
Big Sandy Summary
Big Sandy, Montana is a small town located in Chouteau County, Montana. It is situated in the north-central part of the state, about 50 miles south of the Canadian border. The town has a population of just over 500 people, and is the county seat of Chouteau County.
Big Sandy is located in the Rocky Mountain Front, a region of the Rocky Mountains that extends from the Canadian border to the Great Plains. The town is situated in a valley surrounded by the Rocky Mountains, and is home to a variety of wildlife, including deer, elk, and antelope. The area is also known for its abundance of wildflowers, and is a popular destination for hikers and campers.
The economy of Big Sandy is largely based on agriculture and ranching. The town is home to several large ranches, and the surrounding area is used for cattle and sheep grazing. The town also has a small manufacturing sector, with several small businesses producing a variety of products, including furniture, clothing, and leather goods.
The town is served by a small airport, and is connected to the rest of the state by a network of highways and roads. The nearest major city is Great Falls, which is about an hour and a half away.
Big Sandy has a rich history, dating back to the late 1800s when it was founded by a group of homesteaders. The town was originally called “Big Sandy Station”, and was a stop on the Great Northern Railway. The town was later renamed Big Sandy, and has remained the same ever since.
The population of Big Sandy is predominantly white, with a small percentage of Native Americans and African Americans. The median household income is around $35,000, and the median age is around 40 years old. The town has a low unemployment rate, and the majority of the population is employed in the agricultural and ranching industries.
Big Sandy is a small town with a big heart. It is a great place to live, work, and raise a family. The town is surrounded by beautiful scenery, and the people are friendly and welcoming. Big Sandy is a great place to call home.
Common Questions
What is Per Capita Income in Big Sandy?
Per Capita income in Big Sandy is $26,656.
What is the Median Family Income in Big Sandy?
Median Family Income in Big Sandy is $87,250.
What is the Median Household income in Big Sandy?
Median Household Income in Big Sandy is $47,169.
What is Income or Wage Gap in Big Sandy?
Income or Wage Gap in Big Sandy is 1.1%.
Women in Big Sandy earn 98.9 cents for every dollar earned by a man.
What is Inequality or Gini Index in Big Sandy?
Inequality or Gini Index in Big Sandy is 0.42.
What is the Total Population of Big Sandy?
Total Population of Big Sandy is 798.
What is the Total Male Population of Big Sandy?
Total Male Population of Big Sandy is 329.
What is the Total Female Population of Big Sandy?
Total Female Population of Big Sandy is 469.
What is the Ratio of Males per 100 Females in Big Sandy?
There are 70.15 Males per 100 Females in Big Sandy.
What is the Ratio of Females per 100 Males in Big Sandy?
There are 142.55 Females per 100 Males in Big Sandy.
What is the Median Population Age in Big Sandy?
Median Population Age in Big Sandy is 43.5 Years.
What is the Average Family Size in Big Sandy
Average Family Size in Big Sandy is 4.0 People.
What is the Average Household Size in Big Sandy
Average Household Size in Big Sandy is 2.7 People.
How Large is the Labor Force in Big Sandy?
There are 367 People in the Labor Forcein in Big Sandy.
What is the Percentage of People in the Labor Force in Big Sandy?
58.3% of People are in the Labor Force in Big Sandy.
What is the Unemployment Rate in Big Sandy?
Unemployment Rate in Big Sandy is 11.7%.