Seeley Lake, MT Map & Demographics
Seeley Lake Map
Seeley Lake Overview
$34,990
PER CAPITA INCOME
$66,375
AVG FAMILY INCOME
$42,254
AVG HOUSEHOLD INCOME
0.48
INEQUALITY / GINI INDEX
1,590
TOTAL POPULATION
875
MALE POPULATION
715
FEMALE POPULATION
122.38
MALES / 100 FEMALES
81.71
FEMALES / 100 MALES
58.7
MEDIAN AGE
2.7
AVG FAMILY SIZE
2.1
AVG HOUSEHOLD SIZE
595
LABOR FORCE [ PEOPLE ]
41.1%
PERCENT IN LABOR FORCE
6.1%
UNEMPLOYMENT RATE
Seeley Lake Zip Codes
Seeley Lake Area Codes
Income in Seeley Lake
Income Overview in Seeley Lake
Per Capita Income in Seeley Lake is $34,990, while median incomes of families and households are $66,375 and $42,254 respectively.
| Characteristic | Number | Measure |
| Per Capita Income | 1,590 | $34,990 |
| Median Family Income | 433 | $66,375 |
| Mean Family Income | 433 | $95,960 |
| Median Household Income | 772 | $42,254 |
| Mean Household Income | 772 | $72,123 |
| Income Deficit | 433 | $0 |
| Wage / Income Gap (%) | 1,590 | 0.00% |
| Wage / Income Gap ($) | 1,590 | 100.00¢ per $1 |
| Gini / Inequality Index | 1,590 | 0.48 |
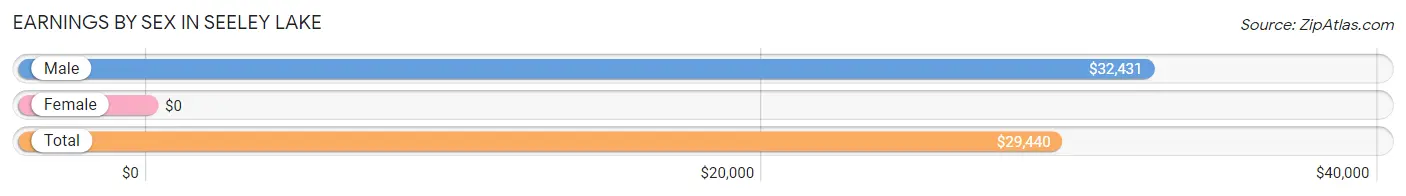
Earnings by Sex in Seeley Lake
| Sex | Number | Average Earnings |
| Male | 431 (62.6%) | $32,431 |
| Female | 257 (37.3%) | $0 |
| Total | 688 (100.0%) | $29,440 |
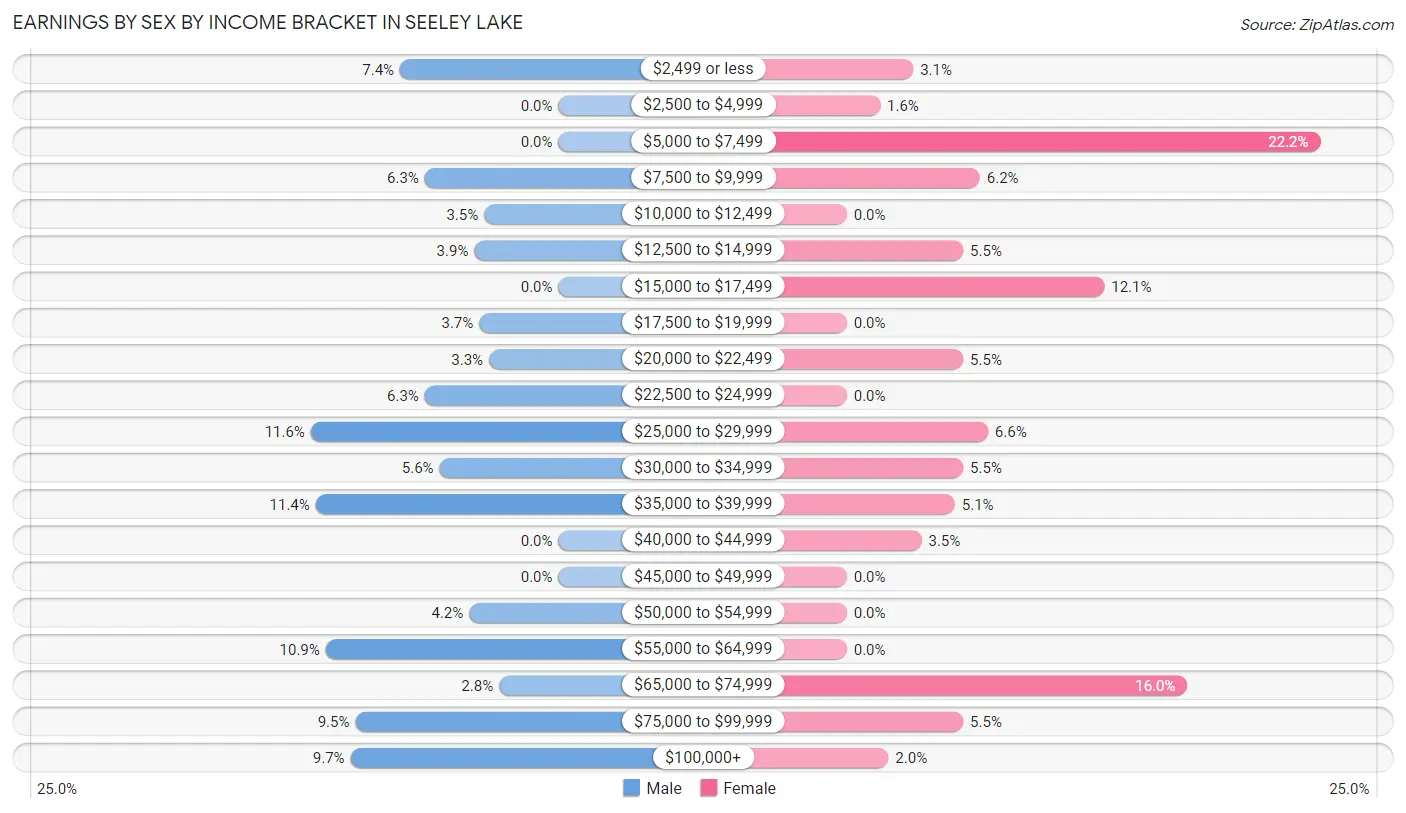
Earnings by Sex by Income Bracket in Seeley Lake
The most common earnings brackets in Seeley Lake are $25,000 to $29,999 for men (50 | 11.6%) and $5,000 to $7,499 for women (57 | 22.2%).
| Income | Male | Female |
| $2,499 or less | 32 (7.4%) | 8 (3.1%) |
| $2,500 to $4,999 | 0 (0.0%) | 4 (1.6%) |
| $5,000 to $7,499 | 0 (0.0%) | 57 (22.2%) |
| $7,500 to $9,999 | 27 (6.3%) | 16 (6.2%) |
| $10,000 to $12,499 | 15 (3.5%) | 0 (0.0%) |
| $12,500 to $14,999 | 17 (3.9%) | 14 (5.4%) |
| $15,000 to $17,499 | 0 (0.0%) | 31 (12.1%) |
| $17,500 to $19,999 | 16 (3.7%) | 0 (0.0%) |
| $20,000 to $22,499 | 14 (3.3%) | 14 (5.4%) |
| $22,500 to $24,999 | 27 (6.3%) | 0 (0.0%) |
| $25,000 to $29,999 | 50 (11.6%) | 17 (6.6%) |
| $30,000 to $34,999 | 24 (5.6%) | 14 (5.4%) |
| $35,000 to $39,999 | 49 (11.4%) | 13 (5.1%) |
| $40,000 to $44,999 | 0 (0.0%) | 9 (3.5%) |
| $45,000 to $49,999 | 0 (0.0%) | 0 (0.0%) |
| $50,000 to $54,999 | 18 (4.2%) | 0 (0.0%) |
| $55,000 to $64,999 | 47 (10.9%) | 0 (0.0%) |
| $65,000 to $74,999 | 12 (2.8%) | 41 (16.0%) |
| $75,000 to $99,999 | 41 (9.5%) | 14 (5.4%) |
| $100,000+ | 42 (9.7%) | 5 (1.9%) |
| Total | 431 (100.0%) | 257 (100.0%) |
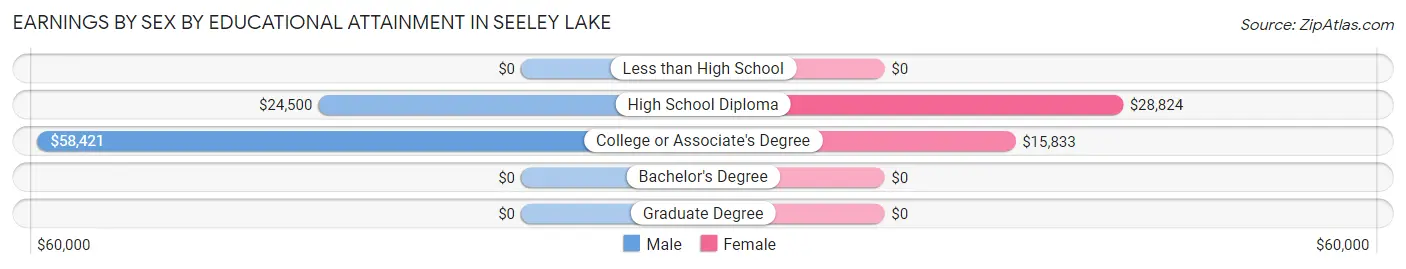
Earnings by Sex by Educational Attainment in Seeley Lake
Average earnings in Seeley Lake are $36,033 for men and $21,518 for women, a difference of 40.3%. Men with an educational attainment of college or associate's degree enjoy the highest average annual earnings of $58,421, while those with high school diploma education earn the least with $24,500. Women with an educational attainment of high school diploma earn the most with the average annual earnings of $28,824, while those with college or associate's degree education have the smallest earnings of $15,833.
| Educational Attainment | Male Income | Female Income |
| Less than High School | - | - |
| High School Diploma | $24,500 | $28,824 |
| College or Associate's Degree | $58,421 | $15,833 |
| Bachelor's Degree | - | - |
| Graduate Degree | - | - |
| Total | $36,033 | $21,518 |
Family Income in Seeley Lake
Family Income Brackets in Seeley Lake
According to the Seeley Lake family income data, there are 134 families falling into the $35,000 to $49,999 income range, which is the most common income bracket and makes up 30.9% of all families.
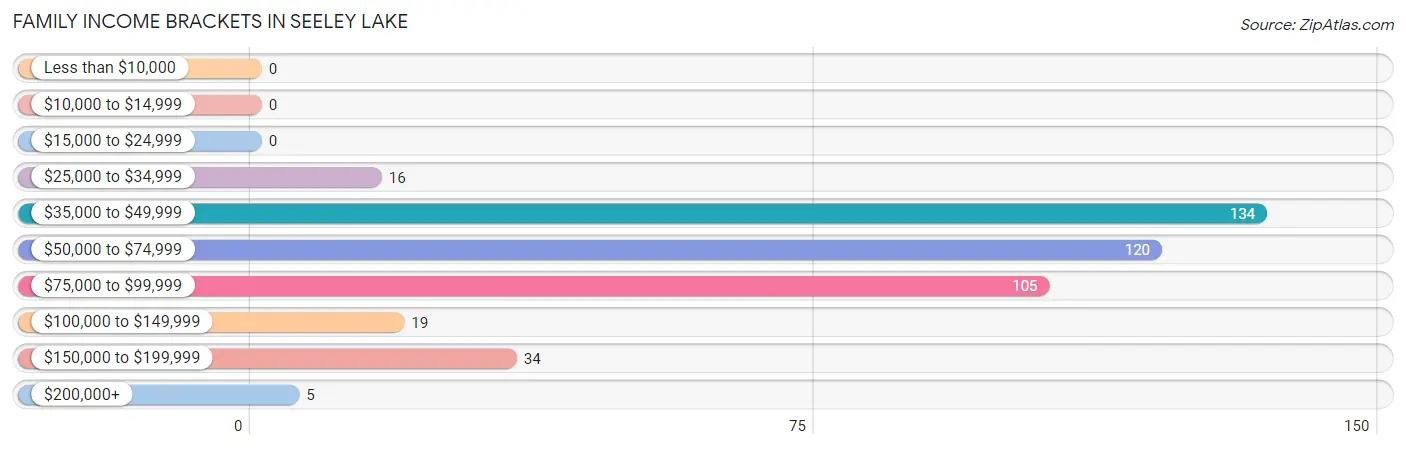
| Income Bracket | # Families | % Families |
| Less than $10,000 | 0 | 0.0% |
| $10,000 to $14,999 | 0 | 0.0% |
| $15,000 to $24,999 | 0 | 0.0% |
| $25,000 to $34,999 | 16 | 3.7% |
| $35,000 to $49,999 | 134 | 30.9% |
| $50,000 to $74,999 | 120 | 27.7% |
| $75,000 to $99,999 | 105 | 24.2% |
| $100,000 to $149,999 | 19 | 4.4% |
| $150,000 to $199,999 | 34 | 7.9% |
| $200,000+ | 5 | 1.2% |
Family Income by Famaliy Size in Seeley Lake
4-person families (38 | 8.8%) account for the highest median family income in Seeley Lake with $71,842 per family, while 2-person families (222 | 51.3%) have the highest median income of $32,928 per family member.
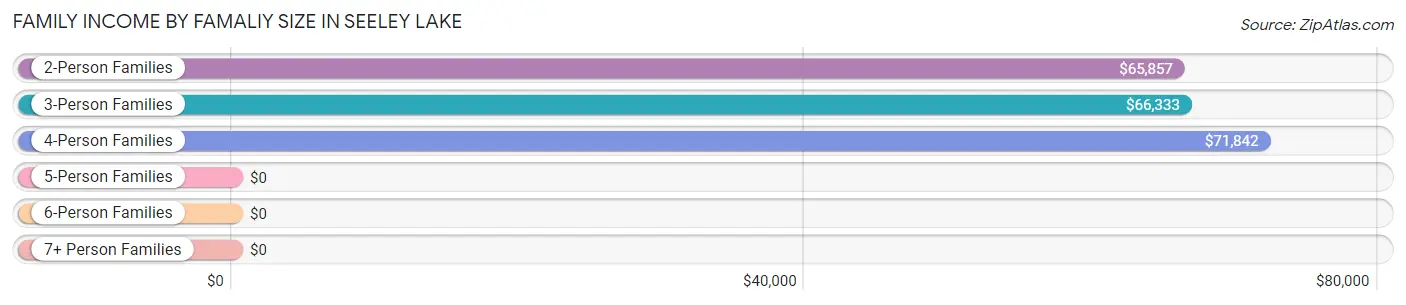
| Income Bracket | # Families | Median Income |
| 2-Person Families | 222 (51.3%) | $65,857 |
| 3-Person Families | 160 (36.9%) | $66,333 |
| 4-Person Families | 38 (8.8%) | $71,842 |
| 5-Person Families | 13 (3.0%) | $0 |
| 6-Person Families | 0 (0.0%) | $0 |
| 7+ Person Families | 0 (0.0%) | $0 |
| Total | 433 (100.0%) | $66,375 |
Family Income by Number of Earners in Seeley Lake
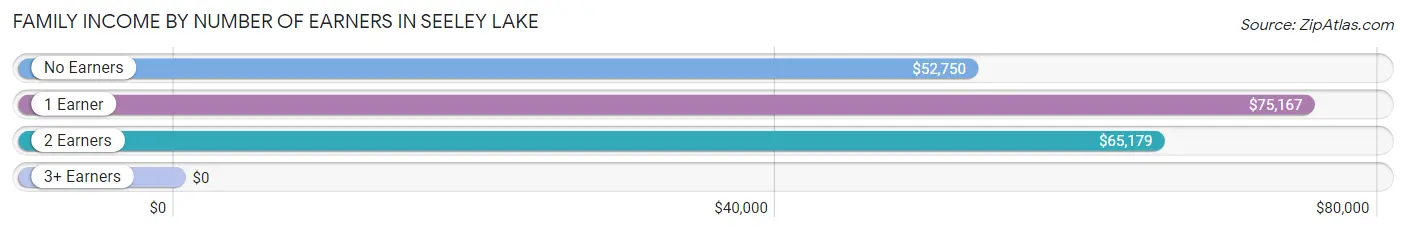
| Number of Earners | # Families | Median Income |
| No Earners | 131 (30.2%) | $52,750 |
| 1 Earner | 106 (24.5%) | $75,167 |
| 2 Earners | 152 (35.1%) | $65,179 |
| 3+ Earners | 44 (10.2%) | $0 |
| Total | 433 (100.0%) | $66,375 |
Household Income in Seeley Lake
Household Income Brackets in Seeley Lake
With 171 households falling in the category, the $35,000 to $49,999 income range is the most frequent in Seeley Lake, accounting for 22.2% of all households.
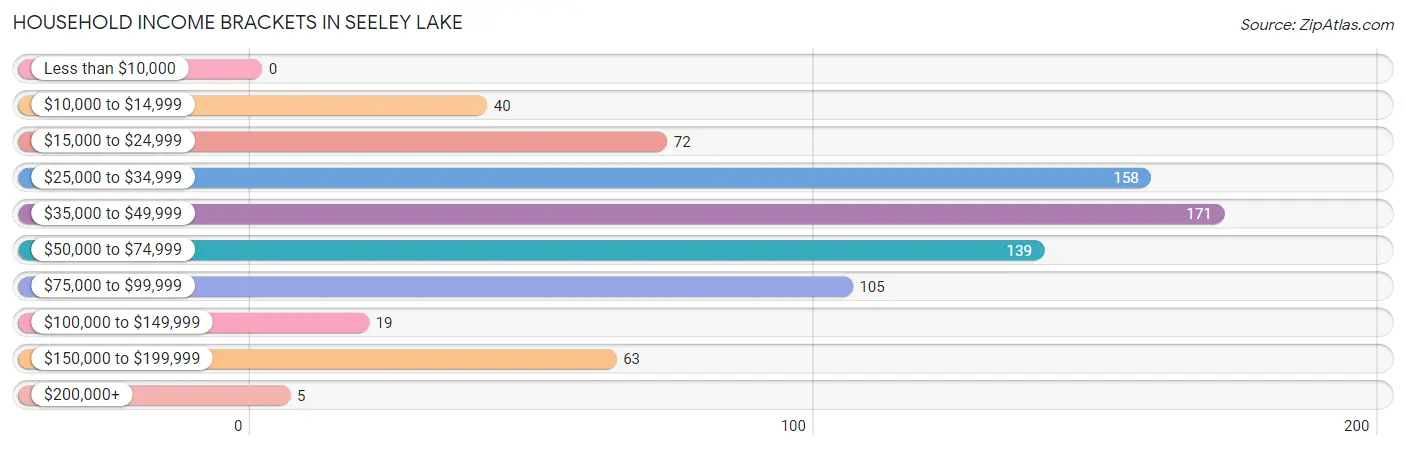
| Income Bracket | # Households | % Households |
| Less than $10,000 | 0 | 0.0% |
| $10,000 to $14,999 | 40 | 5.2% |
| $15,000 to $24,999 | 72 | 9.3% |
| $25,000 to $34,999 | 158 | 20.5% |
| $35,000 to $49,999 | 171 | 22.2% |
| $50,000 to $74,999 | 139 | 18.0% |
| $75,000 to $99,999 | 105 | 13.6% |
| $100,000 to $149,999 | 19 | 2.5% |
| $150,000 to $199,999 | 63 | 8.2% |
| $200,000+ | 5 | 0.6% |
Household Income by Householder Age in Seeley Lake
The median household income in Seeley Lake is $42,254, with the highest median household income of $70,081 found in the 45 to 64 years age bracket for the primary householder. A total of 268 households (34.7%) fall into this category. Meanwhile, the 15 to 24 years age bracket for the primary householder has the lowest median household income of $0, with 26 households (3.4%) in this group.
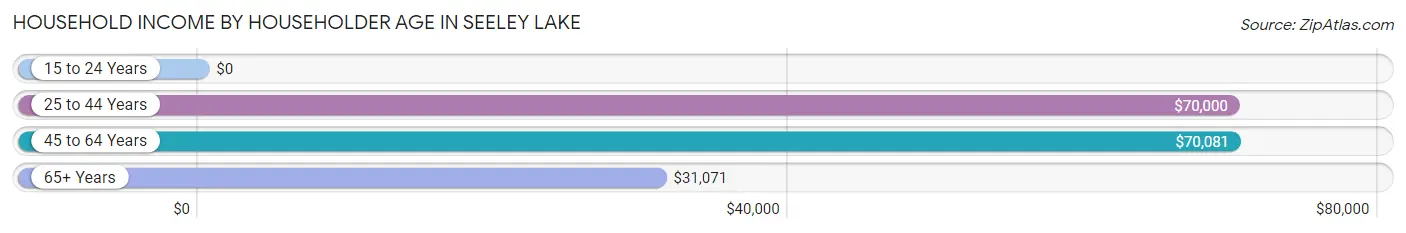
| Income Bracket | # Households | Median Income |
| 15 to 24 Years | 26 (3.4%) | $0 |
| 25 to 44 Years | 92 (11.9%) | $70,000 |
| 45 to 64 Years | 268 (34.7%) | $70,081 |
| 65+ Years | 386 (50.0%) | $31,071 |
| Total | 772 (100.0%) | $42,254 |
Poverty in Seeley Lake
Income Below Poverty by Sex and Age in Seeley Lake
With 5.6% poverty level for males and 2.9% for females among the residents of Seeley Lake, 75 year old and over males and 55 to 64 year old females are the most vulnerable to poverty, with 30 males (30.3%) and 15 females (13.4%) in their respective age groups living below the poverty level.
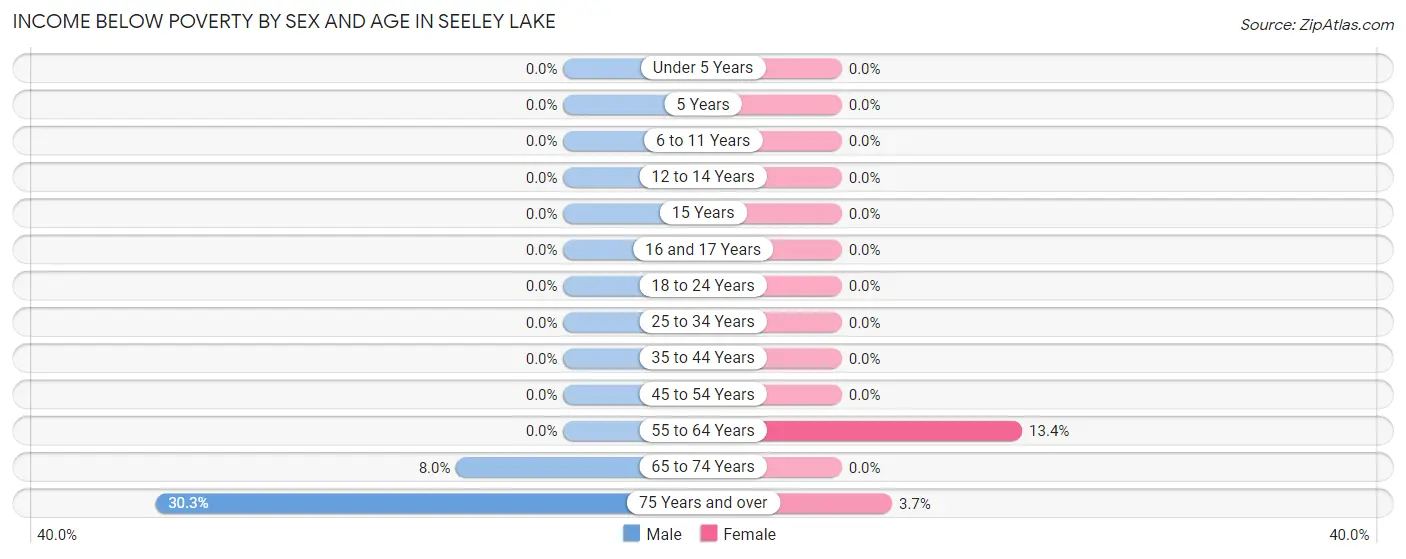
| Age Bracket | Male | Female |
| Under 5 Years | 0 (0.0%) | 0 (0.0%) |
| 5 Years | 0 (0.0%) | 0 (0.0%) |
| 6 to 11 Years | 0 (0.0%) | 0 (0.0%) |
| 12 to 14 Years | 0 (0.0%) | 0 (0.0%) |
| 15 Years | 0 (0.0%) | 0 (0.0%) |
| 16 and 17 Years | 0 (0.0%) | 0 (0.0%) |
| 18 to 24 Years | 0 (0.0%) | 0 (0.0%) |
| 25 to 34 Years | 0 (0.0%) | 0 (0.0%) |
| 35 to 44 Years | 0 (0.0%) | 0 (0.0%) |
| 45 to 54 Years | 0 (0.0%) | 0 (0.0%) |
| 55 to 64 Years | 0 (0.0%) | 15 (13.4%) |
| 65 to 74 Years | 19 (8.0%) | 0 (0.0%) |
| 75 Years and over | 30 (30.3%) | 6 (3.7%) |
| Total | 49 (5.6%) | 21 (2.9%) |
Income Above Poverty by Sex and Age in Seeley Lake
According to the poverty statistics in Seeley Lake, males aged under 5 years and females aged under 5 years are the age groups that are most secure financially, with 100.0% of males and 100.0% of females in these age groups living above the poverty line.
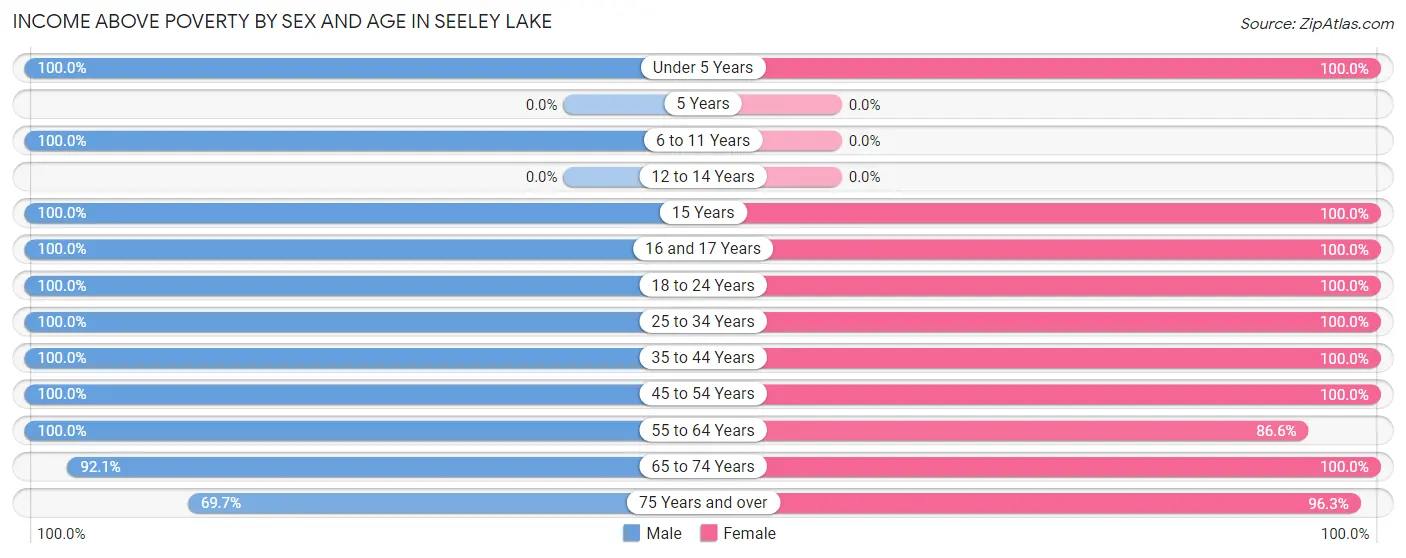
| Age Bracket | Male | Female |
| Under 5 Years | 35 (100.0%) | 23 (100.0%) |
| 5 Years | 0 (0.0%) | 0 (0.0%) |
| 6 to 11 Years | 45 (100.0%) | 0 (0.0%) |
| 12 to 14 Years | 0 (0.0%) | 0 (0.0%) |
| 15 Years | 17 (100.0%) | 23 (100.0%) |
| 16 and 17 Years | 27 (100.0%) | 2 (100.0%) |
| 18 to 24 Years | 57 (100.0%) | 20 (100.0%) |
| 25 to 34 Years | 32 (100.0%) | 150 (100.0%) |
| 35 to 44 Years | 70 (100.0%) | 32 (100.0%) |
| 45 to 54 Years | 105 (100.0%) | 75 (100.0%) |
| 55 to 64 Years | 149 (100.0%) | 97 (86.6%) |
| 65 to 74 Years | 220 (92.0%) | 117 (100.0%) |
| 75 Years and over | 69 (69.7%) | 155 (96.3%) |
| Total | 826 (94.4%) | 694 (97.1%) |
Income Below Poverty Among Married-Couple Families in Seeley Lake
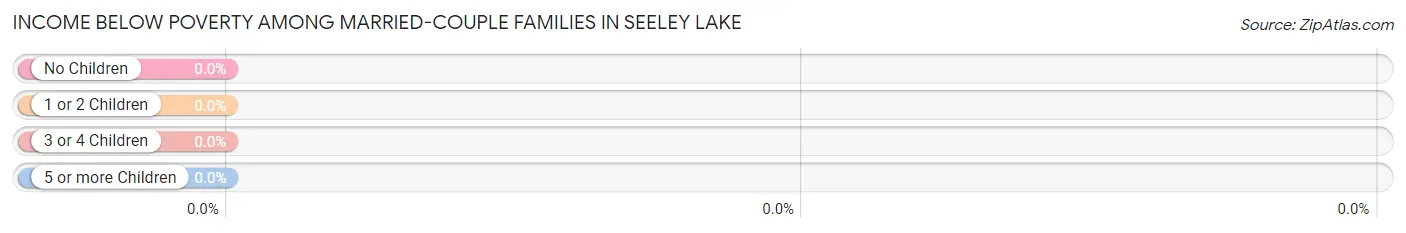
| Children | Above Poverty | Below Poverty |
| No Children | 292 (100.0%) | 0 (0.0%) |
| 1 or 2 Children | 112 (100.0%) | 0 (0.0%) |
| 3 or 4 Children | 13 (100.0%) | 0 (0.0%) |
| 5 or more Children | 0 (0.0%) | 0 (0.0%) |
| Total | 417 (100.0%) | 0 (0.0%) |
Income Below Poverty Among Single-Parent Households in Seeley Lake
| Children | Single Father | Single Mother |
| No Children | 0 (0.0%) | 0 (0.0%) |
| 1 or 2 Children | 0 (0.0%) | 0 (0.0%) |
| 3 or 4 Children | 0 (0.0%) | 0 (0.0%) |
| 5 or more Children | 0 (0.0%) | 0 (0.0%) |
| Total | 0 (0.0%) | 0 (0.0%) |
Income Below Poverty Among Married-Couple vs Single-Parent Households in Seeley Lake
| Children | Married-Couple Families | Single-Parent Households |
| No Children | 0 (0.0%) | 0 (0.0%) |
| 1 or 2 Children | 0 (0.0%) | 0 (0.0%) |
| 3 or 4 Children | 0 (0.0%) | 0 (0.0%) |
| 5 or more Children | 0 (0.0%) | 0 (0.0%) |
| Total | 0 (0.0%) | 0 (0.0%) |
Race in Seeley Lake
The most populous races in Seeley Lake are White / Caucasian (1,421 | 89.4%), Asian (100 | 6.3%), and Two or more Races (69 | 4.3%).
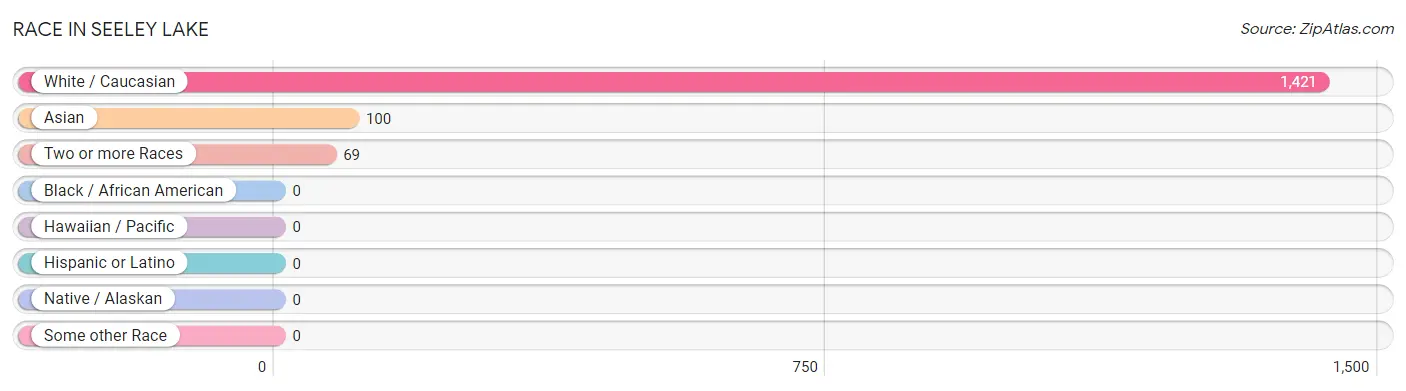
| Race | # Population | % Population |
| Asian | 100 | 6.3% |
| Black / African American | 0 | 0.0% |
| Hawaiian / Pacific | 0 | 0.0% |
| Hispanic or Latino | 0 | 0.0% |
| Native / Alaskan | 0 | 0.0% |
| White / Caucasian | 1,421 | 89.4% |
| Two or more Races | 69 | 4.3% |
| Some other Race | 0 | 0.0% |
| Total | 1,590 | 100.0% |
Ancestry in Seeley Lake
The most populous ancestries reported in Seeley Lake are German (329 | 20.7%), Irish (295 | 18.5%), American (219 | 13.8%), English (204 | 12.8%), and Norwegian (192 | 12.1%), together accounting for 77.9% of all Seeley Lake residents.
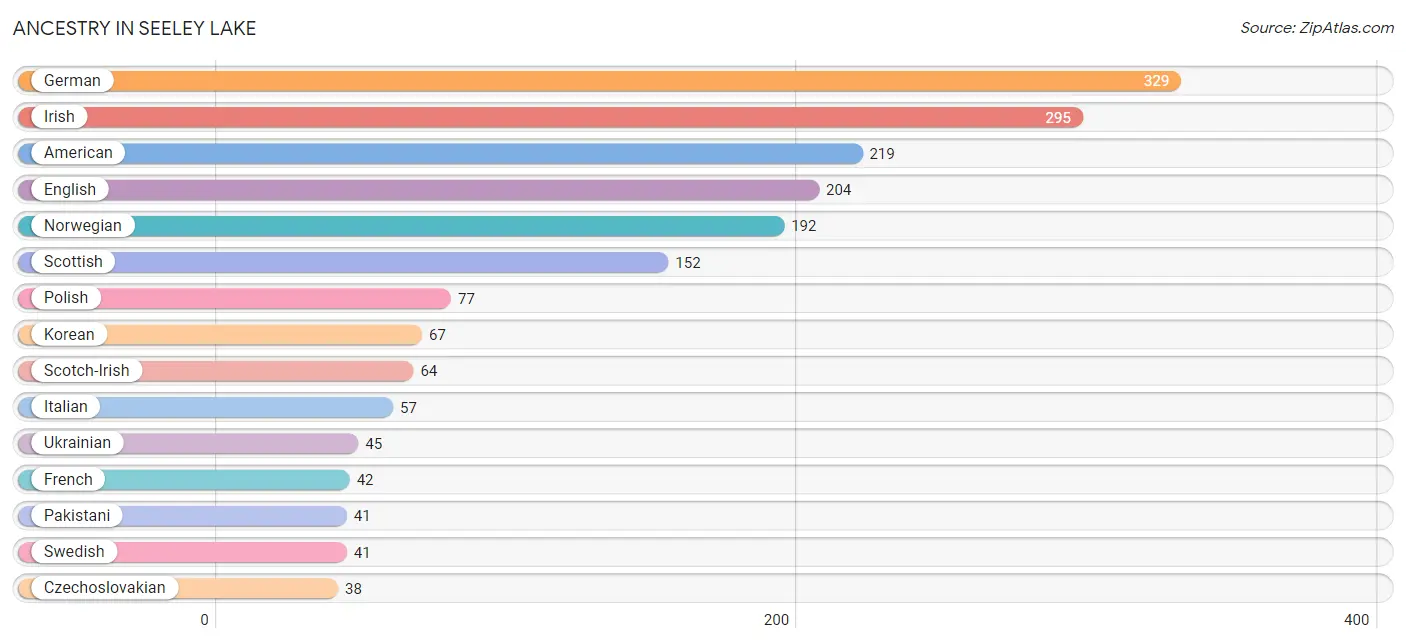
| Ancestry | # Population | % Population |
| American | 219 | 13.8% |
| Bhutanese | 32 | 2.0% |
| Czech | 35 | 2.2% |
| Czechoslovakian | 38 | 2.4% |
| Danish | 5 | 0.3% |
| Dutch | 15 | 0.9% |
| Eastern European | 28 | 1.8% |
| English | 204 | 12.8% |
| French | 42 | 2.6% |
| French Canadian | 37 | 2.3% |
| German | 329 | 20.7% |
| Hungarian | 6 | 0.4% |
| Irish | 295 | 18.5% |
| Italian | 57 | 3.6% |
| Korean | 67 | 4.2% |
| Norwegian | 192 | 12.1% |
| Pakistani | 41 | 2.6% |
| Polish | 77 | 4.8% |
| Scandinavian | 23 | 1.5% |
| Scotch-Irish | 64 | 4.0% |
| Scottish | 152 | 9.6% |
| Swedish | 41 | 2.6% |
| Swiss | 8 | 0.5% |
| Ukrainian | 45 | 2.8% |
| Yugoslavian | 16 | 1.0% | View All 25 Rows |
Immigrants in Seeley Lake
The most numerous immigrant groups reported in Seeley Lake came from Asia (100 | 6.3%), South Eastern Asia (84 | 5.3%), Philippines (67 | 4.2%), Europe (47 | 3.0%), and Germany (47 | 3.0%), together accounting for 21.7% of all Seeley Lake residents.
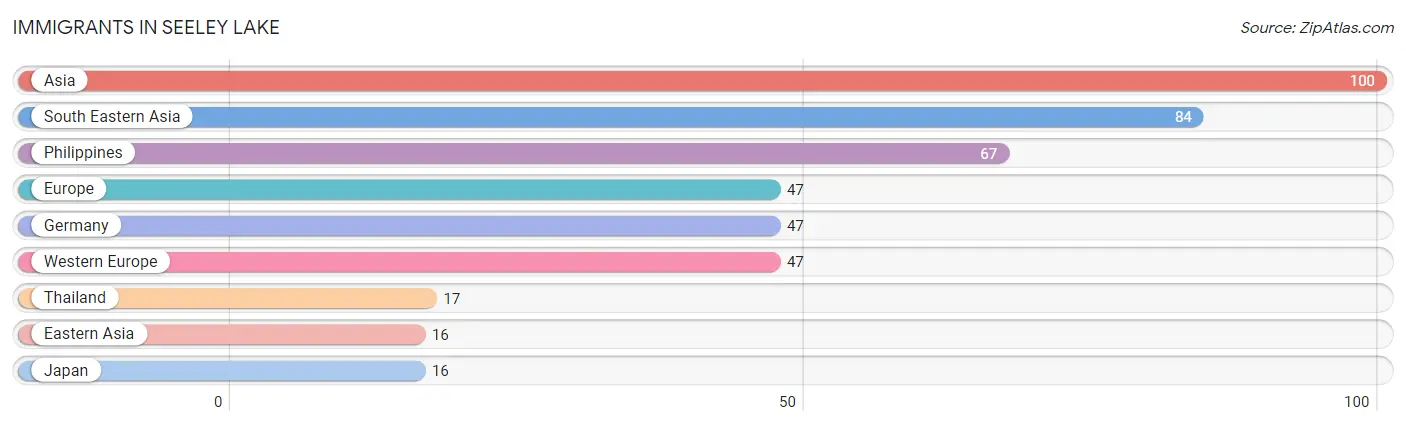
| Immigration Origin | # Population | % Population |
| Asia | 100 | 6.3% |
| Eastern Asia | 16 | 1.0% |
| Europe | 47 | 3.0% |
| Germany | 47 | 3.0% |
| Japan | 16 | 1.0% |
| Philippines | 67 | 4.2% |
| South Eastern Asia | 84 | 5.3% |
| Thailand | 17 | 1.1% |
| Western Europe | 47 | 3.0% | View All 9 Rows |
Sex and Age in Seeley Lake
Sex and Age in Seeley Lake
The most populous age groups in Seeley Lake are 70 to 74 Years (165 | 18.9%) for men and 25 to 29 Years (102 | 14.3%) for women.
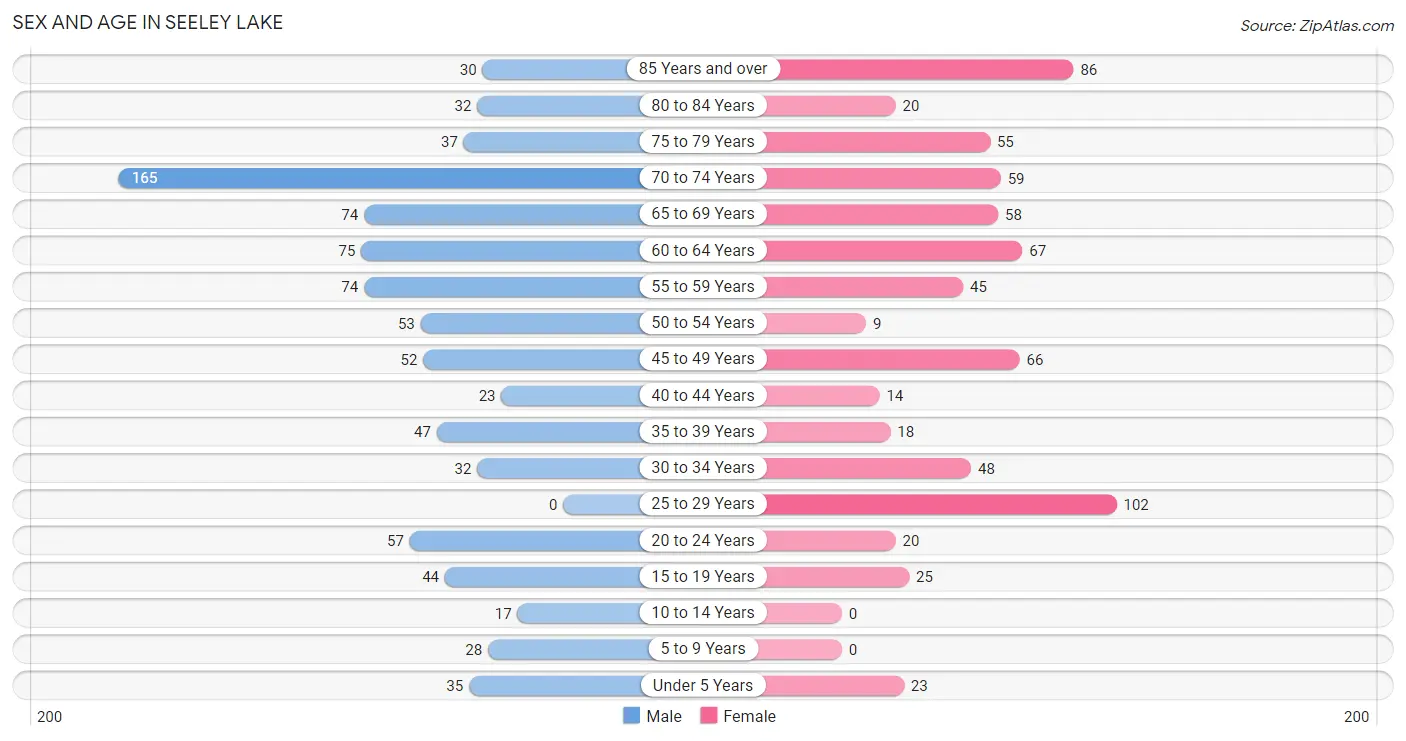
| Age Bracket | Male | Female |
| Under 5 Years | 35 (4.0%) | 23 (3.2%) |
| 5 to 9 Years | 28 (3.2%) | 0 (0.0%) |
| 10 to 14 Years | 17 (1.9%) | 0 (0.0%) |
| 15 to 19 Years | 44 (5.0%) | 25 (3.5%) |
| 20 to 24 Years | 57 (6.5%) | 20 (2.8%) |
| 25 to 29 Years | 0 (0.0%) | 102 (14.3%) |
| 30 to 34 Years | 32 (3.7%) | 48 (6.7%) |
| 35 to 39 Years | 47 (5.4%) | 18 (2.5%) |
| 40 to 44 Years | 23 (2.6%) | 14 (2.0%) |
| 45 to 49 Years | 52 (5.9%) | 66 (9.2%) |
| 50 to 54 Years | 53 (6.1%) | 9 (1.3%) |
| 55 to 59 Years | 74 (8.5%) | 45 (6.3%) |
| 60 to 64 Years | 75 (8.6%) | 67 (9.4%) |
| 65 to 69 Years | 74 (8.5%) | 58 (8.1%) |
| 70 to 74 Years | 165 (18.9%) | 59 (8.3%) |
| 75 to 79 Years | 37 (4.2%) | 55 (7.7%) |
| 80 to 84 Years | 32 (3.7%) | 20 (2.8%) |
| 85 Years and over | 30 (3.4%) | 86 (12.0%) |
| Total | 875 (100.0%) | 715 (100.0%) |
Families and Households in Seeley Lake
Median Family Size in Seeley Lake
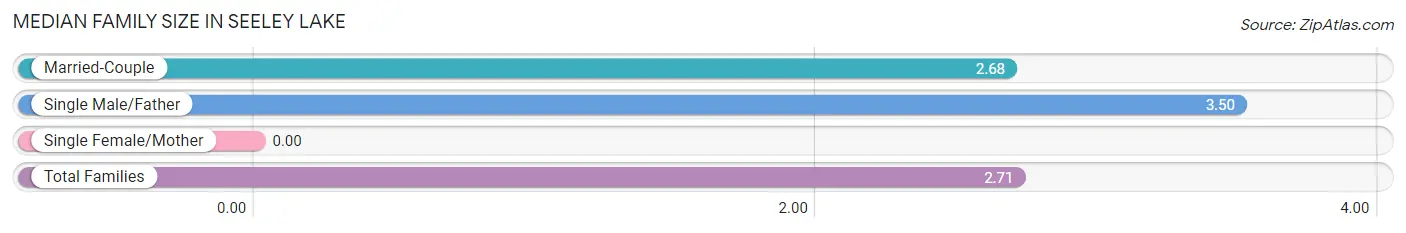
| Family Type | # Families | Family Size |
| Married-Couple | 417 (96.3%) | 2.68 |
| Single Male/Father | 16 (3.7%) | 3.50 |
| Single Female/Mother | 0 (0.0%) | - |
| Total Families | 433 (100.0%) | 2.71 |
Median Household Size in Seeley Lake
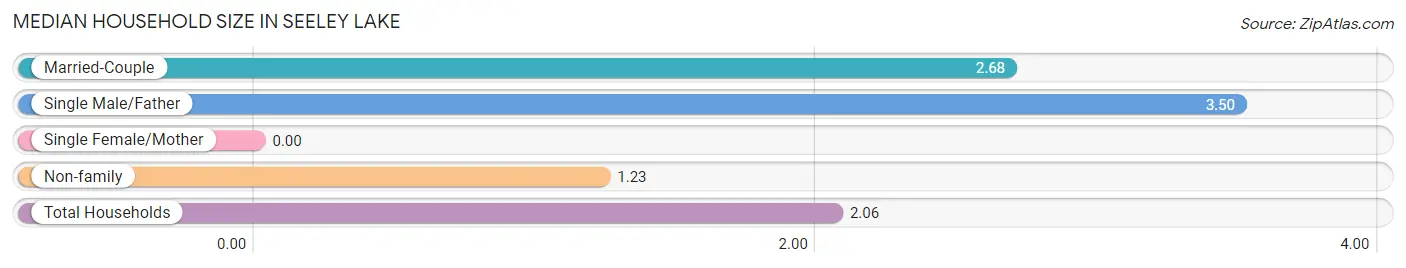
| Household Type | # Households | Household Size |
| Married-Couple | 417 (54.0%) | 2.68 |
| Single Male/Father | 16 (2.1%) | 3.50 |
| Single Female/Mother | 0 (0.0%) | - |
| Non-family | 339 (43.9%) | 1.23 |
| Total Households | 772 (100.0%) | 2.06 |
Household Size by Marriage Status in Seeley Lake
Out of a total of 772 households in Seeley Lake, 433 (56.1%) are family households, while 339 (43.9%) are nonfamily households. The most numerous type of family households are 2-person households, comprising 222, and the most common type of nonfamily households are 1-person households, comprising 280.
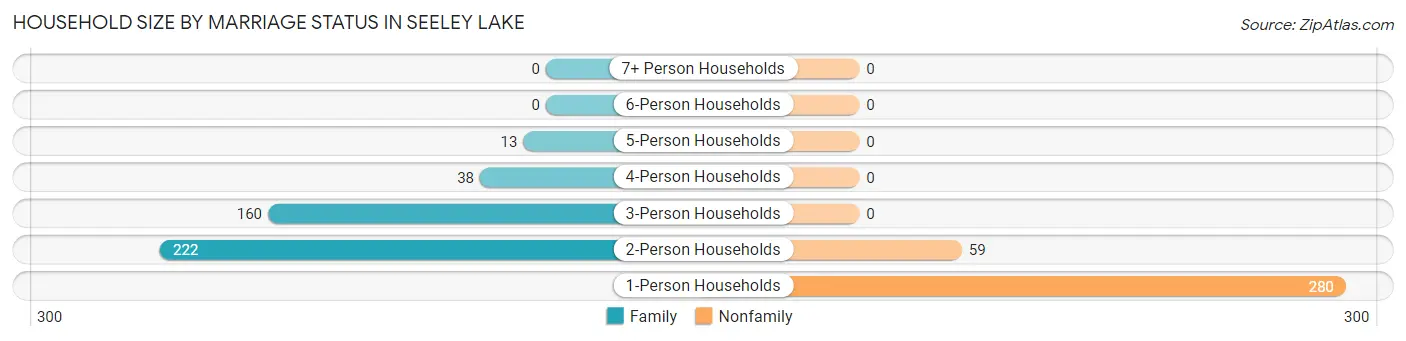
| Household Size | Family Households | Nonfamily Households |
| 1-Person Households | - | 280 (36.3%) |
| 2-Person Households | 222 (28.8%) | 59 (7.6%) |
| 3-Person Households | 160 (20.7%) | 0 (0.0%) |
| 4-Person Households | 38 (4.9%) | 0 (0.0%) |
| 5-Person Households | 13 (1.7%) | 0 (0.0%) |
| 6-Person Households | 0 (0.0%) | 0 (0.0%) |
| 7+ Person Households | 0 (0.0%) | 0 (0.0%) |
| Total | 433 (56.1%) | 339 (43.9%) |
Female Fertility in Seeley Lake
Fertility by Age in Seeley Lake
Average fertility rate in Seeley Lake is 116.0 births per 1,000 women. Women in the age bracket of 20 to 34 years have the highest fertility rate with 200.0 births per 1,000 women. Women in the age bracket of 20 to 34 years acount for 100.0% of all women with births.
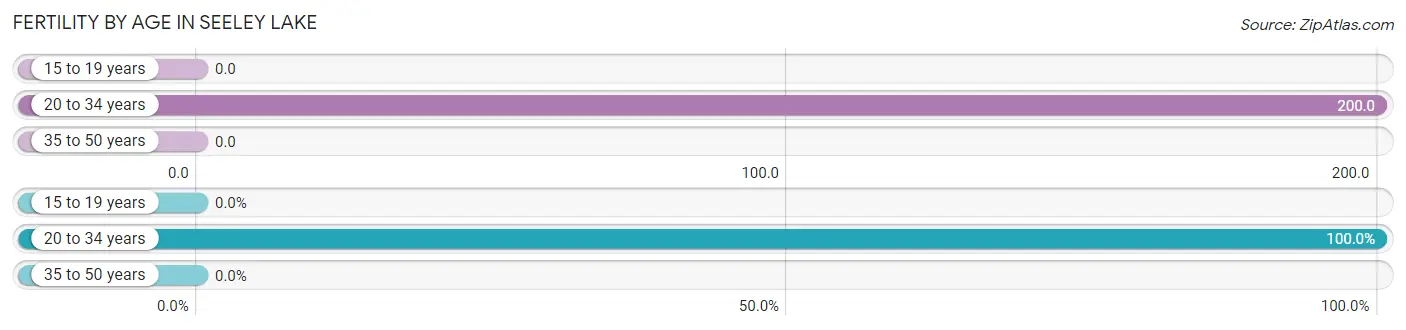
| Age Bracket | Women with Births | Births / 1,000 Women |
| 15 to 19 years | 0 (0.0%) | 0.0 |
| 20 to 34 years | 34 (100.0%) | 200.0 |
| 35 to 50 years | 0 (0.0%) | 0.0 |
| Total | 34 (100.0%) | 116.0 |
Fertility by Age by Marriage Status in Seeley Lake
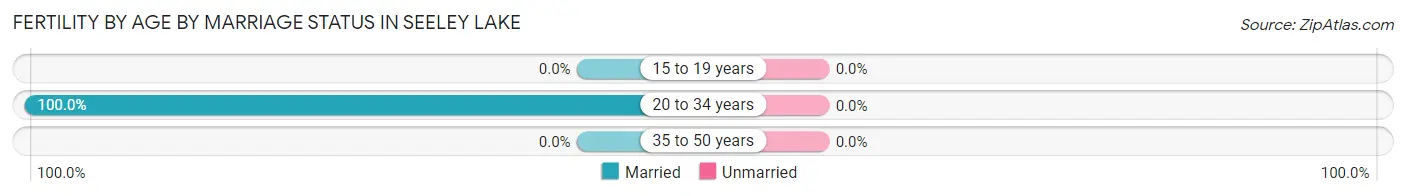
| Age Bracket | Married | Unmarried |
| 15 to 19 years | 0 (0.0%) | 0 (0.0%) |
| 20 to 34 years | 34 (100.0%) | 0 (0.0%) |
| 35 to 50 years | 0 (0.0%) | 0 (0.0%) |
| Total | 34 (100.0%) | 0 (0.0%) |
Fertility by Education in Seeley Lake
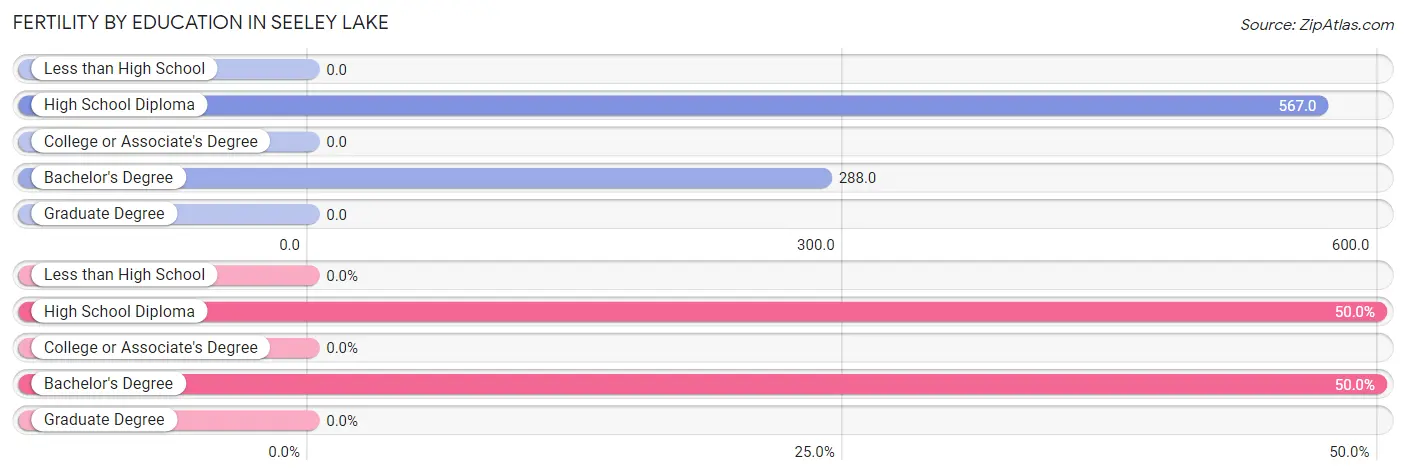
| Educational Attainment | Women with Births | Births / 1,000 Women |
| Less than High School | 0 (0.0%) | 0.0 |
| High School Diploma | 17 (50.0%) | 567.0 |
| College or Associate's Degree | 0 (0.0%) | 0.0 |
| Bachelor's Degree | 17 (50.0%) | 288.0 |
| Graduate Degree | 0 (0.0%) | 0.0 |
| Total | 34 (100.0%) | 116.0 |
Fertility by Education by Marriage Status in Seeley Lake
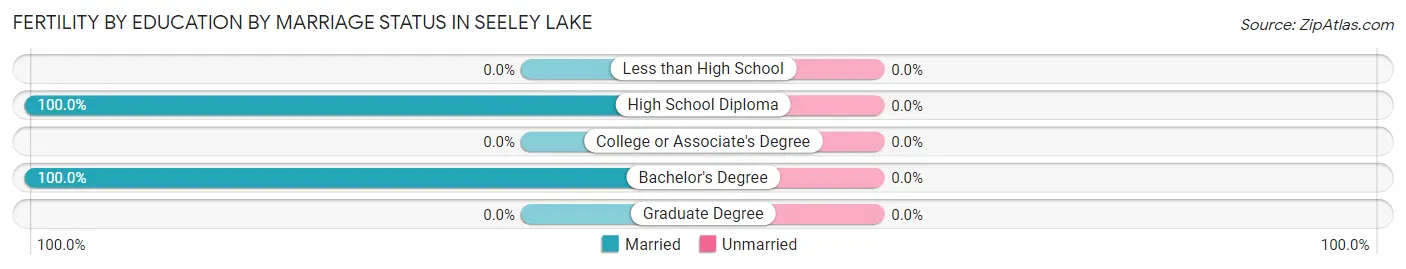
| Educational Attainment | Married | Unmarried |
| Less than High School | 0 (0.0%) | 0 (0.0%) |
| High School Diploma | 17 (100.0%) | 0 (0.0%) |
| College or Associate's Degree | 0 (0.0%) | 0 (0.0%) |
| Bachelor's Degree | 17 (100.0%) | 0 (0.0%) |
| Graduate Degree | 0 (0.0%) | 0 (0.0%) |
| Total | 34 (100.0%) | 0 (0.0%) |
Employment Characteristics in Seeley Lake
Employment by Class of Employer in Seeley Lake
Among the 503 employed individuals in Seeley Lake, private company employees (372 | 74.0%), self-employed (incorporated) (84 | 16.7%), and self-employed (not incorporated) (37 | 7.4%) make up the most common classes of employment.
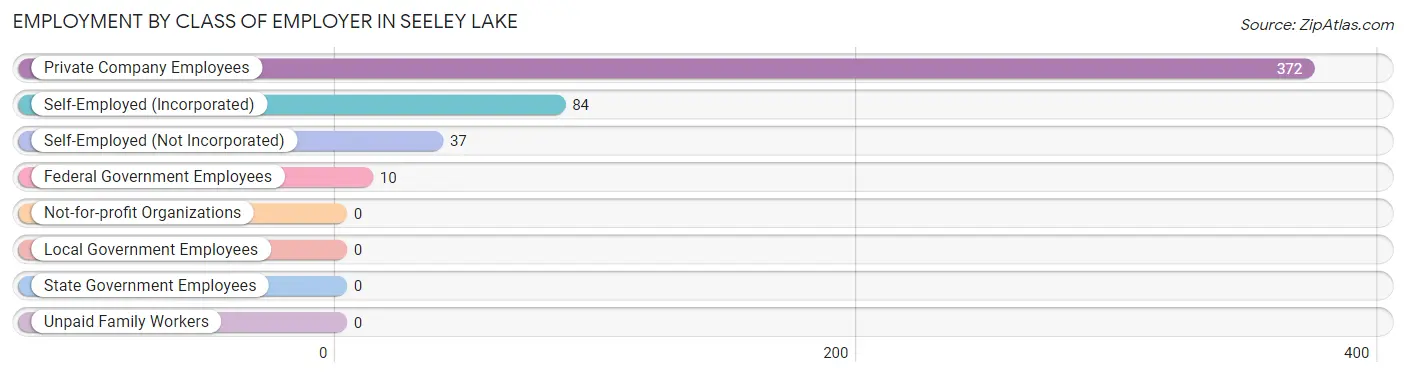
| Employer Class | # Employees | % Employees |
| Private Company Employees | 372 | 74.0% |
| Self-Employed (Incorporated) | 84 | 16.7% |
| Self-Employed (Not Incorporated) | 37 | 7.4% |
| Not-for-profit Organizations | 0 | 0.0% |
| Local Government Employees | 0 | 0.0% |
| State Government Employees | 0 | 0.0% |
| Federal Government Employees | 10 | 2.0% |
| Unpaid Family Workers | 0 | 0.0% |
| Total | 503 | 100.0% |
Employment Status by Age in Seeley Lake
According to the labor force statistics for Seeley Lake, out of the total population over 16 years of age (1,447), 41.1% or 595 individuals are in the labor force, with 6.1% or 36 of them unemployed. The age group with the highest labor force participation rate is 35 to 44 years, with 100.0% or 102 individuals in the labor force. Within the labor force, the 25 to 29 years age range has the highest percentage of unemployed individuals, with 100.0% or 18 of them being unemployed.
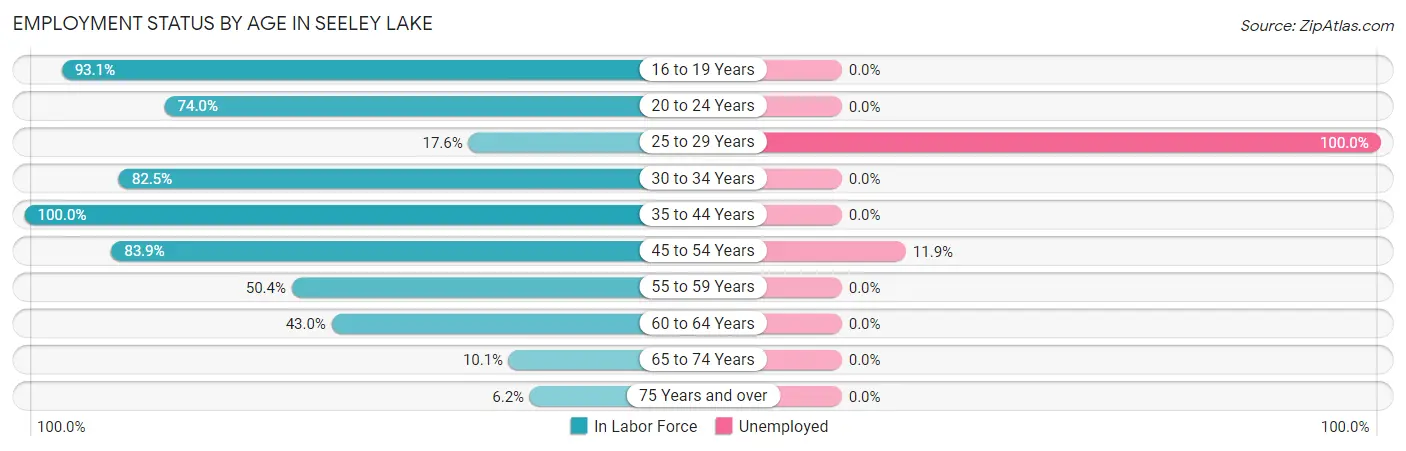
| Age Bracket | In Labor Force | Unemployed |
| 16 to 19 Years | 27 (93.1%) | 0 (0.0%) |
| 20 to 24 Years | 57 (74.0%) | 0 (0.0%) |
| 25 to 29 Years | 18 (17.6%) | 18 (100.0%) |
| 30 to 34 Years | 66 (82.5%) | 0 (0.0%) |
| 35 to 44 Years | 102 (100.0%) | 0 (0.0%) |
| 45 to 54 Years | 151 (83.9%) | 18 (11.9%) |
| 55 to 59 Years | 60 (50.4%) | 0 (0.0%) |
| 60 to 64 Years | 61 (43.0%) | 0 (0.0%) |
| 65 to 74 Years | 36 (10.1%) | 0 (0.0%) |
| 75 Years and over | 16 (6.2%) | 0 (0.0%) |
| Total | 595 (41.1%) | 36 (6.1%) |
Employment Status by Educational Attainment in Seeley Lake
According to labor force statistics for Seeley Lake, 63.2% of individuals (458) out of the total population between 25 and 64 years of age (725) are in the labor force, with 7.9% or 36 of them being unemployed. The group with the highest labor force participation rate are those with the educational attainment of less than high school, with 100.0% or 17 individuals in the labor force. Within the labor force, individuals with high school diploma education have the highest percentage of unemployment, with 15.1% or 18 of them being unemployed.
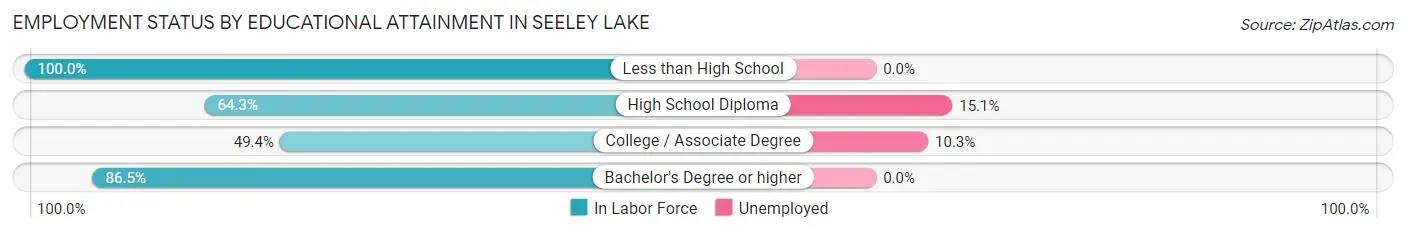
| Educational Attainment | In Labor Force | Unemployed |
| Less than High School | 17 (100.0%) | 0 (0.0%) |
| High School Diploma | 119 (64.3%) | 28 (15.1%) |
| College / Associate Degree | 174 (49.4%) | 36 (10.3%) |
| Bachelor's Degree or higher | 148 (86.5%) | 0 (0.0%) |
| Total | 458 (63.2%) | 57 (7.9%) |
Employment Occupations by Sex in Seeley Lake
Management, Business, Science and Arts Occupations
The most common Management, Business, Science and Arts occupations in Seeley Lake are Management (143 | 25.6%), Community & Social Service (29 | 5.2%), and Arts, Media & Entertainment (29 | 5.2%).
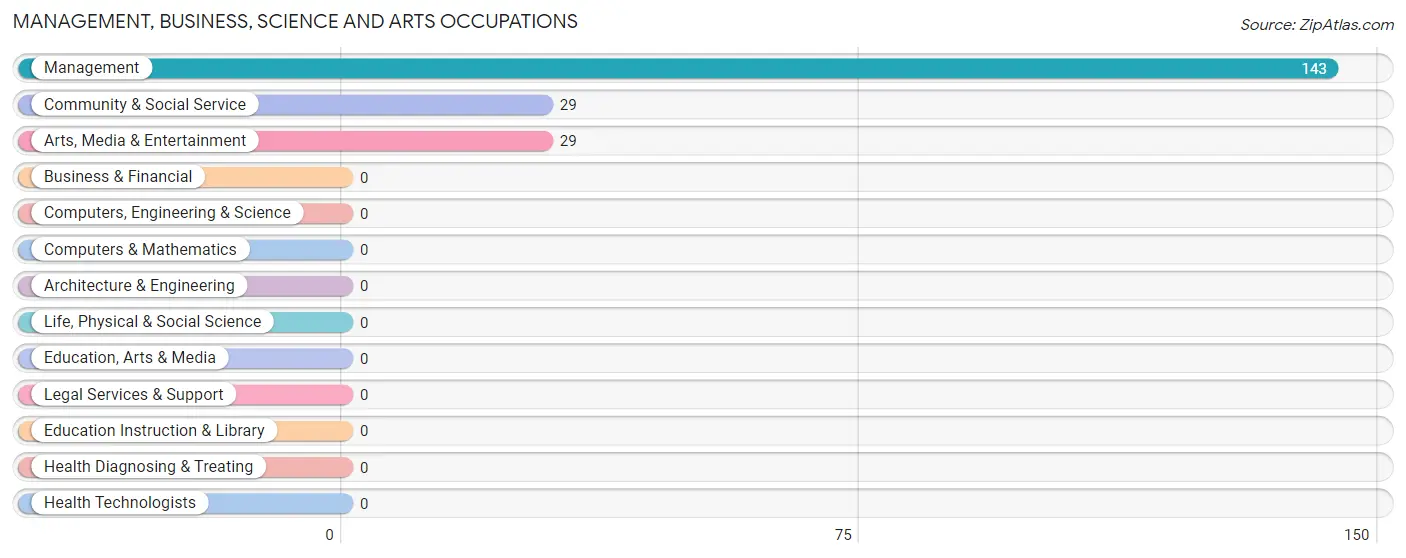
Management, Business, Science and Arts Occupations by Sex
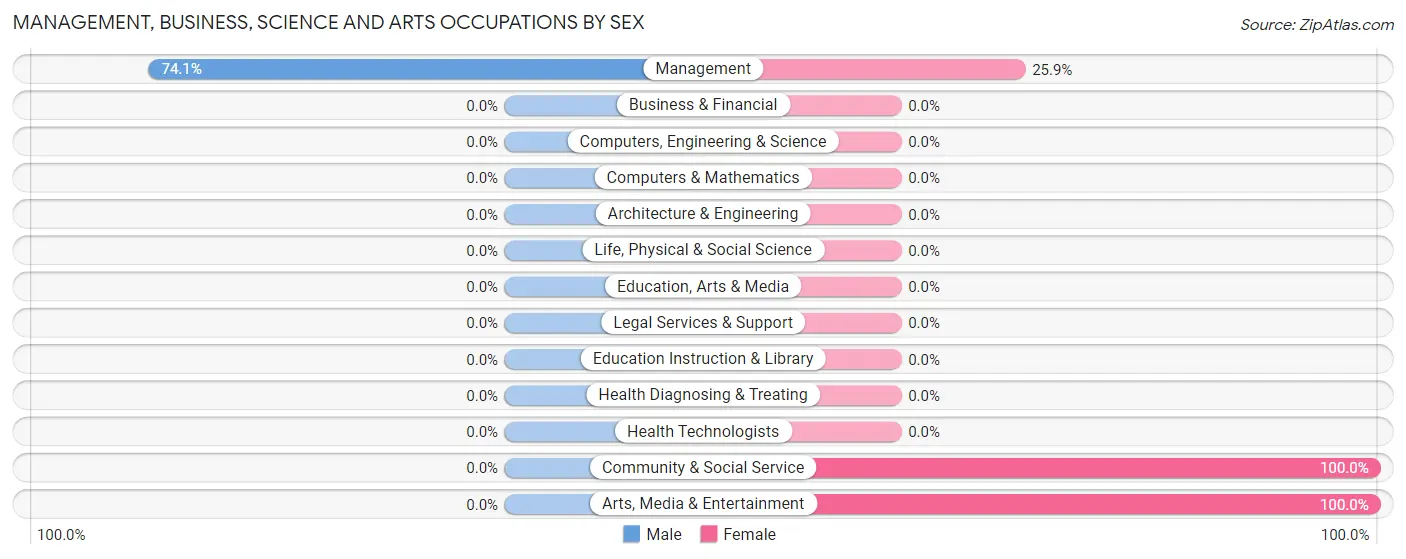
| Occupation | Male | Female |
| Management | 106 (74.1%) | 37 (25.9%) |
| Business & Financial | 0 (0.0%) | 0 (0.0%) |
| Computers, Engineering & Science | 0 (0.0%) | 0 (0.0%) |
| Computers & Mathematics | 0 (0.0%) | 0 (0.0%) |
| Architecture & Engineering | 0 (0.0%) | 0 (0.0%) |
| Life, Physical & Social Science | 0 (0.0%) | 0 (0.0%) |
| Community & Social Service | 0 (0.0%) | 29 (100.0%) |
| Education, Arts & Media | 0 (0.0%) | 0 (0.0%) |
| Legal Services & Support | 0 (0.0%) | 0 (0.0%) |
| Education Instruction & Library | 0 (0.0%) | 0 (0.0%) |
| Arts, Media & Entertainment | 0 (0.0%) | 29 (100.0%) |
| Health Diagnosing & Treating | 0 (0.0%) | 0 (0.0%) |
| Health Technologists | 0 (0.0%) | 0 (0.0%) |
| Total (Category) | 106 (61.6%) | 66 (38.4%) |
| Total (Overall) | 399 (71.5%) | 159 (28.5%) |
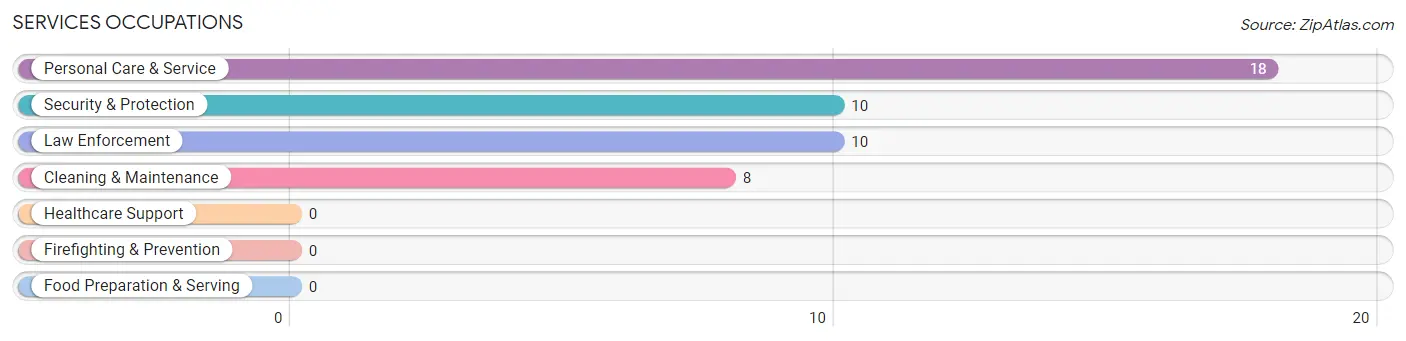
Services Occupations
The most common Services occupations in Seeley Lake are Personal Care & Service (18 | 3.2%), Security & Protection (10 | 1.8%), Law Enforcement (10 | 1.8%), and Cleaning & Maintenance (8 | 1.4%).
Services Occupations by Sex
Within the Services occupations in Seeley Lake, the most male-oriented occupations are Security & Protection (100.0%), and Law Enforcement (100.0%), while the most female-oriented occupations are Cleaning & Maintenance (100.0%), and Personal Care & Service (100.0%).
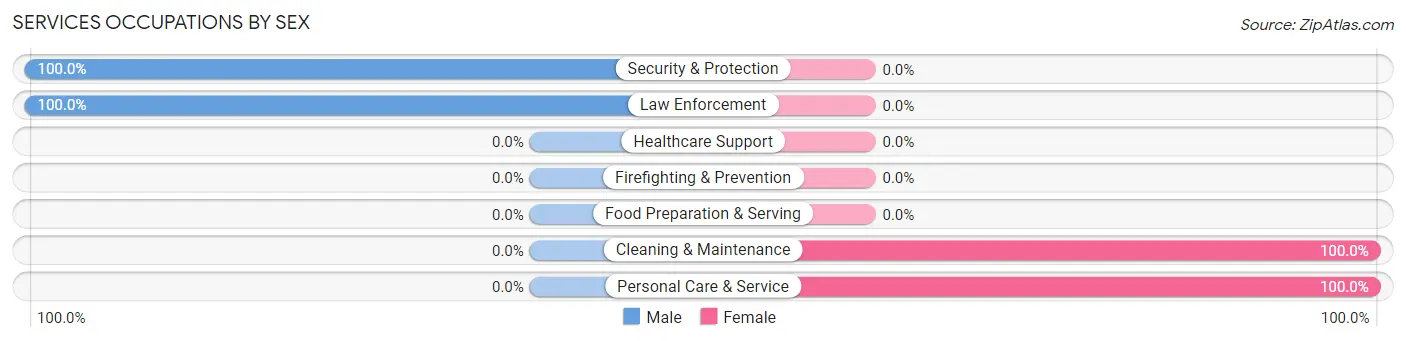
| Occupation | Male | Female |
| Healthcare Support | 0 (0.0%) | 0 (0.0%) |
| Security & Protection | 10 (100.0%) | 0 (0.0%) |
| Firefighting & Prevention | 0 (0.0%) | 0 (0.0%) |
| Law Enforcement | 10 (100.0%) | 0 (0.0%) |
| Food Preparation & Serving | 0 (0.0%) | 0 (0.0%) |
| Cleaning & Maintenance | 0 (0.0%) | 8 (100.0%) |
| Personal Care & Service | 0 (0.0%) | 18 (100.0%) |
| Total (Category) | 10 (27.8%) | 26 (72.2%) |
| Total (Overall) | 399 (71.5%) | 159 (28.5%) |
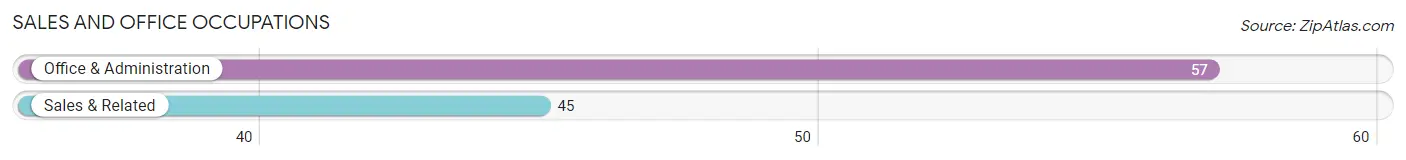
Sales and Office Occupations
The most common Sales and Office occupations in Seeley Lake are Office & Administration (57 | 10.2%), and Sales & Related (45 | 8.1%).
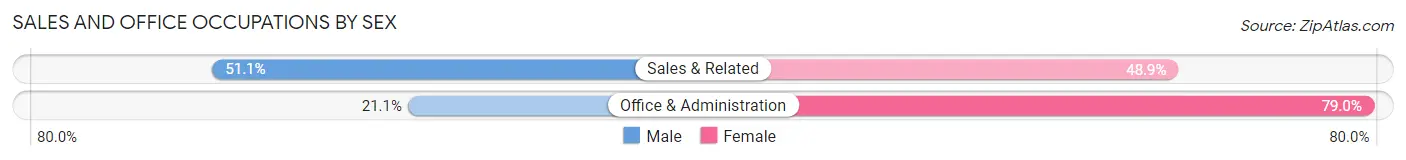
Sales and Office Occupations by Sex
| Occupation | Male | Female |
| Sales & Related | 23 (51.1%) | 22 (48.9%) |
| Office & Administration | 12 (21.0%) | 45 (78.9%) |
| Total (Category) | 35 (34.3%) | 67 (65.7%) |
| Total (Overall) | 399 (71.5%) | 159 (28.5%) |
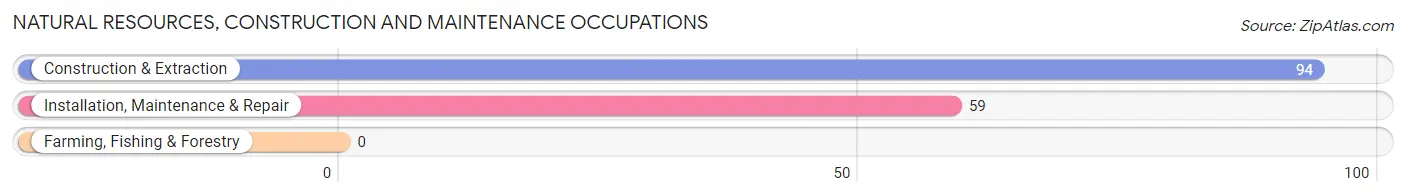
Natural Resources, Construction and Maintenance Occupations
The most common Natural Resources, Construction and Maintenance occupations in Seeley Lake are Construction & Extraction (94 | 16.9%), and Installation, Maintenance & Repair (59 | 10.6%).
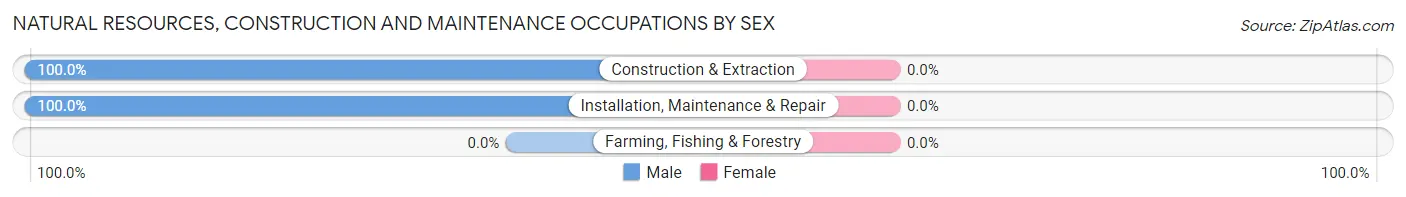
Natural Resources, Construction and Maintenance Occupations by Sex
| Occupation | Male | Female |
| Farming, Fishing & Forestry | 0 (0.0%) | 0 (0.0%) |
| Construction & Extraction | 94 (100.0%) | 0 (0.0%) |
| Installation, Maintenance & Repair | 59 (100.0%) | 0 (0.0%) |
| Total (Category) | 153 (100.0%) | 0 (0.0%) |
| Total (Overall) | 399 (71.5%) | 159 (28.5%) |
Production, Transportation and Moving Occupations
The most common Production, Transportation and Moving occupations in Seeley Lake are Material Moving (42 | 7.5%), Transportation (35 | 6.3%), and Production (18 | 3.2%).
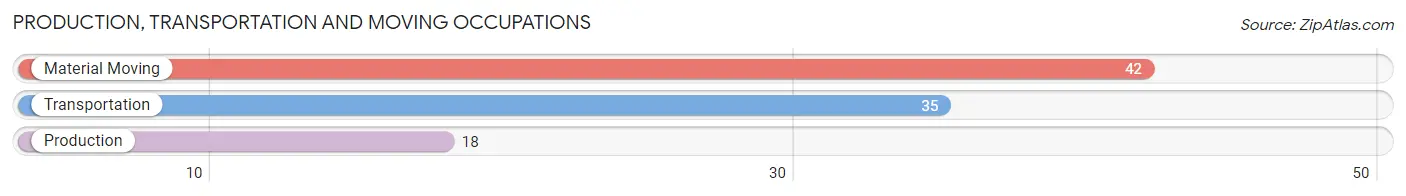
Production, Transportation and Moving Occupations by Sex
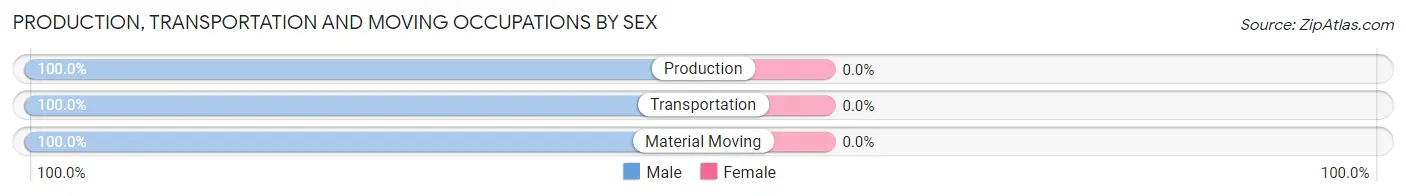
| Occupation | Male | Female |
| Production | 18 (100.0%) | 0 (0.0%) |
| Transportation | 35 (100.0%) | 0 (0.0%) |
| Material Moving | 42 (100.0%) | 0 (0.0%) |
| Total (Category) | 95 (100.0%) | 0 (0.0%) |
| Total (Overall) | 399 (71.5%) | 159 (28.5%) |
Employment Industries by Sex in Seeley Lake
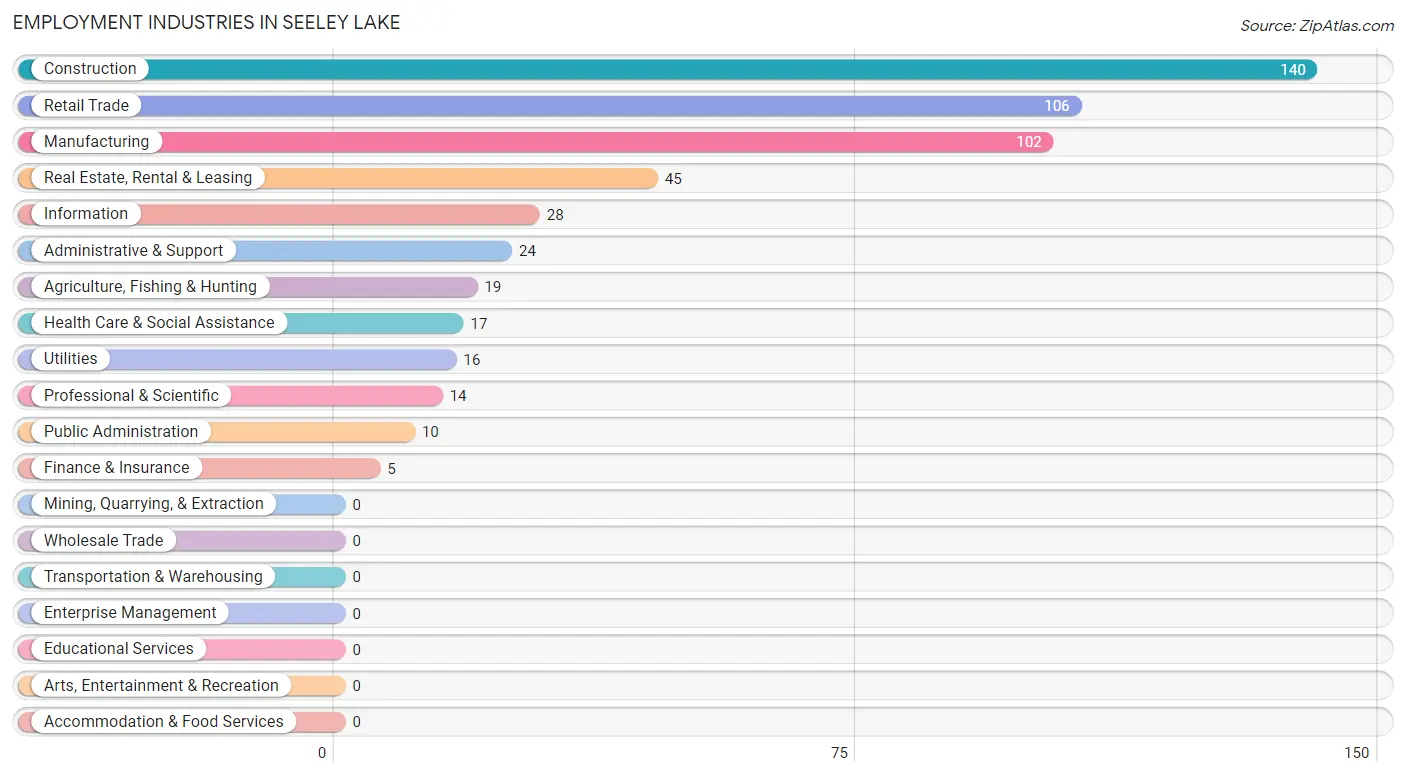
Employment Industries in Seeley Lake
The major employment industries in Seeley Lake include Construction (140 | 25.1%), Retail Trade (106 | 19.0%), Manufacturing (102 | 18.3%), Real Estate, Rental & Leasing (45 | 8.1%), and Information (28 | 5.0%).
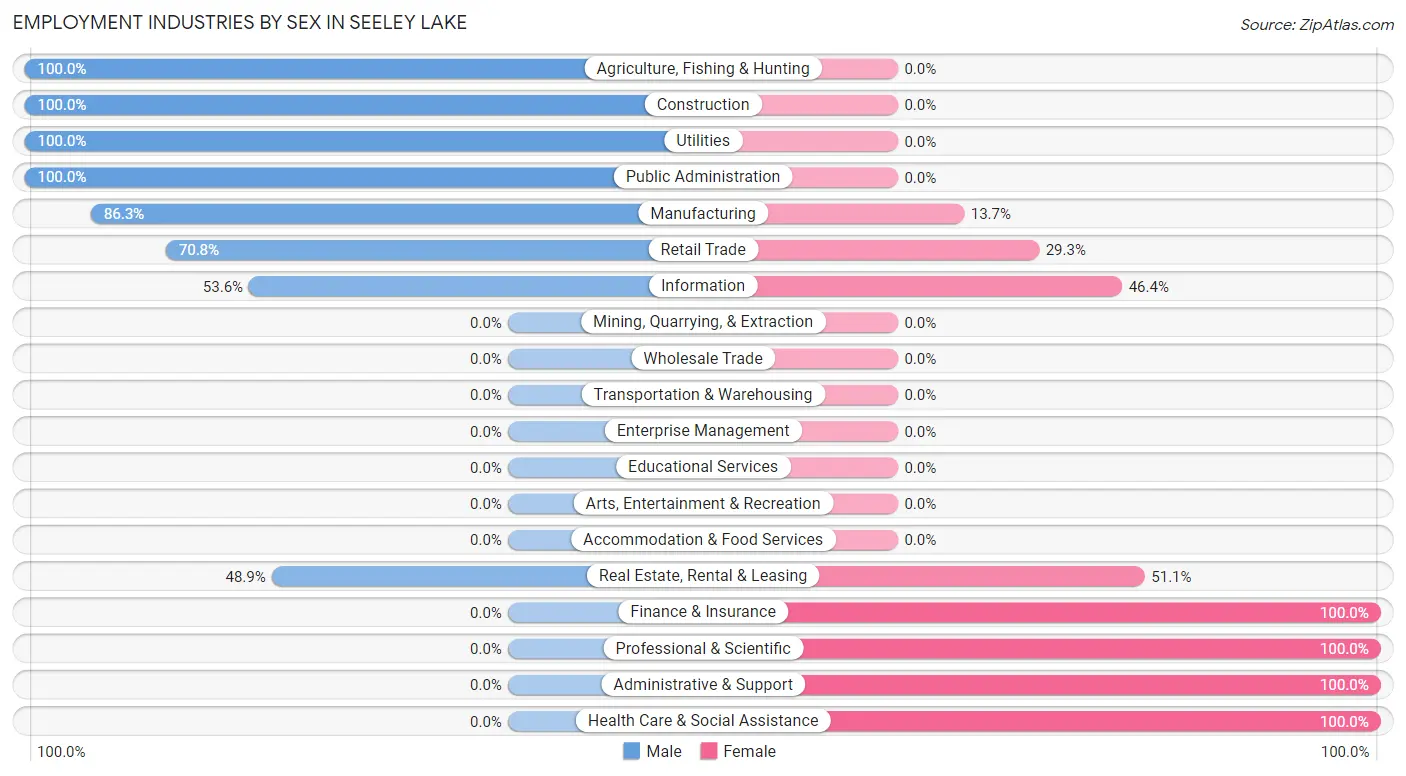
Employment Industries by Sex in Seeley Lake
The Seeley Lake industries that see more men than women are Agriculture, Fishing & Hunting (100.0%), Construction (100.0%), and Utilities (100.0%), whereas the industries that tend to have a higher number of women are Finance & Insurance (100.0%), Professional & Scientific (100.0%), and Administrative & Support (100.0%).
| Industry | Male | Female |
| Agriculture, Fishing & Hunting | 19 (100.0%) | 0 (0.0%) |
| Mining, Quarrying, & Extraction | 0 (0.0%) | 0 (0.0%) |
| Construction | 140 (100.0%) | 0 (0.0%) |
| Manufacturing | 88 (86.3%) | 14 (13.7%) |
| Wholesale Trade | 0 (0.0%) | 0 (0.0%) |
| Retail Trade | 75 (70.8%) | 31 (29.2%) |
| Transportation & Warehousing | 0 (0.0%) | 0 (0.0%) |
| Utilities | 16 (100.0%) | 0 (0.0%) |
| Information | 15 (53.6%) | 13 (46.4%) |
| Finance & Insurance | 0 (0.0%) | 5 (100.0%) |
| Real Estate, Rental & Leasing | 22 (48.9%) | 23 (51.1%) |
| Professional & Scientific | 0 (0.0%) | 14 (100.0%) |
| Enterprise Management | 0 (0.0%) | 0 (0.0%) |
| Administrative & Support | 0 (0.0%) | 24 (100.0%) |
| Educational Services | 0 (0.0%) | 0 (0.0%) |
| Health Care & Social Assistance | 0 (0.0%) | 17 (100.0%) |
| Arts, Entertainment & Recreation | 0 (0.0%) | 0 (0.0%) |
| Accommodation & Food Services | 0 (0.0%) | 0 (0.0%) |
| Public Administration | 10 (100.0%) | 0 (0.0%) |
| Total | 399 (71.5%) | 159 (28.5%) |
Education in Seeley Lake
School Enrollment in Seeley Lake
The most common levels of schooling among the 202 students in Seeley Lake are college / undergraduate (47 | 23.3%), high school (46 | 22.8%), and middle school (40 | 19.8%).
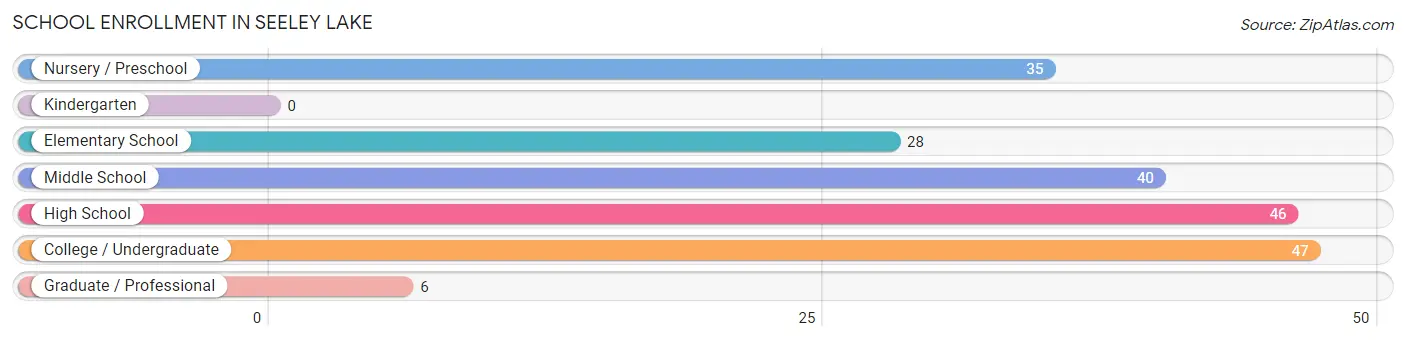
| School Level | # Students | % Students |
| Nursery / Preschool | 35 | 17.3% |
| Kindergarten | 0 | 0.0% |
| Elementary School | 28 | 13.9% |
| Middle School | 40 | 19.8% |
| High School | 46 | 22.8% |
| College / Undergraduate | 47 | 23.3% |
| Graduate / Professional | 6 | 3.0% |
| Total | 202 | 100.0% |
School Enrollment by Age by Funding Source in Seeley Lake
Out of a total of 202 students who are enrolled in schools in Seeley Lake, 33 (16.3%) attend a private institution, while the remaining 169 (83.7%) are enrolled in public schools. The age group of 25 to 34 year olds has the highest likelihood of being enrolled in private schools, with 13 (100.0% in the age bracket) enrolled. Conversely, the age group of 3 to 4 year olds has the lowest likelihood of being enrolled in a private school, with 35 (100.0% in the age bracket) attending a public institution.
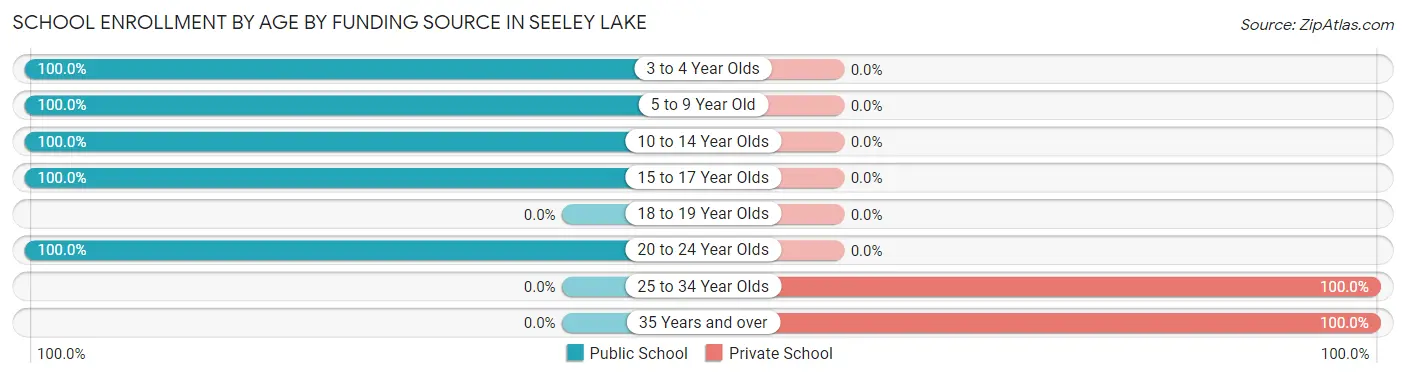
| Age Bracket | Public School | Private School |
| 3 to 4 Year Olds | 35 (100.0%) | 0 (0.0%) |
| 5 to 9 Year Old | 28 (100.0%) | 0 (0.0%) |
| 10 to 14 Year Olds | 17 (100.0%) | 0 (0.0%) |
| 15 to 17 Year Olds | 69 (100.0%) | 0 (0.0%) |
| 18 to 19 Year Olds | 0 (0.0%) | 0 (0.0%) |
| 20 to 24 Year Olds | 20 (100.0%) | 0 (0.0%) |
| 25 to 34 Year Olds | 0 (0.0%) | 13 (100.0%) |
| 35 Years and over | 0 (0.0%) | 20 (100.0%) |
| Total | 169 (83.7%) | 33 (16.3%) |
Educational Attainment by Field of Study in Seeley Lake
Business (72 | 21.2%), education (47 | 13.9%), bio, nature & agricultural (45 | 13.3%), engineering (41 | 12.1%), and literature & languages (33 | 9.7%) are the most common fields of study among 339 individuals in Seeley Lake who have obtained a bachelor's degree or higher.
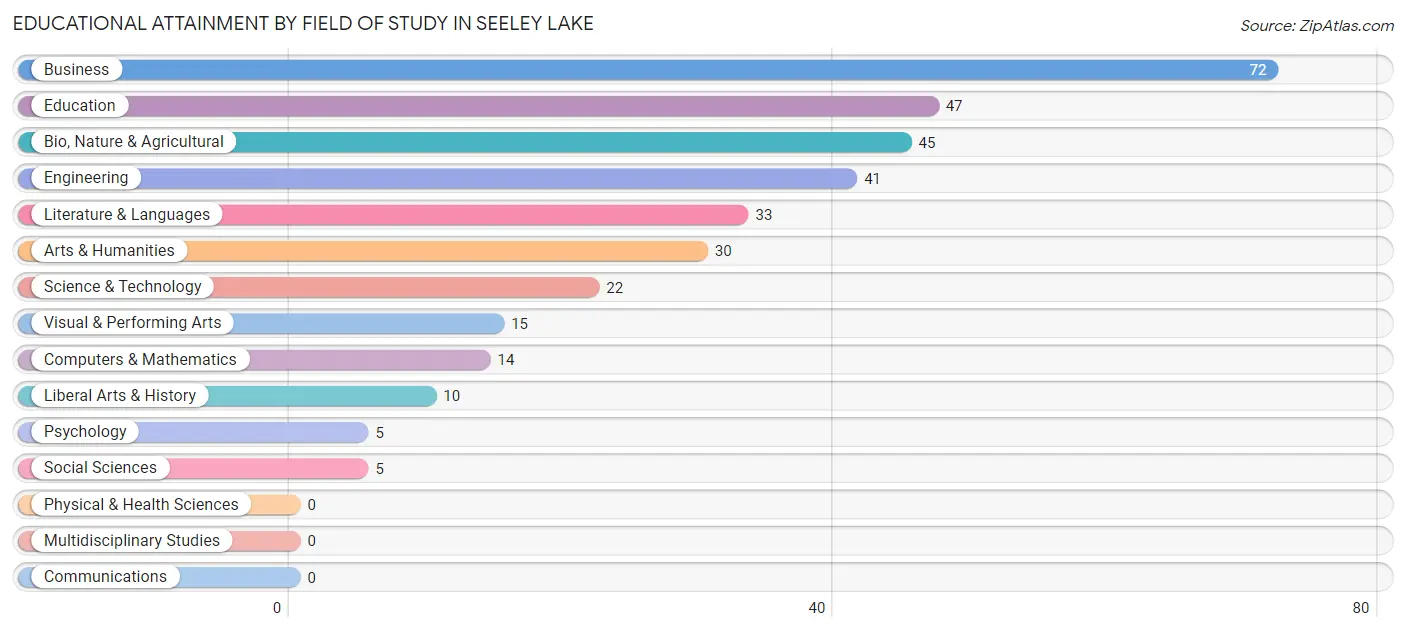
| Field of Study | # Graduates | % Graduates |
| Computers & Mathematics | 14 | 4.1% |
| Bio, Nature & Agricultural | 45 | 13.3% |
| Physical & Health Sciences | 0 | 0.0% |
| Psychology | 5 | 1.5% |
| Social Sciences | 5 | 1.5% |
| Engineering | 41 | 12.1% |
| Multidisciplinary Studies | 0 | 0.0% |
| Science & Technology | 22 | 6.5% |
| Business | 72 | 21.2% |
| Education | 47 | 13.9% |
| Literature & Languages | 33 | 9.7% |
| Liberal Arts & History | 10 | 2.9% |
| Visual & Performing Arts | 15 | 4.4% |
| Communications | 0 | 0.0% |
| Arts & Humanities | 30 | 8.8% |
| Total | 339 | 100.0% |
Transportation & Commute in Seeley Lake
Vehicle Availability by Sex in Seeley Lake
The most prevalent vehicle ownership categories in Seeley Lake are males with 2 vehicles (130, accounting for 36.1%) and females with 2 vehicles (45, making up 90.9%).
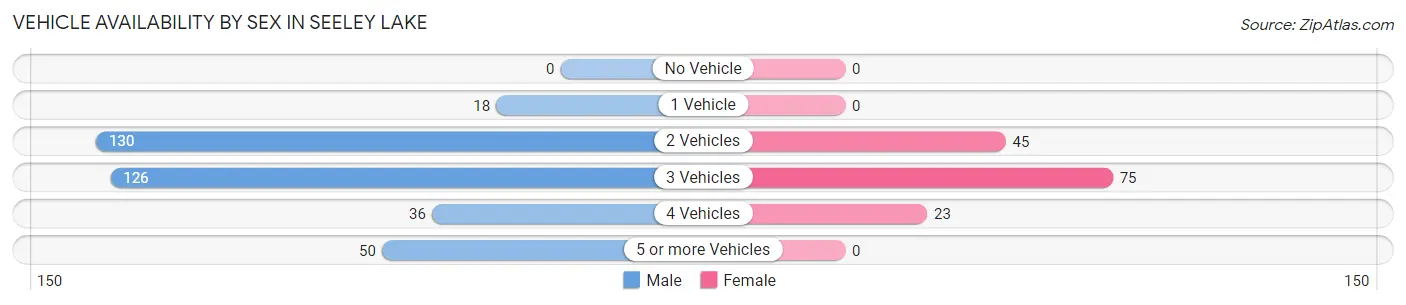
| Vehicles Available | Male | Female |
| No Vehicle | 0 (0.0%) | 0 (0.0%) |
| 1 Vehicle | 18 (5.0%) | 0 (0.0%) |
| 2 Vehicles | 130 (36.1%) | 45 (31.5%) |
| 3 Vehicles | 126 (35.0%) | 75 (52.4%) |
| 4 Vehicles | 36 (10.0%) | 23 (16.1%) |
| 5 or more Vehicles | 50 (13.9%) | 0 (0.0%) |
| Total | 360 (100.0%) | 143 (100.0%) |
Commute Time in Seeley Lake
The most frequently occuring commute durations in Seeley Lake are 5 to 9 minutes (140 commuters, 35.3%), 10 to 14 minutes (99 commuters, 25.0%), and 20 to 24 minutes (52 commuters, 13.1%).
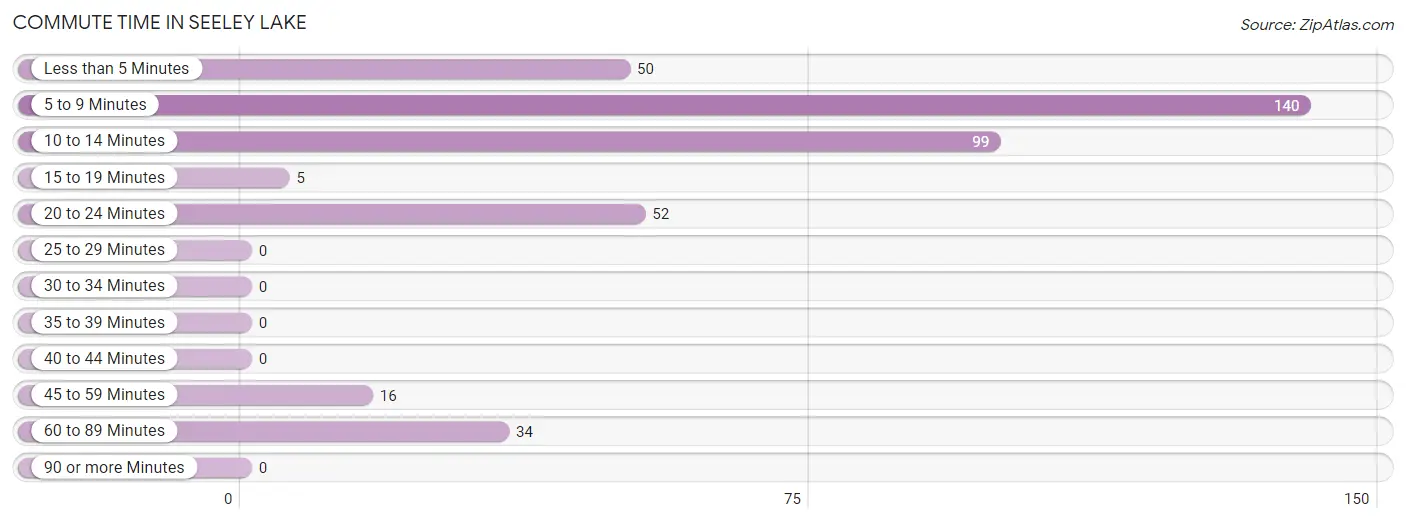
| Commute Time | # Commuters | % Commuters |
| Less than 5 Minutes | 50 | 12.6% |
| 5 to 9 Minutes | 140 | 35.3% |
| 10 to 14 Minutes | 99 | 25.0% |
| 15 to 19 Minutes | 5 | 1.3% |
| 20 to 24 Minutes | 52 | 13.1% |
| 25 to 29 Minutes | 0 | 0.0% |
| 30 to 34 Minutes | 0 | 0.0% |
| 35 to 39 Minutes | 0 | 0.0% |
| 40 to 44 Minutes | 0 | 0.0% |
| 45 to 59 Minutes | 16 | 4.0% |
| 60 to 89 Minutes | 34 | 8.6% |
| 90 or more Minutes | 0 | 0.0% |
Commute Time by Sex in Seeley Lake
The most common commute times in Seeley Lake are 10 to 14 minutes (91 commuters, 30.1%) for males and 5 to 9 minutes (58 commuters, 61.7%) for females.
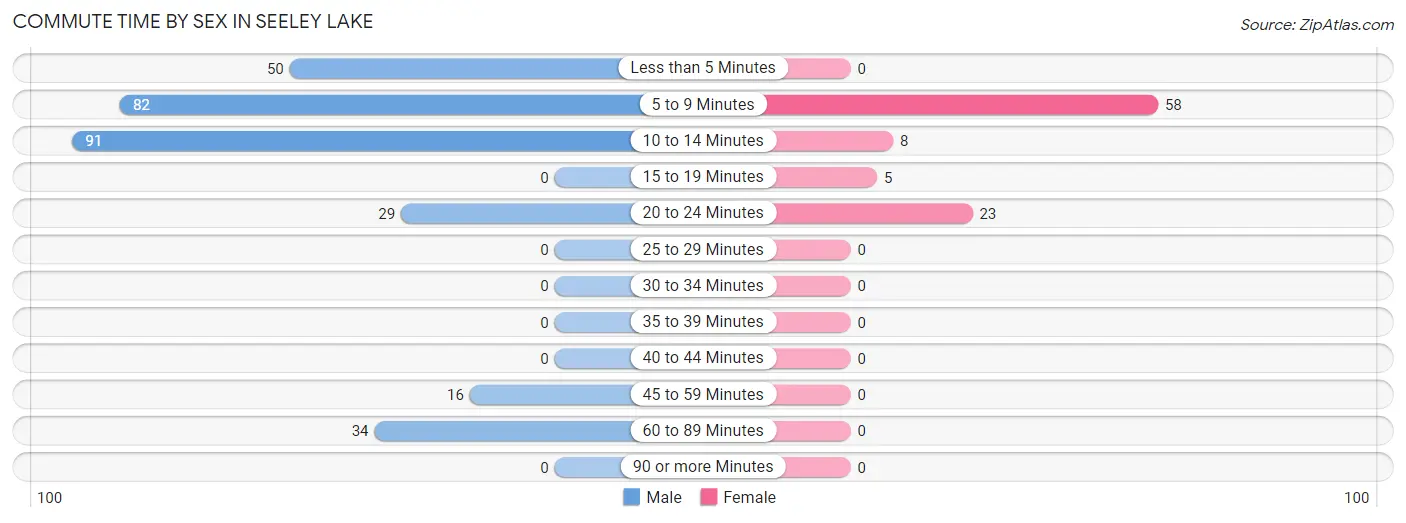
| Commute Time | Male | Female |
| Less than 5 Minutes | 50 (16.6%) | 0 (0.0%) |
| 5 to 9 Minutes | 82 (27.2%) | 58 (61.7%) |
| 10 to 14 Minutes | 91 (30.1%) | 8 (8.5%) |
| 15 to 19 Minutes | 0 (0.0%) | 5 (5.3%) |
| 20 to 24 Minutes | 29 (9.6%) | 23 (24.5%) |
| 25 to 29 Minutes | 0 (0.0%) | 0 (0.0%) |
| 30 to 34 Minutes | 0 (0.0%) | 0 (0.0%) |
| 35 to 39 Minutes | 0 (0.0%) | 0 (0.0%) |
| 40 to 44 Minutes | 0 (0.0%) | 0 (0.0%) |
| 45 to 59 Minutes | 16 (5.3%) | 0 (0.0%) |
| 60 to 89 Minutes | 34 (11.3%) | 0 (0.0%) |
| 90 or more Minutes | 0 (0.0%) | 0 (0.0%) |
Time of Departure to Work by Sex in Seeley Lake
The most frequent times of departure to work in Seeley Lake are 6:30 AM to 6:59 AM (101, 33.4%) for males and 7:00 AM to 7:29 AM (26, 27.7%) for females.
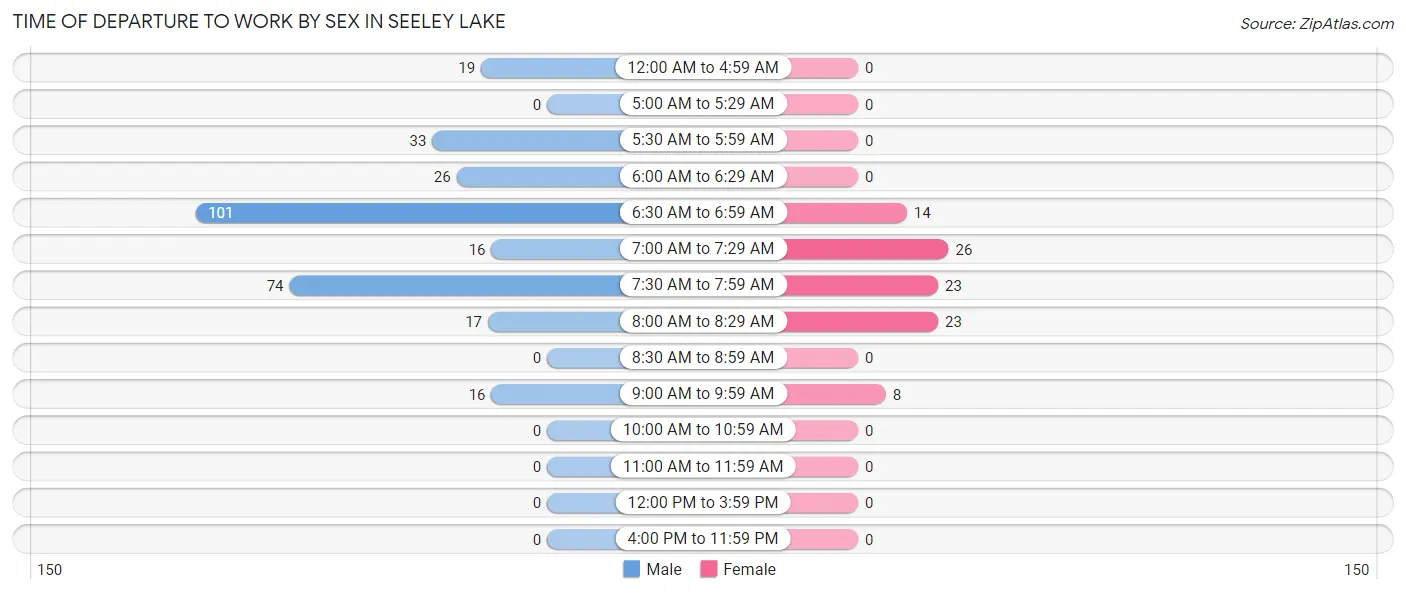
| Time of Departure | Male | Female |
| 12:00 AM to 4:59 AM | 19 (6.3%) | 0 (0.0%) |
| 5:00 AM to 5:29 AM | 0 (0.0%) | 0 (0.0%) |
| 5:30 AM to 5:59 AM | 33 (10.9%) | 0 (0.0%) |
| 6:00 AM to 6:29 AM | 26 (8.6%) | 0 (0.0%) |
| 6:30 AM to 6:59 AM | 101 (33.4%) | 14 (14.9%) |
| 7:00 AM to 7:29 AM | 16 (5.3%) | 26 (27.7%) |
| 7:30 AM to 7:59 AM | 74 (24.5%) | 23 (24.5%) |
| 8:00 AM to 8:29 AM | 17 (5.6%) | 23 (24.5%) |
| 8:30 AM to 8:59 AM | 0 (0.0%) | 0 (0.0%) |
| 9:00 AM to 9:59 AM | 16 (5.3%) | 8 (8.5%) |
| 10:00 AM to 10:59 AM | 0 (0.0%) | 0 (0.0%) |
| 11:00 AM to 11:59 AM | 0 (0.0%) | 0 (0.0%) |
| 12:00 PM to 3:59 PM | 0 (0.0%) | 0 (0.0%) |
| 4:00 PM to 11:59 PM | 0 (0.0%) | 0 (0.0%) |
| Total | 302 (100.0%) | 94 (100.0%) |
Housing Occupancy in Seeley Lake
Occupancy by Ownership in Seeley Lake
Of the total 772 dwellings in Seeley Lake, owner-occupied units account for 678 (87.8%), while renter-occupied units make up 94 (12.2%).
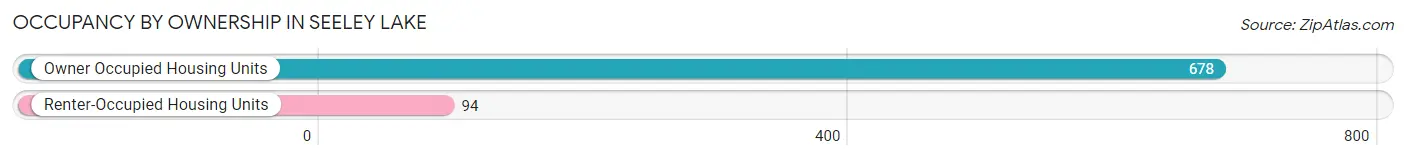
| Occupancy | # Housing Units | % Housing Units |
| Owner Occupied Housing Units | 678 | 87.8% |
| Renter-Occupied Housing Units | 94 | 12.2% |
| Total Occupied Housing Units | 772 | 100.0% |
Occupancy by Household Size in Seeley Lake
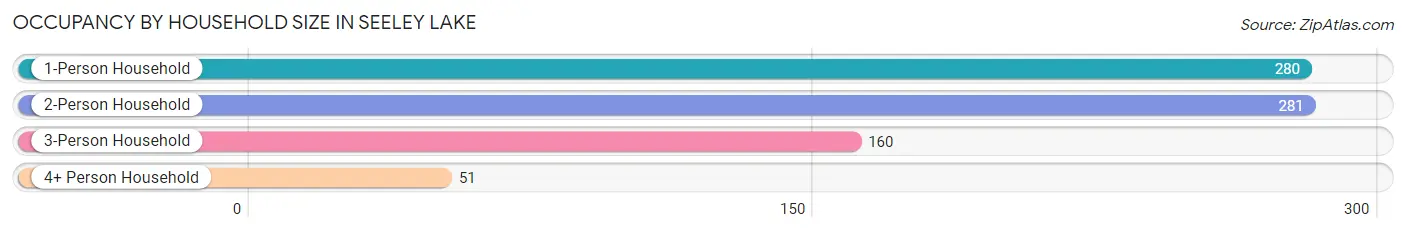
| Household Size | # Housing Units | % Housing Units |
| 1-Person Household | 280 | 36.3% |
| 2-Person Household | 281 | 36.4% |
| 3-Person Household | 160 | 20.7% |
| 4+ Person Household | 51 | 6.6% |
| Total Housing Units | 772 | 100.0% |
Occupancy by Ownership by Household Size in Seeley Lake
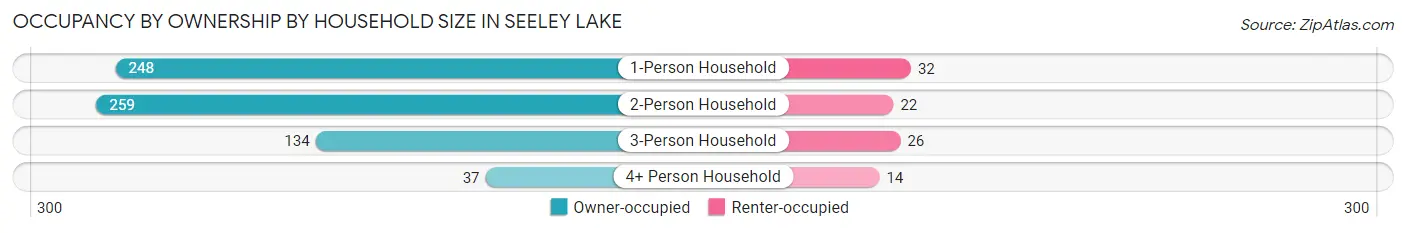
| Household Size | Owner-occupied | Renter-occupied |
| 1-Person Household | 248 (88.6%) | 32 (11.4%) |
| 2-Person Household | 259 (92.2%) | 22 (7.8%) |
| 3-Person Household | 134 (83.8%) | 26 (16.3%) |
| 4+ Person Household | 37 (72.6%) | 14 (27.5%) |
| Total Housing Units | 678 (87.8%) | 94 (12.2%) |
Occupancy by Educational Attainment in Seeley Lake
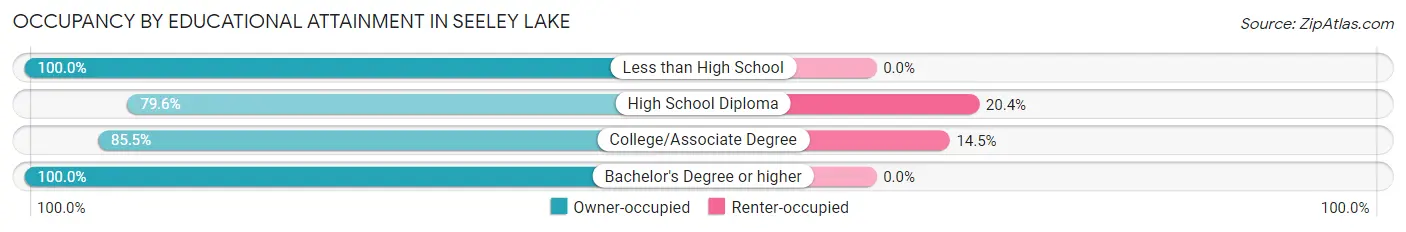
| Household Size | Owner-occupied | Renter-occupied |
| Less than High School | 16 (100.0%) | 0 (0.0%) |
| High School Diploma | 172 (79.6%) | 44 (20.4%) |
| College/Associate Degree | 294 (85.5%) | 50 (14.5%) |
| Bachelor's Degree or higher | 196 (100.0%) | 0 (0.0%) |
Occupancy by Age of Householder in Seeley Lake
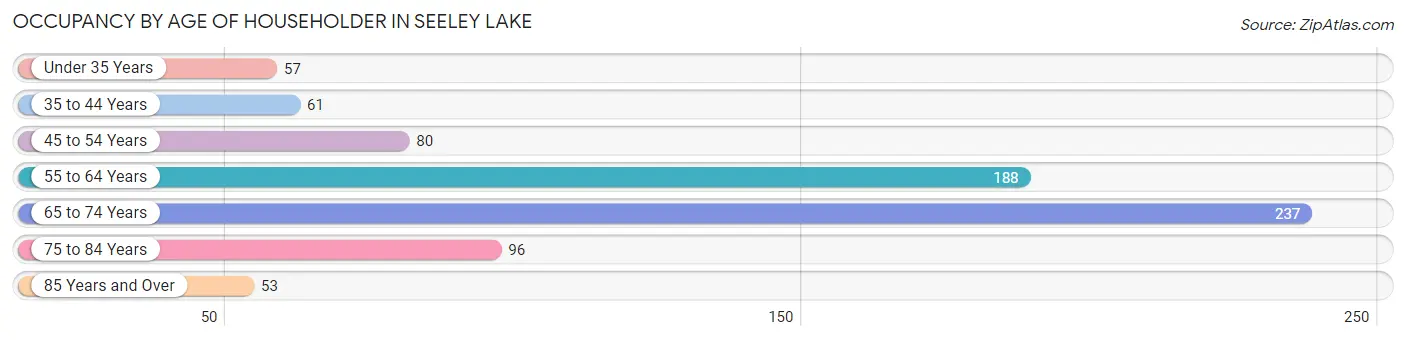
| Age Bracket | # Households | % Households |
| Under 35 Years | 57 | 7.4% |
| 35 to 44 Years | 61 | 7.9% |
| 45 to 54 Years | 80 | 10.4% |
| 55 to 64 Years | 188 | 24.3% |
| 65 to 74 Years | 237 | 30.7% |
| 75 to 84 Years | 96 | 12.4% |
| 85 Years and Over | 53 | 6.9% |
| Total | 772 | 100.0% |
Housing Finances in Seeley Lake
Median Income by Occupancy in Seeley Lake
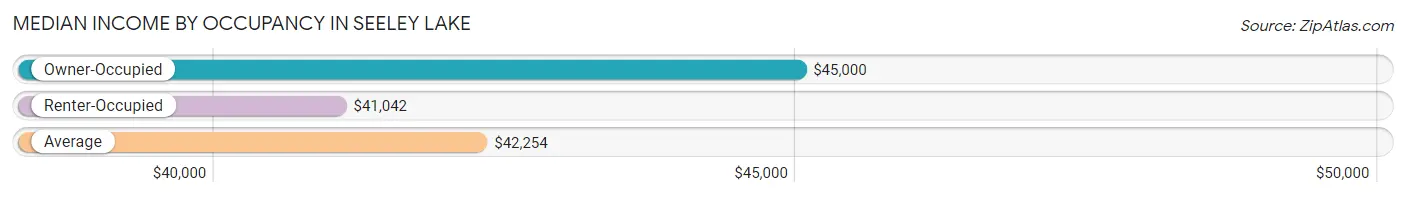
| Occupancy Type | # Households | Median Income |
| Owner-Occupied | 678 (87.8%) | $45,000 |
| Renter-Occupied | 94 (12.2%) | $41,042 |
| Average | 772 (100.0%) | $42,254 |
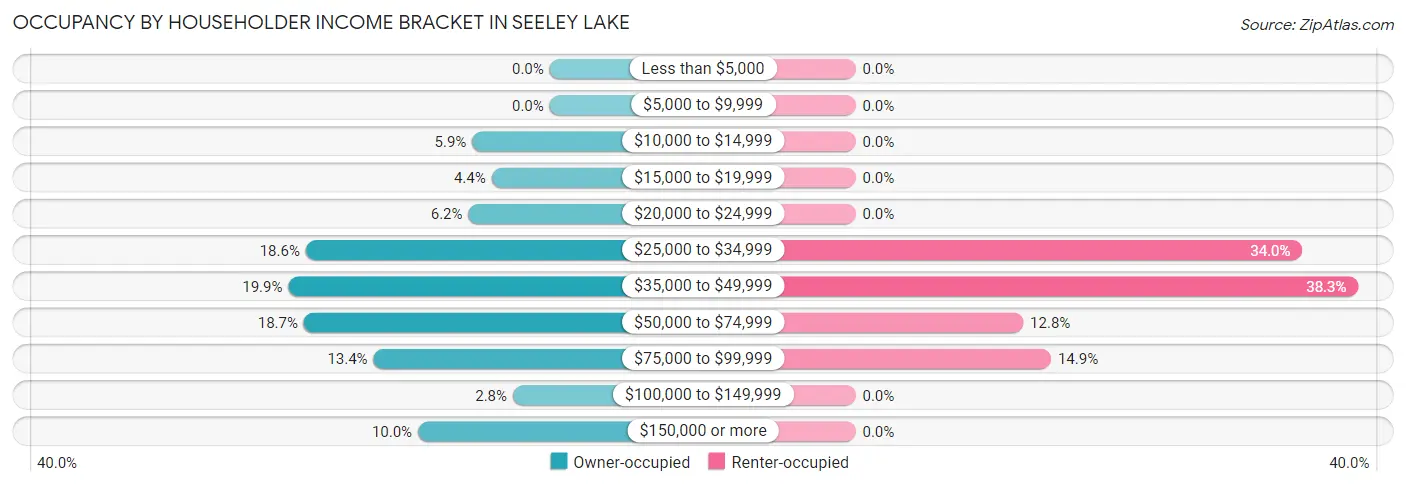
Occupancy by Householder Income Bracket in Seeley Lake
| Income Bracket | Owner-occupied | Renter-occupied |
| Less than $5,000 | 0 (0.0%) | 0 (0.0%) |
| $5,000 to $9,999 | 0 (0.0%) | 0 (0.0%) |
| $10,000 to $14,999 | 40 (5.9%) | 0 (0.0%) |
| $15,000 to $19,999 | 30 (4.4%) | 0 (0.0%) |
| $20,000 to $24,999 | 42 (6.2%) | 0 (0.0%) |
| $25,000 to $34,999 | 126 (18.6%) | 32 (34.0%) |
| $35,000 to $49,999 | 135 (19.9%) | 36 (38.3%) |
| $50,000 to $74,999 | 127 (18.7%) | 12 (12.8%) |
| $75,000 to $99,999 | 91 (13.4%) | 14 (14.9%) |
| $100,000 to $149,999 | 19 (2.8%) | 0 (0.0%) |
| $150,000 or more | 68 (10.0%) | 0 (0.0%) |
| Total | 678 (100.0%) | 94 (100.0%) |
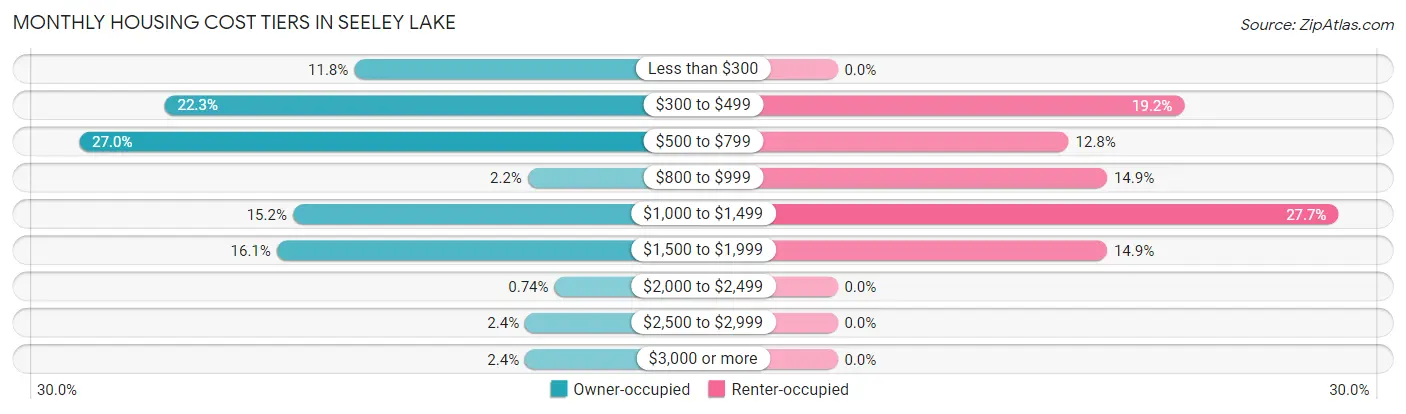
Monthly Housing Cost Tiers in Seeley Lake
| Monthly Cost | Owner-occupied | Renter-occupied |
| Less than $300 | 80 (11.8%) | 0 (0.0%) |
| $300 to $499 | 151 (22.3%) | 18 (19.2%) |
| $500 to $799 | 183 (27.0%) | 12 (12.8%) |
| $800 to $999 | 15 (2.2%) | 14 (14.9%) |
| $1,000 to $1,499 | 103 (15.2%) | 26 (27.7%) |
| $1,500 to $1,999 | 109 (16.1%) | 14 (14.9%) |
| $2,000 to $2,499 | 5 (0.7%) | 0 (0.0%) |
| $2,500 to $2,999 | 16 (2.4%) | 0 (0.0%) |
| $3,000 or more | 16 (2.4%) | 0 (0.0%) |
| Total | 678 (100.0%) | 94 (100.0%) |
Physical Housing Characteristics in Seeley Lake
Housing Structures in Seeley Lake
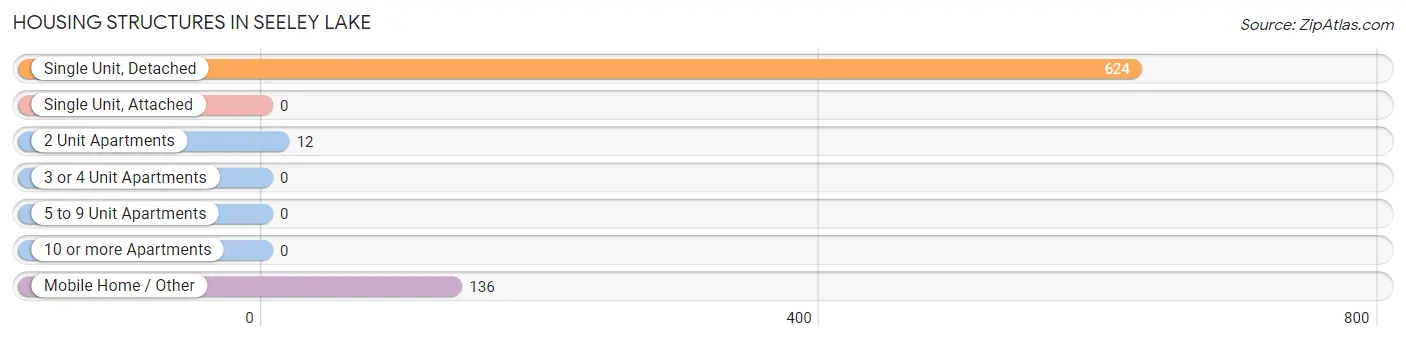
| Structure Type | # Housing Units | % Housing Units |
| Single Unit, Detached | 624 | 80.8% |
| Single Unit, Attached | 0 | 0.0% |
| 2 Unit Apartments | 12 | 1.5% |
| 3 or 4 Unit Apartments | 0 | 0.0% |
| 5 to 9 Unit Apartments | 0 | 0.0% |
| 10 or more Apartments | 0 | 0.0% |
| Mobile Home / Other | 136 | 17.6% |
| Total | 772 | 100.0% |
Housing Structures by Occupancy in Seeley Lake
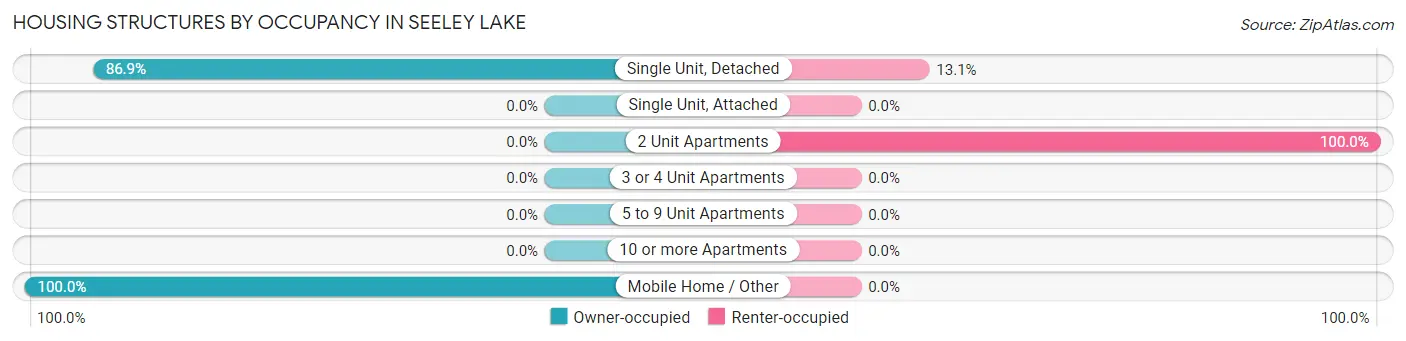
| Structure Type | Owner-occupied | Renter-occupied |
| Single Unit, Detached | 542 (86.9%) | 82 (13.1%) |
| Single Unit, Attached | 0 (0.0%) | 0 (0.0%) |
| 2 Unit Apartments | 0 (0.0%) | 12 (100.0%) |
| 3 or 4 Unit Apartments | 0 (0.0%) | 0 (0.0%) |
| 5 to 9 Unit Apartments | 0 (0.0%) | 0 (0.0%) |
| 10 or more Apartments | 0 (0.0%) | 0 (0.0%) |
| Mobile Home / Other | 136 (100.0%) | 0 (0.0%) |
| Total | 678 (87.8%) | 94 (12.2%) |
Housing Structures by Number of Rooms in Seeley Lake
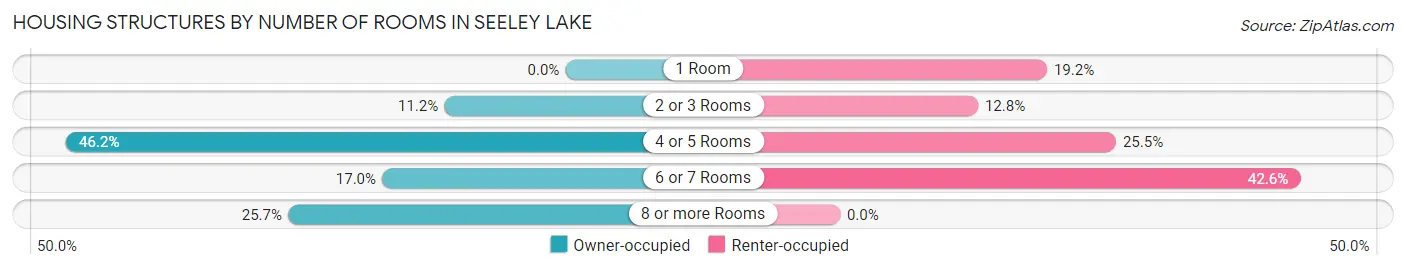
| Number of Rooms | Owner-occupied | Renter-occupied |
| 1 Room | 0 (0.0%) | 18 (19.2%) |
| 2 or 3 Rooms | 76 (11.2%) | 12 (12.8%) |
| 4 or 5 Rooms | 313 (46.2%) | 24 (25.5%) |
| 6 or 7 Rooms | 115 (17.0%) | 40 (42.5%) |
| 8 or more Rooms | 174 (25.7%) | 0 (0.0%) |
| Total | 678 (100.0%) | 94 (100.0%) |
Housing Structure by Heating Type in Seeley Lake
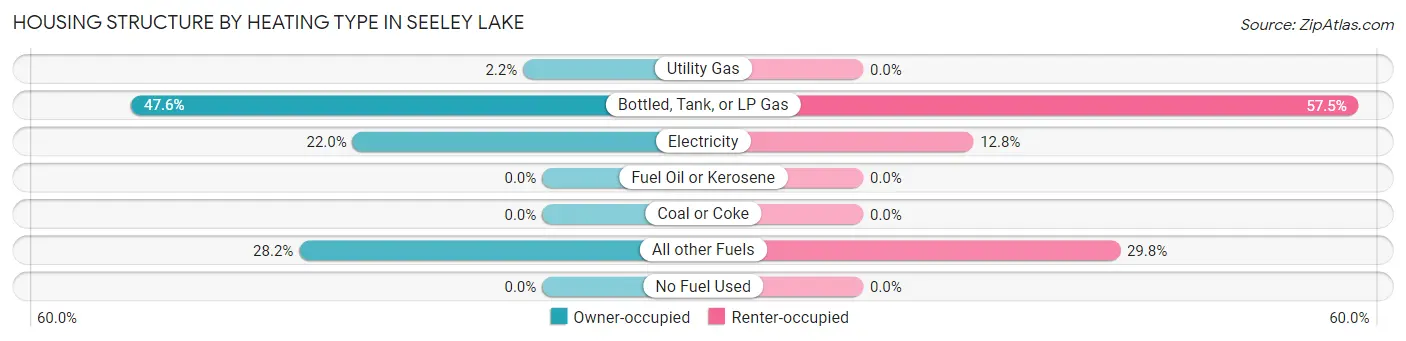
| Heating Type | Owner-occupied | Renter-occupied |
| Utility Gas | 15 (2.2%) | 0 (0.0%) |
| Bottled, Tank, or LP Gas | 323 (47.6%) | 54 (57.5%) |
| Electricity | 149 (22.0%) | 12 (12.8%) |
| Fuel Oil or Kerosene | 0 (0.0%) | 0 (0.0%) |
| Coal or Coke | 0 (0.0%) | 0 (0.0%) |
| All other Fuels | 191 (28.2%) | 28 (29.8%) |
| No Fuel Used | 0 (0.0%) | 0 (0.0%) |
| Total | 678 (100.0%) | 94 (100.0%) |
Household Vehicle Usage in Seeley Lake
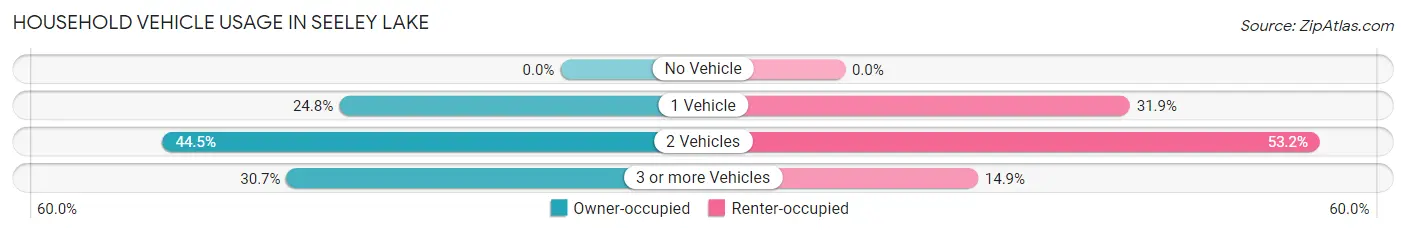
| Vehicles per Household | Owner-occupied | Renter-occupied |
| No Vehicle | 0 (0.0%) | 0 (0.0%) |
| 1 Vehicle | 168 (24.8%) | 30 (31.9%) |
| 2 Vehicles | 302 (44.5%) | 50 (53.2%) |
| 3 or more Vehicles | 208 (30.7%) | 14 (14.9%) |
| Total | 678 (100.0%) | 94 (100.0%) |
Real Estate & Mortgages in Seeley Lake
Real Estate and Mortgage Overview in Seeley Lake
| Characteristic | Without Mortgage | With Mortgage |
| Housing Units | 381 | 297 |
| Median Property Value | $263,100 | $371,200 |
| Median Household Income | $31,964 | $50 |
| Monthly Housing Costs | $457 | $16 |
| Real Estate Taxes | $1,413 | $0 |
Property Value by Mortgage Status in Seeley Lake
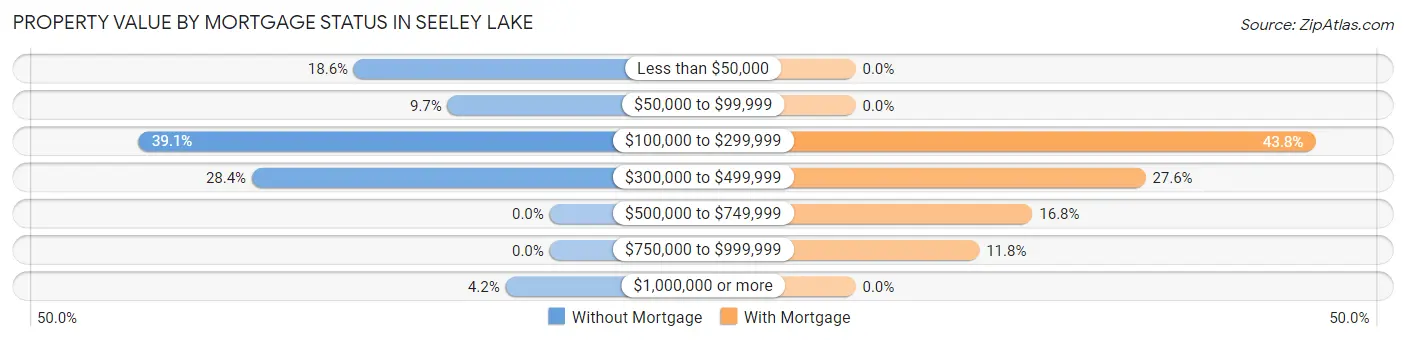
| Property Value | Without Mortgage | With Mortgage |
| Less than $50,000 | 71 (18.6%) | 0 (0.0%) |
| $50,000 to $99,999 | 37 (9.7%) | 0 (0.0%) |
| $100,000 to $299,999 | 149 (39.1%) | 130 (43.8%) |
| $300,000 to $499,999 | 108 (28.3%) | 82 (27.6%) |
| $500,000 to $749,999 | 0 (0.0%) | 50 (16.8%) |
| $750,000 to $999,999 | 0 (0.0%) | 35 (11.8%) |
| $1,000,000 or more | 16 (4.2%) | 0 (0.0%) |
| Total | 381 (100.0%) | 297 (100.0%) |
Household Income by Mortgage Status in Seeley Lake
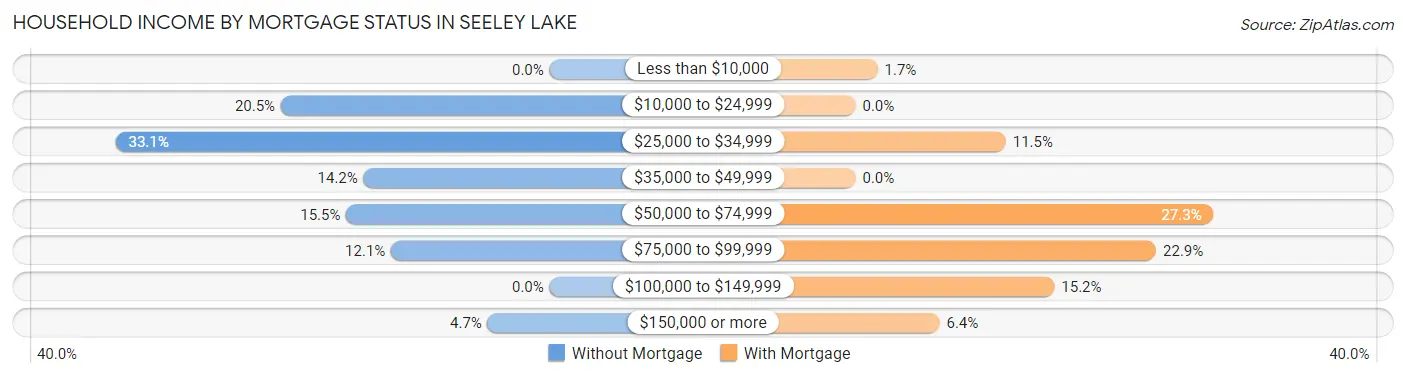
| Household Income | Without Mortgage | With Mortgage |
| Less than $10,000 | 0 (0.0%) | 5 (1.7%) |
| $10,000 to $24,999 | 78 (20.5%) | 0 (0.0%) |
| $25,000 to $34,999 | 126 (33.1%) | 34 (11.5%) |
| $35,000 to $49,999 | 54 (14.2%) | 0 (0.0%) |
| $50,000 to $74,999 | 59 (15.5%) | 81 (27.3%) |
| $75,000 to $99,999 | 46 (12.1%) | 68 (22.9%) |
| $100,000 to $149,999 | 0 (0.0%) | 45 (15.1%) |
| $150,000 or more | 18 (4.7%) | 19 (6.4%) |
| Total | 381 (100.0%) | 297 (100.0%) |
Property Value to Household Income Ratio in Seeley Lake

| Value-to-Income Ratio | Without Mortgage | With Mortgage |
| Less than 2.0x | 108 (28.3%) | 64,083 (21,576.8%) |
| 2.0x to 2.9x | 5 (1.3%) | 5 (1.7%) |
| 3.0x to 3.9x | 46 (12.1%) | 54 (18.2%) |
| 4.0x or more | 222 (58.3%) | 72 (24.2%) |
| Total | 381 (100.0%) | 297 (100.0%) |
Real Estate Taxes by Mortgage Status in Seeley Lake
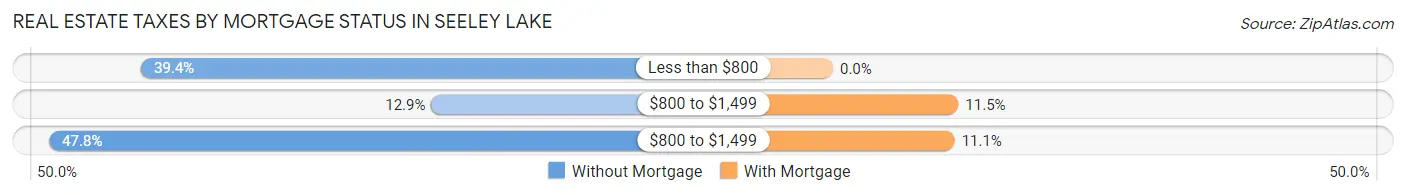
| Property Taxes | Without Mortgage | With Mortgage |
| Less than $800 | 150 (39.4%) | 0 (0.0%) |
| $800 to $1,499 | 49 (12.9%) | 34 (11.5%) |
| $800 to $1,499 | 182 (47.8%) | 33 (11.1%) |
| Total | 381 (100.0%) | 297 (100.0%) |
Health & Disability in Seeley Lake
Health Insurance Coverage by Age in Seeley Lake
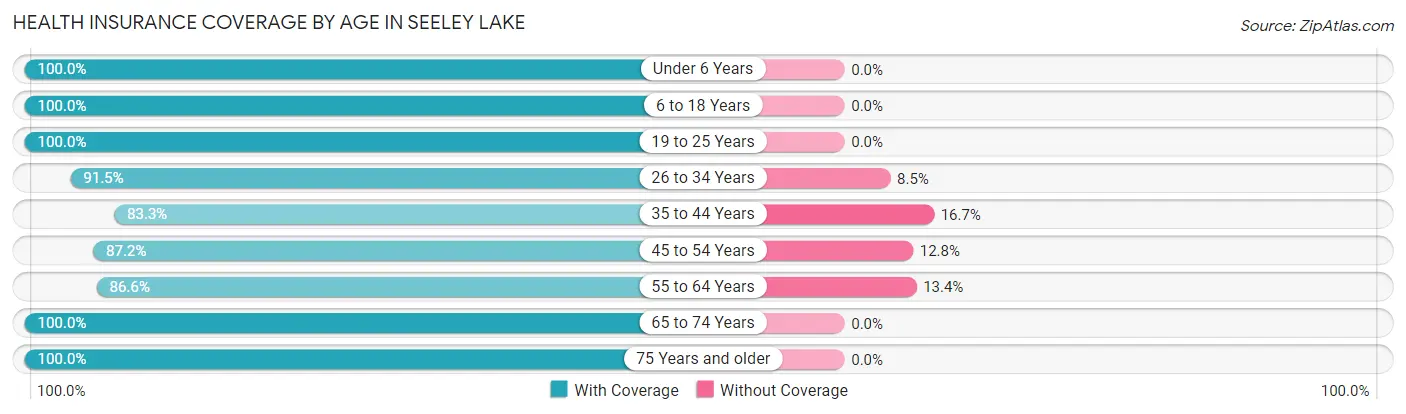
| Age Bracket | With Coverage | Without Coverage |
| Under 6 Years | 58 (100.0%) | 0 (0.0%) |
| 6 to 18 Years | 114 (100.0%) | 0 (0.0%) |
| 19 to 25 Years | 95 (100.0%) | 0 (0.0%) |
| 26 to 34 Years | 150 (91.5%) | 14 (8.5%) |
| 35 to 44 Years | 85 (83.3%) | 17 (16.7%) |
| 45 to 54 Years | 157 (87.2%) | 23 (12.8%) |
| 55 to 64 Years | 226 (86.6%) | 35 (13.4%) |
| 65 to 74 Years | 356 (100.0%) | 0 (0.0%) |
| 75 Years and older | 260 (100.0%) | 0 (0.0%) |
| Total | 1,501 (94.4%) | 89 (5.6%) |
Health Insurance Coverage by Citizenship Status in Seeley Lake
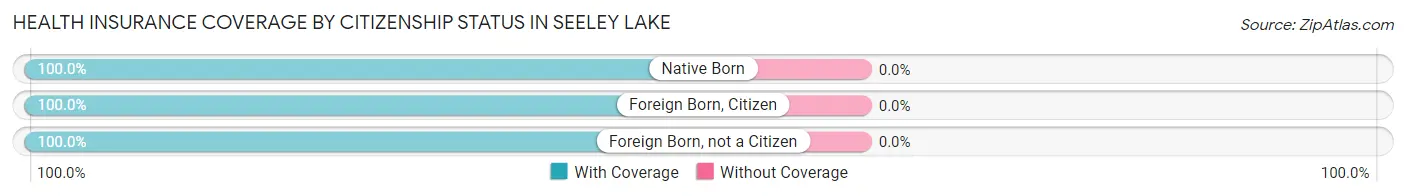
| Citizenship Status | With Coverage | Without Coverage |
| Native Born | 58 (100.0%) | 0 (0.0%) |
| Foreign Born, Citizen | 114 (100.0%) | 0 (0.0%) |
| Foreign Born, not a Citizen | 95 (100.0%) | 0 (0.0%) |
Health Insurance Coverage by Household Income in Seeley Lake
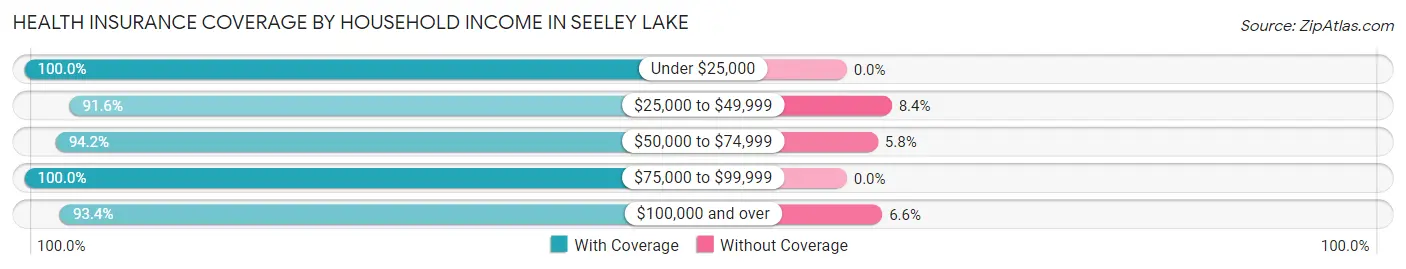
| Household Income | With Coverage | Without Coverage |
| Under $25,000 | 112 (100.0%) | 0 (0.0%) |
| $25,000 to $49,999 | 609 (91.6%) | 56 (8.4%) |
| $50,000 to $74,999 | 307 (94.2%) | 19 (5.8%) |
| $75,000 to $99,999 | 276 (100.0%) | 0 (0.0%) |
| $100,000 and over | 197 (93.4%) | 14 (6.6%) |
Public vs Private Health Insurance Coverage by Age in Seeley Lake
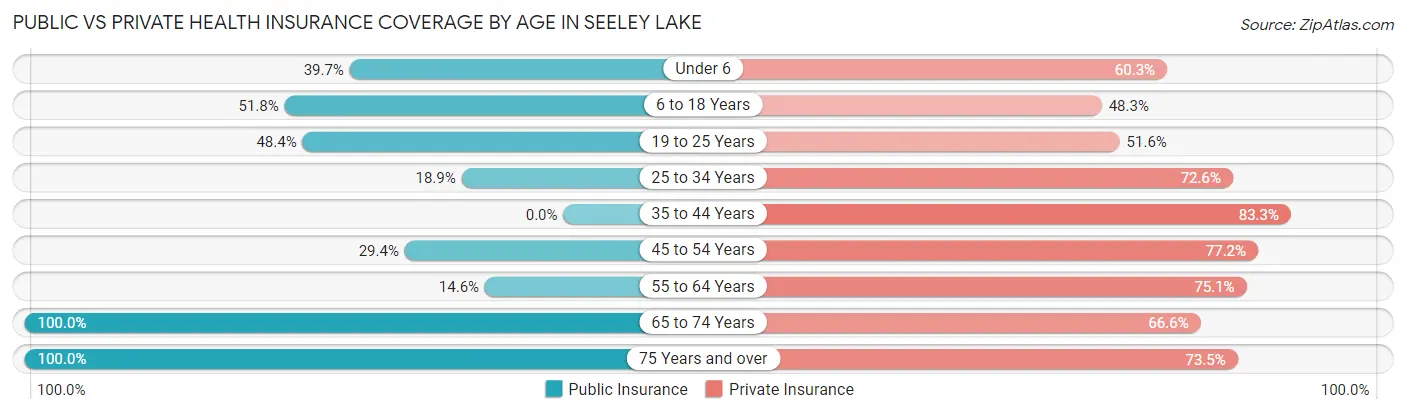
| Age Bracket | Public Insurance | Private Insurance |
| Under 6 | 23 (39.7%) | 35 (60.3%) |
| 6 to 18 Years | 59 (51.7%) | 55 (48.2%) |
| 19 to 25 Years | 46 (48.4%) | 49 (51.6%) |
| 25 to 34 Years | 31 (18.9%) | 119 (72.6%) |
| 35 to 44 Years | 0 (0.0%) | 85 (83.3%) |
| 45 to 54 Years | 53 (29.4%) | 139 (77.2%) |
| 55 to 64 Years | 38 (14.6%) | 196 (75.1%) |
| 65 to 74 Years | 356 (100.0%) | 237 (66.6%) |
| 75 Years and over | 260 (100.0%) | 191 (73.5%) |
| Total | 866 (54.5%) | 1,106 (69.6%) |
Disability Status by Sex by Age in Seeley Lake
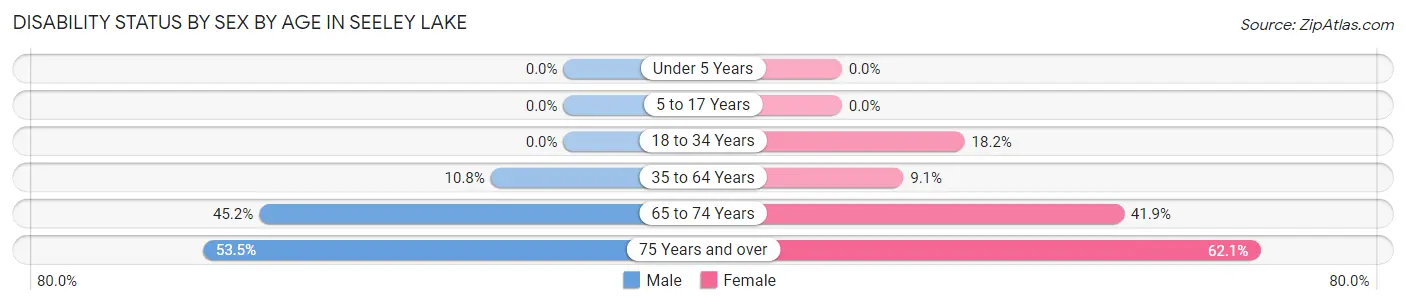
| Age Bracket | Male | Female |
| Under 5 Years | 0 (0.0%) | 0 (0.0%) |
| 5 to 17 Years | 0 (0.0%) | 0 (0.0%) |
| 18 to 34 Years | 0 (0.0%) | 31 (18.2%) |
| 35 to 64 Years | 35 (10.8%) | 20 (9.1%) |
| 65 to 74 Years | 108 (45.2%) | 49 (41.9%) |
| 75 Years and over | 53 (53.5%) | 100 (62.1%) |
Disability Class by Sex by Age in Seeley Lake
Disability Class: Hearing Difficulty
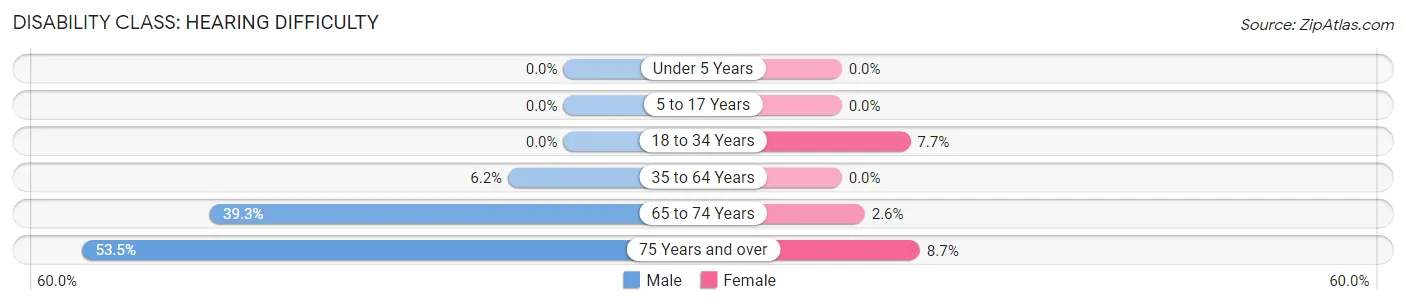
| Age Bracket | Male | Female |
| Under 5 Years | 0 (0.0%) | 0 (0.0%) |
| 5 to 17 Years | 0 (0.0%) | 0 (0.0%) |
| 18 to 34 Years | 0 (0.0%) | 13 (7.6%) |
| 35 to 64 Years | 20 (6.2%) | 0 (0.0%) |
| 65 to 74 Years | 94 (39.3%) | 3 (2.6%) |
| 75 Years and over | 53 (53.5%) | 14 (8.7%) |
Disability Class: Vision Difficulty
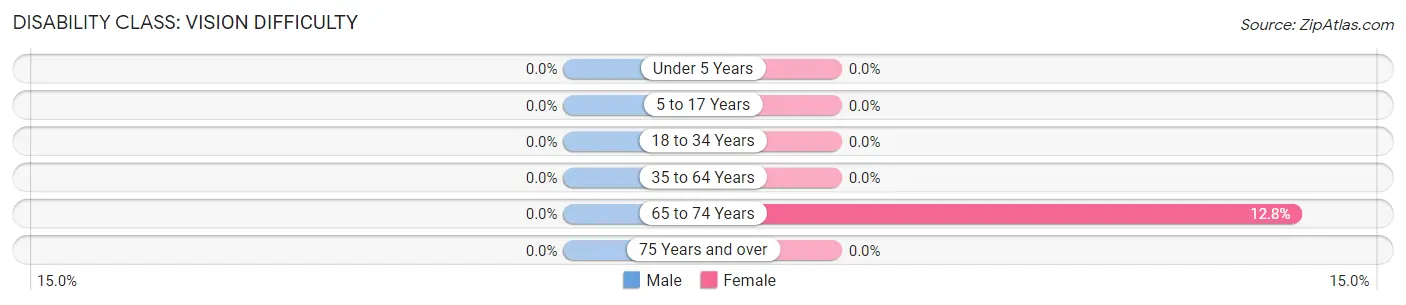
| Age Bracket | Male | Female |
| Under 5 Years | 0 (0.0%) | 0 (0.0%) |
| 5 to 17 Years | 0 (0.0%) | 0 (0.0%) |
| 18 to 34 Years | 0 (0.0%) | 0 (0.0%) |
| 35 to 64 Years | 0 (0.0%) | 0 (0.0%) |
| 65 to 74 Years | 0 (0.0%) | 15 (12.8%) |
| 75 Years and over | 0 (0.0%) | 0 (0.0%) |
Disability Class: Cognitive Difficulty
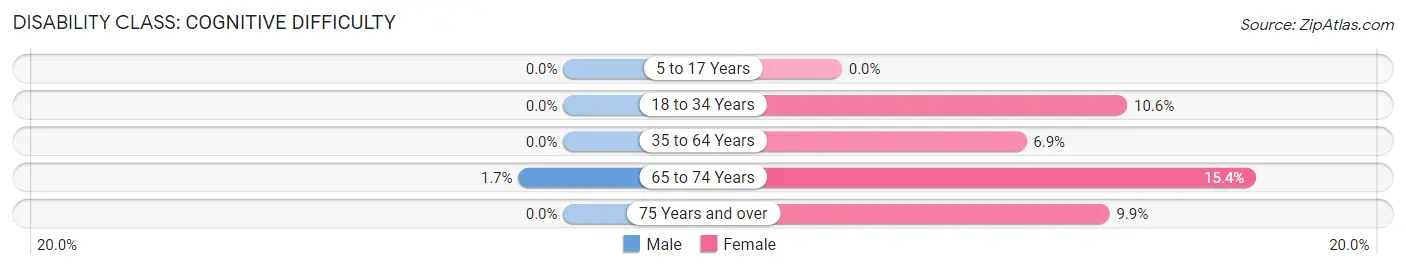
| Age Bracket | Male | Female |
| 5 to 17 Years | 0 (0.0%) | 0 (0.0%) |
| 18 to 34 Years | 0 (0.0%) | 18 (10.6%) |
| 35 to 64 Years | 0 (0.0%) | 15 (6.9%) |
| 65 to 74 Years | 4 (1.7%) | 18 (15.4%) |
| 75 Years and over | 0 (0.0%) | 16 (9.9%) |
Disability Class: Ambulatory Difficulty
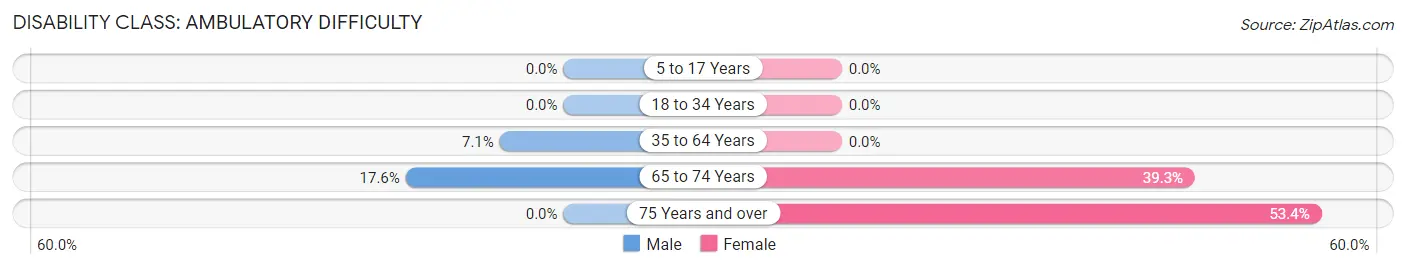
| Age Bracket | Male | Female |
| 5 to 17 Years | 0 (0.0%) | 0 (0.0%) |
| 18 to 34 Years | 0 (0.0%) | 0 (0.0%) |
| 35 to 64 Years | 23 (7.1%) | 0 (0.0%) |
| 65 to 74 Years | 42 (17.6%) | 46 (39.3%) |
| 75 Years and over | 0 (0.0%) | 86 (53.4%) |
Disability Class: Self-Care Difficulty
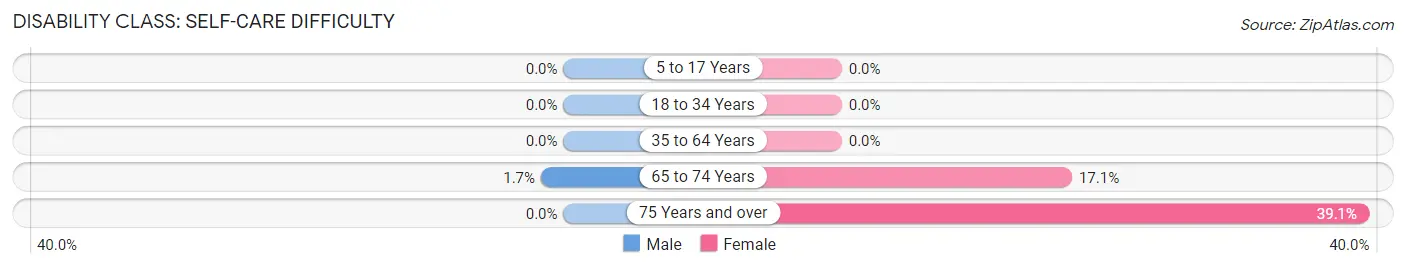
| Age Bracket | Male | Female |
| 5 to 17 Years | 0 (0.0%) | 0 (0.0%) |
| 18 to 34 Years | 0 (0.0%) | 0 (0.0%) |
| 35 to 64 Years | 0 (0.0%) | 0 (0.0%) |
| 65 to 74 Years | 4 (1.7%) | 20 (17.1%) |
| 75 Years and over | 0 (0.0%) | 63 (39.1%) |
Technology Access in Seeley Lake
Computing Device Access in Seeley Lake
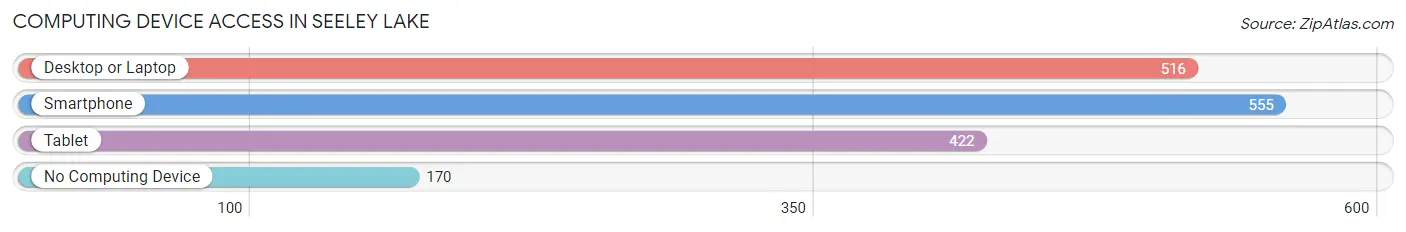
| Device Type | # Households | % Households |
| Desktop or Laptop | 516 | 66.8% |
| Smartphone | 555 | 71.9% |
| Tablet | 422 | 54.7% |
| No Computing Device | 170 | 22.0% |
| Total | 772 | 100.0% |
Internet Access in Seeley Lake
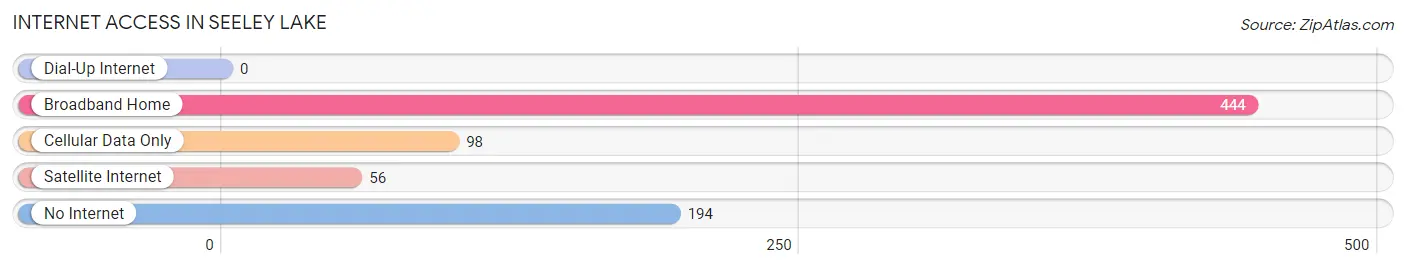
| Internet Type | # Households | % Households |
| Dial-Up Internet | 0 | 0.0% |
| Broadband Home | 444 | 57.5% |
| Cellular Data Only | 98 | 12.7% |
| Satellite Internet | 56 | 7.2% |
| No Internet | 194 | 25.1% |
| Total | 772 | 100.0% |
Seeley Lake Summary
Seeley Lake is a small unincorporated community located in Missoula County, Montana. It is situated in the Seeley-Swan Valley, a region of the Rocky Mountains. The town is located on the western shore of Seeley Lake, a large natural lake that is the source of the Blackfoot River. The population of Seeley Lake was 1,073 at the 2010 census.
History
The Seeley-Swan Valley has been inhabited by Native Americans for thousands of years. The Salish, Kootenai, and Pend d'Oreille tribes were the primary inhabitants of the area. The first non-native settlers arrived in the late 1800s, and the town of Seeley Lake was established in 1902. The town was named after the lake, which was named after a local settler, William Seeley.
Geography
Seeley Lake is located in the Seeley-Swan Valley, a region of the Rocky Mountains. The town is situated on the western shore of Seeley Lake, a large natural lake that is the source of the Blackfoot River. The lake is approximately 8 miles long and 2 miles wide. The surrounding area is mostly forested, with some open meadows and wetlands. The town is located at an elevation of 3,400 feet.
Economy
Seeley Lake is a small, rural community with a primarily agricultural economy. The town is home to several small businesses, including a grocery store, a hardware store, and a few restaurants. The town is also home to a number of tourist attractions, including the Seeley Lake Historical Museum, the Seeley Lake Nature Center, and the Seeley Lake Ski Area.
Demographics
As of the 2010 census, the population of Seeley Lake was 1,073. The racial makeup of the town was 95.2% White, 0.3% African American, 1.2% Native American, 0.3% Asian, 0.1% Pacific Islander, 0.7% from other races, and 2.2% from two or more races. The median household income was $37,917, and the median family income was $45,625. The per capita income was $20,945.
Conclusion
Seeley Lake is a small, rural community located in the Seeley-Swan Valley of the Rocky Mountains. The town is situated on the western shore of Seeley Lake, a large natural lake that is the source of the Blackfoot River. The population of Seeley Lake was 1,073 at the 2010 census. The town has a primarily agricultural economy, with some small businesses and tourist attractions. The racial makeup of the town was 95.2% White, 0.3% African American, 1.2% Native American, 0.3% Asian, 0.1% Pacific Islander, 0.7% from other races, and 2.2% from two or more races. The median household income was $37,917, and the median family income was $45,625.
Common Questions
What is Per Capita Income in Seeley Lake?
Per Capita income in Seeley Lake is $34,990.
What is the Median Family Income in Seeley Lake?
Median Family Income in Seeley Lake is $66,375.
What is the Median Household income in Seeley Lake?
Median Household Income in Seeley Lake is $42,254.
What is Inequality or Gini Index in Seeley Lake?
Inequality or Gini Index in Seeley Lake is 0.48.
What is the Total Population of Seeley Lake?
Total Population of Seeley Lake is 1,590.
What is the Total Male Population of Seeley Lake?
Total Male Population of Seeley Lake is 875.
What is the Total Female Population of Seeley Lake?
Total Female Population of Seeley Lake is 715.
What is the Ratio of Males per 100 Females in Seeley Lake?
There are 122.38 Males per 100 Females in Seeley Lake.
What is the Ratio of Females per 100 Males in Seeley Lake?
There are 81.71 Females per 100 Males in Seeley Lake.
What is the Median Population Age in Seeley Lake?
Median Population Age in Seeley Lake is 58.7 Years.
What is the Average Family Size in Seeley Lake
Average Family Size in Seeley Lake is 2.7 People.
What is the Average Household Size in Seeley Lake
Average Household Size in Seeley Lake is 2.1 People.
How Large is the Labor Force in Seeley Lake?
There are 595 People in the Labor Forcein in Seeley Lake.
What is the Percentage of People in the Labor Force in Seeley Lake?
41.1% of People are in the Labor Force in Seeley Lake.
What is the Unemployment Rate in Seeley Lake?
Unemployment Rate in Seeley Lake is 6.1%.