Forsyth, MT Map & Demographics
Forsyth Map
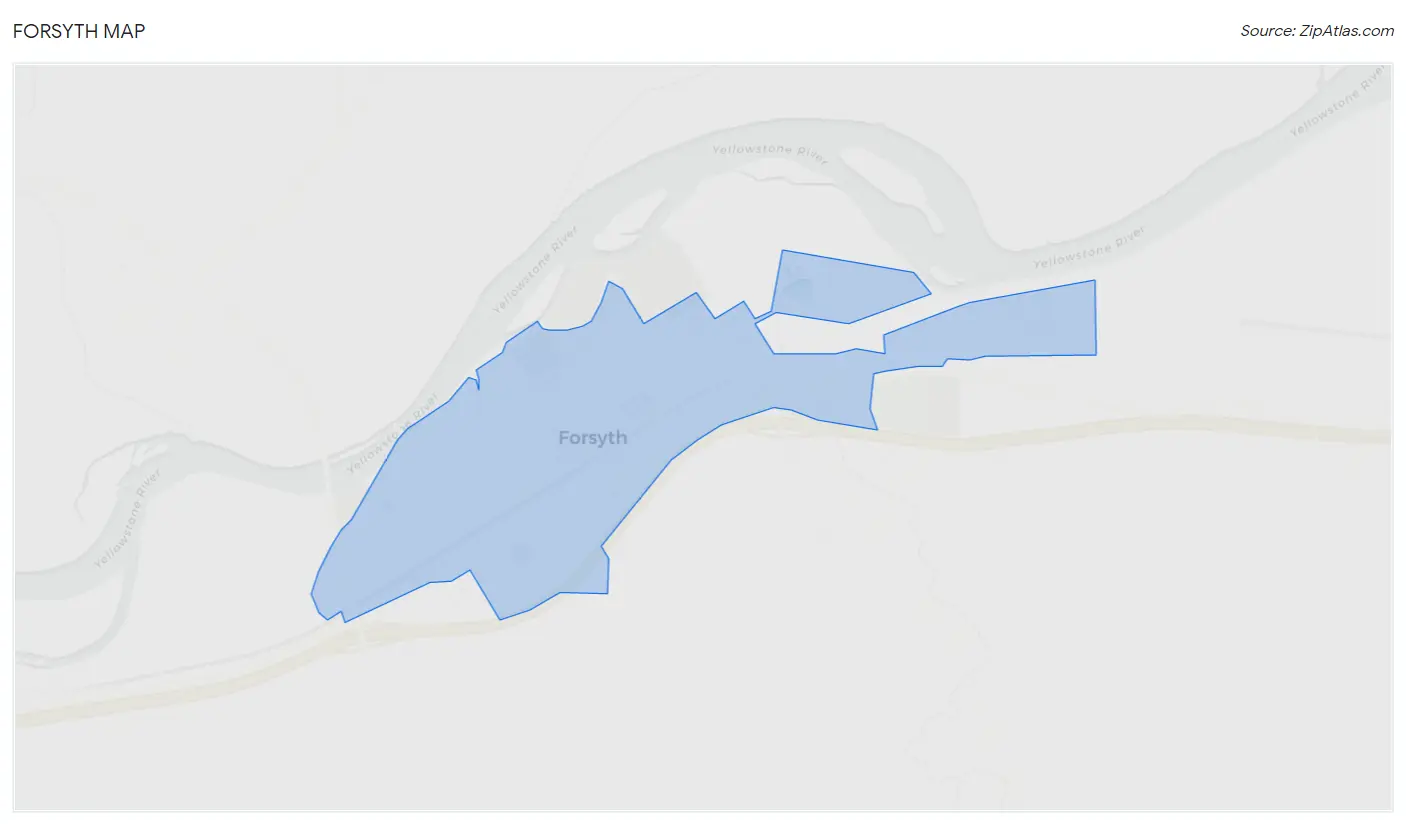
Forsyth Overview
$25,763
PER CAPITA INCOME
$58,810
AVG FAMILY INCOME
$56,397
AVG HOUSEHOLD INCOME
41.8%
WAGE / INCOME GAP [ % ]
58.2¢/ $1
WAGE / INCOME GAP [ $ ]
0.38
INEQUALITY / GINI INDEX
1,458
TOTAL POPULATION
735
MALE POPULATION
723
FEMALE POPULATION
101.66
MALES / 100 FEMALES
98.37
FEMALES / 100 MALES
38.6
MEDIAN AGE
3.0
AVG FAMILY SIZE
2.3
AVG HOUSEHOLD SIZE
613
LABOR FORCE [ PEOPLE ]
51.8%
PERCENT IN LABOR FORCE
2.6%
UNEMPLOYMENT RATE
Forsyth Zip Codes
Forsyth Area Codes
Income in Forsyth
Income Overview in Forsyth
Per Capita Income in Forsyth is $25,763, while median incomes of families and households are $58,810 and $56,397 respectively.
| Characteristic | Number | Measure |
| Per Capita Income | 1,458 | $25,763 |
| Median Family Income | 364 | $58,810 |
| Mean Family Income | 364 | $67,850 |
| Median Household Income | 614 | $56,397 |
| Mean Household Income | 614 | $57,714 |
| Income Deficit | 364 | $0 |
| Wage / Income Gap (%) | 1,458 | 41.84% |
| Wage / Income Gap ($) | 1,458 | 58.16¢ per $1 |
| Gini / Inequality Index | 1,458 | 0.38 |
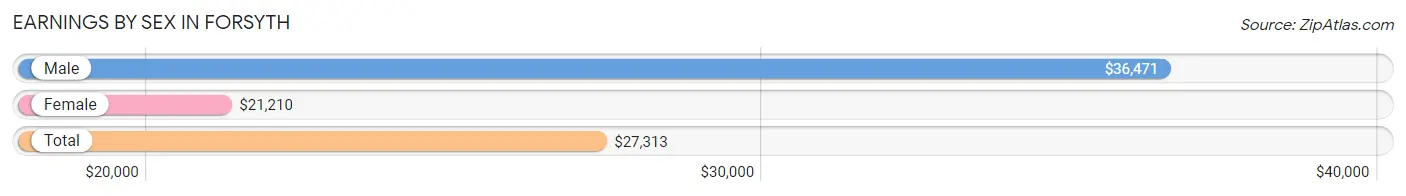
Earnings by Sex in Forsyth
Average Earnings in Forsyth are $27,313, $36,471 for men and $21,210 for women, a difference of 41.8%.
| Sex | Number | Average Earnings |
| Male | 346 (54.8%) | $36,471 |
| Female | 285 (45.2%) | $21,210 |
| Total | 631 (100.0%) | $27,313 |
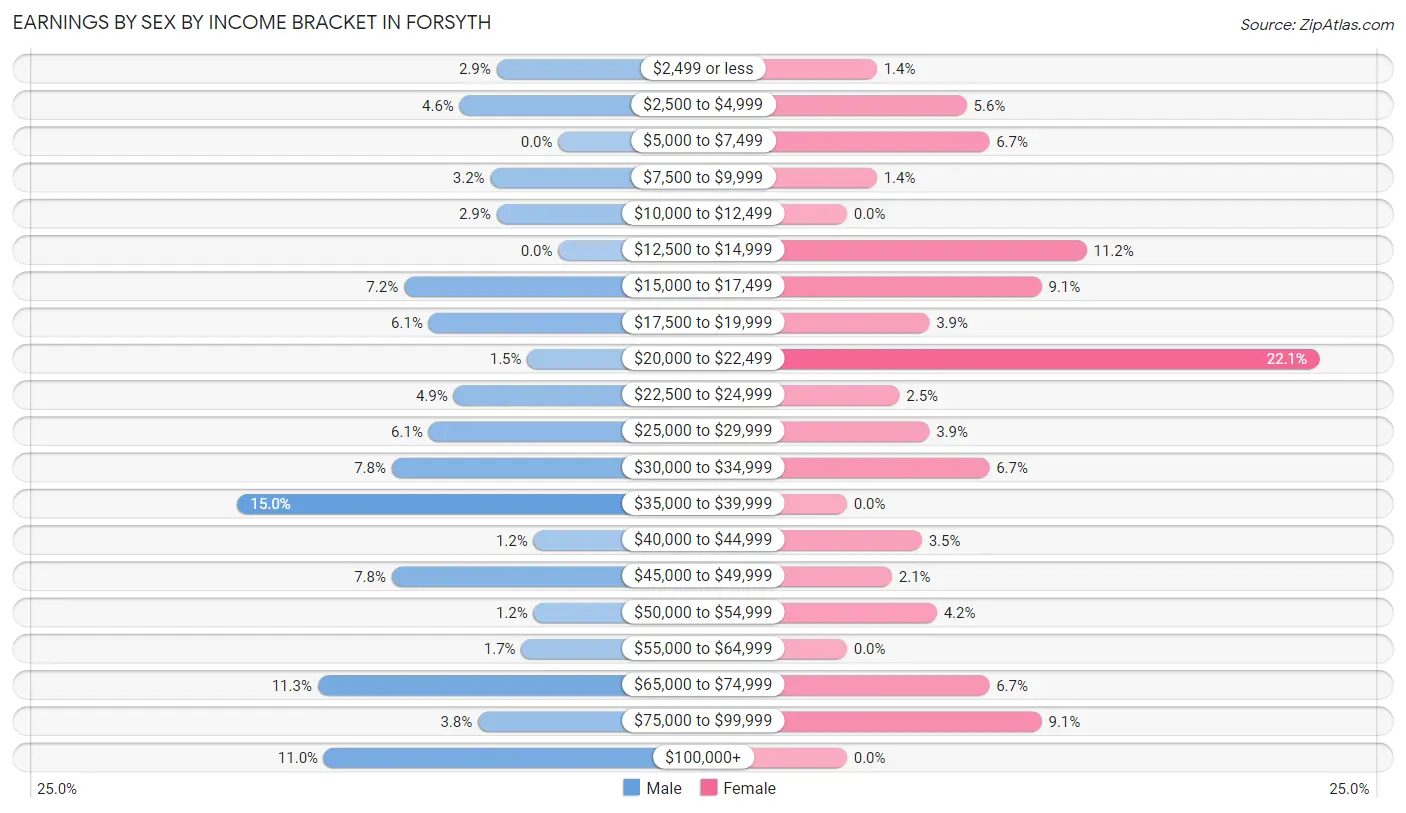
Earnings by Sex by Income Bracket in Forsyth
The most common earnings brackets in Forsyth are $35,000 to $39,999 for men (52 | 15.0%) and $20,000 to $22,499 for women (63 | 22.1%).
| Income | Male | Female |
| $2,499 or less | 10 (2.9%) | 4 (1.4%) |
| $2,500 to $4,999 | 16 (4.6%) | 16 (5.6%) |
| $5,000 to $7,499 | 0 (0.0%) | 19 (6.7%) |
| $7,500 to $9,999 | 11 (3.2%) | 4 (1.4%) |
| $10,000 to $12,499 | 10 (2.9%) | 0 (0.0%) |
| $12,500 to $14,999 | 0 (0.0%) | 32 (11.2%) |
| $15,000 to $17,499 | 25 (7.2%) | 26 (9.1%) |
| $17,500 to $19,999 | 21 (6.1%) | 11 (3.9%) |
| $20,000 to $22,499 | 5 (1.5%) | 63 (22.1%) |
| $22,500 to $24,999 | 17 (4.9%) | 7 (2.5%) |
| $25,000 to $29,999 | 21 (6.1%) | 11 (3.9%) |
| $30,000 to $34,999 | 27 (7.8%) | 19 (6.7%) |
| $35,000 to $39,999 | 52 (15.0%) | 0 (0.0%) |
| $40,000 to $44,999 | 4 (1.2%) | 10 (3.5%) |
| $45,000 to $49,999 | 27 (7.8%) | 6 (2.1%) |
| $50,000 to $54,999 | 4 (1.2%) | 12 (4.2%) |
| $55,000 to $64,999 | 6 (1.7%) | 0 (0.0%) |
| $65,000 to $74,999 | 39 (11.3%) | 19 (6.7%) |
| $75,000 to $99,999 | 13 (3.8%) | 26 (9.1%) |
| $100,000+ | 38 (11.0%) | 0 (0.0%) |
| Total | 346 (100.0%) | 285 (100.0%) |
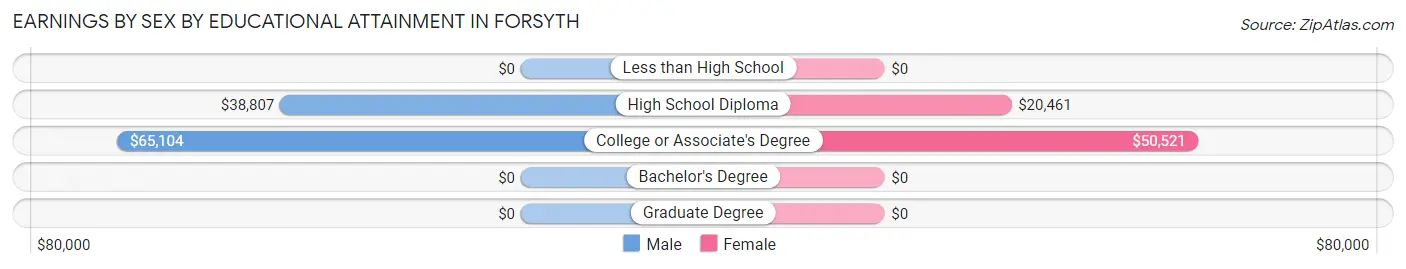
Earnings by Sex by Educational Attainment in Forsyth
Average earnings in Forsyth are $39,000 for men and $22,148 for women, a difference of 43.2%. Men with an educational attainment of college or associate's degree enjoy the highest average annual earnings of $65,104, while those with high school diploma education earn the least with $38,807. Women with an educational attainment of college or associate's degree earn the most with the average annual earnings of $50,521, while those with high school diploma education have the smallest earnings of $20,461.
| Educational Attainment | Male Income | Female Income |
| Less than High School | - | - |
| High School Diploma | $38,807 | $20,461 |
| College or Associate's Degree | $65,104 | $50,521 |
| Bachelor's Degree | - | - |
| Graduate Degree | - | - |
| Total | $39,000 | $22,148 |
Family Income in Forsyth
Family Income Brackets in Forsyth
According to the Forsyth family income data, there are 113 families falling into the $50,000 to $74,999 income range, which is the most common income bracket and makes up 31.0% of all families. Conversely, the $200,000+ income bracket is the least frequent group with only 2 families (0.5%) belonging to this category.
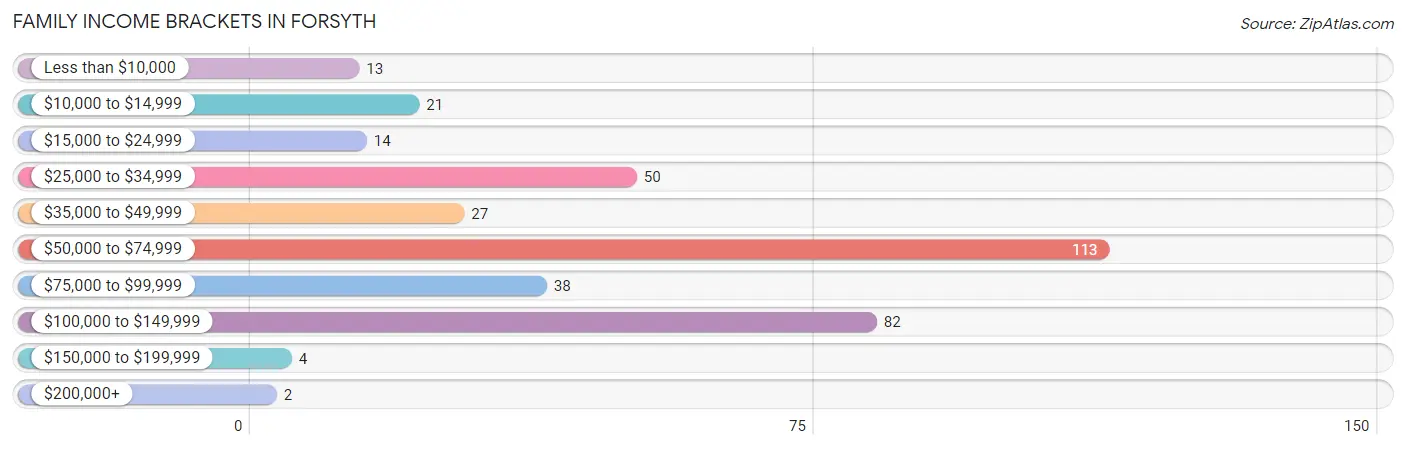
| Income Bracket | # Families | % Families |
| Less than $10,000 | 13 | 3.6% |
| $10,000 to $14,999 | 21 | 5.8% |
| $15,000 to $24,999 | 14 | 3.8% |
| $25,000 to $34,999 | 50 | 13.7% |
| $35,000 to $49,999 | 27 | 7.4% |
| $50,000 to $74,999 | 113 | 31.0% |
| $75,000 to $99,999 | 38 | 10.4% |
| $100,000 to $149,999 | 82 | 22.5% |
| $150,000 to $199,999 | 4 | 1.1% |
| $200,000+ | 2 | 0.5% |
Family Income by Famaliy Size in Forsyth
5-person families (42 | 11.5%) account for the highest median family income in Forsyth with $86,875 per family, while 2-person families (205 | 56.3%) have the highest median income of $27,525 per family member.
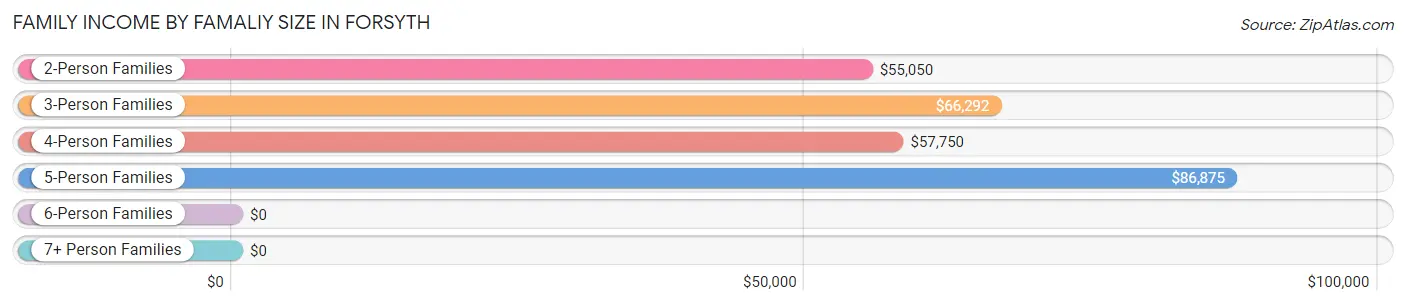
| Income Bracket | # Families | Median Income |
| 2-Person Families | 205 (56.3%) | $55,050 |
| 3-Person Families | 73 (20.1%) | $66,292 |
| 4-Person Families | 40 (11.0%) | $57,750 |
| 5-Person Families | 42 (11.5%) | $86,875 |
| 6-Person Families | 4 (1.1%) | $0 |
| 7+ Person Families | 0 (0.0%) | $0 |
| Total | 364 (100.0%) | $58,810 |
Family Income by Number of Earners in Forsyth
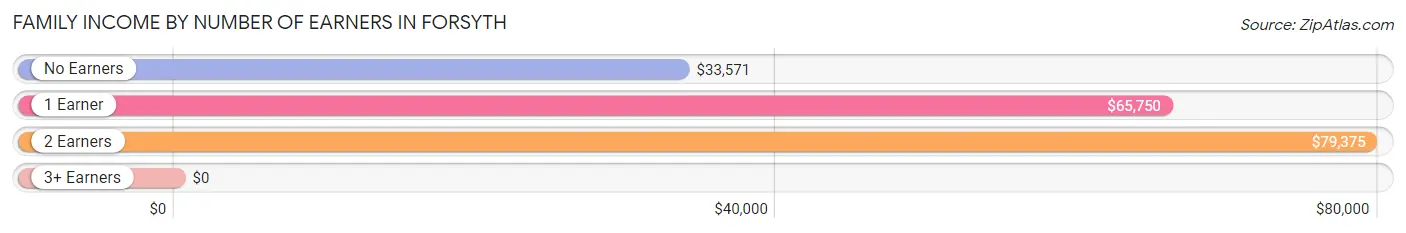
| Number of Earners | # Families | Median Income |
| No Earners | 108 (29.7%) | $33,571 |
| 1 Earner | 134 (36.8%) | $65,750 |
| 2 Earners | 108 (29.7%) | $79,375 |
| 3+ Earners | 14 (3.8%) | $0 |
| Total | 364 (100.0%) | $58,810 |
Household Income in Forsyth
Household Income Brackets in Forsyth
With 178 households falling in the category, the $50,000 to $74,999 income range is the most frequent in Forsyth, accounting for 29.0% of all households. In contrast, only 2 households (0.3%) fall into the $200,000+ income bracket, making it the least populous group.
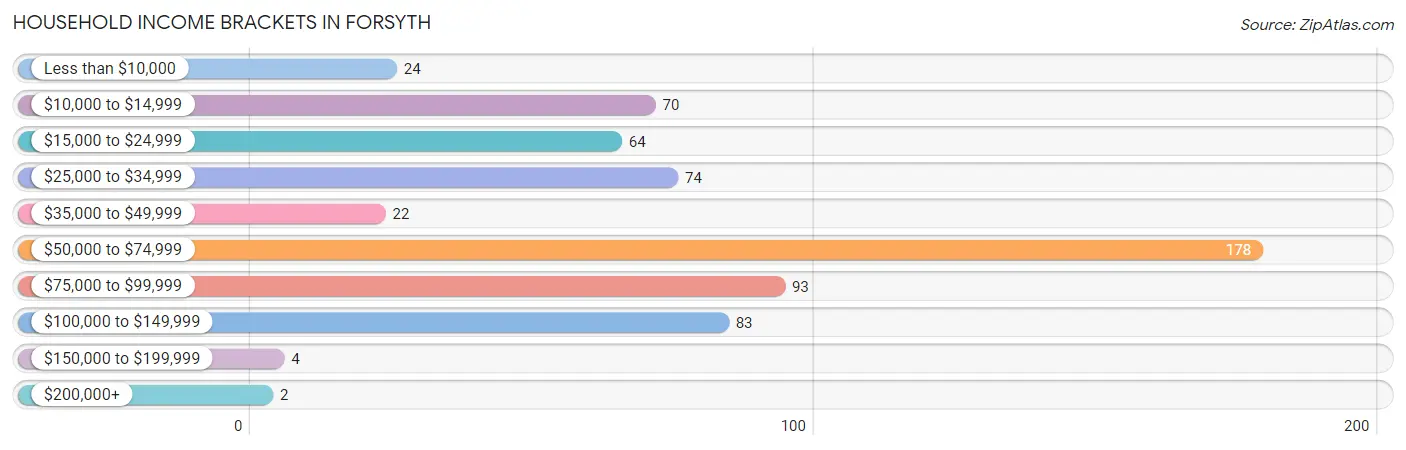
| Income Bracket | # Households | % Households |
| Less than $10,000 | 24 | 3.9% |
| $10,000 to $14,999 | 70 | 11.4% |
| $15,000 to $24,999 | 64 | 10.4% |
| $25,000 to $34,999 | 74 | 12.1% |
| $35,000 to $49,999 | 22 | 3.6% |
| $50,000 to $74,999 | 178 | 29.0% |
| $75,000 to $99,999 | 93 | 15.1% |
| $100,000 to $149,999 | 83 | 13.5% |
| $150,000 to $199,999 | 4 | 0.7% |
| $200,000+ | 2 | 0.3% |
Household Income by Householder Age in Forsyth
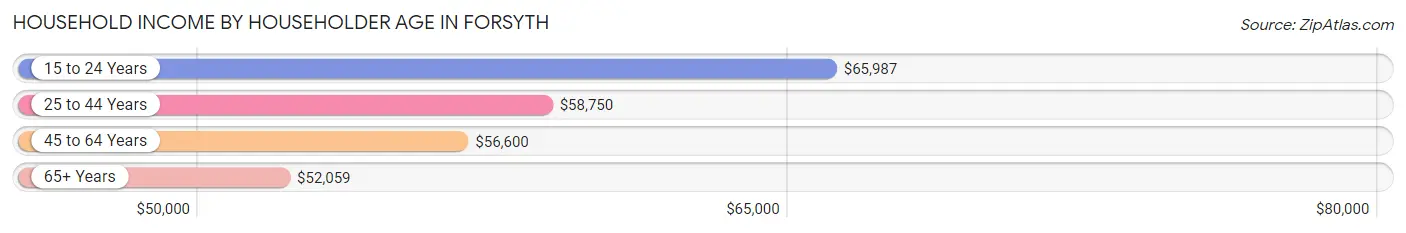
The median household income in Forsyth is $56,397, with the highest median household income of $65,987 found in the 15 to 24 years age bracket for the primary householder. A total of 59 households (9.6%) fall into this category. Meanwhile, the 65+ years age bracket for the primary householder has the lowest median household income of $52,059, with 226 households (36.8%) in this group.
| Income Bracket | # Households | Median Income |
| 15 to 24 Years | 59 (9.6%) | $65,987 |
| 25 to 44 Years | 145 (23.6%) | $58,750 |
| 45 to 64 Years | 184 (30.0%) | $56,600 |
| 65+ Years | 226 (36.8%) | $52,059 |
| Total | 614 (100.0%) | $56,397 |
Poverty in Forsyth
Income Below Poverty by Sex and Age in Forsyth
With 14.0% poverty level for males and 7.0% for females among the residents of Forsyth, 75 year old and over males and 75 year old and over females are the most vulnerable to poverty, with 34 males (40.0%) and 11 females (22.5%) in their respective age groups living below the poverty level.
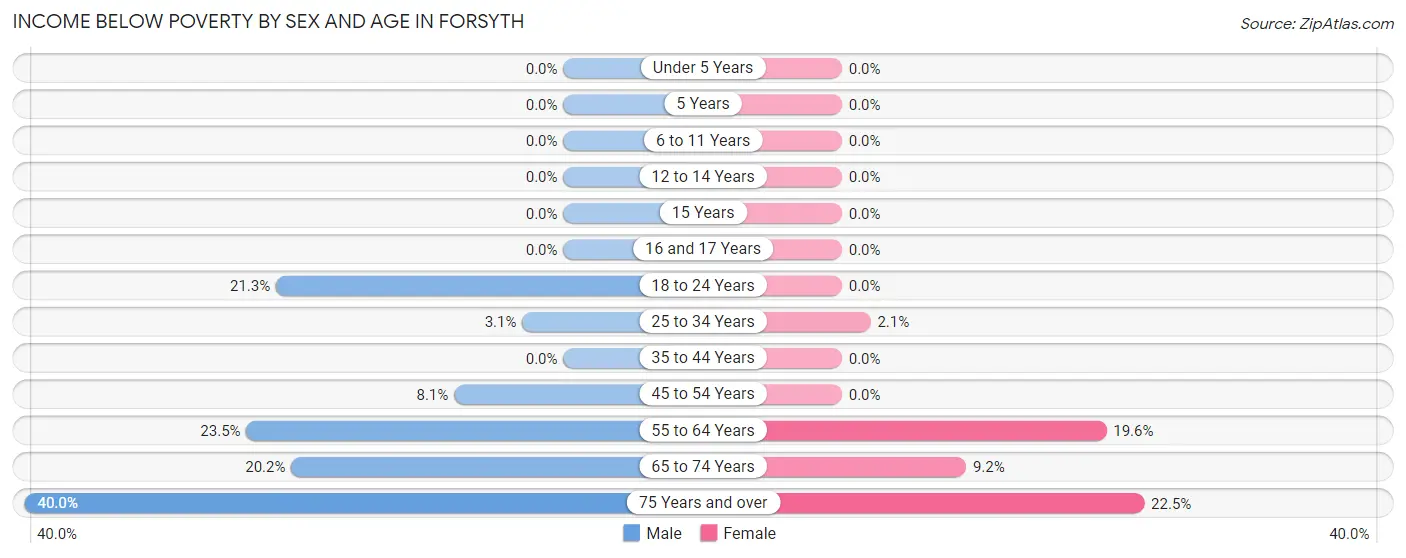
| Age Bracket | Male | Female |
| Under 5 Years | 0 (0.0%) | 0 (0.0%) |
| 5 Years | 0 (0.0%) | 0 (0.0%) |
| 6 to 11 Years | 0 (0.0%) | 0 (0.0%) |
| 12 to 14 Years | 0 (0.0%) | 0 (0.0%) |
| 15 Years | 0 (0.0%) | 0 (0.0%) |
| 16 and 17 Years | 0 (0.0%) | 0 (0.0%) |
| 18 to 24 Years | 16 (21.3%) | 0 (0.0%) |
| 25 to 34 Years | 4 (3.0%) | 2 (2.1%) |
| 35 to 44 Years | 0 (0.0%) | 0 (0.0%) |
| 45 to 54 Years | 3 (8.1%) | 0 (0.0%) |
| 55 to 64 Years | 24 (23.5%) | 22 (19.6%) |
| 65 to 74 Years | 20 (20.2%) | 13 (9.2%) |
| 75 Years and over | 34 (40.0%) | 11 (22.5%) |
| Total | 101 (14.0%) | 48 (7.0%) |
Income Above Poverty by Sex and Age in Forsyth
According to the poverty statistics in Forsyth, males aged under 5 years and females aged under 5 years are the age groups that are most secure financially, with 100.0% of males and 100.0% of females in these age groups living above the poverty line.
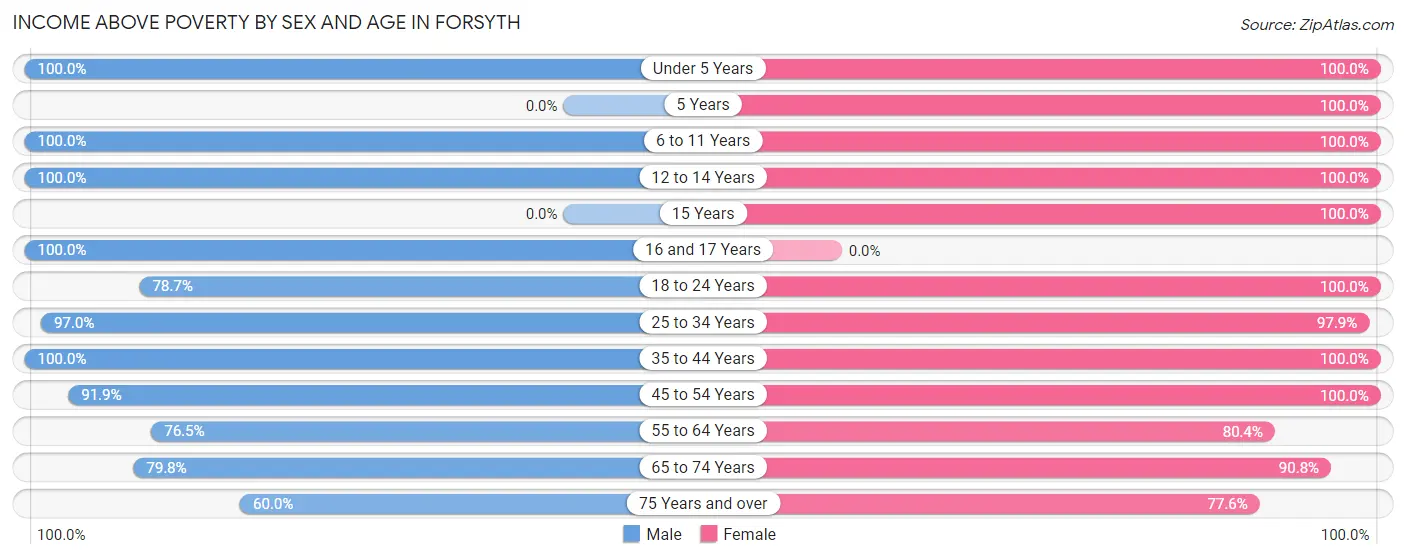
| Age Bracket | Male | Female |
| Under 5 Years | 104 (100.0%) | 18 (100.0%) |
| 5 Years | 0 (0.0%) | 20 (100.0%) |
| 6 to 11 Years | 18 (100.0%) | 71 (100.0%) |
| 12 to 14 Years | 15 (100.0%) | 22 (100.0%) |
| 15 Years | 0 (0.0%) | 6 (100.0%) |
| 16 and 17 Years | 22 (100.0%) | 0 (0.0%) |
| 18 to 24 Years | 59 (78.7%) | 56 (100.0%) |
| 25 to 34 Years | 127 (97.0%) | 92 (97.9%) |
| 35 to 44 Years | 32 (100.0%) | 57 (100.0%) |
| 45 to 54 Years | 34 (91.9%) | 40 (100.0%) |
| 55 to 64 Years | 78 (76.5%) | 90 (80.4%) |
| 65 to 74 Years | 79 (79.8%) | 128 (90.8%) |
| 75 Years and over | 51 (60.0%) | 38 (77.5%) |
| Total | 619 (86.0%) | 638 (93.0%) |
Income Below Poverty Among Married-Couple Families in Forsyth
The poverty statistics for married-couple families in Forsyth show that 10.6% or 34 of the total 322 families live below the poverty line. Families with no children have the highest poverty rate of 14.5%, comprising of 34 families. On the other hand, families with 1 or 2 children have the lowest poverty rate of 0.0%, which includes 0 families.
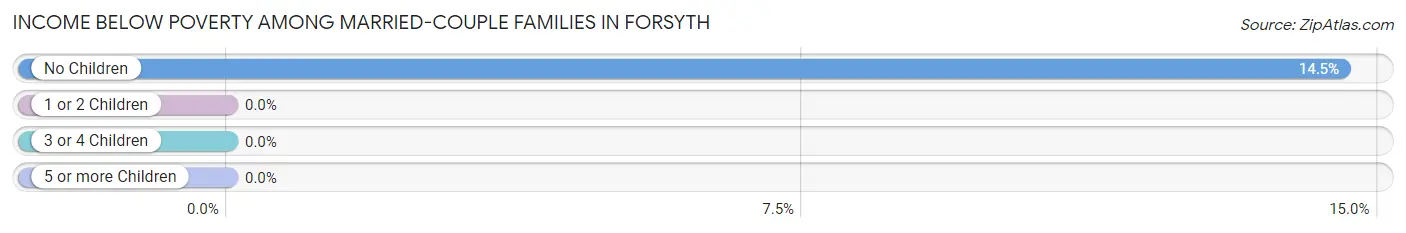
| Children | Above Poverty | Below Poverty |
| No Children | 200 (85.5%) | 34 (14.5%) |
| 1 or 2 Children | 46 (100.0%) | 0 (0.0%) |
| 3 or 4 Children | 42 (100.0%) | 0 (0.0%) |
| 5 or more Children | 0 (0.0%) | 0 (0.0%) |
| Total | 288 (89.4%) | 34 (10.6%) |
Income Below Poverty Among Single-Parent Households in Forsyth
| Children | Single Father | Single Mother |
| No Children | 0 (0.0%) | 0 (0.0%) |
| 1 or 2 Children | 0 (0.0%) | 0 (0.0%) |
| 3 or 4 Children | 0 (0.0%) | 0 (0.0%) |
| 5 or more Children | 0 (0.0%) | 0 (0.0%) |
| Total | 0 (0.0%) | 0 (0.0%) |
Income Below Poverty Among Married-Couple vs Single-Parent Households in Forsyth
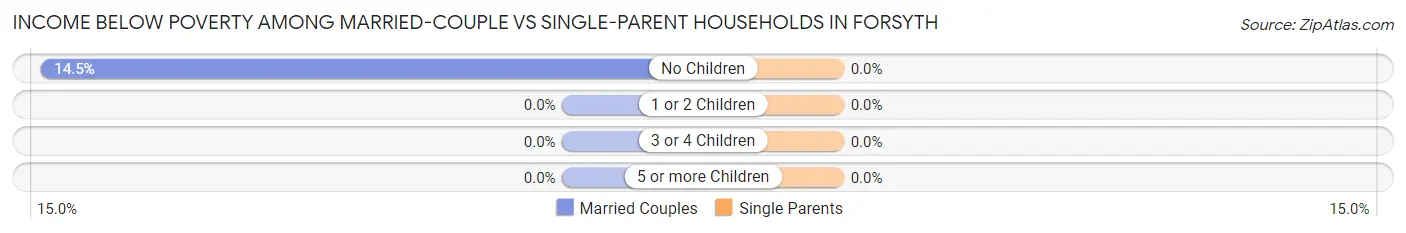
| Children | Married-Couple Families | Single-Parent Households |
| No Children | 34 (14.5%) | 0 (0.0%) |
| 1 or 2 Children | 0 (0.0%) | 0 (0.0%) |
| 3 or 4 Children | 0 (0.0%) | 0 (0.0%) |
| 5 or more Children | 0 (0.0%) | 0 (0.0%) |
| Total | 34 (10.6%) | 0 (0.0%) |
Race in Forsyth
The most populous races in Forsyth are White / Caucasian (1,184 | 81.2%), Two or more Races (178 | 12.2%), and Hispanic or Latino (49 | 3.4%).
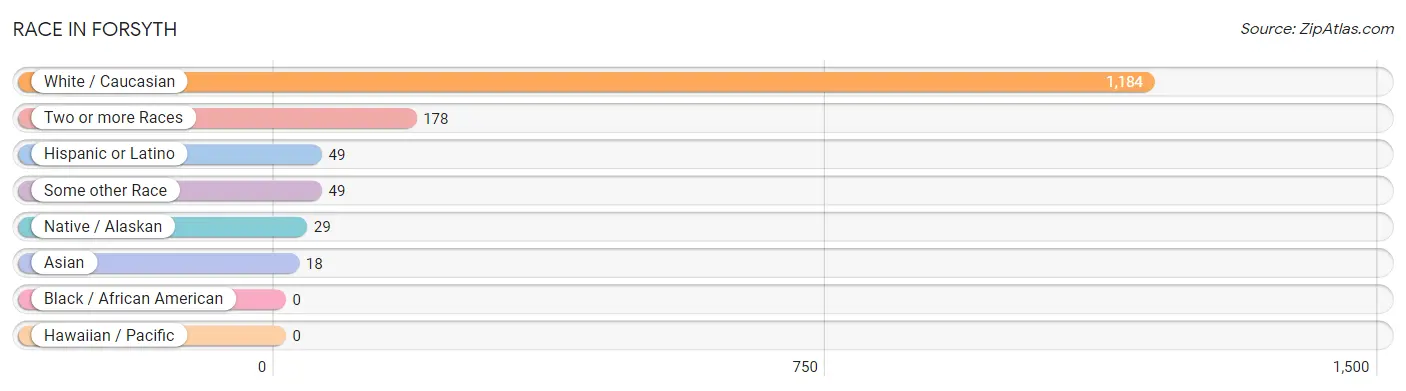
| Race | # Population | % Population |
| Asian | 18 | 1.2% |
| Black / African American | 0 | 0.0% |
| Hawaiian / Pacific | 0 | 0.0% |
| Hispanic or Latino | 49 | 3.4% |
| Native / Alaskan | 29 | 2.0% |
| White / Caucasian | 1,184 | 81.2% |
| Two or more Races | 178 | 12.2% |
| Some other Race | 49 | 3.4% |
| Total | 1,458 | 100.0% |
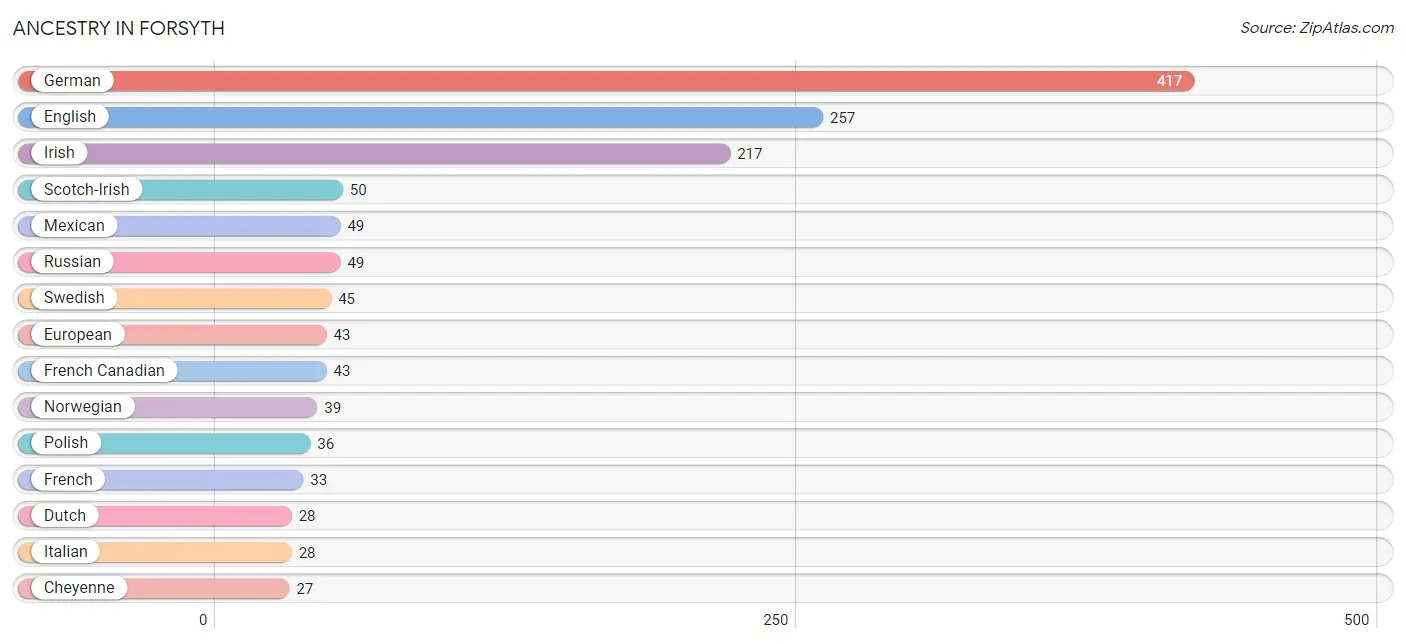
Ancestry in Forsyth
The most populous ancestries reported in Forsyth are German (417 | 28.6%), English (257 | 17.6%), Irish (217 | 14.9%), Scotch-Irish (50 | 3.4%), and Mexican (49 | 3.4%), together accounting for 67.9% of all Forsyth residents.
| Ancestry | # Population | % Population |
| American | 18 | 1.2% |
| Cheyenne | 27 | 1.8% |
| Czechoslovakian | 6 | 0.4% |
| Danish | 14 | 1.0% |
| Dutch | 28 | 1.9% |
| Eastern European | 5 | 0.3% |
| English | 257 | 17.6% |
| European | 43 | 2.9% |
| Finnish | 14 | 1.0% |
| French | 33 | 2.3% |
| French Canadian | 43 | 2.9% |
| German | 417 | 28.6% |
| Irish | 217 | 14.9% |
| Italian | 28 | 1.9% |
| Korean | 18 | 1.2% |
| Mexican | 49 | 3.4% |
| Norwegian | 39 | 2.7% |
| Polish | 36 | 2.5% |
| Russian | 49 | 3.4% |
| Scotch-Irish | 50 | 3.4% |
| Scottish | 19 | 1.3% |
| Sioux | 26 | 1.8% |
| Swedish | 45 | 3.1% |
| Ukrainian | 20 | 1.4% |
| Welsh | 14 | 1.0% | View All 25 Rows |
Immigrants in Forsyth
The most numerous immigrant groups reported in Forsyth came from Asia (16 | 1.1%), Philippines (16 | 1.1%), South Eastern Asia (16 | 1.1%), and Canada (14 | 1.0%), together accounting for 4.3% of all Forsyth residents.
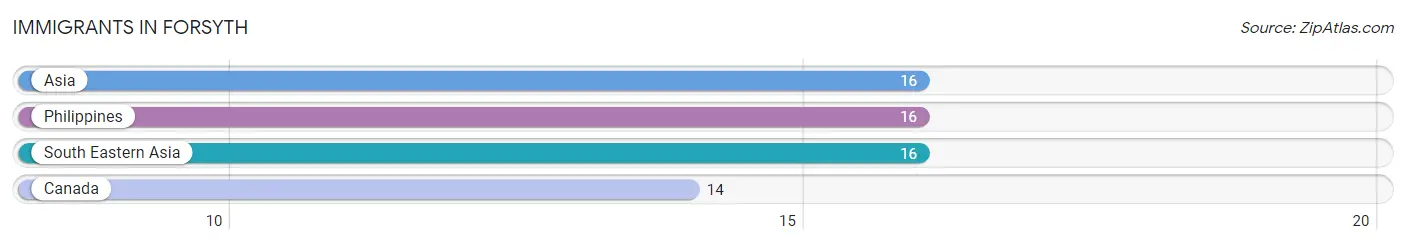
| Immigration Origin | # Population | % Population |
| Asia | 16 | 1.1% |
| Canada | 14 | 1.0% |
| Philippines | 16 | 1.1% |
| South Eastern Asia | 16 | 1.1% | View All 4 Rows |
Sex and Age in Forsyth
Sex and Age in Forsyth
The most populous age groups in Forsyth are 70 to 74 Years (107 | 14.6%) for men and 65 to 69 Years (105 | 14.5%) for women.
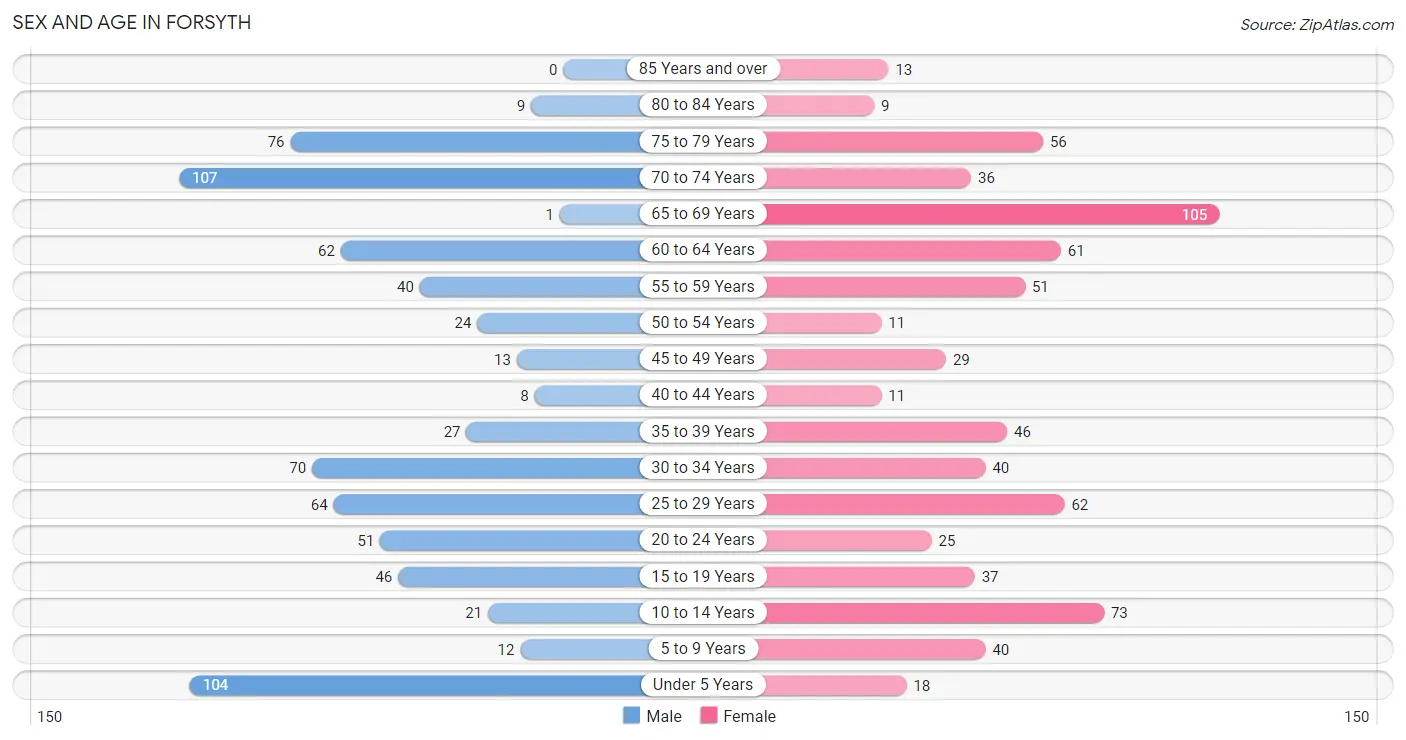
| Age Bracket | Male | Female |
| Under 5 Years | 104 (14.1%) | 18 (2.5%) |
| 5 to 9 Years | 12 (1.6%) | 40 (5.5%) |
| 10 to 14 Years | 21 (2.9%) | 73 (10.1%) |
| 15 to 19 Years | 46 (6.3%) | 37 (5.1%) |
| 20 to 24 Years | 51 (6.9%) | 25 (3.5%) |
| 25 to 29 Years | 64 (8.7%) | 62 (8.6%) |
| 30 to 34 Years | 70 (9.5%) | 40 (5.5%) |
| 35 to 39 Years | 27 (3.7%) | 46 (6.4%) |
| 40 to 44 Years | 8 (1.1%) | 11 (1.5%) |
| 45 to 49 Years | 13 (1.8%) | 29 (4.0%) |
| 50 to 54 Years | 24 (3.3%) | 11 (1.5%) |
| 55 to 59 Years | 40 (5.4%) | 51 (7.0%) |
| 60 to 64 Years | 62 (8.4%) | 61 (8.4%) |
| 65 to 69 Years | 1 (0.1%) | 105 (14.5%) |
| 70 to 74 Years | 107 (14.6%) | 36 (5.0%) |
| 75 to 79 Years | 76 (10.3%) | 56 (7.7%) |
| 80 to 84 Years | 9 (1.2%) | 9 (1.2%) |
| 85 Years and over | 0 (0.0%) | 13 (1.8%) |
| Total | 735 (100.0%) | 723 (100.0%) |
Families and Households in Forsyth
Median Family Size in Forsyth
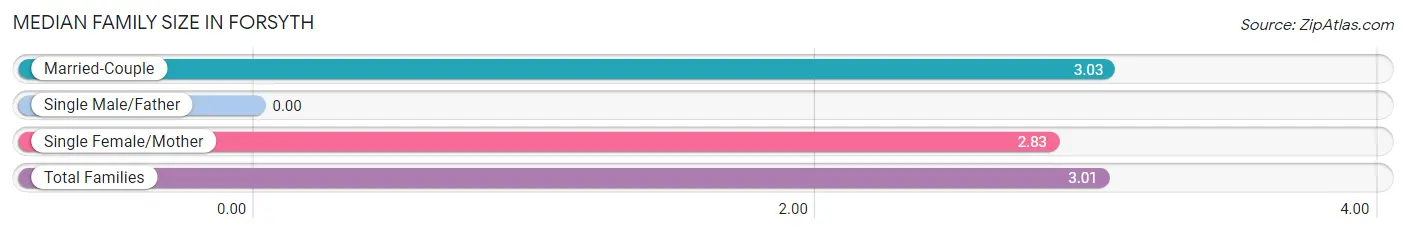
| Family Type | # Families | Family Size |
| Married-Couple | 322 (88.5%) | 3.03 |
| Single Male/Father | 0 (0.0%) | - |
| Single Female/Mother | 42 (11.5%) | 2.83 |
| Total Families | 364 (100.0%) | 3.01 |
Median Household Size in Forsyth
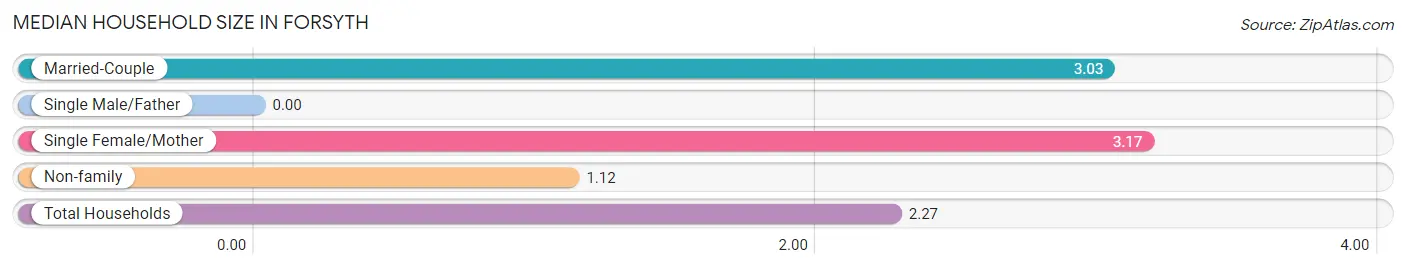
| Household Type | # Households | Household Size |
| Married-Couple | 322 (52.4%) | 3.03 |
| Single Male/Father | 0 (0.0%) | - |
| Single Female/Mother | 42 (6.8%) | 3.17 |
| Non-family | 250 (40.7%) | 1.12 |
| Total Households | 614 (100.0%) | 2.27 |
Household Size by Marriage Status in Forsyth
Out of a total of 614 households in Forsyth, 364 (59.3%) are family households, while 250 (40.7%) are nonfamily households. The most numerous type of family households are 2-person households, comprising 205, and the most common type of nonfamily households are 1-person households, comprising 232.
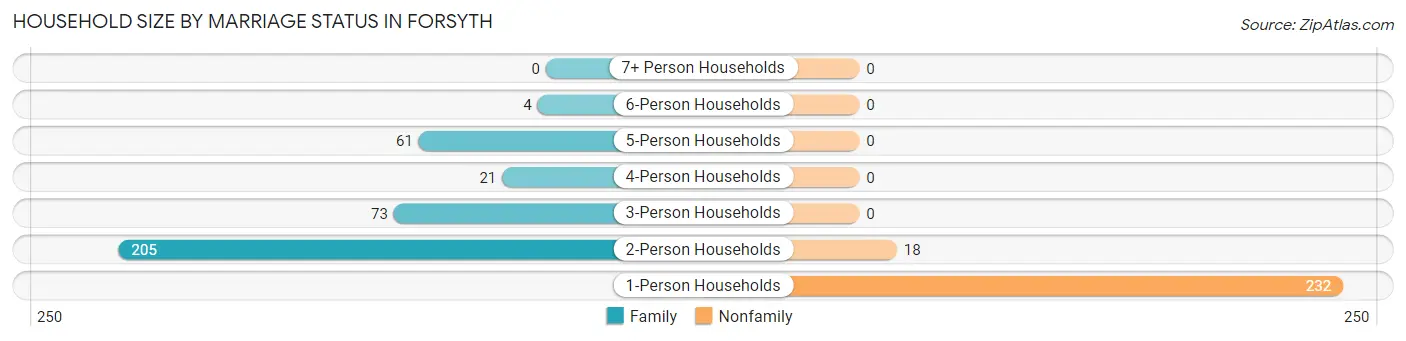
| Household Size | Family Households | Nonfamily Households |
| 1-Person Households | - | 232 (37.8%) |
| 2-Person Households | 205 (33.4%) | 18 (2.9%) |
| 3-Person Households | 73 (11.9%) | 0 (0.0%) |
| 4-Person Households | 21 (3.4%) | 0 (0.0%) |
| 5-Person Households | 61 (9.9%) | 0 (0.0%) |
| 6-Person Households | 4 (0.6%) | 0 (0.0%) |
| 7+ Person Households | 0 (0.0%) | 0 (0.0%) |
| Total | 364 (59.3%) | 250 (40.7%) |
Female Fertility in Forsyth
Fertility by Age in Forsyth
Average fertility rate in Forsyth is 192.0 births per 1,000 women. Women in the age bracket of 35 to 50 years have the highest fertility rate with 267.0 births per 1,000 women. Women in the age bracket of 20 to 34 years acount for 52.1% of all women with births.
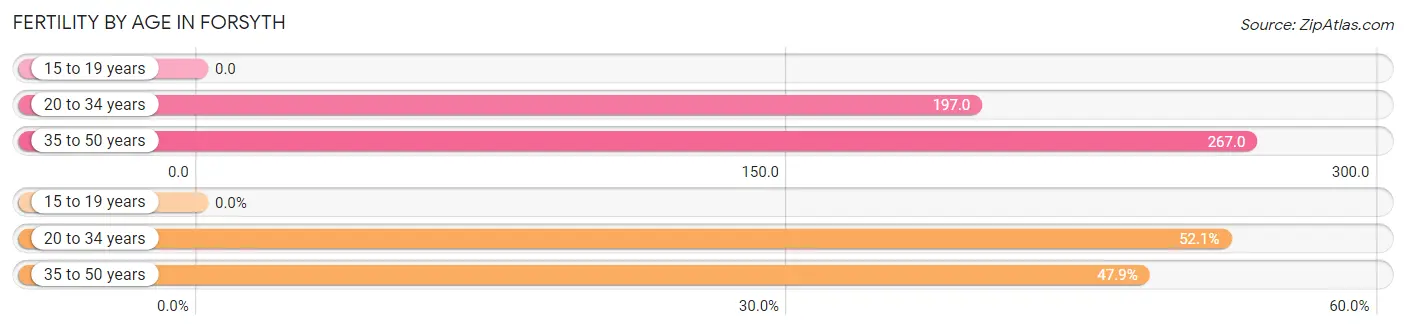
| Age Bracket | Women with Births | Births / 1,000 Women |
| 15 to 19 years | 0 (0.0%) | 0.0 |
| 20 to 34 years | 25 (52.1%) | 197.0 |
| 35 to 50 years | 23 (47.9%) | 267.0 |
| Total | 48 (100.0%) | 192.0 |
Fertility by Age by Marriage Status in Forsyth
87.5% of women with births (48) in Forsyth are married. The highest percentage of unmarried women with births falls into 20 to 34 years age bracket with 24.0% of them unmarried at the time of birth, while the lowest percentage of unmarried women with births belong to 35 to 50 years age bracket with 0.0% of them unmarried.
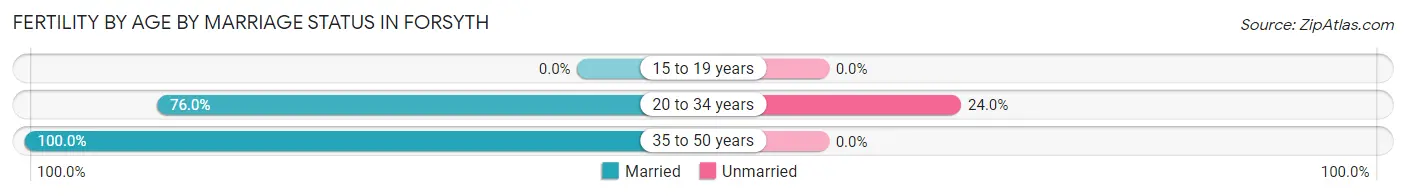
| Age Bracket | Married | Unmarried |
| 15 to 19 years | 0 (0.0%) | 0 (0.0%) |
| 20 to 34 years | 19 (76.0%) | 6 (24.0%) |
| 35 to 50 years | 23 (100.0%) | 0 (0.0%) |
| Total | 42 (87.5%) | 6 (12.5%) |
Fertility by Education in Forsyth
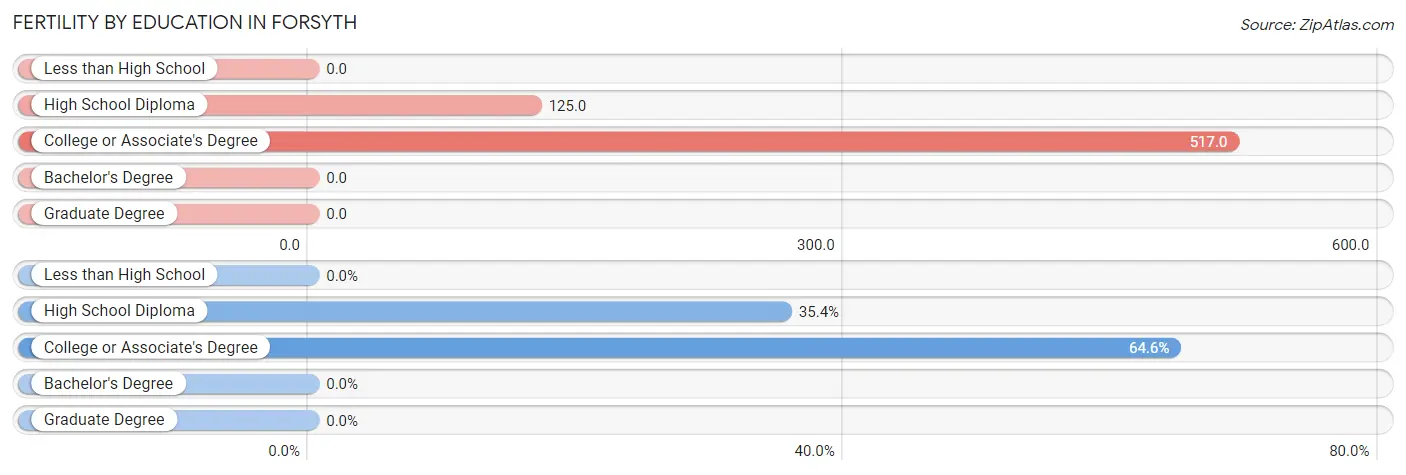
| Educational Attainment | Women with Births | Births / 1,000 Women |
| Less than High School | 0 (0.0%) | 0.0 |
| High School Diploma | 17 (35.4%) | 125.0 |
| College or Associate's Degree | 31 (64.6%) | 517.0 |
| Bachelor's Degree | 0 (0.0%) | 0.0 |
| Graduate Degree | 0 (0.0%) | 0.0 |
| Total | 48 (100.0%) | 192.0 |
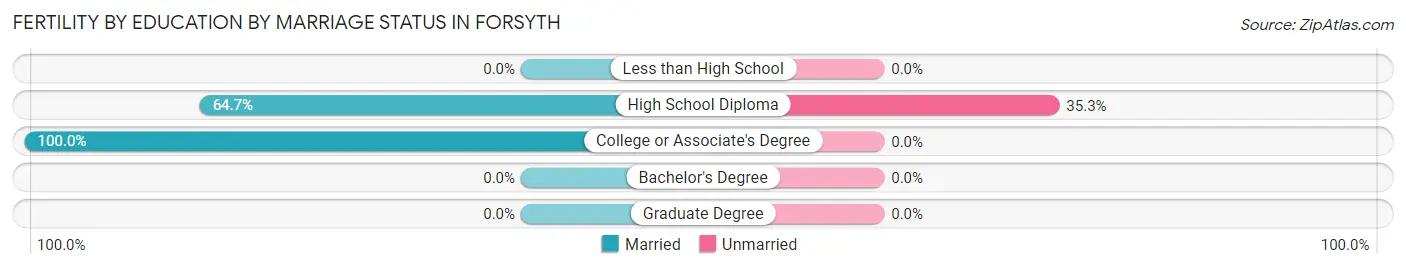
Fertility by Education by Marriage Status in Forsyth
12.5% of women with births in Forsyth are unmarried. Women with the educational attainment of college or associate's degree are most likely to be married with 100.0% of them married at childbirth, while women with the educational attainment of high school diploma are least likely to be married with 35.3% of them unmarried at childbirth.
| Educational Attainment | Married | Unmarried |
| Less than High School | 0 (0.0%) | 0 (0.0%) |
| High School Diploma | 11 (64.7%) | 6 (35.3%) |
| College or Associate's Degree | 31 (100.0%) | 0 (0.0%) |
| Bachelor's Degree | 0 (0.0%) | 0 (0.0%) |
| Graduate Degree | 0 (0.0%) | 0 (0.0%) |
| Total | 42 (87.5%) | 6 (12.5%) |
Employment Characteristics in Forsyth
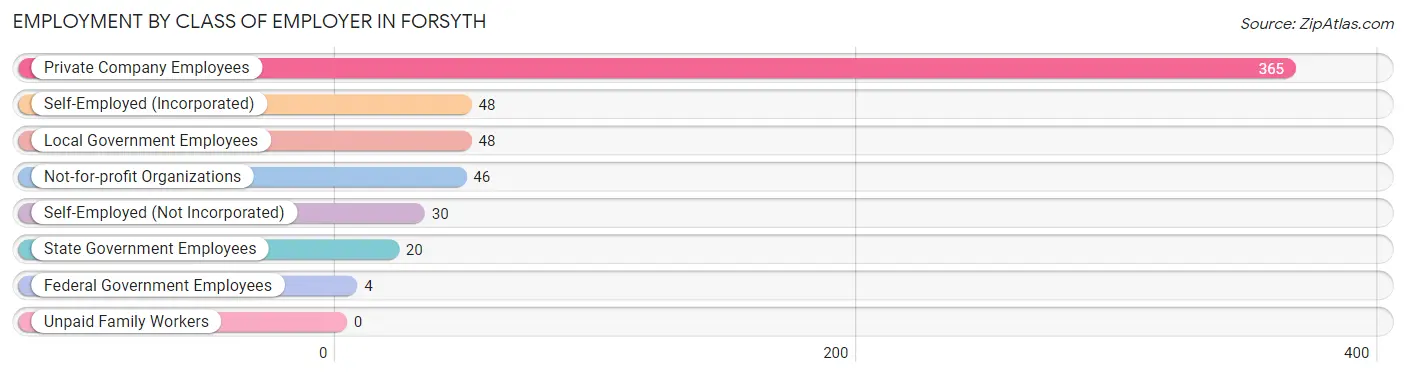
Employment by Class of Employer in Forsyth
Among the 561 employed individuals in Forsyth, private company employees (365 | 65.1%), self-employed (incorporated) (48 | 8.6%), and local government employees (48 | 8.6%) make up the most common classes of employment.
| Employer Class | # Employees | % Employees |
| Private Company Employees | 365 | 65.1% |
| Self-Employed (Incorporated) | 48 | 8.6% |
| Self-Employed (Not Incorporated) | 30 | 5.3% |
| Not-for-profit Organizations | 46 | 8.2% |
| Local Government Employees | 48 | 8.6% |
| State Government Employees | 20 | 3.6% |
| Federal Government Employees | 4 | 0.7% |
| Unpaid Family Workers | 0 | 0.0% |
| Total | 561 | 100.0% |
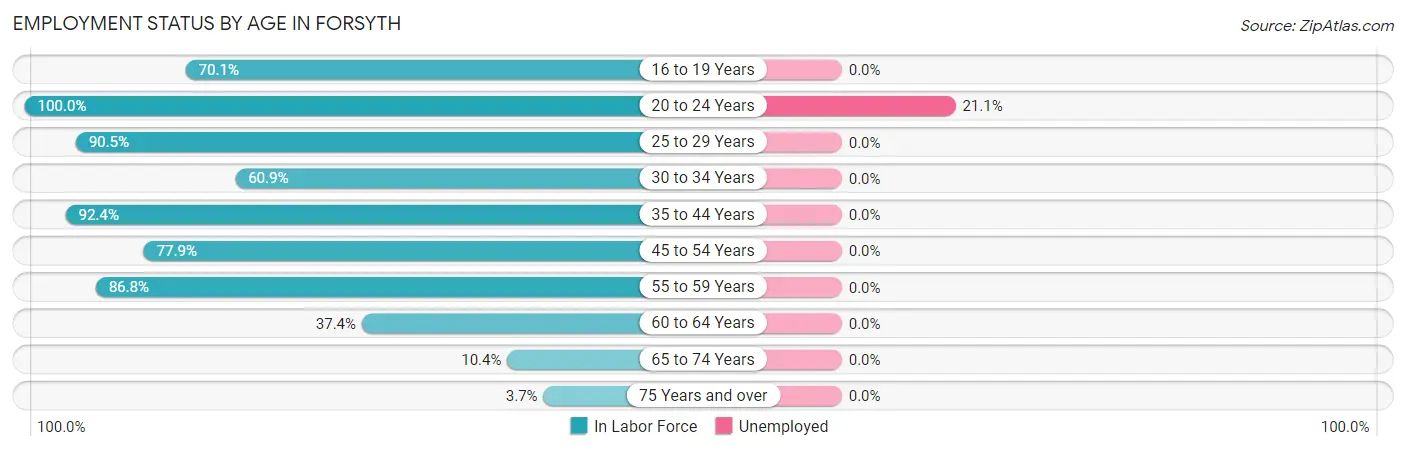
Employment Status by Age in Forsyth
According to the labor force statistics for Forsyth, out of the total population over 16 years of age (1,184), 51.8% or 613 individuals are in the labor force, with 2.6% or 16 of them unemployed. The age group with the highest labor force participation rate is 20 to 24 years, with 100.0% or 76 individuals in the labor force. Within the labor force, the 20 to 24 years age range has the highest percentage of unemployed individuals, with 21.1% or 16 of them being unemployed.
| Age Bracket | In Labor Force | Unemployed |
| 16 to 19 Years | 54 (70.1%) | 0 (0.0%) |
| 20 to 24 Years | 76 (100.0%) | 16 (21.1%) |
| 25 to 29 Years | 114 (90.5%) | 0 (0.0%) |
| 30 to 34 Years | 67 (60.9%) | 0 (0.0%) |
| 35 to 44 Years | 85 (92.4%) | 0 (0.0%) |
| 45 to 54 Years | 60 (77.9%) | 0 (0.0%) |
| 55 to 59 Years | 79 (86.8%) | 0 (0.0%) |
| 60 to 64 Years | 46 (37.4%) | 0 (0.0%) |
| 65 to 74 Years | 26 (10.4%) | 0 (0.0%) |
| 75 Years and over | 6 (3.7%) | 0 (0.0%) |
| Total | 613 (51.8%) | 16 (2.6%) |
Employment Status by Educational Attainment in Forsyth
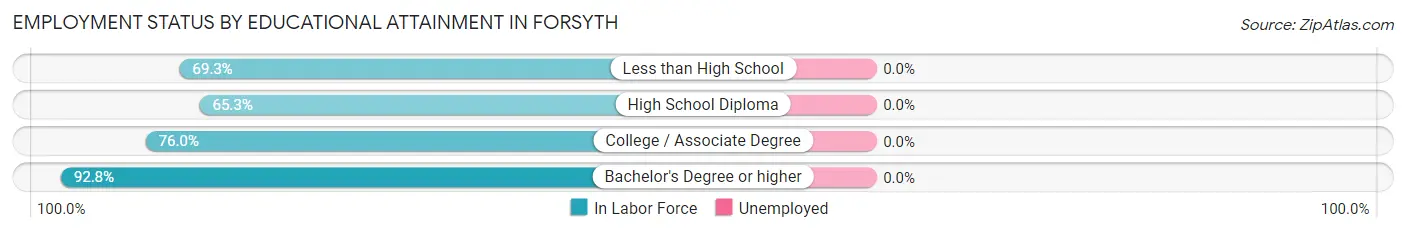
| Educational Attainment | In Labor Force | Unemployed |
| Less than High School | 52 (69.3%) | 0 (0.0%) |
| High School Diploma | 158 (65.3%) | 0 (0.0%) |
| College / Associate Degree | 177 (76.0%) | 0 (0.0%) |
| Bachelor's Degree or higher | 64 (92.8%) | 0 (0.0%) |
| Total | 451 (72.9%) | 0 (0.0%) |
Employment Occupations by Sex in Forsyth
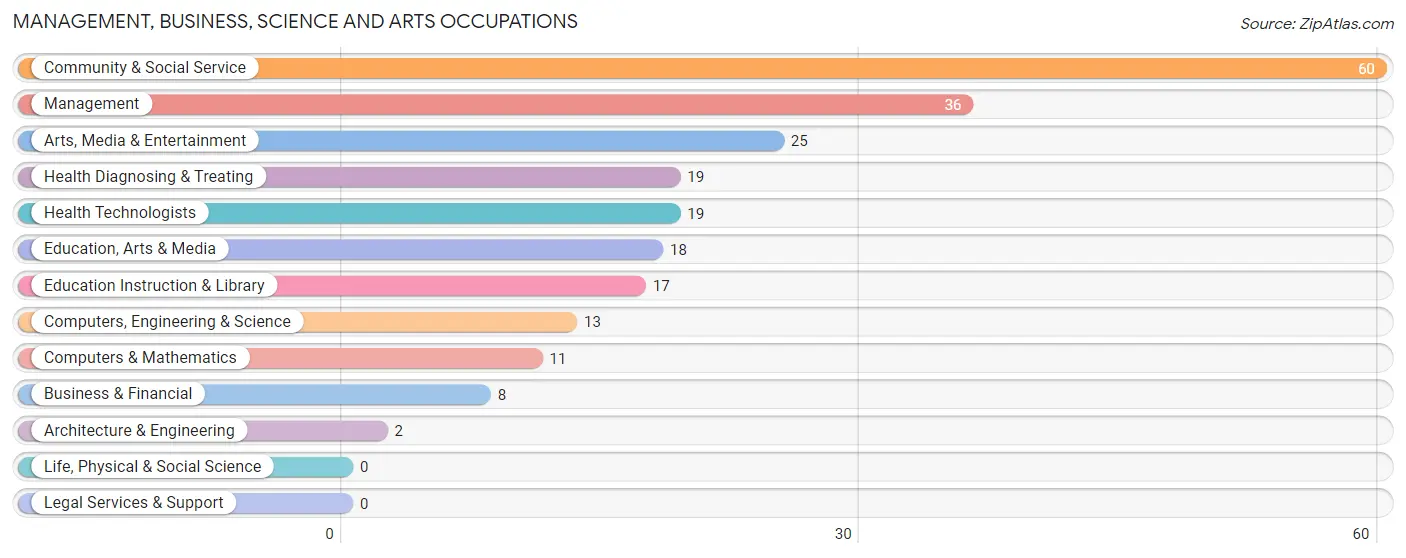
Management, Business, Science and Arts Occupations
The most common Management, Business, Science and Arts occupations in Forsyth are Community & Social Service (60 | 10.1%), Management (36 | 6.0%), Arts, Media & Entertainment (25 | 4.2%), Health Diagnosing & Treating (19 | 3.2%), and Health Technologists (19 | 3.2%).
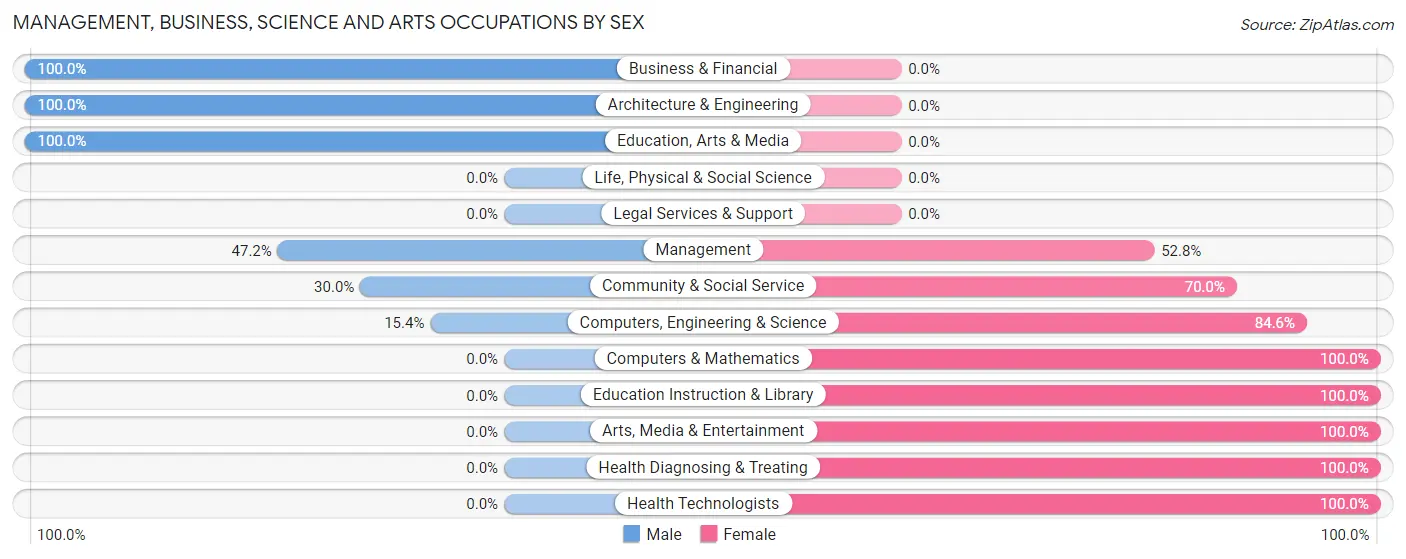
Management, Business, Science and Arts Occupations by Sex
Within the Management, Business, Science and Arts occupations in Forsyth, the most male-oriented occupations are Business & Financial (100.0%), Architecture & Engineering (100.0%), and Education, Arts & Media (100.0%), while the most female-oriented occupations are Computers & Mathematics (100.0%), Education Instruction & Library (100.0%), and Arts, Media & Entertainment (100.0%).
| Occupation | Male | Female |
| Management | 17 (47.2%) | 19 (52.8%) |
| Business & Financial | 8 (100.0%) | 0 (0.0%) |
| Computers, Engineering & Science | 2 (15.4%) | 11 (84.6%) |
| Computers & Mathematics | 0 (0.0%) | 11 (100.0%) |
| Architecture & Engineering | 2 (100.0%) | 0 (0.0%) |
| Life, Physical & Social Science | 0 (0.0%) | 0 (0.0%) |
| Community & Social Service | 18 (30.0%) | 42 (70.0%) |
| Education, Arts & Media | 18 (100.0%) | 0 (0.0%) |
| Legal Services & Support | 0 (0.0%) | 0 (0.0%) |
| Education Instruction & Library | 0 (0.0%) | 17 (100.0%) |
| Arts, Media & Entertainment | 0 (0.0%) | 25 (100.0%) |
| Health Diagnosing & Treating | 0 (0.0%) | 19 (100.0%) |
| Health Technologists | 0 (0.0%) | 19 (100.0%) |
| Total (Category) | 45 (33.1%) | 91 (66.9%) |
| Total (Overall) | 322 (53.9%) | 275 (46.1%) |
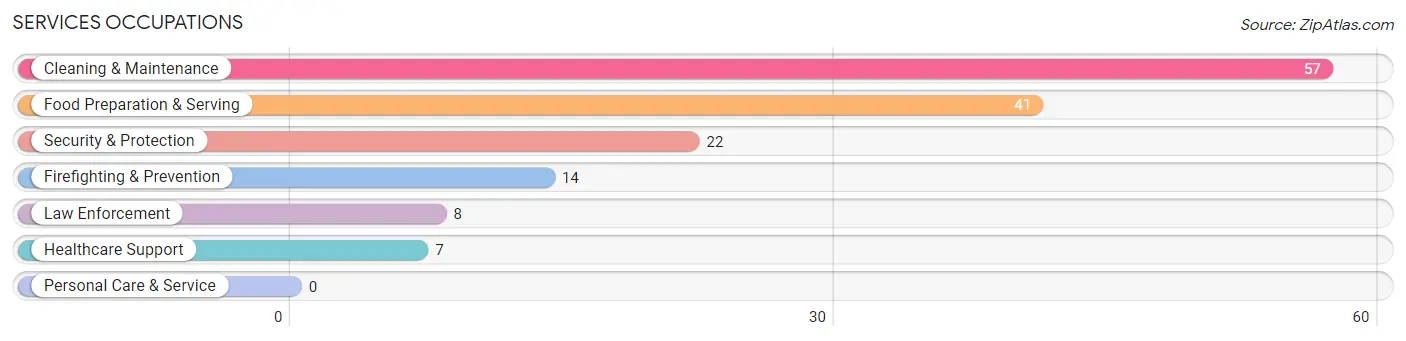
Services Occupations
The most common Services occupations in Forsyth are Cleaning & Maintenance (57 | 9.6%), Food Preparation & Serving (41 | 6.9%), Security & Protection (22 | 3.7%), Firefighting & Prevention (14 | 2.4%), and Law Enforcement (8 | 1.3%).
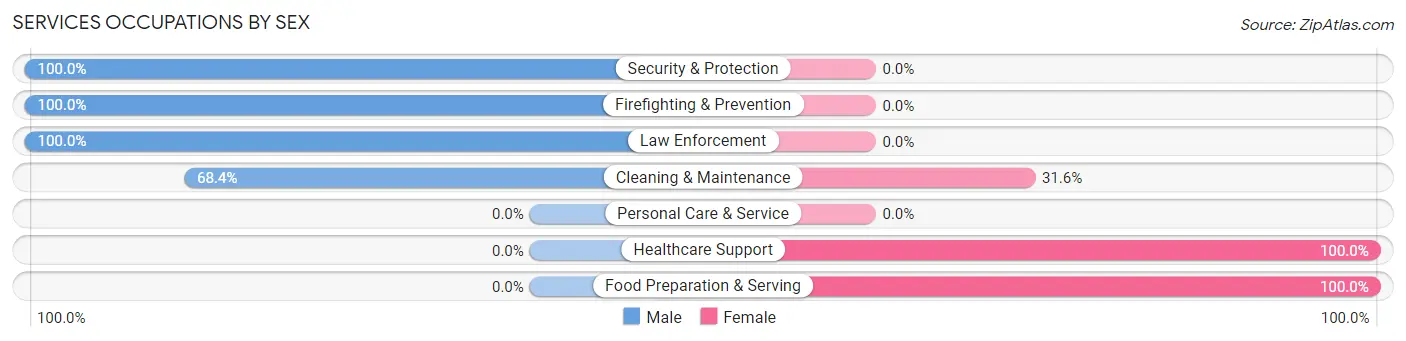
Services Occupations by Sex
Within the Services occupations in Forsyth, the most male-oriented occupations are Security & Protection (100.0%), Firefighting & Prevention (100.0%), and Law Enforcement (100.0%), while the most female-oriented occupations are Healthcare Support (100.0%), Food Preparation & Serving (100.0%), and Cleaning & Maintenance (31.6%).
| Occupation | Male | Female |
| Healthcare Support | 0 (0.0%) | 7 (100.0%) |
| Security & Protection | 22 (100.0%) | 0 (0.0%) |
| Firefighting & Prevention | 14 (100.0%) | 0 (0.0%) |
| Law Enforcement | 8 (100.0%) | 0 (0.0%) |
| Food Preparation & Serving | 0 (0.0%) | 41 (100.0%) |
| Cleaning & Maintenance | 39 (68.4%) | 18 (31.6%) |
| Personal Care & Service | 0 (0.0%) | 0 (0.0%) |
| Total (Category) | 61 (48.0%) | 66 (52.0%) |
| Total (Overall) | 322 (53.9%) | 275 (46.1%) |
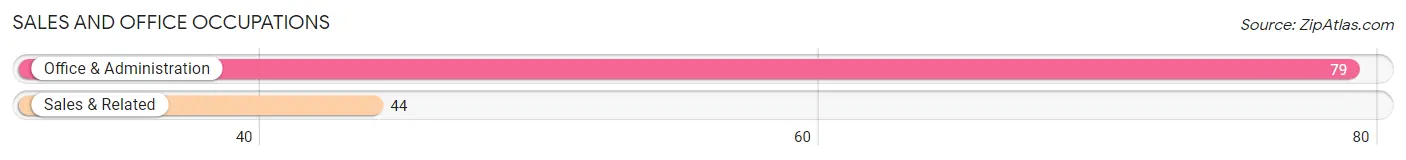
Sales and Office Occupations
The most common Sales and Office occupations in Forsyth are Office & Administration (79 | 13.2%), and Sales & Related (44 | 7.4%).
Sales and Office Occupations by Sex
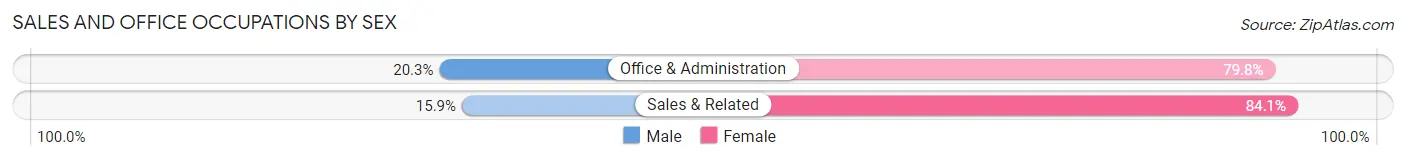
| Occupation | Male | Female |
| Sales & Related | 7 (15.9%) | 37 (84.1%) |
| Office & Administration | 16 (20.3%) | 63 (79.7%) |
| Total (Category) | 23 (18.7%) | 100 (81.3%) |
| Total (Overall) | 322 (53.9%) | 275 (46.1%) |
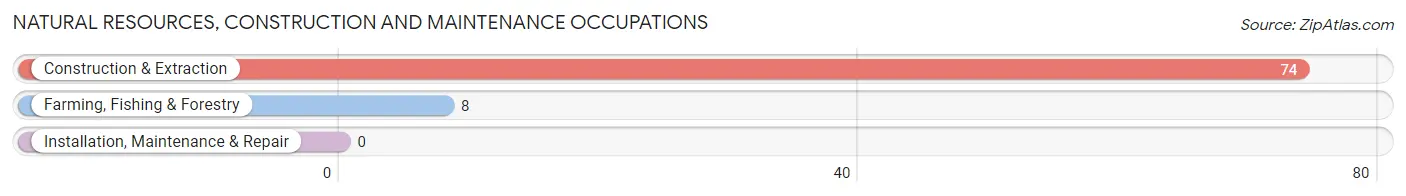
Natural Resources, Construction and Maintenance Occupations
The most common Natural Resources, Construction and Maintenance occupations in Forsyth are Construction & Extraction (74 | 12.4%), and Farming, Fishing & Forestry (8 | 1.3%).
Natural Resources, Construction and Maintenance Occupations by Sex
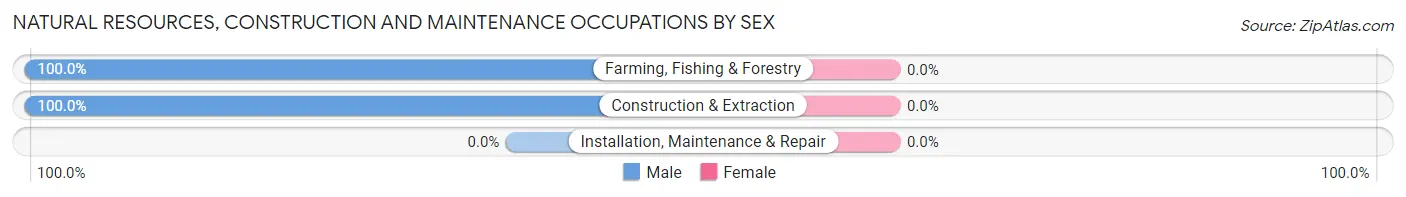
| Occupation | Male | Female |
| Farming, Fishing & Forestry | 8 (100.0%) | 0 (0.0%) |
| Construction & Extraction | 74 (100.0%) | 0 (0.0%) |
| Installation, Maintenance & Repair | 0 (0.0%) | 0 (0.0%) |
| Total (Category) | 82 (100.0%) | 0 (0.0%) |
| Total (Overall) | 322 (53.9%) | 275 (46.1%) |
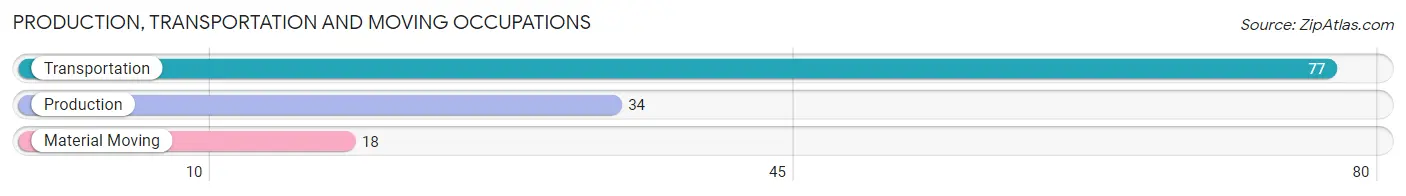
Production, Transportation and Moving Occupations
The most common Production, Transportation and Moving occupations in Forsyth are Transportation (77 | 12.9%), Production (34 | 5.7%), and Material Moving (18 | 3.0%).
Production, Transportation and Moving Occupations by Sex
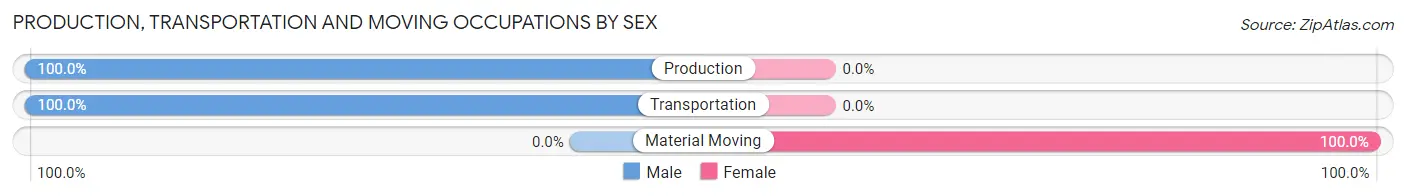
| Occupation | Male | Female |
| Production | 34 (100.0%) | 0 (0.0%) |
| Transportation | 77 (100.0%) | 0 (0.0%) |
| Material Moving | 0 (0.0%) | 18 (100.0%) |
| Total (Category) | 111 (86.1%) | 18 (14.0%) |
| Total (Overall) | 322 (53.9%) | 275 (46.1%) |
Employment Industries by Sex in Forsyth
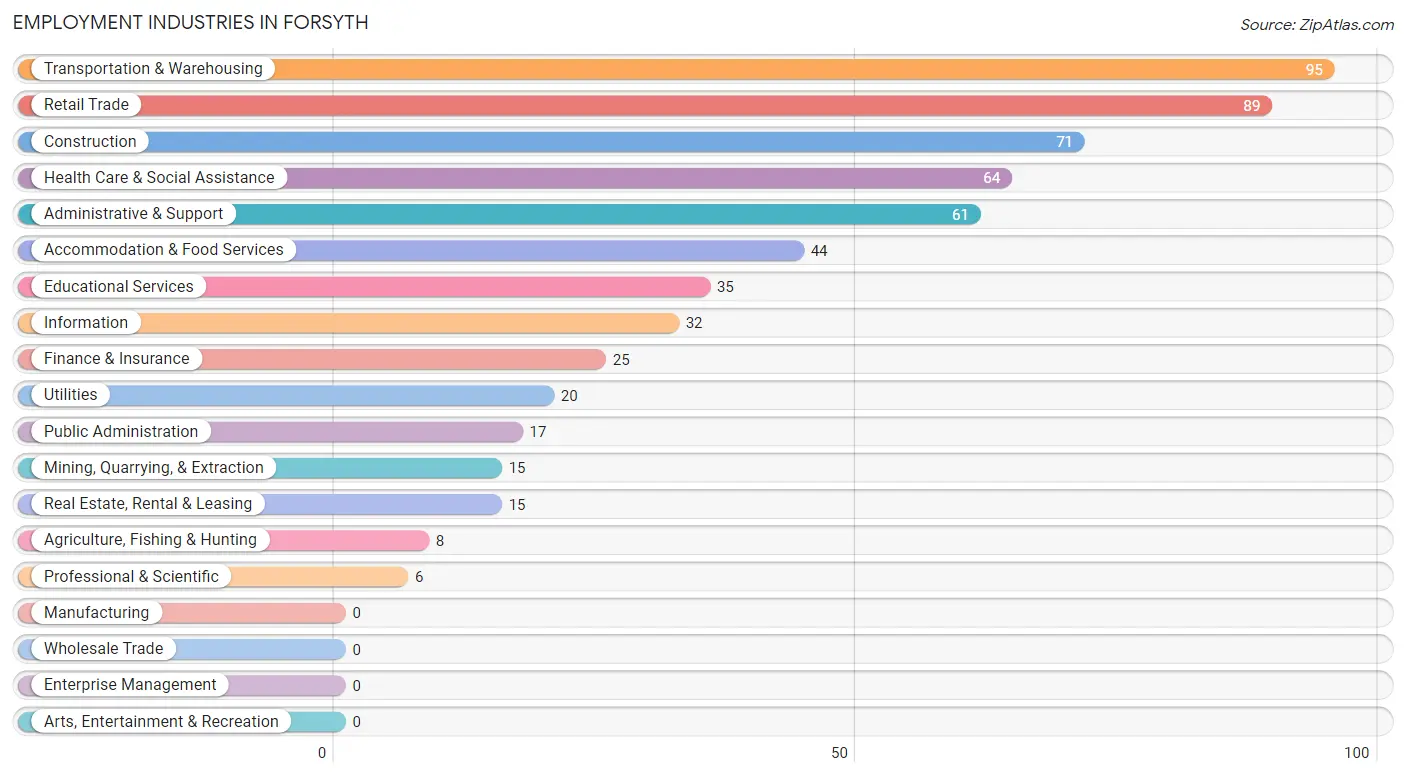
Employment Industries in Forsyth
The major employment industries in Forsyth include Transportation & Warehousing (95 | 15.9%), Retail Trade (89 | 14.9%), Construction (71 | 11.9%), Health Care & Social Assistance (64 | 10.7%), and Administrative & Support (61 | 10.2%).
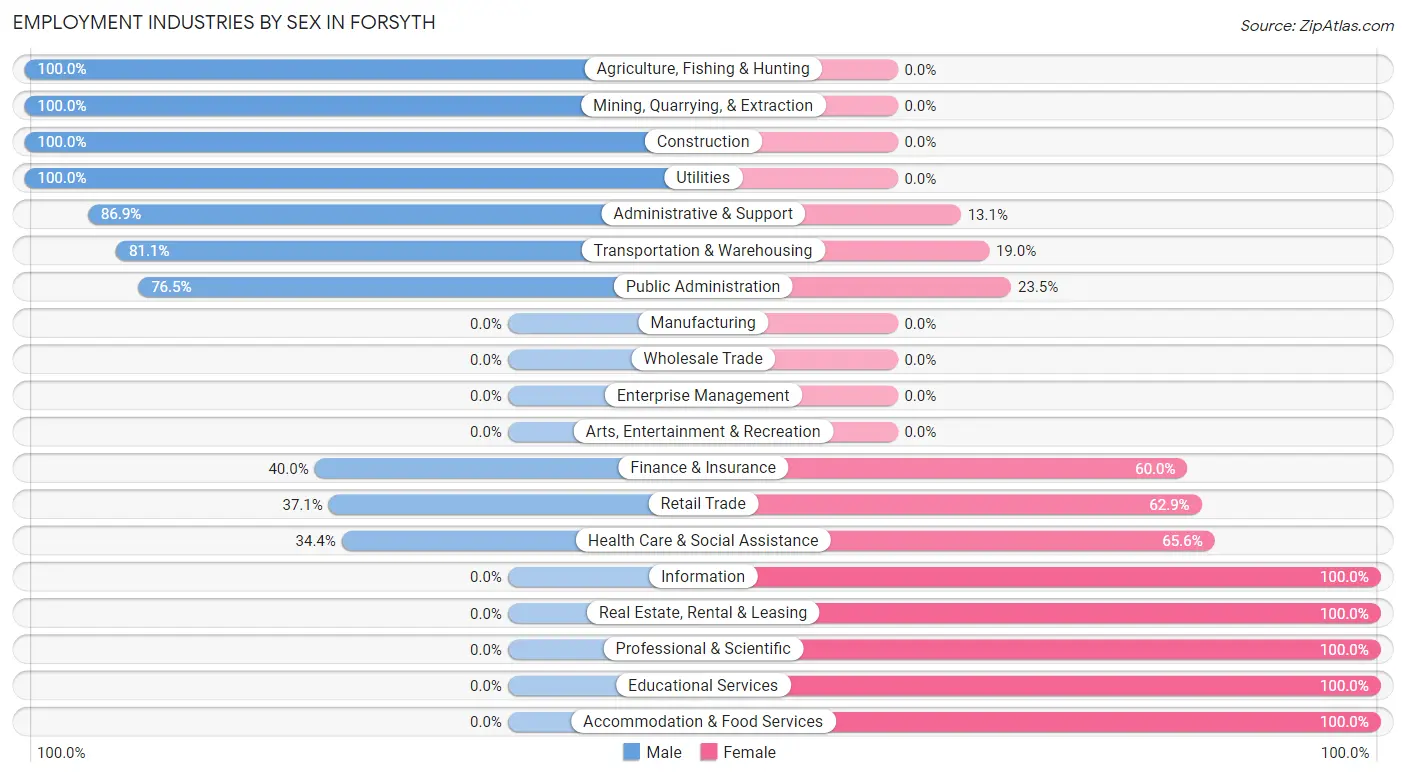
Employment Industries by Sex in Forsyth
The Forsyth industries that see more men than women are Agriculture, Fishing & Hunting (100.0%), Mining, Quarrying, & Extraction (100.0%), and Construction (100.0%), whereas the industries that tend to have a higher number of women are Information (100.0%), Real Estate, Rental & Leasing (100.0%), and Professional & Scientific (100.0%).
| Industry | Male | Female |
| Agriculture, Fishing & Hunting | 8 (100.0%) | 0 (0.0%) |
| Mining, Quarrying, & Extraction | 15 (100.0%) | 0 (0.0%) |
| Construction | 71 (100.0%) | 0 (0.0%) |
| Manufacturing | 0 (0.0%) | 0 (0.0%) |
| Wholesale Trade | 0 (0.0%) | 0 (0.0%) |
| Retail Trade | 33 (37.1%) | 56 (62.9%) |
| Transportation & Warehousing | 77 (81.0%) | 18 (19.0%) |
| Utilities | 20 (100.0%) | 0 (0.0%) |
| Information | 0 (0.0%) | 32 (100.0%) |
| Finance & Insurance | 10 (40.0%) | 15 (60.0%) |
| Real Estate, Rental & Leasing | 0 (0.0%) | 15 (100.0%) |
| Professional & Scientific | 0 (0.0%) | 6 (100.0%) |
| Enterprise Management | 0 (0.0%) | 0 (0.0%) |
| Administrative & Support | 53 (86.9%) | 8 (13.1%) |
| Educational Services | 0 (0.0%) | 35 (100.0%) |
| Health Care & Social Assistance | 22 (34.4%) | 42 (65.6%) |
| Arts, Entertainment & Recreation | 0 (0.0%) | 0 (0.0%) |
| Accommodation & Food Services | 0 (0.0%) | 44 (100.0%) |
| Public Administration | 13 (76.5%) | 4 (23.5%) |
| Total | 322 (53.9%) | 275 (46.1%) |
Education in Forsyth
School Enrollment in Forsyth
The most common levels of schooling among the 162 students in Forsyth are middle school (43 | 26.5%), elementary school (32 | 19.8%), and high school (28 | 17.3%).
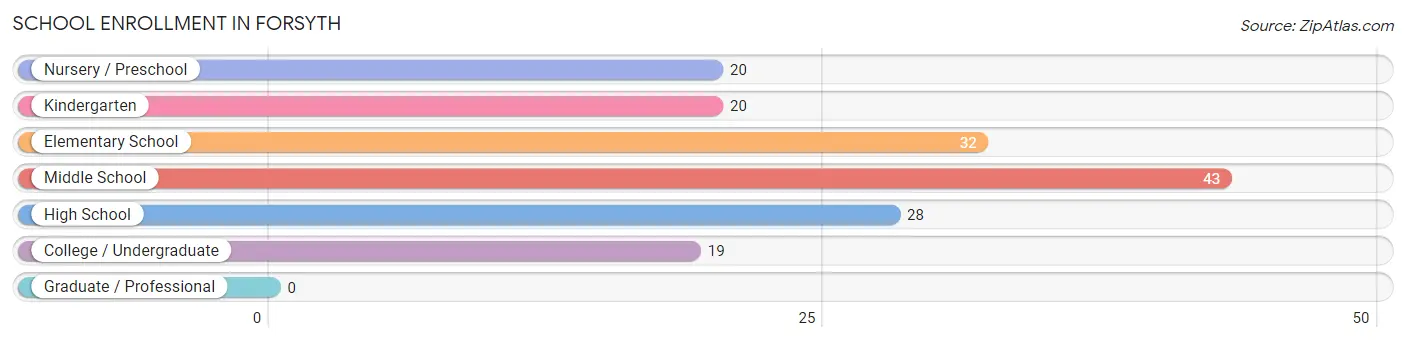
| School Level | # Students | % Students |
| Nursery / Preschool | 20 | 12.3% |
| Kindergarten | 20 | 12.3% |
| Elementary School | 32 | 19.8% |
| Middle School | 43 | 26.5% |
| High School | 28 | 17.3% |
| College / Undergraduate | 19 | 11.7% |
| Graduate / Professional | 0 | 0.0% |
| Total | 162 | 100.0% |
School Enrollment by Age by Funding Source in Forsyth
Out of a total of 162 students who are enrolled in schools in Forsyth, 13 (8.0%) attend a private institution, while the remaining 149 (92.0%) are enrolled in public schools. The age group of 15 to 17 year olds has the highest likelihood of being enrolled in private schools, with 13 (46.4% in the age bracket) enrolled. Conversely, the age group of 5 to 9 year old has the lowest likelihood of being enrolled in a private school, with 52 (100.0% in the age bracket) attending a public institution.
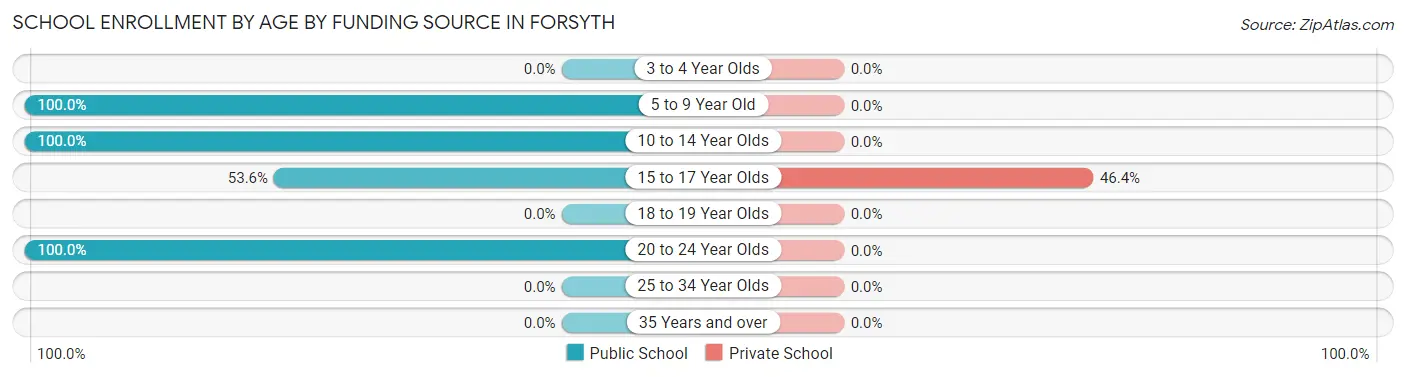
| Age Bracket | Public School | Private School |
| 3 to 4 Year Olds | 0 (0.0%) | 0 (0.0%) |
| 5 to 9 Year Old | 52 (100.0%) | 0 (0.0%) |
| 10 to 14 Year Olds | 63 (100.0%) | 0 (0.0%) |
| 15 to 17 Year Olds | 15 (53.6%) | 13 (46.4%) |
| 18 to 19 Year Olds | 0 (0.0%) | 0 (0.0%) |
| 20 to 24 Year Olds | 19 (100.0%) | 0 (0.0%) |
| 25 to 34 Year Olds | 0 (0.0%) | 0 (0.0%) |
| 35 Years and over | 0 (0.0%) | 0 (0.0%) |
| Total | 149 (92.0%) | 13 (8.0%) |
Educational Attainment by Field of Study in Forsyth
Science & technology (42 | 22.7%), education (35 | 18.9%), business (25 | 13.5%), bio, nature & agricultural (20 | 10.8%), and arts & humanities (15 | 8.1%) are the most common fields of study among 185 individuals in Forsyth who have obtained a bachelor's degree or higher.
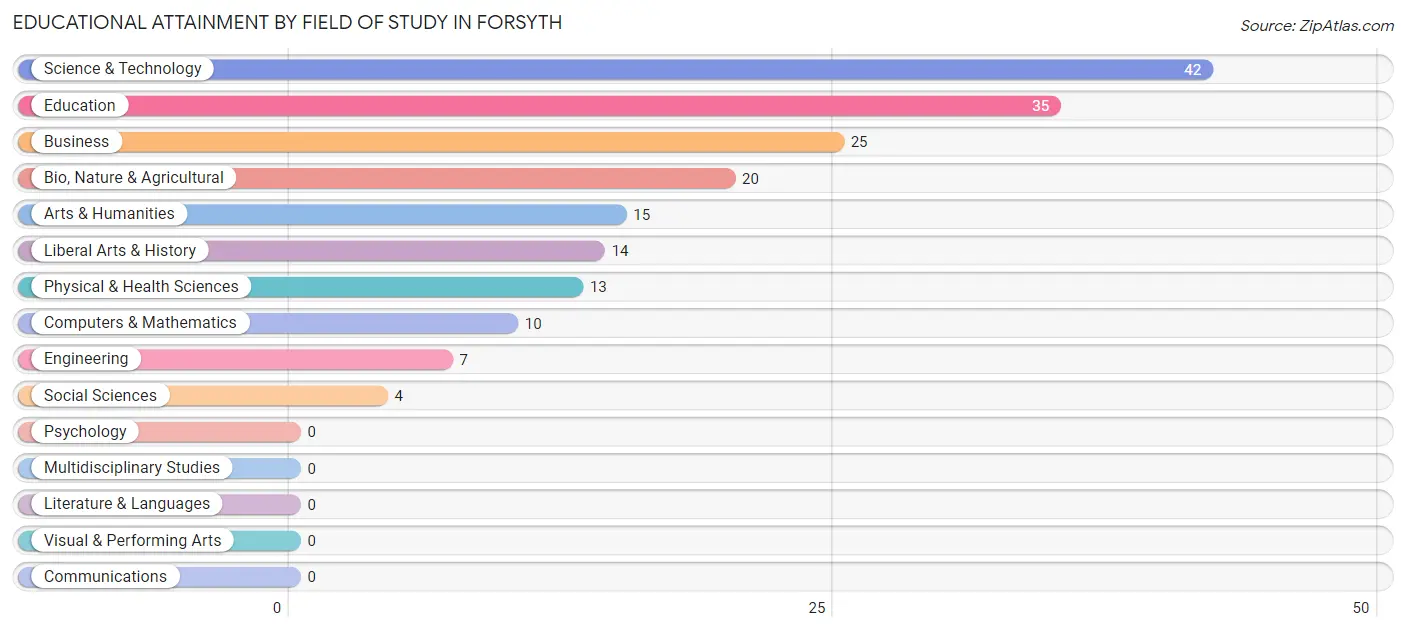
| Field of Study | # Graduates | % Graduates |
| Computers & Mathematics | 10 | 5.4% |
| Bio, Nature & Agricultural | 20 | 10.8% |
| Physical & Health Sciences | 13 | 7.0% |
| Psychology | 0 | 0.0% |
| Social Sciences | 4 | 2.2% |
| Engineering | 7 | 3.8% |
| Multidisciplinary Studies | 0 | 0.0% |
| Science & Technology | 42 | 22.7% |
| Business | 25 | 13.5% |
| Education | 35 | 18.9% |
| Literature & Languages | 0 | 0.0% |
| Liberal Arts & History | 14 | 7.6% |
| Visual & Performing Arts | 0 | 0.0% |
| Communications | 0 | 0.0% |
| Arts & Humanities | 15 | 8.1% |
| Total | 185 | 100.0% |
Transportation & Commute in Forsyth
Vehicle Availability by Sex in Forsyth
The most prevalent vehicle ownership categories in Forsyth are males with 2 vehicles (113, accounting for 39.8%) and females with 2 vehicles (73, making up 41.7%).
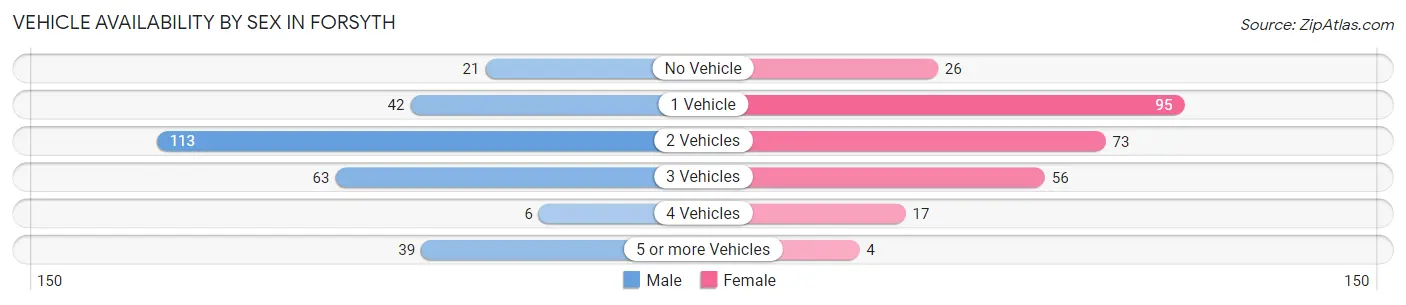
| Vehicles Available | Male | Female |
| No Vehicle | 21 (7.4%) | 26 (9.6%) |
| 1 Vehicle | 42 (14.8%) | 95 (35.1%) |
| 2 Vehicles | 113 (39.8%) | 73 (26.9%) |
| 3 Vehicles | 63 (22.2%) | 56 (20.7%) |
| 4 Vehicles | 6 (2.1%) | 17 (6.3%) |
| 5 or more Vehicles | 39 (13.7%) | 4 (1.5%) |
| Total | 284 (100.0%) | 271 (100.0%) |
Commute Time in Forsyth
The most frequently occuring commute durations in Forsyth are less than 5 minutes (181 commuters, 34.5%), 5 to 9 minutes (135 commuters, 25.8%), and 40 to 44 minutes (62 commuters, 11.8%).
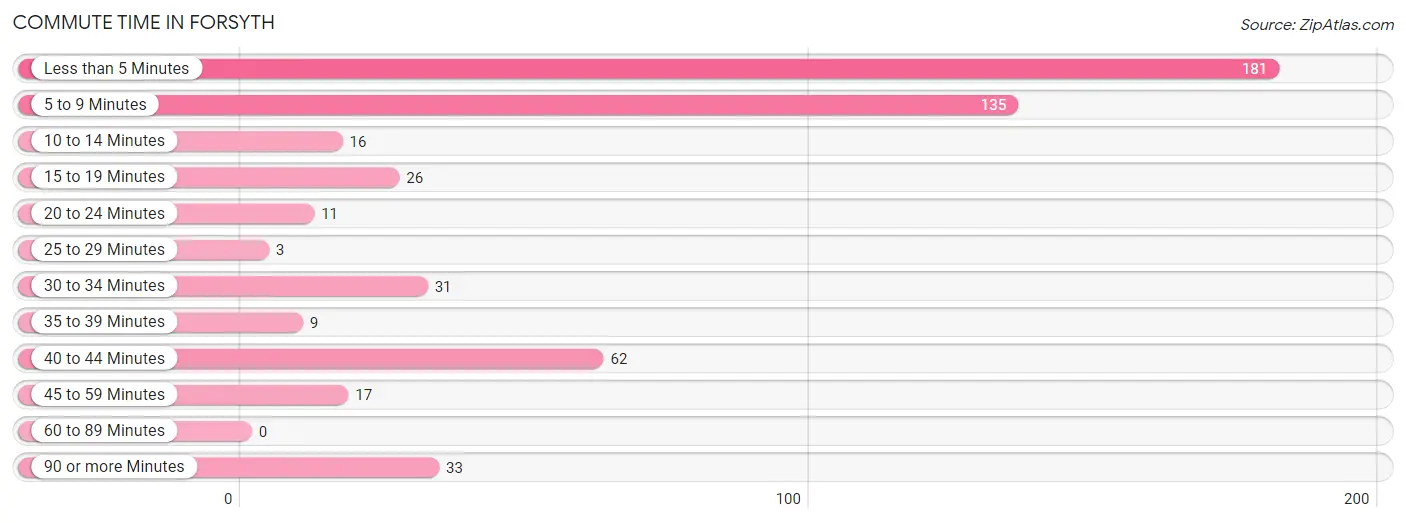
| Commute Time | # Commuters | % Commuters |
| Less than 5 Minutes | 181 | 34.5% |
| 5 to 9 Minutes | 135 | 25.8% |
| 10 to 14 Minutes | 16 | 3.0% |
| 15 to 19 Minutes | 26 | 5.0% |
| 20 to 24 Minutes | 11 | 2.1% |
| 25 to 29 Minutes | 3 | 0.6% |
| 30 to 34 Minutes | 31 | 5.9% |
| 35 to 39 Minutes | 9 | 1.7% |
| 40 to 44 Minutes | 62 | 11.8% |
| 45 to 59 Minutes | 17 | 3.2% |
| 60 to 89 Minutes | 0 | 0.0% |
| 90 or more Minutes | 33 | 6.3% |
Commute Time by Sex in Forsyth
The most common commute times in Forsyth are less than 5 minutes (87 commuters, 33.6%) for males and less than 5 minutes (94 commuters, 35.5%) for females.
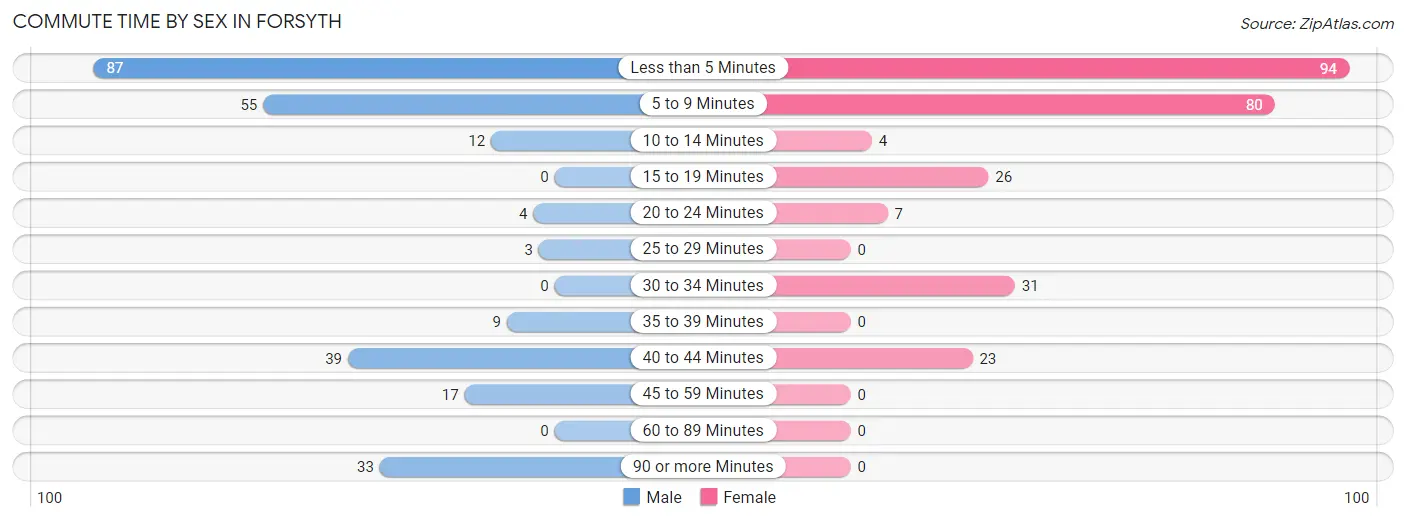
| Commute Time | Male | Female |
| Less than 5 Minutes | 87 (33.6%) | 94 (35.5%) |
| 5 to 9 Minutes | 55 (21.2%) | 80 (30.2%) |
| 10 to 14 Minutes | 12 (4.6%) | 4 (1.5%) |
| 15 to 19 Minutes | 0 (0.0%) | 26 (9.8%) |
| 20 to 24 Minutes | 4 (1.5%) | 7 (2.6%) |
| 25 to 29 Minutes | 3 (1.2%) | 0 (0.0%) |
| 30 to 34 Minutes | 0 (0.0%) | 31 (11.7%) |
| 35 to 39 Minutes | 9 (3.5%) | 0 (0.0%) |
| 40 to 44 Minutes | 39 (15.1%) | 23 (8.7%) |
| 45 to 59 Minutes | 17 (6.6%) | 0 (0.0%) |
| 60 to 89 Minutes | 0 (0.0%) | 0 (0.0%) |
| 90 or more Minutes | 33 (12.7%) | 0 (0.0%) |
Time of Departure to Work by Sex in Forsyth
The most frequent times of departure to work in Forsyth are 7:30 AM to 7:59 AM (68, 26.3%) for males and 8:00 AM to 8:29 AM (62, 23.4%) for females.
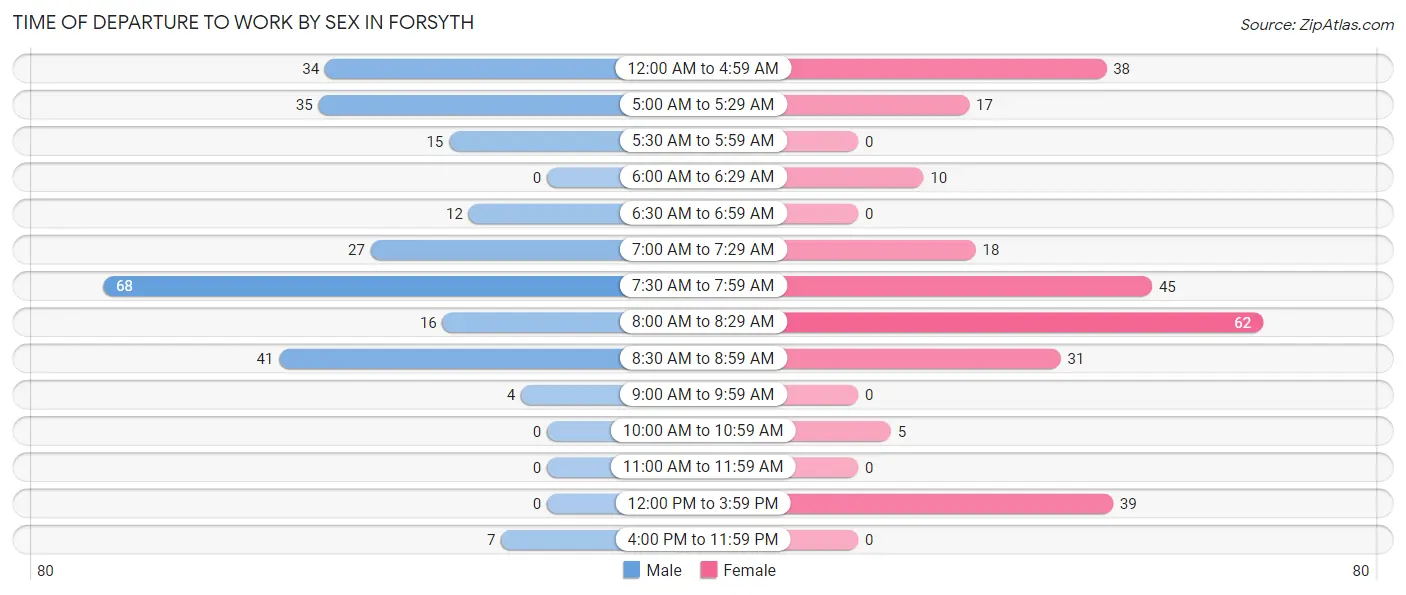
| Time of Departure | Male | Female |
| 12:00 AM to 4:59 AM | 34 (13.1%) | 38 (14.3%) |
| 5:00 AM to 5:29 AM | 35 (13.5%) | 17 (6.4%) |
| 5:30 AM to 5:59 AM | 15 (5.8%) | 0 (0.0%) |
| 6:00 AM to 6:29 AM | 0 (0.0%) | 10 (3.8%) |
| 6:30 AM to 6:59 AM | 12 (4.6%) | 0 (0.0%) |
| 7:00 AM to 7:29 AM | 27 (10.4%) | 18 (6.8%) |
| 7:30 AM to 7:59 AM | 68 (26.3%) | 45 (17.0%) |
| 8:00 AM to 8:29 AM | 16 (6.2%) | 62 (23.4%) |
| 8:30 AM to 8:59 AM | 41 (15.8%) | 31 (11.7%) |
| 9:00 AM to 9:59 AM | 4 (1.5%) | 0 (0.0%) |
| 10:00 AM to 10:59 AM | 0 (0.0%) | 5 (1.9%) |
| 11:00 AM to 11:59 AM | 0 (0.0%) | 0 (0.0%) |
| 12:00 PM to 3:59 PM | 0 (0.0%) | 39 (14.7%) |
| 4:00 PM to 11:59 PM | 7 (2.7%) | 0 (0.0%) |
| Total | 259 (100.0%) | 265 (100.0%) |
Housing Occupancy in Forsyth
Occupancy by Ownership in Forsyth
Of the total 614 dwellings in Forsyth, owner-occupied units account for 362 (59.0%), while renter-occupied units make up 252 (41.0%).
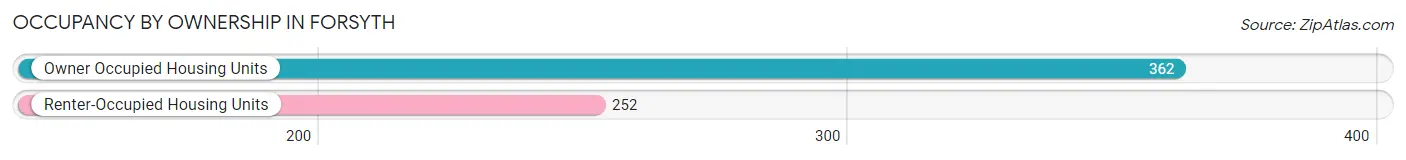
| Occupancy | # Housing Units | % Housing Units |
| Owner Occupied Housing Units | 362 | 59.0% |
| Renter-Occupied Housing Units | 252 | 41.0% |
| Total Occupied Housing Units | 614 | 100.0% |
Occupancy by Household Size in Forsyth
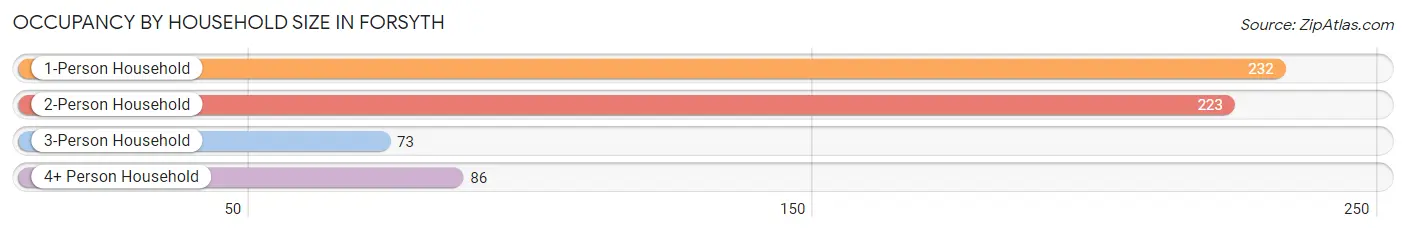
| Household Size | # Housing Units | % Housing Units |
| 1-Person Household | 232 | 37.8% |
| 2-Person Household | 223 | 36.3% |
| 3-Person Household | 73 | 11.9% |
| 4+ Person Household | 86 | 14.0% |
| Total Housing Units | 614 | 100.0% |
Occupancy by Ownership by Household Size in Forsyth
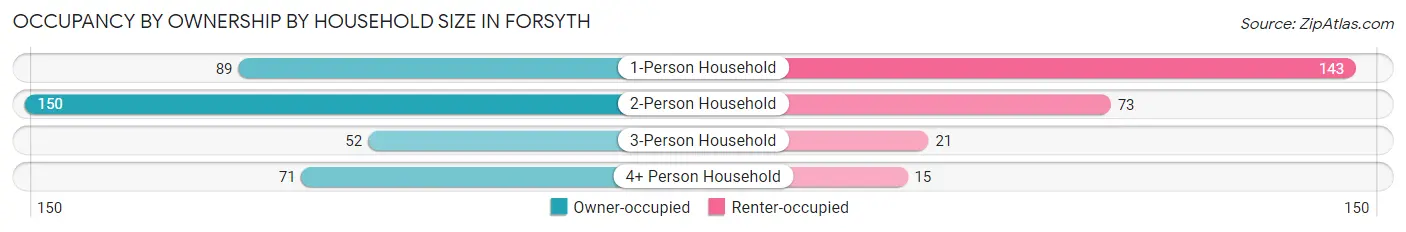
| Household Size | Owner-occupied | Renter-occupied |
| 1-Person Household | 89 (38.4%) | 143 (61.6%) |
| 2-Person Household | 150 (67.3%) | 73 (32.7%) |
| 3-Person Household | 52 (71.2%) | 21 (28.8%) |
| 4+ Person Household | 71 (82.6%) | 15 (17.4%) |
| Total Housing Units | 362 (59.0%) | 252 (41.0%) |
Occupancy by Educational Attainment in Forsyth
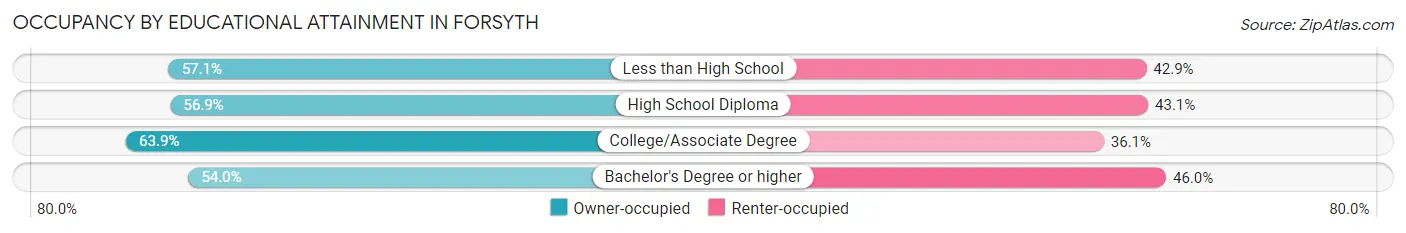
| Household Size | Owner-occupied | Renter-occupied |
| Less than High School | 28 (57.1%) | 21 (42.9%) |
| High School Diploma | 149 (56.9%) | 113 (43.1%) |
| College/Associate Degree | 138 (63.9%) | 78 (36.1%) |
| Bachelor's Degree or higher | 47 (54.0%) | 40 (46.0%) |
Occupancy by Age of Householder in Forsyth
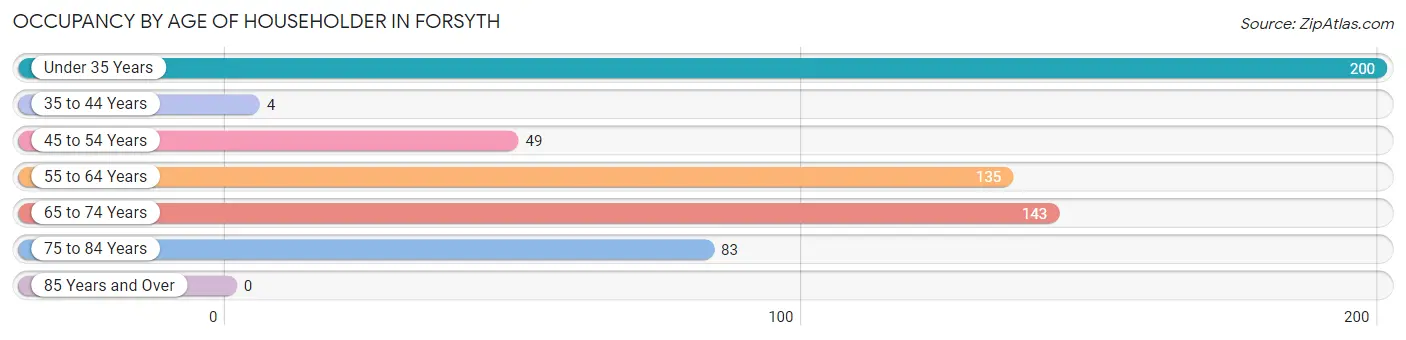
| Age Bracket | # Households | % Households |
| Under 35 Years | 200 | 32.6% |
| 35 to 44 Years | 4 | 0.6% |
| 45 to 54 Years | 49 | 8.0% |
| 55 to 64 Years | 135 | 22.0% |
| 65 to 74 Years | 143 | 23.3% |
| 75 to 84 Years | 83 | 13.5% |
| 85 Years and Over | 0 | 0.0% |
| Total | 614 | 100.0% |
Housing Finances in Forsyth
Median Income by Occupancy in Forsyth
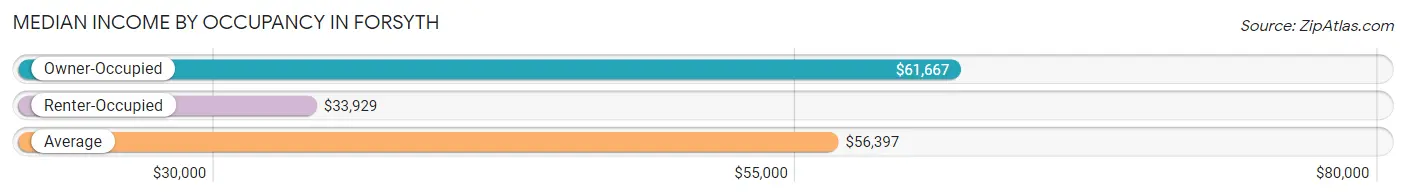
| Occupancy Type | # Households | Median Income |
| Owner-Occupied | 362 (59.0%) | $61,667 |
| Renter-Occupied | 252 (41.0%) | $33,929 |
| Average | 614 (100.0%) | $56,397 |
Occupancy by Householder Income Bracket in Forsyth
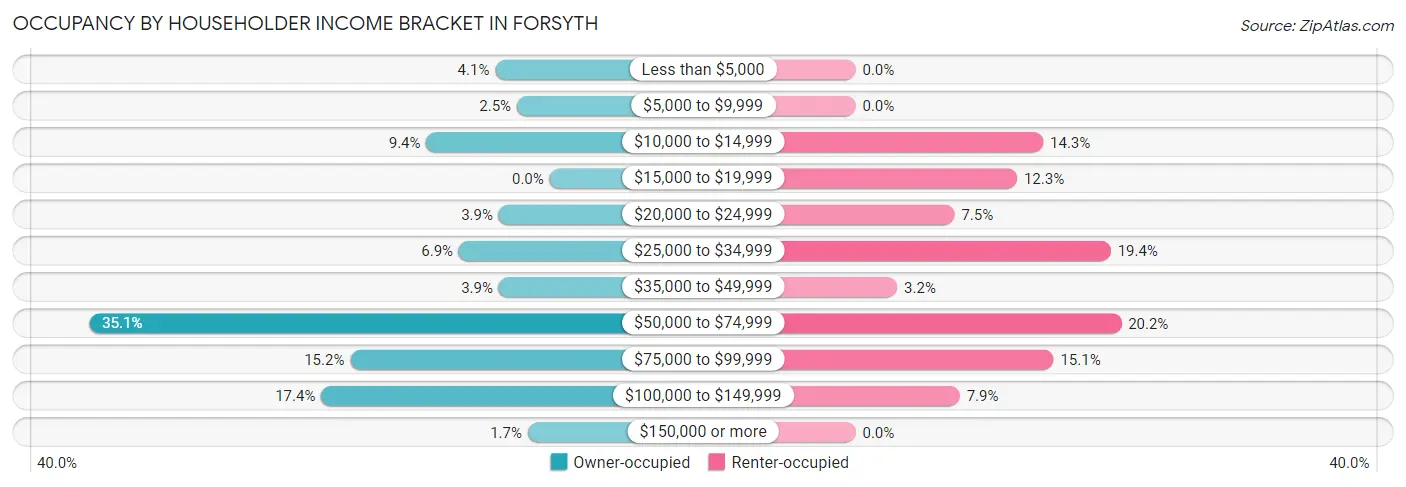
| Income Bracket | Owner-occupied | Renter-occupied |
| Less than $5,000 | 15 (4.1%) | 0 (0.0%) |
| $5,000 to $9,999 | 9 (2.5%) | 0 (0.0%) |
| $10,000 to $14,999 | 34 (9.4%) | 36 (14.3%) |
| $15,000 to $19,999 | 0 (0.0%) | 31 (12.3%) |
| $20,000 to $24,999 | 14 (3.9%) | 19 (7.5%) |
| $25,000 to $34,999 | 25 (6.9%) | 49 (19.4%) |
| $35,000 to $49,999 | 14 (3.9%) | 8 (3.2%) |
| $50,000 to $74,999 | 127 (35.1%) | 51 (20.2%) |
| $75,000 to $99,999 | 55 (15.2%) | 38 (15.1%) |
| $100,000 to $149,999 | 63 (17.4%) | 20 (7.9%) |
| $150,000 or more | 6 (1.7%) | 0 (0.0%) |
| Total | 362 (100.0%) | 252 (100.0%) |
Monthly Housing Cost Tiers in Forsyth
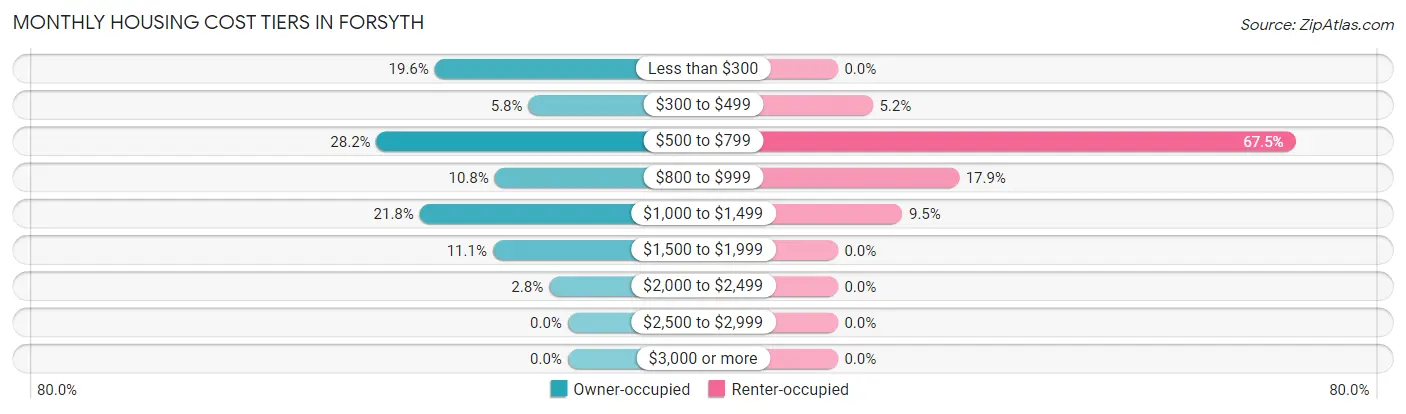
| Monthly Cost | Owner-occupied | Renter-occupied |
| Less than $300 | 71 (19.6%) | 0 (0.0%) |
| $300 to $499 | 21 (5.8%) | 13 (5.2%) |
| $500 to $799 | 102 (28.2%) | 170 (67.5%) |
| $800 to $999 | 39 (10.8%) | 45 (17.9%) |
| $1,000 to $1,499 | 79 (21.8%) | 24 (9.5%) |
| $1,500 to $1,999 | 40 (11.1%) | 0 (0.0%) |
| $2,000 to $2,499 | 10 (2.8%) | 0 (0.0%) |
| $2,500 to $2,999 | 0 (0.0%) | 0 (0.0%) |
| $3,000 or more | 0 (0.0%) | 0 (0.0%) |
| Total | 362 (100.0%) | 252 (100.0%) |
Physical Housing Characteristics in Forsyth
Housing Structures in Forsyth
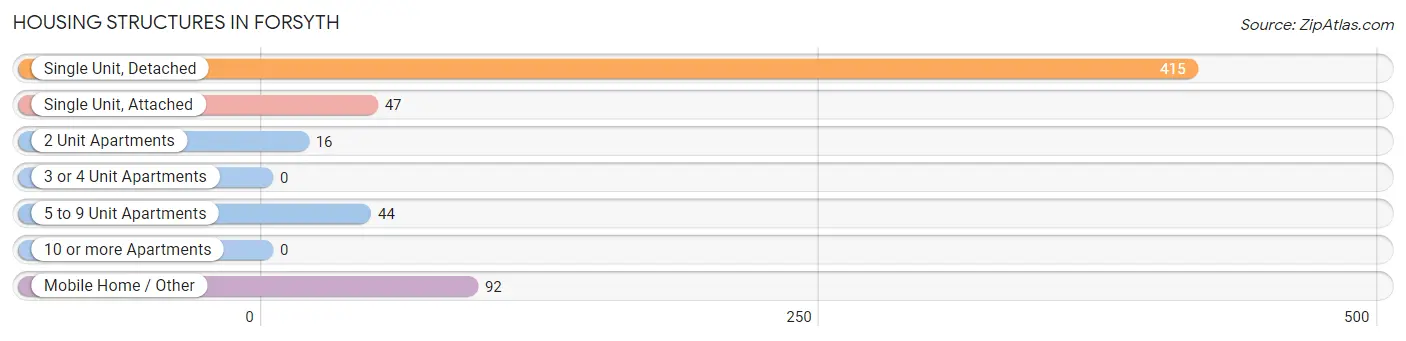
| Structure Type | # Housing Units | % Housing Units |
| Single Unit, Detached | 415 | 67.6% |
| Single Unit, Attached | 47 | 7.6% |
| 2 Unit Apartments | 16 | 2.6% |
| 3 or 4 Unit Apartments | 0 | 0.0% |
| 5 to 9 Unit Apartments | 44 | 7.2% |
| 10 or more Apartments | 0 | 0.0% |
| Mobile Home / Other | 92 | 15.0% |
| Total | 614 | 100.0% |
Housing Structures by Occupancy in Forsyth
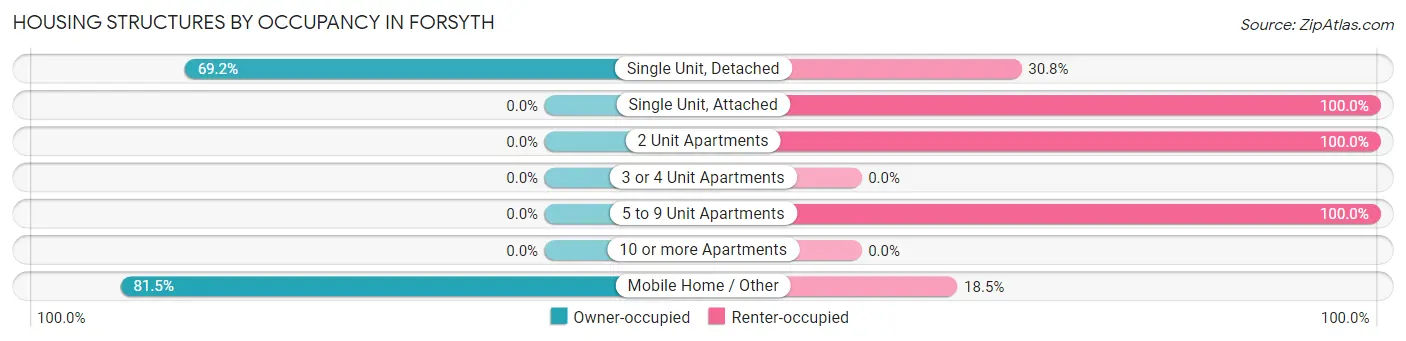
| Structure Type | Owner-occupied | Renter-occupied |
| Single Unit, Detached | 287 (69.2%) | 128 (30.8%) |
| Single Unit, Attached | 0 (0.0%) | 47 (100.0%) |
| 2 Unit Apartments | 0 (0.0%) | 16 (100.0%) |
| 3 or 4 Unit Apartments | 0 (0.0%) | 0 (0.0%) |
| 5 to 9 Unit Apartments | 0 (0.0%) | 44 (100.0%) |
| 10 or more Apartments | 0 (0.0%) | 0 (0.0%) |
| Mobile Home / Other | 75 (81.5%) | 17 (18.5%) |
| Total | 362 (59.0%) | 252 (41.0%) |
Housing Structures by Number of Rooms in Forsyth
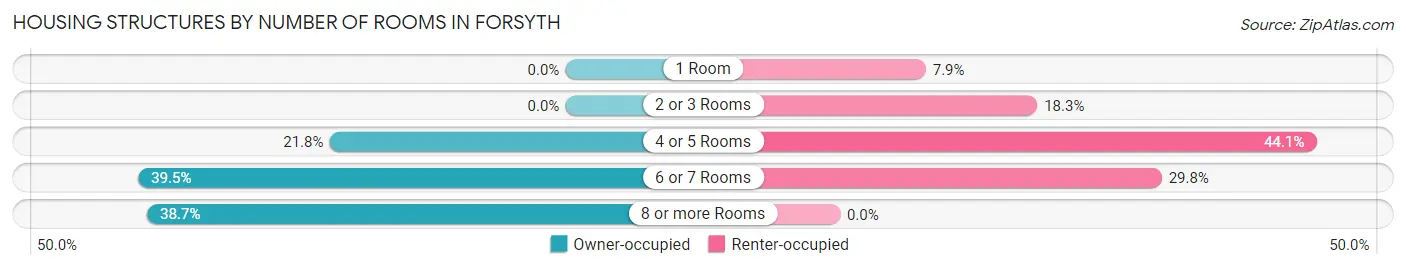
| Number of Rooms | Owner-occupied | Renter-occupied |
| 1 Room | 0 (0.0%) | 20 (7.9%) |
| 2 or 3 Rooms | 0 (0.0%) | 46 (18.2%) |
| 4 or 5 Rooms | 79 (21.8%) | 111 (44.1%) |
| 6 or 7 Rooms | 143 (39.5%) | 75 (29.8%) |
| 8 or more Rooms | 140 (38.7%) | 0 (0.0%) |
| Total | 362 (100.0%) | 252 (100.0%) |
Housing Structure by Heating Type in Forsyth
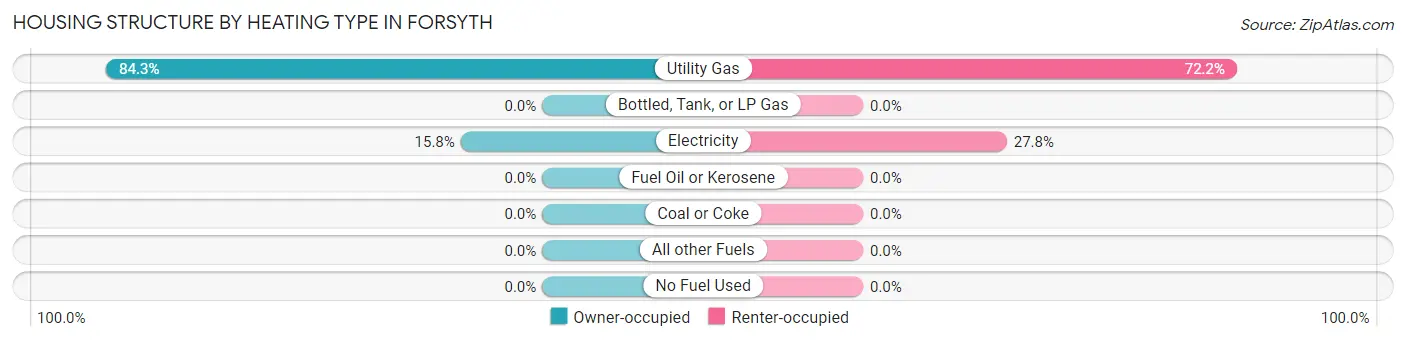
| Heating Type | Owner-occupied | Renter-occupied |
| Utility Gas | 305 (84.3%) | 182 (72.2%) |
| Bottled, Tank, or LP Gas | 0 (0.0%) | 0 (0.0%) |
| Electricity | 57 (15.8%) | 70 (27.8%) |
| Fuel Oil or Kerosene | 0 (0.0%) | 0 (0.0%) |
| Coal or Coke | 0 (0.0%) | 0 (0.0%) |
| All other Fuels | 0 (0.0%) | 0 (0.0%) |
| No Fuel Used | 0 (0.0%) | 0 (0.0%) |
| Total | 362 (100.0%) | 252 (100.0%) |
Household Vehicle Usage in Forsyth
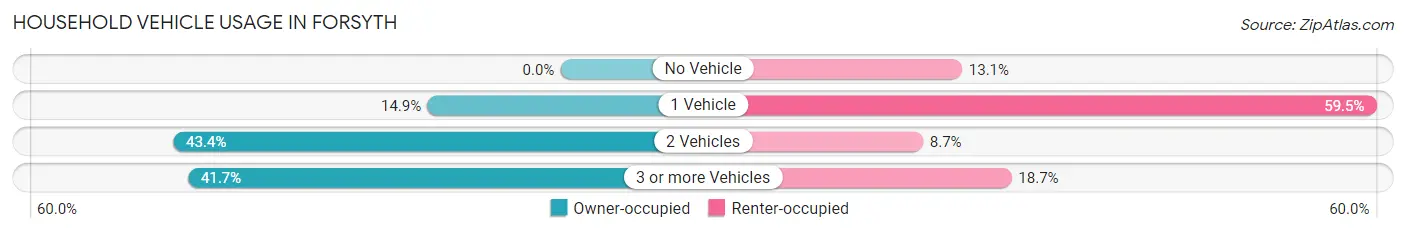
| Vehicles per Household | Owner-occupied | Renter-occupied |
| No Vehicle | 0 (0.0%) | 33 (13.1%) |
| 1 Vehicle | 54 (14.9%) | 150 (59.5%) |
| 2 Vehicles | 157 (43.4%) | 22 (8.7%) |
| 3 or more Vehicles | 151 (41.7%) | 47 (18.6%) |
| Total | 362 (100.0%) | 252 (100.0%) |
Real Estate & Mortgages in Forsyth
Real Estate and Mortgage Overview in Forsyth
| Characteristic | Without Mortgage | With Mortgage |
| Housing Units | 186 | 176 |
| Median Property Value | $160,400 | $176,500 |
| Median Household Income | $34,286 | $4 |
| Monthly Housing Costs | $503 | $0 |
| Real Estate Taxes | $1,481 | $0 |
Property Value by Mortgage Status in Forsyth
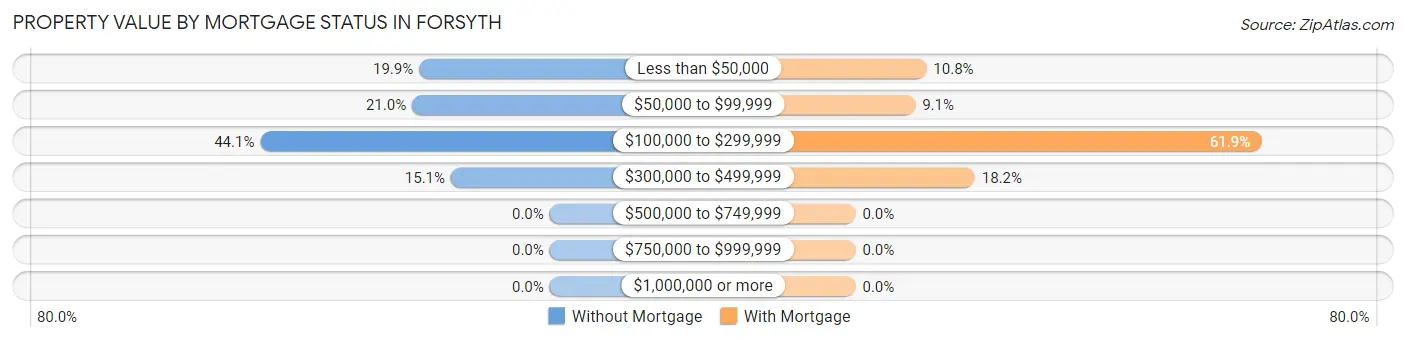
| Property Value | Without Mortgage | With Mortgage |
| Less than $50,000 | 37 (19.9%) | 19 (10.8%) |
| $50,000 to $99,999 | 39 (21.0%) | 16 (9.1%) |
| $100,000 to $299,999 | 82 (44.1%) | 109 (61.9%) |
| $300,000 to $499,999 | 28 (15.0%) | 32 (18.2%) |
| $500,000 to $749,999 | 0 (0.0%) | 0 (0.0%) |
| $750,000 to $999,999 | 0 (0.0%) | 0 (0.0%) |
| $1,000,000 or more | 0 (0.0%) | 0 (0.0%) |
| Total | 186 (100.0%) | 176 (100.0%) |
Household Income by Mortgage Status in Forsyth
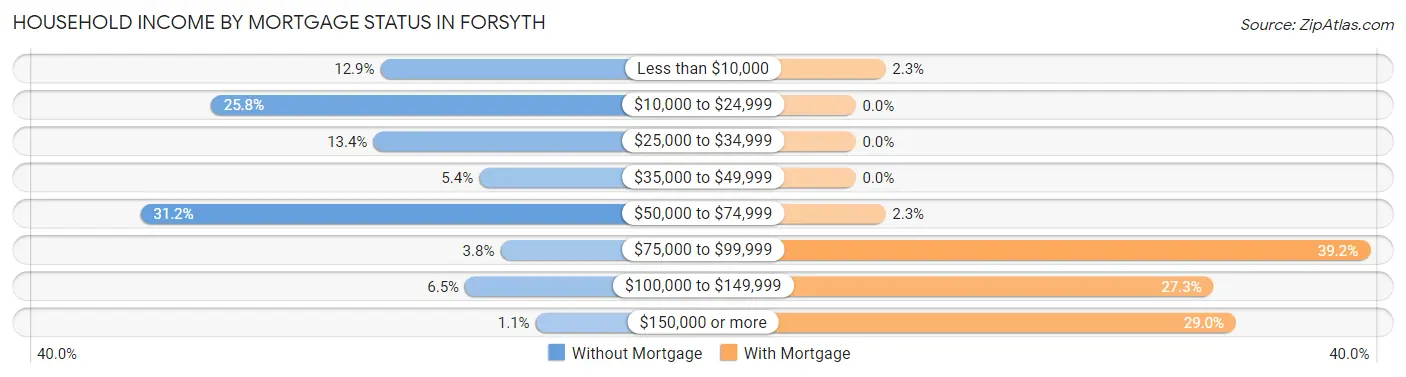
| Household Income | Without Mortgage | With Mortgage |
| Less than $10,000 | 24 (12.9%) | 4 (2.3%) |
| $10,000 to $24,999 | 48 (25.8%) | 0 (0.0%) |
| $25,000 to $34,999 | 25 (13.4%) | 0 (0.0%) |
| $35,000 to $49,999 | 10 (5.4%) | 0 (0.0%) |
| $50,000 to $74,999 | 58 (31.2%) | 4 (2.3%) |
| $75,000 to $99,999 | 7 (3.8%) | 69 (39.2%) |
| $100,000 to $149,999 | 12 (6.5%) | 48 (27.3%) |
| $150,000 or more | 2 (1.1%) | 51 (29.0%) |
| Total | 186 (100.0%) | 176 (100.0%) |
Property Value to Household Income Ratio in Forsyth
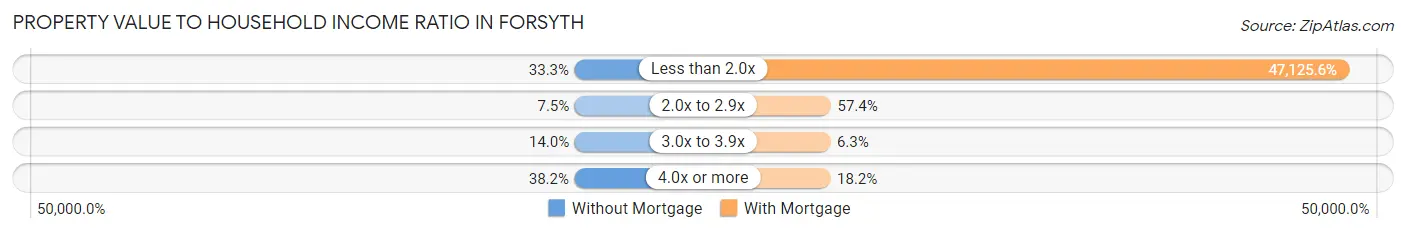
| Value-to-Income Ratio | Without Mortgage | With Mortgage |
| Less than 2.0x | 62 (33.3%) | 82,941 (47,125.6%) |
| 2.0x to 2.9x | 14 (7.5%) | 101 (57.4%) |
| 3.0x to 3.9x | 26 (14.0%) | 11 (6.2%) |
| 4.0x or more | 71 (38.2%) | 32 (18.2%) |
| Total | 186 (100.0%) | 176 (100.0%) |
Real Estate Taxes by Mortgage Status in Forsyth
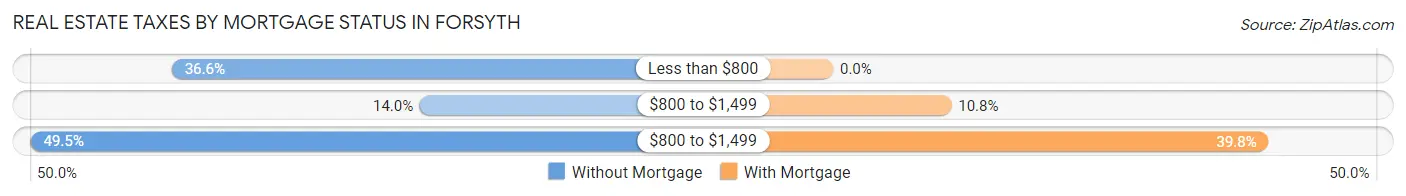
| Property Taxes | Without Mortgage | With Mortgage |
| Less than $800 | 68 (36.6%) | 0 (0.0%) |
| $800 to $1,499 | 26 (14.0%) | 19 (10.8%) |
| $800 to $1,499 | 92 (49.5%) | 70 (39.8%) |
| Total | 186 (100.0%) | 176 (100.0%) |
Health & Disability in Forsyth
Health Insurance Coverage by Age in Forsyth
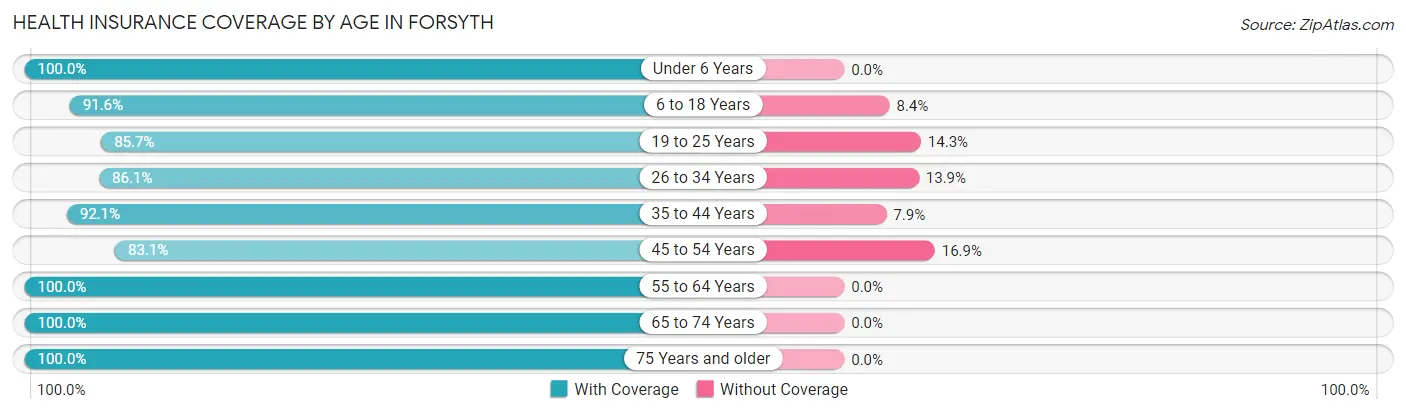
| Age Bracket | With Coverage | Without Coverage |
| Under 6 Years | 142 (100.0%) | 0 (0.0%) |
| 6 to 18 Years | 141 (91.6%) | 13 (8.4%) |
| 19 to 25 Years | 114 (85.7%) | 19 (14.3%) |
| 26 to 34 Years | 192 (86.1%) | 31 (13.9%) |
| 35 to 44 Years | 82 (92.1%) | 7 (7.9%) |
| 45 to 54 Years | 64 (83.1%) | 13 (16.9%) |
| 55 to 64 Years | 214 (100.0%) | 0 (0.0%) |
| 65 to 74 Years | 240 (100.0%) | 0 (0.0%) |
| 75 Years and older | 134 (100.0%) | 0 (0.0%) |
| Total | 1,323 (94.1%) | 83 (5.9%) |
Health Insurance Coverage by Citizenship Status in Forsyth
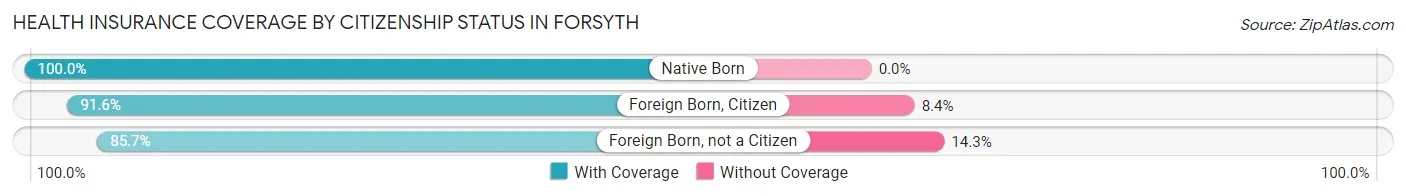
| Citizenship Status | With Coverage | Without Coverage |
| Native Born | 142 (100.0%) | 0 (0.0%) |
| Foreign Born, Citizen | 141 (91.6%) | 13 (8.4%) |
| Foreign Born, not a Citizen | 114 (85.7%) | 19 (14.3%) |
Health Insurance Coverage by Household Income in Forsyth
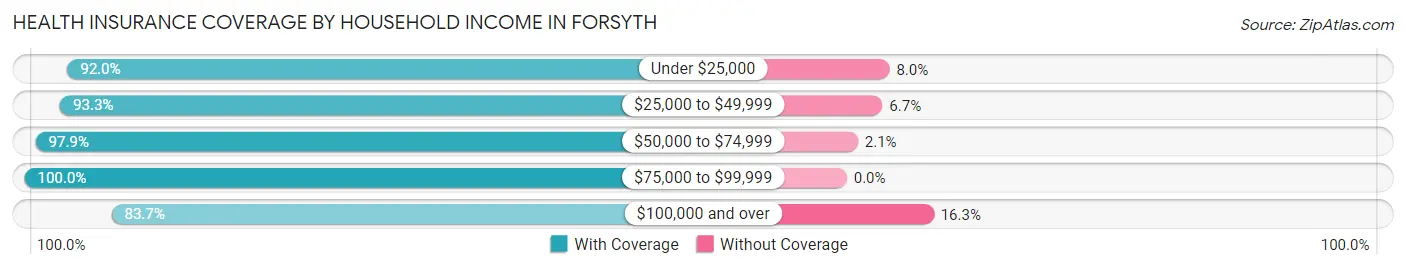
| Household Income | With Coverage | Without Coverage |
| Under $25,000 | 207 (92.0%) | 18 (8.0%) |
| $25,000 to $49,999 | 182 (93.3%) | 13 (6.7%) |
| $50,000 to $74,999 | 426 (97.9%) | 9 (2.1%) |
| $75,000 to $99,999 | 272 (100.0%) | 0 (0.0%) |
| $100,000 and over | 221 (83.7%) | 43 (16.3%) |
Public vs Private Health Insurance Coverage by Age in Forsyth
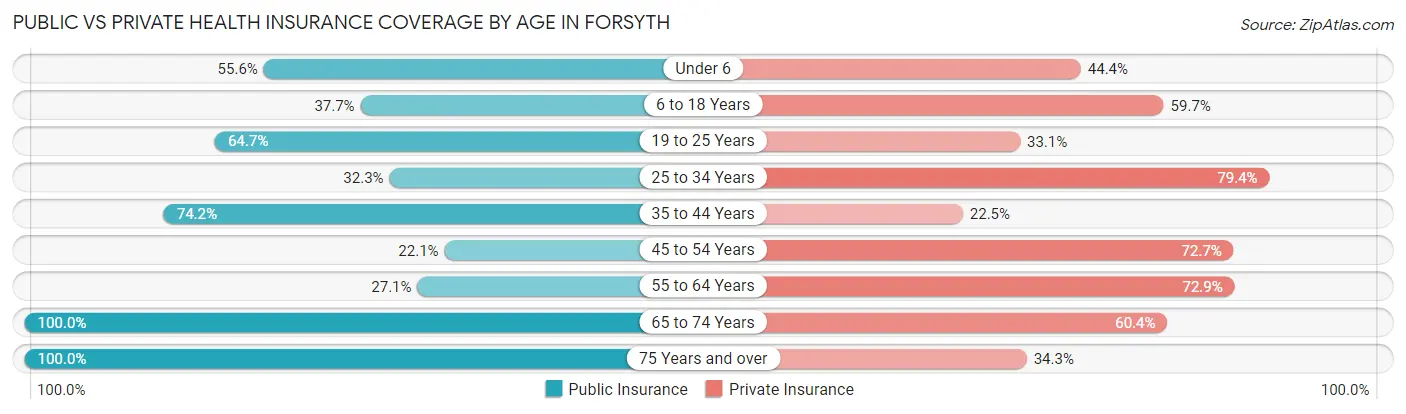
| Age Bracket | Public Insurance | Private Insurance |
| Under 6 | 79 (55.6%) | 63 (44.4%) |
| 6 to 18 Years | 58 (37.7%) | 92 (59.7%) |
| 19 to 25 Years | 86 (64.7%) | 44 (33.1%) |
| 25 to 34 Years | 72 (32.3%) | 177 (79.4%) |
| 35 to 44 Years | 66 (74.2%) | 20 (22.5%) |
| 45 to 54 Years | 17 (22.1%) | 56 (72.7%) |
| 55 to 64 Years | 58 (27.1%) | 156 (72.9%) |
| 65 to 74 Years | 240 (100.0%) | 145 (60.4%) |
| 75 Years and over | 134 (100.0%) | 46 (34.3%) |
| Total | 810 (57.6%) | 799 (56.8%) |
Disability Status by Sex by Age in Forsyth
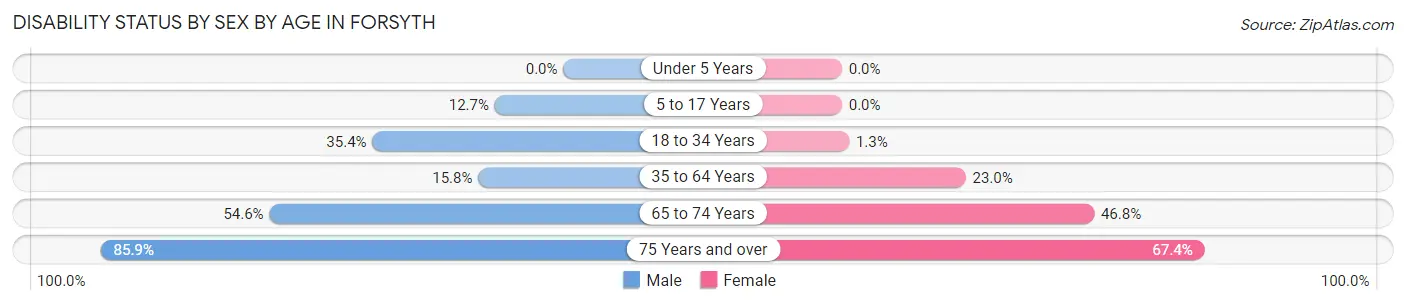
| Age Bracket | Male | Female |
| Under 5 Years | 0 (0.0%) | 0 (0.0%) |
| 5 to 17 Years | 7 (12.7%) | 0 (0.0%) |
| 18 to 34 Years | 73 (35.4%) | 2 (1.3%) |
| 35 to 64 Years | 27 (15.8%) | 48 (23.0%) |
| 65 to 74 Years | 54 (54.5%) | 66 (46.8%) |
| 75 Years and over | 73 (85.9%) | 33 (67.3%) |
Disability Class by Sex by Age in Forsyth
Disability Class: Hearing Difficulty
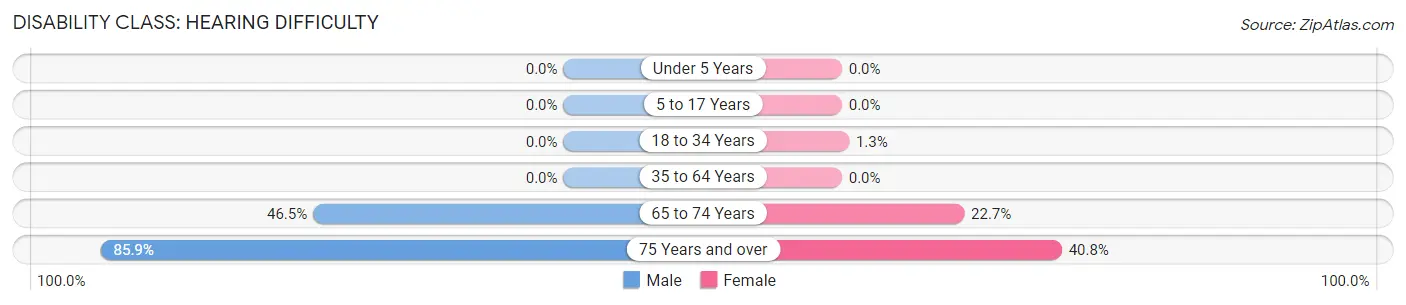
| Age Bracket | Male | Female |
| Under 5 Years | 0 (0.0%) | 0 (0.0%) |
| 5 to 17 Years | 0 (0.0%) | 0 (0.0%) |
| 18 to 34 Years | 0 (0.0%) | 2 (1.3%) |
| 35 to 64 Years | 0 (0.0%) | 0 (0.0%) |
| 65 to 74 Years | 46 (46.5%) | 32 (22.7%) |
| 75 Years and over | 73 (85.9%) | 20 (40.8%) |
Disability Class: Vision Difficulty
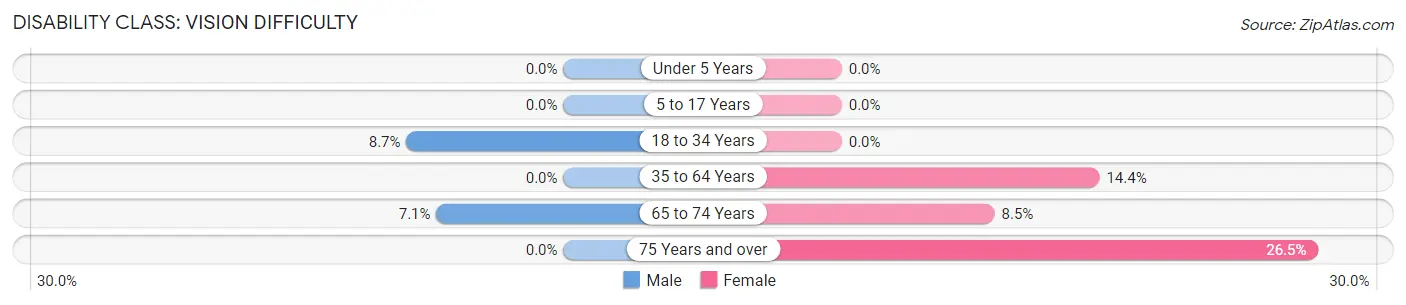
| Age Bracket | Male | Female |
| Under 5 Years | 0 (0.0%) | 0 (0.0%) |
| 5 to 17 Years | 0 (0.0%) | 0 (0.0%) |
| 18 to 34 Years | 18 (8.7%) | 0 (0.0%) |
| 35 to 64 Years | 0 (0.0%) | 30 (14.3%) |
| 65 to 74 Years | 7 (7.1%) | 12 (8.5%) |
| 75 Years and over | 0 (0.0%) | 13 (26.5%) |
Disability Class: Cognitive Difficulty
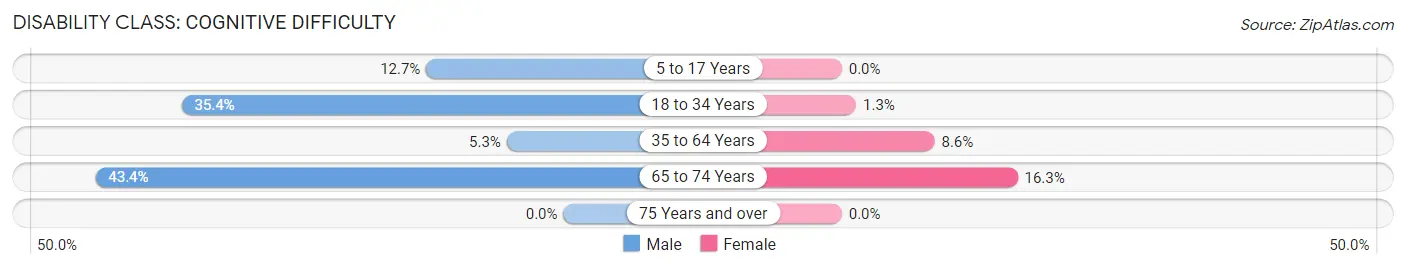
| Age Bracket | Male | Female |
| 5 to 17 Years | 7 (12.7%) | 0 (0.0%) |
| 18 to 34 Years | 73 (35.4%) | 2 (1.3%) |
| 35 to 64 Years | 9 (5.3%) | 18 (8.6%) |
| 65 to 74 Years | 43 (43.4%) | 23 (16.3%) |
| 75 Years and over | 0 (0.0%) | 0 (0.0%) |
Disability Class: Ambulatory Difficulty
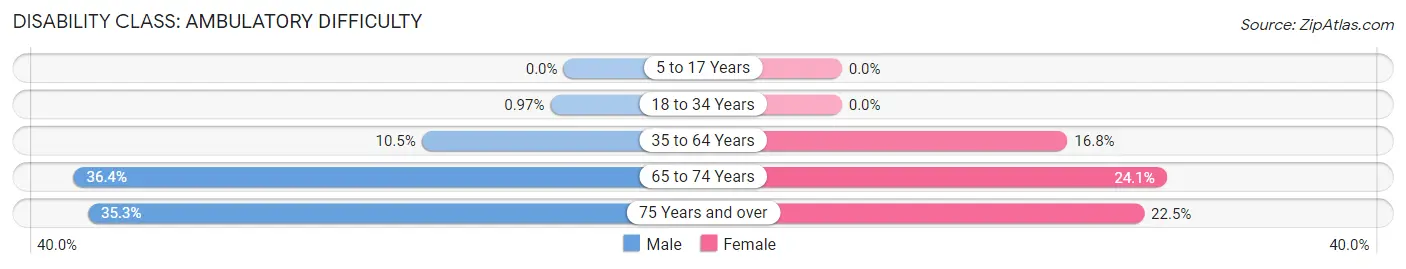
| Age Bracket | Male | Female |
| 5 to 17 Years | 0 (0.0%) | 0 (0.0%) |
| 18 to 34 Years | 2 (1.0%) | 0 (0.0%) |
| 35 to 64 Years | 18 (10.5%) | 35 (16.8%) |
| 65 to 74 Years | 36 (36.4%) | 34 (24.1%) |
| 75 Years and over | 30 (35.3%) | 11 (22.5%) |
Disability Class: Self-Care Difficulty
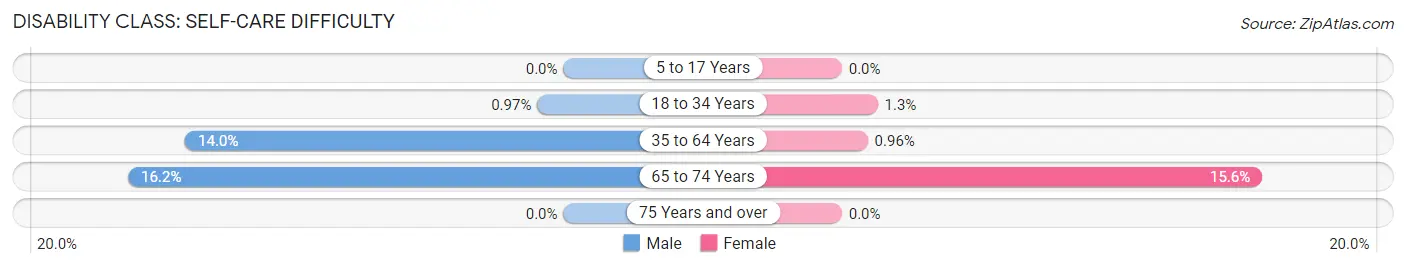
| Age Bracket | Male | Female |
| 5 to 17 Years | 0 (0.0%) | 0 (0.0%) |
| 18 to 34 Years | 2 (1.0%) | 2 (1.3%) |
| 35 to 64 Years | 24 (14.0%) | 2 (1.0%) |
| 65 to 74 Years | 16 (16.2%) | 22 (15.6%) |
| 75 Years and over | 0 (0.0%) | 0 (0.0%) |
Technology Access in Forsyth
Computing Device Access in Forsyth
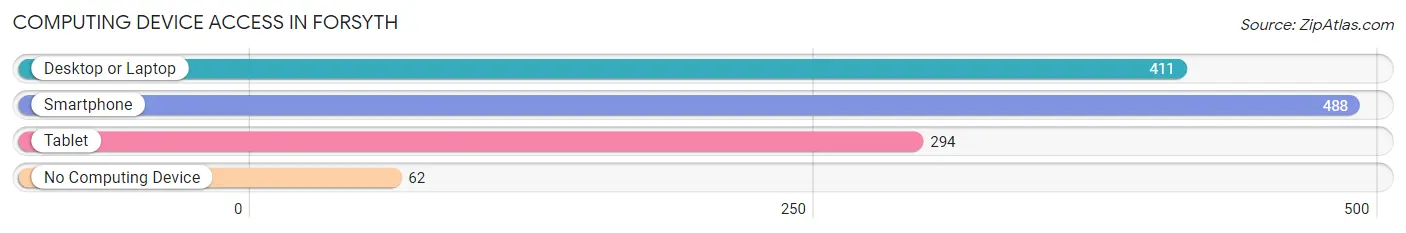
| Device Type | # Households | % Households |
| Desktop or Laptop | 411 | 66.9% |
| Smartphone | 488 | 79.5% |
| Tablet | 294 | 47.9% |
| No Computing Device | 62 | 10.1% |
| Total | 614 | 100.0% |
Internet Access in Forsyth
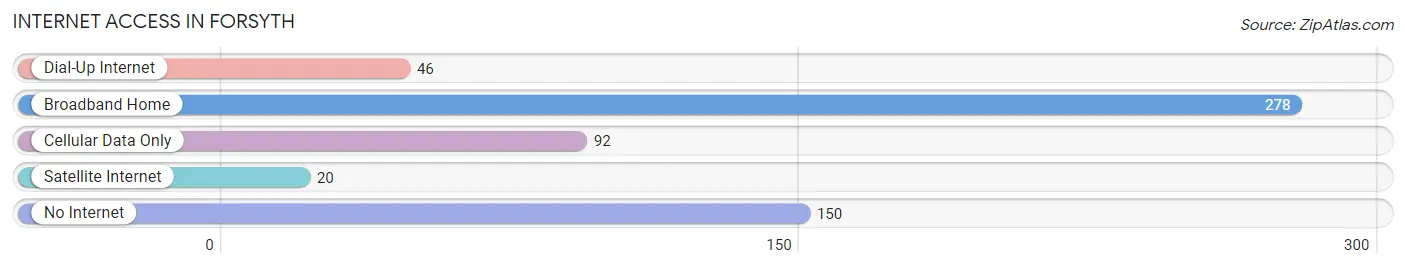
| Internet Type | # Households | % Households |
| Dial-Up Internet | 46 | 7.5% |
| Broadband Home | 278 | 45.3% |
| Cellular Data Only | 92 | 15.0% |
| Satellite Internet | 20 | 3.3% |
| No Internet | 150 | 24.4% |
| Total | 614 | 100.0% |
Forsyth Summary
Forsyth is a small town located in the southeastern corner of Montana, in Rosebud County. It is situated along the Yellowstone River, and is the county seat of Rosebud County. The town was founded in 1876, and was named after General James W. Forsyth, who was a Union Army officer during the Civil War. The town has a population of 1,717 people, according to the 2010 census.
History
Forsyth was founded in 1876, and was named after General James W. Forsyth, who was a Union Army officer during the Civil War. The town was originally a trading post for the Crow Indians, and was later used as a supply point for the Northern Pacific Railroad. The town was incorporated in 1885, and the first post office was established in 1887.
The town was a major stop on the Northern Pacific Railroad, and was a popular destination for travelers. The town was also a major cattle shipping point, and was home to several large ranches. The town was also home to several saloons, hotels, and other businesses.
In the early 1900s, the town was a major center for the mining industry, and was home to several large mines. The town was also home to several large lumber mills, and was a major supplier of lumber to the surrounding area.
Geography
Forsyth is located in the southeastern corner of Montana, in Rosebud County. It is situated along the Yellowstone River, and is the county seat of Rosebud County. The town is located at an elevation of 3,400 feet, and has a total area of 1.2 square miles.
The town is located in the Yellowstone Valley, and is surrounded by rolling hills and prairies. The town is located near the Little Bighorn National Monument, and is also close to the Little Bighorn Battlefield National Monument.
Economy
Forsyth is a small town, and the economy is largely based on agriculture and tourism. The town is home to several large ranches, and is a major cattle shipping point. The town is also home to several large lumber mills, and is a major supplier of lumber to the surrounding area.
The town is also home to several small businesses, including restaurants, bars, and retail stores. The town is also home to several tourist attractions, including the Little Bighorn National Monument and the Little Bighorn Battlefield National Monument.
Demographics
According to the 2010 census, Forsyth has a population of 1,717 people. The town has a median age of 39.7 years, and a median household income of $37,941. The town is predominantly white, with 91.3% of the population being white. The town also has a large Native American population, with 8.7% of the population being Native American. The town also has a small Hispanic population, with 1.2% of the population being Hispanic.
Common Questions
What is Per Capita Income in Forsyth?
Per Capita income in Forsyth is $25,763.
What is the Median Family Income in Forsyth?
Median Family Income in Forsyth is $58,810.
What is the Median Household income in Forsyth?
Median Household Income in Forsyth is $56,397.
What is Income or Wage Gap in Forsyth?
Income or Wage Gap in Forsyth is 41.8%.
Women in Forsyth earn 58.2 cents for every dollar earned by a man.
What is Inequality or Gini Index in Forsyth?
Inequality or Gini Index in Forsyth is 0.38.
What is the Total Population of Forsyth?
Total Population of Forsyth is 1,458.
What is the Total Male Population of Forsyth?
Total Male Population of Forsyth is 735.
What is the Total Female Population of Forsyth?
Total Female Population of Forsyth is 723.
What is the Ratio of Males per 100 Females in Forsyth?
There are 101.66 Males per 100 Females in Forsyth.
What is the Ratio of Females per 100 Males in Forsyth?
There are 98.37 Females per 100 Males in Forsyth.
What is the Median Population Age in Forsyth?
Median Population Age in Forsyth is 38.6 Years.
What is the Average Family Size in Forsyth
Average Family Size in Forsyth is 3.0 People.
What is the Average Household Size in Forsyth
Average Household Size in Forsyth is 2.3 People.
How Large is the Labor Force in Forsyth?
There are 613 People in the Labor Forcein in Forsyth.
What is the Percentage of People in the Labor Force in Forsyth?
51.8% of People are in the Labor Force in Forsyth.
What is the Unemployment Rate in Forsyth?
Unemployment Rate in Forsyth is 2.6%.