Glendive, MT Map & Demographics
Glendive Map
Glendive Overview
$34,707
PER CAPITA INCOME
$79,920
AVG FAMILY INCOME
$65,663
AVG HOUSEHOLD INCOME
50.6%
WAGE / INCOME GAP [ % ]
49.4¢/ $1
WAGE / INCOME GAP [ $ ]
0.39
INEQUALITY / GINI INDEX
4,861
TOTAL POPULATION
2,482
MALE POPULATION
2,379
FEMALE POPULATION
104.33
MALES / 100 FEMALES
95.85
FEMALES / 100 MALES
41.4
MEDIAN AGE
2.9
AVG FAMILY SIZE
2.2
AVG HOUSEHOLD SIZE
2,343
LABOR FORCE [ PEOPLE ]
59.1%
PERCENT IN LABOR FORCE
4.1%
UNEMPLOYMENT RATE
Glendive Zip Codes
Glendive Area Codes
Income in Glendive
Income Overview in Glendive
Per Capita Income in Glendive is $34,707, while median incomes of families and households are $79,920 and $65,663 respectively.
| Characteristic | Number | Measure |
| Per Capita Income | 4,861 | $34,707 |
| Median Family Income | 1,180 | $79,920 |
| Mean Family Income | 1,180 | $102,339 |
| Median Household Income | 1,990 | $65,663 |
| Mean Household Income | 1,990 | $80,021 |
| Income Deficit | 1,180 | $0 |
| Wage / Income Gap (%) | 4,861 | 50.61% |
| Wage / Income Gap ($) | 4,861 | 49.39¢ per $1 |
| Gini / Inequality Index | 4,861 | 0.39 |
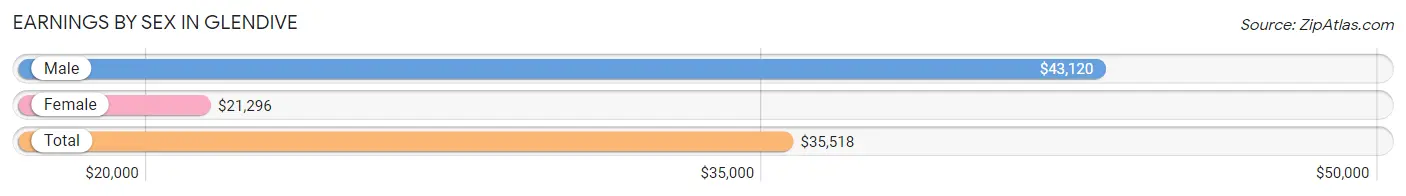
Earnings by Sex in Glendive
Average Earnings in Glendive are $35,518, $43,120 for men and $21,296 for women, a difference of 50.6%.
| Sex | Number | Average Earnings |
| Male | 1,472 (54.9%) | $43,120 |
| Female | 1,209 (45.1%) | $21,296 |
| Total | 2,681 (100.0%) | $35,518 |
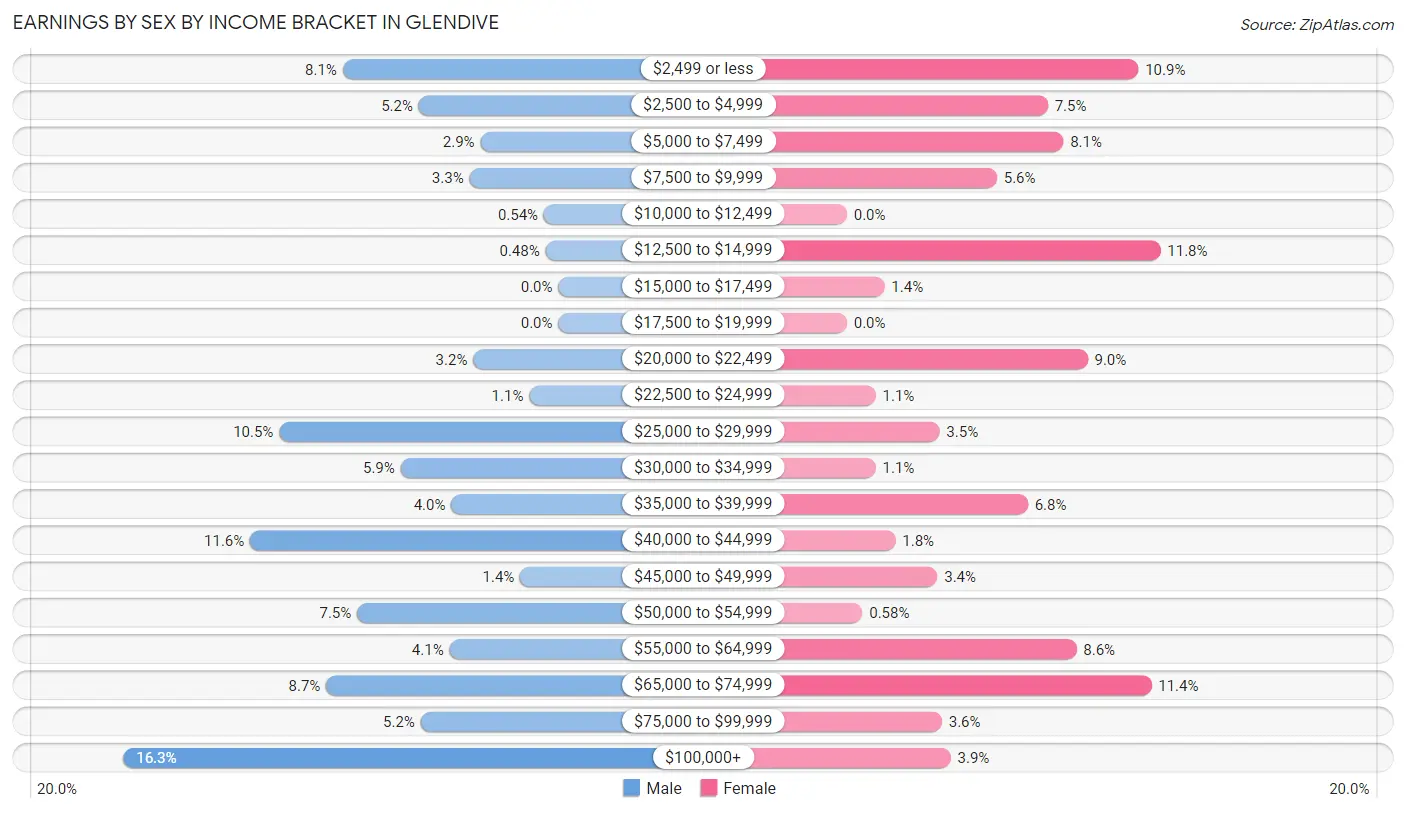
Earnings by Sex by Income Bracket in Glendive
The most common earnings brackets in Glendive are $100,000+ for men (240 | 16.3%) and $12,500 to $14,999 for women (142 | 11.7%).
| Income | Male | Female |
| $2,499 or less | 119 (8.1%) | 132 (10.9%) |
| $2,500 to $4,999 | 77 (5.2%) | 91 (7.5%) |
| $5,000 to $7,499 | 43 (2.9%) | 98 (8.1%) |
| $7,500 to $9,999 | 49 (3.3%) | 68 (5.6%) |
| $10,000 to $12,499 | 8 (0.5%) | 0 (0.0%) |
| $12,500 to $14,999 | 7 (0.5%) | 142 (11.7%) |
| $15,000 to $17,499 | 0 (0.0%) | 17 (1.4%) |
| $17,500 to $19,999 | 0 (0.0%) | 0 (0.0%) |
| $20,000 to $22,499 | 47 (3.2%) | 109 (9.0%) |
| $22,500 to $24,999 | 16 (1.1%) | 13 (1.1%) |
| $25,000 to $29,999 | 154 (10.5%) | 42 (3.5%) |
| $30,000 to $34,999 | 87 (5.9%) | 13 (1.1%) |
| $35,000 to $39,999 | 59 (4.0%) | 82 (6.8%) |
| $40,000 to $44,999 | 170 (11.6%) | 22 (1.8%) |
| $45,000 to $49,999 | 21 (1.4%) | 41 (3.4%) |
| $50,000 to $54,999 | 111 (7.5%) | 7 (0.6%) |
| $55,000 to $64,999 | 60 (4.1%) | 104 (8.6%) |
| $65,000 to $74,999 | 128 (8.7%) | 138 (11.4%) |
| $75,000 to $99,999 | 76 (5.2%) | 43 (3.6%) |
| $100,000+ | 240 (16.3%) | 47 (3.9%) |
| Total | 1,472 (100.0%) | 1,209 (100.0%) |
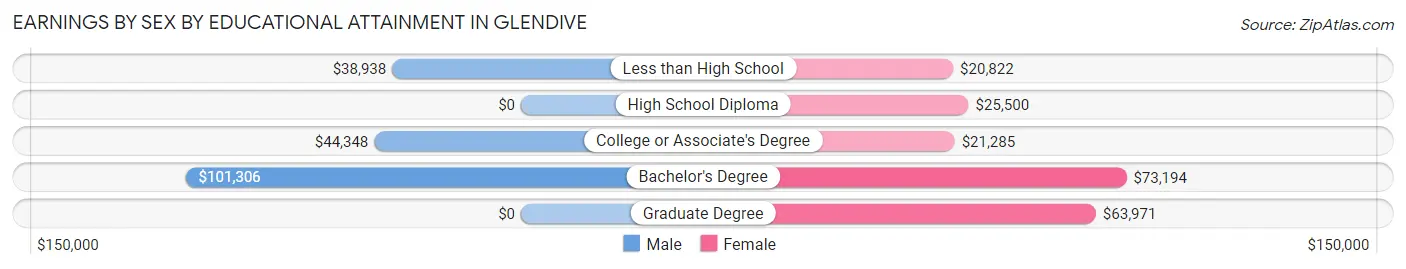
Earnings by Sex by Educational Attainment in Glendive
Average earnings in Glendive are $51,731 for men and $24,519 for women, a difference of 52.6%. Men with an educational attainment of bachelor's degree enjoy the highest average annual earnings of $101,306, while those with less than high school education earn the least with $38,938. Women with an educational attainment of bachelor's degree earn the most with the average annual earnings of $73,194, while those with less than high school education have the smallest earnings of $20,822.
| Educational Attainment | Male Income | Female Income |
| Less than High School | $38,938 | $20,822 |
| High School Diploma | - | - |
| College or Associate's Degree | $44,348 | $21,285 |
| Bachelor's Degree | $101,306 | $73,194 |
| Graduate Degree | - | - |
| Total | $51,731 | $24,519 |
Family Income in Glendive
Family Income Brackets in Glendive
According to the Glendive family income data, there are 304 families falling into the $100,000 to $149,999 income range, which is the most common income bracket and makes up 25.8% of all families.
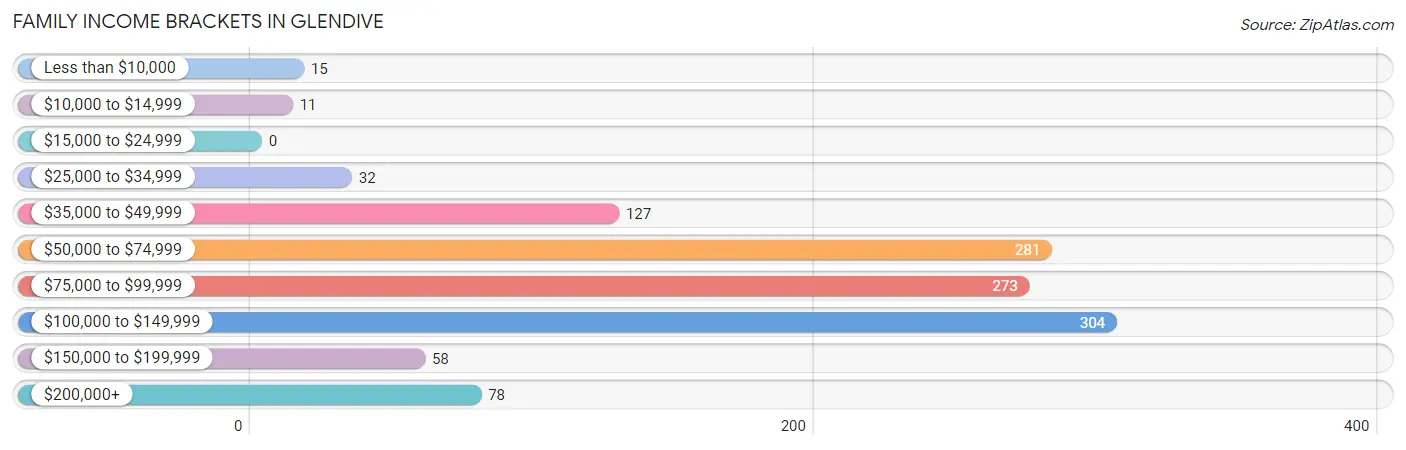
| Income Bracket | # Families | % Families |
| Less than $10,000 | 15 | 1.3% |
| $10,000 to $14,999 | 11 | 0.9% |
| $15,000 to $24,999 | 0 | 0.0% |
| $25,000 to $34,999 | 32 | 2.7% |
| $35,000 to $49,999 | 127 | 10.8% |
| $50,000 to $74,999 | 281 | 23.8% |
| $75,000 to $99,999 | 273 | 23.1% |
| $100,000 to $149,999 | 304 | 25.8% |
| $150,000 to $199,999 | 58 | 4.9% |
| $200,000+ | 78 | 6.6% |
Family Income by Famaliy Size in Glendive
5-person families (94 | 8.0%) account for the highest median family income in Glendive with $115,865 per family, while 2-person families (734 | 62.2%) have the highest median income of $39,432 per family member.
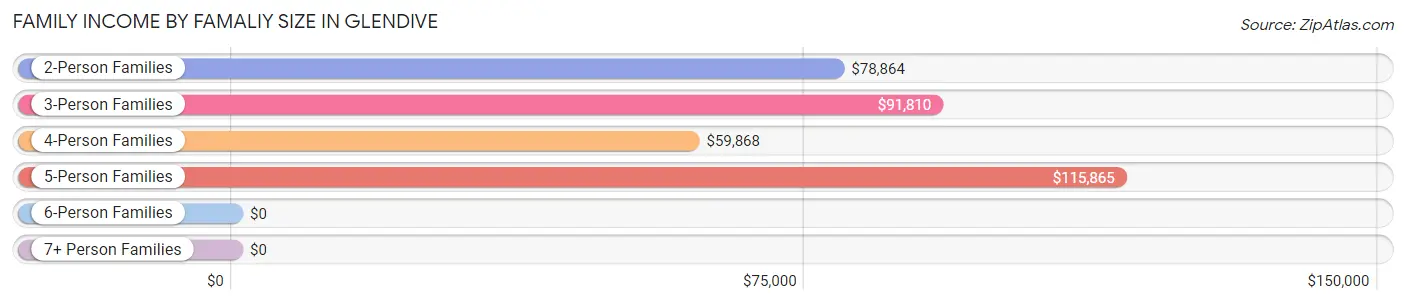
| Income Bracket | # Families | Median Income |
| 2-Person Families | 734 (62.2%) | $78,864 |
| 3-Person Families | 178 (15.1%) | $91,810 |
| 4-Person Families | 174 (14.7%) | $59,868 |
| 5-Person Families | 94 (8.0%) | $115,865 |
| 6-Person Families | 0 (0.0%) | $0 |
| 7+ Person Families | 0 (0.0%) | $0 |
| Total | 1,180 (100.0%) | $79,920 |
Family Income by Number of Earners in Glendive
The median family income in Glendive is $79,920, with families comprising 2 earners (446) having the highest median family income of $105,167, while families with 1 earner (469) have the lowest median family income of $59,806, accounting for 37.8% and 39.8% of families, respectively.
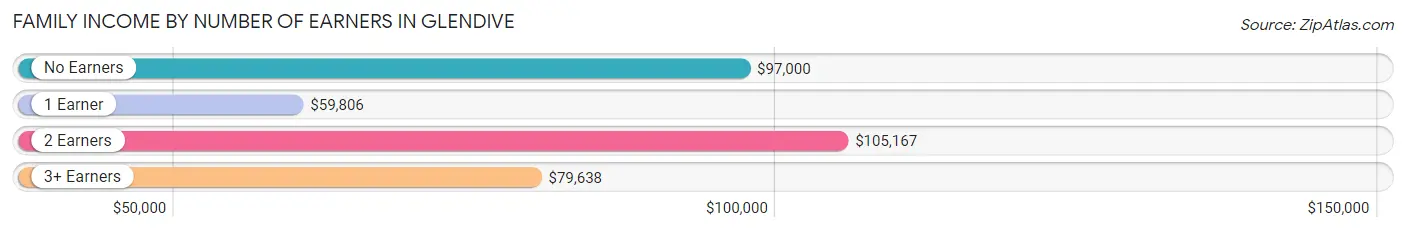
| Number of Earners | # Families | Median Income |
| No Earners | 136 (11.5%) | $97,000 |
| 1 Earner | 469 (39.8%) | $59,806 |
| 2 Earners | 446 (37.8%) | $105,167 |
| 3+ Earners | 129 (10.9%) | $79,638 |
| Total | 1,180 (100.0%) | $79,920 |
Household Income in Glendive
Household Income Brackets in Glendive
With 468 households falling in the category, the $50,000 to $74,999 income range is the most frequent in Glendive, accounting for 23.5% of all households. In contrast, only 32 households (1.6%) fall into the less than $10,000 income bracket, making it the least populous group.
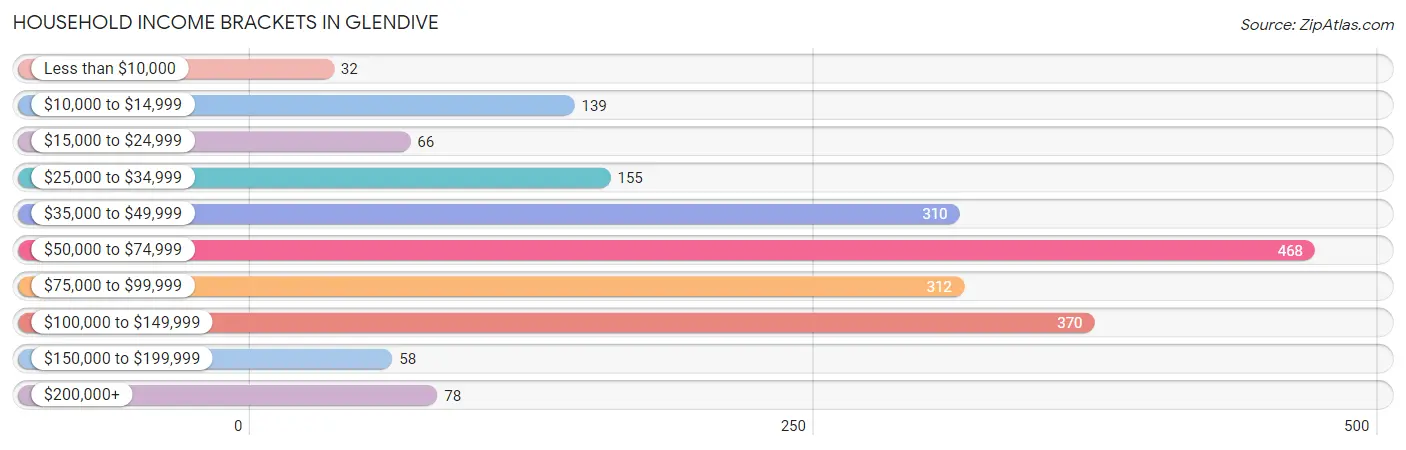
| Income Bracket | # Households | % Households |
| Less than $10,000 | 32 | 1.6% |
| $10,000 to $14,999 | 139 | 7.0% |
| $15,000 to $24,999 | 66 | 3.3% |
| $25,000 to $34,999 | 155 | 7.8% |
| $35,000 to $49,999 | 310 | 15.6% |
| $50,000 to $74,999 | 468 | 23.5% |
| $75,000 to $99,999 | 312 | 15.7% |
| $100,000 to $149,999 | 370 | 18.6% |
| $150,000 to $199,999 | 58 | 2.9% |
| $200,000+ | 78 | 3.9% |
Household Income by Householder Age in Glendive
The median household income in Glendive is $65,663, with the highest median household income of $76,953 found in the 45 to 64 years age bracket for the primary householder. A total of 742 households (37.3%) fall into this category. Meanwhile, the 15 to 24 years age bracket for the primary householder has the lowest median household income of $0, with 87 households (4.4%) in this group.
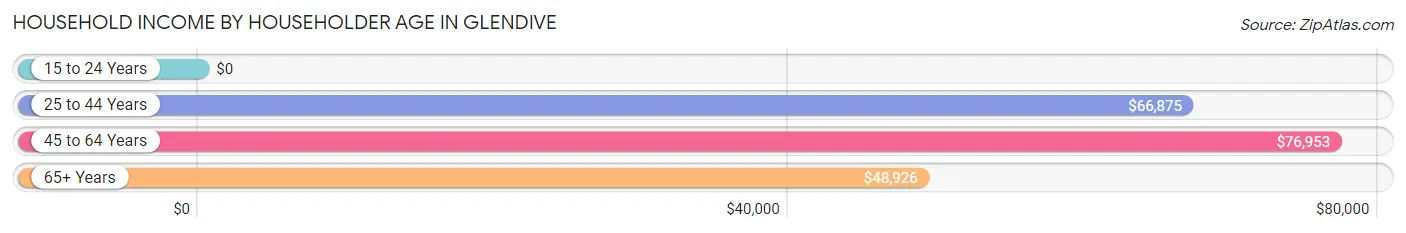
| Income Bracket | # Households | Median Income |
| 15 to 24 Years | 87 (4.4%) | $0 |
| 25 to 44 Years | 564 (28.3%) | $66,875 |
| 45 to 64 Years | 742 (37.3%) | $76,953 |
| 65+ Years | 597 (30.0%) | $48,926 |
| Total | 1,990 (100.0%) | $65,663 |
Poverty in Glendive
Income Below Poverty by Sex and Age in Glendive
With 4.5% poverty level for males and 12.4% for females among the residents of Glendive, 16 and 17 year old males and 18 to 24 year old females are the most vulnerable to poverty, with 34 males (37.4%) and 70 females (100.0%) in their respective age groups living below the poverty level.
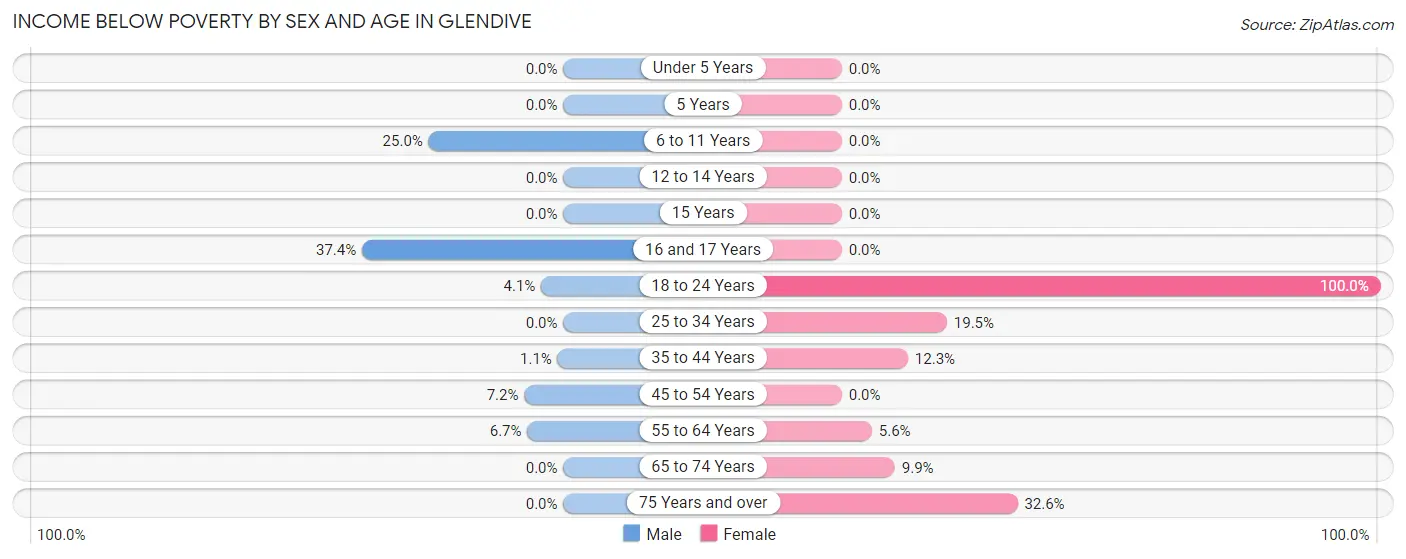
| Age Bracket | Male | Female |
| Under 5 Years | 0 (0.0%) | 0 (0.0%) |
| 5 Years | 0 (0.0%) | 0 (0.0%) |
| 6 to 11 Years | 14 (25.0%) | 0 (0.0%) |
| 12 to 14 Years | 0 (0.0%) | 0 (0.0%) |
| 15 Years | 0 (0.0%) | 0 (0.0%) |
| 16 and 17 Years | 34 (37.4%) | 0 (0.0%) |
| 18 to 24 Years | 8 (4.1%) | 70 (100.0%) |
| 25 to 34 Years | 0 (0.0%) | 55 (19.5%) |
| 35 to 44 Years | 3 (1.1%) | 34 (12.3%) |
| 45 to 54 Years | 11 (7.2%) | 0 (0.0%) |
| 55 to 64 Years | 26 (6.7%) | 24 (5.6%) |
| 65 to 74 Years | 0 (0.0%) | 27 (9.9%) |
| 75 Years and over | 0 (0.0%) | 74 (32.6%) |
| Total | 96 (4.5%) | 284 (12.4%) |
Income Above Poverty by Sex and Age in Glendive
According to the poverty statistics in Glendive, males aged under 5 years and females aged under 5 years are the age groups that are most secure financially, with 100.0% of males and 100.0% of females in these age groups living above the poverty line.
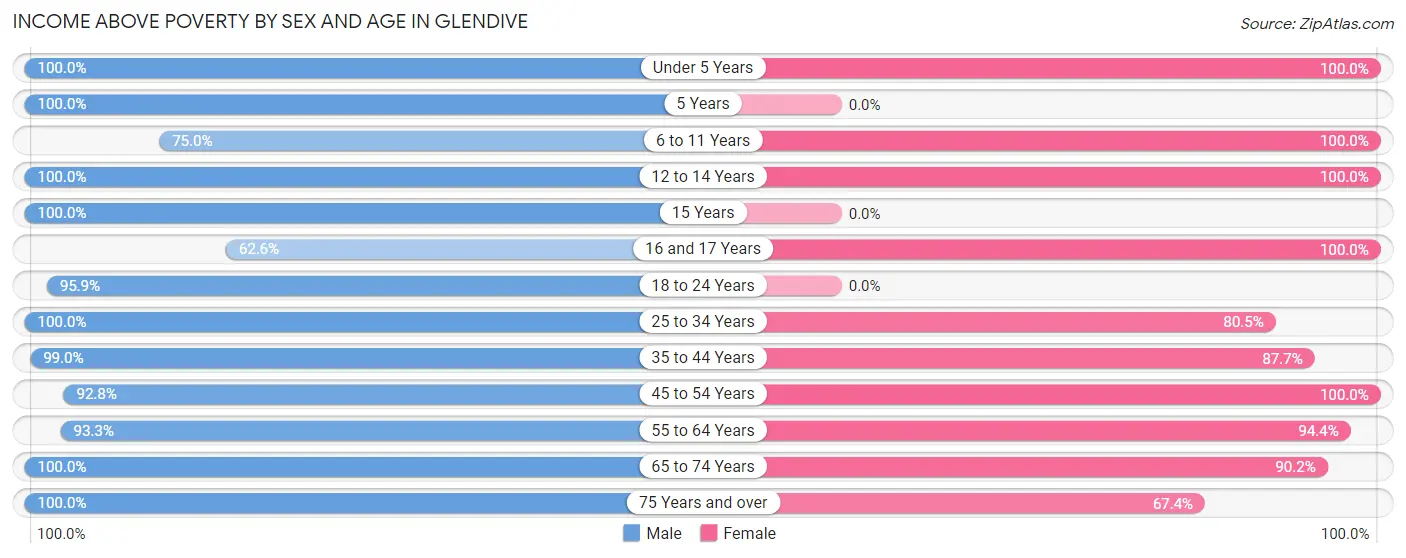
| Age Bracket | Male | Female |
| Under 5 Years | 98 (100.0%) | 196 (100.0%) |
| 5 Years | 33 (100.0%) | 0 (0.0%) |
| 6 to 11 Years | 42 (75.0%) | 92 (100.0%) |
| 12 to 14 Years | 148 (100.0%) | 199 (100.0%) |
| 15 Years | 40 (100.0%) | 0 (0.0%) |
| 16 and 17 Years | 57 (62.6%) | 77 (100.0%) |
| 18 to 24 Years | 186 (95.9%) | 0 (0.0%) |
| 25 to 34 Years | 287 (100.0%) | 227 (80.5%) |
| 35 to 44 Years | 283 (99.0%) | 243 (87.7%) |
| 45 to 54 Years | 141 (92.8%) | 165 (100.0%) |
| 55 to 64 Years | 363 (93.3%) | 406 (94.4%) |
| 65 to 74 Years | 293 (100.0%) | 247 (90.1%) |
| 75 Years and over | 66 (100.0%) | 153 (67.4%) |
| Total | 2,037 (95.5%) | 2,005 (87.6%) |
Income Below Poverty Among Married-Couple Families in Glendive
The poverty statistics for married-couple families in Glendive show that 1.7% or 15 of the total 877 families live below the poverty line. Families with no children have the highest poverty rate of 2.4%, comprising of 15 families. On the other hand, families with 1 or 2 children have the lowest poverty rate of 0.0%, which includes 0 families.
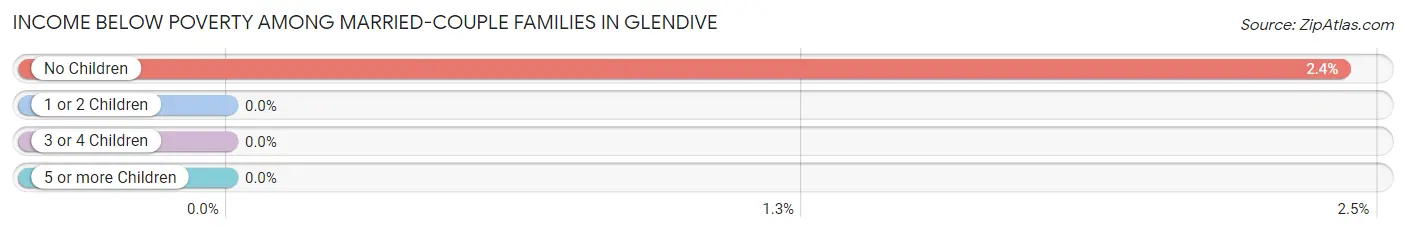
| Children | Above Poverty | Below Poverty |
| No Children | 606 (97.6%) | 15 (2.4%) |
| 1 or 2 Children | 200 (100.0%) | 0 (0.0%) |
| 3 or 4 Children | 56 (100.0%) | 0 (0.0%) |
| 5 or more Children | 0 (0.0%) | 0 (0.0%) |
| Total | 862 (98.3%) | 15 (1.7%) |
Income Below Poverty Among Single-Parent Households in Glendive
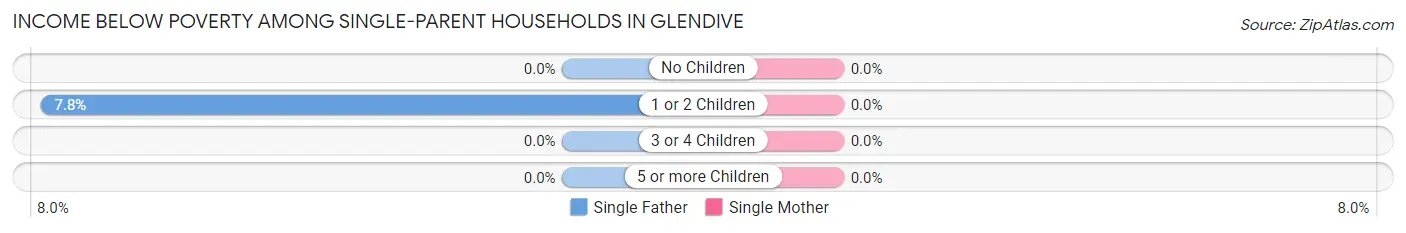
| Children | Single Father | Single Mother |
| No Children | 0 (0.0%) | 0 (0.0%) |
| 1 or 2 Children | 11 (7.7%) | 0 (0.0%) |
| 3 or 4 Children | 0 (0.0%) | 0 (0.0%) |
| 5 or more Children | 0 (0.0%) | 0 (0.0%) |
| Total | 11 (5.6%) | 0 (0.0%) |
Income Below Poverty Among Married-Couple vs Single-Parent Households in Glendive
The poverty data for Glendive shows that 15 of the married-couple family households (1.7%) and 11 of the single-parent households (3.6%) are living below the poverty level. Within the married-couple family households, those with no children have the highest poverty rate, with 15 households (2.4%) falling below the poverty line. Among the single-parent households, those with 1 or 2 children have the highest poverty rate, with 11 household (4.7%) living below poverty.
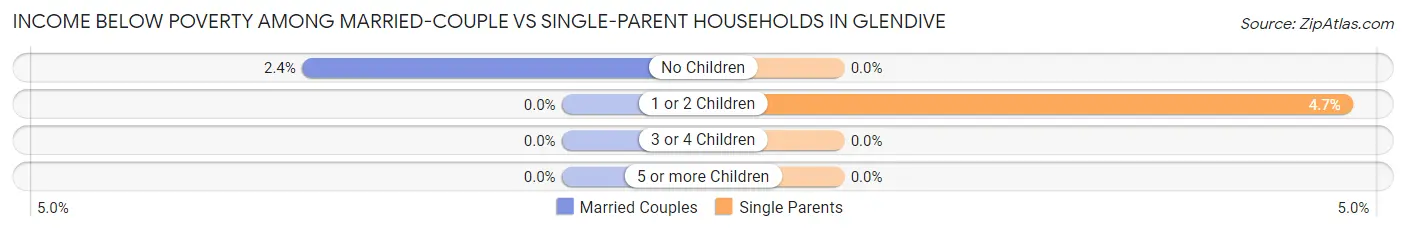
| Children | Married-Couple Families | Single-Parent Households |
| No Children | 15 (2.4%) | 0 (0.0%) |
| 1 or 2 Children | 0 (0.0%) | 11 (4.7%) |
| 3 or 4 Children | 0 (0.0%) | 0 (0.0%) |
| 5 or more Children | 0 (0.0%) | 0 (0.0%) |
| Total | 15 (1.7%) | 11 (3.6%) |
Race in Glendive
The most populous races in Glendive are White / Caucasian (4,587 | 94.4%), Hispanic or Latino (166 | 3.4%), and Two or more Races (135 | 2.8%).
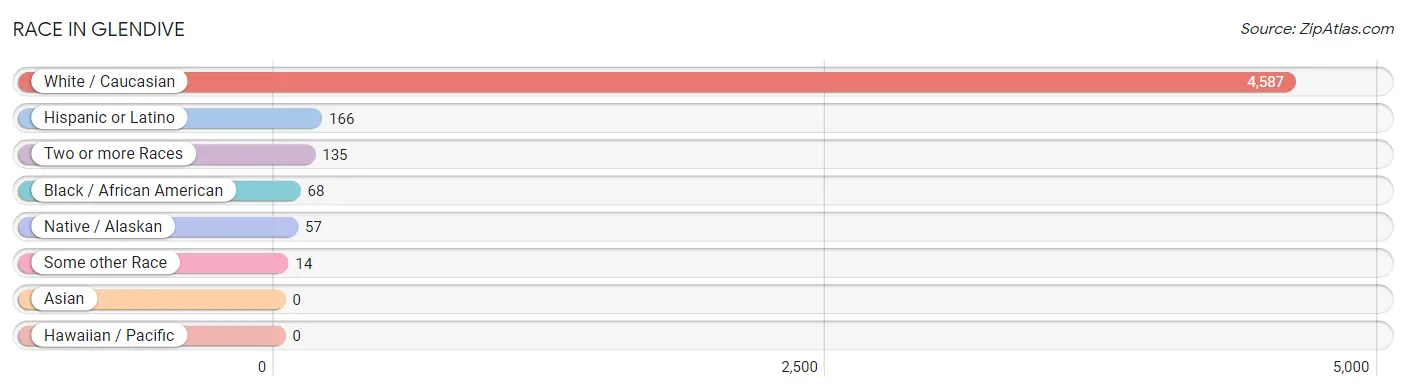
| Race | # Population | % Population |
| Asian | 0 | 0.0% |
| Black / African American | 68 | 1.4% |
| Hawaiian / Pacific | 0 | 0.0% |
| Hispanic or Latino | 166 | 3.4% |
| Native / Alaskan | 57 | 1.2% |
| White / Caucasian | 4,587 | 94.4% |
| Two or more Races | 135 | 2.8% |
| Some other Race | 14 | 0.3% |
| Total | 4,861 | 100.0% |
Ancestry in Glendive
The most populous ancestries reported in Glendive are German (1,722 | 35.4%), Irish (928 | 19.1%), Norwegian (506 | 10.4%), English (467 | 9.6%), and Italian (256 | 5.3%), together accounting for 79.8% of all Glendive residents.
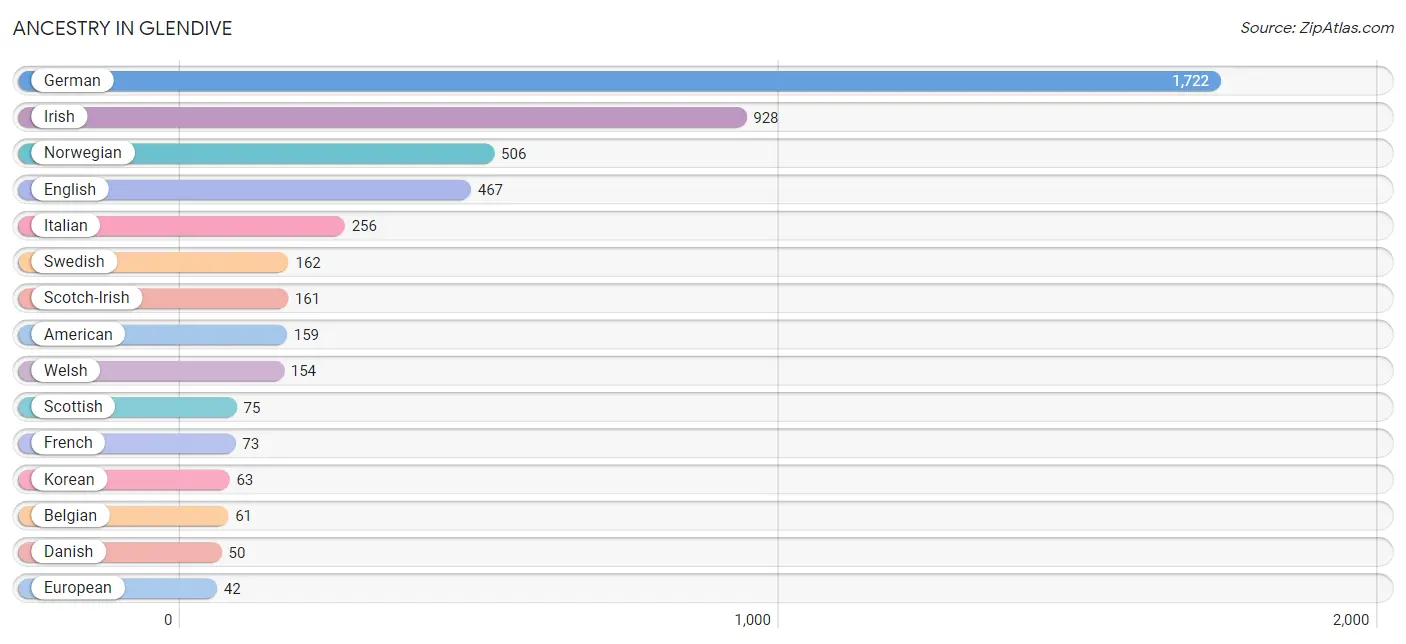
| Ancestry | # Population | % Population |
| American | 159 | 3.3% |
| Belgian | 61 | 1.3% |
| Bhutanese | 7 | 0.1% |
| Blackfeet | 4 | 0.1% |
| Brazilian | 41 | 0.8% |
| Colville | 6 | 0.1% |
| Cree | 4 | 0.1% |
| Croatian | 21 | 0.4% |
| Crow | 14 | 0.3% |
| Czech | 12 | 0.3% |
| Czechoslovakian | 13 | 0.3% |
| Danish | 50 | 1.0% |
| Dutch | 39 | 0.8% |
| English | 467 | 9.6% |
| European | 42 | 0.9% |
| Finnish | 13 | 0.3% |
| French | 73 | 1.5% |
| French Canadian | 4 | 0.1% |
| German | 1,722 | 35.4% |
| Hungarian | 13 | 0.3% |
| Irish | 928 | 19.1% |
| Italian | 256 | 5.3% |
| Korean | 63 | 1.3% |
| Macedonian | 28 | 0.6% |
| Mexican | 14 | 0.3% |
| Northern European | 4 | 0.1% |
| Norwegian | 506 | 10.4% |
| Polish | 38 | 0.8% |
| Scandinavian | 28 | 0.6% |
| Scotch-Irish | 161 | 3.3% |
| Scottish | 75 | 1.5% |
| Sioux | 8 | 0.2% |
| South American | 32 | 0.7% |
| Swedish | 162 | 3.3% |
| Swiss | 3 | 0.1% |
| Ukrainian | 30 | 0.6% |
| Uruguayan | 32 | 0.7% |
| Welsh | 154 | 3.2% | View All 38 Rows |
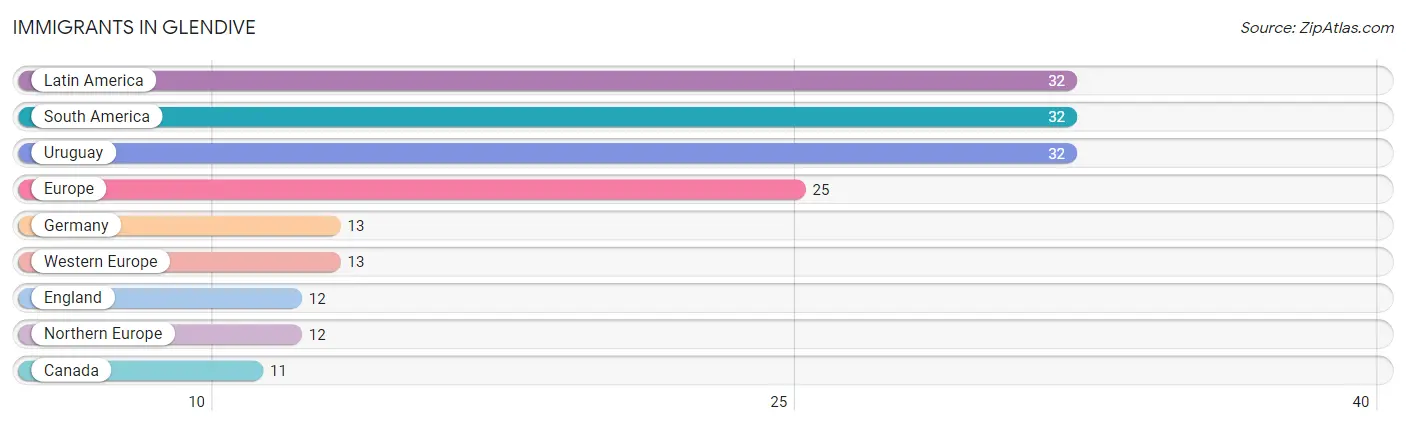
Immigrants in Glendive
The most numerous immigrant groups reported in Glendive came from Latin America (32 | 0.7%), South America (32 | 0.7%), Uruguay (32 | 0.7%), Europe (25 | 0.5%), and Germany (13 | 0.3%), together accounting for 2.8% of all Glendive residents.
| Immigration Origin | # Population | % Population |
| Canada | 11 | 0.2% |
| England | 12 | 0.3% |
| Europe | 25 | 0.5% |
| Germany | 13 | 0.3% |
| Latin America | 32 | 0.7% |
| Northern Europe | 12 | 0.3% |
| South America | 32 | 0.7% |
| Uruguay | 32 | 0.7% |
| Western Europe | 13 | 0.3% | View All 9 Rows |
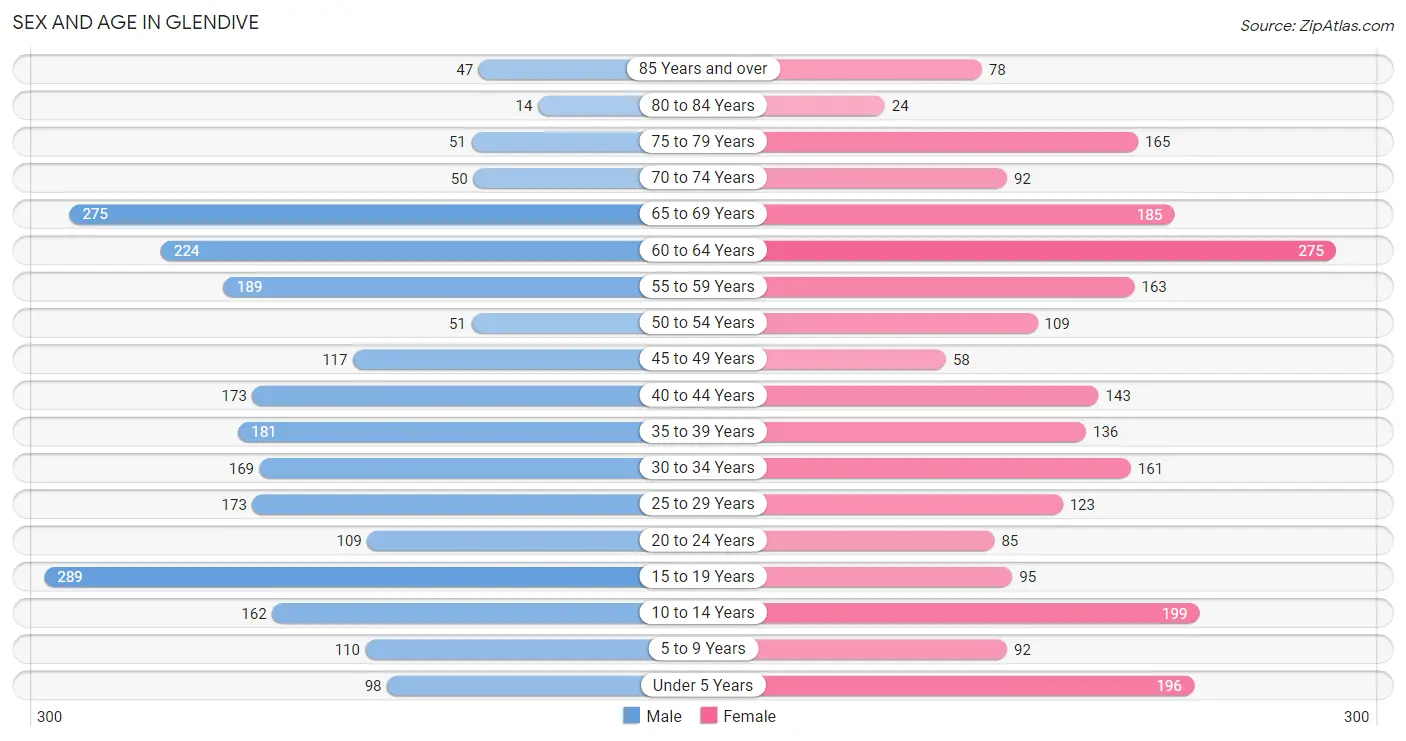
Sex and Age in Glendive
Sex and Age in Glendive
The most populous age groups in Glendive are 15 to 19 Years (289 | 11.6%) for men and 60 to 64 Years (275 | 11.6%) for women.
| Age Bracket | Male | Female |
| Under 5 Years | 98 (4.0%) | 196 (8.2%) |
| 5 to 9 Years | 110 (4.4%) | 92 (3.9%) |
| 10 to 14 Years | 162 (6.5%) | 199 (8.4%) |
| 15 to 19 Years | 289 (11.6%) | 95 (4.0%) |
| 20 to 24 Years | 109 (4.4%) | 85 (3.6%) |
| 25 to 29 Years | 173 (7.0%) | 123 (5.2%) |
| 30 to 34 Years | 169 (6.8%) | 161 (6.8%) |
| 35 to 39 Years | 181 (7.3%) | 136 (5.7%) |
| 40 to 44 Years | 173 (7.0%) | 143 (6.0%) |
| 45 to 49 Years | 117 (4.7%) | 58 (2.4%) |
| 50 to 54 Years | 51 (2.1%) | 109 (4.6%) |
| 55 to 59 Years | 189 (7.6%) | 163 (6.9%) |
| 60 to 64 Years | 224 (9.0%) | 275 (11.6%) |
| 65 to 69 Years | 275 (11.1%) | 185 (7.8%) |
| 70 to 74 Years | 50 (2.0%) | 92 (3.9%) |
| 75 to 79 Years | 51 (2.1%) | 165 (6.9%) |
| 80 to 84 Years | 14 (0.6%) | 24 (1.0%) |
| 85 Years and over | 47 (1.9%) | 78 (3.3%) |
| Total | 2,482 (100.0%) | 2,379 (100.0%) |
Families and Households in Glendive
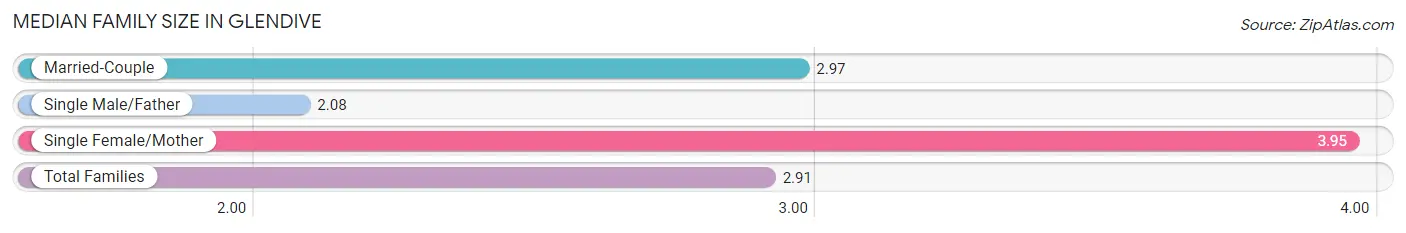
Median Family Size in Glendive
The median family size in Glendive is 2.91 persons per family, with single female/mother families (107 | 9.1%) accounting for the largest median family size of 3.95 persons per family. On the other hand, single male/father families (196 | 16.6%) represent the smallest median family size with 2.08 persons per family.
| Family Type | # Families | Family Size |
| Married-Couple | 877 (74.3%) | 2.97 |
| Single Male/Father | 196 (16.6%) | 2.08 |
| Single Female/Mother | 107 (9.1%) | 3.95 |
| Total Families | 1,180 (100.0%) | 2.91 |
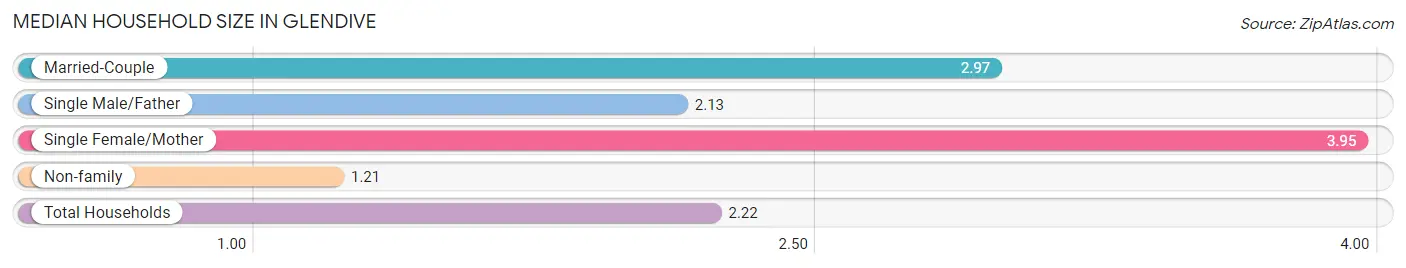
Median Household Size in Glendive
The median household size in Glendive is 2.22 persons per household, with single female/mother households (107 | 5.4%) accounting for the largest median household size of 3.95 persons per household. non-family households (810 | 40.7%) represent the smallest median household size with 1.21 persons per household.
| Household Type | # Households | Household Size |
| Married-Couple | 877 (44.1%) | 2.97 |
| Single Male/Father | 196 (9.9%) | 2.13 |
| Single Female/Mother | 107 (5.4%) | 3.95 |
| Non-family | 810 (40.7%) | 1.21 |
| Total Households | 1,990 (100.0%) | 2.22 |
Household Size by Marriage Status in Glendive
Out of a total of 1,990 households in Glendive, 1,180 (59.3%) are family households, while 810 (40.7%) are nonfamily households. The most numerous type of family households are 2-person households, comprising 734, and the most common type of nonfamily households are 1-person households, comprising 725.
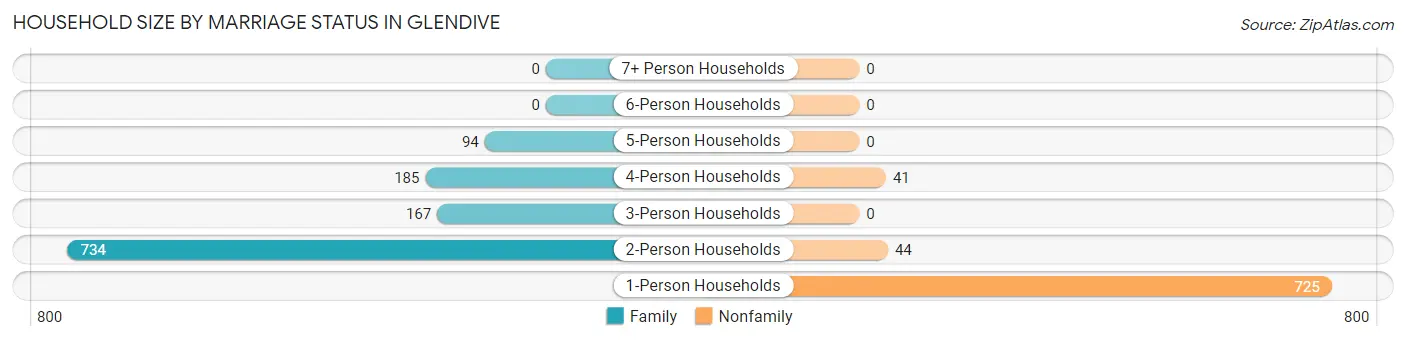
| Household Size | Family Households | Nonfamily Households |
| 1-Person Households | - | 725 (36.4%) |
| 2-Person Households | 734 (36.9%) | 44 (2.2%) |
| 3-Person Households | 167 (8.4%) | 0 (0.0%) |
| 4-Person Households | 185 (9.3%) | 41 (2.1%) |
| 5-Person Households | 94 (4.7%) | 0 (0.0%) |
| 6-Person Households | 0 (0.0%) | 0 (0.0%) |
| 7+ Person Households | 0 (0.0%) | 0 (0.0%) |
| Total | 1,180 (59.3%) | 810 (40.7%) |
Female Fertility in Glendive
Fertility by Age in Glendive
Average fertility rate in Glendive is 115.0 births per 1,000 women. Women in the age bracket of 20 to 34 years have the highest fertility rate with 260.0 births per 1,000 women. Women in the age bracket of 20 to 34 years acount for 100.0% of all women with births.
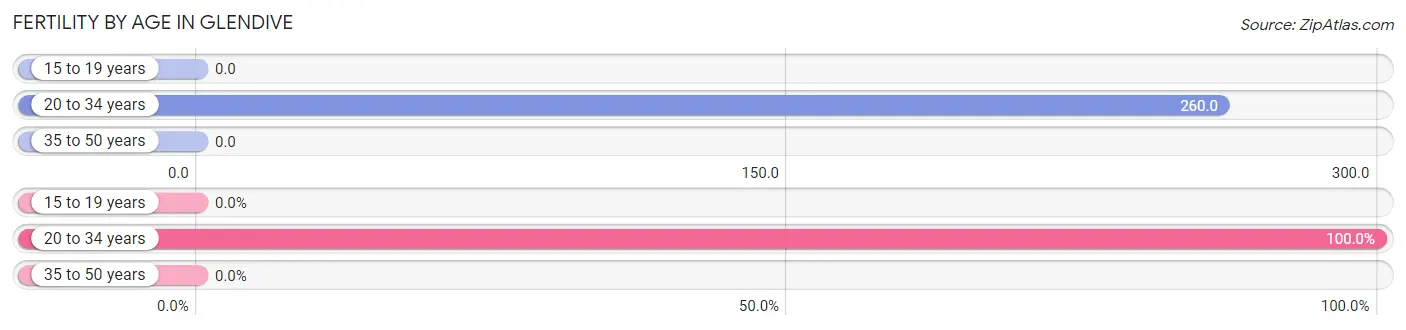
| Age Bracket | Women with Births | Births / 1,000 Women |
| 15 to 19 years | 0 (0.0%) | 0.0 |
| 20 to 34 years | 96 (100.0%) | 260.0 |
| 35 to 50 years | 0 (0.0%) | 0.0 |
| Total | 96 (100.0%) | 115.0 |
Fertility by Age by Marriage Status in Glendive
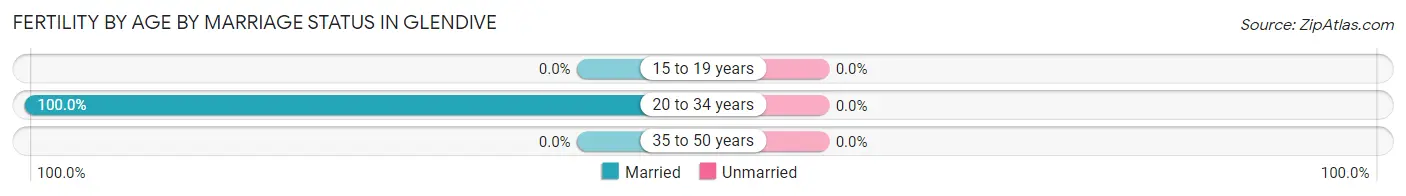
| Age Bracket | Married | Unmarried |
| 15 to 19 years | 0 (0.0%) | 0 (0.0%) |
| 20 to 34 years | 96 (100.0%) | 0 (0.0%) |
| 35 to 50 years | 0 (0.0%) | 0 (0.0%) |
| Total | 96 (100.0%) | 0 (0.0%) |
Fertility by Education in Glendive
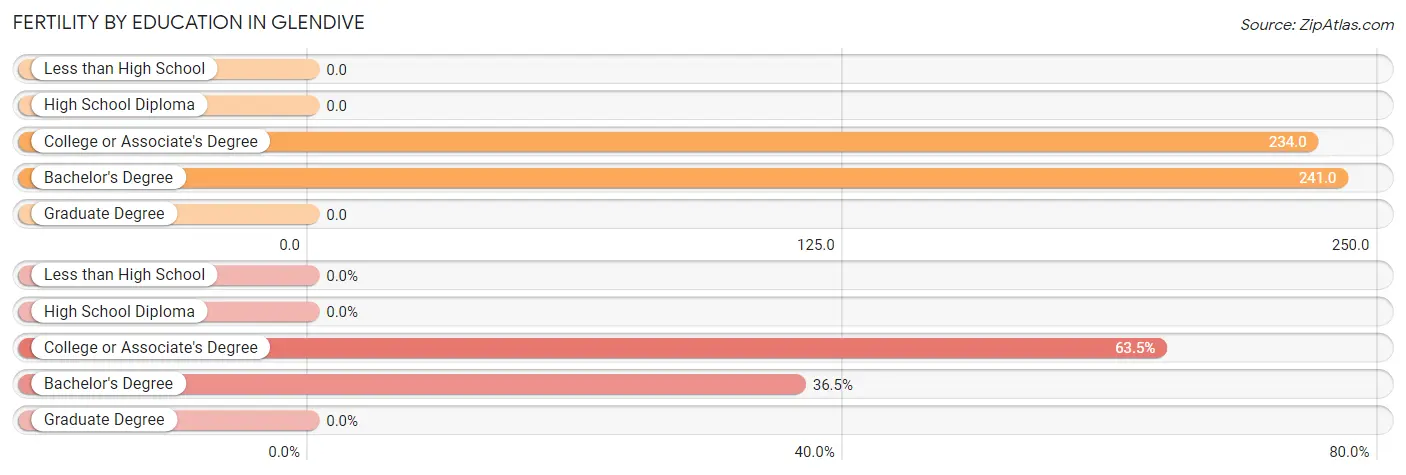
| Educational Attainment | Women with Births | Births / 1,000 Women |
| Less than High School | 0 (0.0%) | 0.0 |
| High School Diploma | 0 (0.0%) | 0.0 |
| College or Associate's Degree | 61 (63.5%) | 234.0 |
| Bachelor's Degree | 35 (36.5%) | 241.0 |
| Graduate Degree | 0 (0.0%) | 0.0 |
| Total | 96 (100.0%) | 115.0 |
Fertility by Education by Marriage Status in Glendive
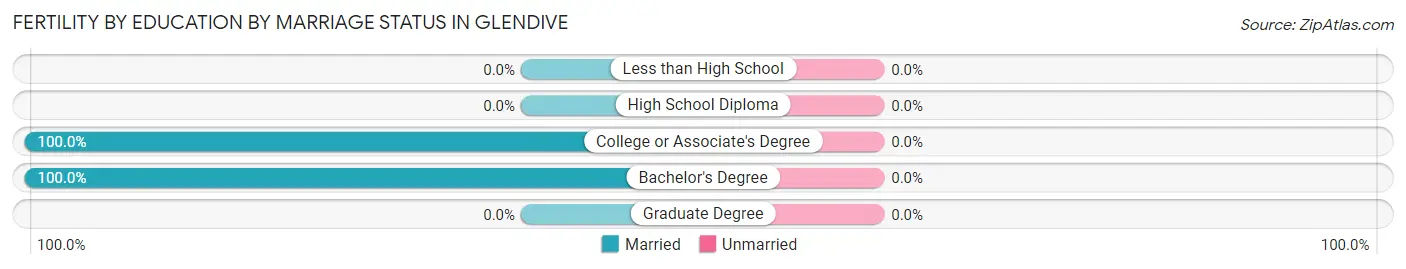
| Educational Attainment | Married | Unmarried |
| Less than High School | 0 (0.0%) | 0 (0.0%) |
| High School Diploma | 0 (0.0%) | 0 (0.0%) |
| College or Associate's Degree | 61 (100.0%) | 0 (0.0%) |
| Bachelor's Degree | 35 (100.0%) | 0 (0.0%) |
| Graduate Degree | 0 (0.0%) | 0 (0.0%) |
| Total | 96 (100.0%) | 0 (0.0%) |
Employment Characteristics in Glendive
Employment by Class of Employer in Glendive
Among the 2,248 employed individuals in Glendive, private company employees (1,334 | 59.3%), local government employees (301 | 13.4%), and state government employees (267 | 11.9%) make up the most common classes of employment.
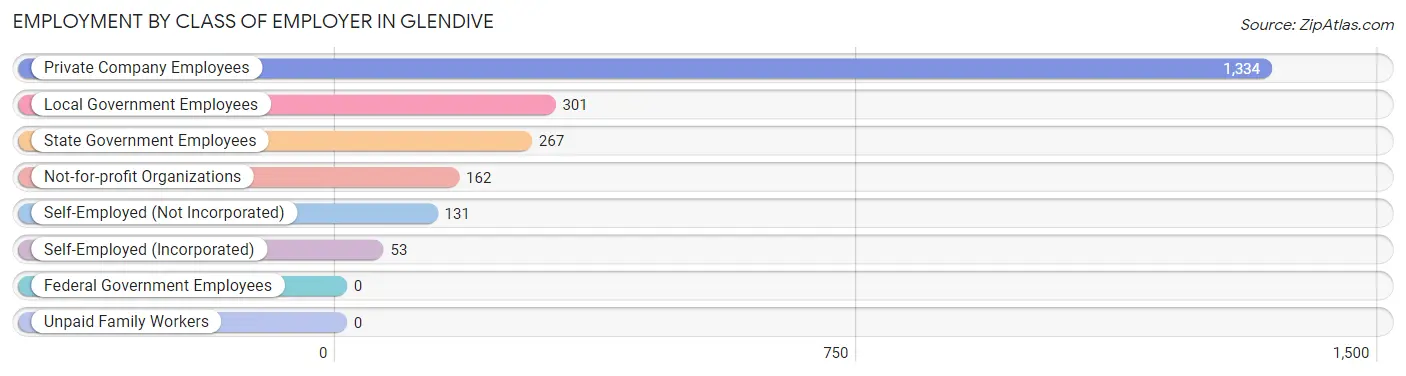
| Employer Class | # Employees | % Employees |
| Private Company Employees | 1,334 | 59.3% |
| Self-Employed (Incorporated) | 53 | 2.4% |
| Self-Employed (Not Incorporated) | 131 | 5.8% |
| Not-for-profit Organizations | 162 | 7.2% |
| Local Government Employees | 301 | 13.4% |
| State Government Employees | 267 | 11.9% |
| Federal Government Employees | 0 | 0.0% |
| Unpaid Family Workers | 0 | 0.0% |
| Total | 2,248 | 100.0% |
Employment Status by Age in Glendive
According to the labor force statistics for Glendive, out of the total population over 16 years of age (3,964), 59.1% or 2,343 individuals are in the labor force, with 4.1% or 96 of them unemployed. The age group with the highest labor force participation rate is 20 to 24 years, with 88.7% or 172 individuals in the labor force. Within the labor force, the 30 to 34 years age range has the highest percentage of unemployed individuals, with 10.3% or 28 of them being unemployed.
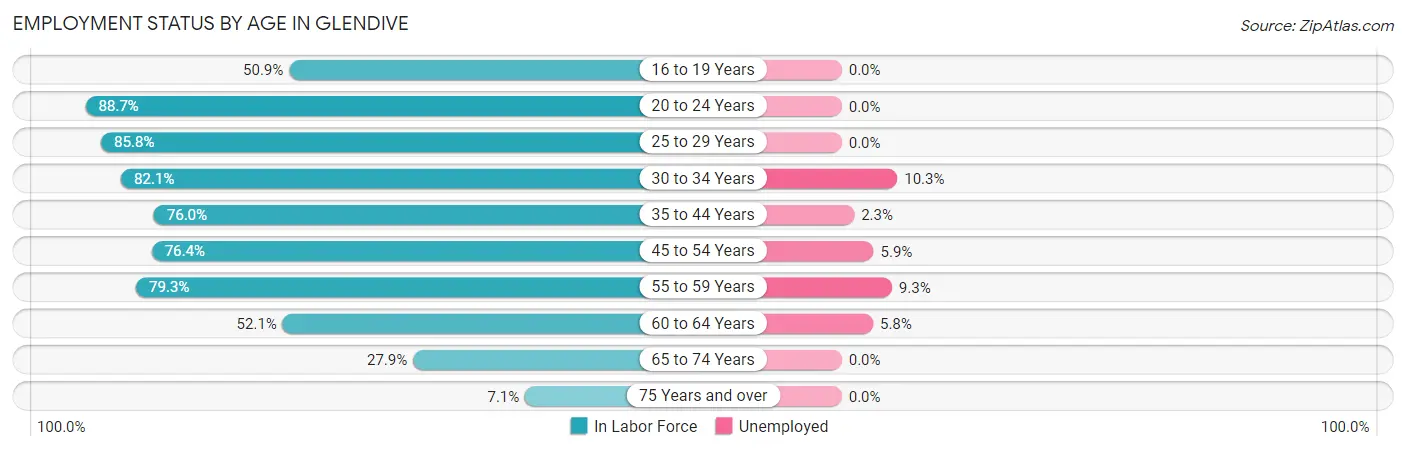
| Age Bracket | In Labor Force | Unemployed |
| 16 to 19 Years | 175 (50.9%) | 0 (0.0%) |
| 20 to 24 Years | 172 (88.7%) | 0 (0.0%) |
| 25 to 29 Years | 254 (85.8%) | 0 (0.0%) |
| 30 to 34 Years | 271 (82.1%) | 28 (10.3%) |
| 35 to 44 Years | 481 (76.0%) | 11 (2.3%) |
| 45 to 54 Years | 256 (76.4%) | 15 (5.9%) |
| 55 to 59 Years | 279 (79.3%) | 26 (9.3%) |
| 60 to 64 Years | 260 (52.1%) | 15 (5.8%) |
| 65 to 74 Years | 168 (27.9%) | 0 (0.0%) |
| 75 Years and over | 27 (7.1%) | 0 (0.0%) |
| Total | 2,343 (59.1%) | 96 (4.1%) |
Employment Status by Educational Attainment in Glendive
According to labor force statistics for Glendive, 73.7% of individuals (1,802) out of the total population between 25 and 64 years of age (2,445) are in the labor force, with 5.3% or 96 of them being unemployed. The group with the highest labor force participation rate are those with the educational attainment of bachelor's degree or higher, with 89.6% or 506 individuals in the labor force. Within the labor force, individuals with less than high school education have the highest percentage of unemployment, with 25.7% or 26 of them being unemployed.
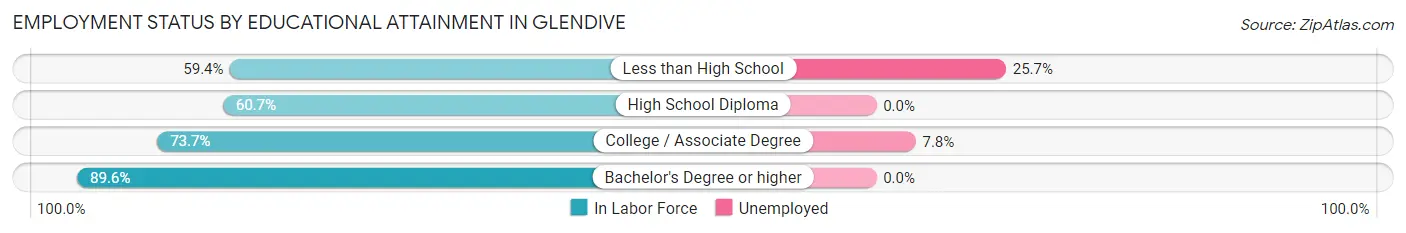
| Educational Attainment | In Labor Force | Unemployed |
| Less than High School | 101 (59.4%) | 44 (25.7%) |
| High School Diploma | 309 (60.7%) | 0 (0.0%) |
| College / Associate Degree | 885 (73.7%) | 94 (7.8%) |
| Bachelor's Degree or higher | 506 (89.6%) | 0 (0.0%) |
| Total | 1,802 (73.7%) | 130 (5.3%) |
Employment Occupations by Sex in Glendive
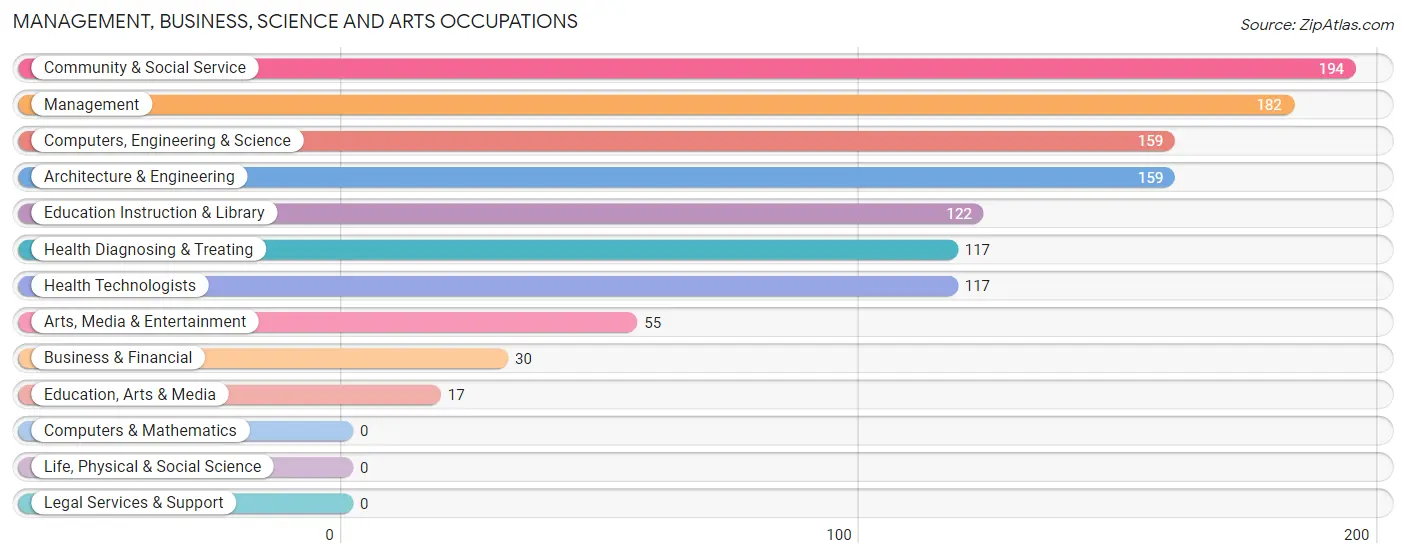
Management, Business, Science and Arts Occupations
The most common Management, Business, Science and Arts occupations in Glendive are Community & Social Service (194 | 8.6%), Management (182 | 8.1%), Computers, Engineering & Science (159 | 7.1%), Architecture & Engineering (159 | 7.1%), and Education Instruction & Library (122 | 5.4%).
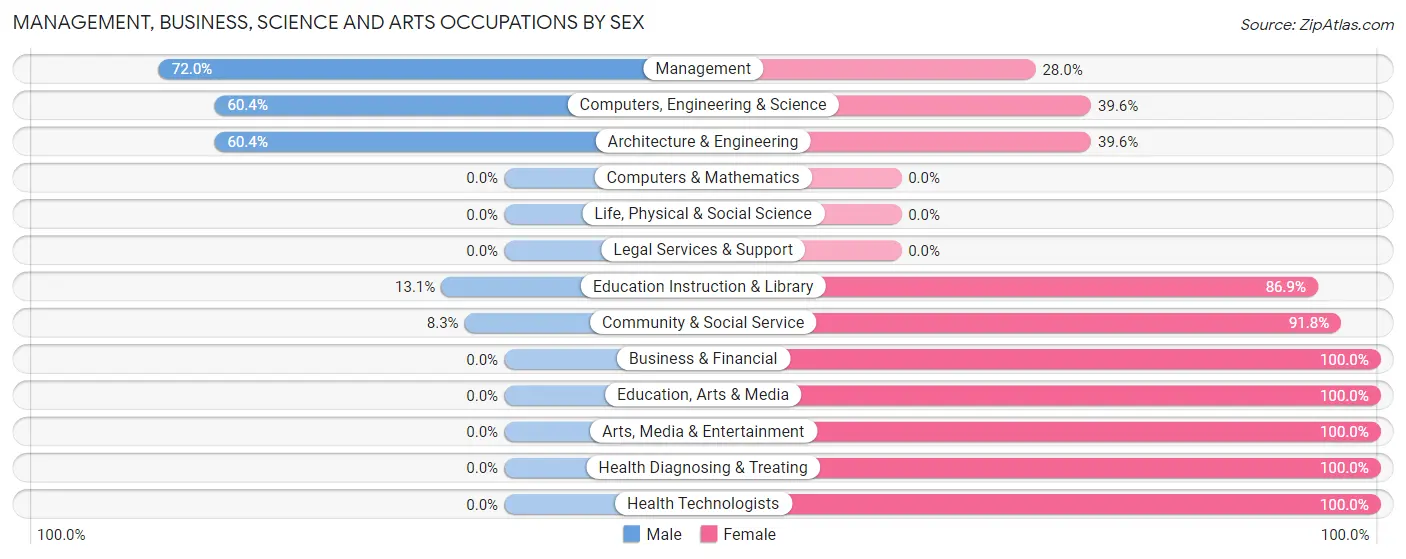
Management, Business, Science and Arts Occupations by Sex
Within the Management, Business, Science and Arts occupations in Glendive, the most male-oriented occupations are Management (72.0%), Computers, Engineering & Science (60.4%), and Architecture & Engineering (60.4%), while the most female-oriented occupations are Business & Financial (100.0%), Education, Arts & Media (100.0%), and Arts, Media & Entertainment (100.0%).
| Occupation | Male | Female |
| Management | 131 (72.0%) | 51 (28.0%) |
| Business & Financial | 0 (0.0%) | 30 (100.0%) |
| Computers, Engineering & Science | 96 (60.4%) | 63 (39.6%) |
| Computers & Mathematics | 0 (0.0%) | 0 (0.0%) |
| Architecture & Engineering | 96 (60.4%) | 63 (39.6%) |
| Life, Physical & Social Science | 0 (0.0%) | 0 (0.0%) |
| Community & Social Service | 16 (8.3%) | 178 (91.7%) |
| Education, Arts & Media | 0 (0.0%) | 17 (100.0%) |
| Legal Services & Support | 0 (0.0%) | 0 (0.0%) |
| Education Instruction & Library | 16 (13.1%) | 106 (86.9%) |
| Arts, Media & Entertainment | 0 (0.0%) | 55 (100.0%) |
| Health Diagnosing & Treating | 0 (0.0%) | 117 (100.0%) |
| Health Technologists | 0 (0.0%) | 117 (100.0%) |
| Total (Category) | 243 (35.6%) | 439 (64.4%) |
| Total (Overall) | 1,298 (57.7%) | 950 (42.3%) |
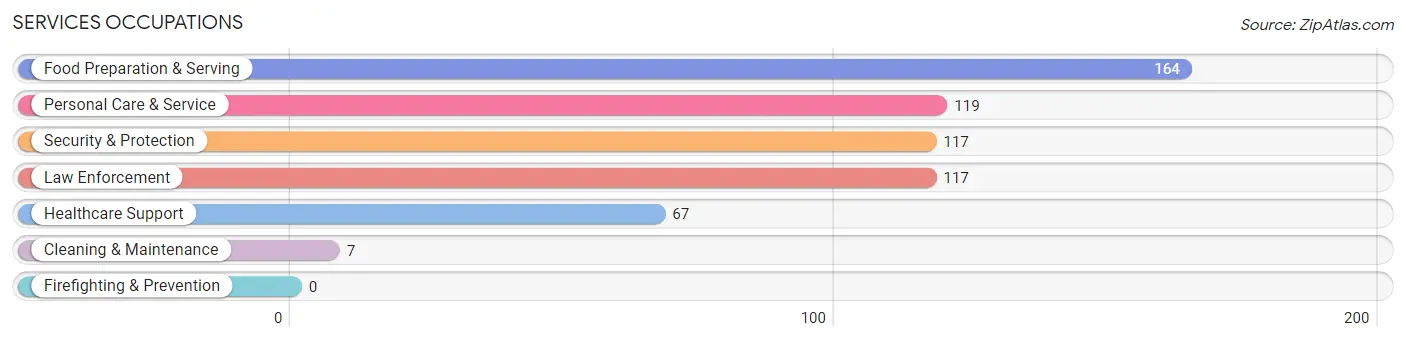
Services Occupations
The most common Services occupations in Glendive are Food Preparation & Serving (164 | 7.3%), Personal Care & Service (119 | 5.3%), Security & Protection (117 | 5.2%), Law Enforcement (117 | 5.2%), and Healthcare Support (67 | 3.0%).
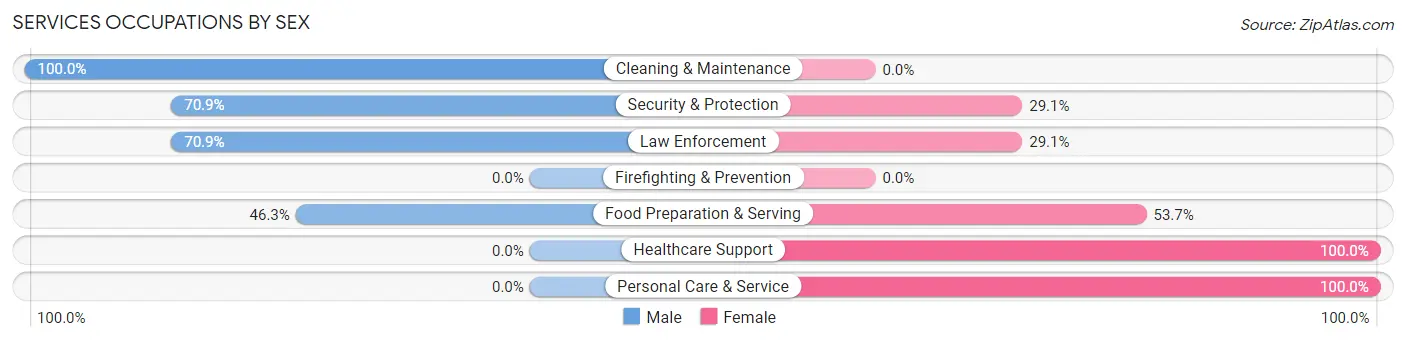
Services Occupations by Sex
Within the Services occupations in Glendive, the most male-oriented occupations are Cleaning & Maintenance (100.0%), Security & Protection (70.9%), and Law Enforcement (70.9%), while the most female-oriented occupations are Healthcare Support (100.0%), Personal Care & Service (100.0%), and Food Preparation & Serving (53.7%).
| Occupation | Male | Female |
| Healthcare Support | 0 (0.0%) | 67 (100.0%) |
| Security & Protection | 83 (70.9%) | 34 (29.1%) |
| Firefighting & Prevention | 0 (0.0%) | 0 (0.0%) |
| Law Enforcement | 83 (70.9%) | 34 (29.1%) |
| Food Preparation & Serving | 76 (46.3%) | 88 (53.7%) |
| Cleaning & Maintenance | 7 (100.0%) | 0 (0.0%) |
| Personal Care & Service | 0 (0.0%) | 119 (100.0%) |
| Total (Category) | 166 (35.0%) | 308 (65.0%) |
| Total (Overall) | 1,298 (57.7%) | 950 (42.3%) |
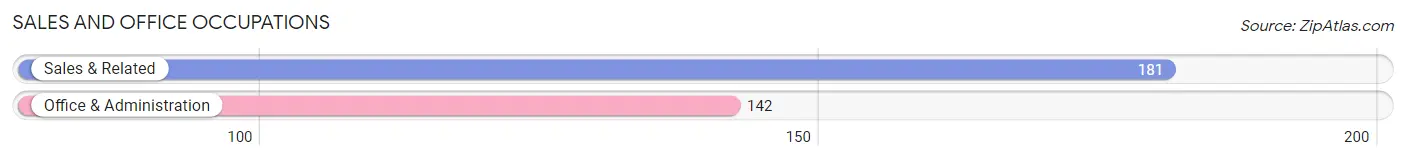
Sales and Office Occupations
The most common Sales and Office occupations in Glendive are Sales & Related (181 | 8.1%), and Office & Administration (142 | 6.3%).
Sales and Office Occupations by Sex
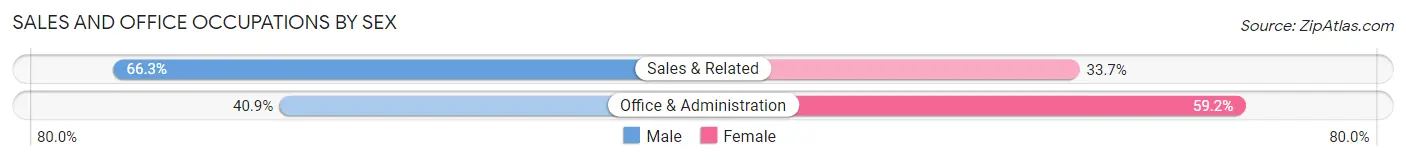
| Occupation | Male | Female |
| Sales & Related | 120 (66.3%) | 61 (33.7%) |
| Office & Administration | 58 (40.8%) | 84 (59.2%) |
| Total (Category) | 178 (55.1%) | 145 (44.9%) |
| Total (Overall) | 1,298 (57.7%) | 950 (42.3%) |
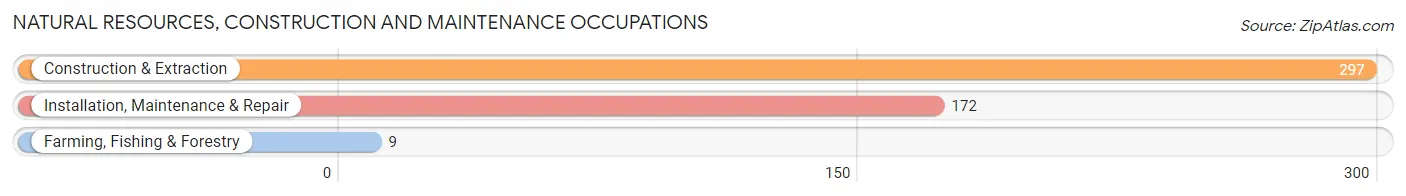
Natural Resources, Construction and Maintenance Occupations
The most common Natural Resources, Construction and Maintenance occupations in Glendive are Construction & Extraction (297 | 13.2%), Installation, Maintenance & Repair (172 | 7.6%), and Farming, Fishing & Forestry (9 | 0.4%).
Natural Resources, Construction and Maintenance Occupations by Sex
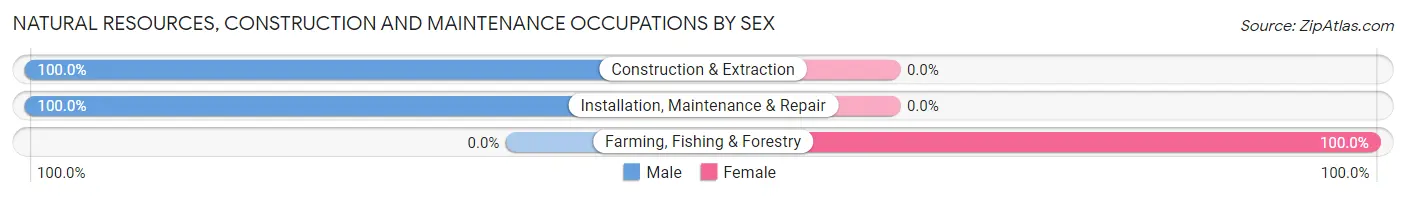
| Occupation | Male | Female |
| Farming, Fishing & Forestry | 0 (0.0%) | 9 (100.0%) |
| Construction & Extraction | 297 (100.0%) | 0 (0.0%) |
| Installation, Maintenance & Repair | 172 (100.0%) | 0 (0.0%) |
| Total (Category) | 469 (98.1%) | 9 (1.9%) |
| Total (Overall) | 1,298 (57.7%) | 950 (42.3%) |
Production, Transportation and Moving Occupations
The most common Production, Transportation and Moving occupations in Glendive are Material Moving (153 | 6.8%), Transportation (93 | 4.1%), and Production (45 | 2.0%).
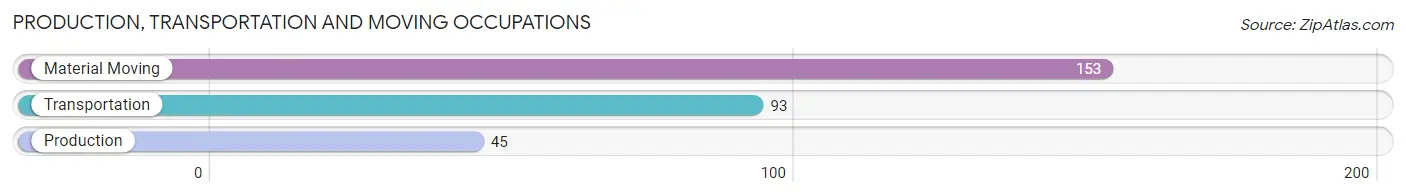
Production, Transportation and Moving Occupations by Sex
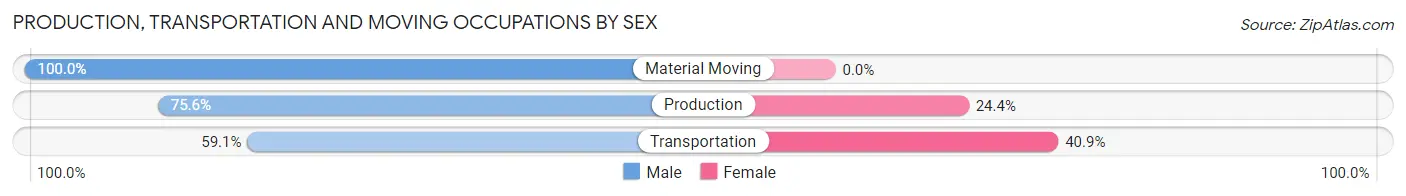
| Occupation | Male | Female |
| Production | 34 (75.6%) | 11 (24.4%) |
| Transportation | 55 (59.1%) | 38 (40.9%) |
| Material Moving | 153 (100.0%) | 0 (0.0%) |
| Total (Category) | 242 (83.2%) | 49 (16.8%) |
| Total (Overall) | 1,298 (57.7%) | 950 (42.3%) |
Employment Industries by Sex in Glendive
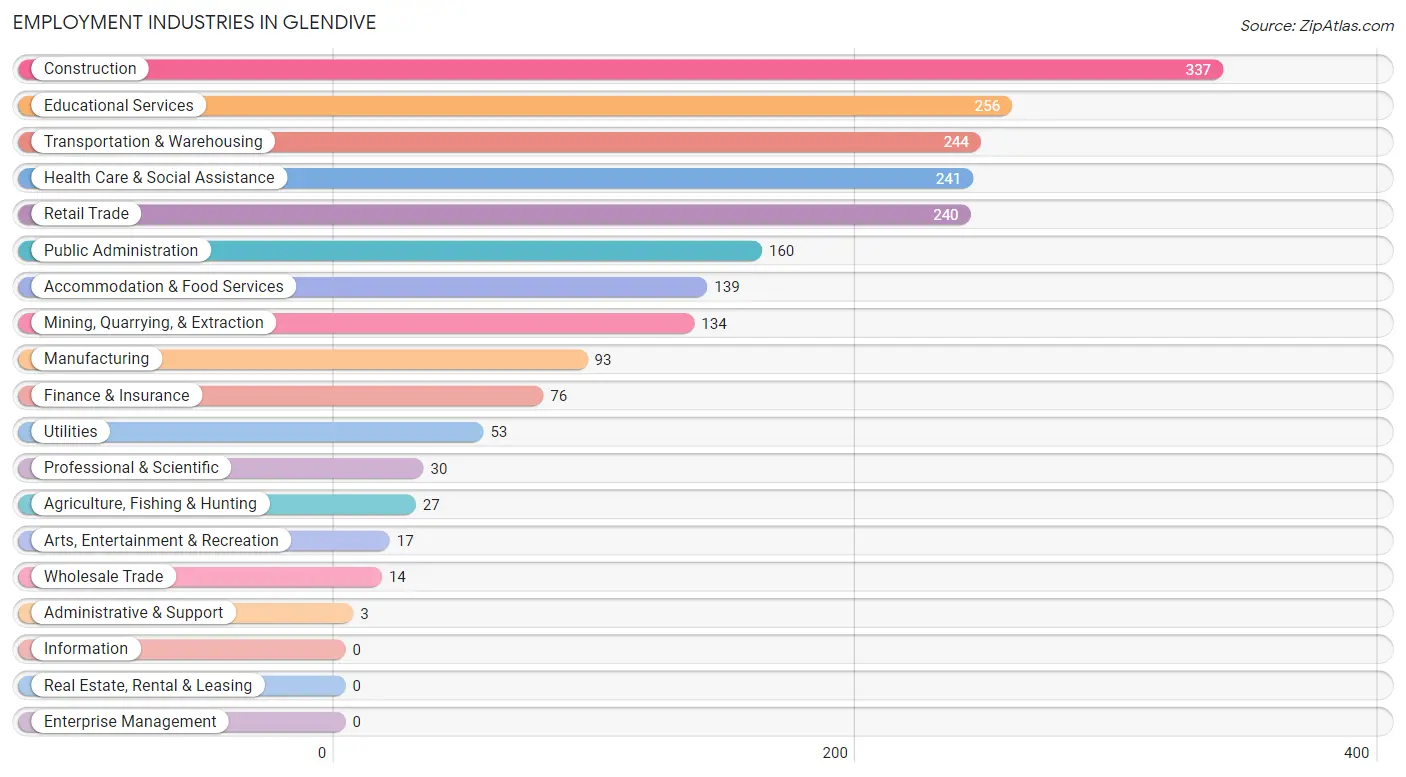
Employment Industries in Glendive
The major employment industries in Glendive include Construction (337 | 15.0%), Educational Services (256 | 11.4%), Transportation & Warehousing (244 | 10.8%), Health Care & Social Assistance (241 | 10.7%), and Retail Trade (240 | 10.7%).
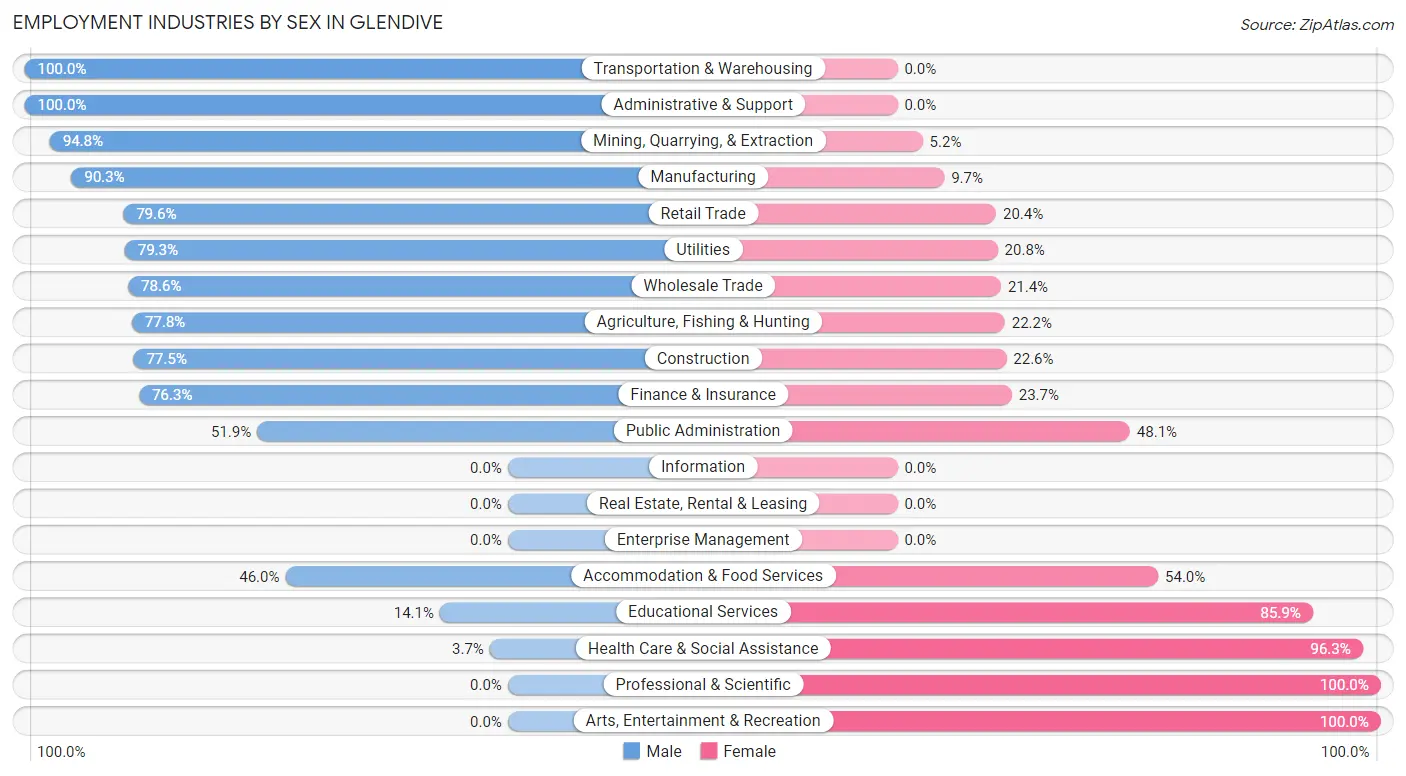
Employment Industries by Sex in Glendive
The Glendive industries that see more men than women are Transportation & Warehousing (100.0%), Administrative & Support (100.0%), and Mining, Quarrying, & Extraction (94.8%), whereas the industries that tend to have a higher number of women are Professional & Scientific (100.0%), Arts, Entertainment & Recreation (100.0%), and Health Care & Social Assistance (96.3%).
| Industry | Male | Female |
| Agriculture, Fishing & Hunting | 21 (77.8%) | 6 (22.2%) |
| Mining, Quarrying, & Extraction | 127 (94.8%) | 7 (5.2%) |
| Construction | 261 (77.4%) | 76 (22.6%) |
| Manufacturing | 84 (90.3%) | 9 (9.7%) |
| Wholesale Trade | 11 (78.6%) | 3 (21.4%) |
| Retail Trade | 191 (79.6%) | 49 (20.4%) |
| Transportation & Warehousing | 244 (100.0%) | 0 (0.0%) |
| Utilities | 42 (79.2%) | 11 (20.7%) |
| Information | 0 (0.0%) | 0 (0.0%) |
| Finance & Insurance | 58 (76.3%) | 18 (23.7%) |
| Real Estate, Rental & Leasing | 0 (0.0%) | 0 (0.0%) |
| Professional & Scientific | 0 (0.0%) | 30 (100.0%) |
| Enterprise Management | 0 (0.0%) | 0 (0.0%) |
| Administrative & Support | 3 (100.0%) | 0 (0.0%) |
| Educational Services | 36 (14.1%) | 220 (85.9%) |
| Health Care & Social Assistance | 9 (3.7%) | 232 (96.3%) |
| Arts, Entertainment & Recreation | 0 (0.0%) | 17 (100.0%) |
| Accommodation & Food Services | 64 (46.0%) | 75 (54.0%) |
| Public Administration | 83 (51.9%) | 77 (48.1%) |
| Total | 1,298 (57.7%) | 950 (42.3%) |
Education in Glendive
School Enrollment in Glendive
The most common levels of schooling among the 1,180 students in Glendive are high school (397 | 33.6%), college / undergraduate (261 | 22.1%), and middle school (242 | 20.5%).
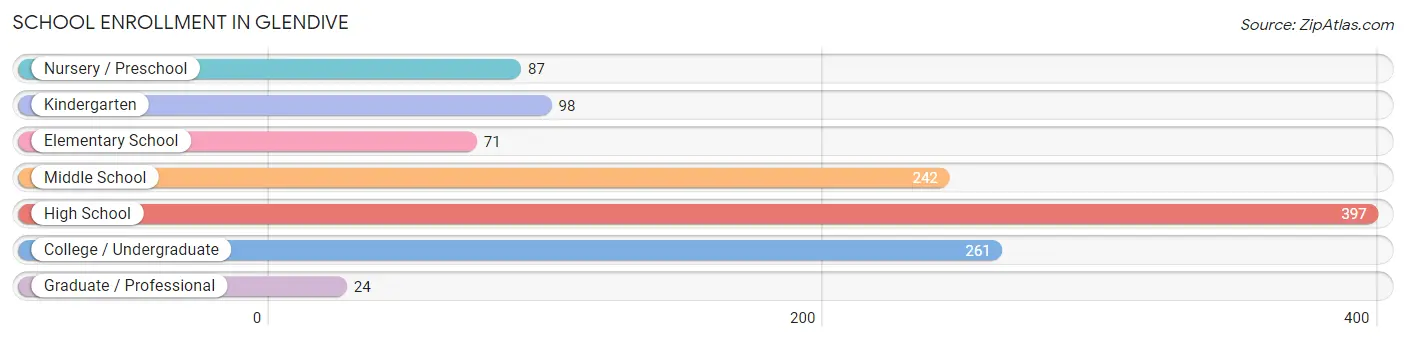
| School Level | # Students | % Students |
| Nursery / Preschool | 87 | 7.4% |
| Kindergarten | 98 | 8.3% |
| Elementary School | 71 | 6.0% |
| Middle School | 242 | 20.5% |
| High School | 397 | 33.6% |
| College / Undergraduate | 261 | 22.1% |
| Graduate / Professional | 24 | 2.0% |
| Total | 1,180 | 100.0% |
School Enrollment by Age by Funding Source in Glendive
Out of a total of 1,180 students who are enrolled in schools in Glendive, 191 (16.2%) attend a private institution, while the remaining 989 (83.8%) are enrolled in public schools. The age group of 35 years and over has the highest likelihood of being enrolled in private schools, with 24 (61.5% in the age bracket) enrolled. Conversely, the age group of 3 to 4 year olds has the lowest likelihood of being enrolled in a private school, with 54 (100.0% in the age bracket) attending a public institution.

| Age Bracket | Public School | Private School |
| 3 to 4 Year Olds | 54 (100.0%) | 0 (0.0%) |
| 5 to 9 Year Old | 202 (100.0%) | 0 (0.0%) |
| 10 to 14 Year Olds | 242 (67.0%) | 119 (33.0%) |
| 15 to 17 Year Olds | 210 (100.0%) | 0 (0.0%) |
| 18 to 19 Year Olds | 133 (76.4%) | 41 (23.6%) |
| 20 to 24 Year Olds | 30 (81.1%) | 7 (18.9%) |
| 25 to 34 Year Olds | 103 (100.0%) | 0 (0.0%) |
| 35 Years and over | 15 (38.5%) | 24 (61.5%) |
| Total | 989 (83.8%) | 191 (16.2%) |
Educational Attainment by Field of Study in Glendive
Education (128 | 14.0%), business (115 | 12.6%), literature & languages (101 | 11.1%), communications (90 | 9.9%), and engineering (77 | 8.4%) are the most common fields of study among 912 individuals in Glendive who have obtained a bachelor's degree or higher.
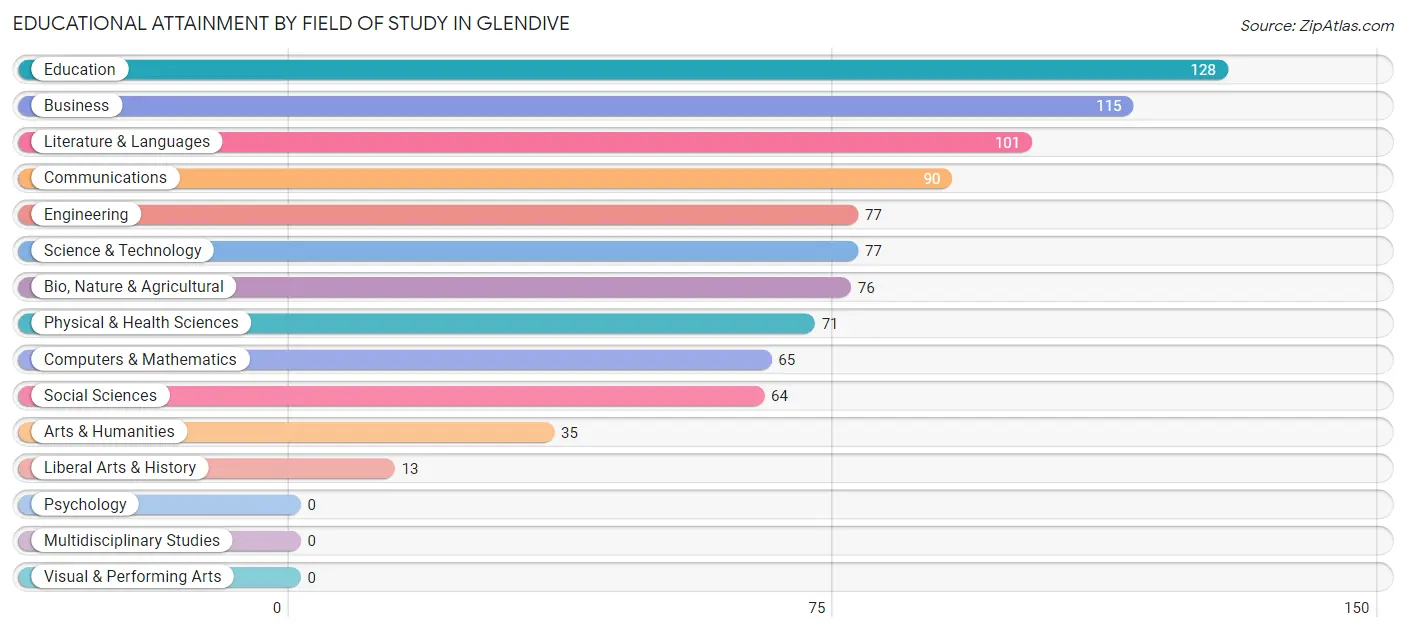
| Field of Study | # Graduates | % Graduates |
| Computers & Mathematics | 65 | 7.1% |
| Bio, Nature & Agricultural | 76 | 8.3% |
| Physical & Health Sciences | 71 | 7.8% |
| Psychology | 0 | 0.0% |
| Social Sciences | 64 | 7.0% |
| Engineering | 77 | 8.4% |
| Multidisciplinary Studies | 0 | 0.0% |
| Science & Technology | 77 | 8.4% |
| Business | 115 | 12.6% |
| Education | 128 | 14.0% |
| Literature & Languages | 101 | 11.1% |
| Liberal Arts & History | 13 | 1.4% |
| Visual & Performing Arts | 0 | 0.0% |
| Communications | 90 | 9.9% |
| Arts & Humanities | 35 | 3.8% |
| Total | 912 | 100.0% |
Transportation & Commute in Glendive
Vehicle Availability by Sex in Glendive
The most prevalent vehicle ownership categories in Glendive are males with 2 vehicles (514, accounting for 41.2%) and females with 2 vehicles (324, making up 55.1%).
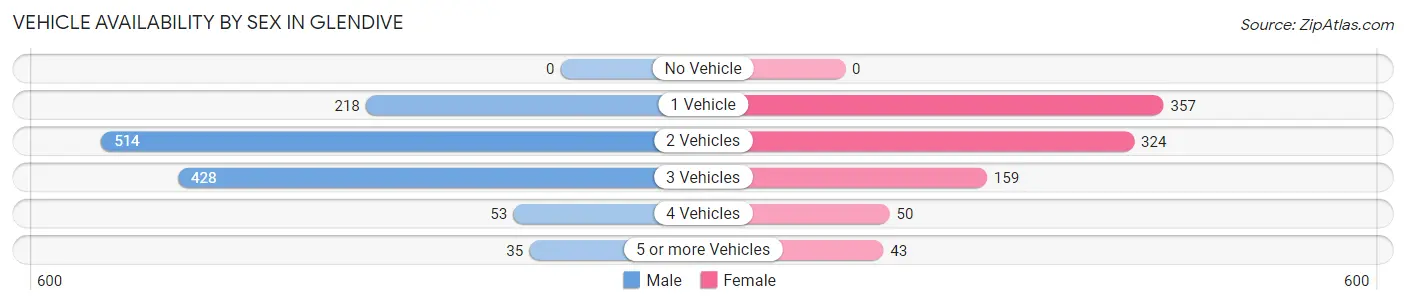
| Vehicles Available | Male | Female |
| No Vehicle | 0 (0.0%) | 0 (0.0%) |
| 1 Vehicle | 218 (17.5%) | 357 (38.3%) |
| 2 Vehicles | 514 (41.2%) | 324 (34.7%) |
| 3 Vehicles | 428 (34.3%) | 159 (17.0%) |
| 4 Vehicles | 53 (4.3%) | 50 (5.4%) |
| 5 or more Vehicles | 35 (2.8%) | 43 (4.6%) |
| Total | 1,248 (100.0%) | 933 (100.0%) |
Commute Time in Glendive
The most frequently occuring commute durations in Glendive are 5 to 9 minutes (743 commuters, 34.4%), 10 to 14 minutes (548 commuters, 25.4%), and less than 5 minutes (352 commuters, 16.3%).
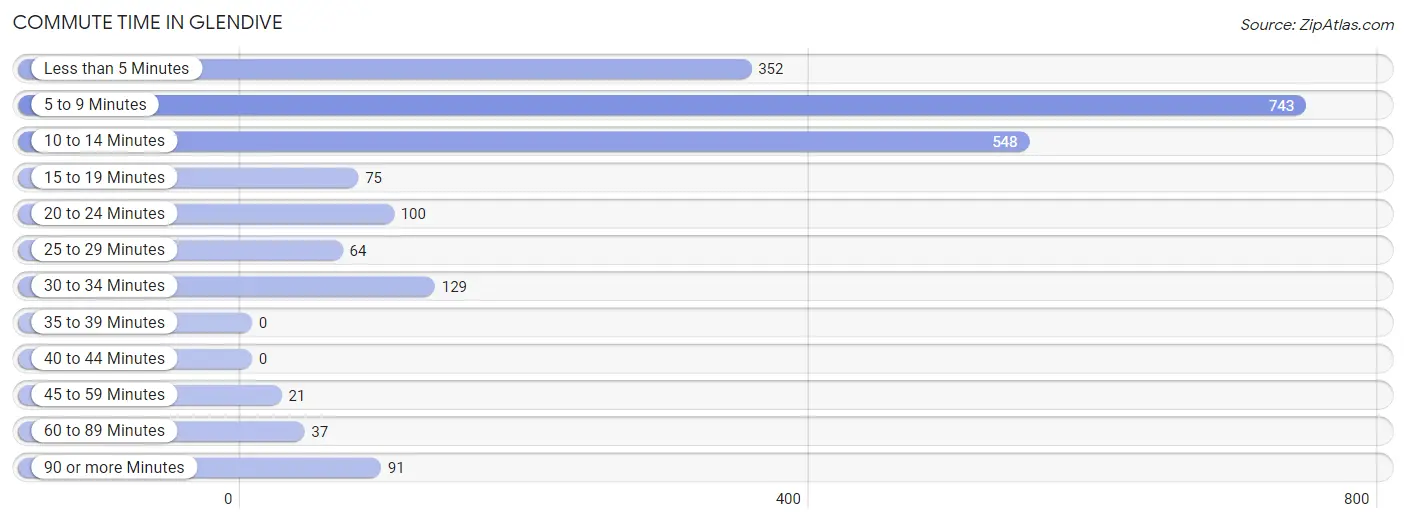
| Commute Time | # Commuters | % Commuters |
| Less than 5 Minutes | 352 | 16.3% |
| 5 to 9 Minutes | 743 | 34.4% |
| 10 to 14 Minutes | 548 | 25.4% |
| 15 to 19 Minutes | 75 | 3.5% |
| 20 to 24 Minutes | 100 | 4.6% |
| 25 to 29 Minutes | 64 | 3.0% |
| 30 to 34 Minutes | 129 | 6.0% |
| 35 to 39 Minutes | 0 | 0.0% |
| 40 to 44 Minutes | 0 | 0.0% |
| 45 to 59 Minutes | 21 | 1.0% |
| 60 to 89 Minutes | 37 | 1.7% |
| 90 or more Minutes | 91 | 4.2% |
Commute Time by Sex in Glendive
The most common commute times in Glendive are 10 to 14 minutes (481 commuters, 37.5%) for males and 5 to 9 minutes (354 commuters, 40.4%) for females.
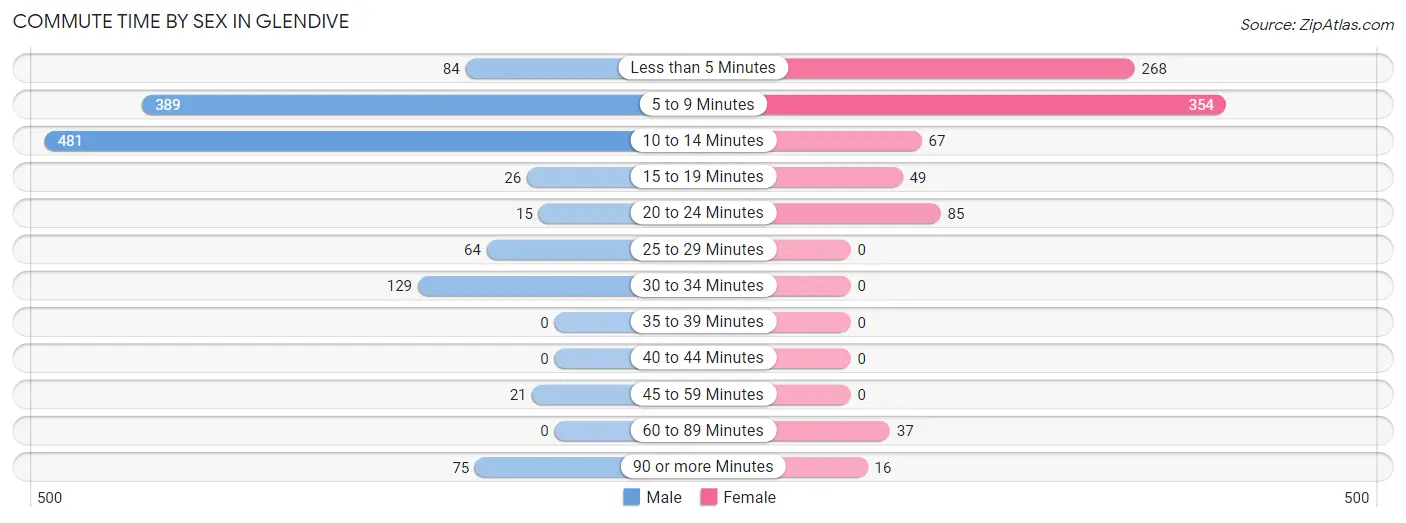
| Commute Time | Male | Female |
| Less than 5 Minutes | 84 (6.5%) | 268 (30.6%) |
| 5 to 9 Minutes | 389 (30.3%) | 354 (40.4%) |
| 10 to 14 Minutes | 481 (37.5%) | 67 (7.6%) |
| 15 to 19 Minutes | 26 (2.0%) | 49 (5.6%) |
| 20 to 24 Minutes | 15 (1.2%) | 85 (9.7%) |
| 25 to 29 Minutes | 64 (5.0%) | 0 (0.0%) |
| 30 to 34 Minutes | 129 (10.1%) | 0 (0.0%) |
| 35 to 39 Minutes | 0 (0.0%) | 0 (0.0%) |
| 40 to 44 Minutes | 0 (0.0%) | 0 (0.0%) |
| 45 to 59 Minutes | 21 (1.6%) | 0 (0.0%) |
| 60 to 89 Minutes | 0 (0.0%) | 37 (4.2%) |
| 90 or more Minutes | 75 (5.8%) | 16 (1.8%) |
Time of Departure to Work by Sex in Glendive
The most frequent times of departure to work in Glendive are 6:30 AM to 6:59 AM (295, 23.0%) for males and 7:00 AM to 7:29 AM (212, 24.2%) for females.
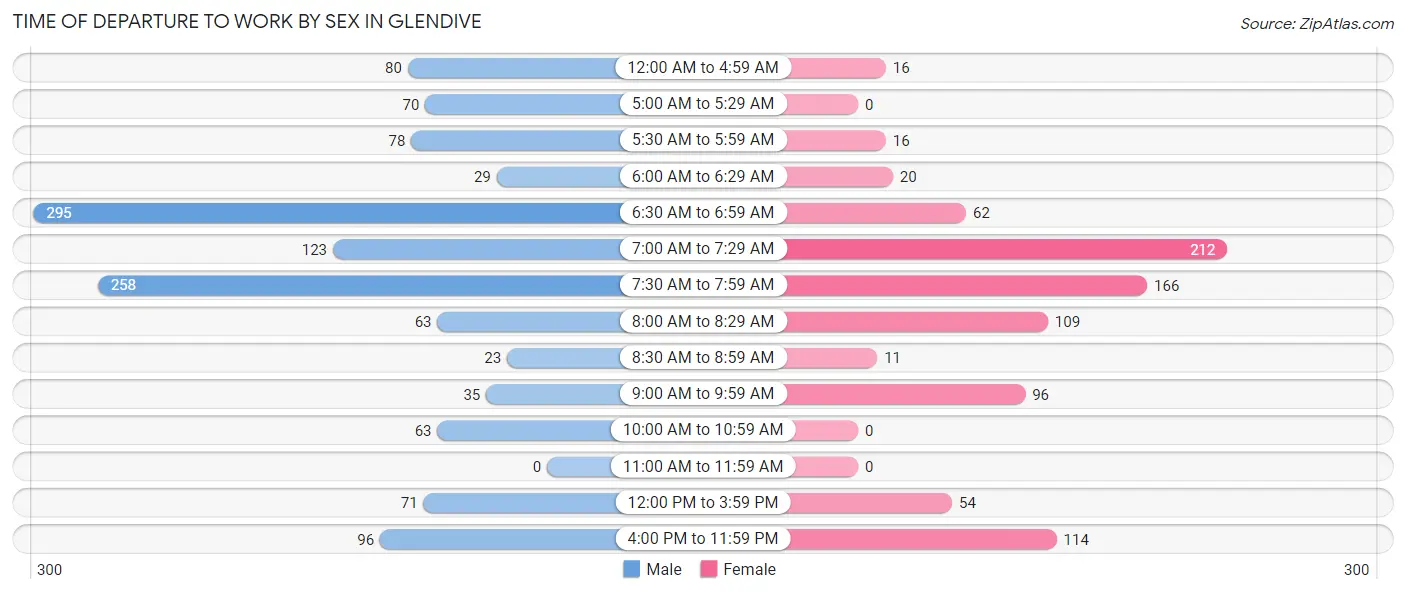
| Time of Departure | Male | Female |
| 12:00 AM to 4:59 AM | 80 (6.2%) | 16 (1.8%) |
| 5:00 AM to 5:29 AM | 70 (5.4%) | 0 (0.0%) |
| 5:30 AM to 5:59 AM | 78 (6.1%) | 16 (1.8%) |
| 6:00 AM to 6:29 AM | 29 (2.3%) | 20 (2.3%) |
| 6:30 AM to 6:59 AM | 295 (23.0%) | 62 (7.1%) |
| 7:00 AM to 7:29 AM | 123 (9.6%) | 212 (24.2%) |
| 7:30 AM to 7:59 AM | 258 (20.1%) | 166 (19.0%) |
| 8:00 AM to 8:29 AM | 63 (4.9%) | 109 (12.4%) |
| 8:30 AM to 8:59 AM | 23 (1.8%) | 11 (1.3%) |
| 9:00 AM to 9:59 AM | 35 (2.7%) | 96 (11.0%) |
| 10:00 AM to 10:59 AM | 63 (4.9%) | 0 (0.0%) |
| 11:00 AM to 11:59 AM | 0 (0.0%) | 0 (0.0%) |
| 12:00 PM to 3:59 PM | 71 (5.5%) | 54 (6.2%) |
| 4:00 PM to 11:59 PM | 96 (7.5%) | 114 (13.0%) |
| Total | 1,284 (100.0%) | 876 (100.0%) |
Housing Occupancy in Glendive
Occupancy by Ownership in Glendive
Of the total 1,990 dwellings in Glendive, owner-occupied units account for 1,287 (64.7%), while renter-occupied units make up 703 (35.3%).
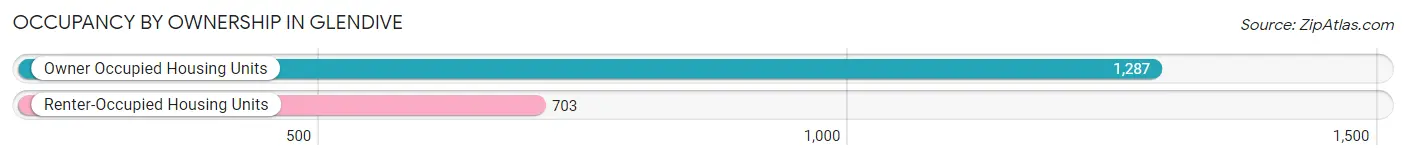
| Occupancy | # Housing Units | % Housing Units |
| Owner Occupied Housing Units | 1,287 | 64.7% |
| Renter-Occupied Housing Units | 703 | 35.3% |
| Total Occupied Housing Units | 1,990 | 100.0% |
Occupancy by Household Size in Glendive
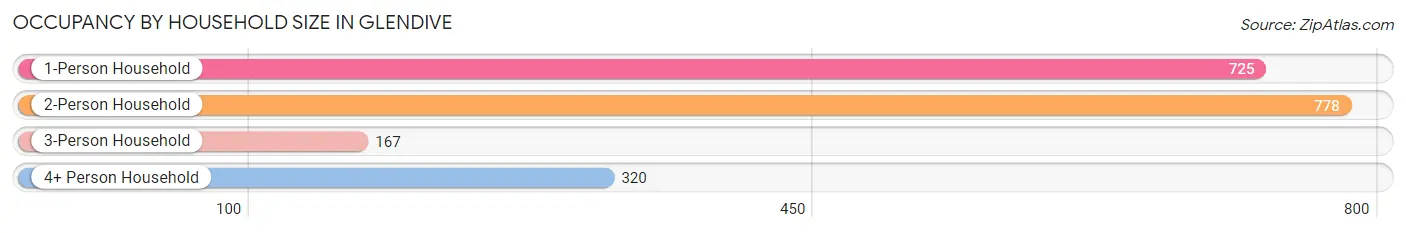
| Household Size | # Housing Units | % Housing Units |
| 1-Person Household | 725 | 36.4% |
| 2-Person Household | 778 | 39.1% |
| 3-Person Household | 167 | 8.4% |
| 4+ Person Household | 320 | 16.1% |
| Total Housing Units | 1,990 | 100.0% |
Occupancy by Ownership by Household Size in Glendive
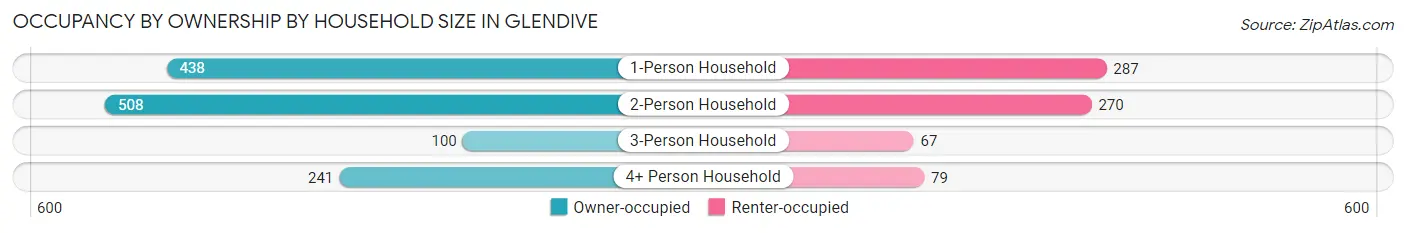
| Household Size | Owner-occupied | Renter-occupied |
| 1-Person Household | 438 (60.4%) | 287 (39.6%) |
| 2-Person Household | 508 (65.3%) | 270 (34.7%) |
| 3-Person Household | 100 (59.9%) | 67 (40.1%) |
| 4+ Person Household | 241 (75.3%) | 79 (24.7%) |
| Total Housing Units | 1,287 (64.7%) | 703 (35.3%) |
Occupancy by Educational Attainment in Glendive
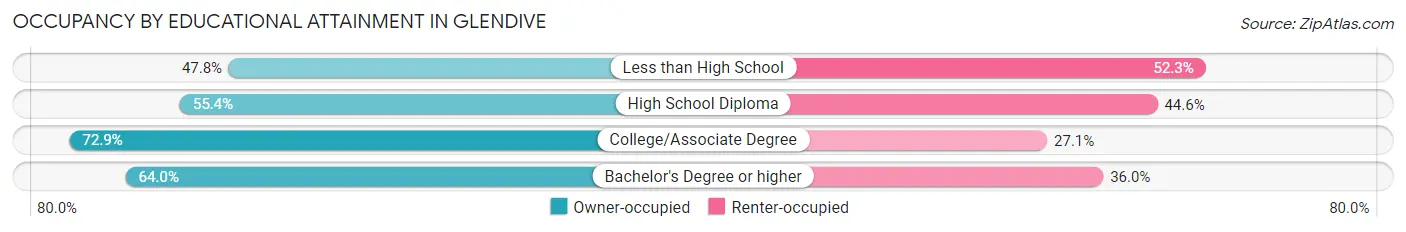
| Household Size | Owner-occupied | Renter-occupied |
| Less than High School | 53 (47.7%) | 58 (52.2%) |
| High School Diploma | 278 (55.4%) | 224 (44.6%) |
| College/Associate Degree | 613 (72.9%) | 228 (27.1%) |
| Bachelor's Degree or higher | 343 (64.0%) | 193 (36.0%) |
Occupancy by Age of Householder in Glendive
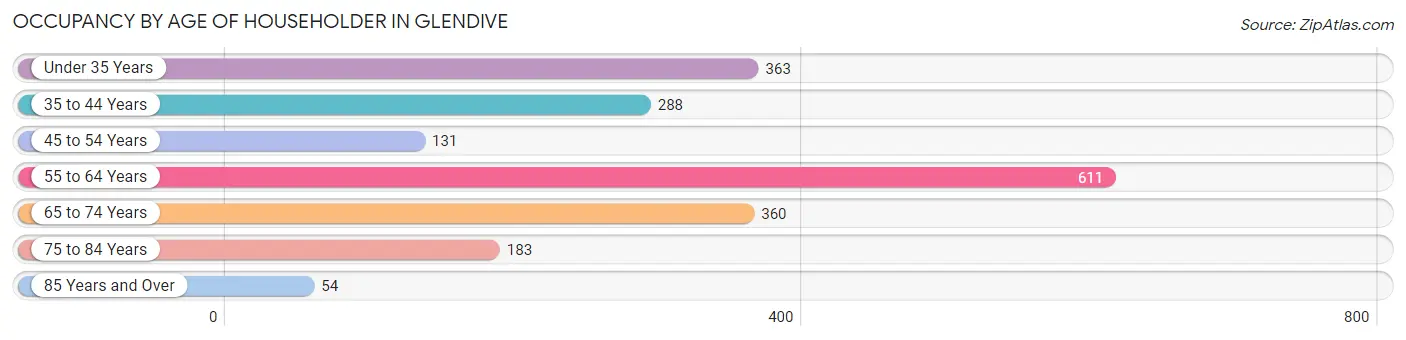
| Age Bracket | # Households | % Households |
| Under 35 Years | 363 | 18.2% |
| 35 to 44 Years | 288 | 14.5% |
| 45 to 54 Years | 131 | 6.6% |
| 55 to 64 Years | 611 | 30.7% |
| 65 to 74 Years | 360 | 18.1% |
| 75 to 84 Years | 183 | 9.2% |
| 85 Years and Over | 54 | 2.7% |
| Total | 1,990 | 100.0% |
Housing Finances in Glendive
Median Income by Occupancy in Glendive
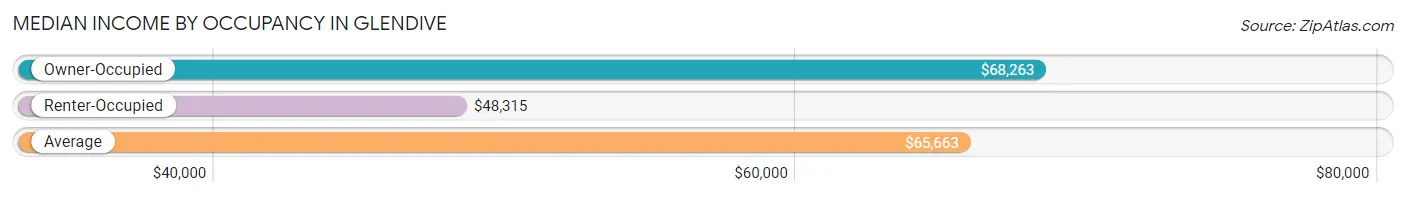
| Occupancy Type | # Households | Median Income |
| Owner-Occupied | 1,287 (64.7%) | $68,263 |
| Renter-Occupied | 703 (35.3%) | $48,315 |
| Average | 1,990 (100.0%) | $65,663 |
Occupancy by Householder Income Bracket in Glendive
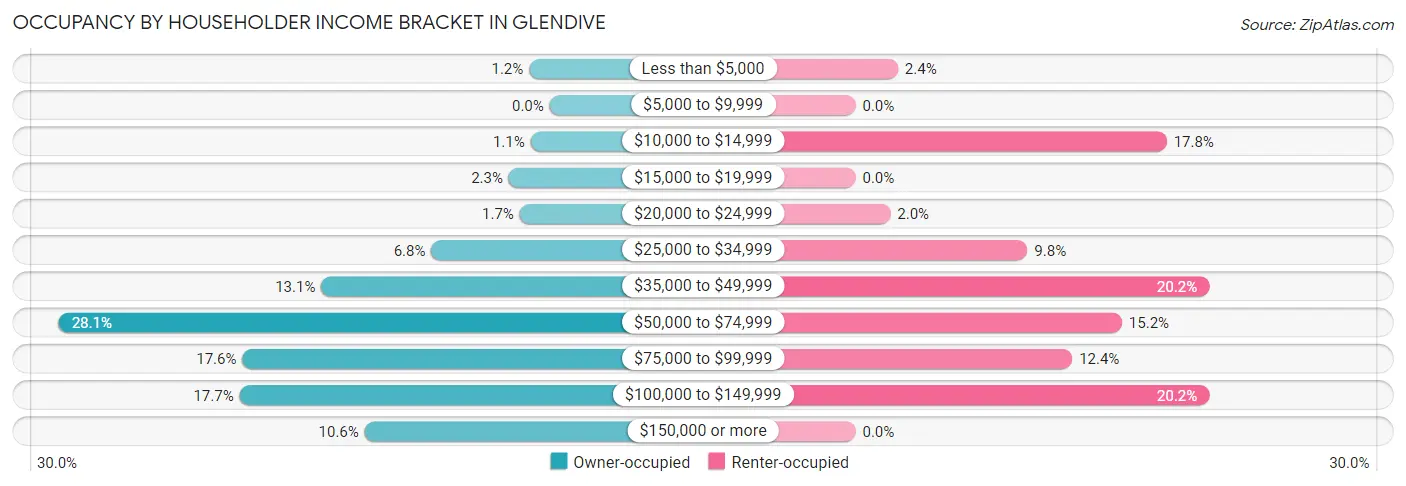
| Income Bracket | Owner-occupied | Renter-occupied |
| Less than $5,000 | 15 (1.2%) | 17 (2.4%) |
| $5,000 to $9,999 | 0 (0.0%) | 0 (0.0%) |
| $10,000 to $14,999 | 14 (1.1%) | 125 (17.8%) |
| $15,000 to $19,999 | 30 (2.3%) | 0 (0.0%) |
| $20,000 to $24,999 | 22 (1.7%) | 14 (2.0%) |
| $25,000 to $34,999 | 87 (6.8%) | 69 (9.8%) |
| $35,000 to $49,999 | 168 (13.1%) | 142 (20.2%) |
| $50,000 to $74,999 | 361 (28.1%) | 107 (15.2%) |
| $75,000 to $99,999 | 226 (17.6%) | 87 (12.4%) |
| $100,000 to $149,999 | 228 (17.7%) | 142 (20.2%) |
| $150,000 or more | 136 (10.6%) | 0 (0.0%) |
| Total | 1,287 (100.0%) | 703 (100.0%) |
Monthly Housing Cost Tiers in Glendive
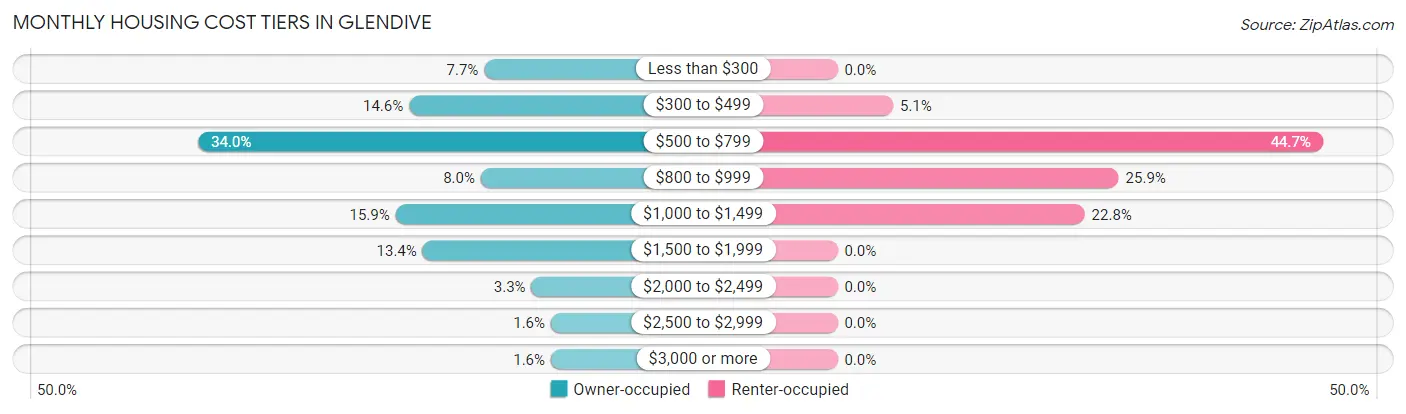
| Monthly Cost | Owner-occupied | Renter-occupied |
| Less than $300 | 99 (7.7%) | 0 (0.0%) |
| $300 to $499 | 188 (14.6%) | 36 (5.1%) |
| $500 to $799 | 438 (34.0%) | 314 (44.7%) |
| $800 to $999 | 103 (8.0%) | 182 (25.9%) |
| $1,000 to $1,499 | 204 (15.9%) | 160 (22.8%) |
| $1,500 to $1,999 | 172 (13.4%) | 0 (0.0%) |
| $2,000 to $2,499 | 43 (3.3%) | 0 (0.0%) |
| $2,500 to $2,999 | 20 (1.5%) | 0 (0.0%) |
| $3,000 or more | 20 (1.5%) | 0 (0.0%) |
| Total | 1,287 (100.0%) | 703 (100.0%) |
Physical Housing Characteristics in Glendive
Housing Structures in Glendive
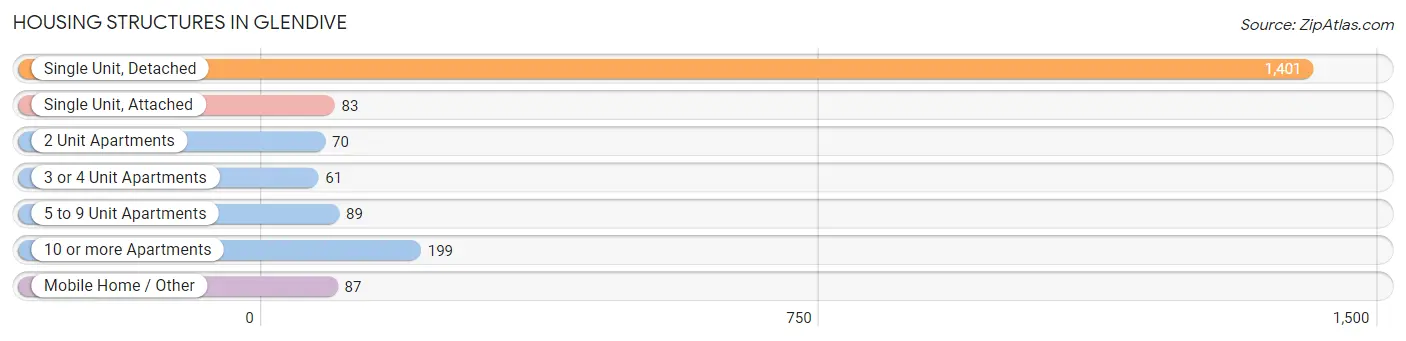
| Structure Type | # Housing Units | % Housing Units |
| Single Unit, Detached | 1,401 | 70.4% |
| Single Unit, Attached | 83 | 4.2% |
| 2 Unit Apartments | 70 | 3.5% |
| 3 or 4 Unit Apartments | 61 | 3.1% |
| 5 to 9 Unit Apartments | 89 | 4.5% |
| 10 or more Apartments | 199 | 10.0% |
| Mobile Home / Other | 87 | 4.4% |
| Total | 1,990 | 100.0% |
Housing Structures by Occupancy in Glendive
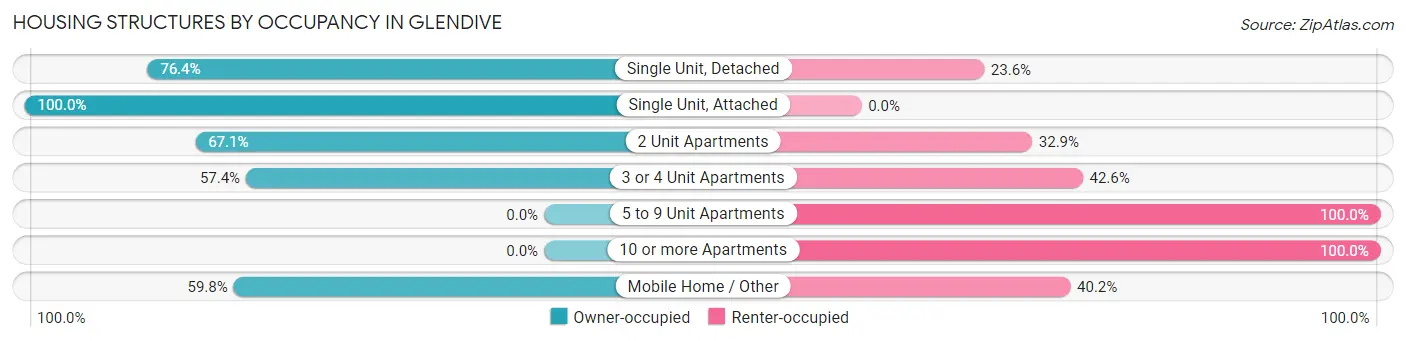
| Structure Type | Owner-occupied | Renter-occupied |
| Single Unit, Detached | 1,070 (76.4%) | 331 (23.6%) |
| Single Unit, Attached | 83 (100.0%) | 0 (0.0%) |
| 2 Unit Apartments | 47 (67.1%) | 23 (32.9%) |
| 3 or 4 Unit Apartments | 35 (57.4%) | 26 (42.6%) |
| 5 to 9 Unit Apartments | 0 (0.0%) | 89 (100.0%) |
| 10 or more Apartments | 0 (0.0%) | 199 (100.0%) |
| Mobile Home / Other | 52 (59.8%) | 35 (40.2%) |
| Total | 1,287 (64.7%) | 703 (35.3%) |
Housing Structures by Number of Rooms in Glendive
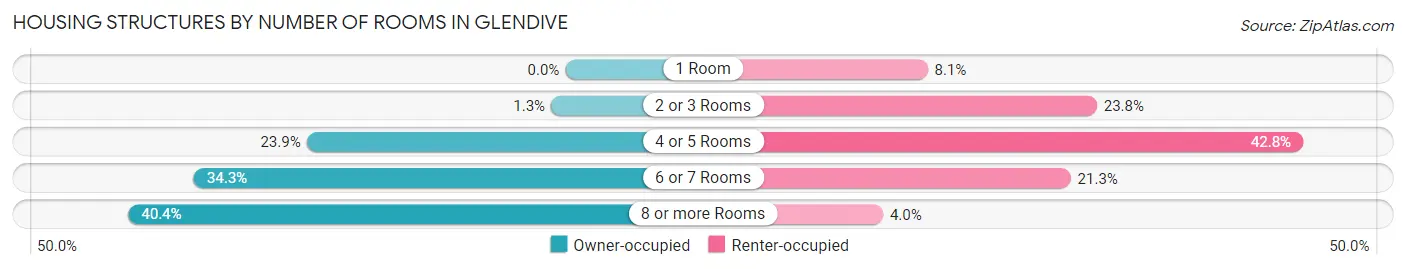
| Number of Rooms | Owner-occupied | Renter-occupied |
| 1 Room | 0 (0.0%) | 57 (8.1%) |
| 2 or 3 Rooms | 17 (1.3%) | 167 (23.8%) |
| 4 or 5 Rooms | 308 (23.9%) | 301 (42.8%) |
| 6 or 7 Rooms | 442 (34.3%) | 150 (21.3%) |
| 8 or more Rooms | 520 (40.4%) | 28 (4.0%) |
| Total | 1,287 (100.0%) | 703 (100.0%) |
Housing Structure by Heating Type in Glendive
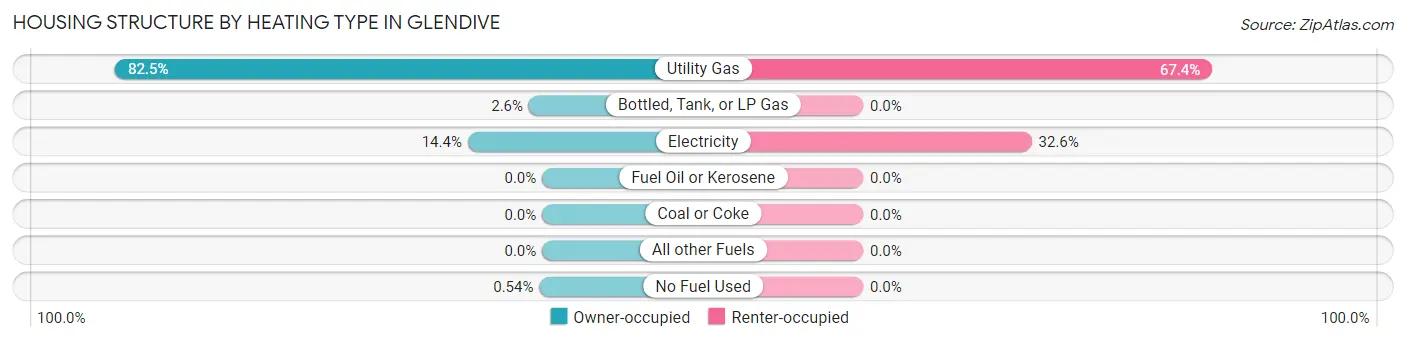
| Heating Type | Owner-occupied | Renter-occupied |
| Utility Gas | 1,062 (82.5%) | 474 (67.4%) |
| Bottled, Tank, or LP Gas | 33 (2.6%) | 0 (0.0%) |
| Electricity | 185 (14.4%) | 229 (32.6%) |
| Fuel Oil or Kerosene | 0 (0.0%) | 0 (0.0%) |
| Coal or Coke | 0 (0.0%) | 0 (0.0%) |
| All other Fuels | 0 (0.0%) | 0 (0.0%) |
| No Fuel Used | 7 (0.5%) | 0 (0.0%) |
| Total | 1,287 (100.0%) | 703 (100.0%) |
Household Vehicle Usage in Glendive
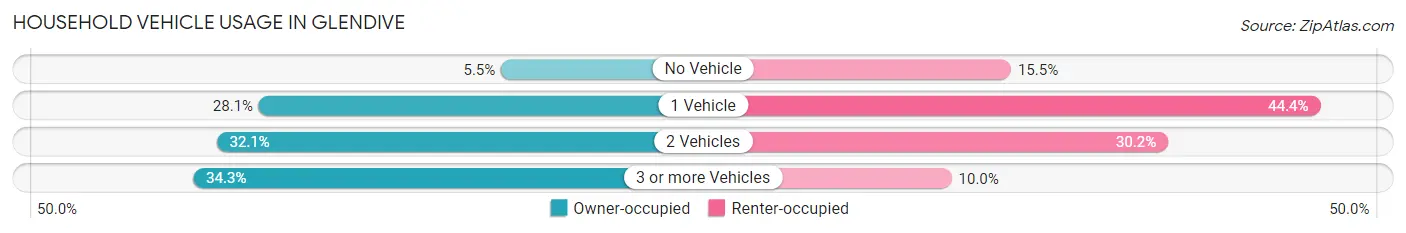
| Vehicles per Household | Owner-occupied | Renter-occupied |
| No Vehicle | 71 (5.5%) | 109 (15.5%) |
| 1 Vehicle | 362 (28.1%) | 312 (44.4%) |
| 2 Vehicles | 413 (32.1%) | 212 (30.2%) |
| 3 or more Vehicles | 441 (34.3%) | 70 (10.0%) |
| Total | 1,287 (100.0%) | 703 (100.0%) |
Real Estate & Mortgages in Glendive
Real Estate and Mortgage Overview in Glendive
| Characteristic | Without Mortgage | With Mortgage |
| Housing Units | 763 | 524 |
| Median Property Value | $188,400 | $144,200 |
| Median Household Income | $66,009 | $79 |
| Monthly Housing Costs | $566 | $0 |
| Real Estate Taxes | $2,167 | $7 |
Property Value by Mortgage Status in Glendive
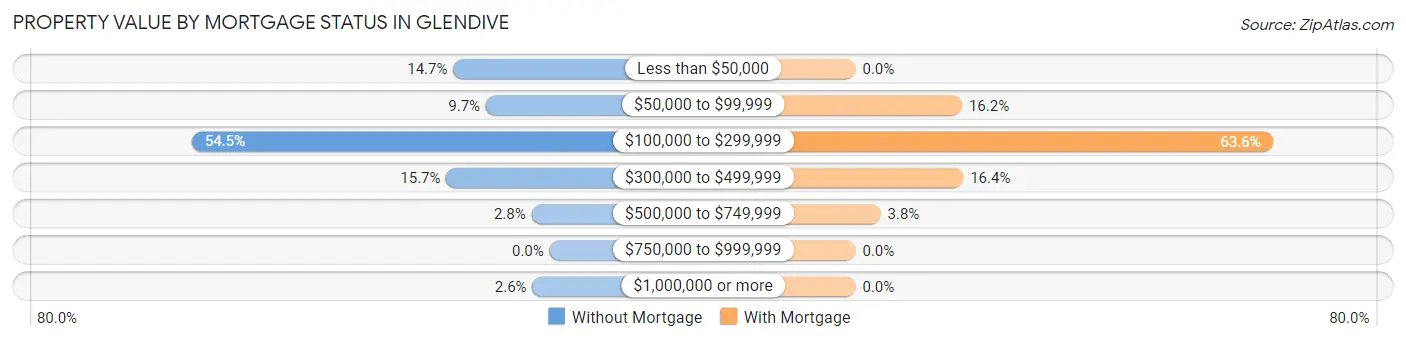
| Property Value | Without Mortgage | With Mortgage |
| Less than $50,000 | 112 (14.7%) | 0 (0.0%) |
| $50,000 to $99,999 | 74 (9.7%) | 85 (16.2%) |
| $100,000 to $299,999 | 416 (54.5%) | 333 (63.5%) |
| $300,000 to $499,999 | 120 (15.7%) | 86 (16.4%) |
| $500,000 to $749,999 | 21 (2.8%) | 20 (3.8%) |
| $750,000 to $999,999 | 0 (0.0%) | 0 (0.0%) |
| $1,000,000 or more | 20 (2.6%) | 0 (0.0%) |
| Total | 763 (100.0%) | 524 (100.0%) |
Household Income by Mortgage Status in Glendive
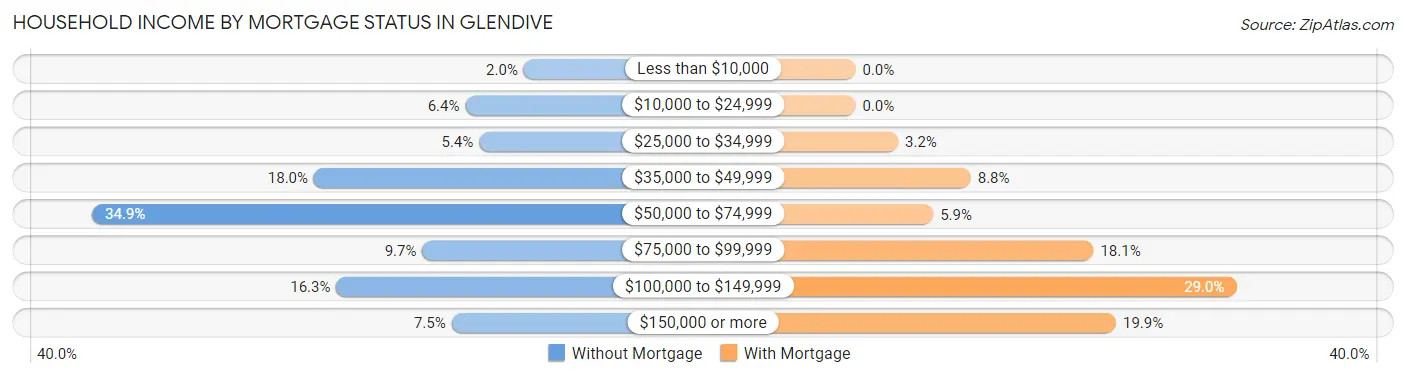
| Household Income | Without Mortgage | With Mortgage |
| Less than $10,000 | 15 (2.0%) | 0 (0.0%) |
| $10,000 to $24,999 | 49 (6.4%) | 0 (0.0%) |
| $25,000 to $34,999 | 41 (5.4%) | 17 (3.2%) |
| $35,000 to $49,999 | 137 (18.0%) | 46 (8.8%) |
| $50,000 to $74,999 | 266 (34.9%) | 31 (5.9%) |
| $75,000 to $99,999 | 74 (9.7%) | 95 (18.1%) |
| $100,000 to $149,999 | 124 (16.3%) | 152 (29.0%) |
| $150,000 or more | 57 (7.5%) | 104 (19.9%) |
| Total | 763 (100.0%) | 524 (100.0%) |
Property Value to Household Income Ratio in Glendive
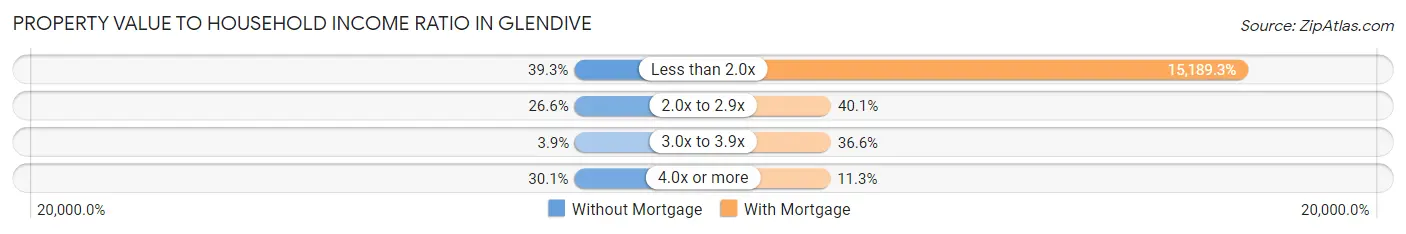
| Value-to-Income Ratio | Without Mortgage | With Mortgage |
| Less than 2.0x | 300 (39.3%) | 79,592 (15,189.3%) |
| 2.0x to 2.9x | 203 (26.6%) | 210 (40.1%) |
| 3.0x to 3.9x | 30 (3.9%) | 192 (36.6%) |
| 4.0x or more | 230 (30.1%) | 59 (11.3%) |
| Total | 763 (100.0%) | 524 (100.0%) |
Real Estate Taxes by Mortgage Status in Glendive
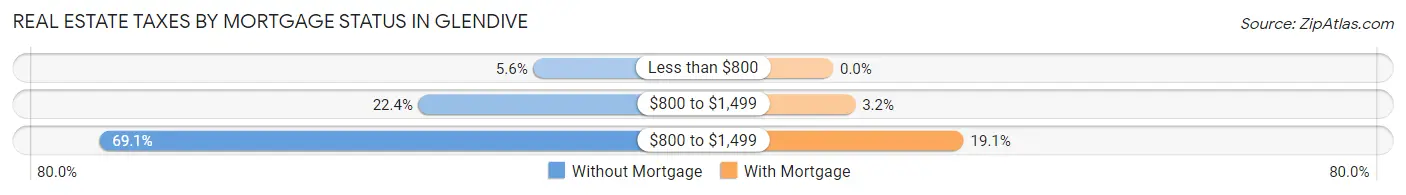
| Property Taxes | Without Mortgage | With Mortgage |
| Less than $800 | 43 (5.6%) | 0 (0.0%) |
| $800 to $1,499 | 171 (22.4%) | 17 (3.2%) |
| $800 to $1,499 | 527 (69.1%) | 100 (19.1%) |
| Total | 763 (100.0%) | 524 (100.0%) |
Health & Disability in Glendive
Health Insurance Coverage by Age in Glendive
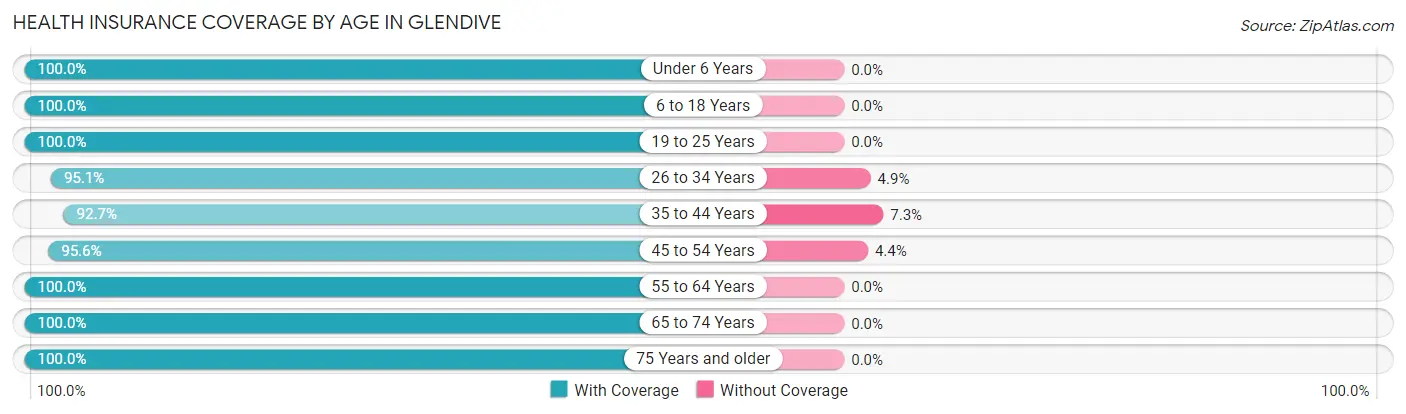
| Age Bracket | With Coverage | Without Coverage |
| Under 6 Years | 327 (100.0%) | 0 (0.0%) |
| 6 to 18 Years | 818 (100.0%) | 0 (0.0%) |
| 19 to 25 Years | 290 (100.0%) | 0 (0.0%) |
| 26 to 34 Years | 541 (95.1%) | 28 (4.9%) |
| 35 to 44 Years | 522 (92.7%) | 41 (7.3%) |
| 45 to 54 Years | 303 (95.6%) | 14 (4.4%) |
| 55 to 64 Years | 819 (100.0%) | 0 (0.0%) |
| 65 to 74 Years | 567 (100.0%) | 0 (0.0%) |
| 75 Years and older | 293 (100.0%) | 0 (0.0%) |
| Total | 4,480 (98.2%) | 83 (1.8%) |
Health Insurance Coverage by Citizenship Status in Glendive
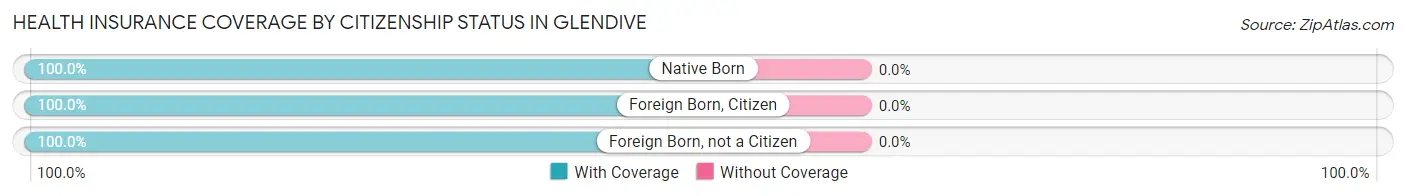
| Citizenship Status | With Coverage | Without Coverage |
| Native Born | 327 (100.0%) | 0 (0.0%) |
| Foreign Born, Citizen | 818 (100.0%) | 0 (0.0%) |
| Foreign Born, not a Citizen | 290 (100.0%) | 0 (0.0%) |
Health Insurance Coverage by Household Income in Glendive
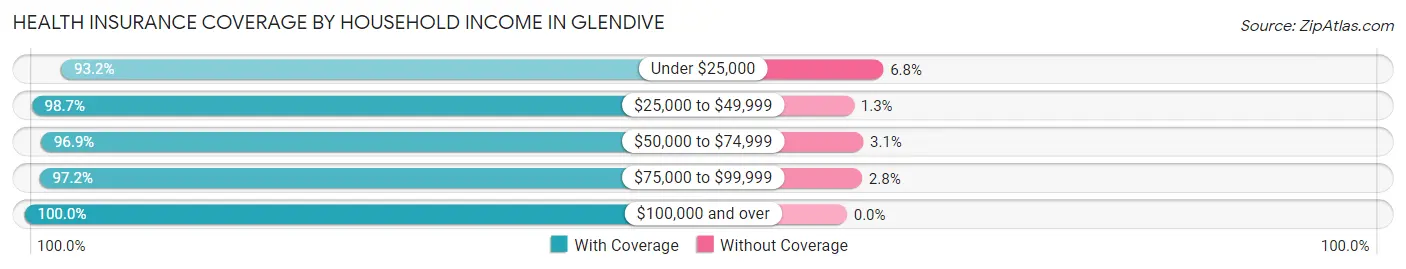
| Household Income | With Coverage | Without Coverage |
| Under $25,000 | 232 (93.2%) | 17 (6.8%) |
| $25,000 to $49,999 | 821 (98.7%) | 11 (1.3%) |
| $50,000 to $74,999 | 886 (96.9%) | 28 (3.1%) |
| $75,000 to $99,999 | 928 (97.2%) | 27 (2.8%) |
| $100,000 and over | 1,477 (100.0%) | 0 (0.0%) |
Public vs Private Health Insurance Coverage by Age in Glendive
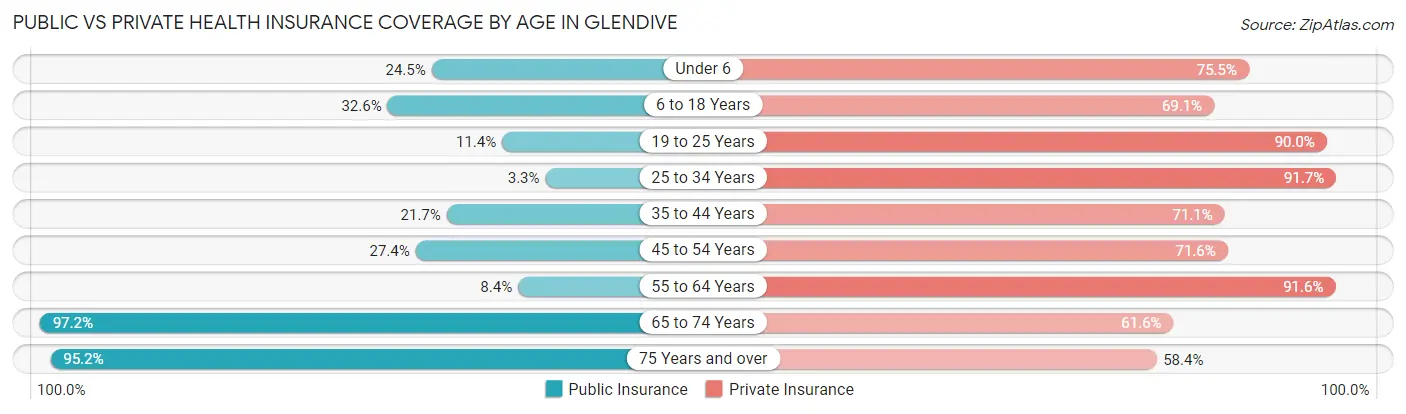
| Age Bracket | Public Insurance | Private Insurance |
| Under 6 | 80 (24.5%) | 247 (75.5%) |
| 6 to 18 Years | 267 (32.6%) | 565 (69.1%) |
| 19 to 25 Years | 33 (11.4%) | 261 (90.0%) |
| 25 to 34 Years | 19 (3.3%) | 522 (91.7%) |
| 35 to 44 Years | 122 (21.7%) | 400 (71.1%) |
| 45 to 54 Years | 87 (27.4%) | 227 (71.6%) |
| 55 to 64 Years | 69 (8.4%) | 750 (91.6%) |
| 65 to 74 Years | 551 (97.2%) | 349 (61.6%) |
| 75 Years and over | 279 (95.2%) | 171 (58.4%) |
| Total | 1,507 (33.0%) | 3,492 (76.5%) |
Disability Status by Sex by Age in Glendive
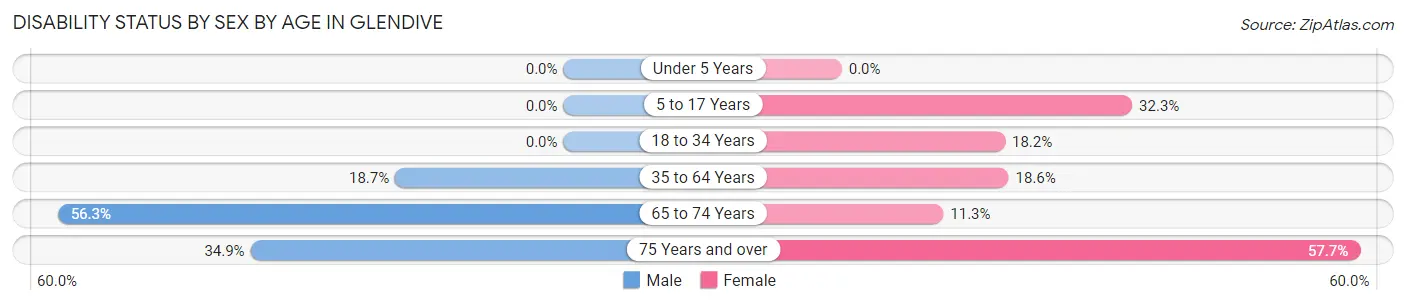
| Age Bracket | Male | Female |
| Under 5 Years | 0 (0.0%) | 0 (0.0%) |
| 5 to 17 Years | 0 (0.0%) | 119 (32.3%) |
| 18 to 34 Years | 0 (0.0%) | 70 (18.2%) |
| 35 to 64 Years | 155 (18.7%) | 162 (18.6%) |
| 65 to 74 Years | 165 (56.3%) | 31 (11.3%) |
| 75 Years and over | 23 (34.8%) | 131 (57.7%) |
Disability Class by Sex by Age in Glendive
Disability Class: Hearing Difficulty
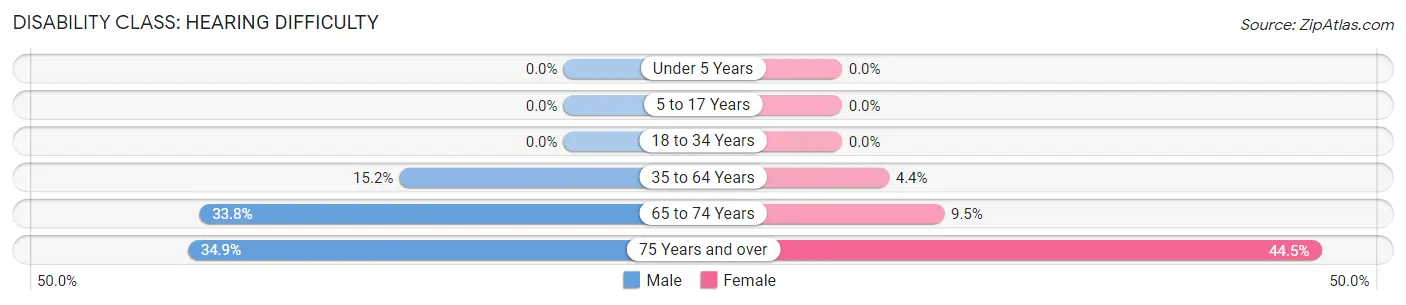
| Age Bracket | Male | Female |
| Under 5 Years | 0 (0.0%) | 0 (0.0%) |
| 5 to 17 Years | 0 (0.0%) | 0 (0.0%) |
| 18 to 34 Years | 0 (0.0%) | 0 (0.0%) |
| 35 to 64 Years | 126 (15.2%) | 38 (4.4%) |
| 65 to 74 Years | 99 (33.8%) | 26 (9.5%) |
| 75 Years and over | 23 (34.8%) | 101 (44.5%) |
Disability Class: Vision Difficulty
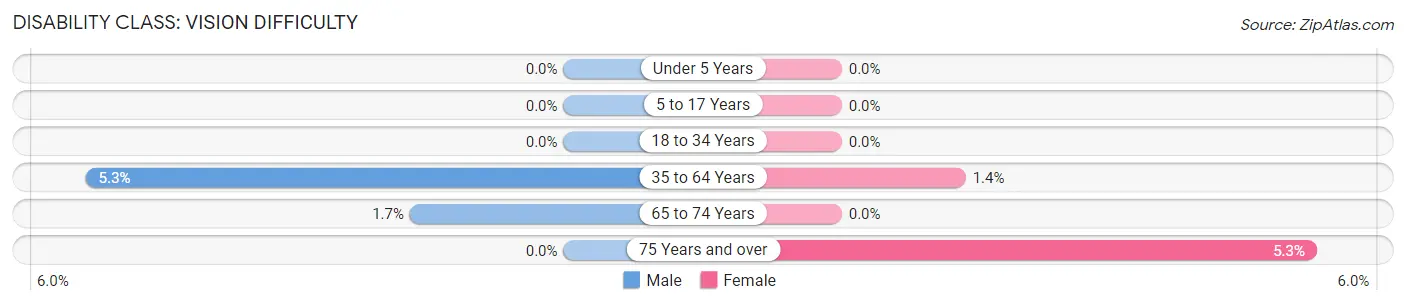
| Age Bracket | Male | Female |
| Under 5 Years | 0 (0.0%) | 0 (0.0%) |
| 5 to 17 Years | 0 (0.0%) | 0 (0.0%) |
| 18 to 34 Years | 0 (0.0%) | 0 (0.0%) |
| 35 to 64 Years | 44 (5.3%) | 12 (1.4%) |
| 65 to 74 Years | 5 (1.7%) | 0 (0.0%) |
| 75 Years and over | 0 (0.0%) | 12 (5.3%) |
Disability Class: Cognitive Difficulty
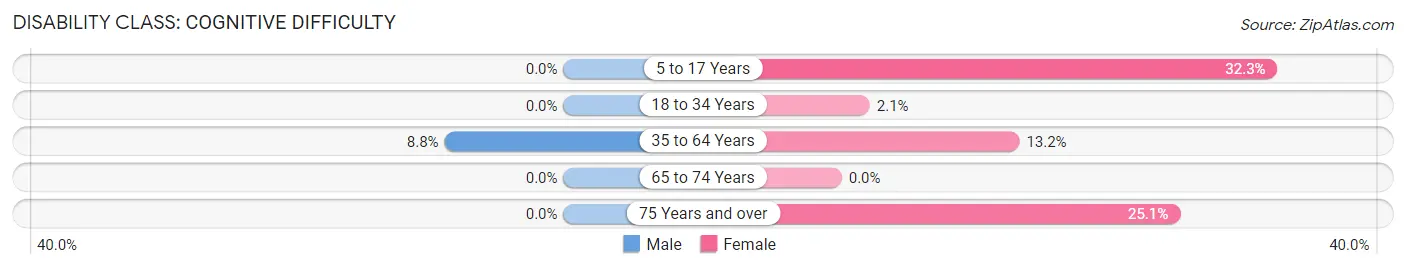
| Age Bracket | Male | Female |
| 5 to 17 Years | 0 (0.0%) | 119 (32.3%) |
| 18 to 34 Years | 0 (0.0%) | 8 (2.1%) |
| 35 to 64 Years | 73 (8.8%) | 115 (13.2%) |
| 65 to 74 Years | 0 (0.0%) | 0 (0.0%) |
| 75 Years and over | 0 (0.0%) | 57 (25.1%) |
Disability Class: Ambulatory Difficulty
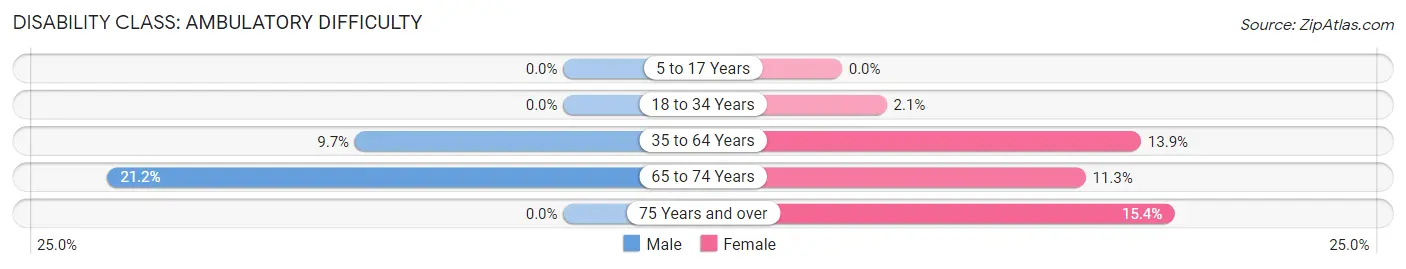
| Age Bracket | Male | Female |
| 5 to 17 Years | 0 (0.0%) | 0 (0.0%) |
| 18 to 34 Years | 0 (0.0%) | 8 (2.1%) |
| 35 to 64 Years | 80 (9.7%) | 121 (13.9%) |
| 65 to 74 Years | 62 (21.2%) | 31 (11.3%) |
| 75 Years and over | 0 (0.0%) | 35 (15.4%) |
Disability Class: Self-Care Difficulty
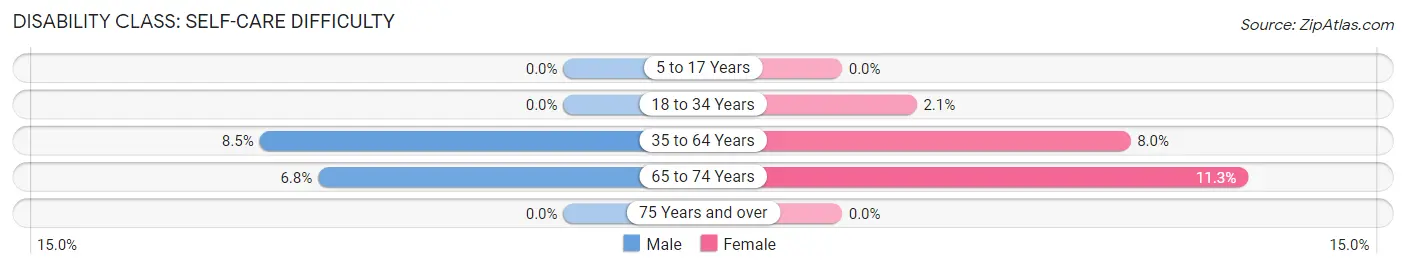
| Age Bracket | Male | Female |
| 5 to 17 Years | 0 (0.0%) | 0 (0.0%) |
| 18 to 34 Years | 0 (0.0%) | 8 (2.1%) |
| 35 to 64 Years | 70 (8.5%) | 70 (8.0%) |
| 65 to 74 Years | 20 (6.8%) | 31 (11.3%) |
| 75 Years and over | 0 (0.0%) | 0 (0.0%) |
Technology Access in Glendive
Computing Device Access in Glendive
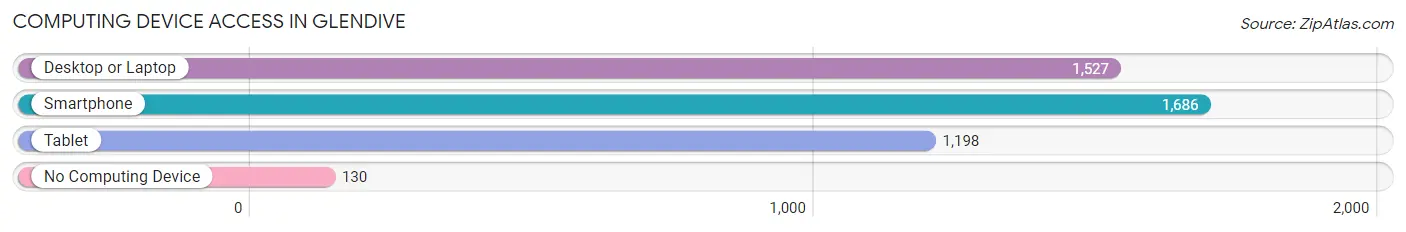
| Device Type | # Households | % Households |
| Desktop or Laptop | 1,527 | 76.7% |
| Smartphone | 1,686 | 84.7% |
| Tablet | 1,198 | 60.2% |
| No Computing Device | 130 | 6.5% |
| Total | 1,990 | 100.0% |
Internet Access in Glendive
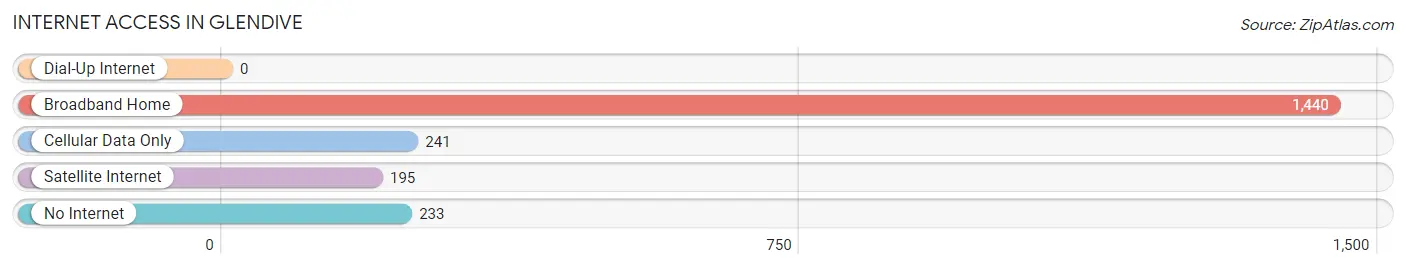
| Internet Type | # Households | % Households |
| Dial-Up Internet | 0 | 0.0% |
| Broadband Home | 1,440 | 72.4% |
| Cellular Data Only | 241 | 12.1% |
| Satellite Internet | 195 | 9.8% |
| No Internet | 233 | 11.7% |
| Total | 1,990 | 100.0% |
Glendive Summary
Glendive is a small city located in eastern Montana, in the United States. It is the county seat of Dawson County and is situated along the Yellowstone River. The city has a population of 5,931 as of the 2010 census, making it the largest city in the county.
History
Glendive was founded in 1881 by the Northern Pacific Railroad. The city was named after the nearby Glendive Creek, which was named after the Scottish word for “valley”. The city was originally a trading post for the local Native American tribes, and was later used as a supply point for the gold miners in the area.
In the early 1900s, Glendive became a major agricultural center, with the construction of the Glendive Irrigation Project. This project brought water to the area, allowing for the growth of crops such as wheat, barley, and alfalfa. The city also became a major center for the oil and gas industry, with the discovery of oil in the area in the 1920s.
Geography
Glendive is located in eastern Montana, in the United States. It is situated along the Yellowstone River, and is located at the intersection of Interstate 94 and U.S. Route 212. The city is located in the Yellowstone Valley, and is surrounded by the badlands of the Makoshika State Park.
The city has a total area of 4.2 square miles, of which 4.1 square miles is land and 0.1 square miles is water. The city has a semi-arid climate, with hot summers and cold winters.
Economy
The economy of Glendive is largely based on agriculture, oil and gas, and tourism. The city is home to several large agricultural operations, including the Glendive Grain Elevator, which is the largest grain elevator in the state. The city is also home to several oil and gas companies, including the Glendive Oil Company, which is the largest oil and gas company in the area.
Tourism is also an important part of the economy, with the city being home to several attractions, including the Makoshika State Park, the Glendive Dinosaur and Fossil Museum, and the Glendive Historical Museum.
Demographics
As of the 2010 census, the population of Glendive was 5,931. The racial makeup of the city was 94.3% White, 0.7% African American, 1.2% Native American, 0.3% Asian, 0.1% Pacific Islander, 1.2% from other races, and 2.3% from two or more races. Hispanic or Latino of any race were 3.3% of the population.
The median income for a household in the city was $37,917, and the median income for a family was $45,938. The per capita income for the city was $19,945. About 11.2% of families and 14.2% of the population were below the poverty line, including 19.2% of those under age 18 and 8.2% of those age 65 or over.
Common Questions
What is Per Capita Income in Glendive?
Per Capita income in Glendive is $34,707.
What is the Median Family Income in Glendive?
Median Family Income in Glendive is $79,920.
What is the Median Household income in Glendive?
Median Household Income in Glendive is $65,663.
What is Income or Wage Gap in Glendive?
Income or Wage Gap in Glendive is 50.6%.
Women in Glendive earn 49.4 cents for every dollar earned by a man.
What is Inequality or Gini Index in Glendive?
Inequality or Gini Index in Glendive is 0.39.
What is the Total Population of Glendive?
Total Population of Glendive is 4,861.
What is the Total Male Population of Glendive?
Total Male Population of Glendive is 2,482.
What is the Total Female Population of Glendive?
Total Female Population of Glendive is 2,379.
What is the Ratio of Males per 100 Females in Glendive?
There are 104.33 Males per 100 Females in Glendive.
What is the Ratio of Females per 100 Males in Glendive?
There are 95.85 Females per 100 Males in Glendive.
What is the Median Population Age in Glendive?
Median Population Age in Glendive is 41.4 Years.
What is the Average Family Size in Glendive
Average Family Size in Glendive is 2.9 People.
What is the Average Household Size in Glendive
Average Household Size in Glendive is 2.2 People.
How Large is the Labor Force in Glendive?
There are 2,343 People in the Labor Forcein in Glendive.
What is the Percentage of People in the Labor Force in Glendive?
59.1% of People are in the Labor Force in Glendive.
What is the Unemployment Rate in Glendive?
Unemployment Rate in Glendive is 4.1%.